1. Introduction
Pipeline fluid transport is one of the more safe, efficient, and energy-saving methods, which plays an increasingly important role in the development of national economy. However, pipelines are often subject to leakage due to pipe corrosion, pipe aging, pipe weld defects, or damage by a third-party [
1]. In addition, pipeline fluids are also often flammable, toxic, corrosive media. Therefore, pipeline leakage will not only lead to economic loss of products and resources, but also seriously pollute the environment [
2,
3]. Pipeline safety management and accident prevention are increasingly required in countries around the world. Establishing an efficient pipeline leak detection system can report the occurrence and localization of leak accidents in a timely manner, and minimize or even avoid economic losses and environmental pollution. So far, some comprehensive review papers about pipeline leak and localization have been published [
4,
5,
6,
7,
8]. From the perspective of measurement signal acquisition, pipeline leak detection and positioning systems can be broadly classified into external detection methods and internal detection methods [
2]. Externally-based methods monitor external pipeline parameters, such as acoustic signals [
9,
10,
11] and fiber-optic cables [
12,
13,
14], while internally-based methods typically collect pressure, flow, and temperature signals, such as real time transient modeling [
15,
16,
17,
18], negative pressure wave method [
19,
20], pressure point analysis, and the flow balance method. Recently, some scholars have also pointed out that integrating multi-source signals, including internal sensors and external sensors, is also an effective way to improve the performance of pipeline leak detection and localization [
21]. Saqib et al. [
22] used pressure and vibration signals to detect and locate leaks in the water pipeline network. Lang et al. [
23] combined the ultrasonic wave velocity and flow signals to detect small leaks in the pipelines of the experimental set-up. The experimental results showed that multi-sensor information fusion for leak detection has a greater improvement than single-type sensors.
From the perspective of the model used for pipeline leak detection, pipeline leak detection and localization methods can be divided into two categories, based on the mechanism model and the data-driven model. The mechanism model is usually based on the conservation of fluid mass, momentum conservation, as well as energy conservation in the pipeline. The mechanism model can be used to detect leaks in pipelines under steady-state and transient conditions [
5]. Typically, the mechanism model-based methods compare the estimated value obtained from the model with the actual measured value, and if the residual between the estimated value and the actual measured value is greater than a pre-specified threshold, it indicates that a leak is detected [
24]. The accuracy of these methods depends to a large extent on model parameters and sensor accuracy. Furthermore, the method requires extensive simulation and calibration work [
8]. In addition, high computational loads are required to solve these complex nonlinear models [
25,
26]. In recent years, data-driven methods for pipeline leak detection and localization have been developed rapidly, which rely on measuring data and performing signal processing and statistical analysis for leak detection. The advantage of these methods is that they do not require any specific insight into the hydraulics mechanism, and only through machine learning algorithms or artificial intelligence algorithms, plus some statistical or pattern recognition tools, to obtain pipeline leak characteristics and knowledge from the collected data. Recently, Wu and Liu [
8] presented a detailed review on data-driven approaches for leak detection (specifically, burst detection) in the water distribution. Typically, artificial neural network-based methods [
11,
27,
28] and support vector machine-based methods [
13,
28,
29,
30] are the most widely used data-driven approaches for pipeline detection and localization. Besides these, there are other data-driven methods for pipeline leak detection, such as genetic algorithm [
31], principal component analysis (PCA) [
31], particle swarm optimization [
12], support vector data description (SVDD) [
32], and Bayesian reasoning [
33,
34]. In addition to being independently applied to pipeline leak detection, some of these methods are often integrated as a hybrid method for leak detection. Ahn et al. [
31] used the genetic algorithm and PCA to extract acoustic emission signal features, and used support vector machine to detect leaks. The particle swarm optimization method, integrating with support vector machine, was proposed in the literature [
12,
35,
36], in which the particle swarm optimization algorithm was used to optimize the parameters of support vector machine to improve its classification accuracy. The experimental results showed that the particle swarm optimization has strong global search ability when optimizing support vector machine parameters, which further improves the accuracy of leak detection. Similarly, the particle swarm optimization algorithm was used to optimize the parameters of the kernel functions of support vector machine and support vector regression in Jia et al. [
13], in which the support vector machine was used for pipeline leak detection and support vector regression for pipeline leak localization. Mandal et al. [
37] proposed a leak detection approach based on the rough set theory and support vector machine to improve leak detection accuracy. In this method, the rough set theory was used to reduce the length of experimental data as well as generated rules. Meanwhile, the artificial bee colony algorithm was used for the computational training for the support vector machine. Li et al. [
11] specifically studied the leak detection of a water distribution system subject to failure of the socket joint. The acoustic characteristics of leak signals in the socket and spigot pipe segments were extracted and selected. An artificial neural network was established as the classifier. More recently, an adaptive design was proposed that combined one-dimensional convolutional neural networks and support vector machine [
28]. This method enabled fast and accurate leak detection. Moreover, a graph-based localization algorithm was proposed to determine the leak location within a real water distributed system.
To this end, most of the published data-driven methods require extracting features from pipeline leak signal data samples to develop a classification or prediction model for leak detection. To ensure the accuracy and versatility of an algorithm, it is necessary to introduce leaks with different leak levels at different leak locations before the leak detection system operates. This is impossible and unrealistic in most applications [
38]. An alternative suggestion is to use simulation techniques to generate leak samples for training for data-driven methods. However, due to the uncertainty and complexity of actual leaks, it is difficult to fully simulate the actual leakage signal with complete characteristics. Therefore, some researchers have introduced some leak detection methods that require only leak-free sample signals. For example, Wang et al. [
32] extracted the time-domain statistical characteristics of the acoustic sensor from the normal (no leak) sample signal, and constructed the SVDD model, which was implemented in a field leak detection system.
In addition, frequent changes in various operating modes, such as normal running, operating conditions adjustment, and pump operation, are often encountered during the pipeline fluid transportation process. The training samples in the feature space of each operating mode are different in nature and unevenly distributed. Moreover, the characteristics of working condition adjustment and pump operation have certain similarities with the one of pipeline leakage, resulting in a high false alarm rate for the pipeline leak system. As a result, the effective classification of pipeline operating modes is of great significance for improving the accuracy of the leak detection system.
In this paper, we present a novel integration method using kernel principal component analysis (KPCA) and cascade support vector data description (Cas-SVDD), namely, KPCA-Cas-SVDD, for pipeline leak detection with multiple operating modes. On the one hand, only the leak-free data samples are required from the actual running process, and the features are extracted and reconstructed by local mean decomposition (LMD). After that, KPCA is used to reduce the feature dimensions. On the other hand, based on the K-means clustering method, the various normal operating modes of the pipeline are classified, based on which the SVDD model is established for each operating mode. Subsequently, the Cas-SVDD method is used for pipeline leak detection, which greatly improves the leak detection accuracy. The rest of this paper is structured as follows.
Section 2 presents the novel methodology for pipeline leak detection, including the basic algorithms of LMD, KPCA, K-means, and SVDD.
Section 3 presents the background of the case study, data processing, and feature extraction.
Section 4 consists of experimental results and discussion.
Section 5 addresses the conclusion of this research and directions for future work.
2. Methodology
2.1. LMD Based Signal Processing and KPCA for Feature Extraction
The local mean decomposition (LMD) was recently developed to analyze time series signals with nonlinear and non-stationary features, that can adaptively denoise and extract features from the original signals [
39]. Meanwhile, the LMD adaptively decomposes the original signal into pure frequency modulated signals and envelope components of different magnitude, and then obtains a set of product functions (PF), each of which is the product of a pure frequency-modulated signal and an envelope signal [
40]. Combining the instantaneous amplitude and instantaneous frequency of all PF components, the complete time–frequency distribution of the original signal can be obtained, so that the feature information in the original signal can be extracted more effectively.
Given any non-stationary measurement signal
, its decomposed PF components via the LMD algorithm can be written as follows:
where
is the instantaneous amplitude of the PF component, and
is a pure frequency modulation signal. The instantaneous frequency of the PF component is obtained by processing the pure frequency modulation signal by the following formula:
All the PF components are separated from the signal
, and finally a residual component
is obtained, which is constant or monotonic. In this way, the original signal
can be represented into the sum of
PF components and
:
The noise in
can be removed by carefully selecting PF and
according to frequency. After the original signal is denoised and reconstructed by the LMD, 12 feature variables are extracted, including time-domain features (mean, variance, effective value, square root amplitude, and energy) and waveform-domain features (kurtosis, skewness parameter, kurtosis factor, pulse factor, shape parameter, peak coefficient, and valley factor), as shown in
Table 1.
However, too many features that may include invalid or redundant features can result in reduced accuracy of leak detection due to overfitting and greatly increase computational complexity. Principal components analysis (PCA) is one of the classical techniques for multivariate analysis, based on which the dimensionality is reduced by preserving the most variance of the original data. Usually, PCA decorrelates the variables by obtaining a linear relationship that handles the two-order correlation between the variables. However, it is less effective in extracting nonlinear features of the pipeline measurement variables. In this case, kernel PCA (KPCA), using the idea of kernel function, is proposed to handle nonlinear feature extraction for the original signal by finding a suitable nonlinear mapping function
, by which the low-dimensional data sample set
, where
,
is the number of samples, and
is the number of variables, is mapped to high-dimensional space
to construct the feature space, and thereby each variable is subjected to principal component analysis from the high-dimensional feature space [
41,
42]. We shall briefly review the KPCA method here.
The covariance matrix
on the
space is expressed by:
The eigenvalue decomposition equation of the Equation (4) can be obtained by:
where
and
are, respectively, the eigenvalues and the eigenvectors of the covariance matrix. The eigenvectors
of
can be expressed as:
where
is the feature space expansion coefficient. Taking Equations (4) and (6) into Equation (5), the following equation can be obtained:
Define an
kernel matrix
, where
, then Equation (7) can be expressed as:
where
, the eigenvalue of the matrix
satisfies
. One can choose to preserve the pre-
eigenvalues and eigenvectors according to the cumulative variance contribution rate criteria (e.g., up to 0.85). Through this method, KPCA achieves dimensionality reduction and nonlinear feature extraction for original signal. Commonly kernel functions used of KPCA include linear kernel, multi-layer perceptual kernel function, Gaussian kernel, and polynomial kernel. Of these, the Gaussian kernel was used in KPCA in our study, which provides better performance, regardless of the total sample size and feature dimension.
2.2. Pipeline Leak Detection Method Based on K-Means and Cas-SVDD
The SVDD algorithm only requires data samples under normal operating conditions, the main idea of which is to create a closed compact hypersphere that contains as many data samples as possible [
43,
44]. SVDD is an excellent method of one-class classifier with the advantages of robustness, good generalization, and high computation efficiency. Additionally, SVDD inherits small-sample characteristics. However, due to the uncertainties caused by natural changes (such as corrosion and sediments), and human factors (such as valve operation and demand changes), there are frequent changes in operating modes in the pipeline during the fluid transportation process. Moreover, the signal characteristics generated by some pipeline operations, such as valve adjustment and pump opening or closing, are similar to those generated by pipeline leakage. If the different normal operating mode data samples collected are used to create a single SVDD hypersphere, the volume of the hypersphere may be too large, which would lead to an increase in false alarm rate. Therefore, it is necessary that the various operating modes data during normal operation should be first classified, and then multiple SVDDs established.
In our work, the K-means clustering algorithm was used to identify each operating mode of the data samples collected from normal operation of the pipeline. The K-means clustering, as an unsupervised clustering algorithm, is a mature and widely used clustering method. It has the advantages of its simplicity, favorable execution time, and good clustering effect [
45]. Assuming that there are
operating modes in the pipeline transportation process, the algorithm will divide the original data set
into
clusters, each of which has high data similarity, with low similarity between clusters. First, the
data samples are randomly selected in the data set
, each as the center of the initial clusters, and then the distance between the remaining data samples and the initial cluster center is calculated. After that, the data samples of the minimum distance from the certain center of the cluster are assigned to the nearest cluster. Subsequently, the average of all the data in each cluster is calculated. Thereby, the new
cluster centers are obtained. The iterative calculation is performed until each cluster center value does not change. At that time the update process stops. The K-means algorithm chooses squared Euclidean distance as the dissimilarity measure, so the optimization problem can be formulated as:
where
is the function value of the sum of mean squared deviations,
is the given data samples in cluster
, and
is the mean of the cluster
(i.e., cluster center).
Through the K-means method, the original data set was classified into several sub-data sets with corresponding operating modes. However, as the K-means clustering method does not consider the anomaly data samples in each cluster and remove them, it was necessary to further describe the cluster-intensive data samples using SVDD for each cluster after K-means clustering. In this way, it the method not only overcomes the influence of abnormal sample noise, but also overcomes the shortcoming of the SVDD algorithm when the sample population density is not high.
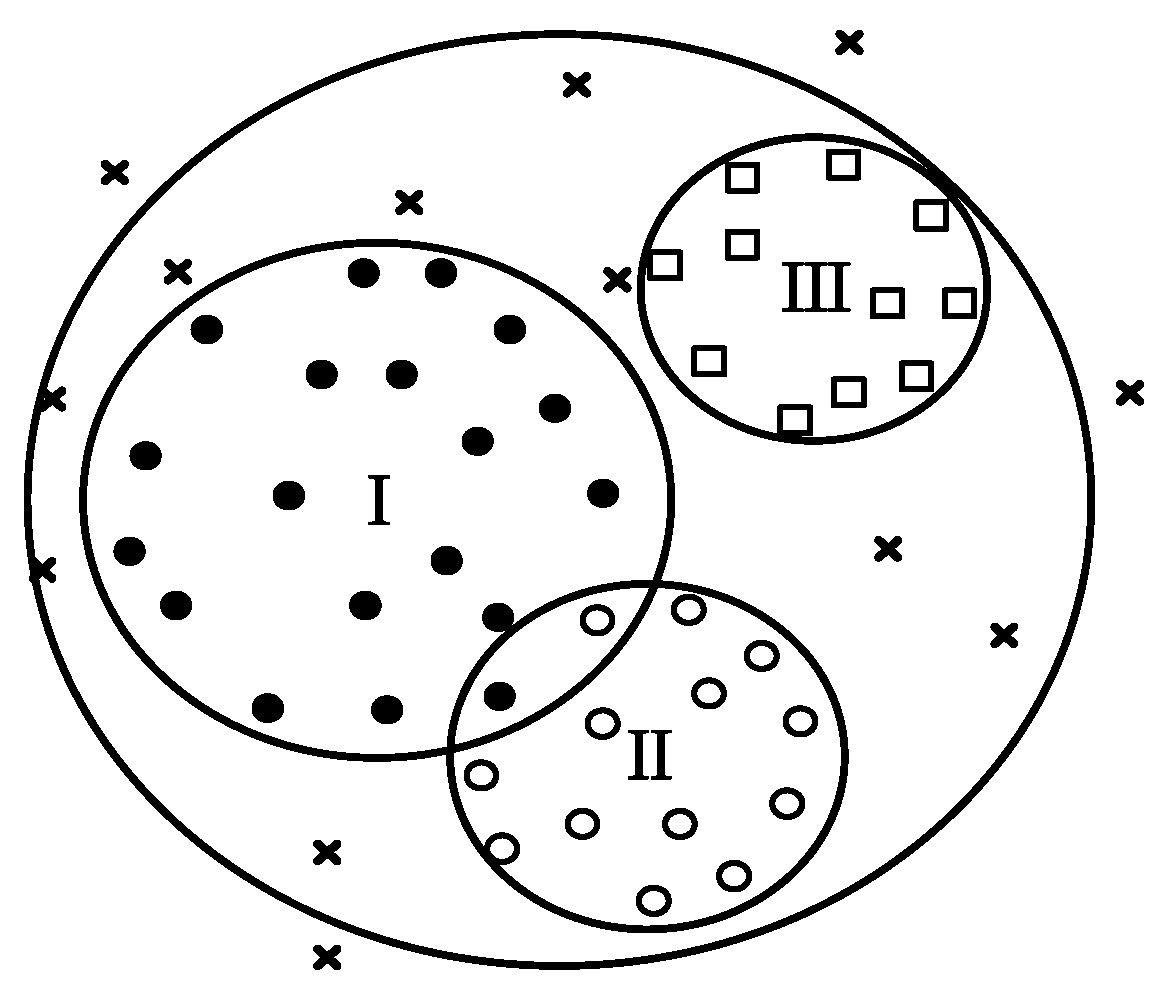
As mentioned earlier, the data samples for each type of operating mode only participate in the training of constructing an SVDD hypersphere, so that each SVDD hypersphere contains all or as many data samples of the corresponding operating mode. In this way, the multiple SVDD models can be established.
Figure 1 gives the schematic diagram.
Even for single class data samples obtained by the K-means algorithm, there are often some data samples of a non-target class, which lead to a larger volume of SVDD hypersphere obtained by training, which will increase the false alarm rate. Additionally, if these data samples near the boundary of the hypersphere are removed, the volume of the obtained hypersphere becomes smaller, resulting in an increase in the false negative rate [
46]. Therefore, in order to enhance the robustness of single SVDD, a relaxation factor and a penalty parameter were introduced. The problem of determining the minimum SVDD hypersphere is formulated as the following optimization problem:
where
is the relaxation factor, which indicates the probability that some training data samples are allowed to be erroneously classified;
is the penalty parameter, which is used to control the degree of punishment for misclassified data samples, and thus plays a role in hypersphere volume and misclassification;
is the number of data samples;
is the number of operating modes;
and
are the center and radius of the
-th hypersphere, respectively.
The kernel function used in SVDD maps raw training data from a low-dimensional space to a high-dimensional feature space, thereby constructing a compact hypersphere in a high-dimensional feature space that contains all or all of the target training data samples. The Gaussian kernel was used for SVDD here, which is commonly used for a one-class classifier, such as SVDD, support vector machine, and Parzen density [
47]. After introducing the kernel function, the dual problem of the optimization problem of Equation (9) can be obtained as follows:
where
a is a Lagrange multiplier;
is the kernel function used to calculate the inner product of the feature space. By solving the above quadratic programming problem, the radius of the
-th hypersphere is calculated by Equation (12):
where
is the support vector. With the same method, the spherical center and radius of other SVDD hyperspheres with different operating modes can be obtained.
Assuming that
is a new sample to be tested, then the distance
between the test sample and the
-th hypersphere center is obtained by:
Therefore, if is greater than , then the test sample does not belong to the -th class.
For multi-SVDD classification issues, it should be noted that due to the intersection of multiple hyperspheres some data samples may have difficulty determining which operating mode the data sample belongs to. Therefore, there are uncertain regions. However, the training data set collected from leak-free historical data, regardless of which hypersphere the data sample in the overlap region belongs to, indicates that the data sample is leak-free one. It is not necessary to determine which SVDD hypersphere the data sample of the overlap region belongs to. For pipeline leak detection, we are concerned with whether the data sample is a leak or a leak-free one, and do not care which type of operating mode the data sample belongs to. Since all SVDD hyperspheres are obtained under different normal operating modes, as long as the test data samples fall in any of the SVDD hyperspheres, this indicates that no leak has occurred. This is the basis for our proposed Cas-SVDD for pipeline leak detection. In our work, the Cas-SVDD is defined that the SVDDs obtained under different operating modes are cascaded one after the other.
After obtaining the SVDD model for each operating mode, Cas-SVDD can be applied with the use of the following strategies:
(1) Before the Cas-SVDD is used, each SVDD should be reasonably ordered. The SVDD corresponding to the operating mode with high probability occurrence should be placed in front of other SVDDs, which can effectively reduce the online detection time;
(2) The data samples collected online are sequentially passed through the Cas-SVDD model. If the sample is included in a certain SVDD hypersphere, it indicates that there is no leak and it is no longer necessary to enter the remaining SVDD hyperspheres. Conversely, if the sample is not included in any SVDD hypersphere, it indicates that the pipeline is leaking.
2.3. Procedure
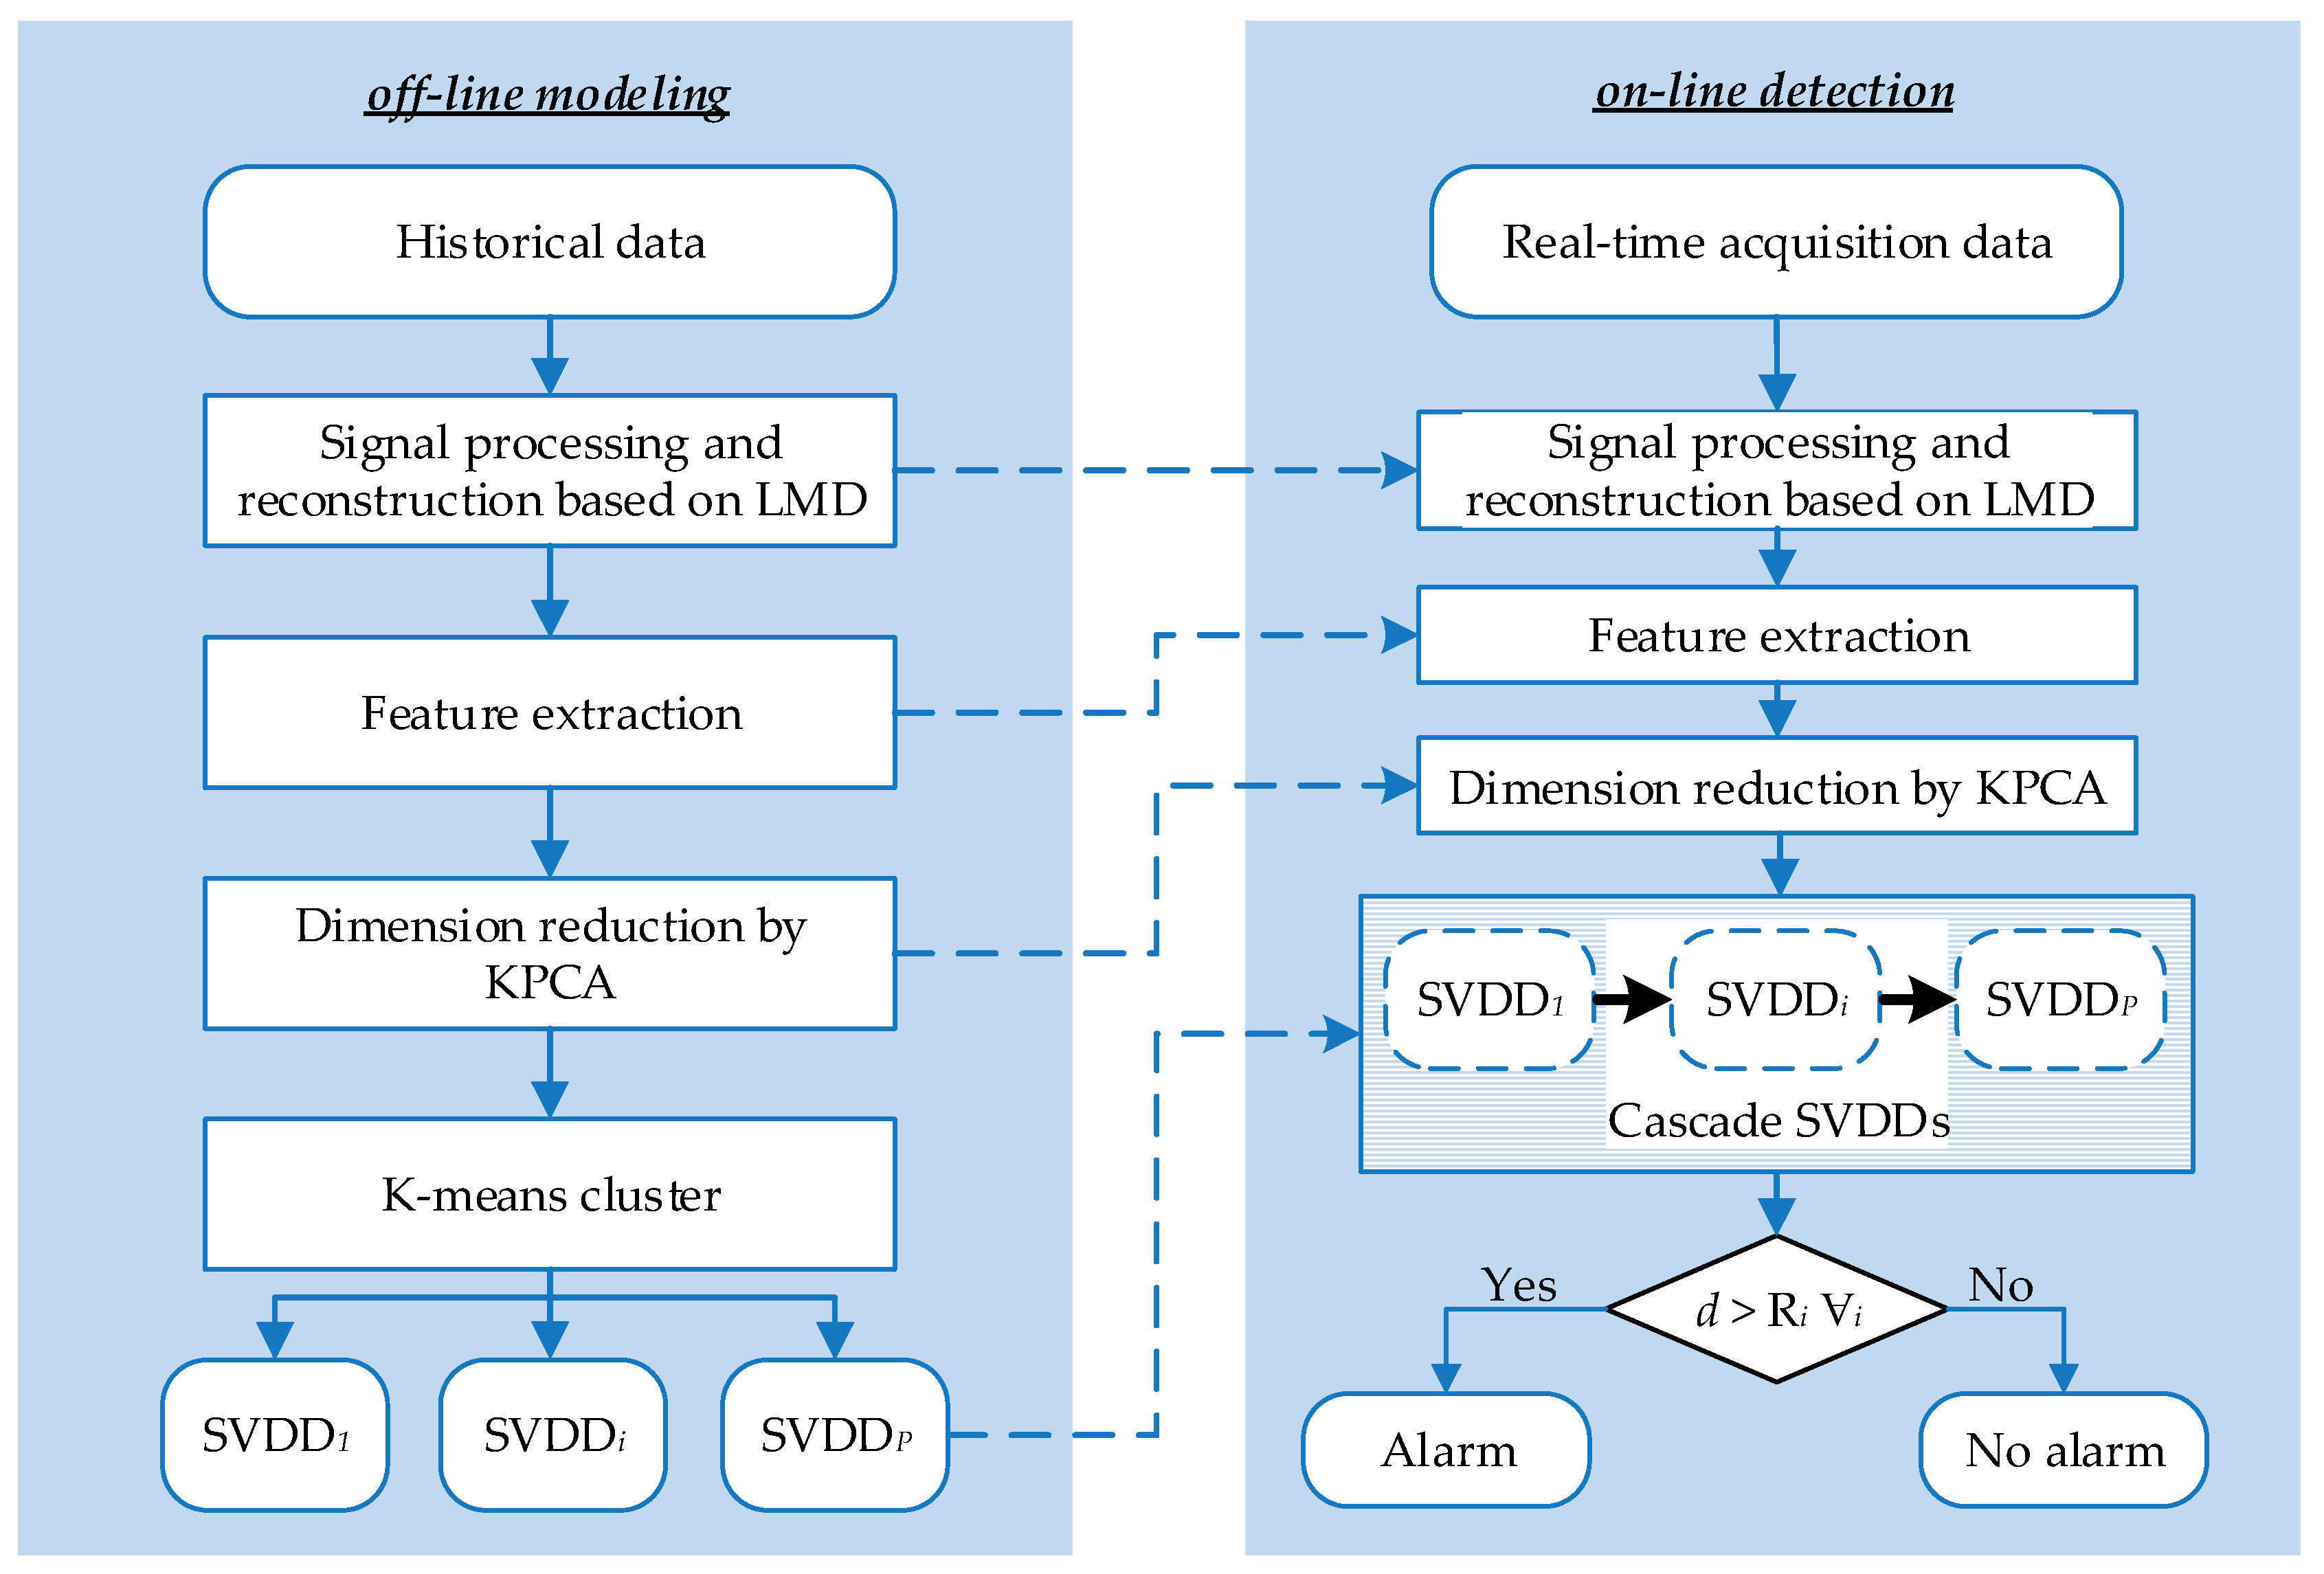
Based on the KPCA and Cas-SVDD methods, the procedure of the proposed method for pipeline leak detection with multiple operating modes can be divided into an offline part and online part, as shown in
Figure 2.
The detailed procedure was as follows:
I: Offline training model module
(1) Collect historical data of pipeline normal operation, and set initial parameters of LMD, KPCA, K-means algorithm, and SVDD;
(2) Denoise and reconstruct data samples by LMD, and extract the feature variables, each of which can be calculated according to the formulas provided in
Table 1. Then, the value of each feature is normalized to the same range (between 0 and 1);
(3) Reduce the Dimension of feature variables by KPCA;
(4) Identify various operating modes by using the K-means algorithm;
(5) Establish the SVDD model for each operating mode, and obtain the center and radius of each hypersphere.
II: Online detection module
(1) Obtain real-time operational data sample;
(2) and (3) are the same as the steps as for the offline module;
(4) Leak alarm, or not, by using Cas-SVDD according to the strategy mentioned above.
It should be noted that the issue of pipeline leak localization is not considered in the paper. For the integrity of the methodology for pipeline leak problem, the most widely used method for pipeline leak location, namely the negative pressure wave method, is briefly introduced here. Once the pipeline leak is determined, the generalized correlation analysis can be used to obtain the time delay estimation of the negative pressure wave generated by the leak signal reaching the sensors on both sides of the leak point. The leak localization can be calculated according to the formula
, where
is the leak point from the upstream reservoir,
is pipeline length,
is the propagation speed of negative pressure wave, and
is the time delay. A detailed description of the leak location method can be found in the literature [
48].
4. Results and Discussions
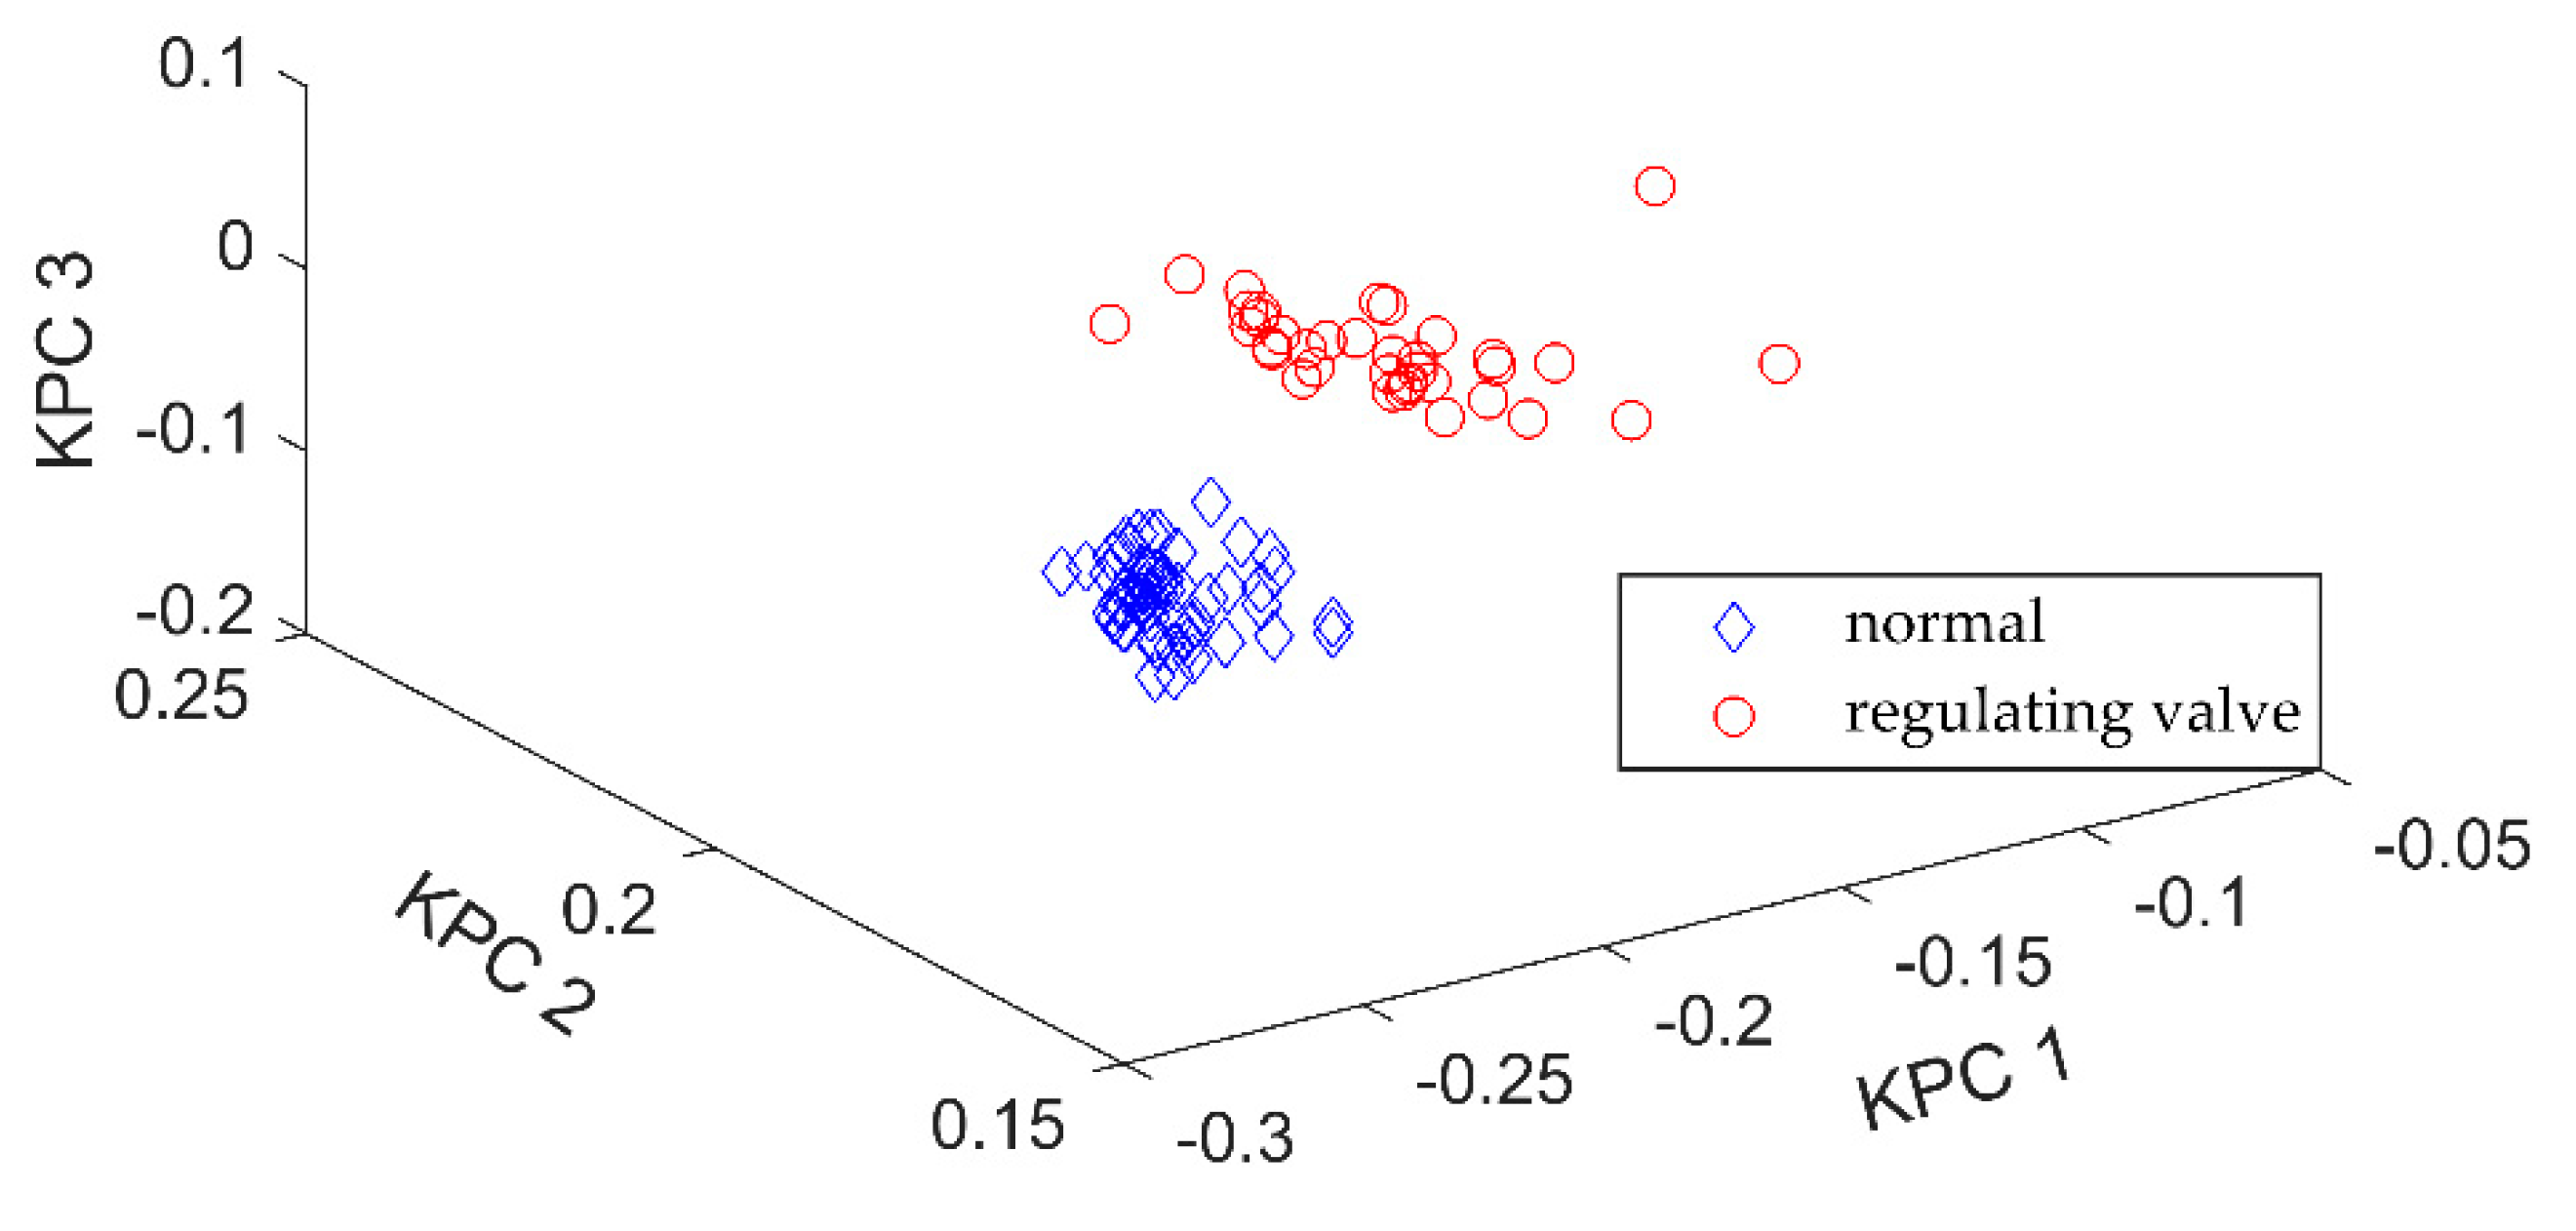
As mentioned above, during the pipeline fluid transport process, the operating modes, such as valve adjustment and normal running, change frequently, and the collected leak-free data samples contain multiple operating conditions. The single SVDD hypersphere is not compact enough in a variety of operating modes, which in turn leads to low classification accuracy. The K-means algorithm was used to cluster data samples that were processed by KPCA, and then the data samples of each operating mode could be obtained. The clustering result using K-means is shown in
Figure 5. The K-means clustering obtained a good clustering result. Next, the SVDD model was established for each operating mode in order to obtain the Cas-SVDD model, consisting of multiple compact SVDD hyperspheres. It can also be seen from
Figure 5 that establishing a unique SVDD hypersphere for all the data samples in all normal operating modes will result in a data sample set that is not compact enough. In some cases, a leak data sample may be located between the SVDD hyperspheres, and the unique SVDD may consider it as a normal operating data sample, while the Cas-SVDD makes it easy to identify that the data sample is a pipeline leak sample.
To verify the proposed KPCA-Cas-SVDD method, the performance of the pipeline leak detection will be compared to the corresponding data from the single SVDD (S-SVDD) and Cas-SVDD methods. Here, the S-SVDD method means that only one hypersphere model was established using all data samples with different operating modes under normal operation; the difference between the Cas-SVDD and the KPCA-Cas-SVDD is that the former does not use the KPCA for the dimension reduction of feature variables, while the latter uses the KPCA. The ratio of training data and test data was 5:5. The SVDD adopted a Gaussian kernel function. After 5-fold cross-validation and grid search, the optimal parameter kernel width
and target class error rate
of the SVDD in the three methods were obtained, as shown in
Table 4.
For the convenience of comparing the performance of the three methods, three cases were considered and the three methods were applied to each of these three cases. Case 1: including 120 sets of data samples, of which 40 were from normal running, 40 from pipeline valve adjustment, and 40 from small leak; Case 2: including 120 sets of data samples, of which 40 were from normal running, 40 from pipeline valve adjustment, and 40 from medium leak; Case 3: including 120 sets of data samples, of which 40 were from normal running, 40 from pipeline valve adjustment, and 40 from large leak.
For the S-SVDD method, the pipeline leak detection results are shown in
Figure 6, where
Figure 6a–c represent Case 1, Case 2, and Case 3, respectively. For the convenience of graphic demonstration, the first 80 data samples are leak-free data samples, and the leak data sets are set from the 81st to the 120th samples. It can be seen from
Figure 6a that 15 small leak samples were not detected.
Figure 6b shows that 12 medium leak samples were undetected.
Figure 6c shows that seven large leak samples were undetected. Therefore, these results show that the performance of the S-SVDD method for pipeline leak detection is poor, with low leak detection accuracy.
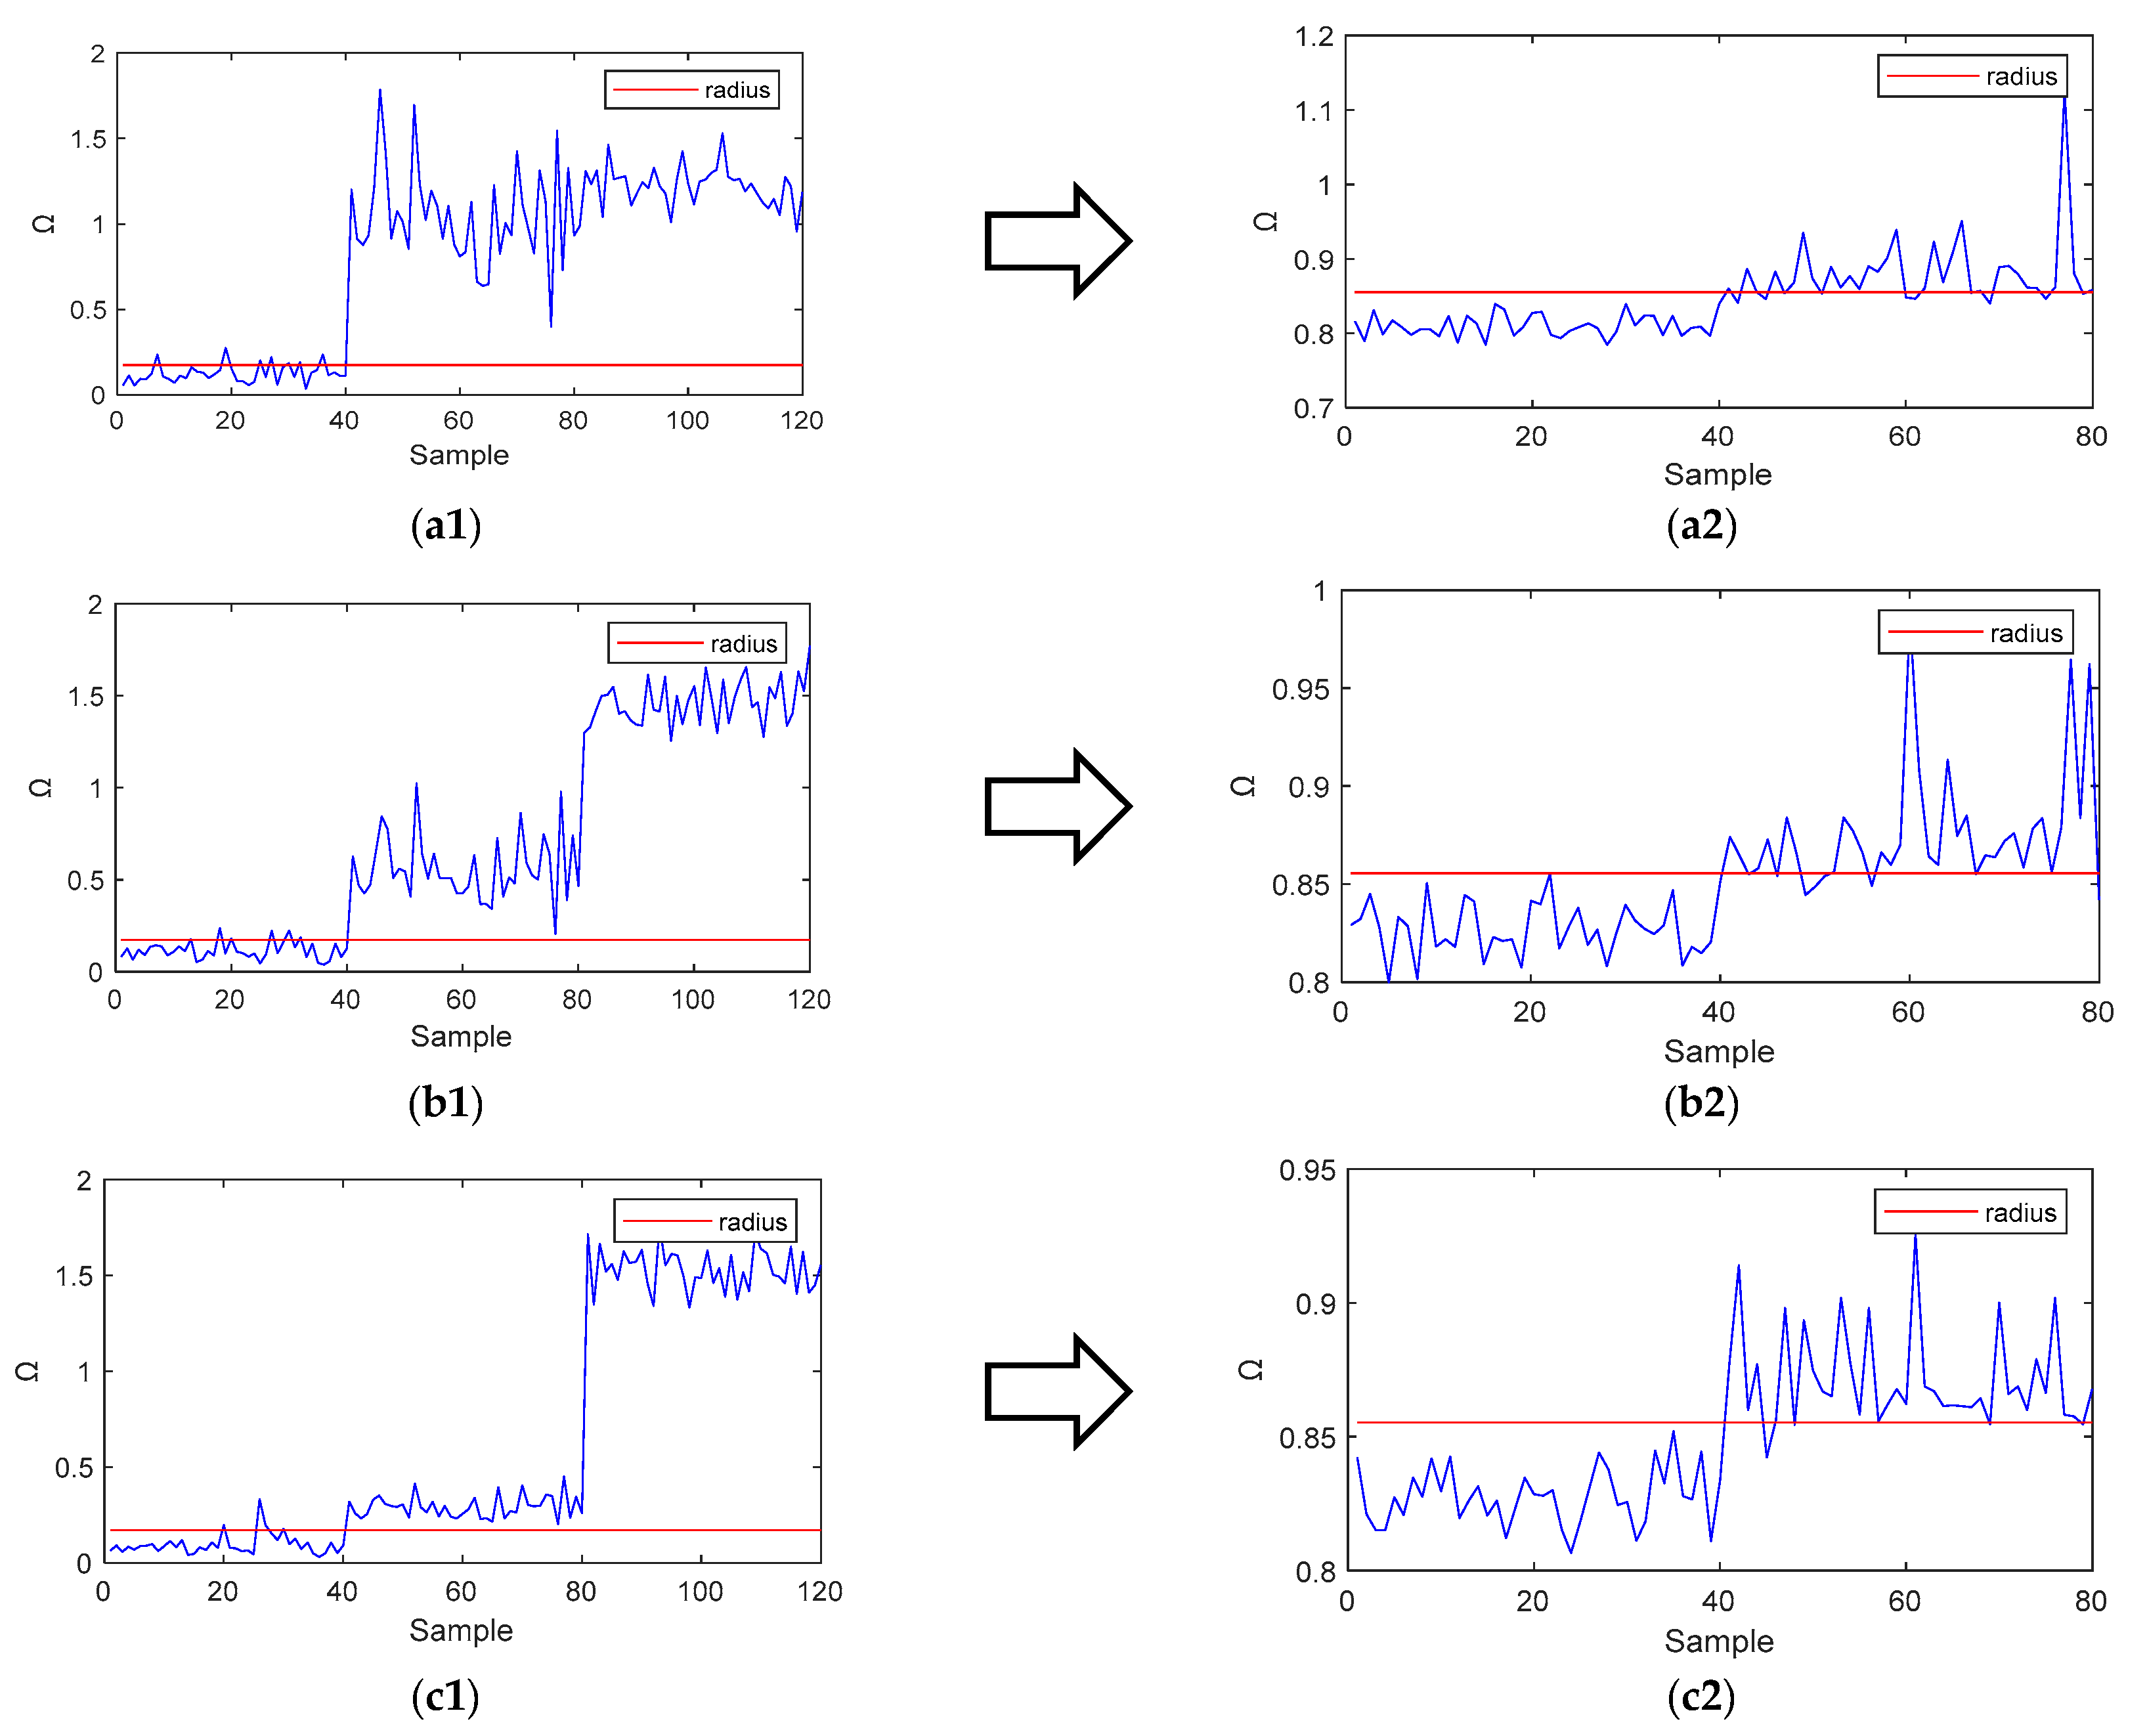
For the Cas-SVDD method, the pipeline leak detection results are shown in
Figure 7. The 120 sets of data samples were first classified by using the first SVDD of the Cas-SVDD. Then, the remaining data samples that were not in the first SVDD hypersphere were further classified by using the second SVDD of the Cas-SVDD.
Figure 7(a1) shows that there were eight samples with false-positive results, and
Figure 7(a2) shows 10 samples with false-negative results. In summary, these results from
Figure 7 show that the performance of Cas-SVDD for pipeline leak detection was much better than that of S-SVDD.
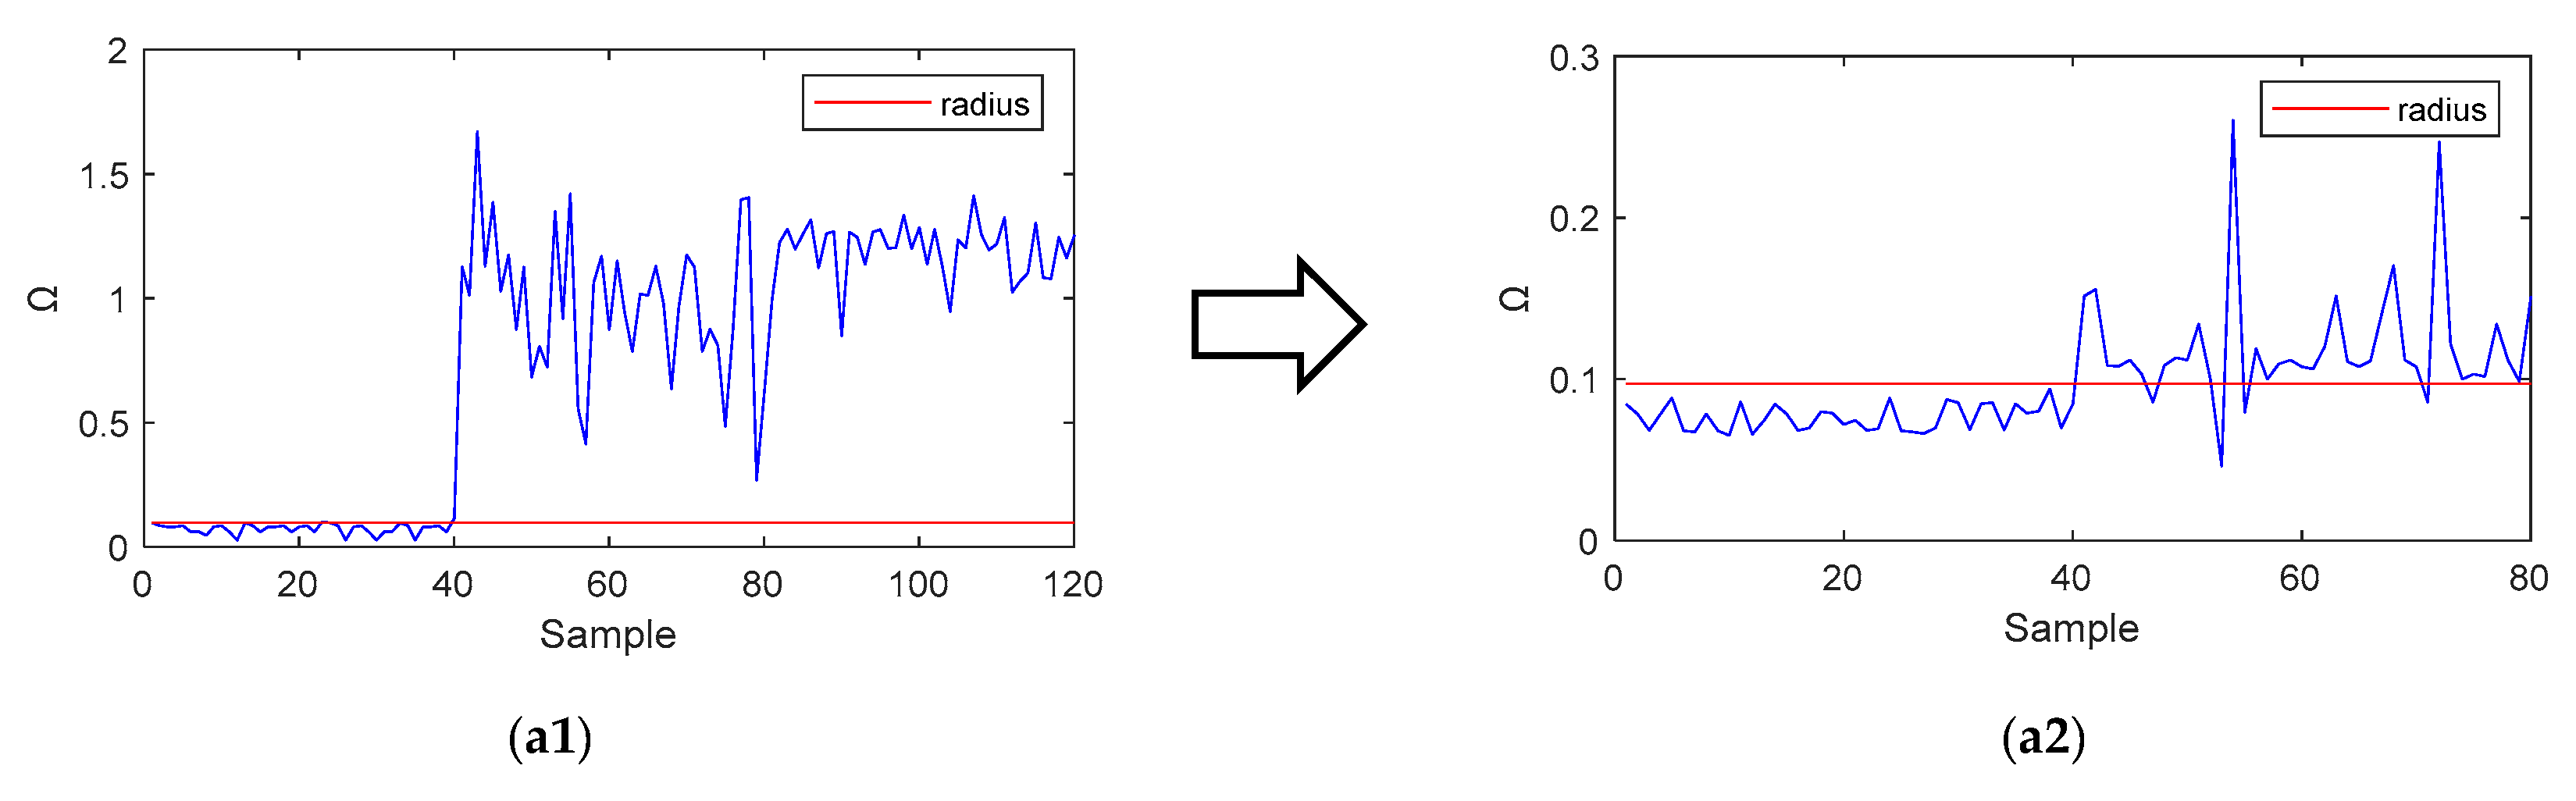
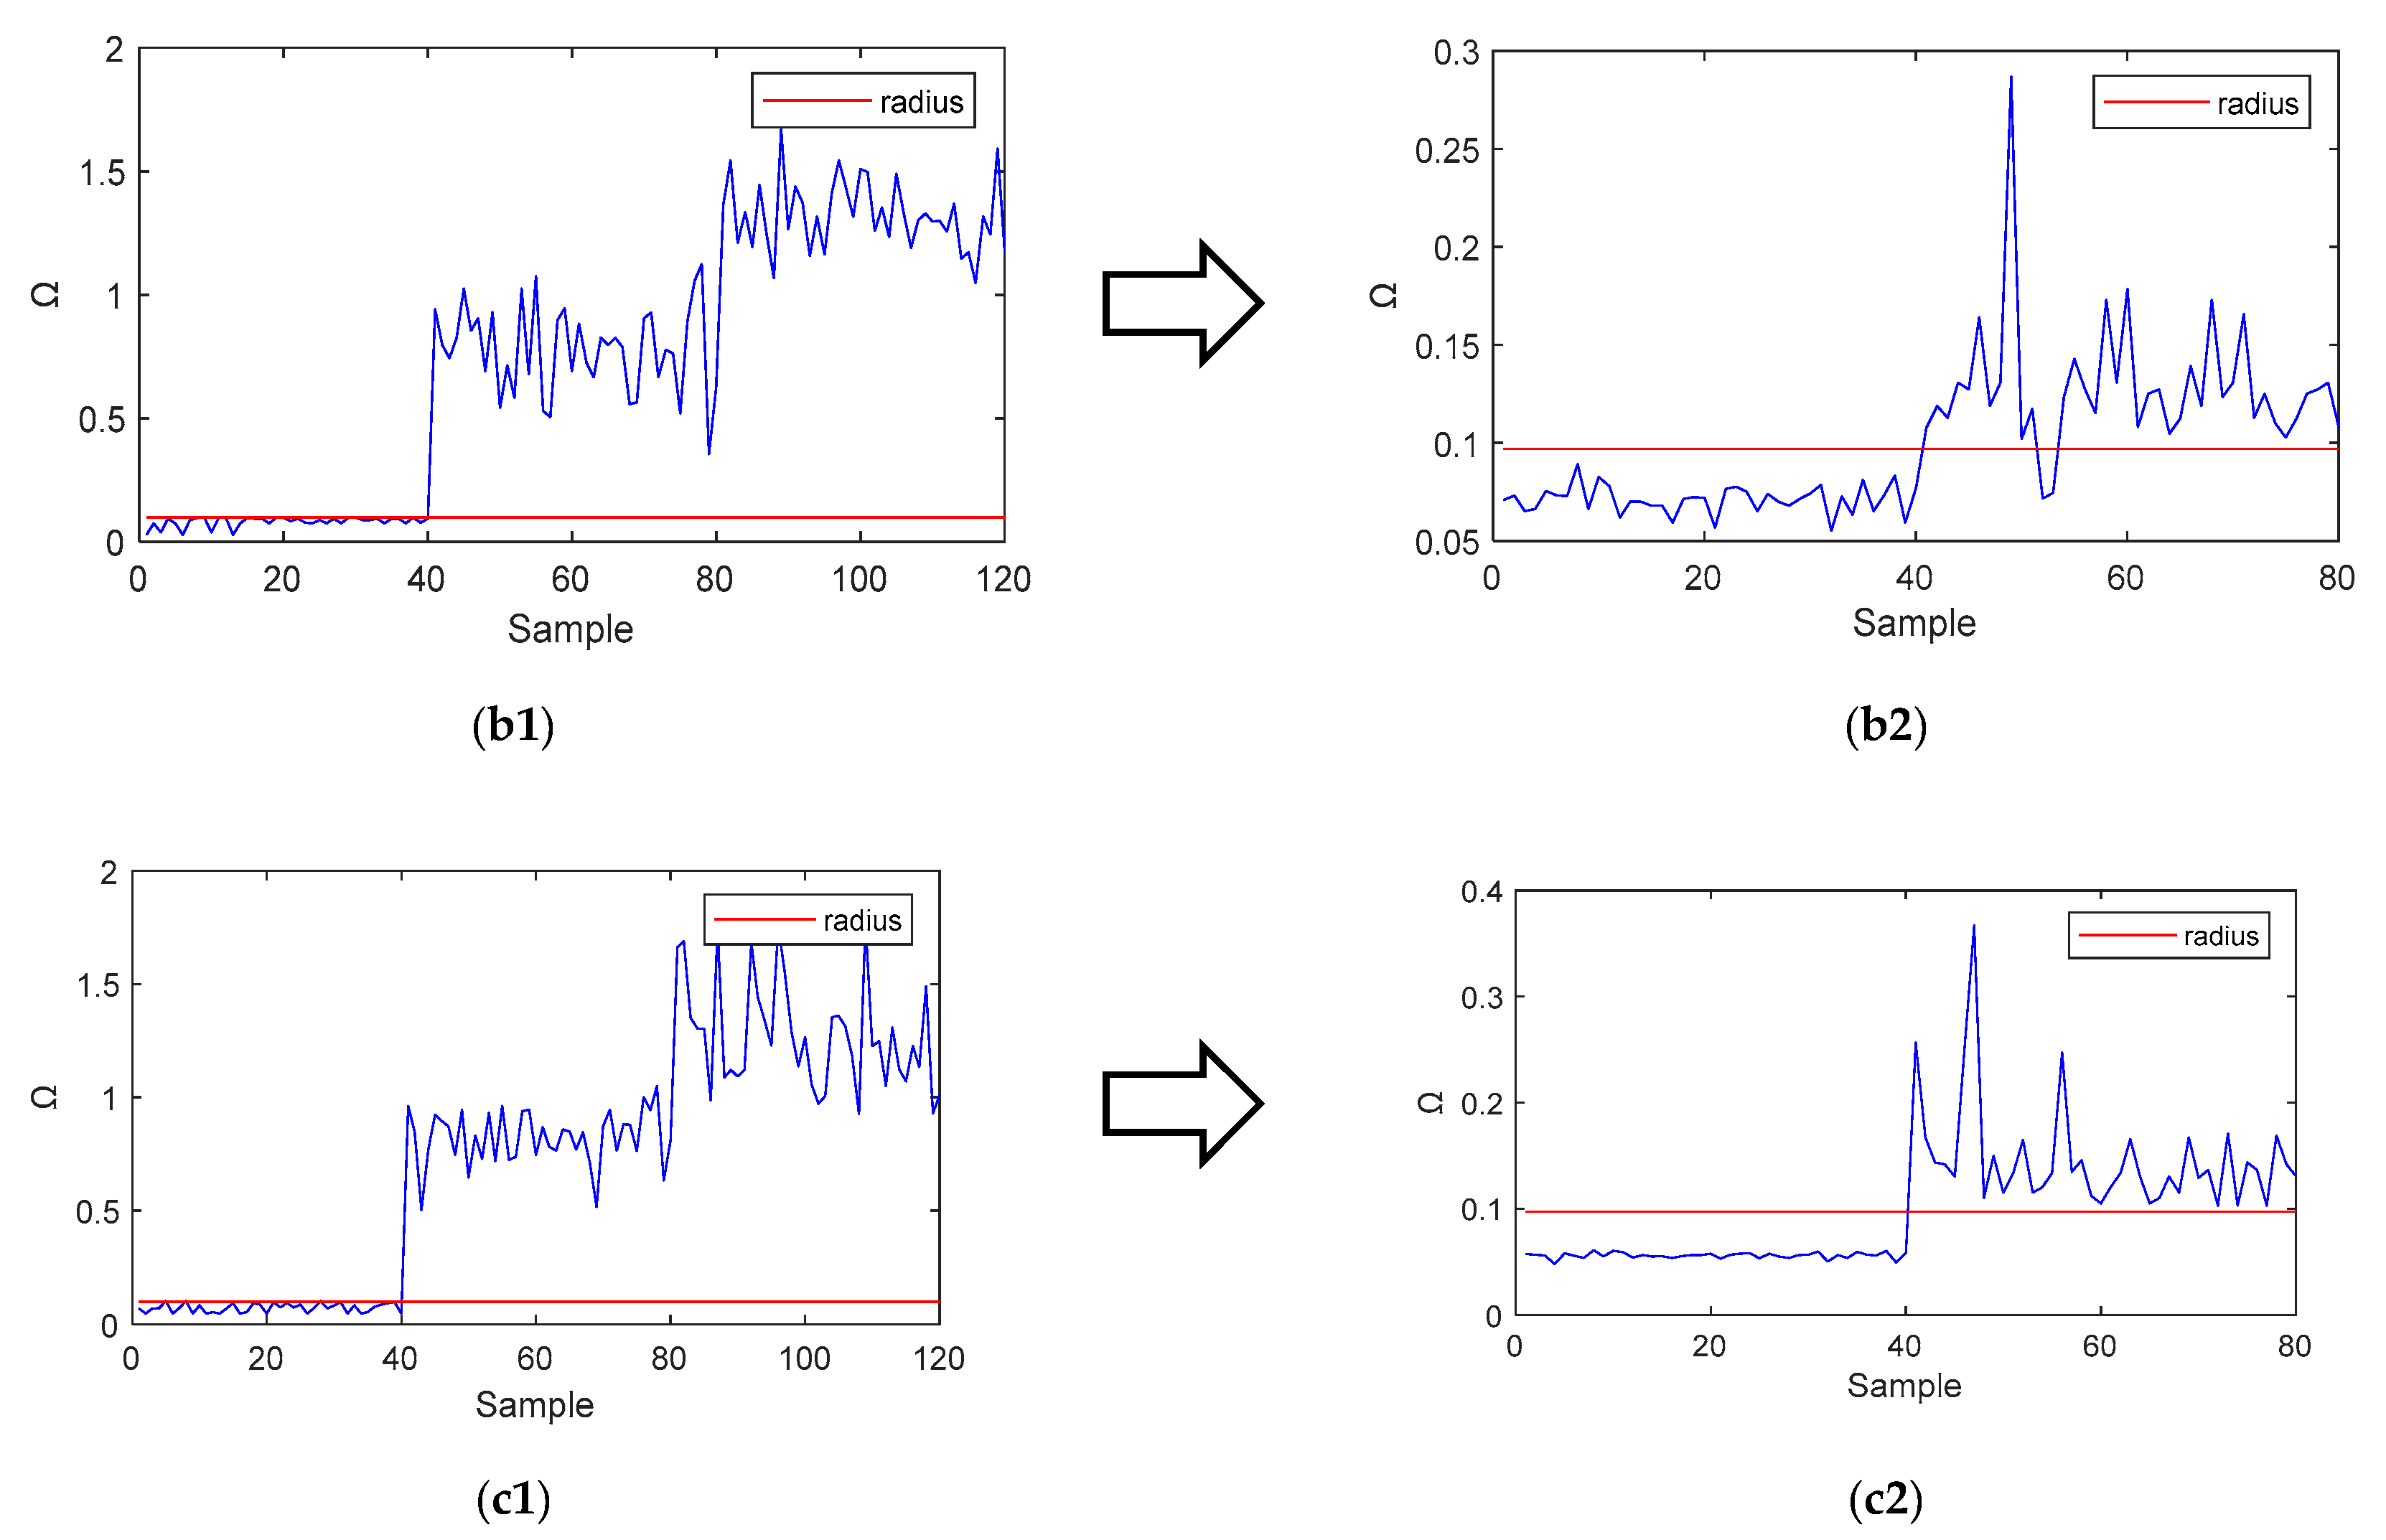
As shown in
Figure 8, the KPCA-Cas-SVDD method had very few false-positive results and false-positive results. This also shows that the feature dimension reduction using KPCA has a great influence on the leak detection performance for the Cas-SVDD. This is because the KPCA algorithm has the ability to process high-dimensional projections for nonlinear data, and can obtain new comprehensive features that contain most of the information of the original feature variables.
Table 5 shows the results of the comparison of the three methods for pipeline leak detection. It also shows that the pressure at the location of the leak has a great influence on the accuracy of the pipeline leak detection. The high pressure at the location of the leak indicates that a large leak has occurred. Large leaks are easily detected compared to small leaks, is because a large leak produces a pressure change of higher magnitude that travels faster to the upstream and downstream pressure sensors, causing obvious changes in the feature variables. However, for small leaks, the pressure change at the location of the leak is less obvious and the variation in the feature variables is also small. In this case, the proposed method showed a high detection accuracy compared to the other two methods.
5. Conclusions
In this paper, a hybrid intelligent method for pipeline leak detection was proposed. The method firstly performed signal denoising and signal reconstruction based on LMD. After that, the KPCA was used for feature dimension reduction. Subsequently, the K-means algorithm was used for the clustering of various operating modes. Finally, the Cas-SVDD was used for pipeline leak detection. The characteristics of this paper are mainly two aspects: (1) the proposed method is only necessary to collect the pressure signal of pipeline normal operation, without the need to collect the leak data samples that are difficult to obtain in the actual pipeline operation; (2) based on the integration of KPCA and Cas-SVDD, a novel method was proposed for pipeline leak detection with multiple operating modes. Compared with the S-SVDD method and Cas-SVDD method, the proposed method in this paper comprehensively considered the various operating modes in the pipeline transportation process, and can effectively reduce the false alarm rate.
However, only two normal operating modes were considered in our work. There may be more operating modes during the actual pipeline operation. In this case, more SVDD models would need to be established, furthermore, the order of each SVDD in the cascade structure should be optimized, which can reduce the time of online detection and improve the accuracy of leak detection. Therefore, how to optimize the order of Cas-SVDD to minimize the time of online detection while ensuring the accuracy of leak detection is an issue worthy of further study. In addition, the better clustering algorithm also contributes to the construction of the Cas-SVDD and improves the accuracy of pipeline leak detection. Finally, some practical issues of the proposed method should be considered for leak detection in a real case. Future work will focus on these issues.


