Systematic and Model-Assisted Process Design for the Extraction and Purification of Artemisinin from Artemisia annua L.—Part I: Conceptual Process Design and Cost Estimation


 ,
,
Abstract
:1. Introduction
- Part 0:
- Sixt, M.; Strube, J. Systematic and model-assisted evaluation of solvent based- or pressurized hot water extraction for the extraction of Artemisinin from Artemisia annua L. Processes 2017, 5, 86, doi:10.3390/pr5040086.
- Part I:
- Sixt, Schmidt et al. Conceptual process design and cost estimation (this article);
- Part II:
- Schmidt, Sixt et al. Model-based design of agitated and packed columns for multistage extraction and scrubbing. Processes, Revised version review;
- Part III:
- Mestmäcker, Schmidt et al. Chromatographic purification. Processes, Pending editor decision;
- Part IV:
- Huter, Schmidt et al. Crystallization. Processes, Under review.
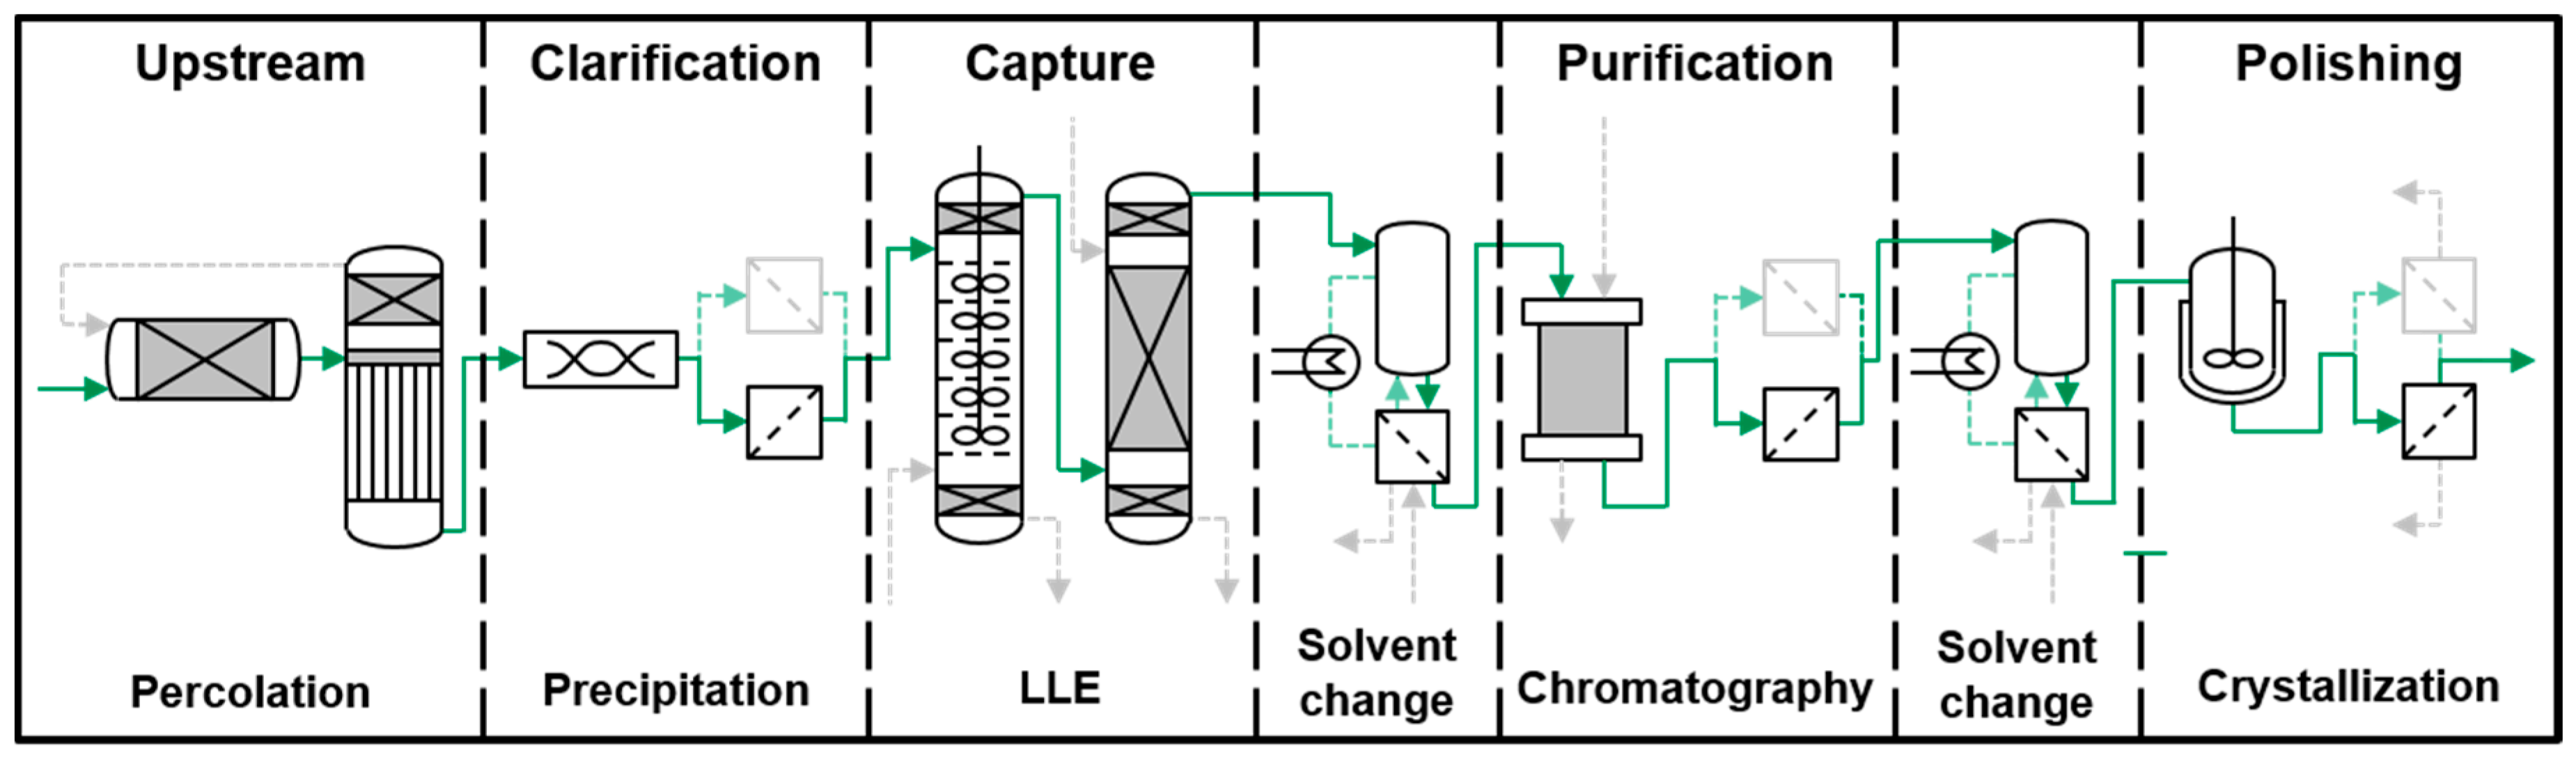
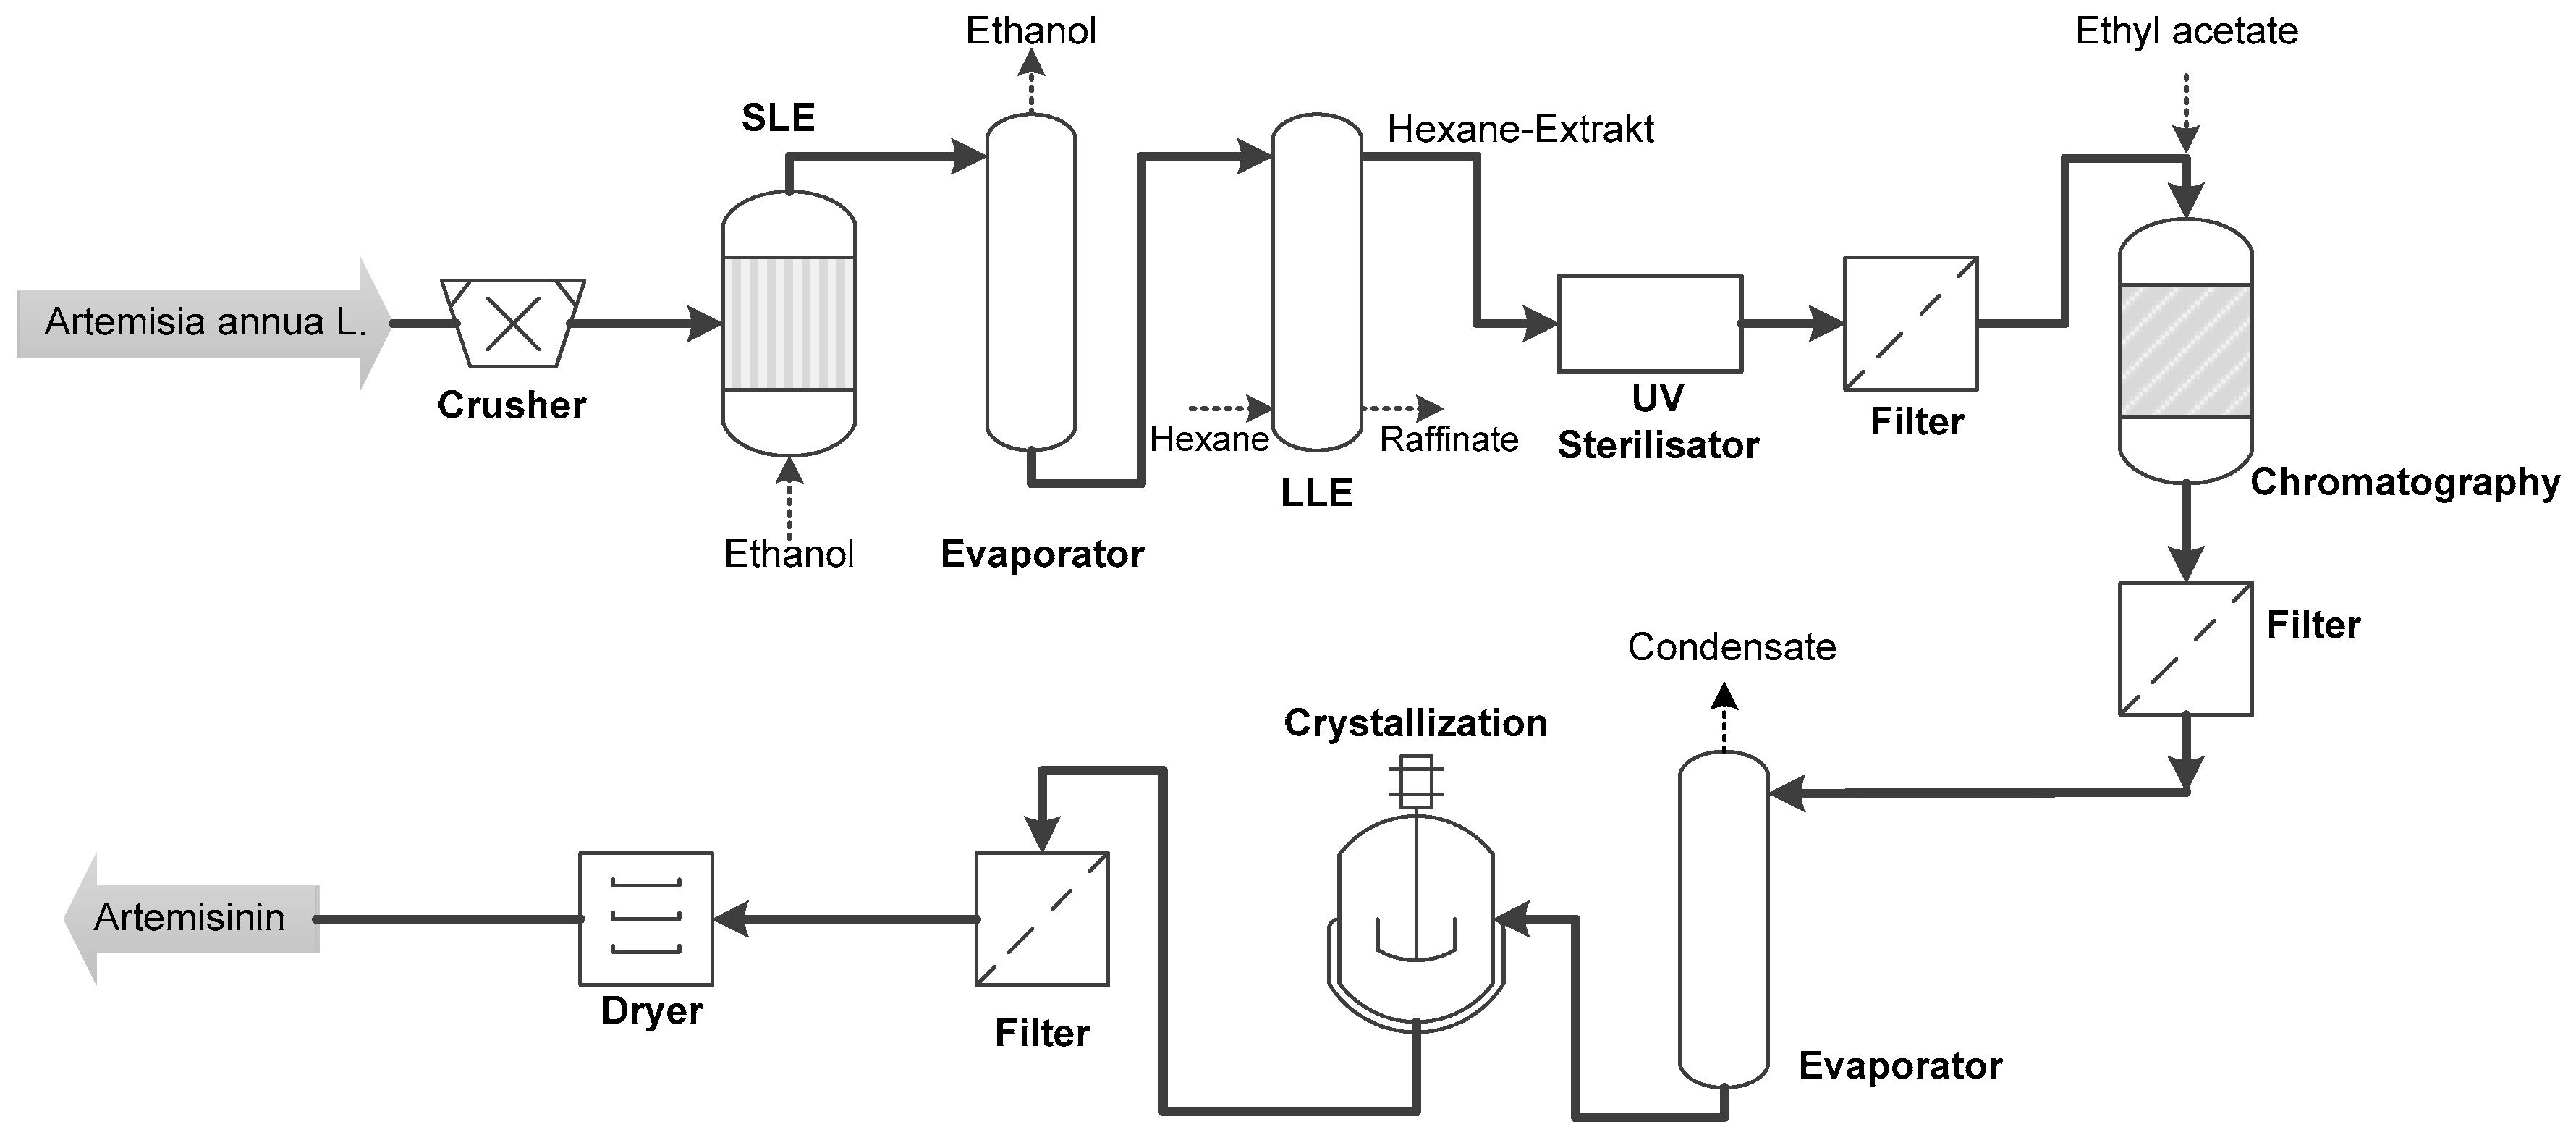
- The first step is the solid-liquid extraction discussed in detail in [7].
- The extract is filtered and afterwards the organic solvent is partly recycled. In this step, the precipitation of chlorophyll commonly takes place due to the accumulation of water in the extract in which chlorophyll is not soluble. If this does not occur, chlorophyll can be precipitated by adding water as an anti-solvent.
- The thickened extract is filtered once again to separate the precipitate.
- A whole series of liquid-liquid extraction steps serves to further increase the target component’s concentration whilst separating side components.
- In a final step, the pure component is obtained either by preparative chromatography or crystallization or rather by coupling these two steps.
2. Results and Discussion
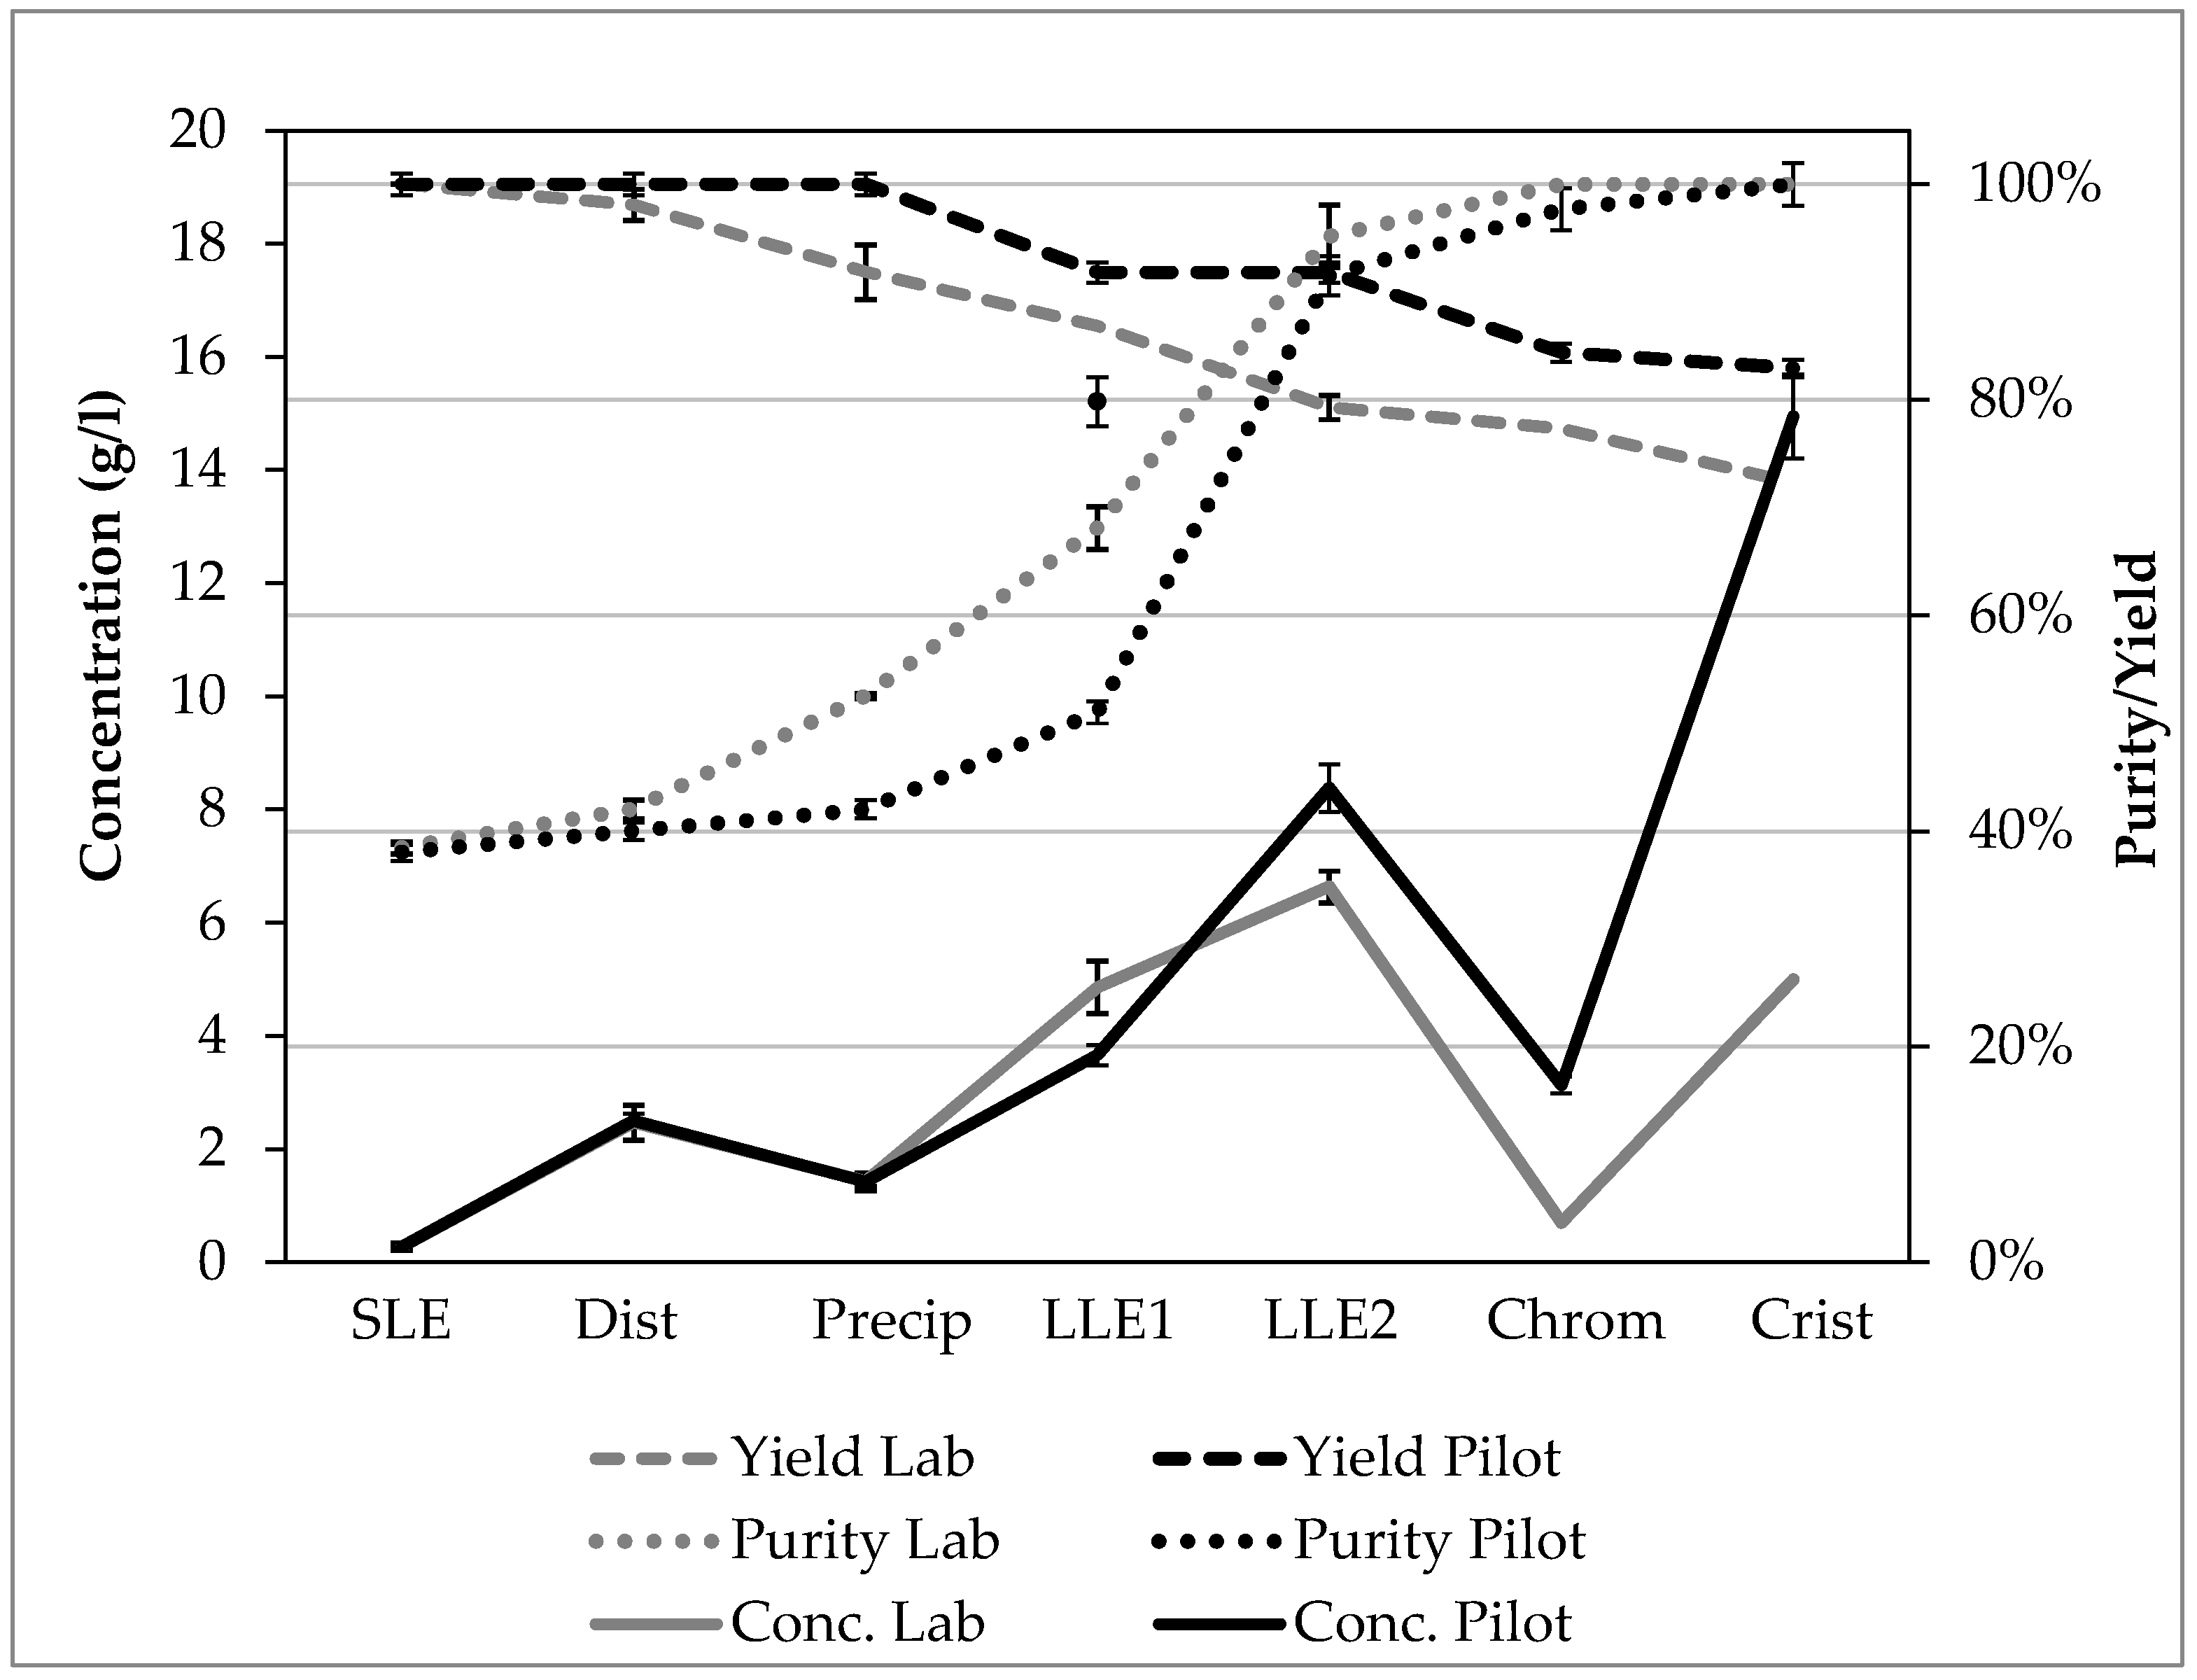
- In both scaling stages, the extract can be recovered by conventional solid-liquid extraction with acetone with a purity of nearly 40% and a concentration of 0.27 g/L. The yield is considered 100% in this process step. Details on solid-liquid extraction can be found in [7].
- Evaporation of the extract by means of distillation results in a concentration of about 2.5 g/L due to the volume reduction. The yield loss amounts to about 2% for this process step.
- In the first step of purification, chlorophyll is separated by precipitation and filtration. It can be seen that the purity in the laboratory process increases to 52%, in the pilot process, however, only to about 42%. Due to the addition of water, the concentration drops. The yield loss in this process step is about 6% on a laboratory scale, whereas, in the pilot process, practically no yield loss is recorded. The purification effect of precipitation is overestimated by the laboratory study, yet higher yields result due to larger pilot scale quantities. Despite the low level of purification, this process step is necessary because the extract containing pure acetone would not form a miscibility gap with the solvents used in the subsequent liquid-liquid extraction.
- In the first liquid-liquid extraction, the concentration in laboratory scale greatly increases from 1.4 g/L to about 4.8 g/L due to the small solvent ratio (+340% increase). The lower solvent ratio in the pilot process results in a concentration of only about 3.7 g/L (increase +264%). The concentration is therefore 30% lower in the pilot study. Similarly, at 70%, the purity is higher by 20 percentage points compared to the pilot scale. In a one-step operation of the first liquid-liquid extraction on a laboratory scale, the yield drops to 80% (shown as a dot in the diagram). However, a multi-step process is assumed, resulting in an overall yield of about 87%. The pilot process results in a measured yield of 90% after this process step.
- Product purity increases to 90% in both process variants in the second liquid-liquid extraction with sodium carbonate solution. This corresponds to an increase of +140% in the laboratory and +186% on a pilot scale. The concentration increases again by the re-extraction of the acetone from the respective organic phase into the aqueous sodium carbonate; on a laboratory scale from about 4.8 g/L to 6.6 g/L (+137%) and on a pilot scale from 3.7 g/L to 8.4 g/L (+227%). In the laboratory process, the overall yield after this step drops to about 80%, whereas this process step at the pilot scale shows no measurable yield loss.
- In the subsequent chromatography (here for better comparability batch chromatography), a purity of over 99% is achieved in both processes. The pilot scale yield is 85% after this step, 77% on a laboratory scale. The concentration decreases in both processes due to the dilution in the respective eluent.
- The final crystallization and drying results in a purity of almost 100%. The overall process yield after these steps is 83% in the pilot and 72% in the laboratory scale.
3. Economic Feasibility Study
3.1. Investment Costs
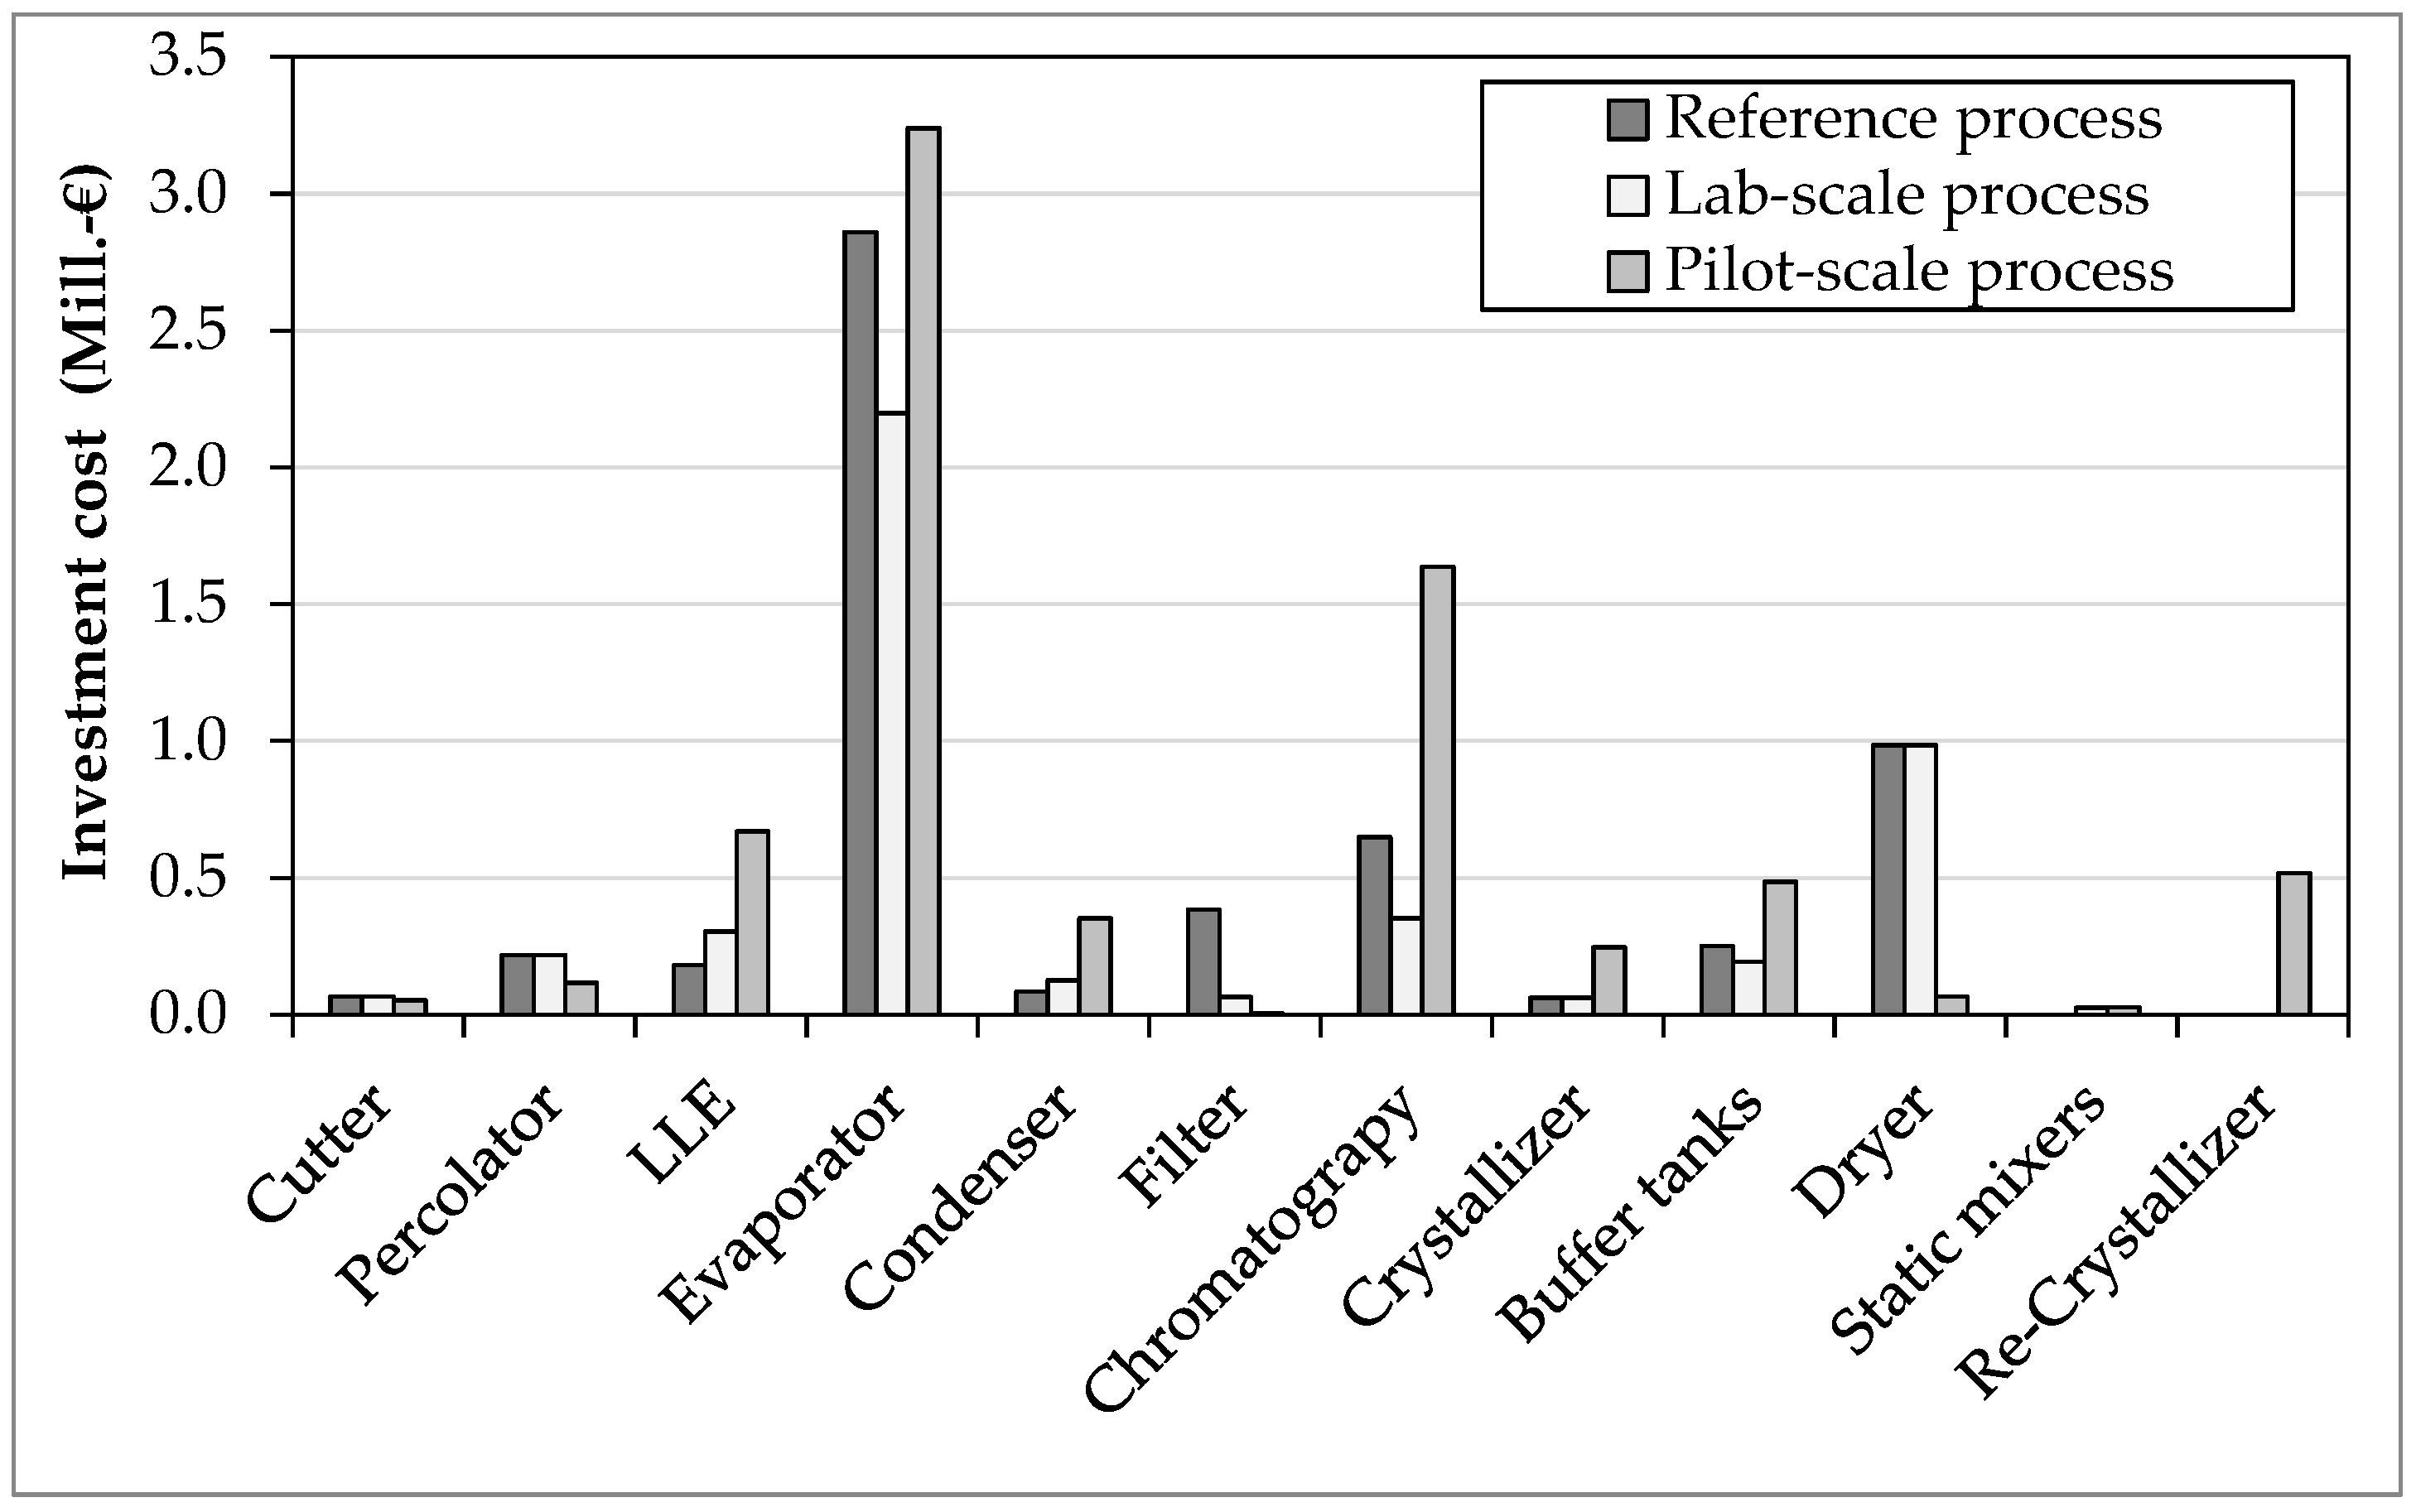
- Due to the higher yield of the pilot process less mugwort needs to be extracted, the costs for the granulator and percolator are, therefore, about 60% lower than in the reference and laboratory process.
- The costs for the liquid-liquid extraction are 120% greater in the pilot process compared to the laboratory process, as the second LLE (liquid-liquid extraction) step was also realized with one column and not with a mixer-separator. In the reference process, only a liquid-liquid extraction is performed in a packed column, resulting in only 30% of the cost of the LLE compared to the pilot process.
- The evaporators are approximately equally expensive in all three variants, whereby it should be noted here that the degree of detail of the solvent recycling increases significantly from the reference to the pilot process. Similarly, the cost of the corresponding capacitors increases.
- The costs for filters were much overestimated in the reference process. The actual costs are negligible.
- The investment costs of batch chromatography in the pilot process are 360% more expensive compared to the laboratory process and about 150% more expensive than in the reference process. This high deviation from the laboratory scale to the pilot scale is achieved by purely theoretical scaling based on thin-layer chromatograms. A high error is to be expected at this point.
- Equipment costs for crystallization are also about 300% more expensive in the pilot process than in the laboratory or reference study. The acetone/isopropanol (VWR®, Darmstadt, Germany) system theoretically considered in the laboratory study has a steeper solubility curve than the ethanol/water system used in the piloting. As a result, significantly more crystallization steps must be carried out successively in the pilot process, which consequently also results in higher apparatus costs.
- Due to the higher level of detail of the pilot study, especially solvent recycling, the cost of buffer tanks is about 150% higher than in the two comparison processes.
- The cost of drying in the pilot study was only about 7% compared to the laboratory or reference process, as it switched from a costly vacuum belt dryer to a tray dryer.
- In the pilot process, the solvent often needs to be changed by recrystallization, for example, from the wash extraction to the chromatography support. In the laboratory process, attempts were made to integrate the solvents in the subsequent process step, which was not feasible in scale-up. As a result, additional equipment costs are incurred here.
- In summary, the pilot process results in approximately 60% higher investment costs (€7.4 million), mainly due to the more detailed interpretation of solvent recycling, recrystallization, and chromatography.
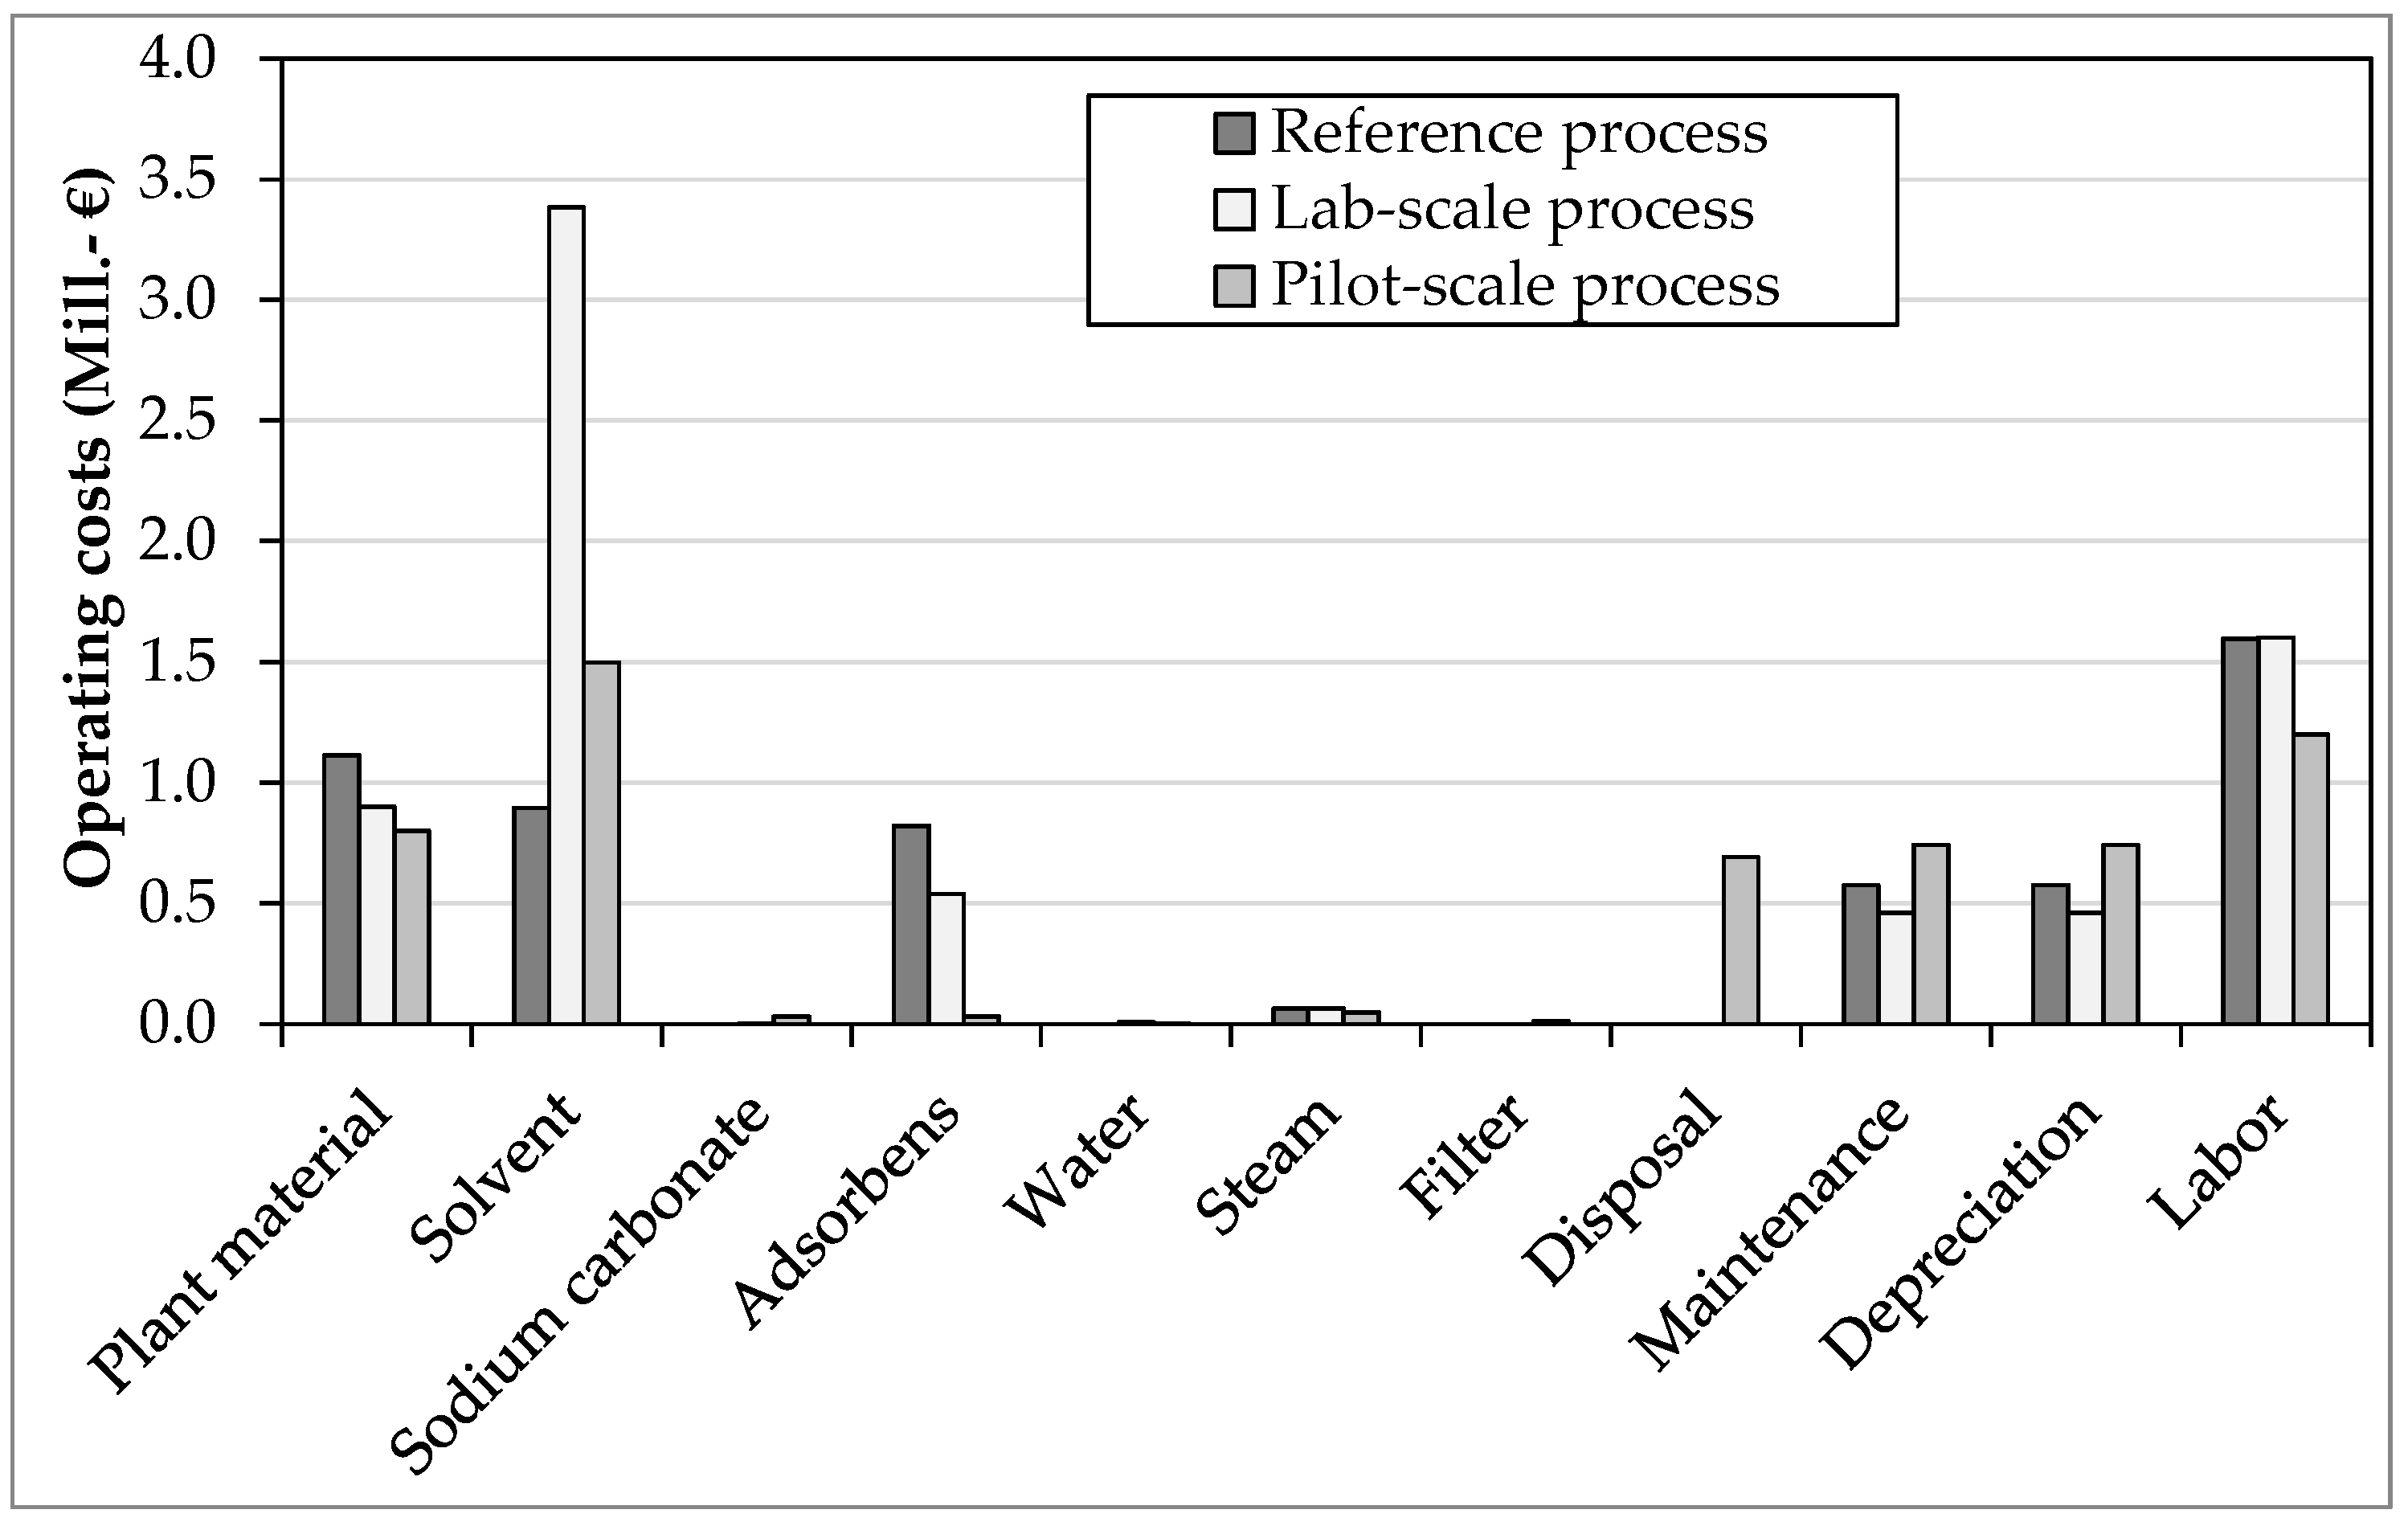
3.2. Operating Costs
- The process yield increases from the reference to the pilot process. This leads to the cost reduction of the plant material, which is assumed to be around 900 €/t. From the reference to the pilot process there is a savings potential of 30%, from the laboratory to the pilot process of 20%.
- In the laboratory process, solvent costs increase by 125% compared to the pilot process. The pilot process took a closer look at solvent recycling and reduced losses. The reference process comes with even lower costs, but this is not tenable due to the lowest level of detail. The cost of each solvent is 10% of Sigma-Aldrich listed retail prices (wholesale discount).
- In the reference and laboratory process, the service life of the adsorbent was much too short. In the pilot process, the column had a long service life, resulting in only about 6% of the cost of replacing the package.
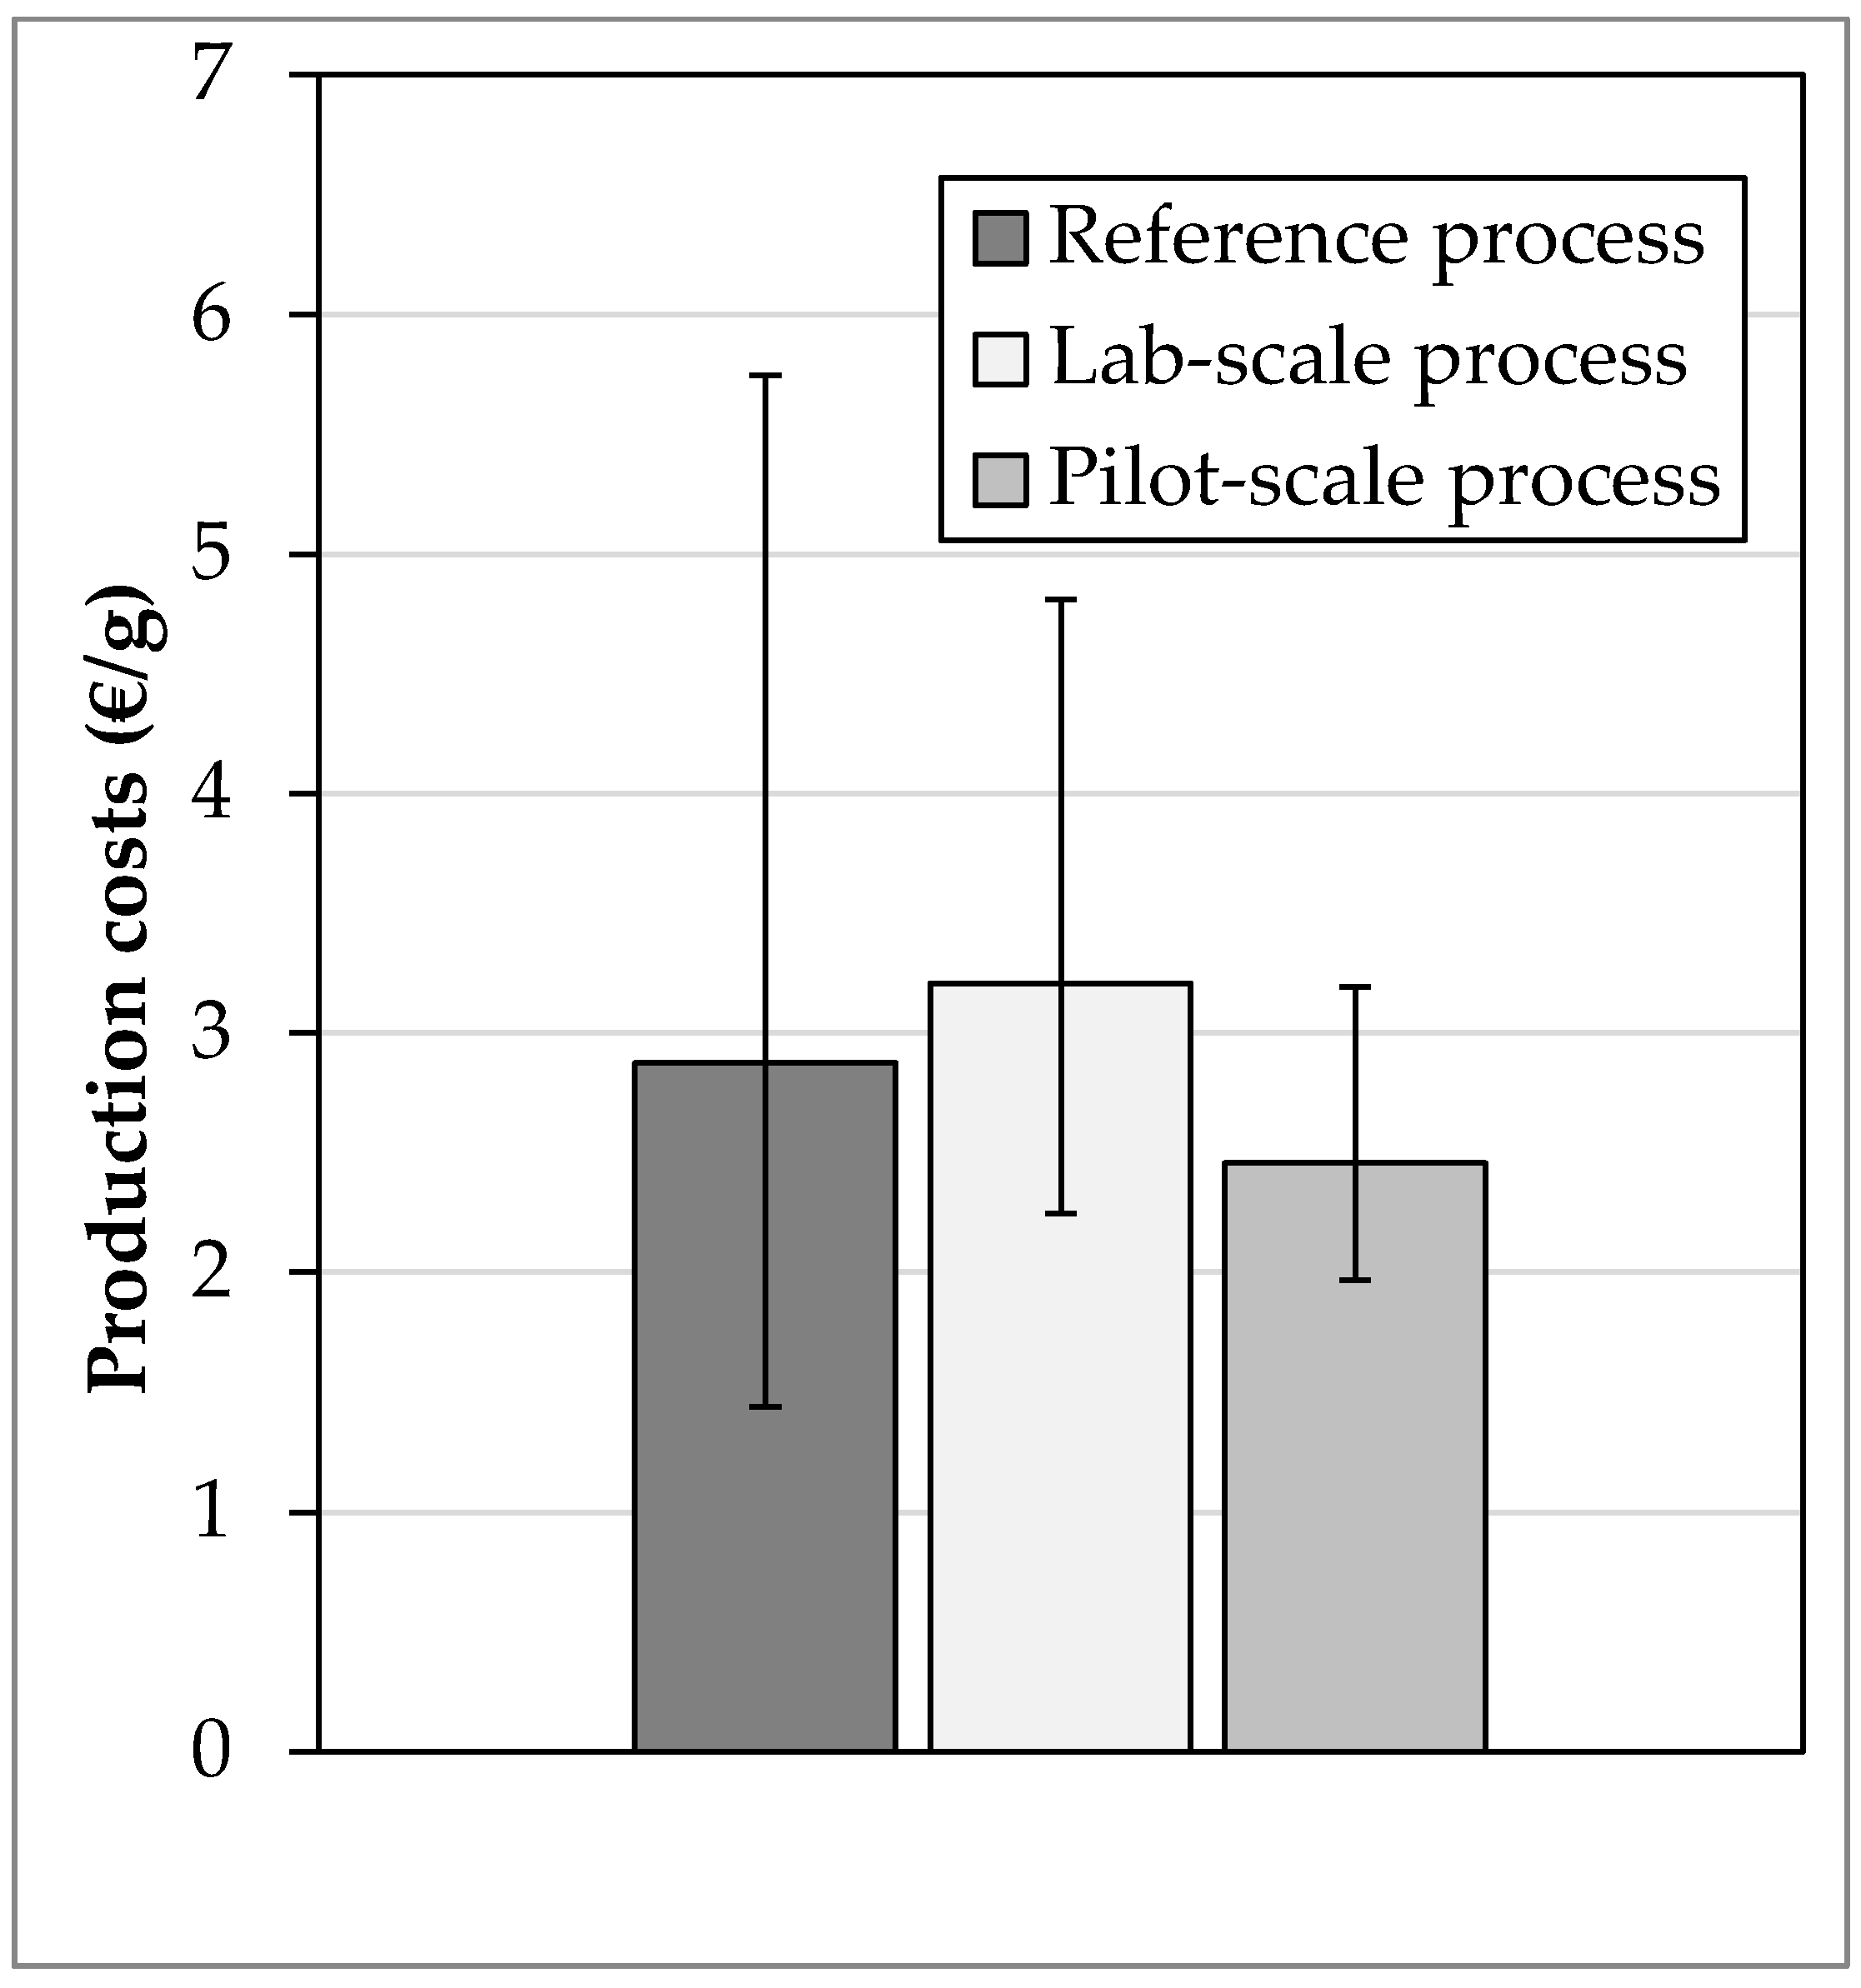
- Total operating costs (€7.2 million) are about 25% lower in the pilot process than in the laboratory process and 15% lower than in the reference process.
3.3. Comparison and Evaluation
- The investment costs in the reference process are 5.7 mil. €, in the laboratory process 4.6 mil. € and in the pilot process €7.4 million. The main reason for the cost increase is the higher level of detail, in particular the basic operations used for solvent recycling and the chromatography based on measured values.
- The operating costs amount to 8.4 mil. € in the reference process, to €9.4 million in the laboratory process and 7.2 Mil. € during the pilot process. The costs are, therefore, the lowest in the piloting stage, which is mainly due to closed solvent circuits.
4. Conclusions
Author Contributions
Funding
Acknowledgments
Conflicts of Interest
References
- Kaßing, M.; Jenelten, U.; Schenk, J.; Hänsch, R.; Strube, J. Combination of rigorous and statistical modeling for process development of plant-based extractions based on mass balances and biological aspects. Chem. Eng. Technol. 2012, 35, 109–132. [Google Scholar] [CrossRef]
- Ditz, R.; Gerard, D.; Hagels, H.; Igl, N.; Schäffler, M.; Schulz, H.; Stürtz, M.; Tegtmeier, M.; Treutwein, J.; Strube, J.; et al. Phytoextracts. Proposal towards a New Comprehensive Research Focus; DECHEMA Gesellschaft für Chemische Technik und Biotechnologie e.V.: Frankfurt, Germany, 2017. [Google Scholar]
- Both, S. Systematische Verfahrensentwicklung für Pflanzlich Basierte Produkte im Regulatorischen Umfeld; Shaker: Aachen, Germany, 2015. [Google Scholar]
- Koudous, I. Stoffdatenbasierte Verfahrensentwicklung zur Isolierung von Wertstoffen aus Pflanzenextrakten, 1. Auflage; Shaker: Herzogenrath, Germany, 2017. [Google Scholar]
- Koudous, I.; Both, S.; Gudi, G.; Schulz, H.; Strube, J. Process design based on physicochemical properties for the example of obtaining valuable products from plant-based extracts. Int. J. Plant Sci. 2014, 17, 218–231. [Google Scholar] [CrossRef]
- Sixt, M.; Koudous, I.; Strube, J. Process design for integration of extraction, purification and formulation with alternative solvent concepts. C. R. Chim. 2016, 19, 733–748. [Google Scholar] [CrossRef]
- Sixt, M.; Strube, J. Systematic and model-assisted evaluation of solvent based- or pressurized hot water extraction for the extraction of Artemisinin from Artemisia annua L. Processes 2017, 5, 86. [Google Scholar] [CrossRef]
- Christen, P.; Veuthey, J.-L. New trends in extraction, identification and quantification of Artemisinin and its derivatives. Curr. Med. Chem. 2001, 8, 1827–1839. [Google Scholar] [CrossRef] [PubMed]
- Krishna, S.; Bustamante, L.; Haynes, R.K.; Staines, H.M. Artemisinins: Their growing importance in medicine. Trends Pharmacol. Sci. 2008, 29, 520–527. [Google Scholar] [CrossRef] [PubMed]
- Tu, Y. From Artemisia annua L. to Artemisinins. The Discovery and Development of Artemisinins and Antimalarial Agents; Elsevier Science: San Diego, CA, USA, 2017. [Google Scholar]
- Liu, C.-Z.; Zhou, H.-Y.; Zhao, Y. An effective method for fast determination of artemisinin in Artemisia annua L. by high performance liquid chromatography with evaporative light scattering detection. Anal. Chim. Acta 2007, 581, 298–302. [Google Scholar] [CrossRef] [PubMed]
- Duke, M.V.; Paul, R.N.; Elsohly, H.N.; Sturtz, G.; Duke, S.O. Localization of Artemisinin and Artemisitene in foliar tissues of glanded and glandless biotypes of Artemisia annua L. Int. J. Plant Sci. 1994, 155, 365–372. [Google Scholar] [CrossRef]
- Nobel Foundation. The Nobel Prize in Physiology or Medicine 2015; Press Release: Stockholm, Sweden, 2015. [Google Scholar]
- Brown, G. Artemisinin and a new generation of antimalarial drugs. Educ. Chem. 2006, 43, 97–99. [Google Scholar]
- ElFeraly, F.S.; Elsohly, H.N. Method for the Isolation of Artemisinin from Artemisa annua. U.S. Patent 4,952,603, 28 August 1990. [Google Scholar]
- Kumar, S.; Gupta Kumar, S.; Singh, D. Process for Isolating Artemisinin from Artemisia annua. U.S. Patent 6,685,972, 3 March 2004. [Google Scholar]
- DocMorris. Euratesim 320 mg/40 mg Filmtabletten. Available online: https://www.docmorris.de/eurartesim-320-mg40-mg-filmtabletten/08404949?wt_mc=psm.psm_cpc.medizinfuchs.default.&erid=1507286926572768301 (accessed on 5 September 2018).
- Lapkin, A.A.; Peters, M.; Greiner, L.; Chemat, S.; Leonhard, K.; Liauw, M.A.; Leitner, W. Screening of new solvents for artemisininextraction process using ab initio methodology. Green Chem. 2010, 12, 241–251. [Google Scholar] [CrossRef]
- Silva, E.D.O.; Borges, L.L.; da Conceição, E.C.; Bara, M.T.F. Box–Behnken experimental design for extraction of artemisinin from Artemisia annua and validation of the assay method. Rev. Bras. Farmacogn. 2017, 27, 519–524. [Google Scholar] [CrossRef]
- Lévesque, F.; Seeberger, P.H. Continuous-flow synthesis of the anti-malaria drug artemisinin. Angew. Chem. Int. Ed. Engl. 2012, 51, 1706–1709. [Google Scholar] [CrossRef] [PubMed]
- Triemer, S.; Gilmore, K.; Vu, G.T.; Seeberger, P.H.; Seidel-Morgenstern, A. Literally green chemical synthesis of Artemisinin from PLant extracts. Angew. Chem. Int. Ed. Engl. 2018, 57, 5525–5528. [Google Scholar] [CrossRef] [PubMed]
- Jolliffe, H.G.; Gerogiorgis, D.I. Plantwide design and economic evaluation of two Continuous Pharmaceutical Manufacturing (CPM) cases: Ibuprofen and artemisinin. Comput. Chem. Eng. 2016, 91, 269–288. [Google Scholar] [CrossRef]
- Suberu, J.O.; Yamin, P.; Leonhard, K.; Song, L.; Chemat, S.; Sullivan, N.; Barker, G.; Lapkin, A.A. The effect of O-methylated flavonoids and other co-metabolites on the crystallization and purification of artemisinin. J. Biotechnol. 2014, 171, 25–33. [Google Scholar] [CrossRef] [PubMed]
- Pilloy, J. Artemisinin market quantities and pricing. In Proceedings of the Artemisinin Conference 2010, Antananarivo, Madagascar, 12–14 October 2010. [Google Scholar]
- Christensen, P.; Dysert, L.R. Cost Estimate Classification System: As Applied in Engineering, Procurement, and Construction for the Process Industries; AACE: Morgantown, WV, USA, 2016. [Google Scholar]
- Peters, M.S.; Timmerhaus, K.D.; West, R.E. Plant Design and Economics for Chemical Engineers, 5th ed.; McGraw-Hill: New York, NY, USA, 2003. [Google Scholar]
- TheGlobalFund. Global Artemisinin Manufacturers Consultation. In Proceedings of the Chengdu Meeting, Chengdu, China, 5–7 September 2016. [Google Scholar]


| Primary Characteristic | Secondary Characteristic | |||
|---|---|---|---|---|
| Estimate Class | Maturity Level of Project Definition Deliverables | End Usage | Methodology | Expected Accuracy Range |
| Expressed as % of Complete Definition | Typical Purpose of Estimate | Typical Estimating Method | Typical Variation in Low and High Ranges | |
| Class 5 | 0% to 2% | Concept screening | Capacity factored, parametric models, judgement, or analogy | L: −20% to −50% H: +30% to +100% |
| Class 4 | 1% to 15% | Study or feasibility | Equipment factored or parametric models | L: −15% to −30% H: +20% to +50% |
| Class 3 | 10% to 40% | Budget authorization or control | Semi-detailed unit costs with assembly level line items | L: −10% to −20% H: +10% to +30% |
| Class 2 | 30% to 75% | Control or bid/tender | Detailed unit cost with forced detailed take-off | L: −5% to −15% H: +5% to +20% |
| Class 1 | 65% to 100% | Check estimate or bid/tender | Detailed unit cost with detailed take-off | L: −3% to −10% H: +3% to +15% |
© 2018 by the authors. Licensee MDPI, Basel, Switzerland. This article is an open access article distributed under the terms and conditions of the Creative Commons Attribution (CC BY) license (http://creativecommons.org/licenses/by/4.0/).
Share and Cite
Sixt, M.; Schmidt, A.; Mestmäcker, F.; Huter, M.J.; Uhlenbrock, L.; Strube, J. Systematic and Model-Assisted Process Design for the Extraction and Purification of Artemisinin from Artemisia annua L.—Part I: Conceptual Process Design and Cost Estimation. Processes 2018, 6, 161. https://doi.org/10.3390/pr6090161
Sixt M, Schmidt A, Mestmäcker F, Huter MJ, Uhlenbrock L, Strube J. Systematic and Model-Assisted Process Design for the Extraction and Purification of Artemisinin from Artemisia annua L.—Part I: Conceptual Process Design and Cost Estimation. Processes. 2018; 6(9):161. https://doi.org/10.3390/pr6090161
Chicago/Turabian StyleSixt, Maximilian, Axel Schmidt, Fabian Mestmäcker, Maximilian Johannes Huter, Lukas Uhlenbrock, and Jochen Strube. 2018. "Systematic and Model-Assisted Process Design for the Extraction and Purification of Artemisinin from Artemisia annua L.—Part I: Conceptual Process Design and Cost Estimation" Processes 6, no. 9: 161. https://doi.org/10.3390/pr6090161