Numerical Simulation on the Dynamic Characteristics of a Tremendous Debris Flow in Sichuan, China


1
State Key Laboratory of Hydroscience and Engineering, Tsinghua University, Beijing 100084, China
2
Key Laboratory for Hydraulic and Waterway Engineering of Ministry of Education, Chongqing Jiaotong University, Chongqing 400074, China
3
Key Laboratory of Karst Environment and Geohazard, Ministry of Land and Resources, Guizhou University, Guiyang 550000, China
4
Institute of Mountain Hazards and Environment, Chinese Academy of Science, Chengdu 610041, China
*
Authors to whom correspondence should be addressed.
Processes 2018, 6(8), 109; https://doi.org/10.3390/pr6080109
Submission received: 26 June 2018
/
Revised: 23 July 2018
/
Accepted: 24 July 2018
/
Published: 1 August 2018
(This article belongs to the Special Issue Fluid Flow in Fractured Porous Media)
Abstract
:The mega debris flow that occurred on 13 August 2010 in Zoumaling Valley in Mianzhu County, China has done great damage to the local inhabitants, as well as to the re-construction projects in the quake-hit areas. Moreover, it is of high possibility that a secondary disaster would reappear and result in worse consequences. In order to maximize risk reduction of this problem, the local government planned to construct seven debris-resisting barriers across each ditch for mitigation of debris flow hazards in the future. In this paper, the numerical simulation fields of flow velocity, pressure, and mud depth of the Zoumaling debris flow had been computed by using finite volume method software based on computational fluid dynamics (CFD). The Bingham fluid was chosen as the constitutive model of this debris flow. The debris flow geometry model was a 3D model. The initial conditions, boundary conditions, control equations, and parameters were determined and adjusted by the actual conditions and analyses. The flow field data obtained from numerical simulations were substituted into the finite element software ANSYS. Then the calculations of fluid-solid coupling action between the flow and dam had been done. All these results of simulations and analyses could be the guide and suggestion for the design and construction of prevention engineering of Zoumaling debris flow.
1. Introduction
Debris flows are a highly unpredictable hazard in areas of mountainous terrain and high runoff. The local geological configurations caused by orogenesis result in a large proportion of steep topography and mountainous areas where earthquakes occur frequently [1]. Meanwhile, torrential rains during the monsoon season are major factors that enhance the occurrence of debris flows, soil erosion, and landslides.
Computational fluid dynamics (CFD) numerical methods have been successfully used to analyze multiphase and multicomponent flows and to investigate fluid–structure interaction in various settings. From the standpoint of dynamic mechanics, Elverhøi et al. [2] performed a numerical model of submarine debris flows with Computational Fluid Dynamics X (CFX). Zakeri et al. [3] applied CFX to simulate the submarine debris flow impact on pipelines. Liu and Tian [4] employed CFX to analyze the impact forces of submarine landslides on free-span pipelines. In recent years, ANSYS CFX has become the most commonly adopted debris flow simulation model.
On 13 August 2010, high intensity heavy rain triggered a debris flow within the watershed, which was classified as a group-occurring debris flow, resulting in worse damages to human life and property than in previous decades [5]. Following this accident, the local government planned to construct seven debris-resisting barriers across each ditch for mitigation of debris flow hazards in the future, for which numerical analysis is an effective method to evaluate the performance of the barriers.
In this study, numerical simulation on the dynamic characteristics of the debris flow was conducted to evaluate the fields of flow velocity, pressure, and mud depth of the debris flow by using CFD software, ANSYS CFX 13.0 (ANSYS, Pittsburgh, PA, USA), which is based on the finite volume method. The Bingham fluid model was chosen as the constitutive model of this debris flow. The debris flow geometry was modeled in 3D. The initial conditions, boundary conditions, controlling equations, and parameters were determined and adjusted by the actual conditions and analyses. The flow field data obtained from numerical simulation were imported into the finite element software ANSYS. Then the calculations of coupled fluid-solid action between the flow and barriers was performed. The results of these simulations and analyses could be used as guidance and suggestions for the design and construction of prevention engineering of the debris flow.
2. Summary of the Study Area and Its Debris Flow Disaster
2.1. Study Area
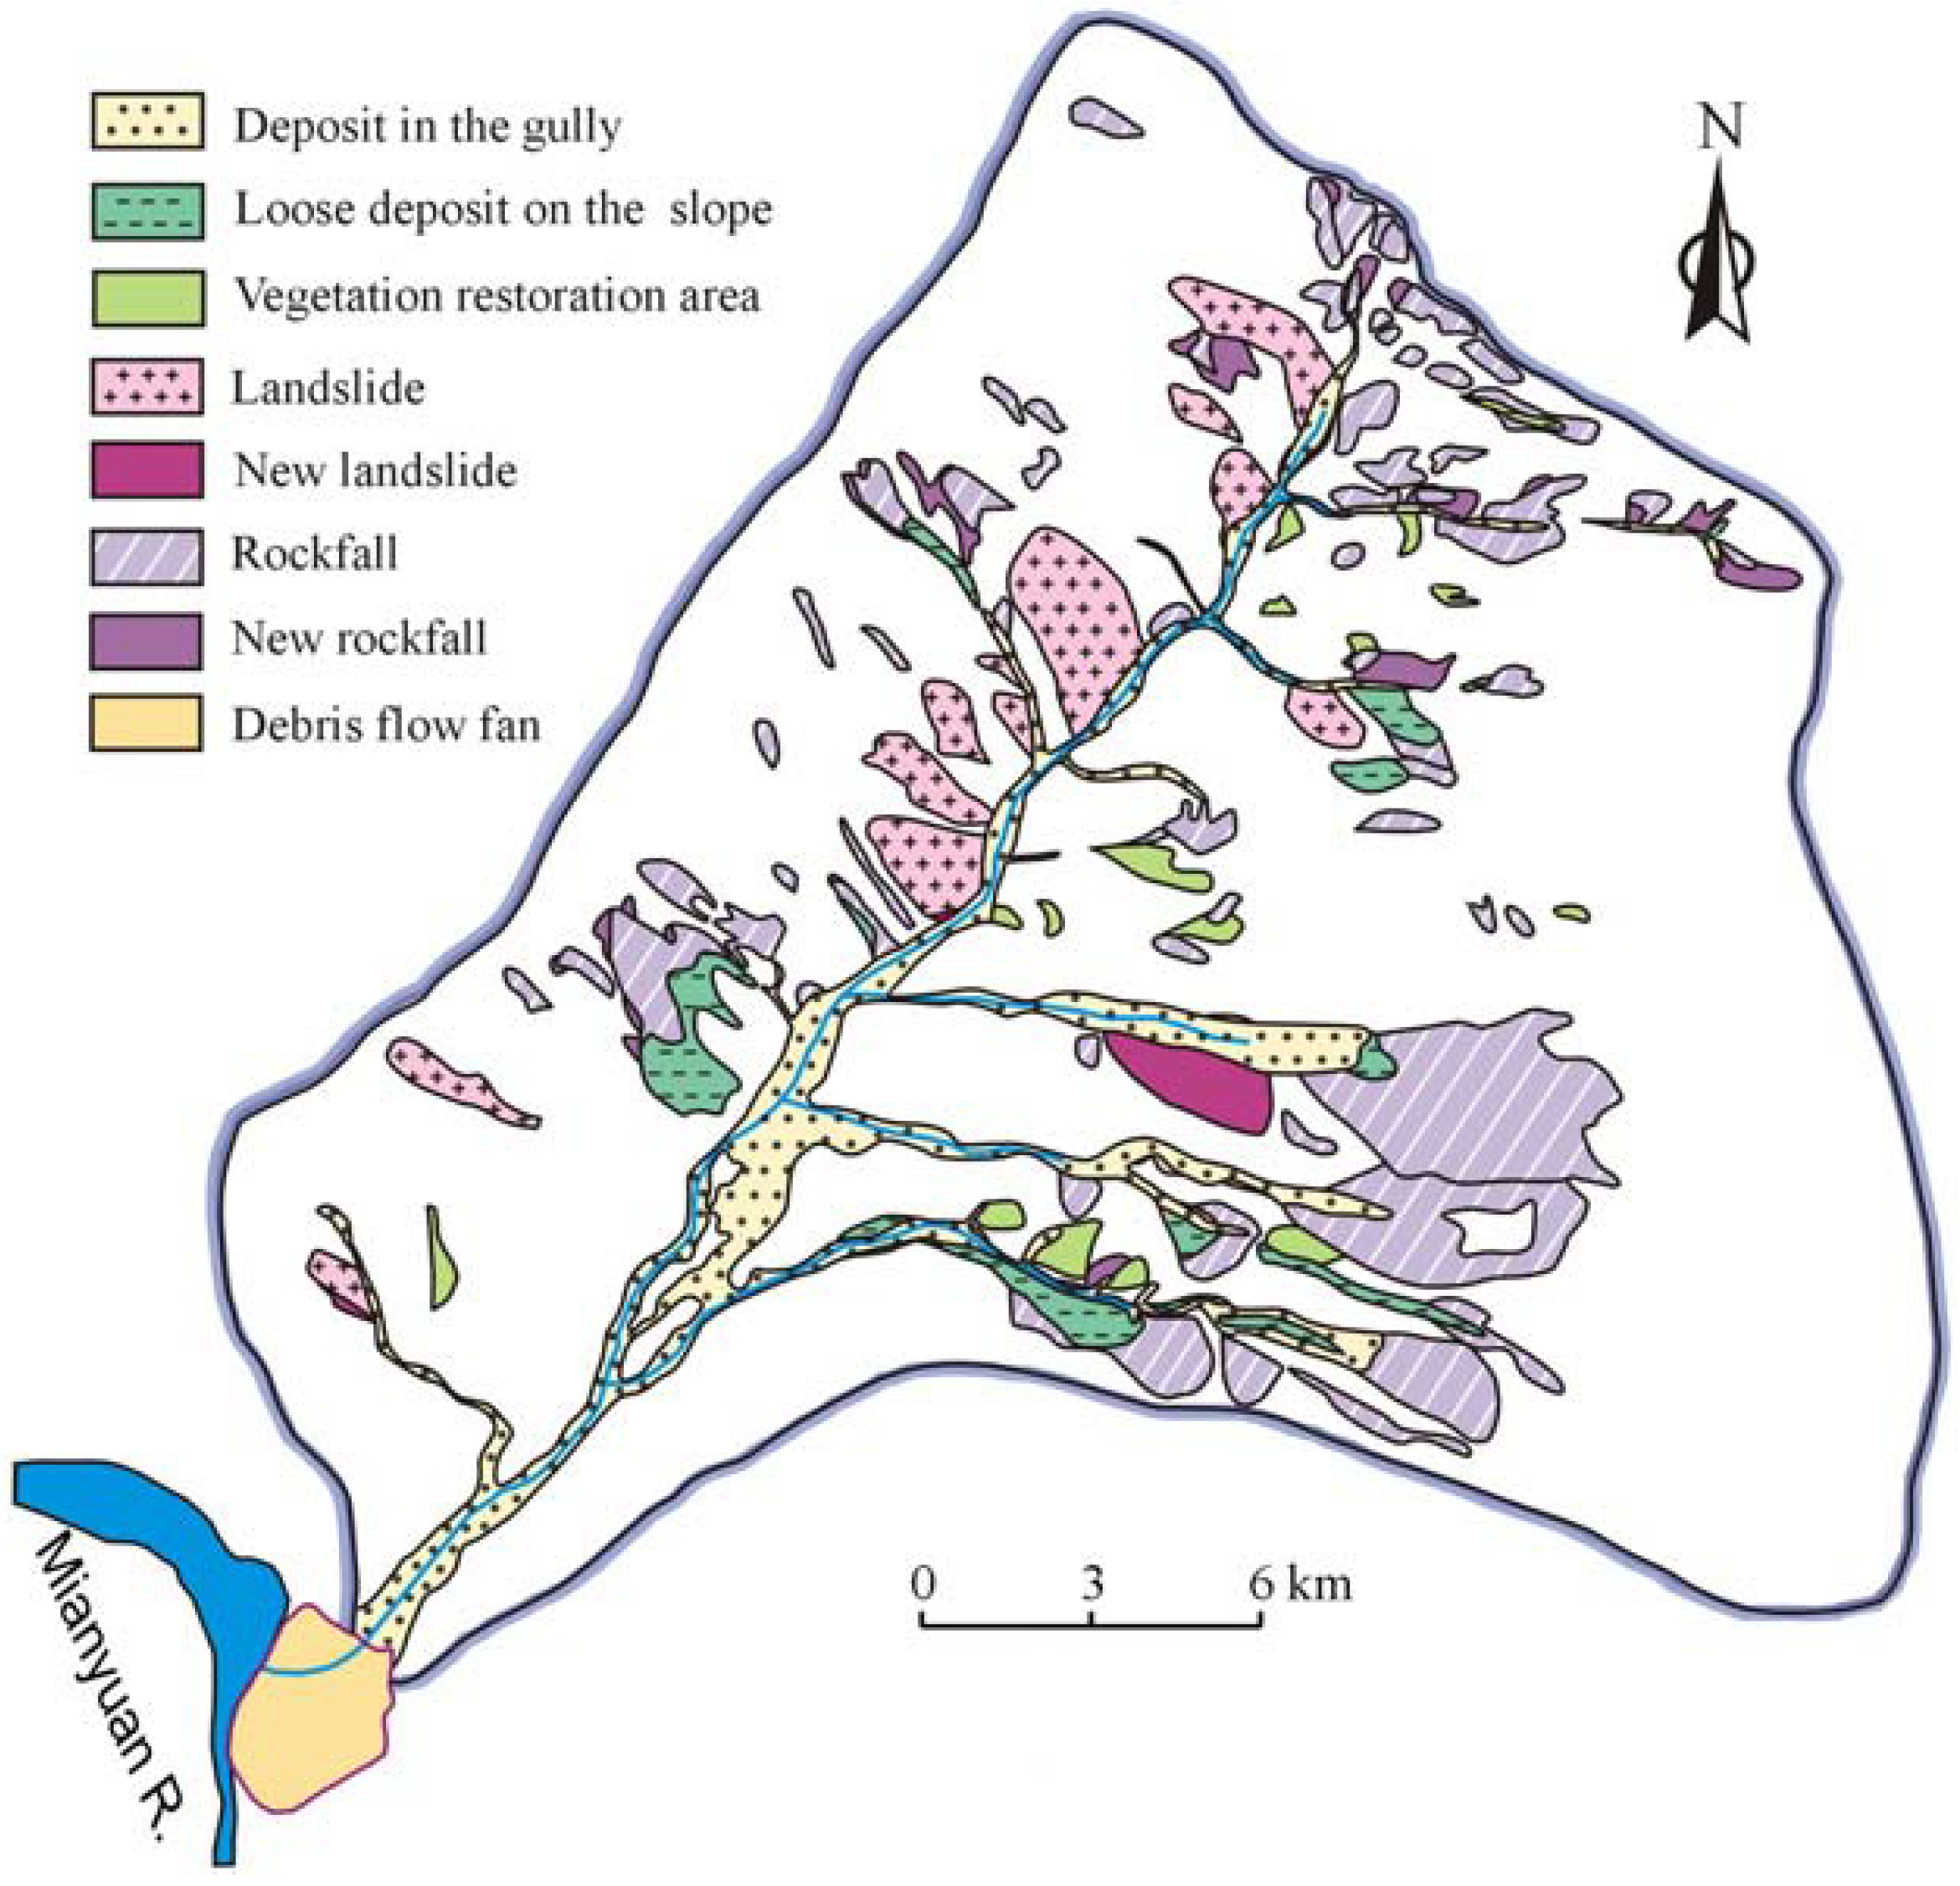
The Mianyuan River, a branch of the Tuojiang River, is in Mianzhu County of Sichuan province (Figure 1). It is about 80 km northeast of the earthquake epicenter, with a basin area of approximately 400 km2. The Yingxiu–Beichuan seismogenic fault of the Wenchuan earthquake goes through the middle part of the river basin. Outcrops within the river basin are locally covered by loose Quaternary materials (Figure 2).
2.2. Debris Flow Events in the Mianyuan River Basin
The co-seismic landslides triggered by the Wenchuan earthquake produced at least 4.0 × 10⁸ m3 of loose material in the Mianyuan River Basin. Loose materials are widespread on the hilly terrains and in gullies. Figure 3 shows the characteristics of long-term activity in the local watershed. Since numerous rainfall events, long cracks developed along the back edge of each gully resulting in an increasing source of potential landslide. These materials, as well as cracked slopes, are marginally stable under normal conditions, and can lose stability due to rainfall infiltration and become sources of deadly debris flows. The antecedent rainfall and rainfall intensity on 13 August 2010 were 82.6 mm/d and 37.4 mm/h, respectively.
A storm swept over the Mianyuan River Basin from 12 to 13 August 2010. The accumulative rainfall was about 200 mm and the duration was 10 h [7]. According to witnesses, seven debris flows occurred in Qingping Town at 23:45 on 12 August. Shortly afterward, another outbreak of debris flows occurred in other areas surrounding the town of Qingping. A depositional fan was formed and the Mianyuan River was blocked in a matter of seconds (Figure 4).
A field survey showed that the debris generated by this event buried the whole town, with a covering area of 1.4 × 10⁶ m2 (length of 4.3 km, width of 400–500 m) and an average thickness of 5 m (Figure 4b). In the event 379 houses were destroyed, which account for 20.9% of the total number of houses in Qingping Town. Furthermore, seven people were killed, seven were missing, and 33 were injured. The field investigation survey and remote sensing interpretation indicate that during the 12–13 August rainstorm, the total volume of deposited materials was 5.65 × 10⁶ m3.
According to the field survey, the Wenchuan earthquake has produced as much as 4.0 × 10⁸ m3 of loose material in this area. However, the Zoumaling debris flow has only transported about 5.65 × 10⁶ m3, which means the most remained resting on the hill slope nearby. If another flash flood breaks out, more debris flows would be more likely to take place. Hence, it is of great importance to understand the dynamic processes of the Zoumaling debris flow and examine the risk mitigation by the debris-resisting barriers.
The field investigation survey indicates that the slope is steep in the upstream gullies and flat in the downstream gullies, as well as alternating steep with flat in some local places. The width is narrow in the upstream gullies and broad in the downstream gullies, as well as alternating narrow with wide in some local places. The above geological condition is favorable for the construction of barriers. Due to the relatively short length of barriers and the relatively flat gully and broad valley upstream, the barriers have a relatively large reservoir capacity, playing a strong role in adjusting the peak flow rate of debris flow.
Due to the large amount of loose mass in the back edge of gully DF05-DF07 (see Figure 3), which may contribute to potential debris flow, multiple barriers were planned to be constructed in the three gullies to counteract erosion by reducing debris flow velocity, as well as to reinforce the foundations. Additionally, drain ditches were employed in the accumulation area to guide flows along designed paths from damaging residential houses and residents near the gully, for which the embankment wall is planned to be constructed uptown. A barrier should be constructed on a loose foundation within the watershed to prevent erosion from debris flow and to reduce the source contributing to debris flow. Barriers are installed upstream of the main gully to reinforce foundations and obstruct debris flows. Seven barriers will be constructed at a height of 8–12 m, with an upstream batter of 1:0.70, and a downstream batter of 1:20. The length of the axis of the barrier crest is 50–71 m. Barriers reserve coarse materials and fine materials pass, and they slow the velocity of debris flow. Thereby, sources reaching downstream are reduced, as is the unit weight, resulting in a smaller peak discharge. As a result, scour resistance walls and protection embankments are subjected to less pressure.
3. Modeling of Debris Flow
ANSYS CFX is a general purpose CFD program that includes a solver based on the finite volume (FV) method for unstructured grids, as well as pre- and post-processing tools for simulation definition and data extraction, respectively. The FV method uses the integral form of the conservation equations. With tetrahedra or hexahedra control volumes (CVs), unstructured grids are best adapted to the FV approach for complex 3D geometries [8]. In general, there are two types of multiphase flows: disperse flows and separated flows. The disperse flows consist of finite particles, such as drops or bubbles (the dispersed phase), distributed in a connected volume of another continuous phase (fluid), whereas the separated flows comprise two or more continuous streams of different fluids separated by interfaces [9].
3.1. Assumption
On the basis of CFX, the following assumptions are made for the numerical simulation of the debris flow: (1) debris flow fluid is a homogeneous single phase flow; (2) the gully and mountain models are stiff so that no deformation occurs during debris flow. Hence, erosion was not considered.
3.2. Construction of Model and Mesh
The 3D geological model gully for debris flow is regarded too complex to be directly modeled by ANSYS. The modeling process is combined with AutoCAD, Surfer, and Design Modeler, etc., following the rules of point to line, line to area, area to cubic, and bottom to top.
The first step was to create the contour line of the watershed where the Zoumaling gully debris flow occurred based on the topographically surveyed data. A plug-in was applied to input elevation points read from contour lines into Surfer. Then the plane range and division space of the model were selected in Surfer and a grid-formatted file was generated to create the terrain model by ANSYS. Finally, a terrain model was imported into Workbench to stretch the terrain to create an entity model of the watershed. The model was meshed with tetrahedrons for the terrain and hexahedrons for the fluid domain and barriers by CFD in Workbench. The number of nodes, cells, and areas are 180,203, 935,994, and 92,224, respectively, as shown in Figure 5. The safety factor of the barriers was calculated according to the Mohr-Coulomb strength criterion.
3.3. Preprocess
Dynamic parameters of debris flow associated with unit weight and flow rate at each gully should be determined in advance.
The unit weight of debris flow was found to be 18.00 KN/m3 by field investigation of the slurry. The elastic modulus and Poisson’s ratio are 3.15 × 10⁷ kPa and 0.2, respectively. The coefficient of friction between the barriers and the debris flow is 0.35.
Referring to a 50-year flood discharge, the inlet flow discharges were 74.6 m3/s for the main gully (DF01), 725.8 m3/s for the DF02 ditch, 40.9 m3/s for the DF03 ditch, 56.7 m3/s for the DF04 ditch, 124.1 m3/s for the DF05 ditch, 64.4 m3/s for the DF06 ditch, and 57.0 m3/s for the DF07 ditch, respectively.
The rheology of the debris flow follows the Bingham model:
where τ is the shear stress, τy is the yield stress, μ is the Bingham viscosity, and du/dy is the shear strain rate. For a Bingham fluid, viscosity that affects the maximum flow velocity was defined by the CFX Expression language. τy can be expressed as:
where SV is the volume concentration, SVm is the limit volume concentration, λ is the linear concentration, B is a constant. In this study, SV, SVm, λ and B are 0.65, 0.56, 8.45, and 1.8.
Moreover, turbulence generated in the water was simulated using the k–ε model. Inherent is the dependency of the undrained shear strength on the shear strain rate.
4. Modeling Results
4.1. Debris Flow Simulation
The three-dimensional debris flow numerical model and computation conditions described previously were implemented to perform a debris flow simulation. Without considering barriers, the debris flow state, pressure nephogram of the riverbed, velocity vector, and shear stress on the riverbed wall are shown in Figure 6, Figure 7, Figure 8, Figure 9, respectively. The debris flow field data at the main gully in Zoumaling is shown in Table 1.
This shows that the maximum pressure on riverbed was 149 kPa, occurring at the junction of gully DF02 and the main gully; maximum shear stress on the riverbed wall and velocity were 8.32 kPa and 13.57 m/s, respectively, occurring at gully DF05. This indicated that in gullies DF02 and DF05, the impact and erosion forces were so strong that the debris flow could greatly influence the stability of the gully bed and bank slope.
The debris flow velocity increased from upstream to downstream. A steeper or narrower riverbed resulted in a larger velocity of debris flow. The deposition thickness decreased with increasing debris flow velocity. A steep or wider riverbed resulted in a smaller deposition thickness of the debris flow.
4.2. Fluid-Solid Coupling Simulation of Debris Flow and Barriers
Debris flow field data at the main gully of Zoumaling was imported to ANSYS for fluid-solid coupling computation to yield flow pressure and characteristics on the barriers proposed to be constructed. Then we can obtain the stress and strain of the barrier in response to the debris flow. The debris-barrier interaction results are listed in Table 2. It can be seen that the stress and strain responses are similar for each barrier.
The deposition thickness of the debris flow in front of the barrier is shown in Figure 10. The deposition thickness increased with the debris-barrier interaction. When the debris flow reached the barrier, it was impeded by the obstruction of the barrier. Debris at the frontal portion ran up against the barrier. A deposition was formed by the debris that was stopped and trapped behind the barrier. The extent of the deposition developed when further debris was stopped behind the barrier. The debris flow subsequently rode on the plug and overtopped the barrier. Debris overflowing from the barrier launched into a ballistic flight, and resumed its travel on the runout trail after landing.
Figure 11 shows the variation of safety factor of barrier with deposition thickness at the front of the barrier. The safety factor of a barrier decreased with the deposition thickness at the front of the barrier. When the deposition overtopped the barrier, the safety factor reached its lowest point.
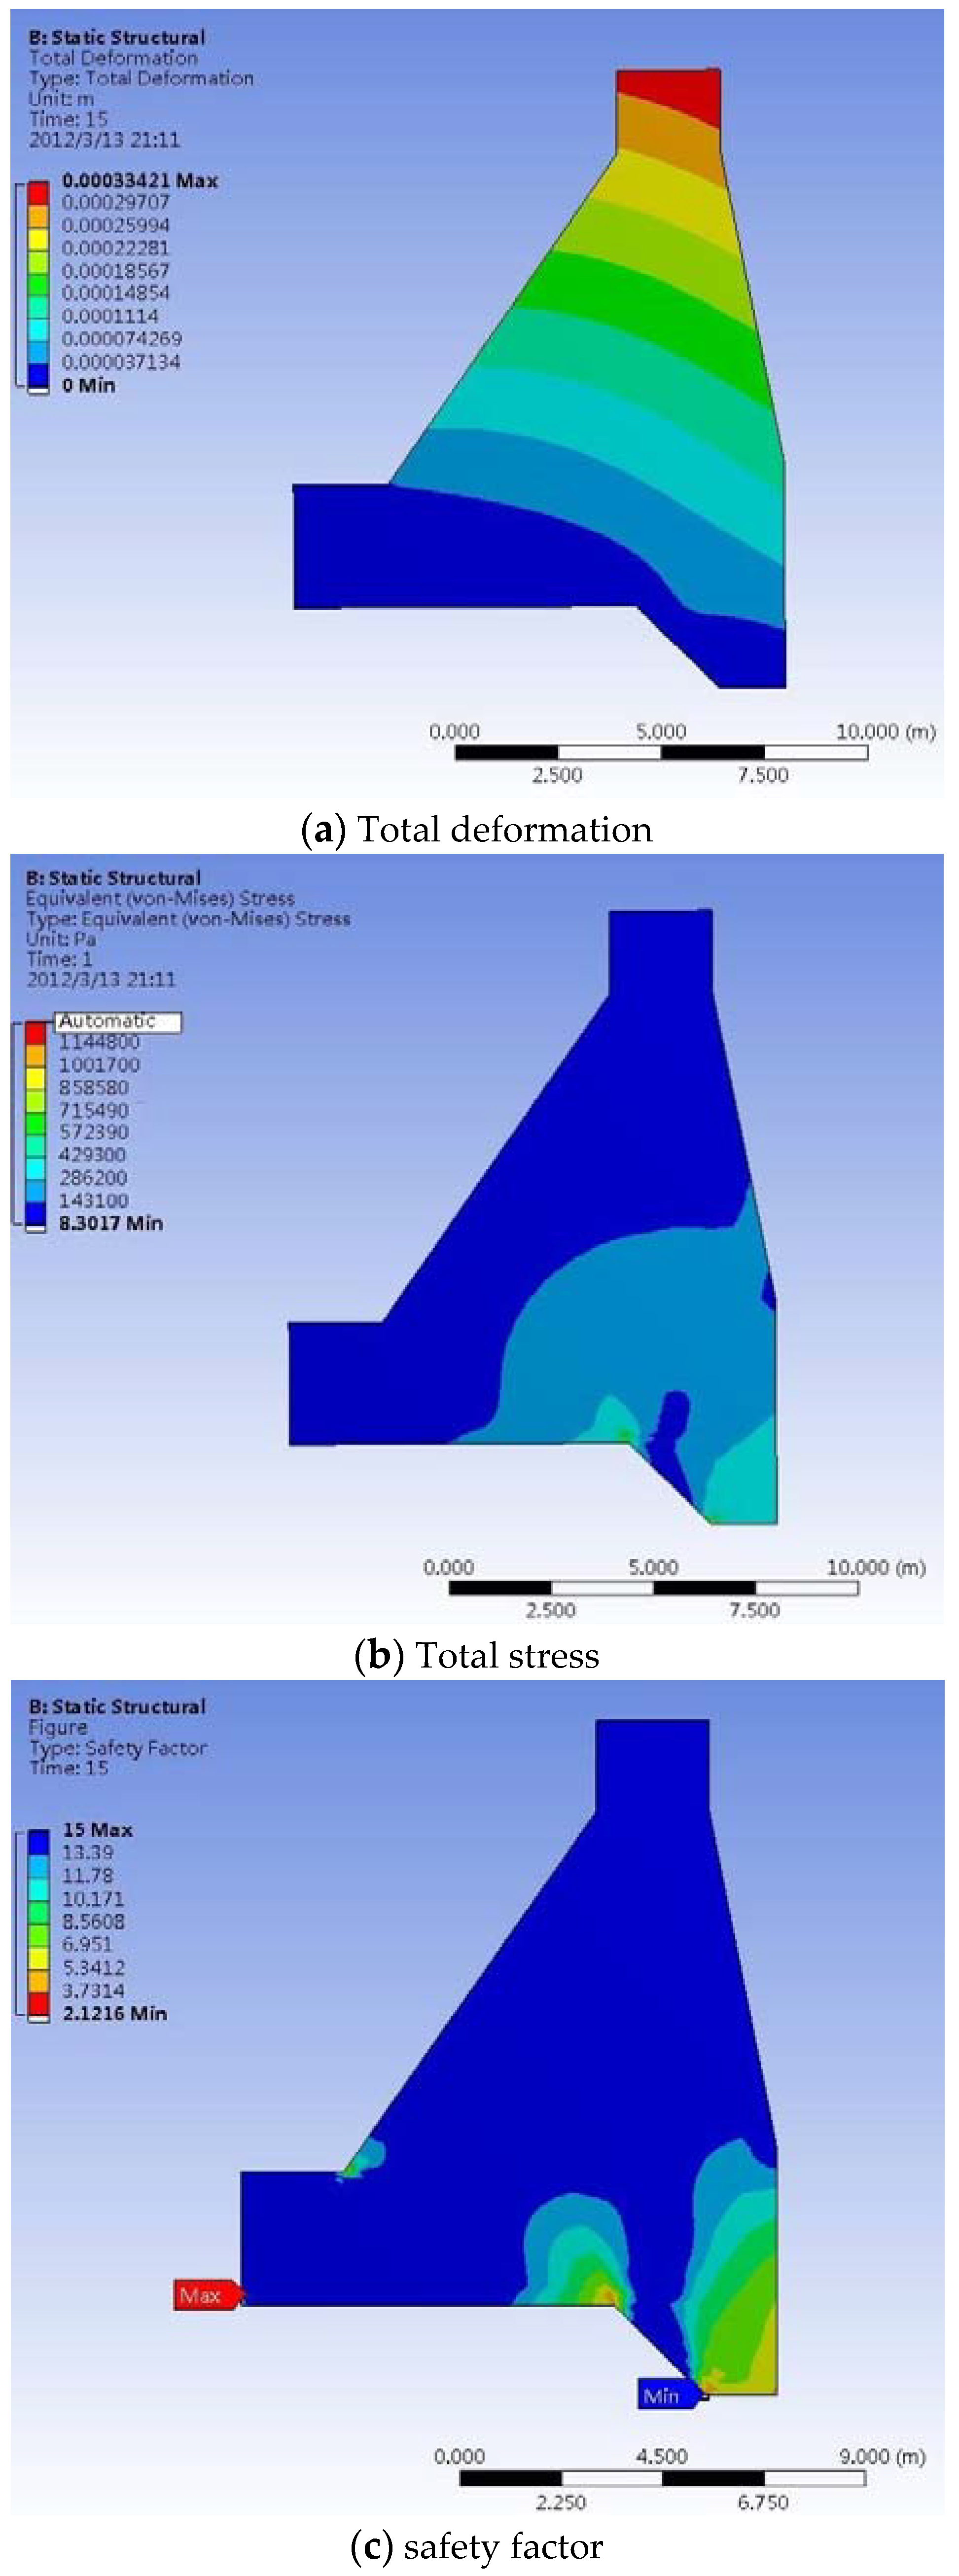
The total pressure of debris flow on the barrier along the height is shown in Figure 12. It shows a similar distribution of total pressure of the debris flow on each barrier. Herein, we just present the results on Barrier 01. The total pressure distribution in front of Barrier 01 is shown in Figure 13. Accordingly, the total deformation, total stress, and safety factor of Barrier 01 are shown in Figure 14.
The maximum force on the barrier was 3360 kN in horizontal direction and 9220 kN in vertical direction. The friction force by the weight of the barrier itself and the vertical force on the it was 3220 kN, which was less than the maximum horizontal force. It meant that the barrier was prone to fail unless the soils along the flow path were protected from erosion. The lower deposition thickness led to a higher safety factor for the barriers.
5. Conclusions
On 13 August 2010, a debris flow occurred in the Zoumaling of Mianzhu County in the southwest part of China due to heavy rainfall. Meanwhile, it formed nearly 5.65 × 10⁶ m3 of deposits before being transformed into a debris flow. Based on numerical simulations of the formation process of the debris flow, the peak velocity of the debris flow, the maximum pressure and maximum shear stress on the riverbed wall were approximately 13.57 m/s, 149 kPa, and 8.32 kPa, respectively. Deposition thickness increased with the debris-barrier interaction. The safety factor of a barrier decreased with the deposition thickness at the front of the barrier. When the deposition overtopped the barrier, the safety factor reached its lowest point. The barrier was prone to fail unless the soils along the flow path were protected from erosion. The lower deposition thickness led to a higher safety factor for the barriers.
Based on the numerical analysis of this debris flow, it is suggested that the soils on the surface of gullies should be protected from erosion and soils on the riverbed should be removed so that the deposition is reduced.
Author Contributions
Y.C. performed the numerical simulations. Z.Q., B.L., and Z.Y. participated in the data treatment and the writing.
Funding
This work is supported by the China Postdoctoral Science Foundation under grant nos. 2017M620048 and 2018T110103.
Acknowledgments
The authors are grateful to Editors and the anonymous reviewers for their extensive and profound comments and suggestions, which substantially improved the quality of paper.
Conflicts of Interest
The authors declare no conflicts of interest.
References
- Yang, Z.; Qiao, J.; Uchimura, T.; Wang, L.; Lei, X.; Huang, D. Unsaturated hydro-mechanical behaviour of rainfall-induced mass remobilization in post-earthquake landslides. Eng. Geol. 2017, 222, 102–110. [Google Scholar] [CrossRef]
- Elverhøi, A.; Issler, D.; de Blasio, F.V.; IIstad, T. Emerging insights into the dynamics of submarine debris flows. Nat. Hazards Earth Syst. Sci. 2005, 5, 633–648. [Google Scholar] [CrossRef] [Green Version]
- Zakeri, A.; Høeg, K.; Nadim, F. Submarine debris flow impact on pipelines—Part II: Numerical analysis. Coast. Eng. 2009, 56, 1–10. [Google Scholar] [CrossRef]
- Liu, J.; Tian, J. Impact forces of submarine landslides on free-span pipelines. In Proceedings of the 33rd International Conference on Ocean, Offshore and Arctic Engineering (OMAE 2014), San Francisco, CA, USA, 8–13 June 2014; p. V06BT04A037. [Google Scholar]
- Huang, R.; Li, W. Post-earthquake landsliding and long-term impacts in the Wenchuan earthquake area, China. Eng. Geol. 2014, 182, 111–120. [Google Scholar] [CrossRef]
- Zhang, Y.; Cheng, Y.; Yin, Y.; Lan, H.; Wang, J.; Fu, X. High-position debris flow: A long-term active geohazard after the Wenchuan earthquake. Eng. Geol. 2014, 180, 45–54. [Google Scholar] [CrossRef]
- Xu, Q.; Zhang, S.; Li, W. The 13 August 2010 catastrophic debris flows after the 2008 Wenchuan earthquake, China. Nat. Hazards Earth Syst. Sci. 2012, 12, 201–216. [Google Scholar] [CrossRef] [Green Version]
- Ferziger, J.H.; Perić, M. Computational Methods for Fluid Dynamics, 3rd ed.; Springer International Publishing: Berlin, Germany, 2002. [Google Scholar]
- Brennen, C.E. Fundamentals of Multiphase Flow; Cambridge University Press: Cambridge, UK, 2005. [Google Scholar]
Figure 1.
Location of the study area—the Mianyuan River basin. MWF: Miaoxian–Wenchuan Fault, YBF: Yingxiu–Beichuan Fault, JGF: Jiangyou–Guanxian Fault, QPF: Qingchuan–Pingwu Fault [5].
Figure 1.
Location of the study area—the Mianyuan River basin. MWF: Miaoxian–Wenchuan Fault, YBF: Yingxiu–Beichuan Fault, JGF: Jiangyou–Guanxian Fault, QPF: Qingchuan–Pingwu Fault [5].
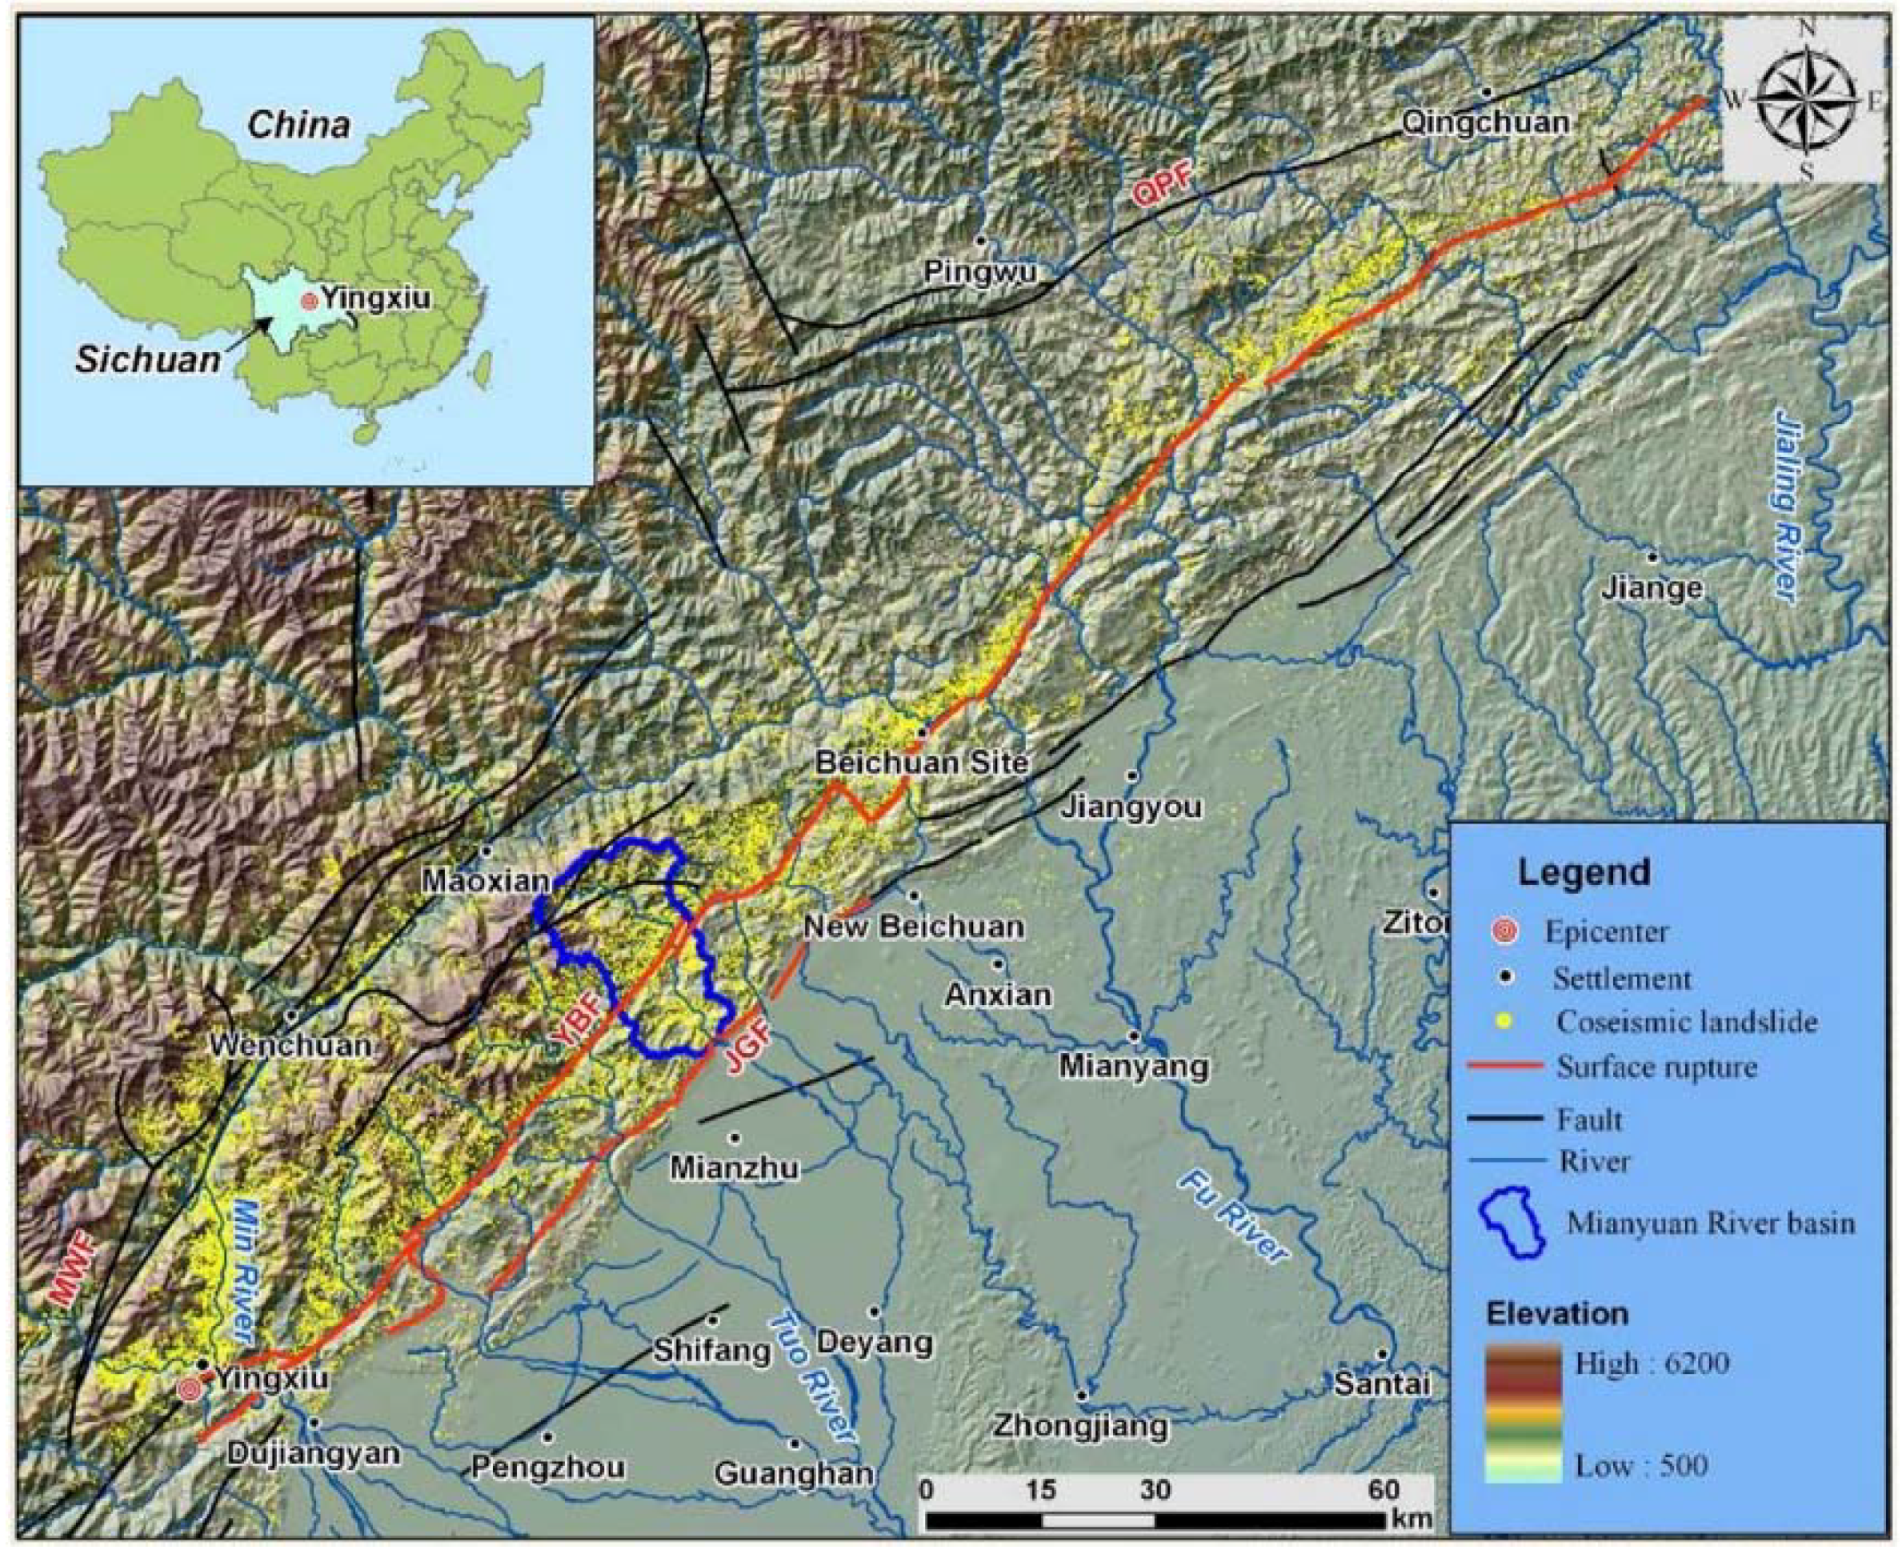
Figure 2.
Geological setting of the Mianyuan River Basin [5].
Figure 2.
Geological setting of the Mianyuan River Basin [5].
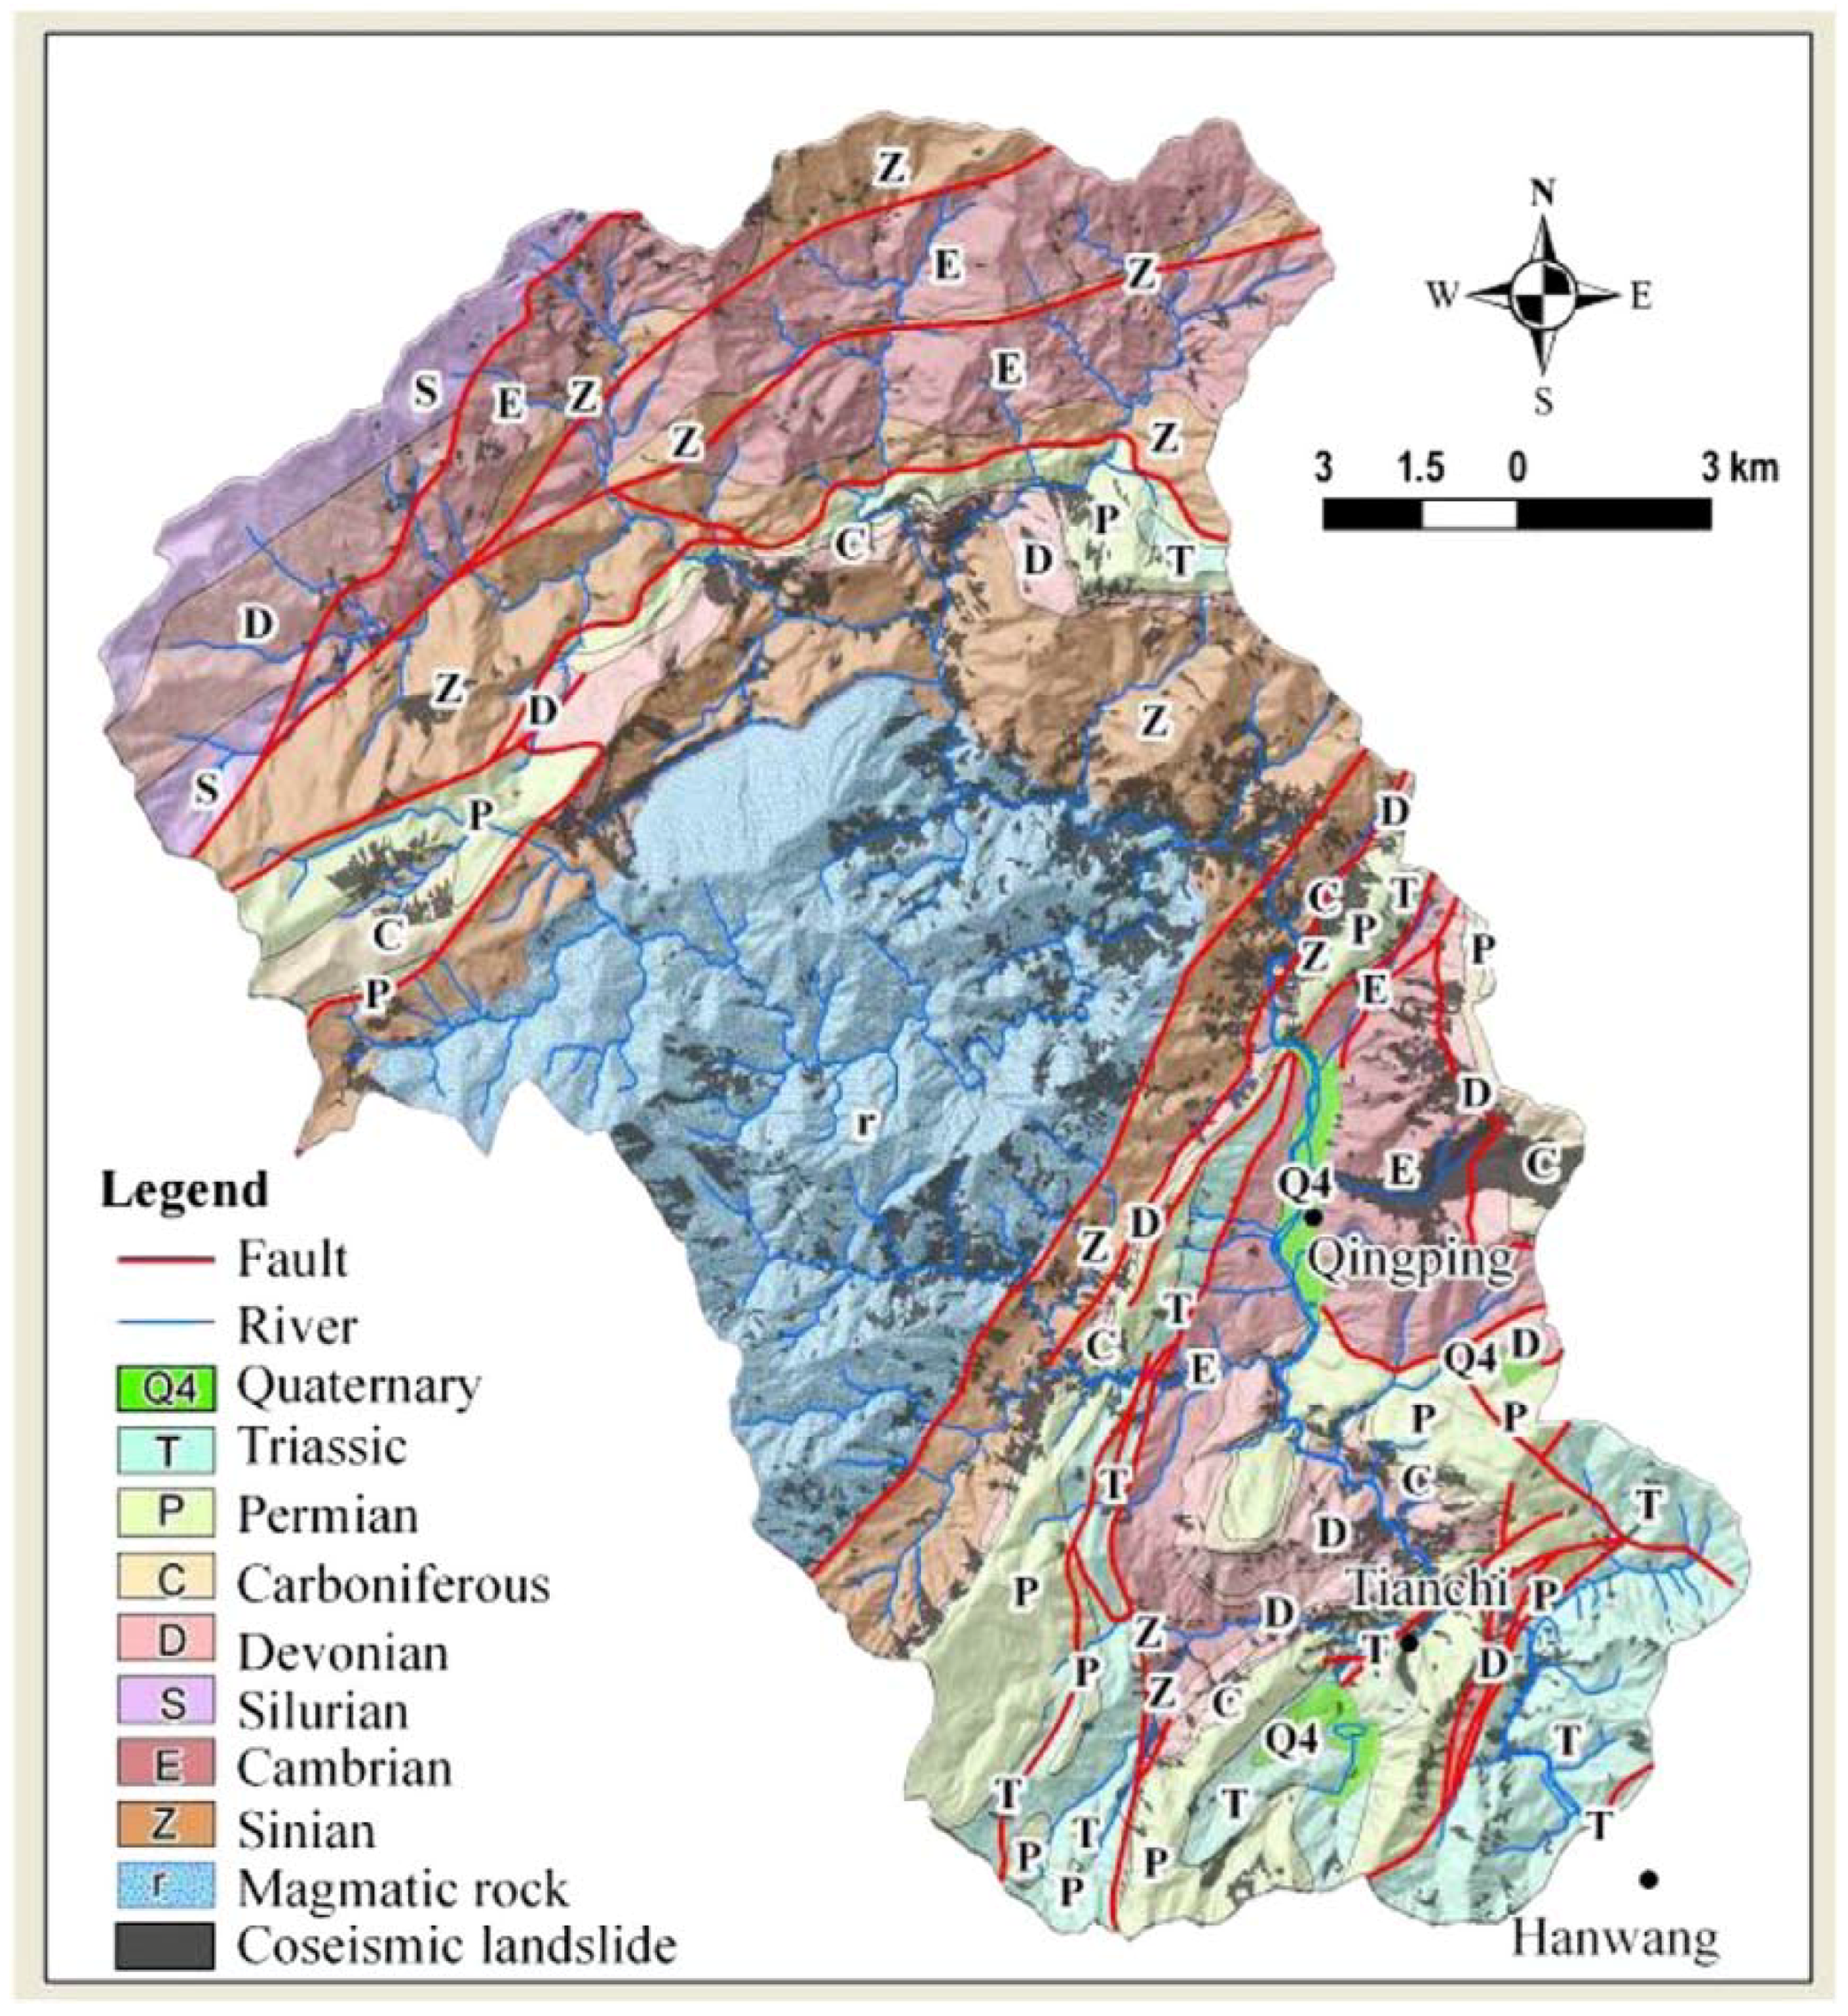
Figure 3.
Evolution of the Zoumaling Gully after the Wenchuan earthquake [6].
Figure 3.
Evolution of the Zoumaling Gully after the Wenchuan earthquake [6].

Figure 4.
Images of the 13 August 2010 debris flow in Qingping Town: (a) aerial photo taken on 18 May 2008; and (b) a Worldview image from 13 December 2010.
Figure 4.
Images of the 13 August 2010 debris flow in Qingping Town: (a) aerial photo taken on 18 May 2008; and (b) a Worldview image from 13 December 2010.
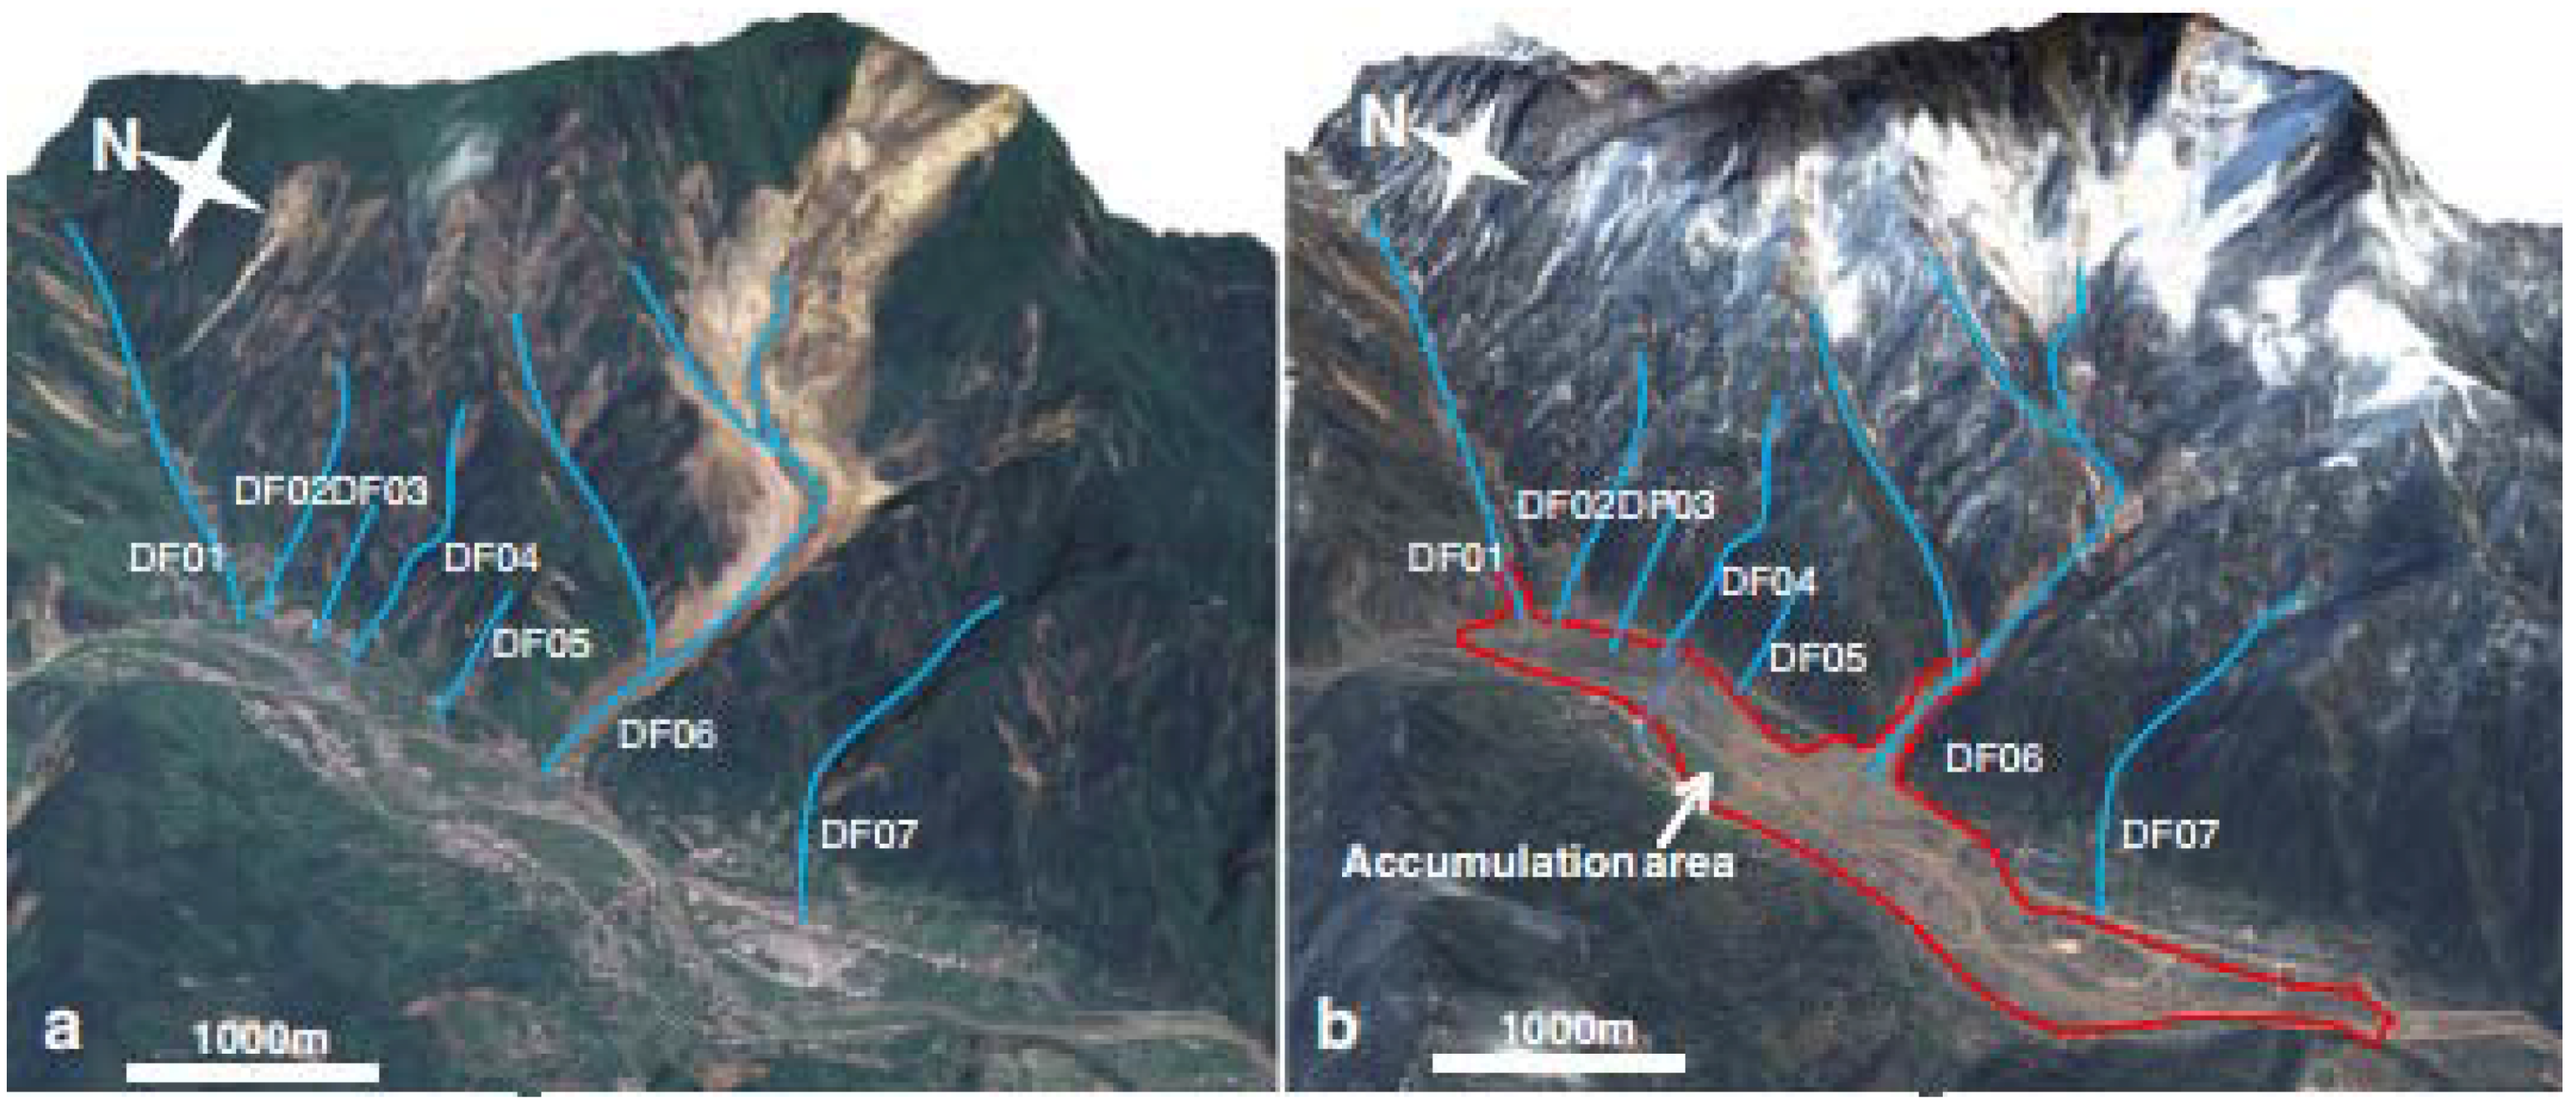
Figure 5.
Mesh example with tetrahedron elements.

Figure 6.
Simulation of the debris flow state.
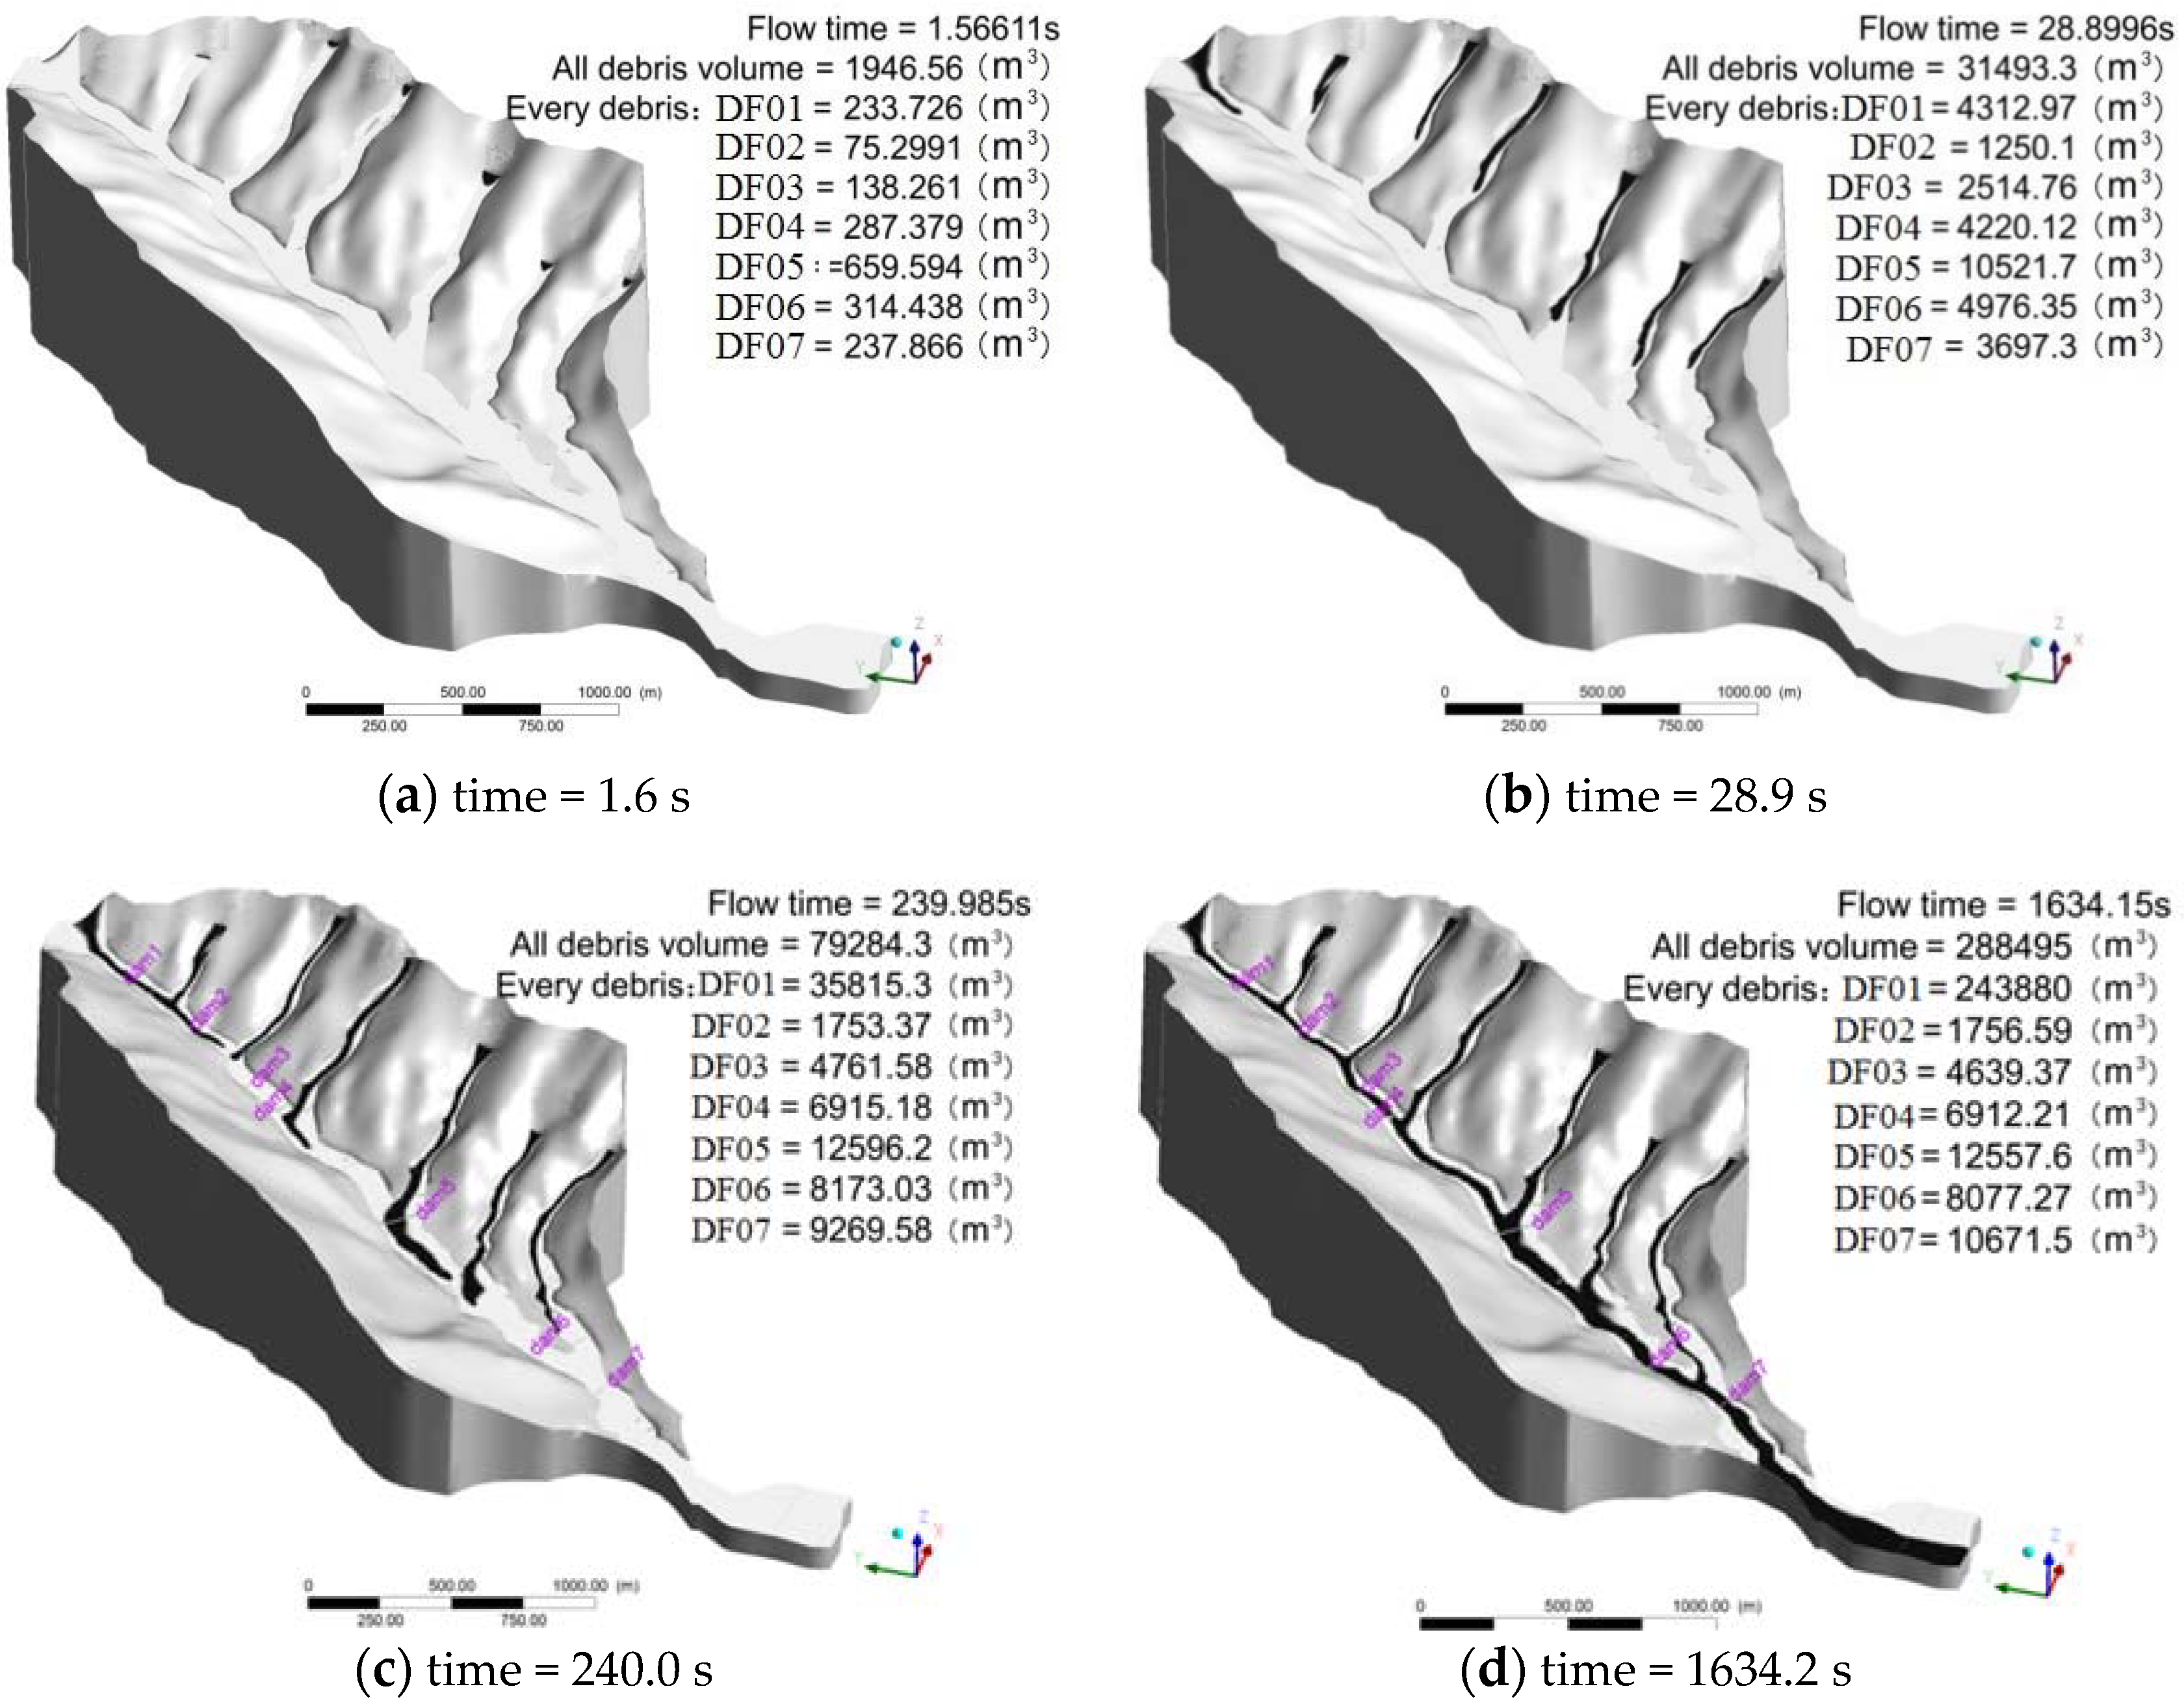
Figure 7.
Debris flow pressure nephogram on the riverbed (time = 1634.2 s).
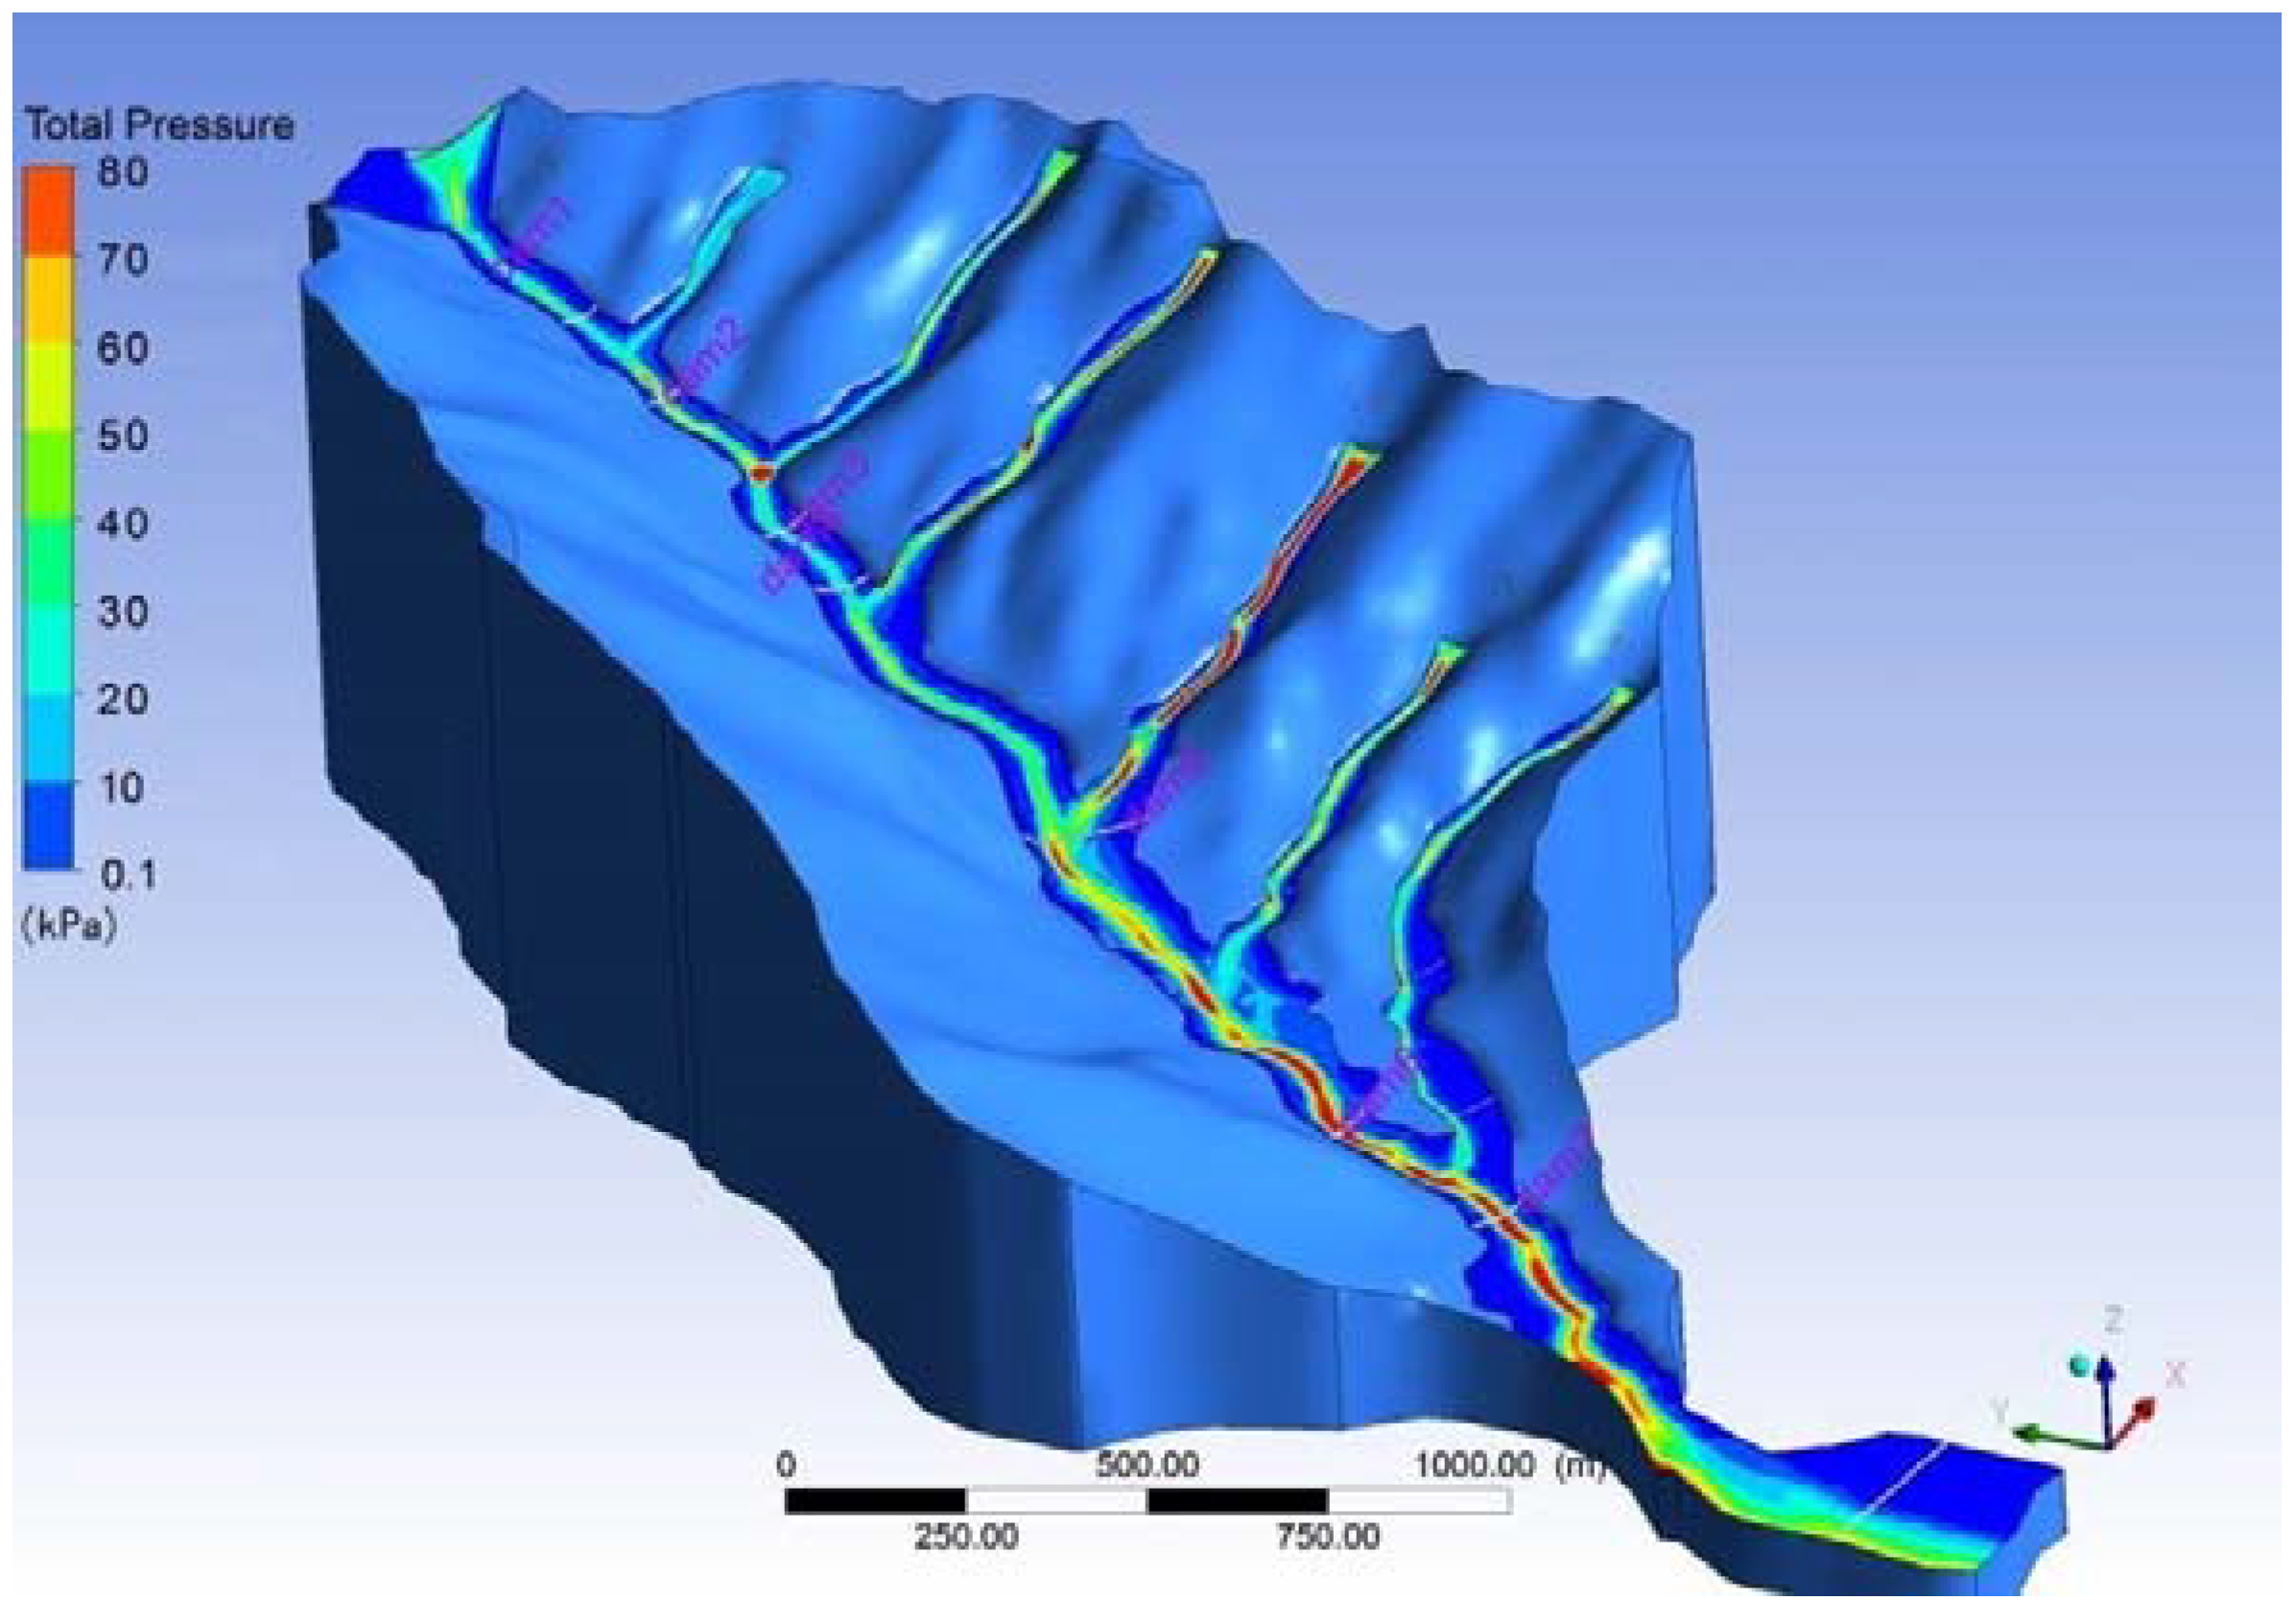
Figure 8.
Debris flow velocity vector (time = 1634.2 s).
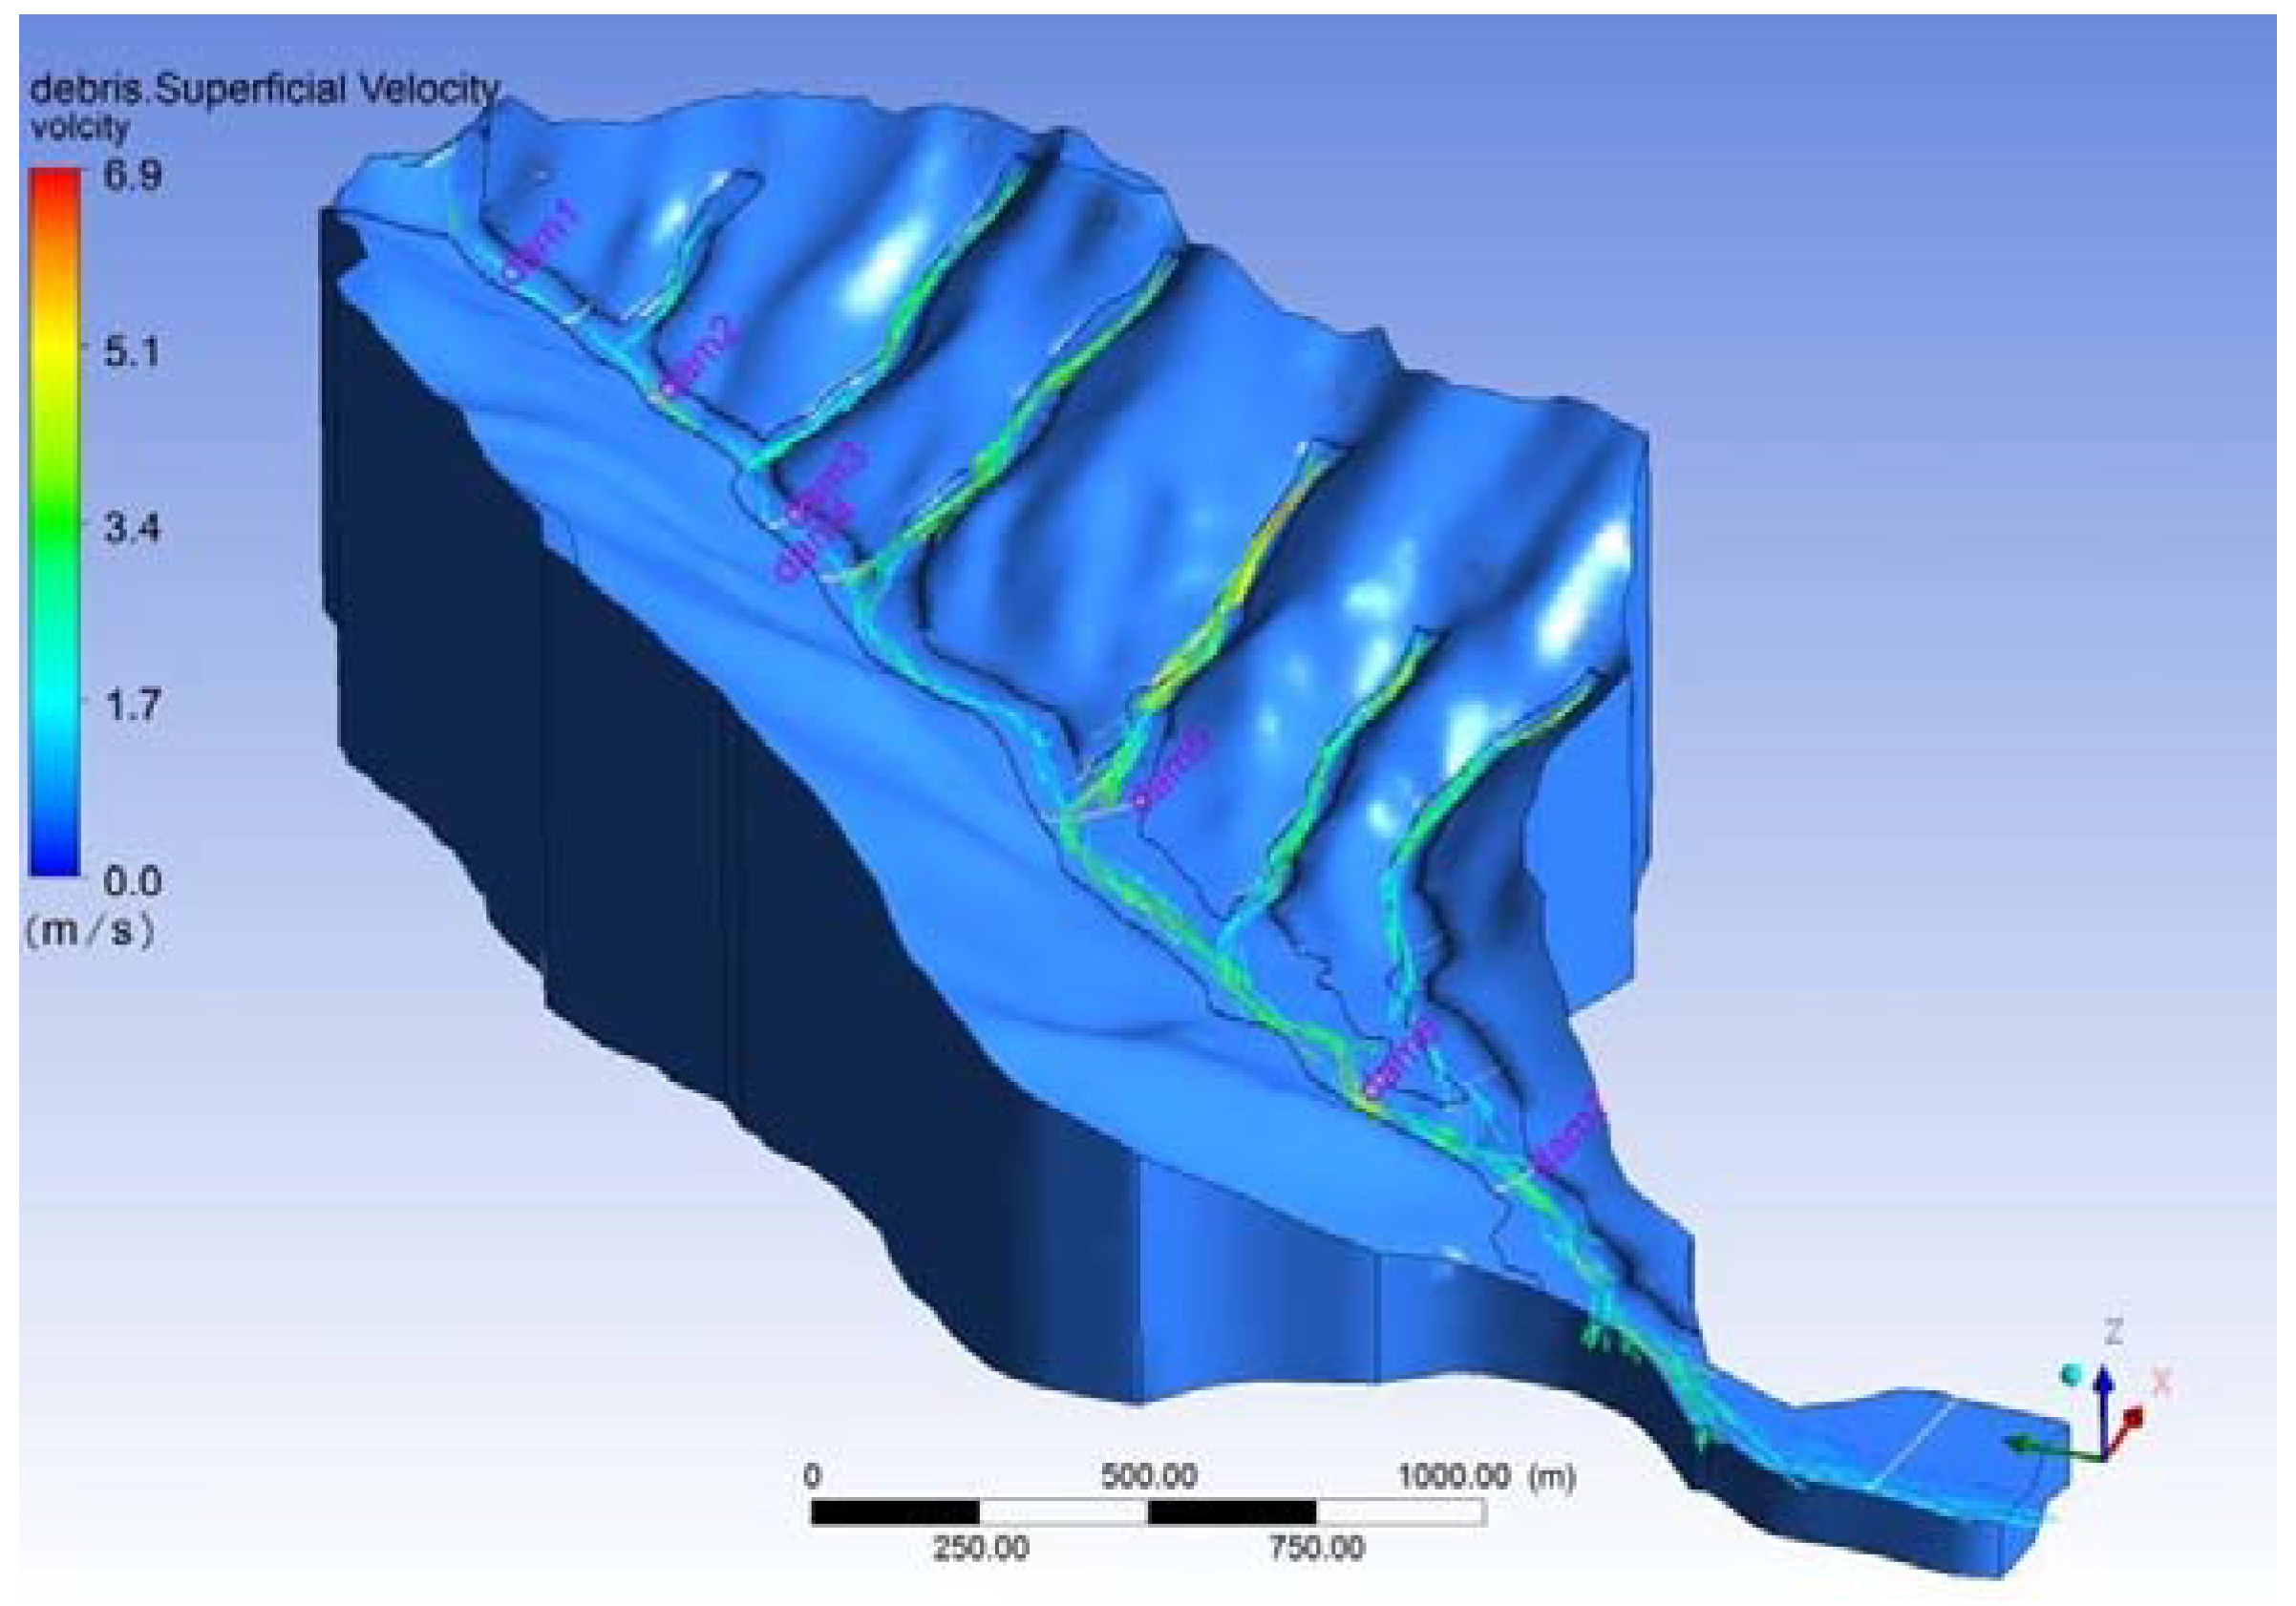
Figure 9.
Debris flow shear stress on the riverbed wall (time = 1634.2 s).
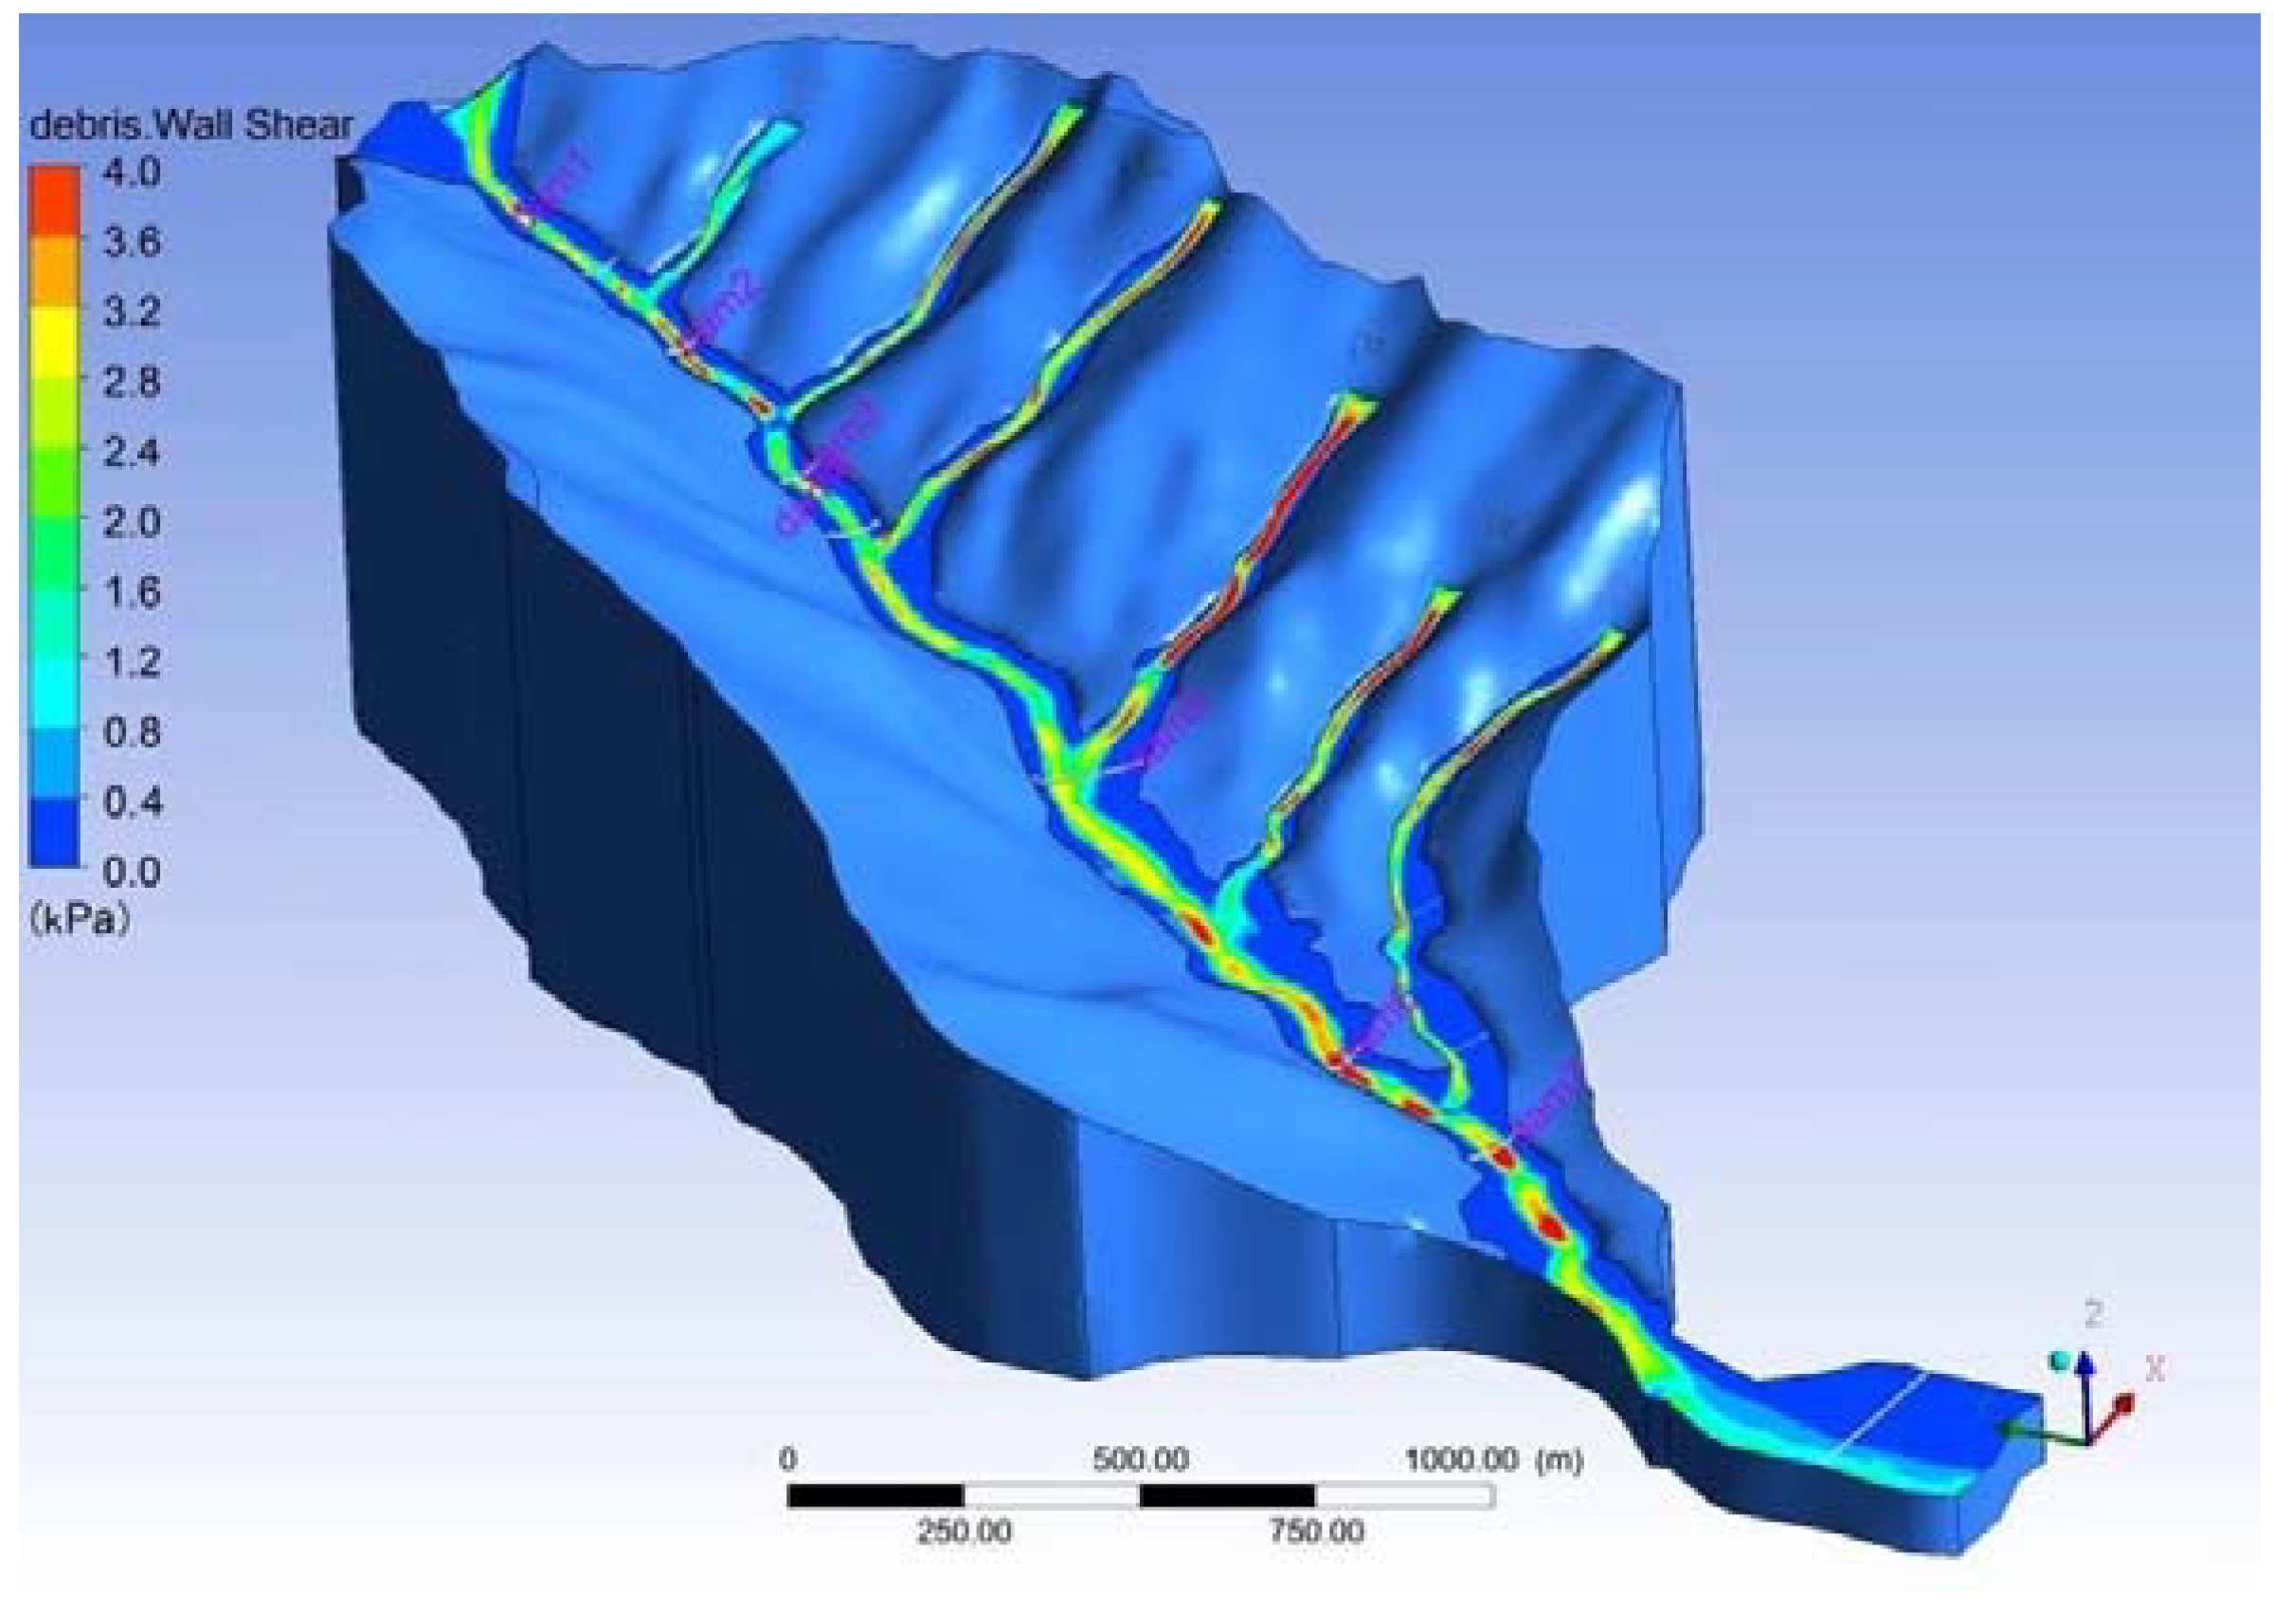
Figure 10.
Deposition thickness at the front of the barrier.
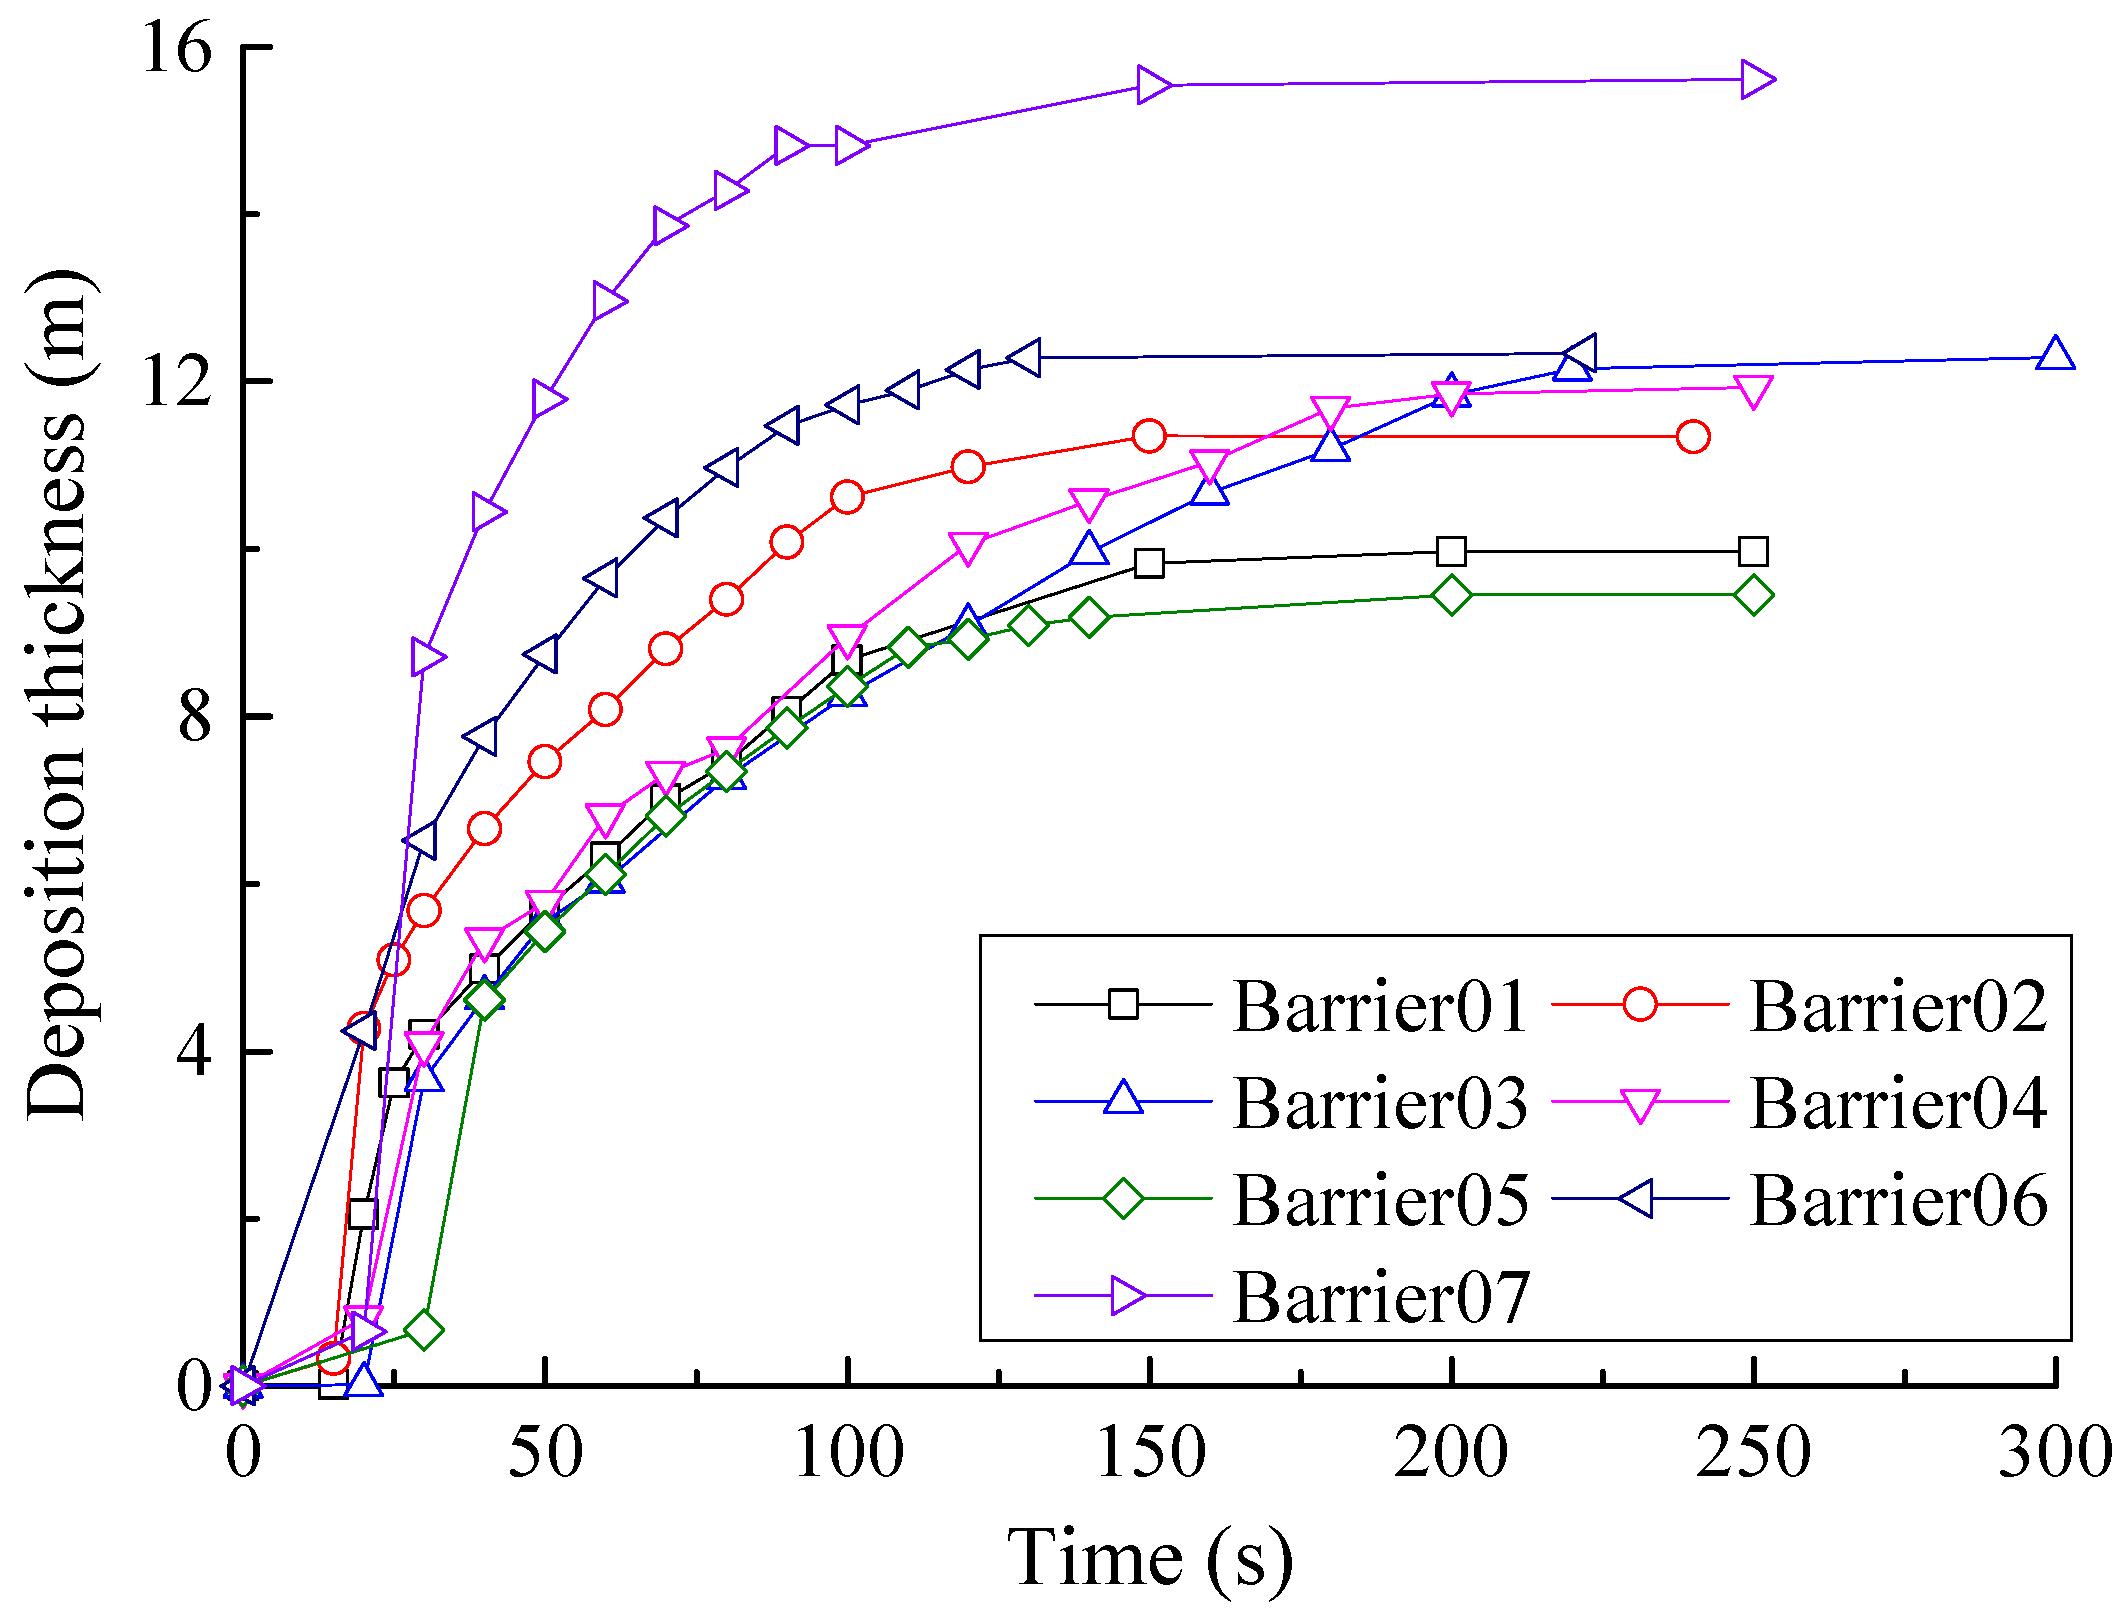
Figure 11.
Variation of the safety factor of the barrier with deposition thickness at the front of the barrier.
Figure 11.
Variation of the safety factor of the barrier with deposition thickness at the front of the barrier.
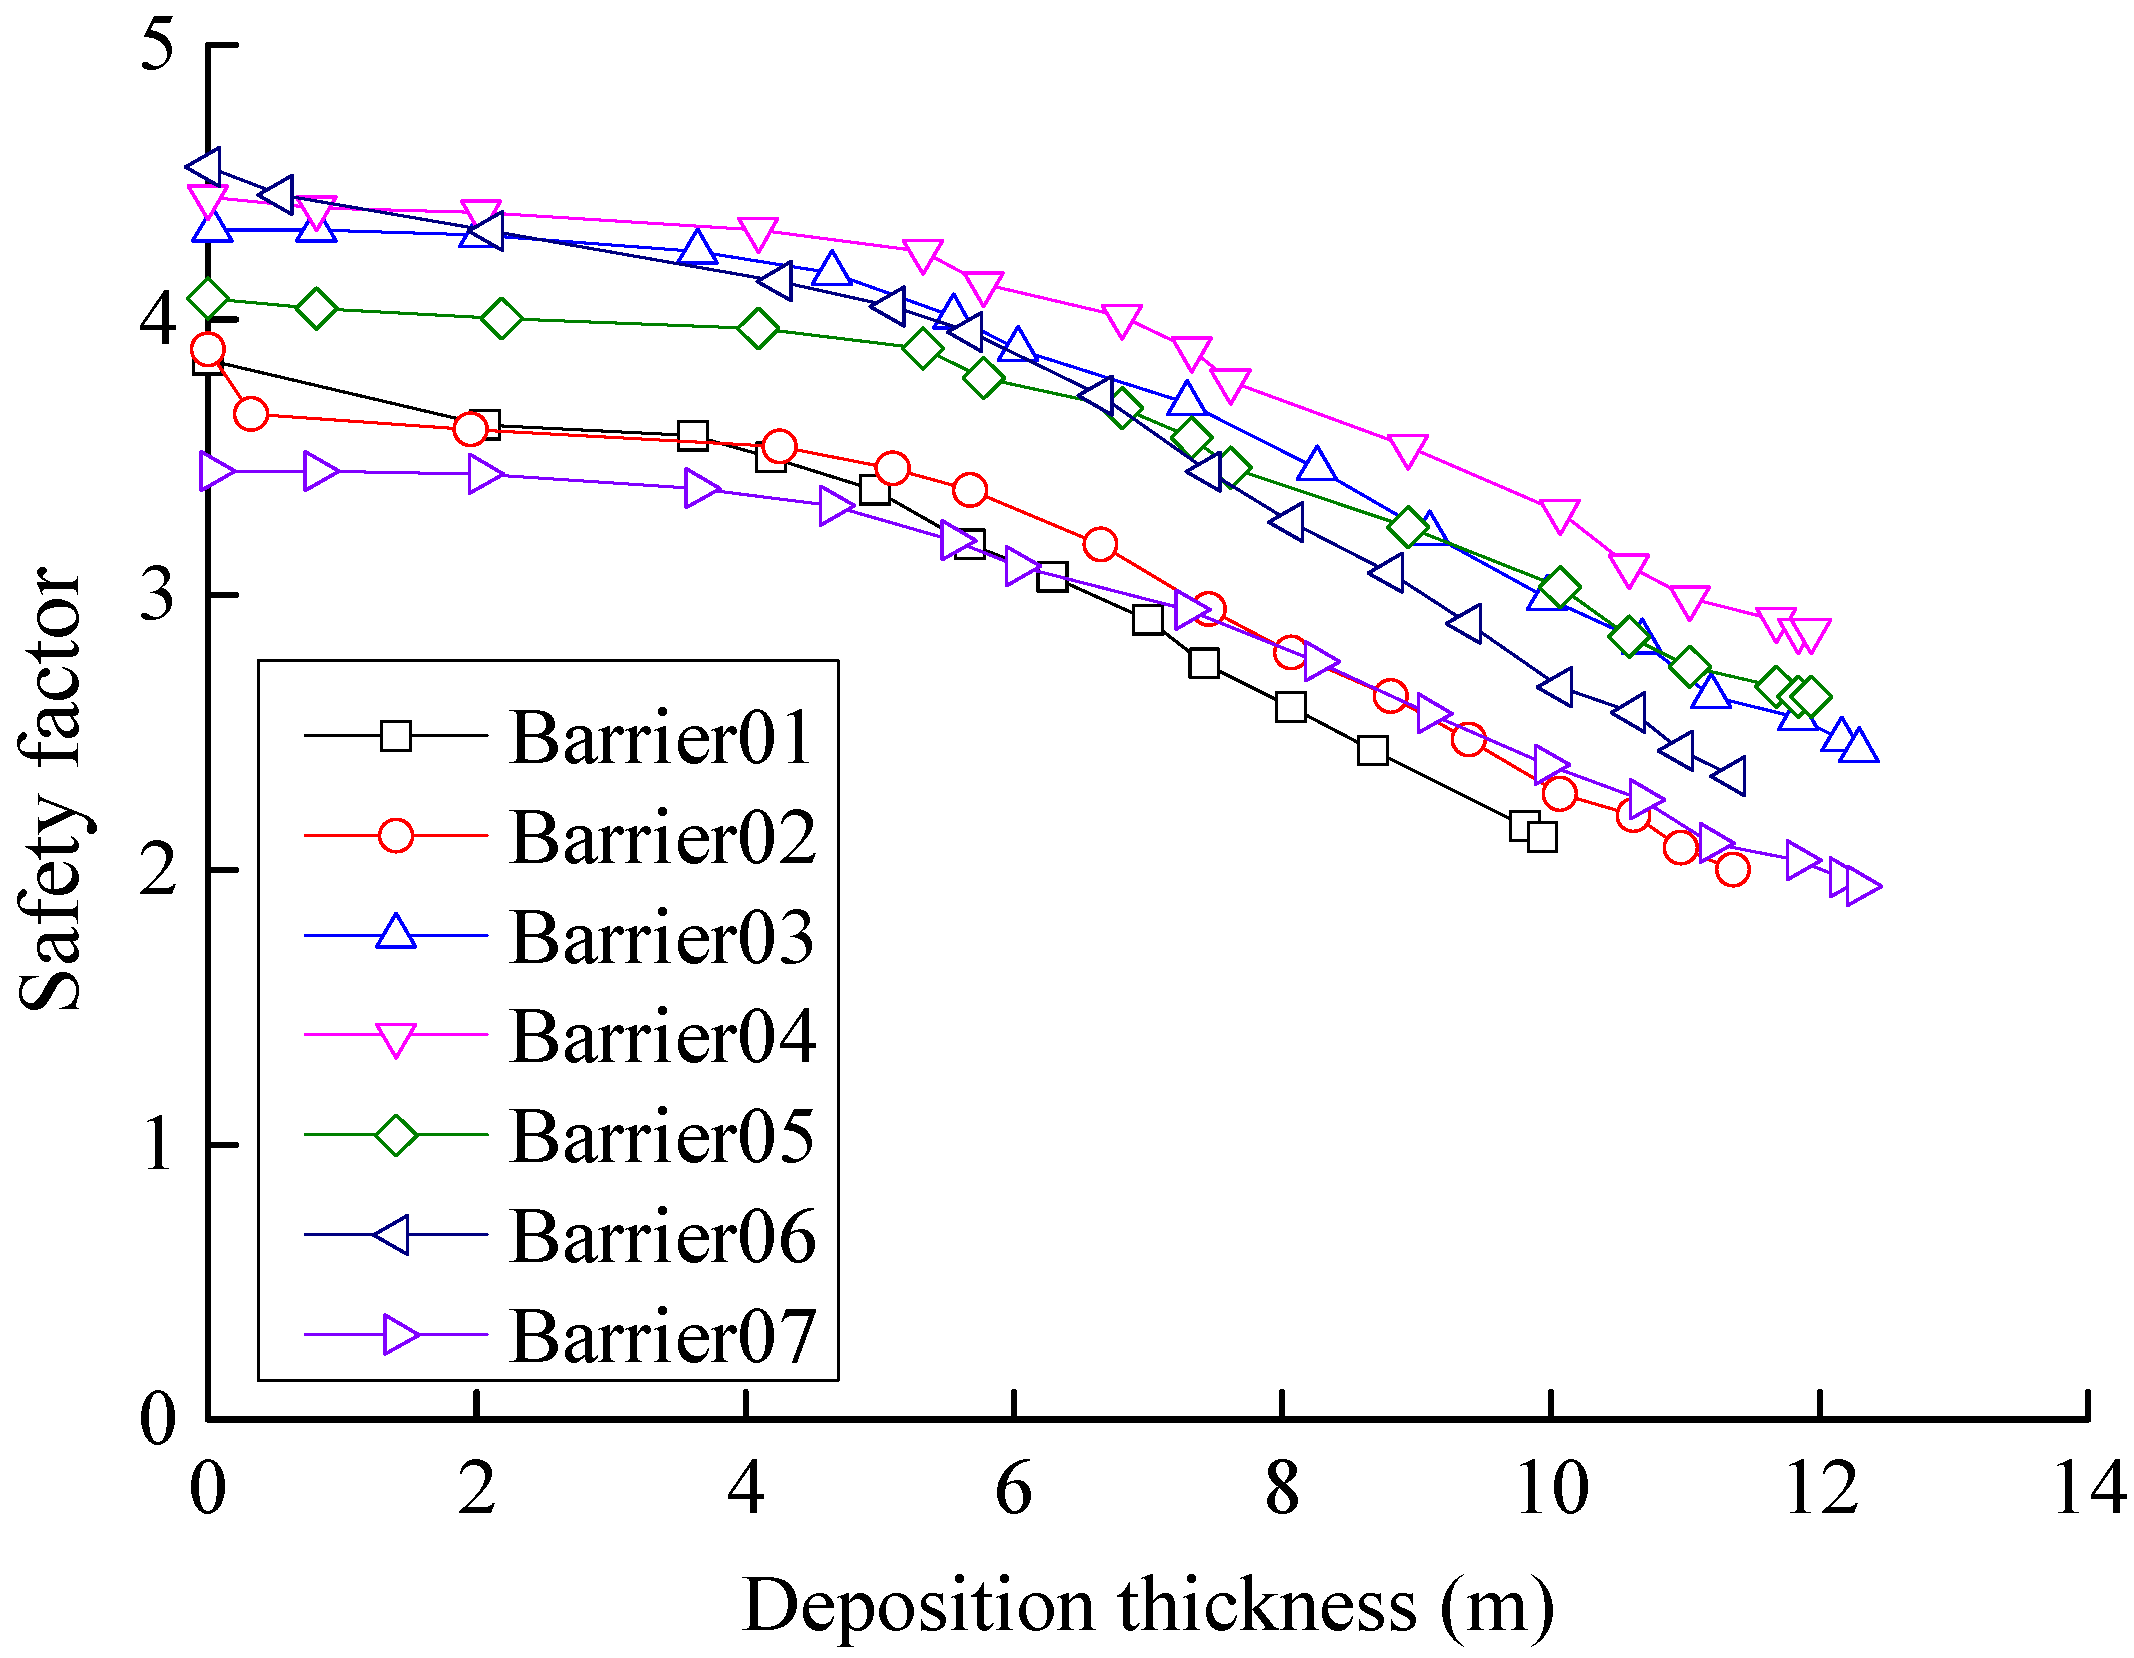
Figure 12.
Total pressure with the height of the barrier.
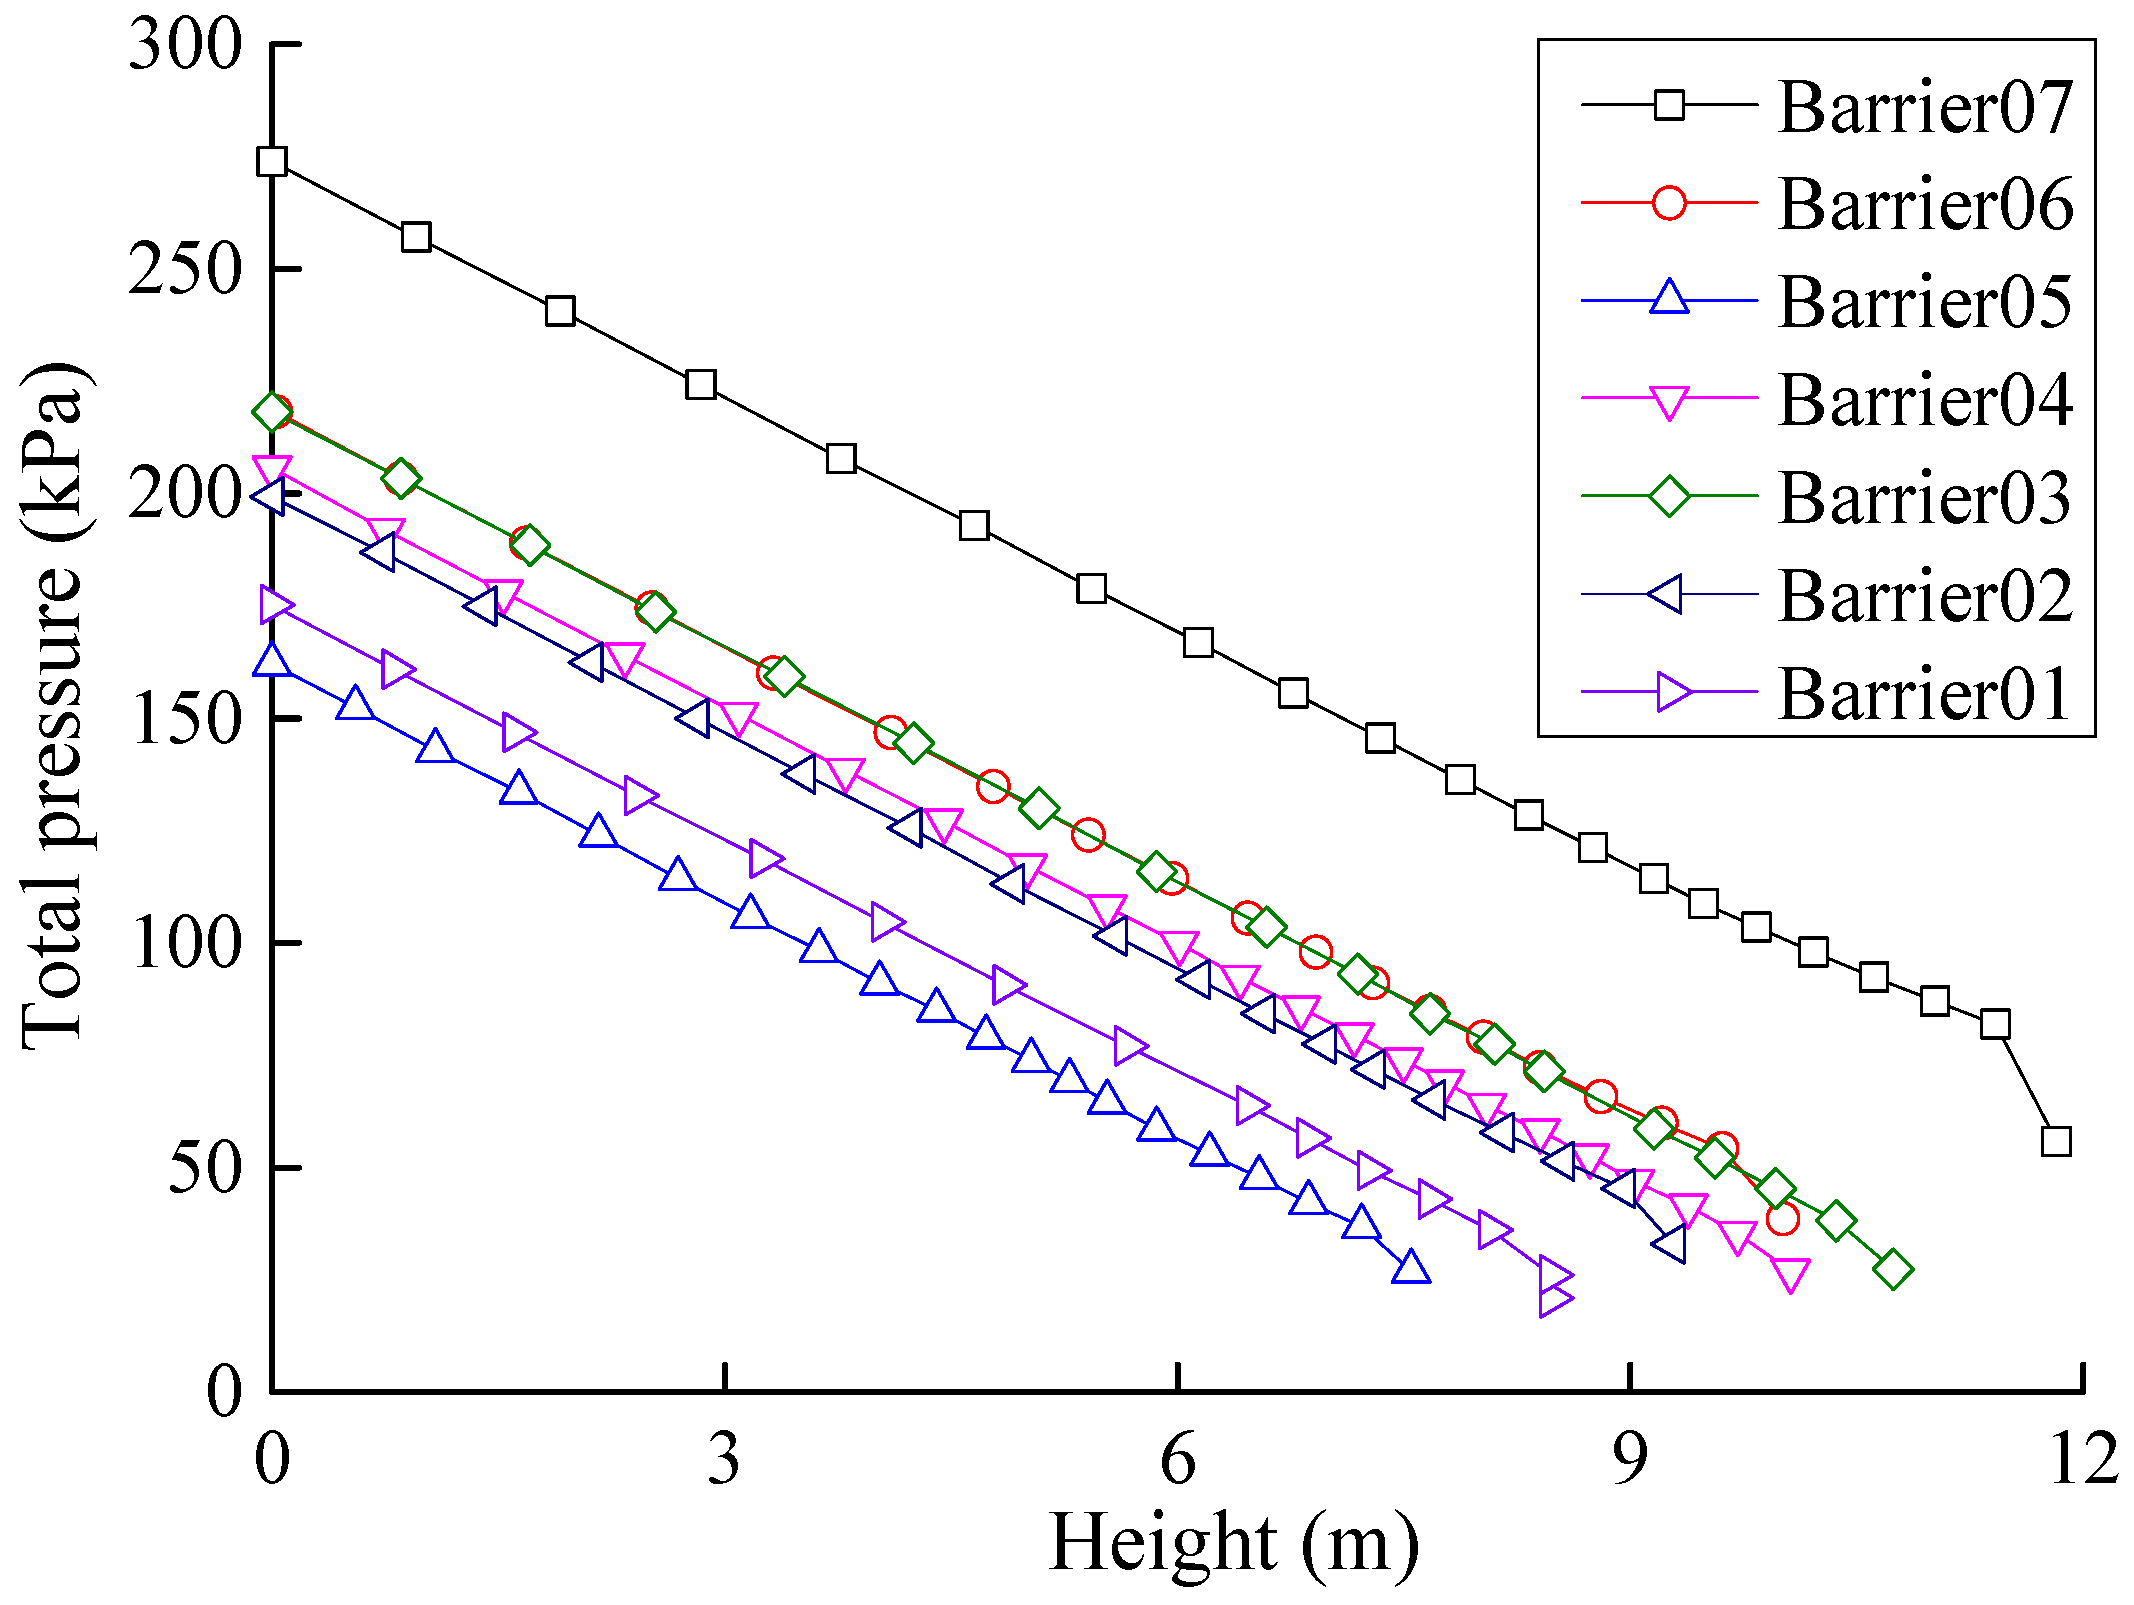
Figure 13.
Total pressure distribution on Barrier 01.

Figure 14.
Total deformation, total stress, and safety factor of Barrier 01.

Table 1.
Debris flow field data at the main gully in Zoumaling.
| Position | Velocity (m/s) | Deposition Thickness (m) |
|---|---|---|
| Barrier01 | 2.29 | 1.49 |
| Barrier02 | 5.69 | 0.82 |
| Barrier03 | 2.41 | 1.29 |
| Barrier04 | 3.64 | 0.82 |
| Barrier05 | 5.69 | 0.58 |
| Barrier06 | 7.83 | 0.84 |
| Barrier07 | 6.92 | 1.83 |
| Outlet | 2.75 | 1.81 |
Table 2.
Debris-barrier interaction.
| Barrier | 01 | 02 | 03 | 04 | 05 | 06 | 07 |
|---|---|---|---|---|---|---|---|
| Max shear stress (Mpa) | 1.22 | 1.29 | 1.05 | 0.898 | 0.332 | 0.456 | 0.534 |
| Max von –mises stress (MPa) | 2.36 | 2.49 | 2.04 | 1.74 | 0.634 | 0.857 | 1.02 |
| Max equivalent elastic strain (×10−5) | 7.48 | 7.90 | 6.48 | 5.53 | 2.01 | 2.72 | 3.24 |
| Max displacement at crest (mm) | 0.334 | 0.368 | 0.388 | 0.333 | 0.12 | 0.193 | 0.229 |
| Debris flow horizontal impact forces (kN) | 3350 | 3690 | 4800 | 4110 | 2390 | 3870 | 5430 |
| Debris flow vertical impact forces (kN) | 9220 | 9470 | 12,600 | 11,400 | 55,500 | 8360 | 14,400 |
| Barrier antioverturning counter moment (kN⋅m) | 17,600 | 15,900 | 32,400 | 28,900 | 16,400 | 29,900 | 69,500 |
| Safety factor (deposition filled) | 2.12 | 2.01 | 2.45 | 2.87 | 2.63 | 2.34 | 1.94 |
© 2018 by the authors. Licensee MDPI, Basel, Switzerland. This article is an open access article distributed under the terms and conditions of the Creative Commons Attribution (CC BY) license (http://creativecommons.org/licenses/by/4.0/).
Share and Cite
MDPI and ACS Style
Chen, Y.; Qiu, Z.; Li, B.; Yang, Z. Numerical Simulation on the Dynamic Characteristics of a Tremendous Debris Flow in Sichuan, China. Processes 2018, 6, 109. https://doi.org/10.3390/pr6080109
AMA Style
Chen Y, Qiu Z, Li B, Yang Z. Numerical Simulation on the Dynamic Characteristics of a Tremendous Debris Flow in Sichuan, China. Processes. 2018; 6(8):109. https://doi.org/10.3390/pr6080109
Chicago/Turabian StyleChen, Yulong, Zhenfeng Qiu, Bo Li, and Zongji Yang. 2018. "Numerical Simulation on the Dynamic Characteristics of a Tremendous Debris Flow in Sichuan, China" Processes 6, no. 8: 109. https://doi.org/10.3390/pr6080109
Note that from the first issue of 2016, this journal uses article numbers instead of page numbers. See further details here.