Article

Structure Manipulation of Carbon Aerogels by Managing Solution Concentration of Precursor and Its Application for CO2 Capture

1
College of Chemical Engineering, Nanjing Tech University, Nanjing 210009, China
2
State Key Laboratory of Materials-Oriented Chemical Engineering, Nanjing Tech University, Nanjing 210009, China
3
Department of Chemistry Centre for Catalysis Research and Innovation (CCRI), University of Ottawa, Ottawa, ON K1N 6N5, Canada
4
Jiangsu National Synergetic Innovation Center for Advanced Materials (SICAM), Nanjing 210009, China
*
Authors to whom correspondence should be addressed.
Processes 2018, 6(4), 35; https://doi.org/10.3390/pr6040035
Submission received: 2 February 2018 / Revised: 1 April 2018 / Accepted: 7 April 2018 / Published: 12 April 2018
(This article belongs to the Special Issue Transport of Fluids in Nanoporous Materials)

Abstract

:
A series of carbon aerogels were synthesized by polycondensation of resorcinol and formaldehyde, and their structure was adjusted by managing solution concentration of precursors. Carbon aerogels were characterized by X-ray diffraction (XRD), Raman, Fourier transform infrared spectroscopy (FTIR), N2 adsorption/desorption and scanning electron microscope (SEM) technologies. It was found that the pore structure and morphology of carbon aerogels can be efficiently manipulated by managing solution concentration. The relative micropore volume of carbon aerogels, defined by Vmicro/Vtol, first increased and then decreased with the increase of solution concentration, leading to the same trend of CO2 adsorption capacity. Specifically, the CA-45 (the solution concentration of precursors is 45 wt%) sample had the highest CO2 adsorption capacity (83.71 cm3/g) and the highest selectivity of CO2/N2 (53) at 1 bar and 0 °C.

Graphical Abstract

1. Introduction

Global climate and eco-environment changes are largely caused by elevated atmospheric CO2 concentration mainly owing to the use of fossil fuels [1]. In order to solve these serious environmental problems, the implementation of carbon capture technologies have been proposed to control CO2 emissions at the existing energy structure [2]. Research on CO2 capture technologies has mainly been performed by using absorption [3], membrane separation [4], adsorption method [5], and so forth.
In absorption, elevated equipment size and corrosion rate, the large energy penalty caused by the regeneration of absorbents are challenging for absorption, especially aqueous amine solutions [6]. Monoethanolamine (MEA) was one of the earliest alkanolamines used for carbon capture, which has a high reaction rate, good absorption capacity. However the major drawbacks such as high energy penalties for regeneration, degradation in oxidizing environment, and corrosive effects limited its application. Membrane separation of CO2 from flue gases depends on the difference in the diffusivity, solubility, absorption and adsorption abilities of different gases on different materials for separation. It was the best economical separation technique compared to other separation methods, when a high purity product is not desired [7]. The main limitation in case of membrane separation for carbon capture is need of very high selectivity to extract a relatively low concentration of CO2 from flue gases. Thus, low selectivity is a huge challenge in commercializing this process. Carbon capture by sorbents is much more energy efficient as compared to aqueous amine solutions. Recently, many groups [8] focused on the study of synthetic methods and performance estimations on the new materials, such as metal-organic frameworks (MOFs), porous organic polymers (POPs), zeolites, activated carbons (ACs). Among these materials, porous carbons [9] have been widely researched, which are promising alternatives for CO2 capture by virtue of their high specific surface areas, moderate heat of adsorption, low-cost preparation, relatively easy regeneration, and less sensitivity to the humidity than the other CO2-philic materials.
Porous carbons derived from coal, petroleum and coconut shells have the uncontrollable surface chemistry and pore size due to uncertain structures of various precursors. Recently, carbon aerogels have received an increasing interest for their wide applicability as CO2 adsorbents due to their special pore structure and variable surface properties [10]. Structure manipulation was the important method to enhance CO2 adsorption performance. In addition, the amount of catalyst [11] and doped nitrogen [12] in the preparation process of carbon aerogels were crucial to pore volume and surface defect, thus affecting its CO2 adsorption behavior. Post-modification of carbon aerogels [13] by adding amine was another effective measure to modulate its CO2 adsorption performance. In addition, the preparation of new type carbon aerogel synthesized from bio-based nanocomposites [14] was the hot spot, showing a high CO2 adsorption capacity.
Nowadays, a large number of reports have shown that structure design of the material is crucial to its performance [15,16]. It has been widely investigated to regulate the properties of the material simply and effectively. In the preparation process of the material, concentration as a simple yet effective factor for its structure and properties had been extensively studied [17,18]. It was reported by Zhang et al. [19] that the concentration of triphenylene-2,6,10-tricarboxylic acid (H3TTCA) at the liquid–solid interface controlled self-assembling structure to fabricate a chicken-wire porous 2D network, which was confirmed by scanning tunneling microscopic (STM) measurements and density function theory (DFT) calculations. Han et al. [20] discussed the effect of concentration on the lyophilization-induced self-assembly of cellulose particles in aqueous suspensions. They found that cellulose particles self-organized into lamellar structured foam composed of aligned membrane layers with adjustable widths by regulating the concentration. Volpe et al. [21] explored that the concentrations of sodium caseinate (SC) and chitosan (CH) affected the structure and physical properties of the obtained blended films. It was found that the hydrophilic nature of films was reduced by increasing the ratio between CH and CS.
Carbon aerogels synthesized by using precursors of resorcinol and formaldehyde have been received much attention [22,23]. This paper demonstrates that the structure of carbon aerogel can be managed by solution concentration of its precursors, thus improving its CO2 adsorption performance. Herein, we developed a series of structure-adjustable carbon aerogels by managing the concentration of precursors. The pore structure and surface morphologies of as-prepared sorbents were characterized by X-ray diffraction (XRD), Raman, Fourier transform infrared spectroscopy (FT-IR), N2 adsorption/desorption and scanning electron microscope (SEM) technologies. In addition, adsorption capacity, isosteric heat of adsorption for CO2, selectivity of CO2/N2, water-resistant performance and adsorption stability of carbon aerogels were investigated to exhibit the adsorption performance of the adsorbents.

2. Materials and Methods

All chemicals purchased by Aladdin in this study were of analytical grade and used as received without further purification, as follows: formaldehyde (37–40 wt% aqueous solution), resorcinol, deionized water, acetone and cetyltrimethyl ammonium bromide.
The preparation process of carbon aerogels was reported elsewhere with some modifications [24]. The molar ratio of cetyltrimethyl ammonium bromide (CTAB), formaldehyde (F) and resorcinol (R) is 1:125:250, and the solution concentration was controlled as X wt% managing by the amount of water. The solution was under magnetic stirring in a glass vial. Then sealed and made sure that the solution underwent a sol-gel process at 85 °C for 72 h. Subsequently, the as-prepared organic aerogels were dried at room temperature for 36 h and then soaked in acetone for 72 h, replacing acetone once a day, finally dried in an oven at 100 °C at ambient pressure. Afterwards the as-obtained organic aerogels were pre-carbonized at 200 °C for 2 h under N2 atmosphere [25]. Then, the pre-carbonized product was carbonized at 900 °C for 3 h with a heating rate of 5 °C/min under N2 atmosphere to get the CA-X (X = 25, 35, 45, 55) sample.
The phase structure of the CA-X was characterized by powder X-ray diffraction (XRD) on a SarmtLab powder diffractometer using Ni-filtered Cu Kα radiation (λ = 0.15406 nm) at a setting of 40 kV and 100 mA. XRD patterns were recorded within the range 10~80° at a scan rate of 2°/min. Raman spectroscopy was measured with spectral resolution of 2 cm−1 in a scanning range of 100–4000 cm−1 on Labram HR800 apparatus (JY Horiba Corporation, Palaiseau, France). In addition, the He-Cd laser at 514 nm line was used as the excitation source. The surface morphologies of the samples were detected by scanning electron microscope (SEM) at an acceleration voltage of 15 kV on Hitachi S-4800 instrument (FEI, Hillsboro, OR, USA). The Fourier transform infrared (FTIR) spectra were collected on a Nicolit iS50 IR spectrometer (Thermo Nicolet Corporation, Madison, WI, USA) with a DTGS KBr detector (Thermo Nicolet Corporation, Madison, WI, USA) in the range of 4000 to 1000 cm−1 at room temperature. N2-physisorption at −196 °C was performed on a BETSORP-II analyzer (MicrotracBEL, Osaka, Japan) to gain the textural properties of the materials. These samples were outgassed at 200 °C for 2 h prior to the adsorption measurements. The Brunauer–Emmett–Teller (BET) method was employed to determine the total surface area in the p/p0 range between 0.05 and 0.20. The micropore volume was determined by the t-plot method. The mesopore volume and size distribution were calculated from the adsorption branch of the isotherm by the Barrett–Joyner–Halenda (BJH) method.
Static CO2 adsorption experiments were measured by a BELSORP-II adsorption apparatus (MicrotracBEL, Osaka, Japan) at different temperature, which was controlled by a constant temperature water tank. The adsorption isotherms were fitted with the Langmuir model [25] as shown in Equation (1), and isotherm parameters were listed in the Tables S1–S4 at the supporting information.
q = q c k c p t 1 + k c p t
where p is the pressure, and q is the adsorption capacity. In addition, qc and kc are the Langmuir model parameters with the subscripts c denoting the channels.
The isosteric heat of adsorption for CO2 over the samples was calculated from the result of three adsorption isotherms at 0, 12.5 and 25 °C by using the Clausius–Clapeyron equation [25], which was shown in Equation (2). Specifically, the isosteric heat of adsorption was determined by evaluating the slope of the plots of ln(P) versus 1/T at the same adsorbed amount, where P and T are respectively the absolute pressure and temperature.
ln P 2 P 1 = Q R ( 1 T 1 1 T 2 )
The selectivity of CO2/N2 (15%/85% in volume) was calculated by using the ideal adsorption solution theory (IAST), which was described particularly in the Appendix A [26].
The test of CO2 breakthrough was measured with a packed-bed column (length = 10.0 cm, inner diameter = 1.0 cm) connected to a QGA mass spectrometer (Hiden, Warrington, UK) at the presence of 15 vol% CO2 with N2 gas. The complete removal of adsorbed species from the adsorbent was achieved through thermal activation at 200 °C under a purge flow of N2 gas. Besides, in order to determine the effect of water vapor on CO2 adsorption, the N2 gas passed through a water saturator (30 °C) located in a temperature-controlled water bath.
In addition, the regeneration experiments were also carried out with the BELSORP-II adsorption apparatus. These samples were saturated with CO2 up to 1 bar at 0 °C. In addition the recovered adsorbents were degassed at 100 °C under vacuum for 30 min prior to each measurement.

3. Results and Discussion

3.1. Material Characterizations
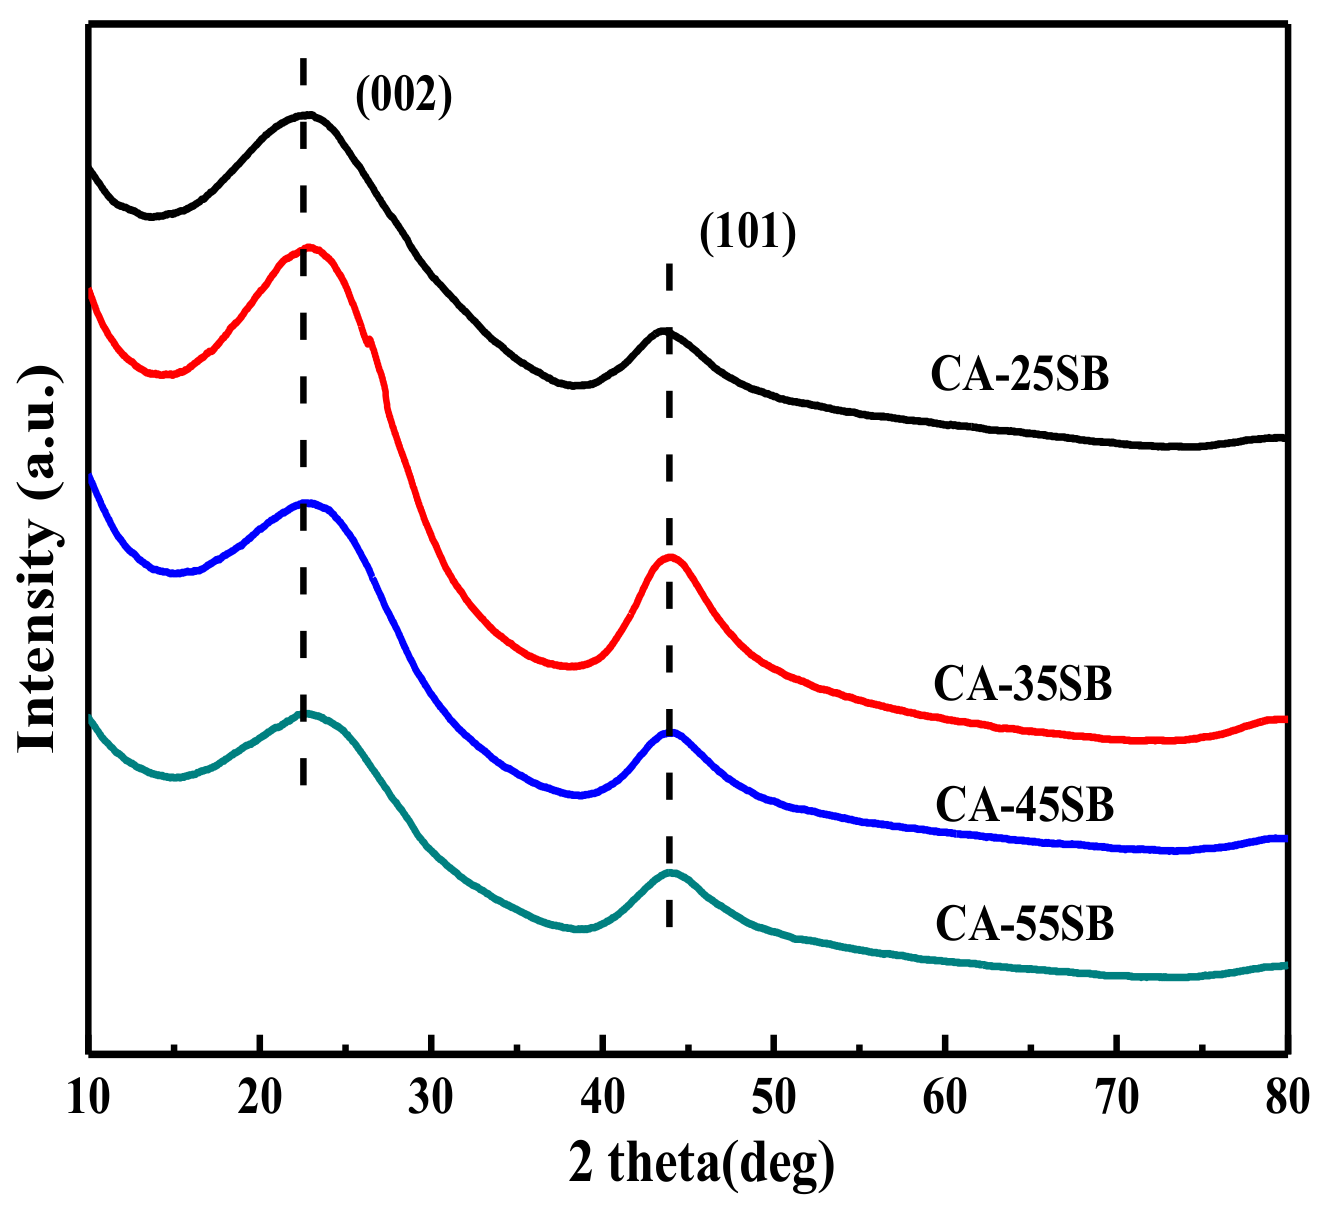
3.1.1. XRD Analysis

As presented in Figure 1, XRD analysis was carried out to characterize the phase structure of carbon aerogels. The characteristic diffraction peaks around 2θ = 23° and 43° were assigned to the (002) and (101) reflections, which indicated that all carbon aerogels showed short-range-ordered amorphous carbon materials as a partly graphitized carbon according to the reported literatures [27,28]. It indicated that the crystal form of the carbon aerogel was hardly affected by the change of solution concentration.

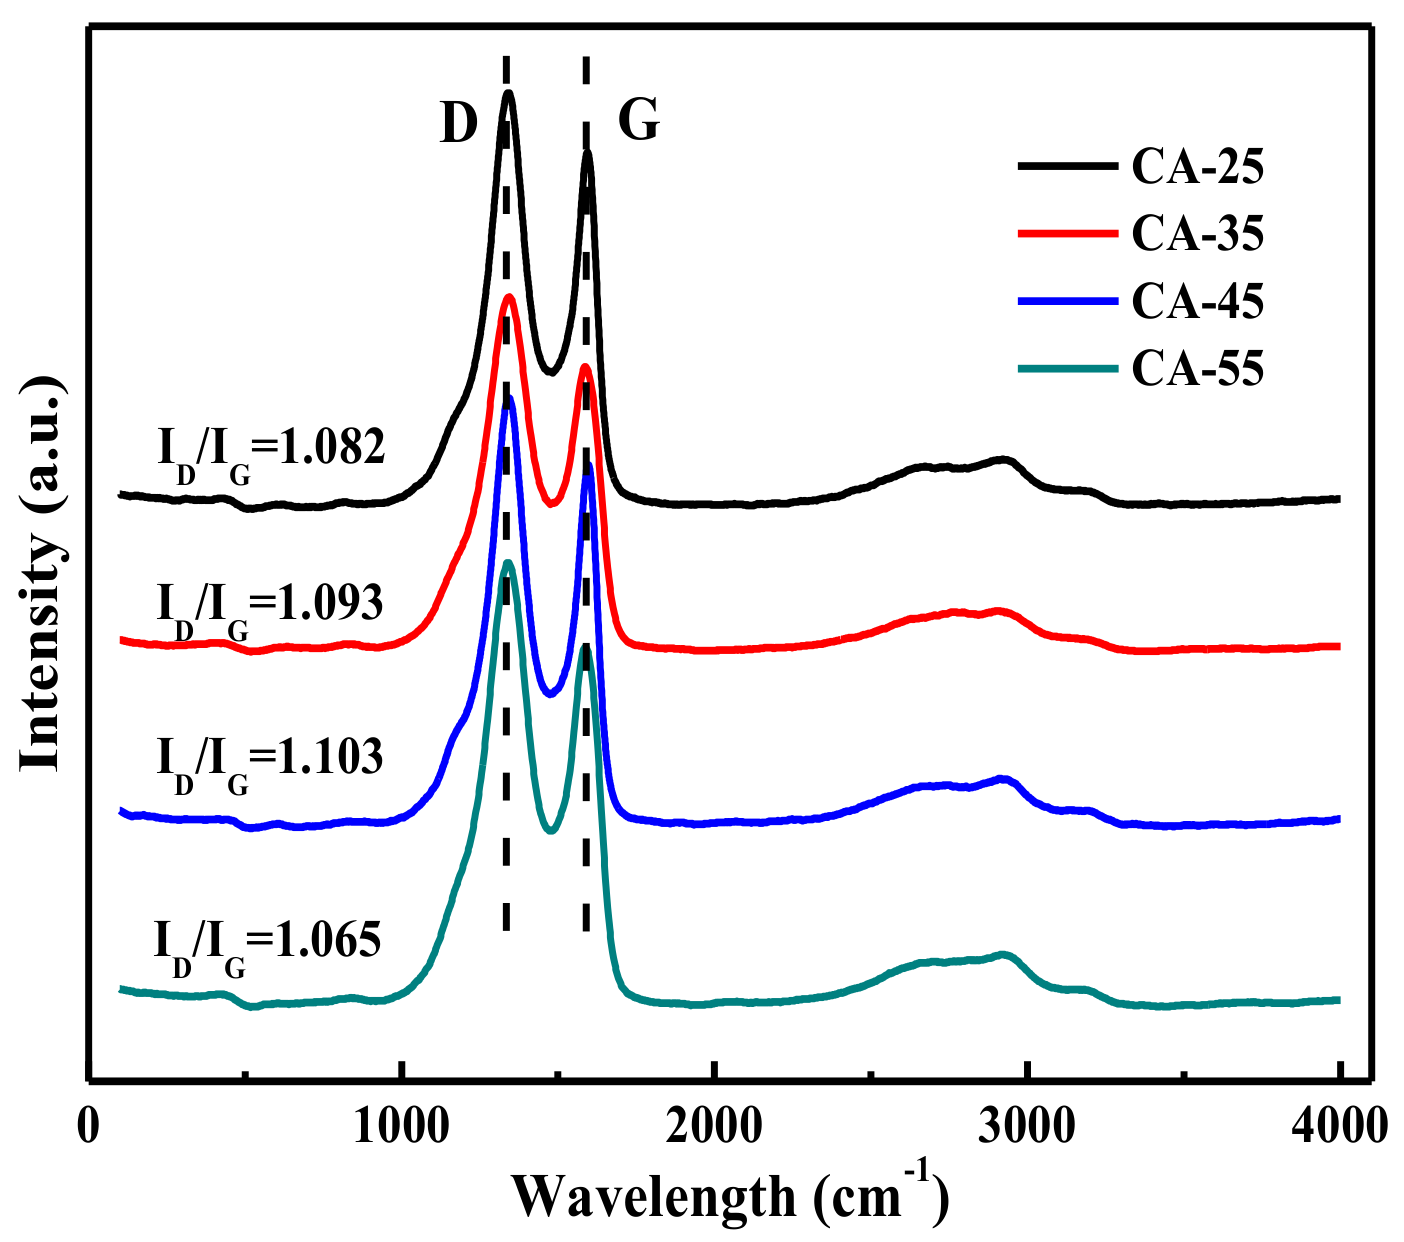
3.1.2. Raman Analysis

Raman spectra of the carbon aerogels were employed to further observe the structure and surface defects of carbon aerogels as shown in Figure 2. The Raman spectra of carbon materials were similar to that of the graphite structure. The prominent Raman G-band near 1590 cm−1 was related to the E2g active modes, which reflected the sp2 type hybridization. In addition, the strong and rather broad D-band, called the defect band, at ca. 1350 cm−1 attributed to a A1g mode, which assigned to the vibration of carbon atoms with dangling bonds [29]. As expected, the structure of amorphous carbon material as a partly graphitized carbon was formed, which was compatible with the result of XRD analysis. In addition, the relatively adjacent ID/IG ratio, showing the surface defect of the material, indicated that the change of solution concentration had a little effect on its surface defects.

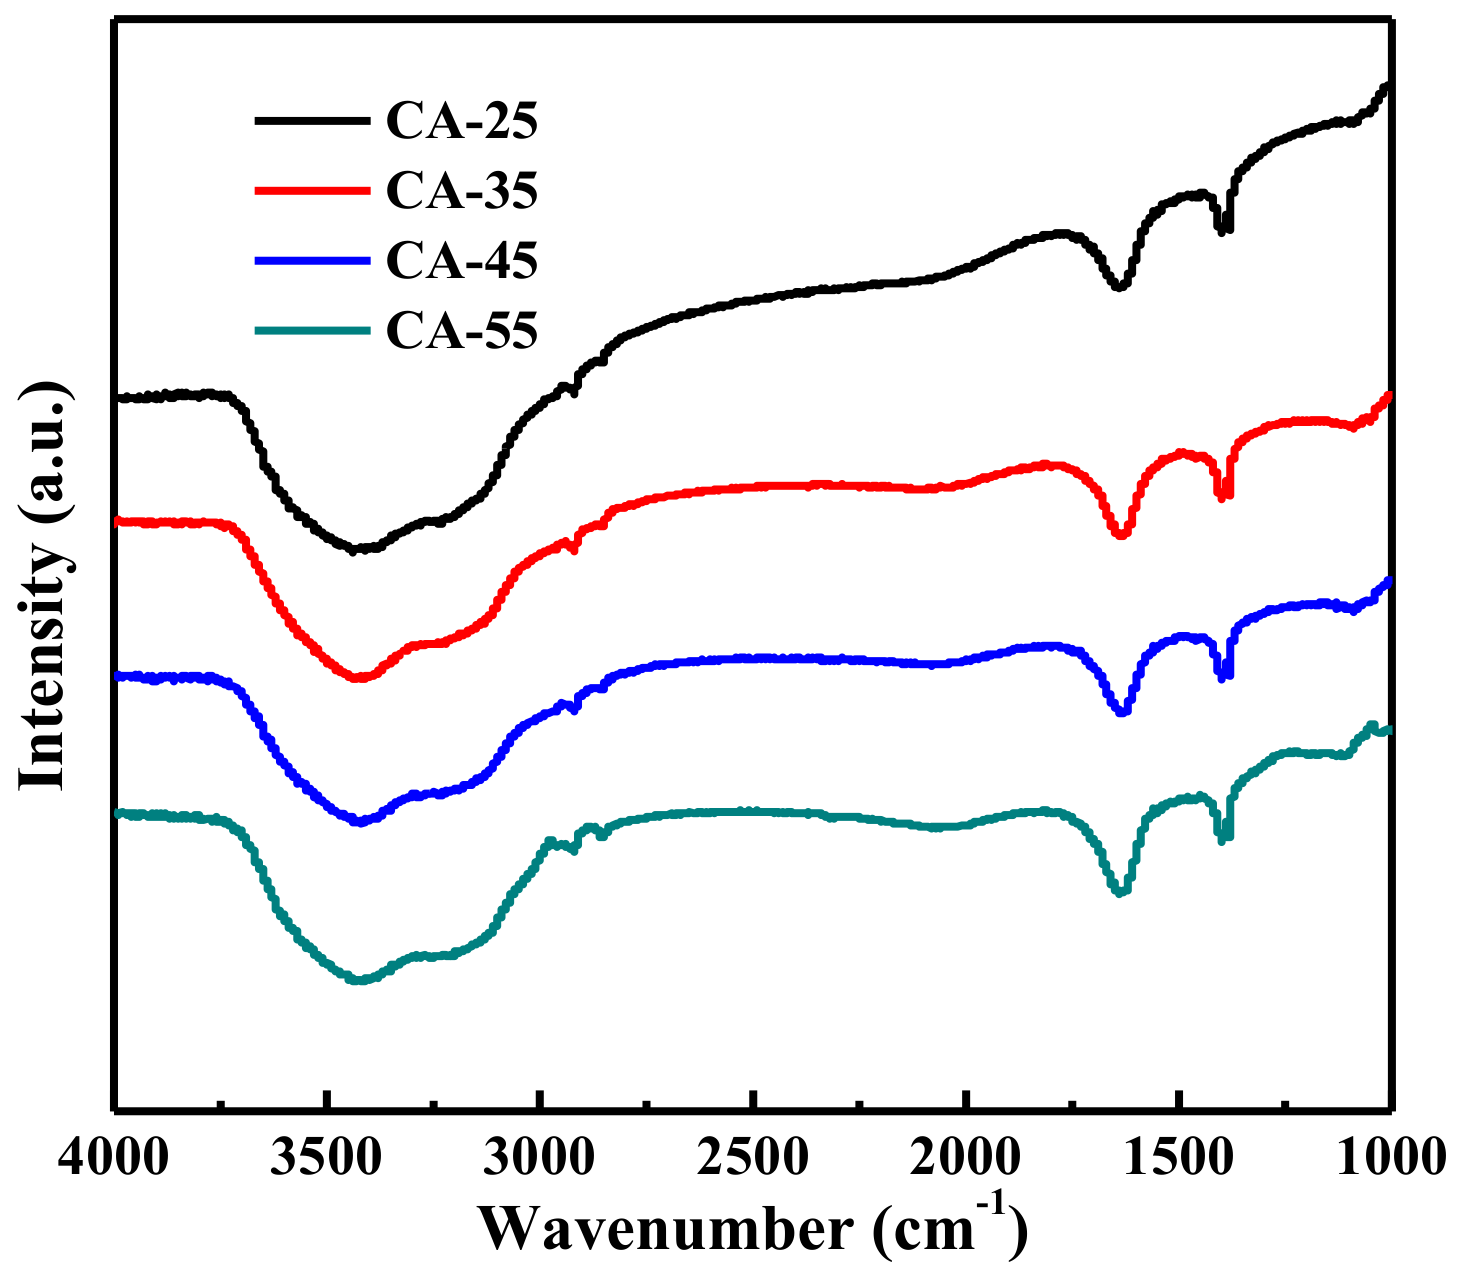
3.1.3. FTIR Analysis
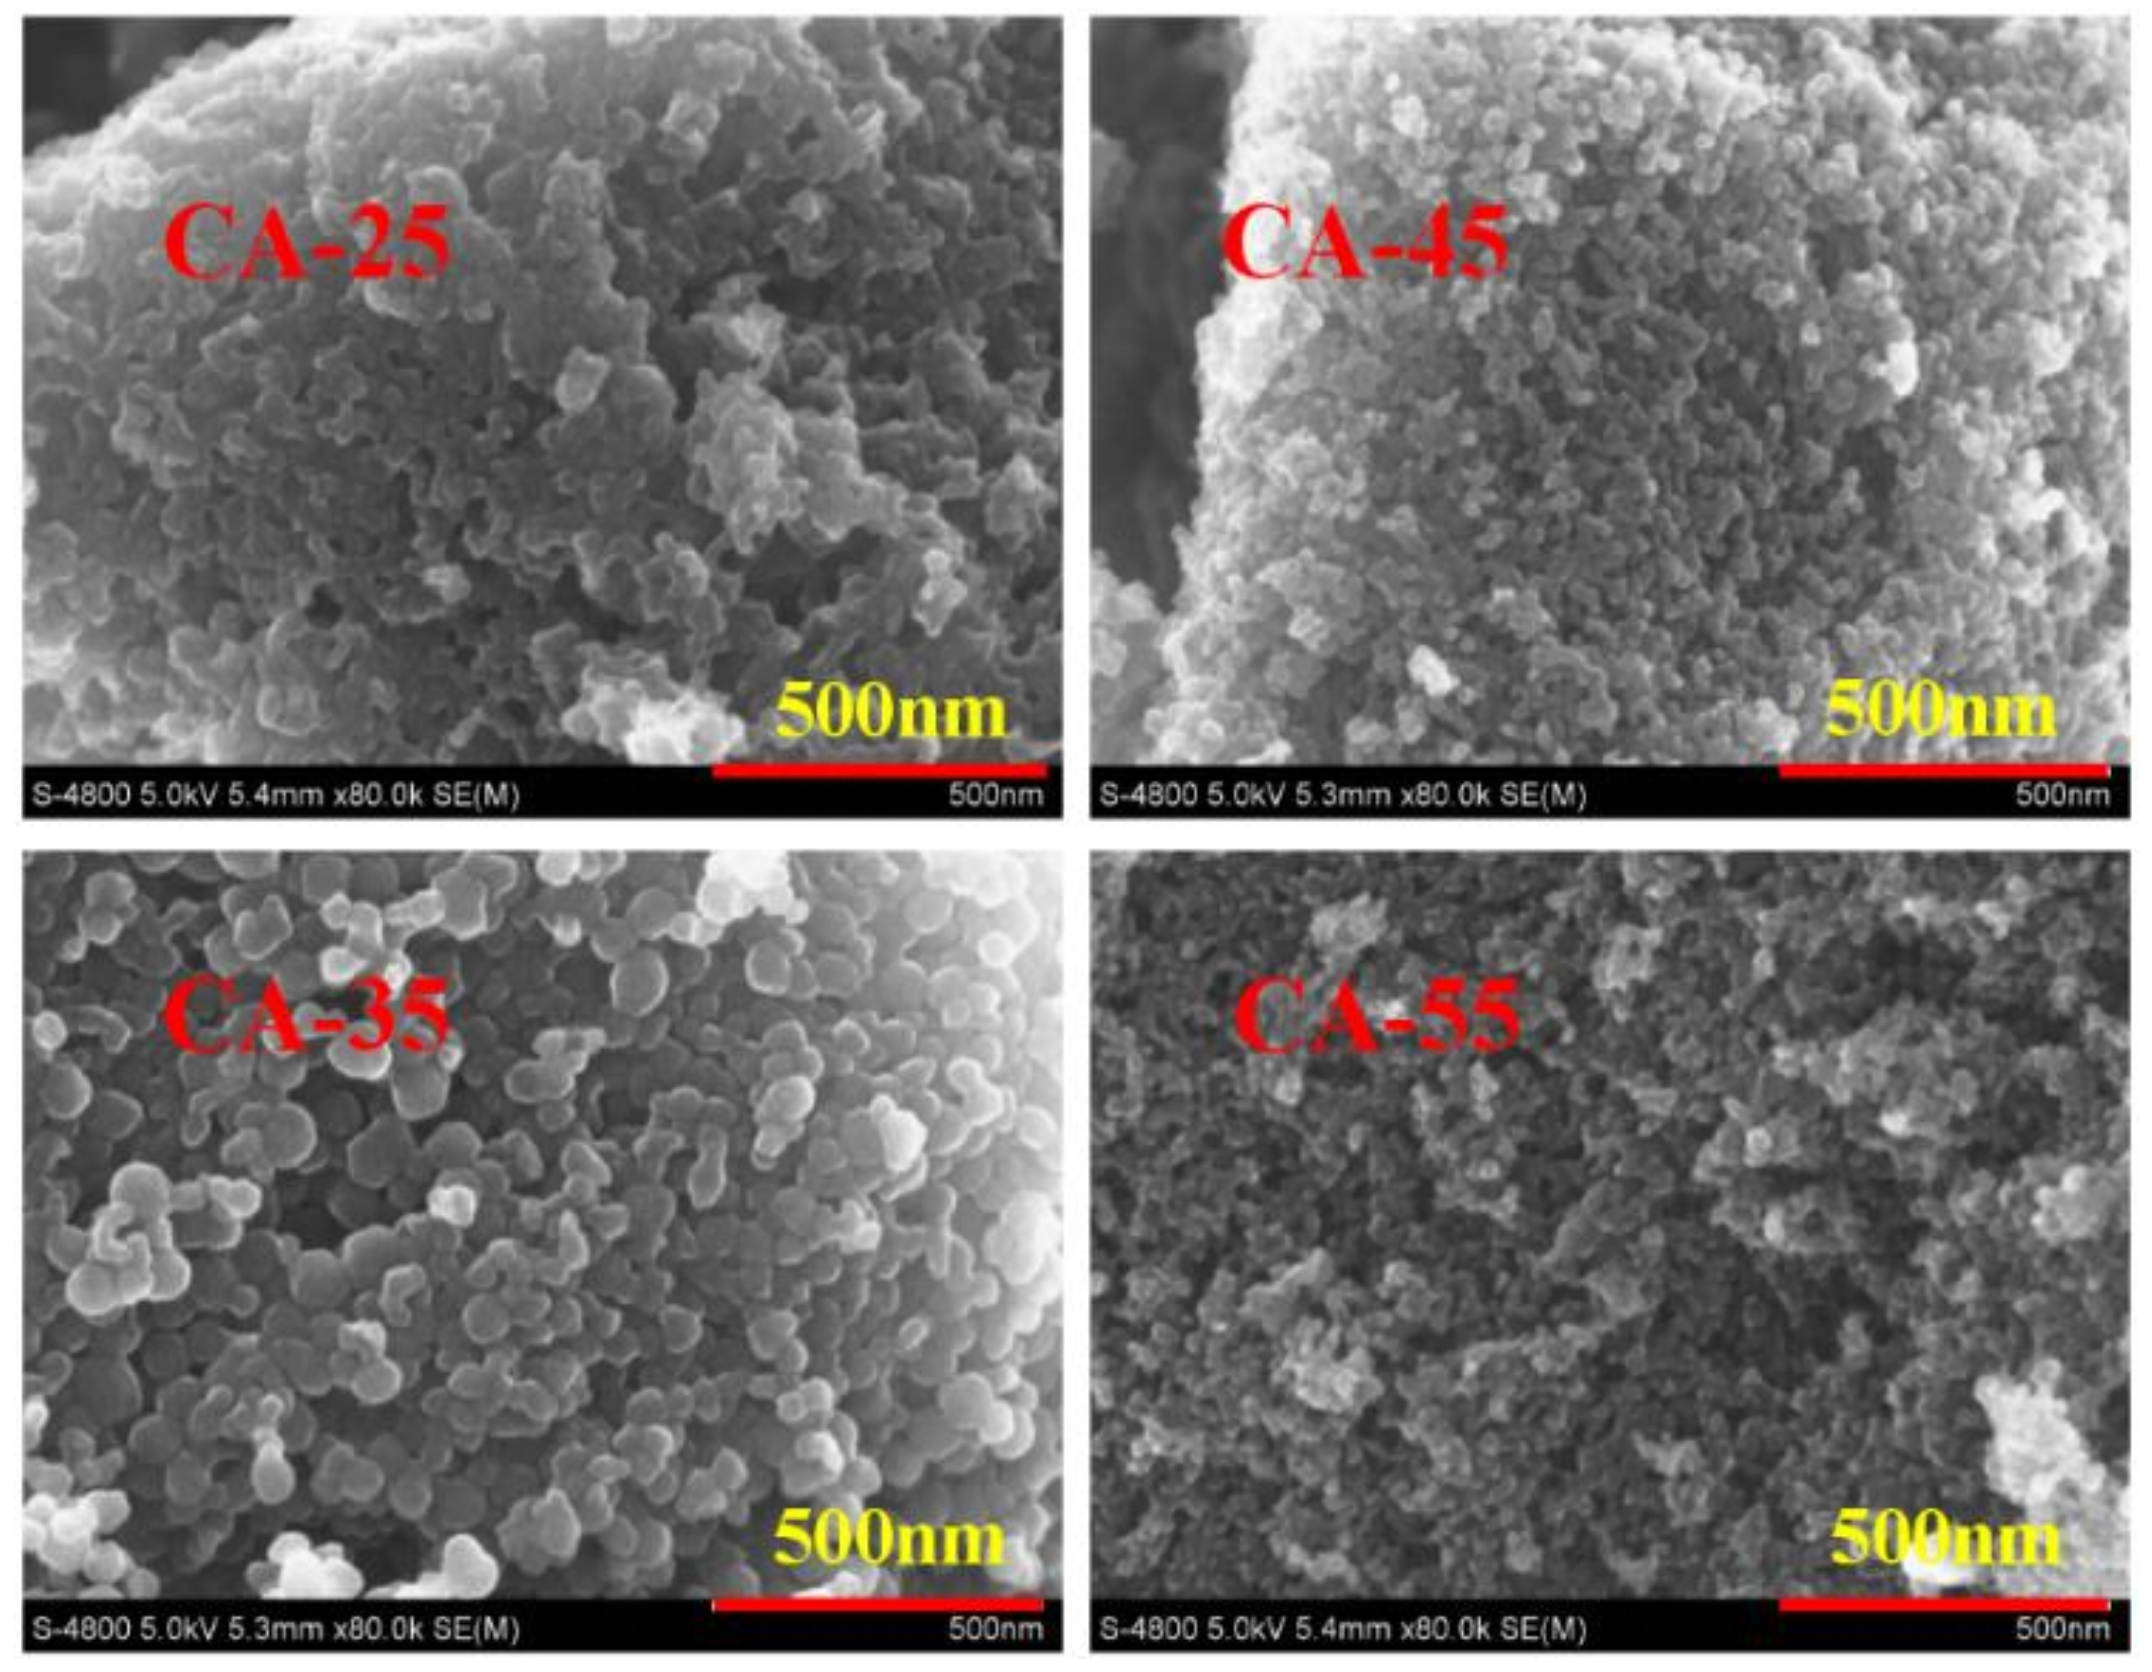
The FTIR spectra of carbon aerogels were exhibited in Figure 3, which were used to detect the surface functional groups of these materials. As shown in the picture, there were no obvious characteristic peak of organic functional groups after the calcination. The typical weak bands at 1570 cm−1 and 1350 cm−1 stem from the absorption peak of carbon in the skeleton over carbon aerogels. And the dominant absorption in the 2800–3000 cm−1 region was an indicative sign of the C–H symmetric and asymmetric stretching of CH2 and CH3 groups [29,30]. These results forcefully showed that the change of solution concentration can’t lead to the variation of surface functional groups.

3.1.4. SEM Analysis

SEM images of these materials were depicted in Figure 4, which were used to investigate the morphologies of carbon aerogels. As shown in the below pictures, it can be seen that the polymerized particle of materials exhibited the special coral shape, which was the typical shape of carbon aerogels. Besides, it can be found that the solution concentration appreciably influenced the size and morphology of carbon aerogel [31]. The size of particle was within the confines of dozens of nanometer caused by the difference of cross-linking strength among clusters, which caused a large number of pores produced between the clusters. Moreover, we can observe that the size of particle became smaller and the degree of cross-linking among clusters was further strengthened as the increase of solution concentration.

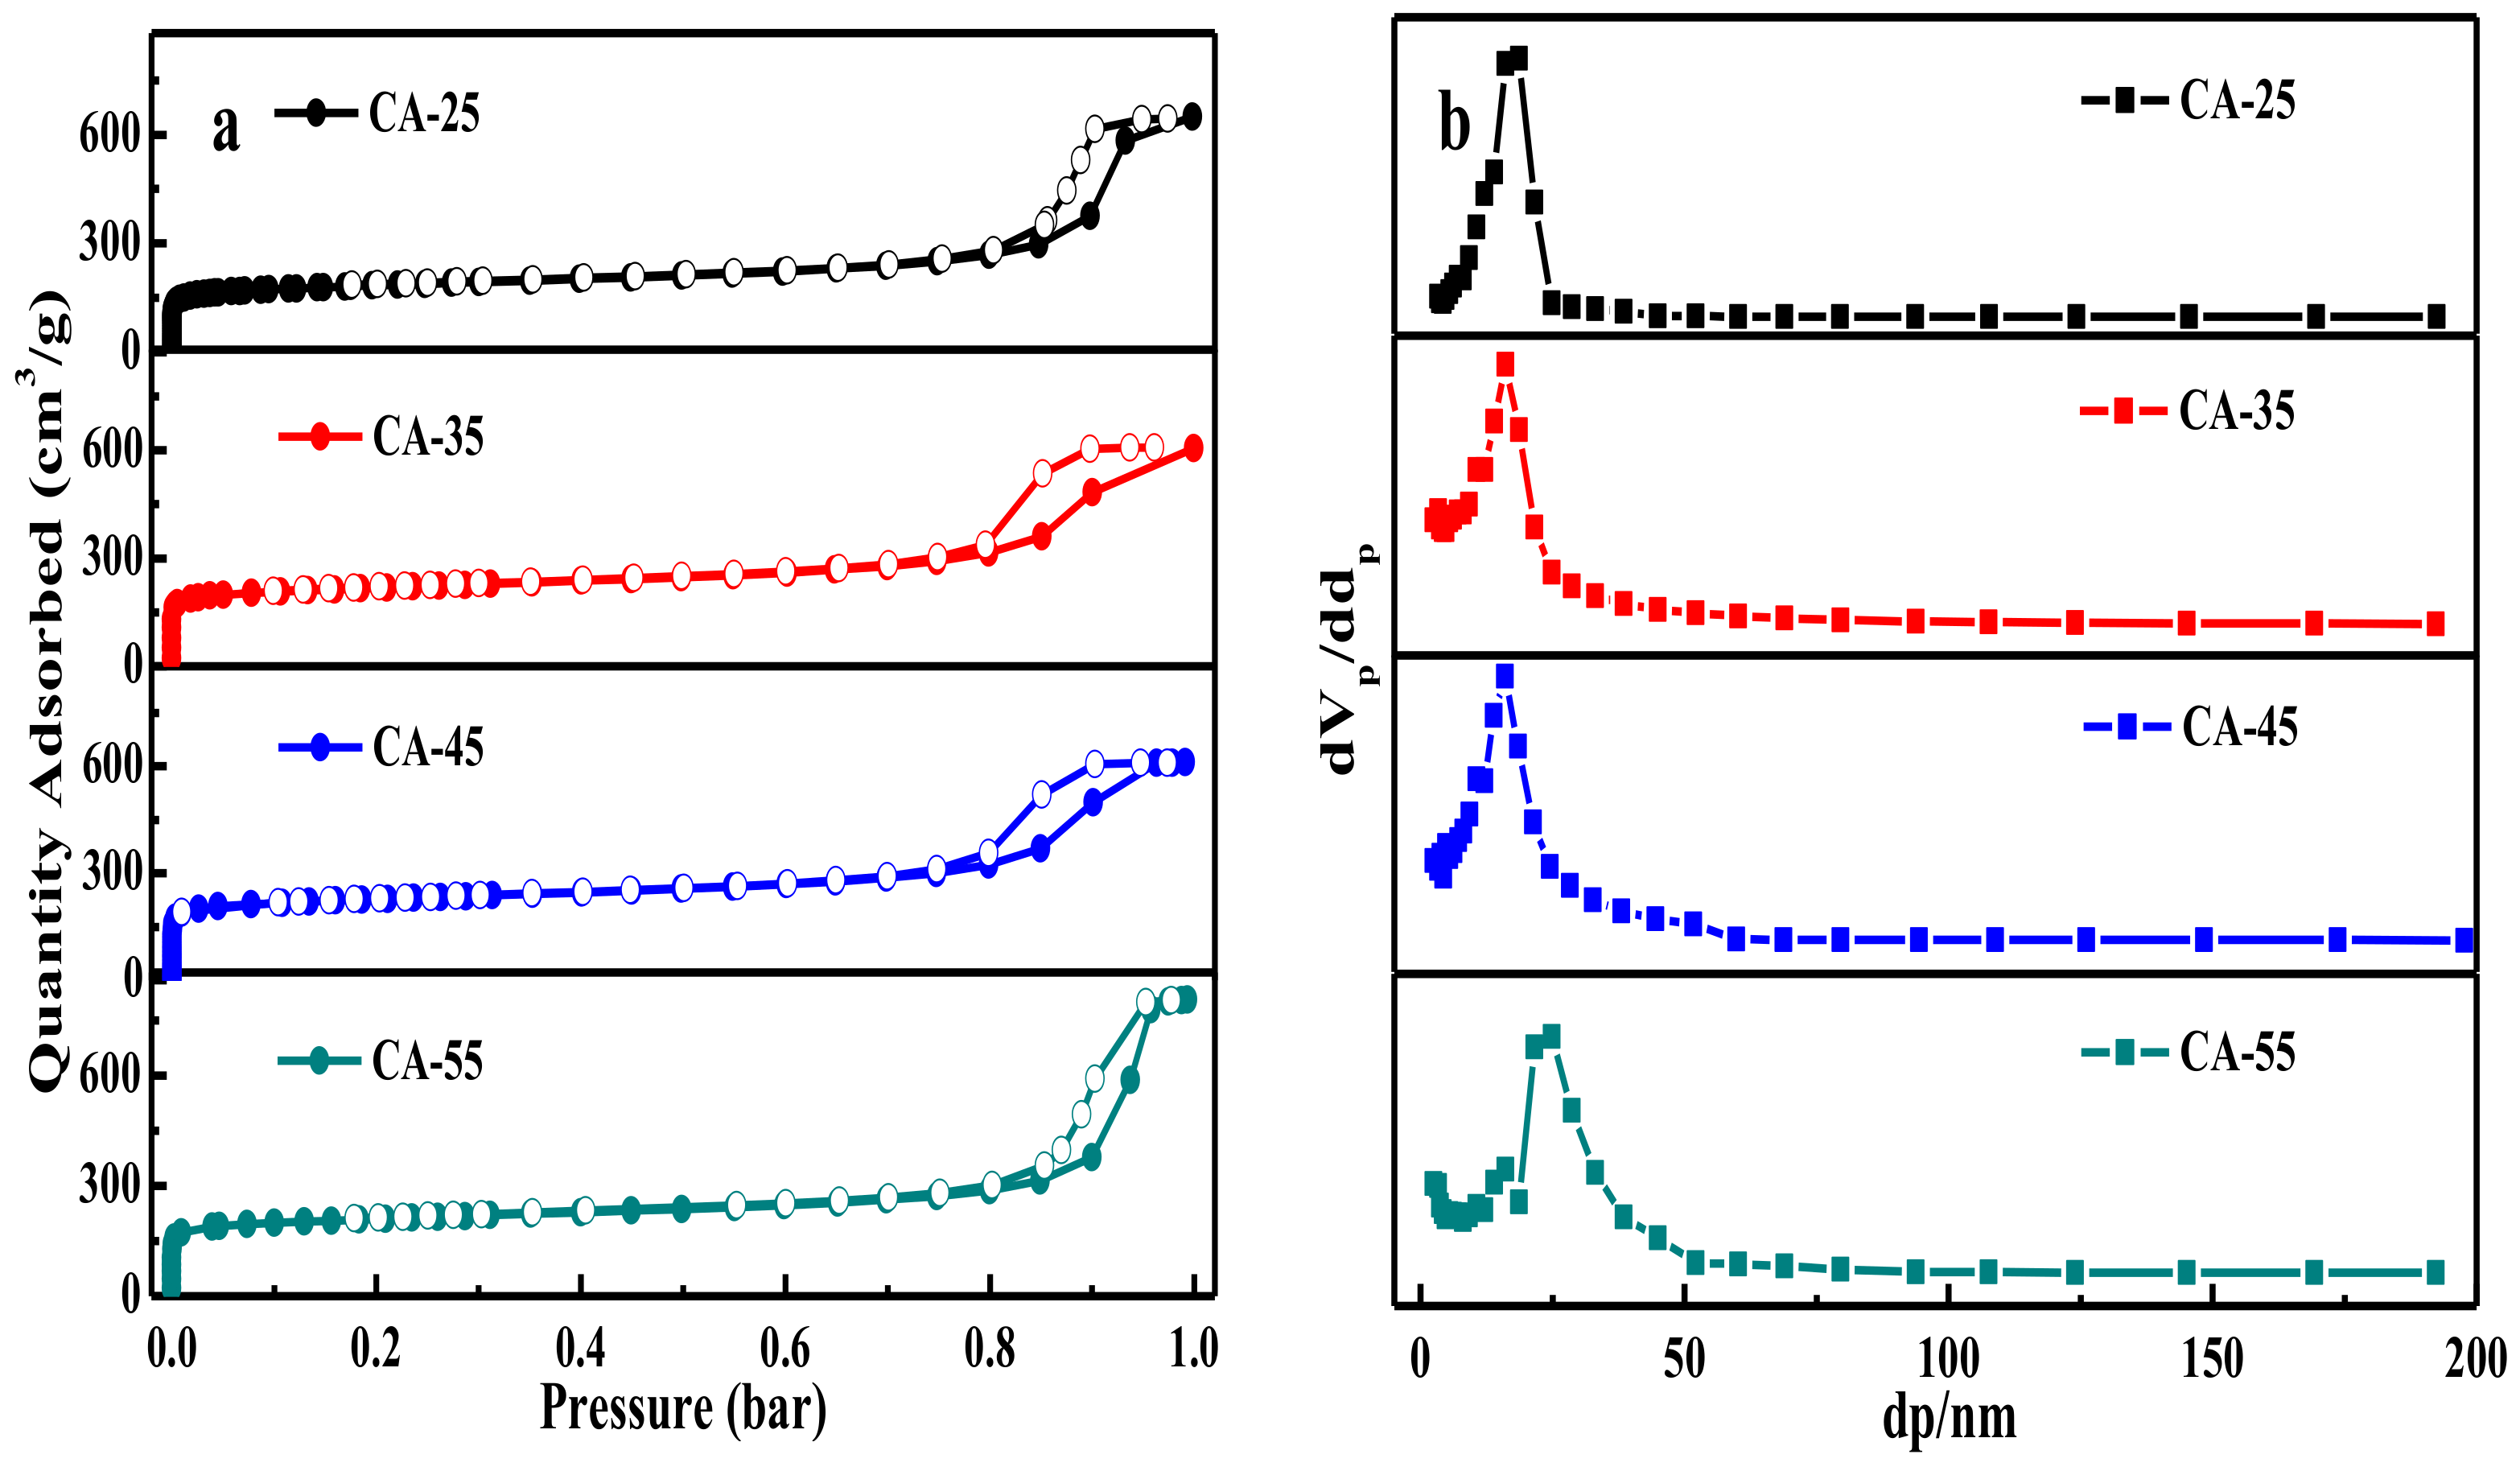
3.1.5. N2 Adsorption/Desorption Analysis

N2 adsorption/desorption isotherms and BJH pore distribution curves of carbon aerogels were exhibited in Figure 5. As shown in Figure 5a, all materials displayed the typical IV-type isotherm with obvious type H2 hysteresis loop at P/P0 range of 0.8~0.9, indicating the existence of slit pore structures inside the materials [25,32]. It can be indicated that the mesoporous structure of the material was formed by the agglomeration of the nanoparticle building blocks, which was previously confirmed by the SEM observation.
In addition, the textural parameters of samples were listed in Table 1. From the below table, it can be concluded that the CA-45 sample had a specific surface area of 848 m2/g and total pore volume of 0.95 cm3/g. To be specific, the surface area and the ratio of Vmicro/Vtol firstly enlarged with the increase of the solution concentration, which was probably as the result of the comparatively large pore disappearing that occurred upon the reduction of the water. It was confirmed that the surface area and the ratio of Vmicro/Vtol decreased as the solution concentration further rising, which was possibly that hypo-water usage was bad for the formation of micropore causing by dispersion of water. Furthermore, the BJH pore distribution exhibited the opposite rule due to the same reason.

3.2. CO2 Adsorption

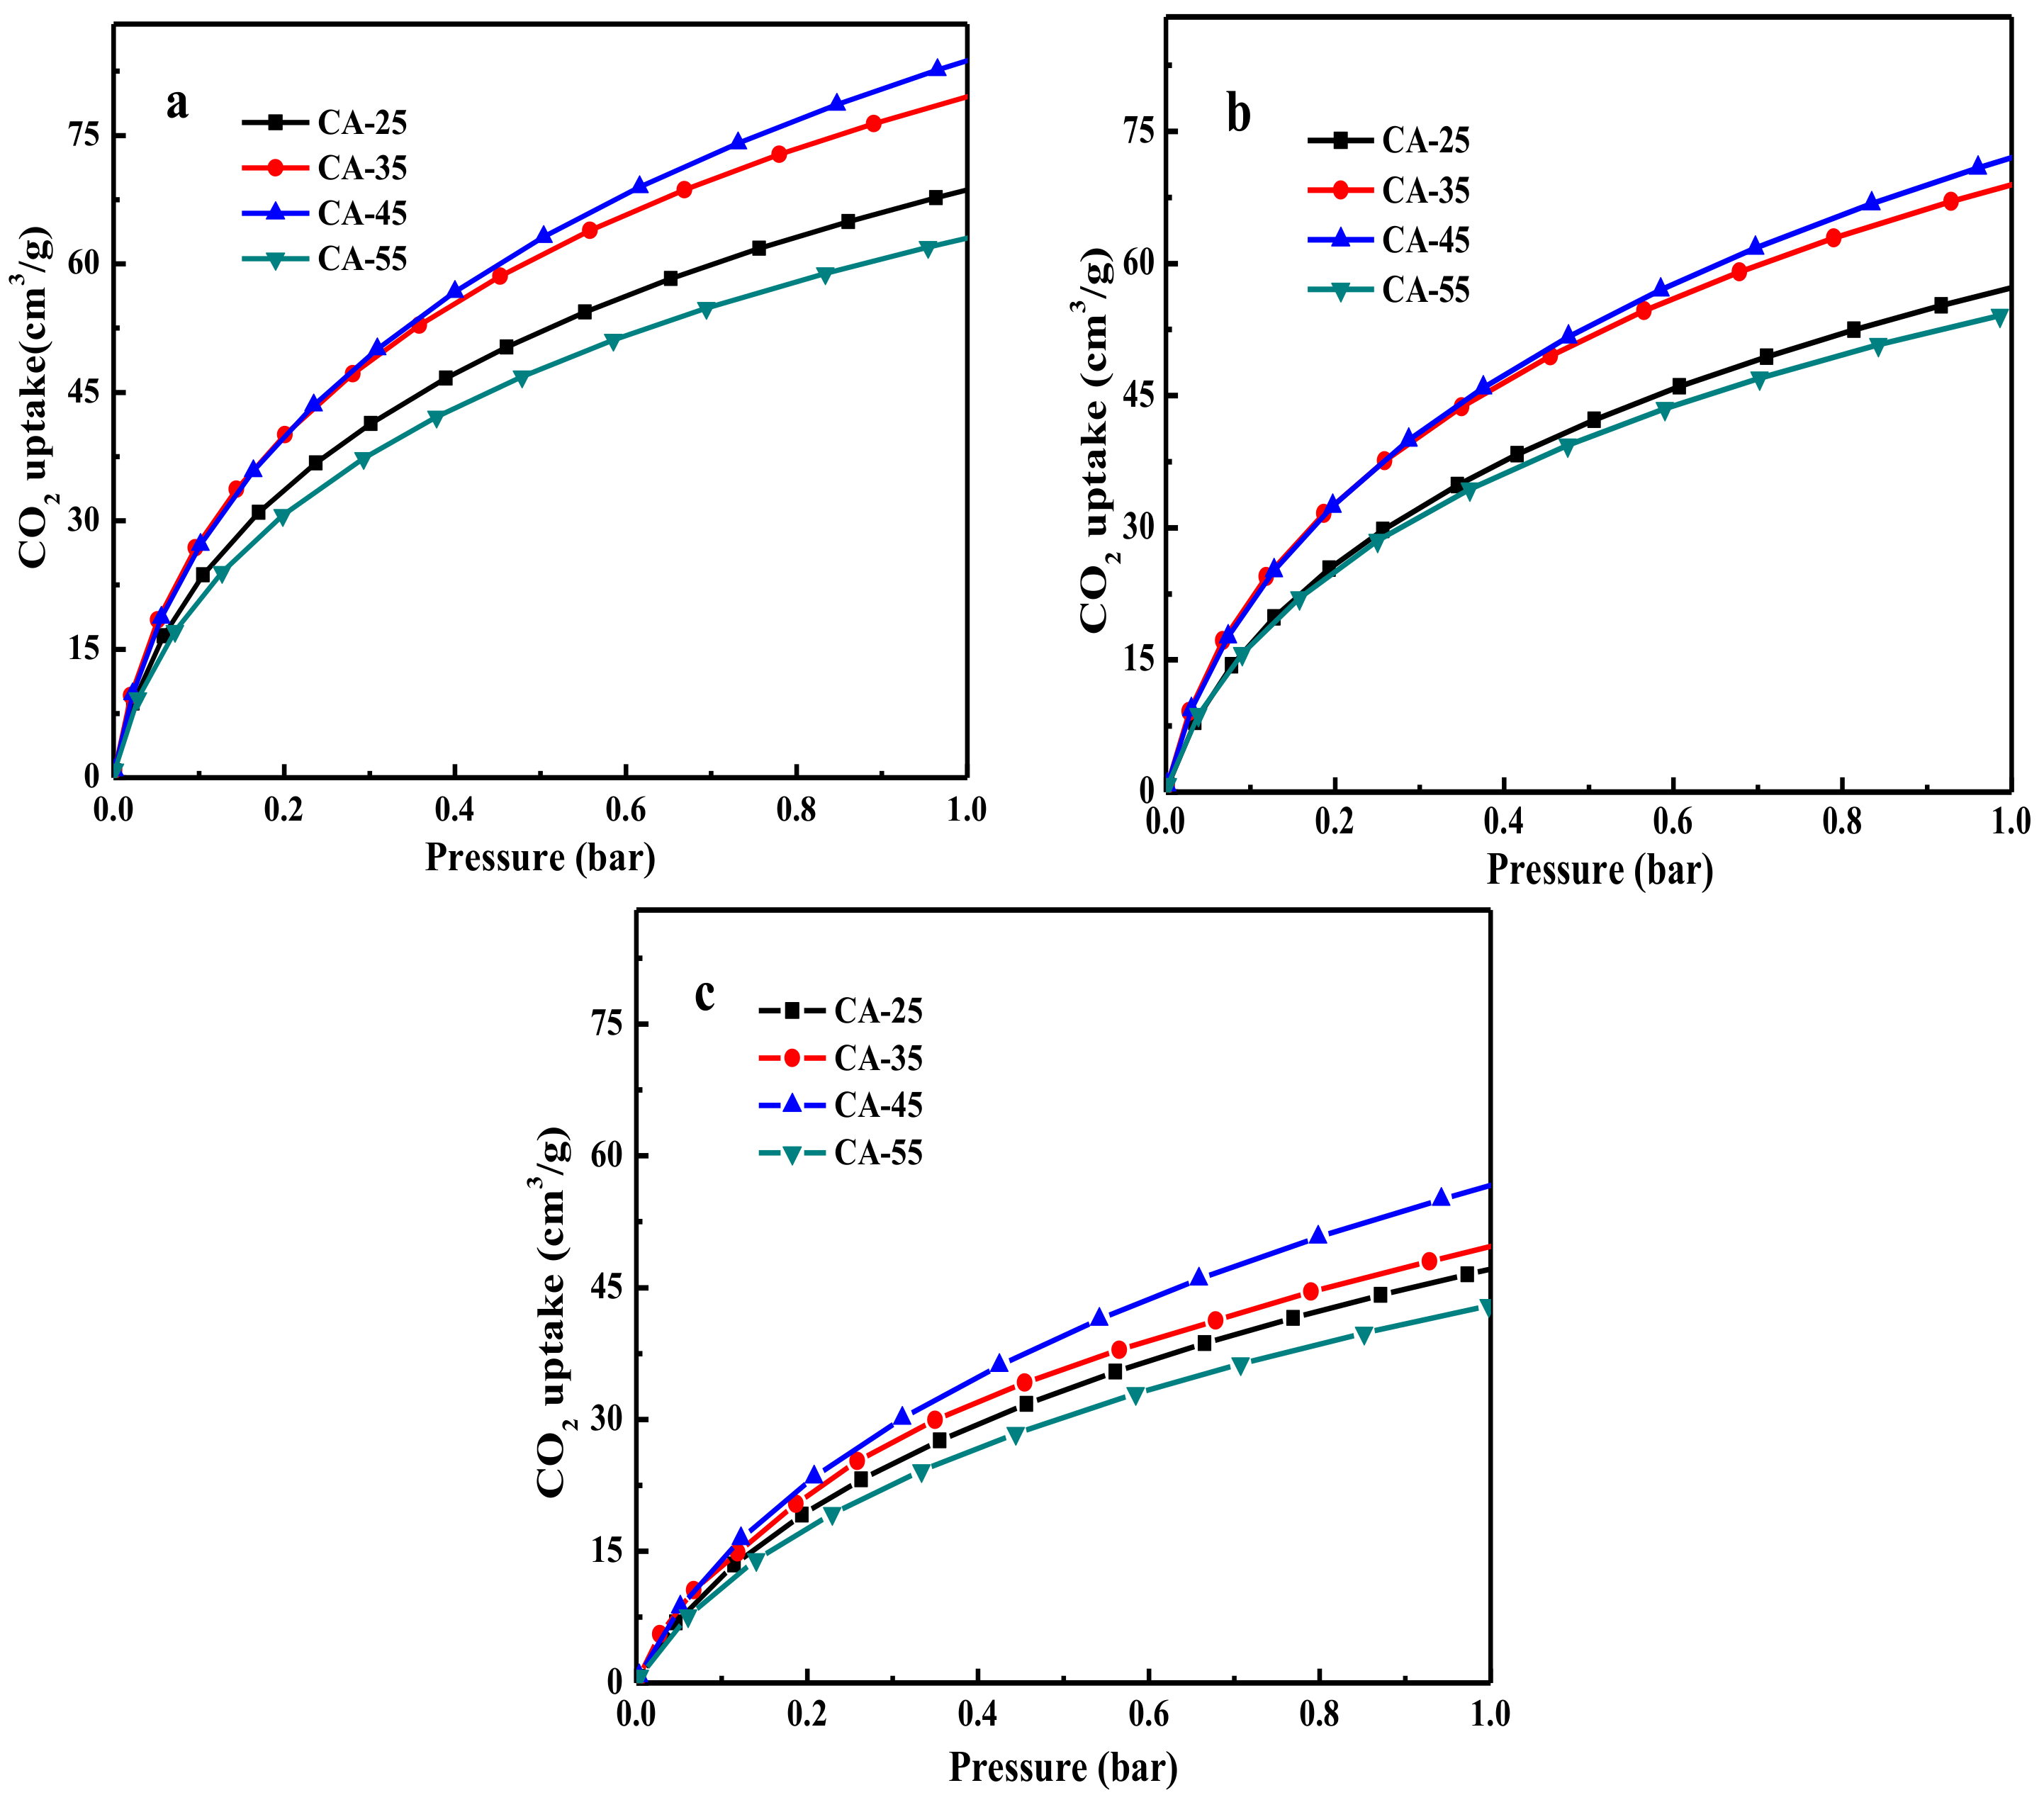
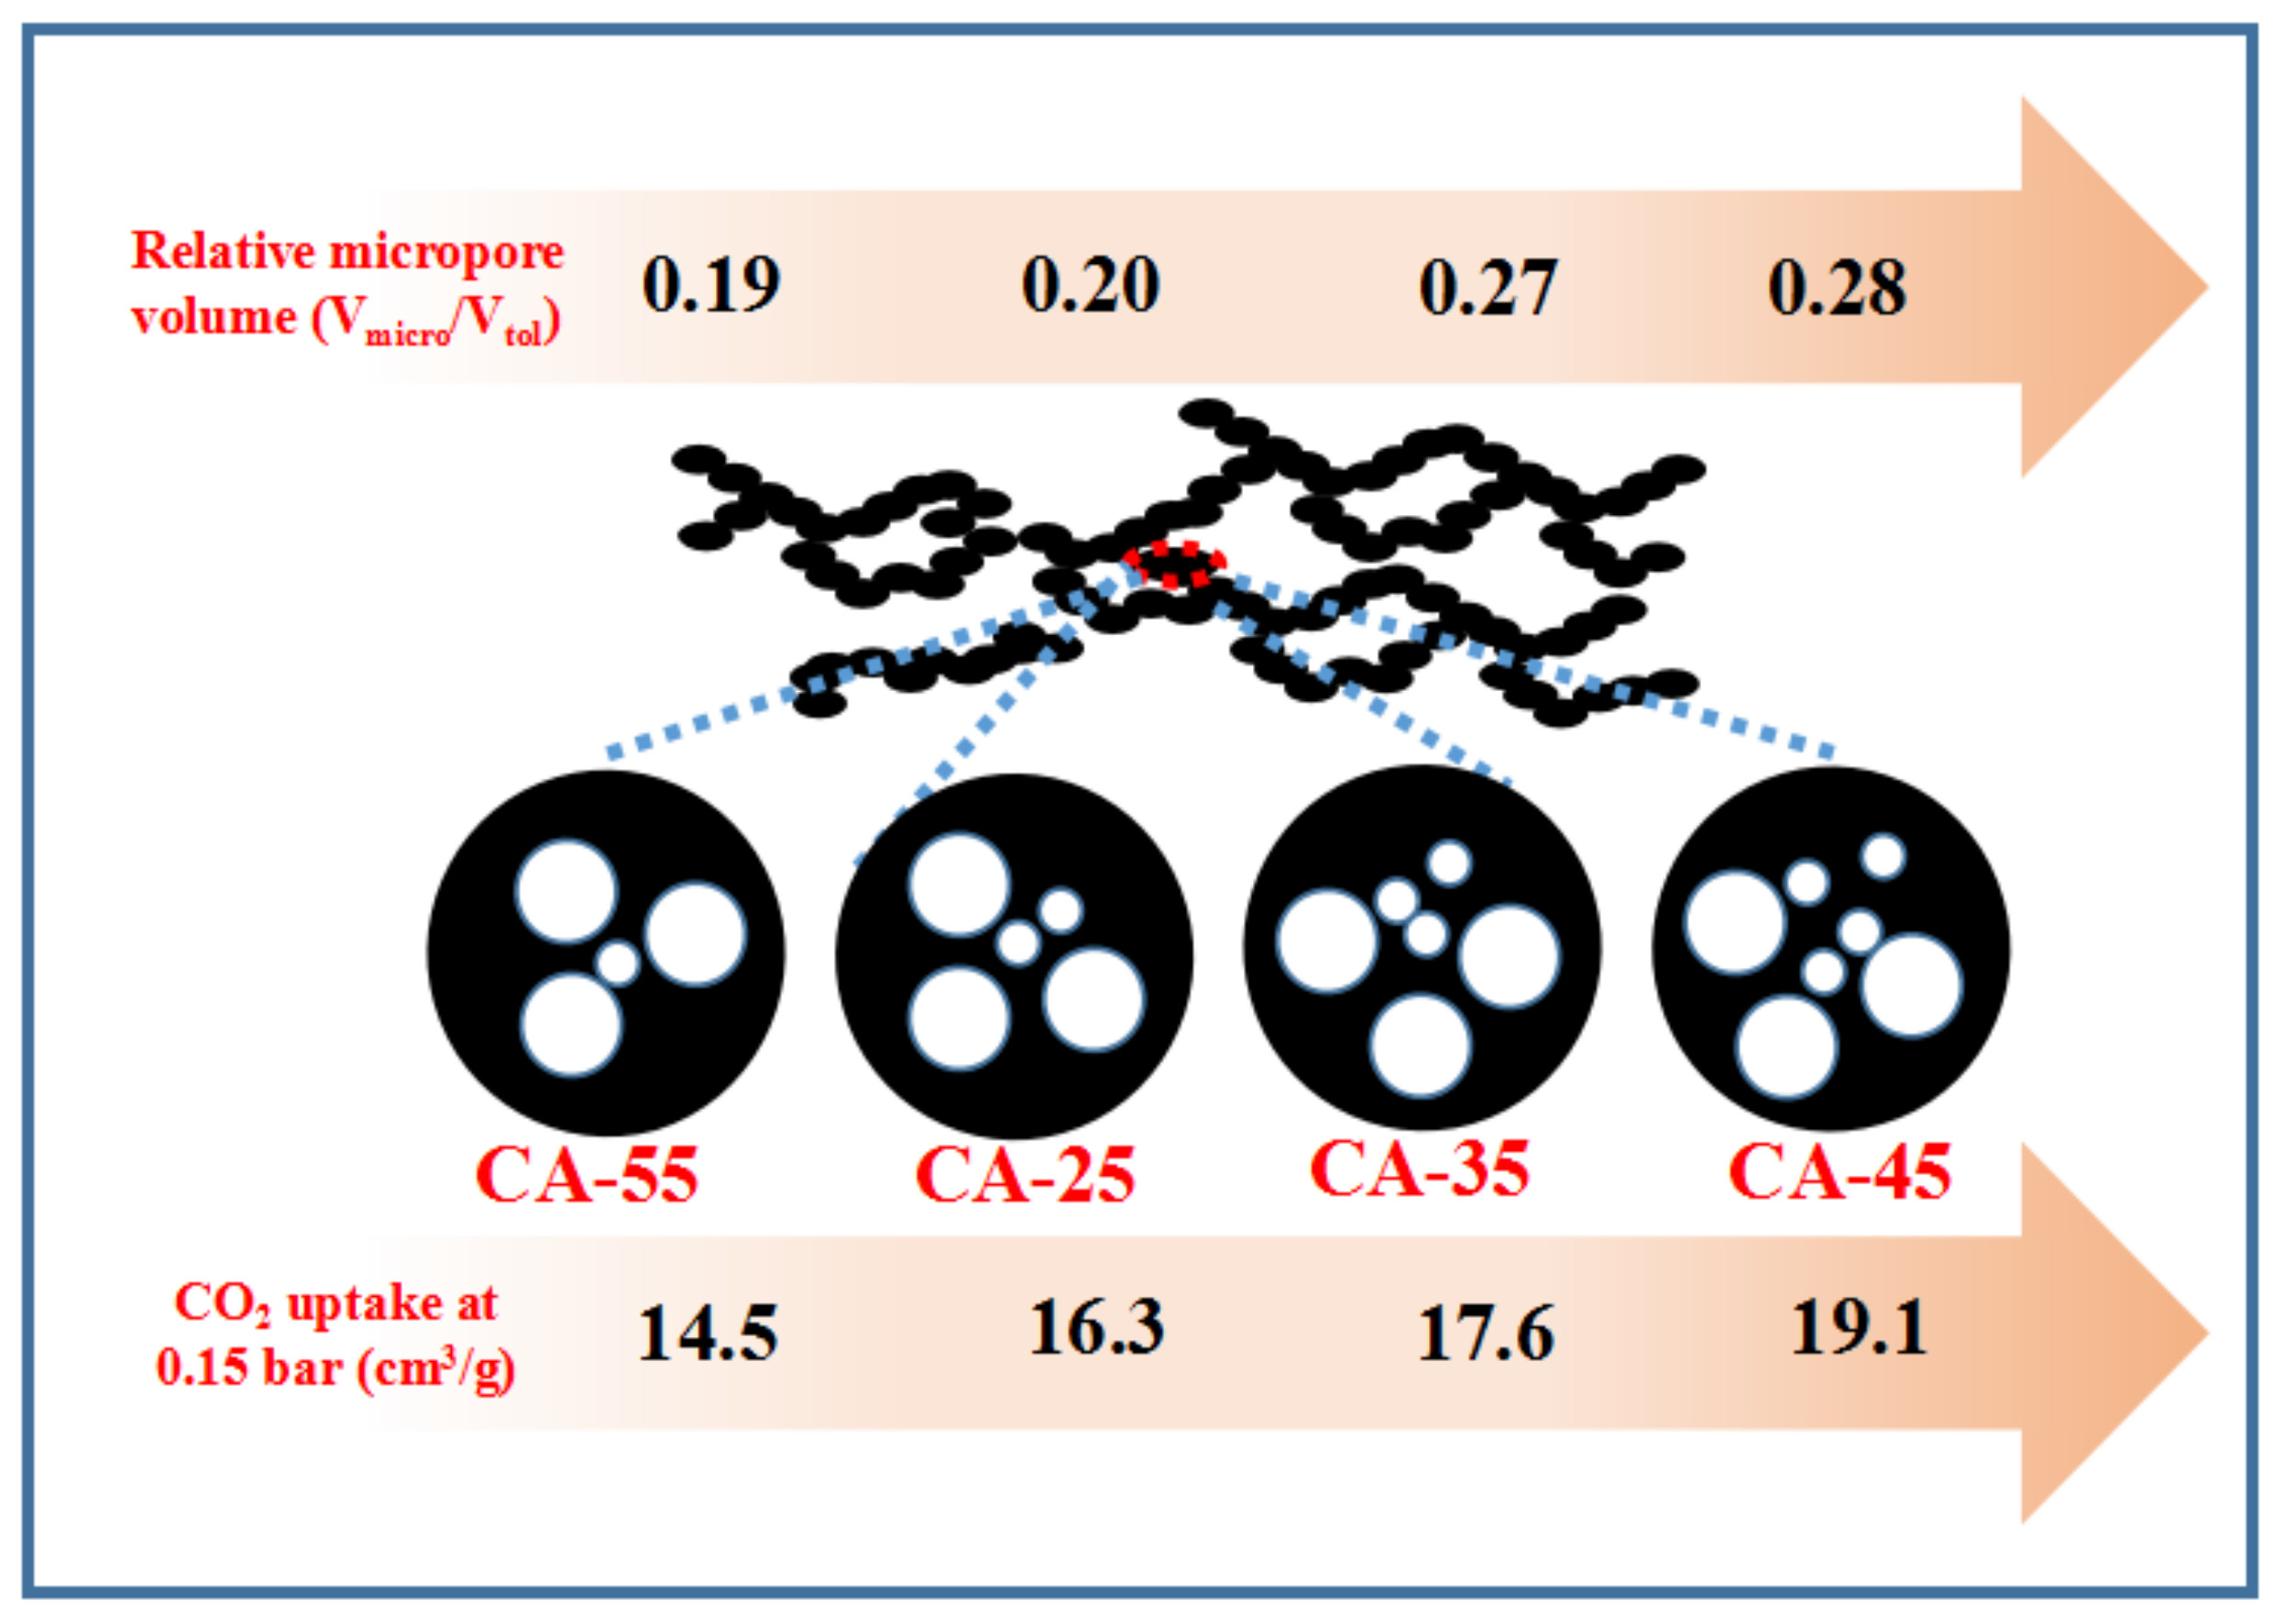
3.2.1. CO2 Adsorption Capacity

Figure 6 displays the CO2 adsorption isotherms for carbon aerogels at 0, 12.5 and 25 °C, which showed the static adsorption of the materials at different pressure. As shown in Figure 6, we can find that the adsorption isotherms of CO2 at 12.5 and 25 °C for carbon aerogels follow the same law compared to adsorption isotherm at 0 °C. These adsorption isotherms can be well confirmed by the parameters of Langmuir model. Then these parameters were listed in Tables S1–S4 at the supporting information. It was worth noting that the CO2 uptake over carbon aerogels was greatly enhanced as the pressure increasing. CO2 uptake shows the opposite result along with the temperature increasing. With the increase of the solution concentration, the CO2 uptake firstly increased from 68.5 cm3/g (CA-25 sample) to 83.7 cm3/g (CA-45 sample), then the CO2 uptake over CA-55 sample sharply decreased to 62.7 cm3/g. On the basis of the aforementioned results, especially pore structure, CA-45 sample exhibited the highest surface area and ratio of Vmicro/Vtol, which was beneficial to CO2 capture. The adsorption capacities of carbon aerogels had a good correspondence with their surface area, pore volume and pore size. It was worth noting that the CO2 adsorption capacity of CA-45 sample was the highest under the test pressure. The increasing trend of CO2 uptake over carbon aerogels was more obvious at lower relative pressure, which was related to the existence of micropores over the adsorbent. As is well-known that micropores can enhance the contact possibility between CO2 and the pore walls. While the existence of abundant mesopores will provide low-resistant pathways for CO2 through the porous material, which was beneficial to enhance the adsorption performance of the material at higher relative pressure. So the proper value of Vmicro/Vtol, which was defined to weight the value of micropores and mesopores, can improve the CO2 adsorption performance.

3.2.2. Isosteric Heat of Adsorption for CO2

The estimated isosteric heat of adsorption for CO2 over carbon aerogels was listed at the Table 2. In order to understand the adsorbate–adsorbent interaction, the isosteric heat of adsorption (Qst) was calculated by using the Clausius–Clapeyron equation from the adsorption isotherms collected at 0, 12.5 and 25 °C. As displayed in Table 2, the values of adsorption heat were near 25 kJ/mol, indicating that CO2 adsorption over carbon aerogels was mainly based on physical adsorption caused by the channels function. This result was confirmed by the outcomes of Raman which indicated that the change of solution concentration had a little effect on the surface defects. Besides, the low Qst value was consistent with FTIR analysis which exhibited that changes of concentration can’t lead to the variation of surface functional groups. In addition, the relatively low isosteric heat of adsorption for CO2 over the samples had an advantage of low renewable energy consumption.

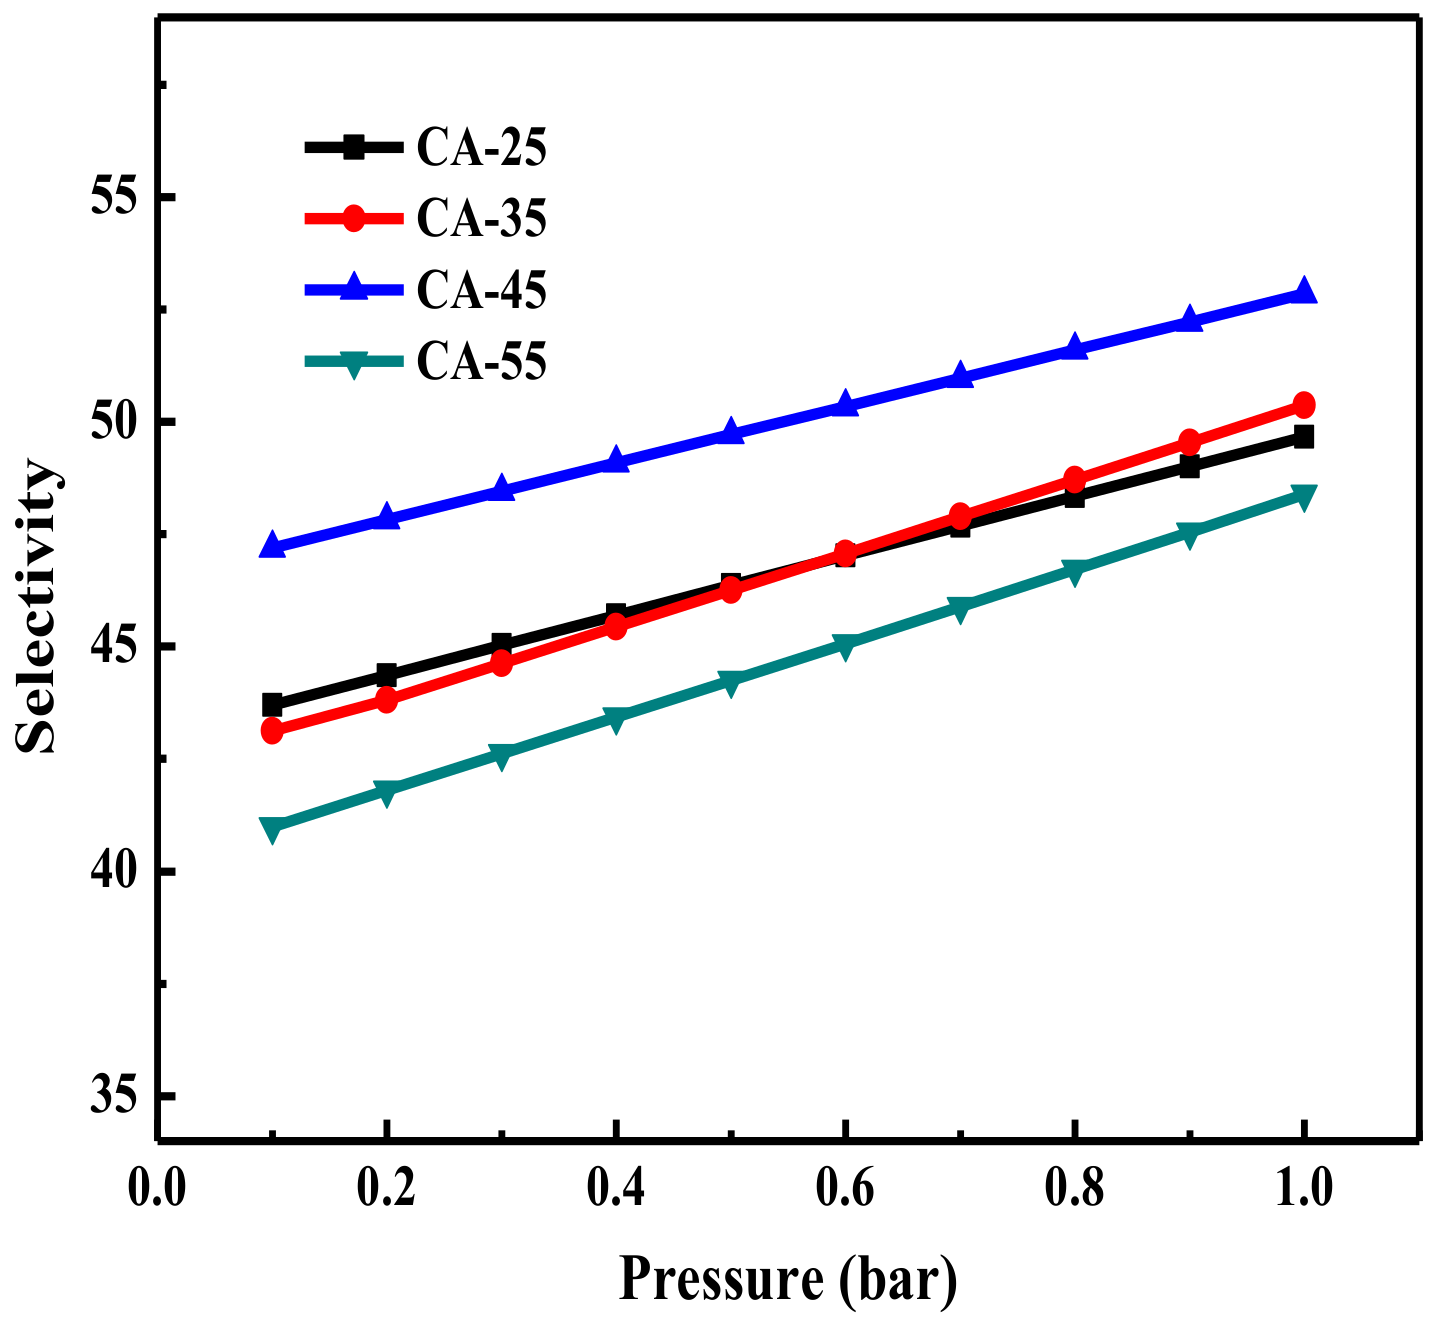
3.2.3. CO2 Adsorption Selectivity

In order to further understand the relationship between structure and CO2 performance, the adsorption isotherms of N2 and CO2 were measured at 0 °C as shown in Figure S1. All carbon aerogels showed the high uptake of CO2, and N2 uptake was barely adsorbed at 0 °C. For example, the N2 uptake on CA-45 sample was just 13.8 cm3/g at 0 °C and 1 bar, which was much lower than the uptake of CO2 (83.7 cm3/g). Similar results were also observed on other carbon aerogels. The adsorption selectivity of CO2/N2 was calculated by IAST which has been widely used to predict adsorption selectivity of gas mixtures. In the calculation, the ratio of CO2/N2 in volume was 15%/85%, which is the typical component of flue gases. Fitting parameters of Langmuir model were listed in Tables S1–S4 at the Supporting Information, and the IAST selectivity results were shown in Figure 7. We can see that the IAST selectivity of CO2/N2 over carbon aerogels increased with the pressure rising, which was mainly caused by the effect of active adsorption sites on micro- and mesopores. To be specific, the CA-45 sample kept relatively high adsorption selectivity compared to other samples because of the highest relative micropore volume (determined by Vmicro/Vtol) and surface area. At a relatively low pressure, the adsorption potential of the mesopore was much lower than that of the micropore. When the pore size of the micropore was close to the size of adsorbate molecules (CO2 at 0.33 nm and N2 at 0.364 nm), which caused that CO2 molecules were easier to enter micropores compared to N2. The selectivity of CO2/N2 on CA-55 sample was 48 at 1 bar, which was the lowest among all samples because that the presence of abundant mesopores provided more adsorbed space to the N2.

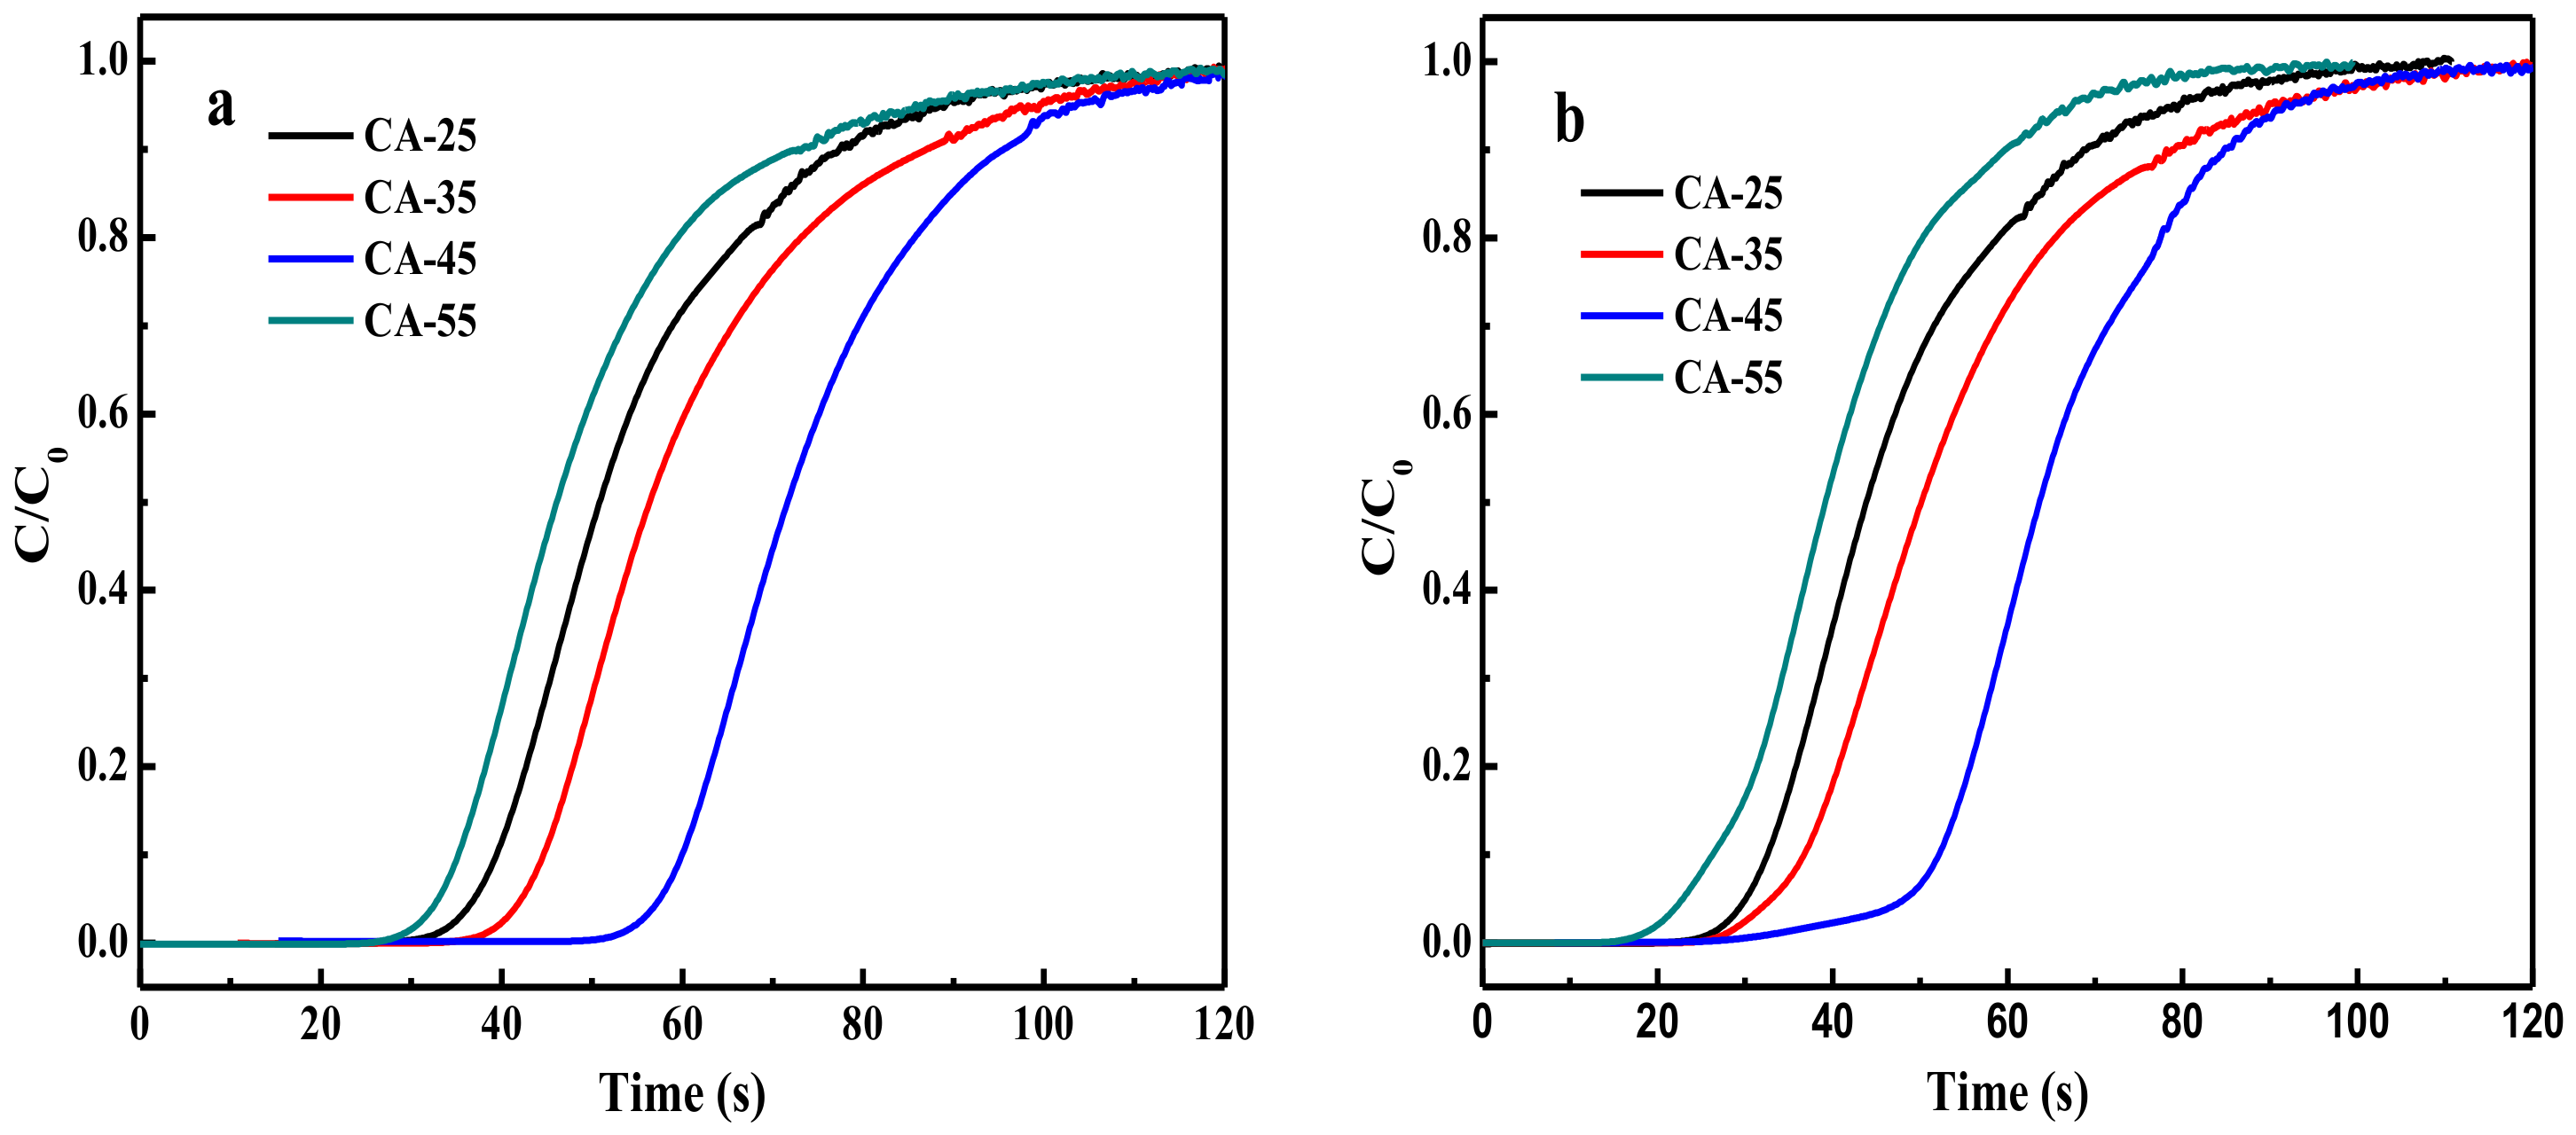
3.2.4. Water-Resistant Experiment

In order to test the adsorption performance of the materials in flue gases and considering that the flue gases were still warm after CO2 scrubbing (~50 °C), the CO2 breakthrough curves of all samples were measured at 50 °C in the presence of 15 vol% CO2 as shown in Figure 8a. The adsorption capacities of carbon aerogels were listed in Table 2. In the table, we can see that the CO2 adsorption capacity of CA-45 sample was 18.5 cm3/g, respectively. As the flue gases always contain water vapor, it was important to evaluate the effect of moisture on CO2 adsorption performance over the current adsorbents [33]. All samples were also selected to research the effect of water vapor (13.74%) on CO2 uptake at 50 °C in the CO2/N2 (15%/85% in volume) mixture to investigate the water-resistant performance of these materials, which was shown in the Figure 8b. Typical CO2 breakthrough curves in the presence of dry and humid gas feed showed that the water vapor had a negative effect on the CO2 adsorption for carbon aerogels. As discussed previously, there was no obvious variation of the adsorption capacity and adsorption rate in the presence of water vapor compared to adsorption behavior on dry gas feed. This is probably attributed to the appropriate relative micropore volume adjusted by managing solution concentration, which was contributed to the fast pathways for CO2 through the porous network at the presence of water vapor.

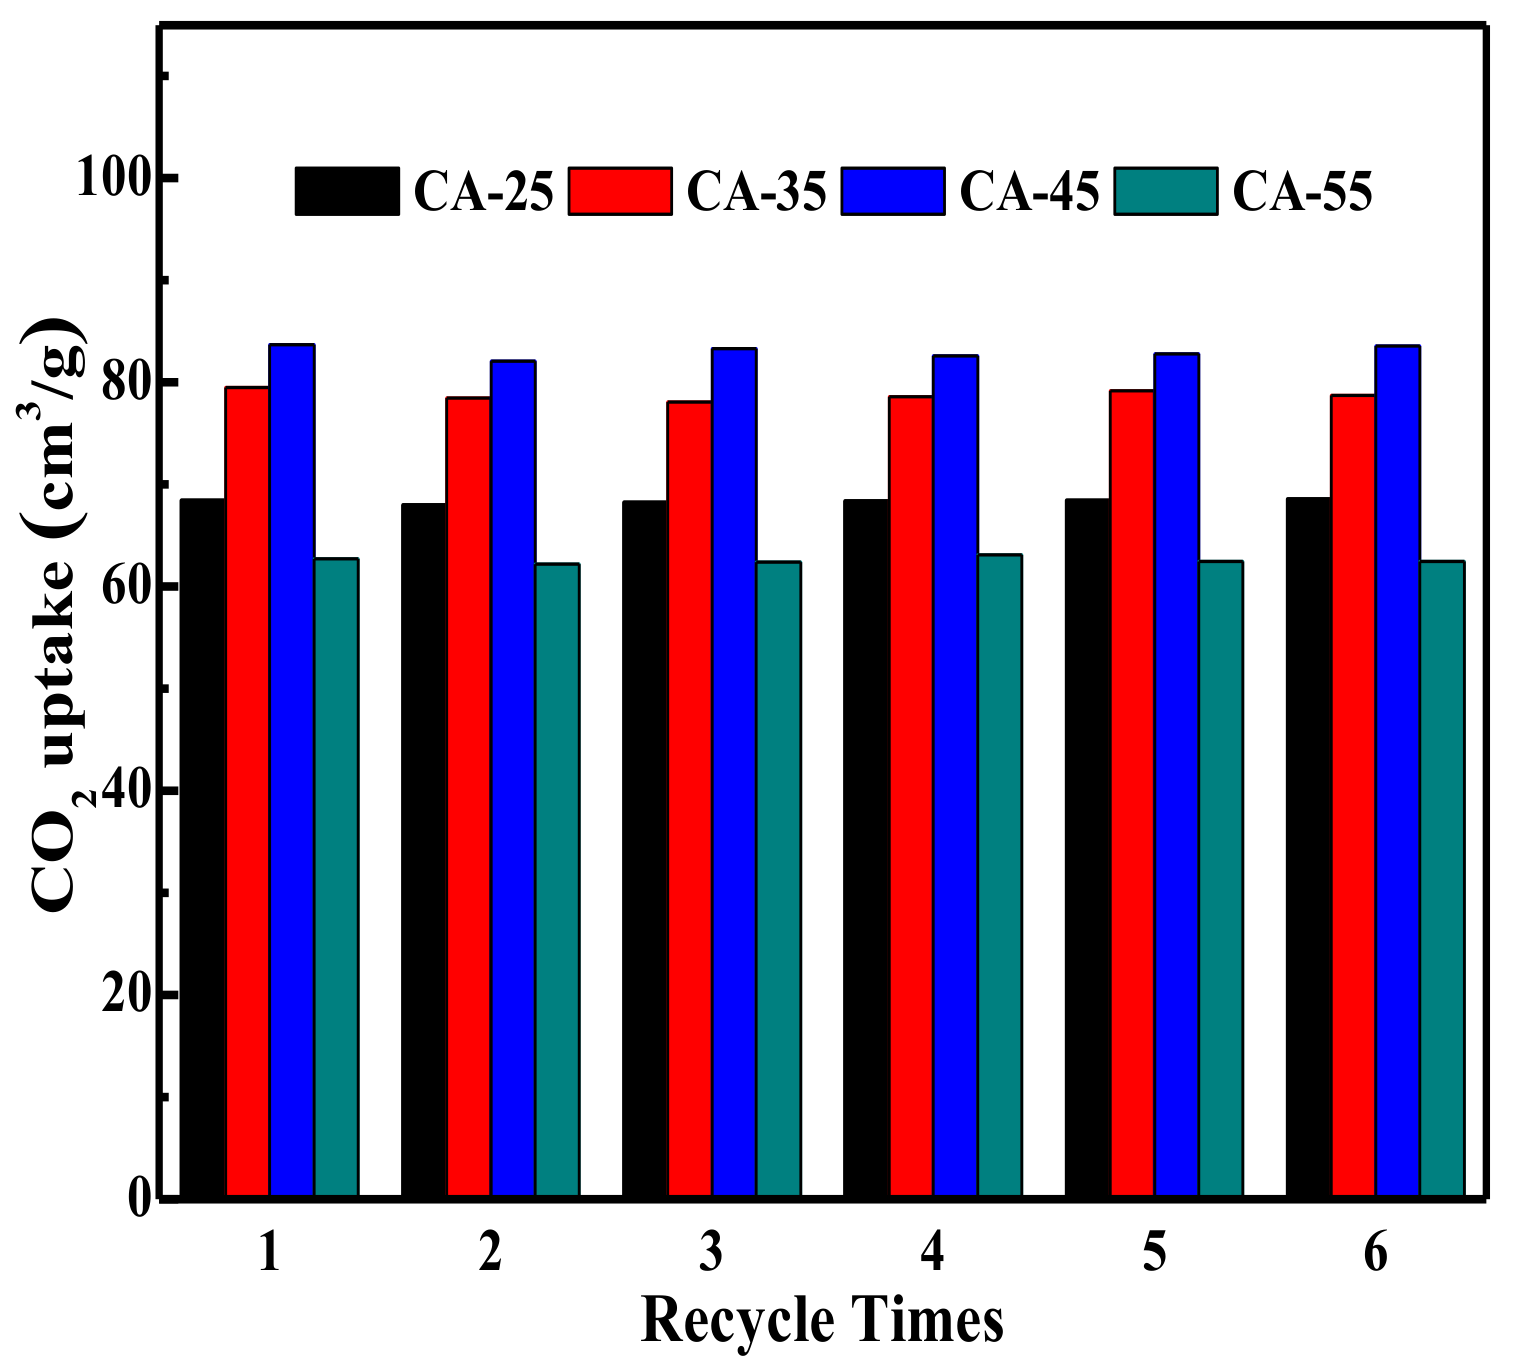
3.2.5. Adsorbent Stability

Taking account into the practical industrial application, the recyclability of adsorbent is of great significance. Figure 9 summarizes the CO2 adsorption capacity at 0 °C and recycle times for the entire sorbents. After each adsorption cycle, quite mild conditions (vacuum, 100 °C and 30 min) were executed for the regeneration. No obvious loss of CO2 adsorption capacity (less than 1%) on samples took place after several cycles. These sorbents were very stable and exhibited outstanding CO2 adsorption capacities for 6 cycles, which suggests that carbon aerogel is a stable and promising adsorbent for CO2 capture [34]. Excellent recyclability of carbon aerogels should be ascribed to the proper relative micropore volume, which provides a relative loose pathway for CO2 adsorption.

4. Conclusions

In this research, we prepared a series of carbon aerogels synthesized by polycondensation of resorcinol and formaldehyde by managing solution concentration. It was found that the pore structure and morphology of carbon aerogels were influenced by the solution concentration of their precursors. The relative micropore volume (determined by the ratio of Vmicro/Vtol) of carbon aerogels was effectively regulated. With the solution concentration increasing, we interestingly found that the particle size decreased and the relative micropore volume was first increasing and then decreasing. The CA-45 sample had the largest relative micropore volume, which shows the optimum adsorption capacity of CO2 and selectivity of CO2/N2. At the same time, the phase structure, surface defects and functional groups of carbon aerogels have no obvious difference with the change of solution concentration. The CA-45 sample exhibited the highest CO2 adsorption capacity up to 83.71 cm3/g and highest selectivity of CO2/N2 (15%/85% in volume) (53) at 1 bar, respectively. Moreover, all samples can be completely regenerated under mild conditions, and little loss of CO2 adsorption capacity was detected after six cycles, showing excellent adsorbent stability.

Supplementary Materials

The following are available online at https://www.mdpi.com/2227-9717/6/4/35/s1, Figure S1: Adsorption isotherms of CO2 and N2 over all samples at 0 °C, Tables S1–S4: Fitting parameters derived from isotherms of all samples.

Acknowledgments

This work was supported by National Natural Science Foundation of China (Grant Nos. 21606130, 21306089), the State Key Laboratory of Materials-Oriented Chemical Engineering (Grant ZK201610, ZK201703), and the Priority Academic Program Development of Jiangsu Higher Education Institutions (PAPD).

Author Contributions

Q.L., X.Q. and P.H. conceived and designed these experiments; P.H. and X.Q. performed the experiments and analyzed the data; P.H., X.Q. and Q.L. wrote the paper; Z.F., Z.Z., X.C., J.T., and M.C. supervised the process of experiments and paper.

Conflicts of Interest

The authors declare no conflict of interest.

Appendix A

The well-known IAST has been extensively reviewed in literature [35] and hence only the working equations will be given here. The theory assumes that the adsorbed phase is an ideal solution of the adsorbed components and the reduced spreading pressure ( π i ) of all the components in the mixture in their standard states is equal to the reduced spreading pressure of the adsorbed mixture ( π ). Thus,
π 1 = π 1 = = π n = π
The reduced spreading pressure of each component is computed from Gibb’s adsorption isotherm as follows:
π i = π i A R T 0 P i 0 q i P i d P
Bring Equation (A3) into Equation (1), we can obtain the DL-IAST model. When the gas mixtures achieve balance, the spreading pressures of component i and j are equal. Thus,
q c i ln ( 1 + k c i y i P t x i ) q c j ln [ 1 + k c j ( 1 y i ) P t 1 x i ] = 0
where qc, and kc, are the Langmiur model parameters with the subscripts c denoting the channels, respectively. Pt is the system pressure, and q is the adsorption amount. What’s more, xi and yi are the molar fractions of component i in the adsorbed and bulk phases.
The ideal adsorption solution theory (IAST) has been reported for predicting binary gas mixture adsorption in solid adsorbent. The selectivity of xi over xj has been defined according to Equation (A4). Thus,
S = ( x i / y i ) ( x j / y j )
The adsorbed-phase mole fraction of the different components are related to those of the gas phase by the Raoult’s law for ideal solutions, analogous to vapor-liquid systems:
P y i = P i 0 ( π ) x i
With the constraint that
y i + y j = 1 x i + x j = 1
So, the selectivity of CO2/N2 can be calculated as long as the yi is known.

References

  1. Haszeldine, R.S. Carbon Capture and Storage: How Green Can Black Be? Science 2009, 325, 1647–1652. [Google Scholar] [CrossRef] [PubMed]
  2. Boot-Handford, M.E.; Abanades, J.C.; Anthony, E.J.; Blunt, M.J.; Brandani, S.; Mac Dowell, N.; Fernandez, J.R.; Ferrari, M.C.; Gross, R.; Hallett, J.P.; et al. Carbon capture and storage update. Energy Environ. Sci. 2014, 7, 130–189. [Google Scholar] [CrossRef]
  3. Leimbrink, M.; Nikoleit, K.G.; Spitzer, R.; Salmon, S.; Bucholz, T.; Gorak, A.; Skiborowski, M. Enzymatic reactive absorption of CO2 in MDEA by means of an innovative biocatalyst delivery system. Chem. Eng. J. 2018, 334, 1195–1205. [Google Scholar] [CrossRef]
  4. Lu, J.G.; Ge, H.; Chen, Y.; Ren, R.T.; Xu, Y.; Zhao, Y.X.; Zhao, X.; Qian, H. CO2 capture using a functional protic ionic liquid by membrane absorption. J. Energy Inst. 2017, 90, 933–940. [Google Scholar] [CrossRef]
  5. Puthiaraj, P.; Lee, Y.R.; Ahn, W.S. Microporous amine-functionalized aromatic polymers and their carbonized products for CO2 adsorption. Chem. Eng. J. 2017, 319, 65–74. [Google Scholar] [CrossRef]
  6. Pires, J.C.M.; Martins, F.G.; Alvim-Ferraz, M.C.M.; Simoes, M. Recent developments on carbon capture and storage: An overview. Chem. Eng. Res. Des. 2011, 89, 1446–1460. [Google Scholar] [CrossRef]
  7. Merkel, T.C.; Lin, H.Q.; Wei, X.T.; Baker, R. Power plant post-combustion carbon dioxide capture: An opportunity for membranes. J. Membr. Sci. 2010, 359, 126–139. [Google Scholar] [CrossRef]
  8. Younas, M.; Sohail, M.; Kong, L.L.; Bashir, M.J.; Sethupathi, S. Feasibility of CO2 adsorption by solid adsorbents: A review on low-temperature systems. Int. J. Environ. Sci. Technol. 2016, 13, 1839–1860. [Google Scholar] [CrossRef]
  9. Rashidi, N.A.; Yusup, S. An overview of activated carbons utilization for the post-combustion carbon dioxide capture. J. CO2 Util. 2016, 13, 1–16. [Google Scholar] [CrossRef]
  10. Wu, X.B.; Wu, D.C.; Fu, R.W. Studies on the adsorption of reactive brilliant red X-3B dye on organic and carbon aerogels. J. Hazard. Mater. 2007, 147, 1028–1036. [Google Scholar] [CrossRef] [PubMed]
  11. Liu, Q.; He, P.P.; Qian, X.C.; Fei, Z.Y.; Zhang, Z.X.; Chen, X.; Tang, J.H.; Cui, M.F.; Qiao, X. Carbon Aerogels Synthesizd with Cetyltrimethyl Ammonium Bromide (CTAB) as a Catalyst and its Application for CO2 Capture. Z. Anorg. Allg. Chem. 2017, 644, 155–160. [Google Scholar] [CrossRef]
  12. Jeon, D.H.; Min, B.G.; Oh, J.G.; Nah, C.; Park, S.J. Influence of Nitrogen moieties on CO2 capture of Carbon Aerogel. Carbon Lett. 2015, 16, 57–61. [Google Scholar] [CrossRef]
  13. Kong, Y.; Jiang, G.D.; Wu, Y.; Cui, S.; Shen, X.D. Amine hybrid aerogel for high-efficiency CO2 capture: Effect of amine loading and CO2 concentration. Chem. Eng. J. 2016, 306, 362–368. [Google Scholar] [CrossRef]
  14. Alhwaige, A.A.; Ishida, H.; Qutubuddin, S. Carbon Aerogels with Excellent CO2 Adsorption Capacity Synthesized from Clay-Reinforced Biobased Chitosan-Polybenzoxazine Nanocomposites. ACS Sustain. Chem. Eng. 2016, 4, 1286–1295. [Google Scholar] [CrossRef]
  15. Li, Z.N.; Gadipelli, S.; Yang, Y.C.; Guo, Z.X. Design of 3D Graphene-Oxide Spheres and Their Derived Hierarchical Porous Structures for High Performance Supercapacitors. Small 2017, 13. [Google Scholar] [CrossRef] [PubMed]
  16. Zhang, C.; He, Y.W.; Mu, P.; Wang, X.; He, Q.; Chen, Y.; Zeng, J.H.; Wang, F.; Xu, Y.H.; Jiang, J.X. Toward High Performance Thiophene-Containing Conjugated Microporous Polymer Anodes for Lithium-Ion Batteries through Structure Design. Adv. Funct. Mater. 2018, 28. [Google Scholar] [CrossRef]
  17. Ahmadi, H.; Lotfollahi-Yaghin, M.A. Stress concentration due to in-plane bending (IPB) loads in ring-stiffened tubular KT-joints of offshore structures: Parametric study and design formulation. Appl. Ocean Res. 2015, 51, 54–66. [Google Scholar] [CrossRef]
  18. Oh, T.H.; Oh, S.K.; Kim, H.; Lee, K.; Lee, J.M. Conceptual Design of an Energy-Efficient Process for Separating Aromatic Compounds from Naphtha with a High Concentration of Aromatic Compounds Using 4-Methyl-N-butylpyridinium Tetrafluoroborate Ionic Liquid. Ind. Eng. Chem. Res. 2017, 56, 7273–7284. [Google Scholar] [CrossRef]
  19. Zhang, S.Q.; Zhang, J.Y.; Deng, K.; Xie, J.L.; Duan, W.B.; Zeng, Q.D. Solution concentration controlled self-assembling structure with host-guest recognition at the liquid-solid interface. Phys. Chem. Chem. Phys. 2015, 17, 24462–24467. [Google Scholar] [CrossRef] [PubMed]
  20. Han, J.Q.; Zhou, C.J.; Wu, Y.Q.; Liu, F.Y.; Wu, Q.L. Self-Assembling Behavior of Cellulose Nanoparticles during Freeze-Drying: Effect of Suspension Concentration, Particle Size, Crystal Structure, and Surface Charge. Biomacromolecules 2013, 14, 1529–1540. [Google Scholar] [CrossRef] [PubMed]
  21. Volpe, S.; Cavella, S.; Masi, P.; Torrieri, E. Effect of solid concentration on structure and properties of chitosan-caseinate blend films. Food Packag. Shelf Life 2017, 13, 76–84. [Google Scholar] [CrossRef]
  22. Aegerter, M.A.; Leventis, N.; Koebel, M.M. Aerogels Handbook; Springer: New York, NY, USA, 2011; pp. 215–233. [Google Scholar]
  23. Far, H.M.; Donthula, S.; Taghvaee, T.; Saeed, A.M.; Garr, Z.; Sotiriou-Leventis, C.; Leventis, N. Air-oxidation of phenolic resin aerogels: Backbone reorganization, formation of ring-fused pyrylium cations, and the effect on microporous carbons with enhanced surface areas. RSC Adv. 2017, 7, 51104–51120. [Google Scholar] [CrossRef]
  24. Li, C.F.; Yang, X.Q.; Zhang, G.Q. Mesopore-dominant activated carbon aerogels with high surface area for electric double-layer capacitor application. Mater. Lett. 2015, 161, 538–541. [Google Scholar] [CrossRef]
  25. Kou, J.H.; Sun, L.B. Nitrogen-Doped Porous Carbons Derived from Carbonization of a Nitrogen-Containing Polymer: Efficient Adsorbents for Selective CO2 Capture. Ind. Eng. Chem. Res. 2016, 55, 10916–10925. [Google Scholar] [CrossRef]
  26. Liu, Q.; He, P.P.; Qian, X.C.; Fei, Z.Y.; Zhang, Z.X.; Chen, X.; Tang, J.H.; Cui, M.F.; Qiao, X.; Shi, Y. Enhanced CO2 Adsorption Performance on Hierarchical Porous ZSM-5 Zeolite. Energy Fuels 2017, 31, 13933–13941. [Google Scholar] [CrossRef]
  27. Jiang, S.F.; Zhang, Z.A.; Qu, Y.H.; Wang, X.W.; Li, Q.; Lai, Y.Q.; Li, J. Activated carbon aerogels with high bimodal porosity for lithium/sulfur batteries. J. Solid State Electrochem. 2014, 18, 545–551. [Google Scholar] [CrossRef]
  28. Lee, Y.J.; Park, H.W.; Park, S.; Song, I.K. Electrochemical properties of Mn-doped activated carbon aerogel as electrode material for supercapacitor. Curr. Appl. Phys. 2012, 12, 233–237. [Google Scholar] [CrossRef]
  29. Patole, A.S.; Patole, S.P.; Kang, H.; Yoo, J.B.; Kim, T.H.; Ahn, J.H. A facile approach to the fabrication of graphene/polystyrene nanocomposite by in situ microemulsion polymerization. J. Colloid Interface Sci. 2010, 350, 530–537. [Google Scholar] [CrossRef] [PubMed]
  30. Patole, A.S.; Patole, S.P.; Jung, S.Y.; Yoo, J.B.; An, J.H.; Kim, T.H. Self assembled graphene/carbon nanotube/polystyrene hybrid nanocomposite by in situ microemulsion polymerization. Eur. Polym. J. 2012, 48, 252–259. [Google Scholar] [CrossRef]
  31. Nallusamy, S. Synthesis and Characterization of Carbon Black-Halloysite Nanotube Hybrid Composites Using XRD and SEM. J. Nano Res. 2017, 45, 208–217. [Google Scholar] [CrossRef]
  32. Zhuo, H.; Hu, Y.J.; Tong, X.; Zhong, L.X.; Peng, X.W.; Sun, R.C. Sustainable hierarchical porous carbon aerogel from cellulose for high-performance supercapacitor and CO2 capture. Ind. Crop. Prod. 2016, 87, 229–235. [Google Scholar] [CrossRef]
  33. Sayari, A.; Liu, Q.; Mishra, P. Enhanced Adsorption Efficiency through Materials Design for Direct Air Capture over Supported Polyethylenimine. Chemsuschem 2016, 9, 2796–2803. [Google Scholar] [CrossRef] [PubMed]
  34. Qian, Y.; Delgado, J.D.L.P.; Veneman, R.; Brilman, D.W.F. Stability of a Benzyl Amine Based CO2 Capture Adsorbent in View of Regeneration Strategies. Ind. Eng. Chem. Res. 2017, 56, 3259–3269. [Google Scholar] [CrossRef]
  35. Jiang, W.J.; Yin, Y.; Liu, X.Q.; Yin, X.Q.; Shi, Y.Q.; Sun, L.B. Fabrication of supported cuprous sites at low temperatures: An efficient, controllable strategy using vapor-induced reduction. J. Am. Chem. Soc. 2013, 135, 8137–8140. [Google Scholar] [CrossRef] [PubMed]
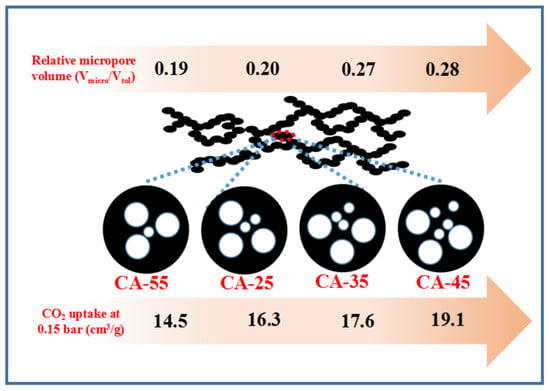
Figure 1. XRD patterns of CA-X samples.
Processes 06 00035 g001
Figure 2. Raman patterns of CA-X samples.
Processes 06 00035 g002
Figure 3. FT-IR spectra of CA-X samples.
Processes 06 00035 g003
Figure 4. SEM images of CA-X samples.
Processes 06 00035 g004
Figure 5. (a) N2 adsorption/desorption isotherms and (b) pore size distributions of CA-X samples.
Processes 06 00035 g005
Figure 6. Adsorption isotherms of CO2 at (a) 0; (b) 12.5 and (c) 25 °C over CA-X samples.
Processes 06 00035 g006
Figure 7. IAST selectivity of CO2/N2 (15%/85% in volume) on the CA-X samples at 0 °C.
Processes 06 00035 g007
Figure 8. CO2 breakthrough curves of CA-X samples under (a) dry and (b) humid conditions.
Processes 06 00035 g008
Figure 9. Adsorption isotherms of CO2 over CA-X samples at 1 bar and 0 °C.
Processes 06 00035 g009
Table 1. Textural structure parameters of CA-X samples.
SampleSBET (m2/g)Vp (cm3/g)dp 2 (nm)Vmicro/Vtol
Micropore 1Mesopore 2Total
CA-256380.200.790.997.370.20
CA-358130.250.670.924.520.27
CA-458480.270.680.954.460.28
CA-557840.241.001.246.340.19
1 Calculated by the t-plot method; 2 Calculated by the BJH method.
Table 2. CO2 adsorption capacities of samples under different pressure and operating temperature.
SampleCO2 Uptake (cm3/g)Qst 3 (kJ/mol)
0 °C12.5 °C25 °C50 °C
0.15 bar 11 bar 10.15 bar 11 bar 10.15 bar 11 bar 10.15 bar (Humid) 2
CA-2528.768.522.257.316.347.313.2 (12.1)25.1
CA-3534.179.527.568.717.649.615.1 (14.3)24.8
CA-4534.283.727.671.819.156.518.5 (16.2)24.3
CA-5526.262.722.154.414.543.313.1 (11.9)25.6
1 Determined by CO2 adsorption isotherms; 2 Determined by CO2 breakthrough curves; 3 Calculated by CO2 adsorption isotherms using the Equation (2).

