Assessment of Industrial Modules to Design a GFMA Process for Cyanide Recovery Based on a Phenomenological Model


1
Advanced Mining Technology Center (AMTC), University of Chile, Tupper 2007 (AMTC Building), Santiago 8370451, Chile
2
Department of Chemistry, Universidad Tecnológica Metropolitana, Las Palmeras 3360, Ñuñoa, Santiago 7800003, Chile
3
Programa Institucional de Fomento a la Investigación, Desarrollo e Innovación, Universidad Tecnológica Metropolitana, Ignacio Valdivieso 2409, San Joaquín, Santiago 8940577, Chile
4
Laboratory of Membrane Separation Processes (LabProSeM), Department of Chemical Engineering, University of Santiago de Chile (USACH), Avenida Libertador Bernardo O'Higgins 3363. Estación Central, Santiago 9170022, Chile
*
Author to whom correspondence should be addressed.
Processes 2018, 6(4), 34; https://doi.org/10.3390/pr6040034
Submission received: 19 March 2018
/
Revised: 4 April 2018
/
Accepted: 6 April 2018
/
Published: 11 April 2018
(This article belongs to the Special Issue Membrane Materials, Performance and Processes)
Abstract
:Cyanide recovery in the gold-mining industry is a crucial step in terms of the cost of operation. Currently, a process such as AVR (acidification, volatilization and recycling), based on packed towers for stripping and absorption stages, addresses this issue with high levels of investment and operational costs. Gas-filled membrane absorption (GFMA) emerges then as an attractive alternative because the stripping and absorption stages can be performed in a single stage, reducing associated investment and operational costs. Despite the advantages of this technology, applications at industrial scale are still emerging. A possible reason is the lack of clear scaling-up methodologies where experimental data can be taken to select the optimum industrial hollow-fiber membrane contactor module (HFMC). The present study proposes a methodology to select adequately between available industrial Liqui-CelTM modules to design a process under optimal operational conditions. The methodology is based on a phenomenological model developed for recovering cyanide by using the GFMA process. Simulation of the Liqui-CelTM industrial membrane modules employed to recover cyanide in the GFMA process, both in a batch arrangement with a feed-flow rate, and in the range 10–125 m3/h, showed that in terms of cyanide recovery there are no differences between the modules tested when they work at the same feed-flow rate. The design criteria to scale-up was determined: to ensure performance at different scales, the length of the transfer unit (HTU) should be kept at different capacities of HFMC modules that comprise the equipment characteristics (mass-transfer area, stream velocities, and mass-transfer coefficient values). Additionally, the number of commercial modules Liqui-CelTM required to treat 57 m3/h and 250 m3/h ensuring a cyanide recovery of 95% was also determined. Finally, the most profitable option (lower pressure drop and module cost) resulted in the use of the 14 × 40 Liqui-CelTM module.
1. Introduction
1.1. Background of Gas-Filled Membrane Absorption (GFMA) Process
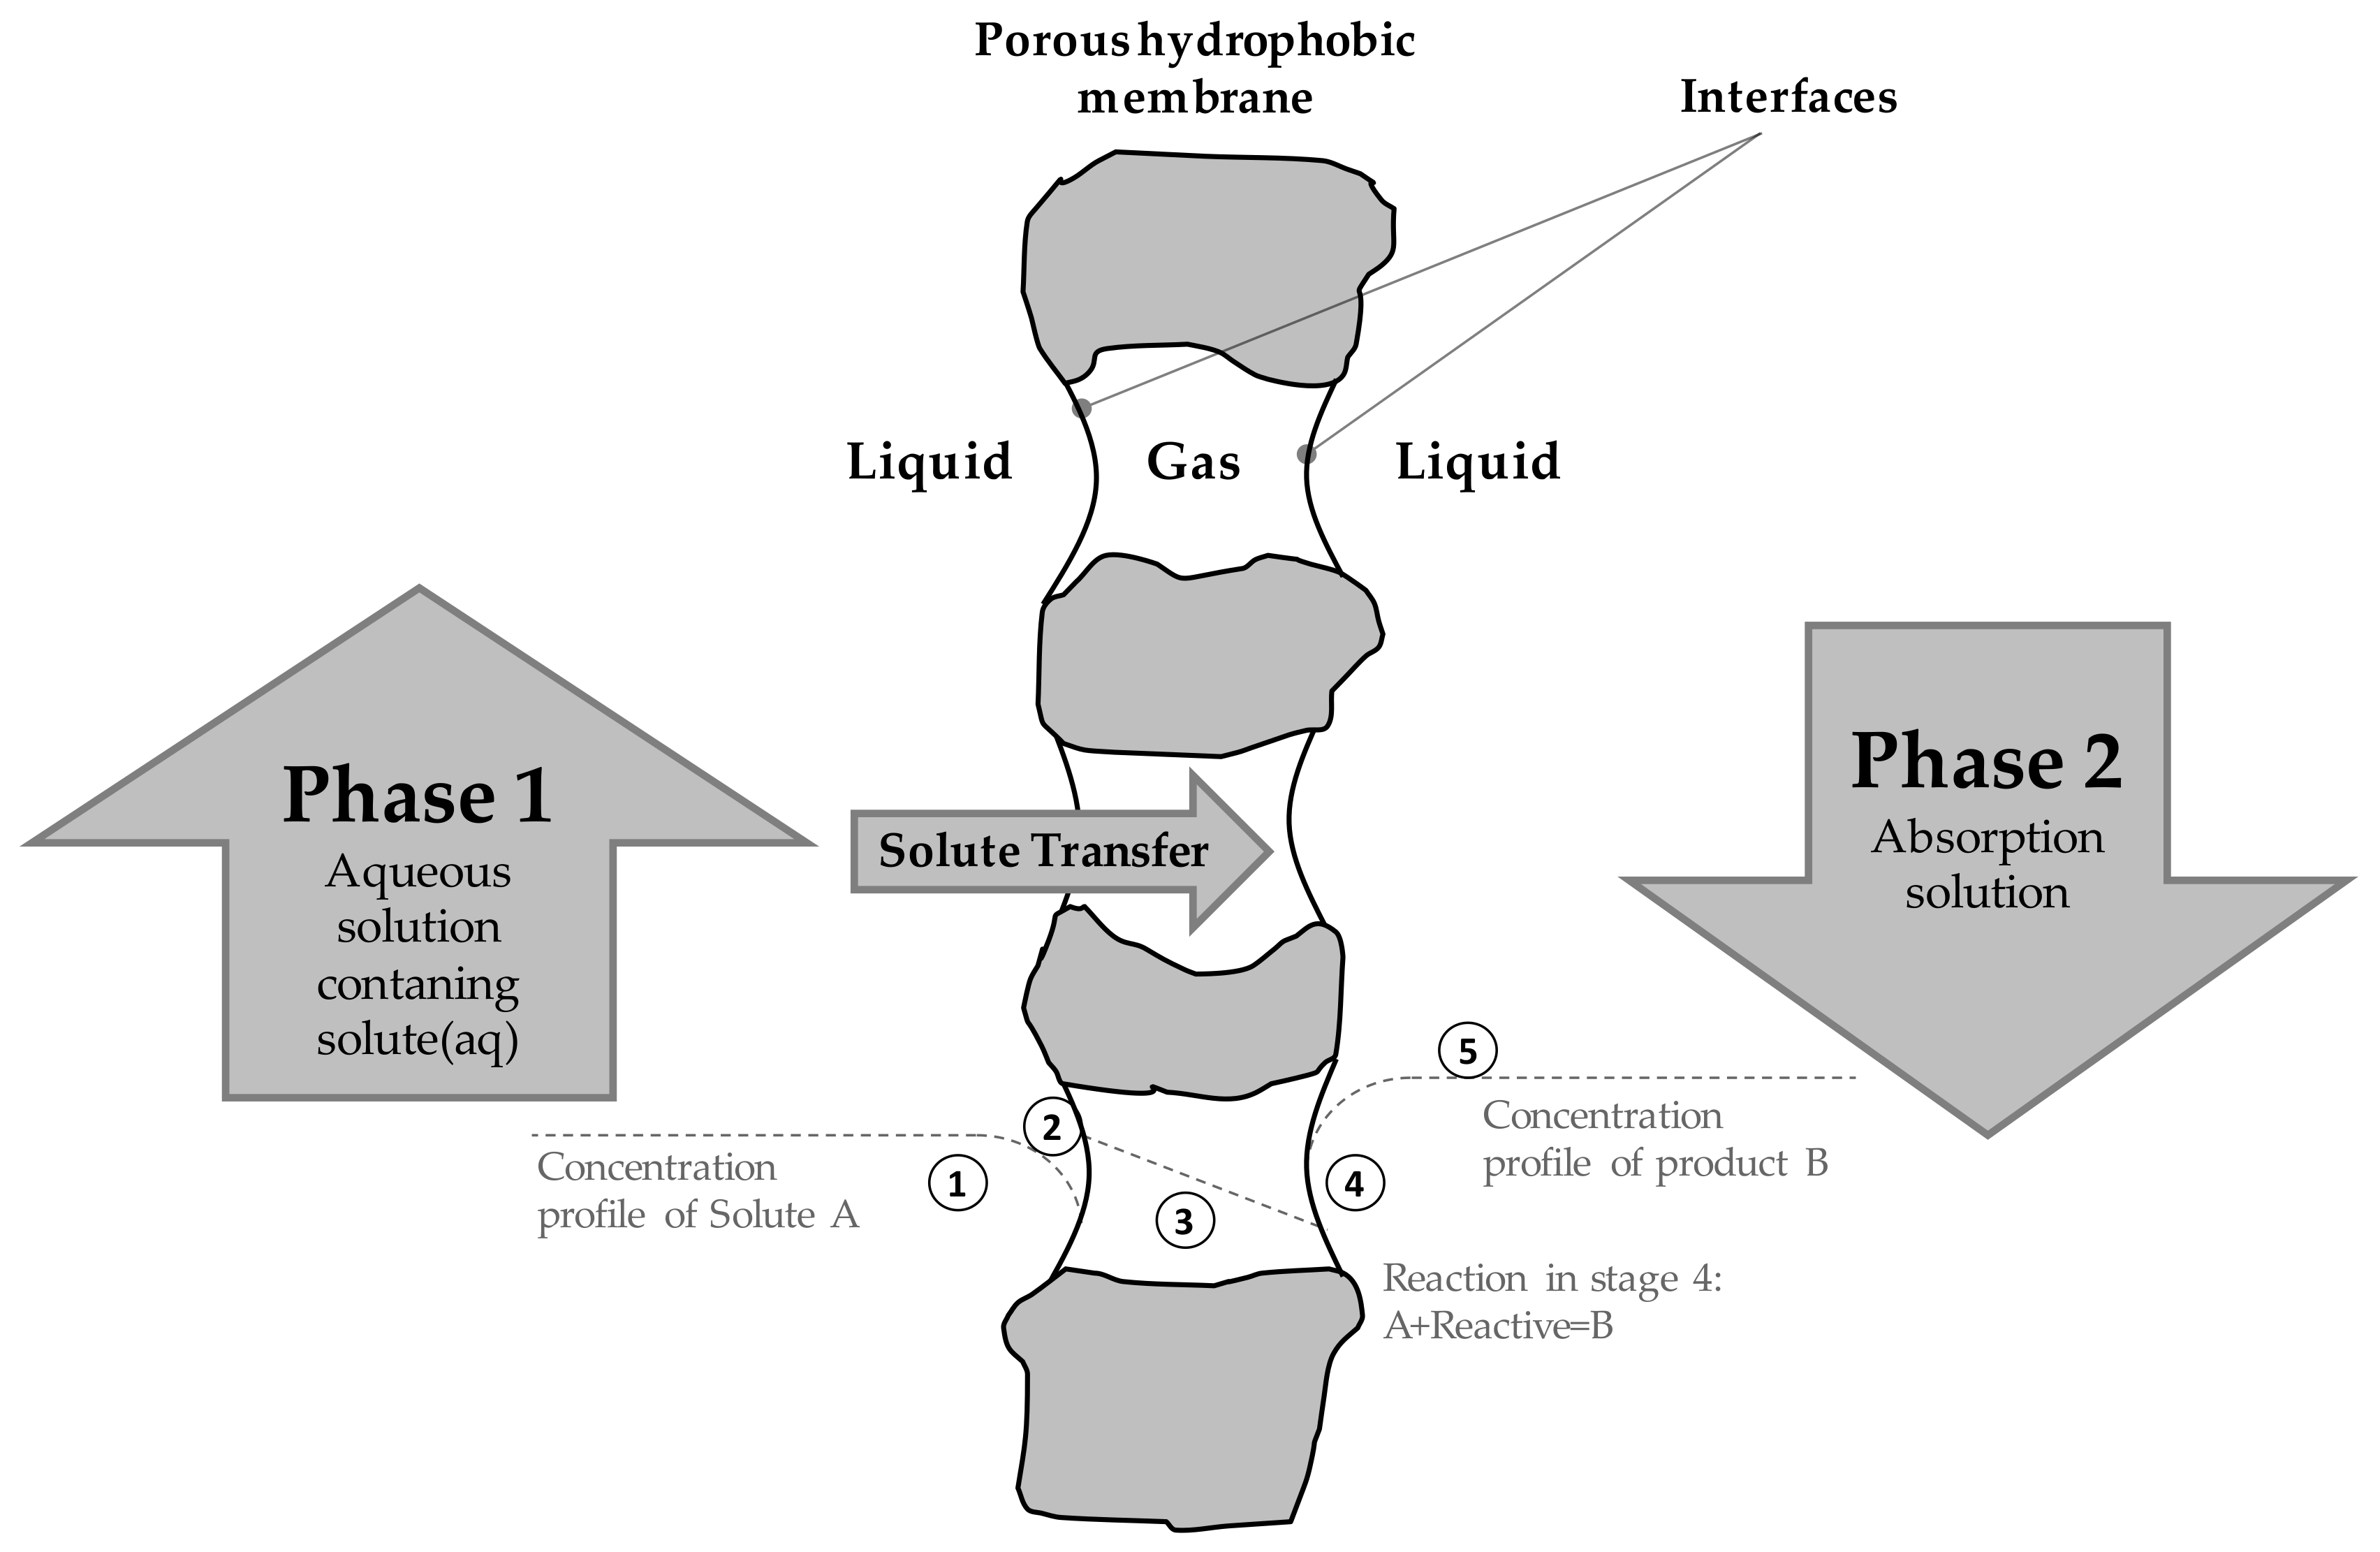
The gas-filled membrane absorption (GFMA) process, also named the gas membrane process, was developed in 1982 by Imai, Furusaki and Miyauchi, who attempted to remove ammonia and iodine from aqueous solution [1]. After this study, the stripping and absorption of different volatile compounds (H2S, SO2, NH3, Br2, I2) was carried out in 1985 [2], by using a hydrophobic hollow-fiber membrane contactor (HFMC) to separate a liquid-aqueous solution containing a volatile solute (stripping solution) from the absorption solution. The hydrophobic properties of the membrane avoid the penetration of aqueous solutions into the membrane pores that are filled with air. In this way, the solute is transferred through the membrane according to Figure 1.
An interesting application of this process can be found for recovering cyanide in gold mining [3,4] as an alternative to the conventional cyanide-recovery processes, such as AVR (acidification, volatilization and recycling) [5], which is based on packed towers for the stripping and absorption stages. Even though the GFMA process allows stripping and absorption stages to be performed in a single-unit operation, this advantage has not been enough to install this technology at industrial scale. This might be because of the lack of studies to support the optimal operational conditions, the equipment design, and the selection of hollow-fiber membrane modules based on a structured methodology to design a plant based on the available industrial HFMCs. The present study proposes a methodology to select adequately between available industrial HFMC, and to design a GFMA process in optimal operational conditions. This methodology is based on a phenomenological model formulated in a previous study [3] for recovering cyanide in the GFMA process.
1.2. Phenomenological Modeling of Cyanide Recovery Based on the GFMA Process
A theoretical model to recover cyanide in gold mining, by using the GFMA process, was developed in a previous study [3]. The feed solution of this process must be acidic (pH < 7.0) to generate a maximum content of cyanide as HCN(aq) in the stripping solution. Thus, the cyanide-metal complexes contained in the feed solution, such as copper and zinc, can be dissociated as described in a previous work [3].
A relationship among the concentration of species and pH can be found according to the aforementioned equations [3]. This relationship is a useful mathematical tool to quantify the content of metal-cyanides species and the HCN concentration contained in the feed solution with respect to the pH. Dissolved HCN is volatilized through the membrane pores from the stripping solution into the receiving phase. This mass-transfer process is based on a resistances-in-series approach [6]. Hence, the overall HCN transfer can be described as:
where NHCN is the flux of HCN transferred through the membranes, K is the overall mass transfer coefficient, A is the total area available for mass transfer, and ΔCmlHCN is the logarithmic mean concentration difference [3]. In particular, the overall mass transfer coefficient (K) can be described as a global resistance (1/K) that includes the individual mass-transfer steps. Thus, the overall mass-transfer coefficient can be estimated according to the following equation:
where kL is the local mass-transfer coefficient of the stripping phase, and km is the local mass-transfer coefficient of the gas phase which fills the membrane pores [3].
In this process, the feed solution flows on the shell side to improve the mass-transfer coefficients [7], increasing the transfer area and enhancing the hydraulic performance. Hence, the mass-transfer coefficient of the feed solution can be estimated using the Basu model [8,9] described as:
where de is the equivalent diameter (4 × [cross-sectional area of flow]/[wetted perimeter]), L is the membrane length, and is the packing fraction. This correlation was defined for a parallel flow configuration to fit with the HFMC module used in the experimental study [3].
1.3. Industrially Applied Hollow-Fiber Membrane Contactor Modules (HFMCs)
Liqui-CelTM modules [10] are the most used HFMC at industrial scale, having available information about design parameters. In particular, these membranes have been successfully applied for the separation of gases (CO, CO2, O2 and ammonia) from solutions or wastewater [11,12]. Despite the improvements achieved in this regard, the application of this technology for the GFMA at industrial scale is yet to be addressed. Moreover, there are recent studies proposing design methodologies or new membrane modules for membrane absorption and osmotic membrane distillation which are not been applied at industrial scale [13,14,15,16].
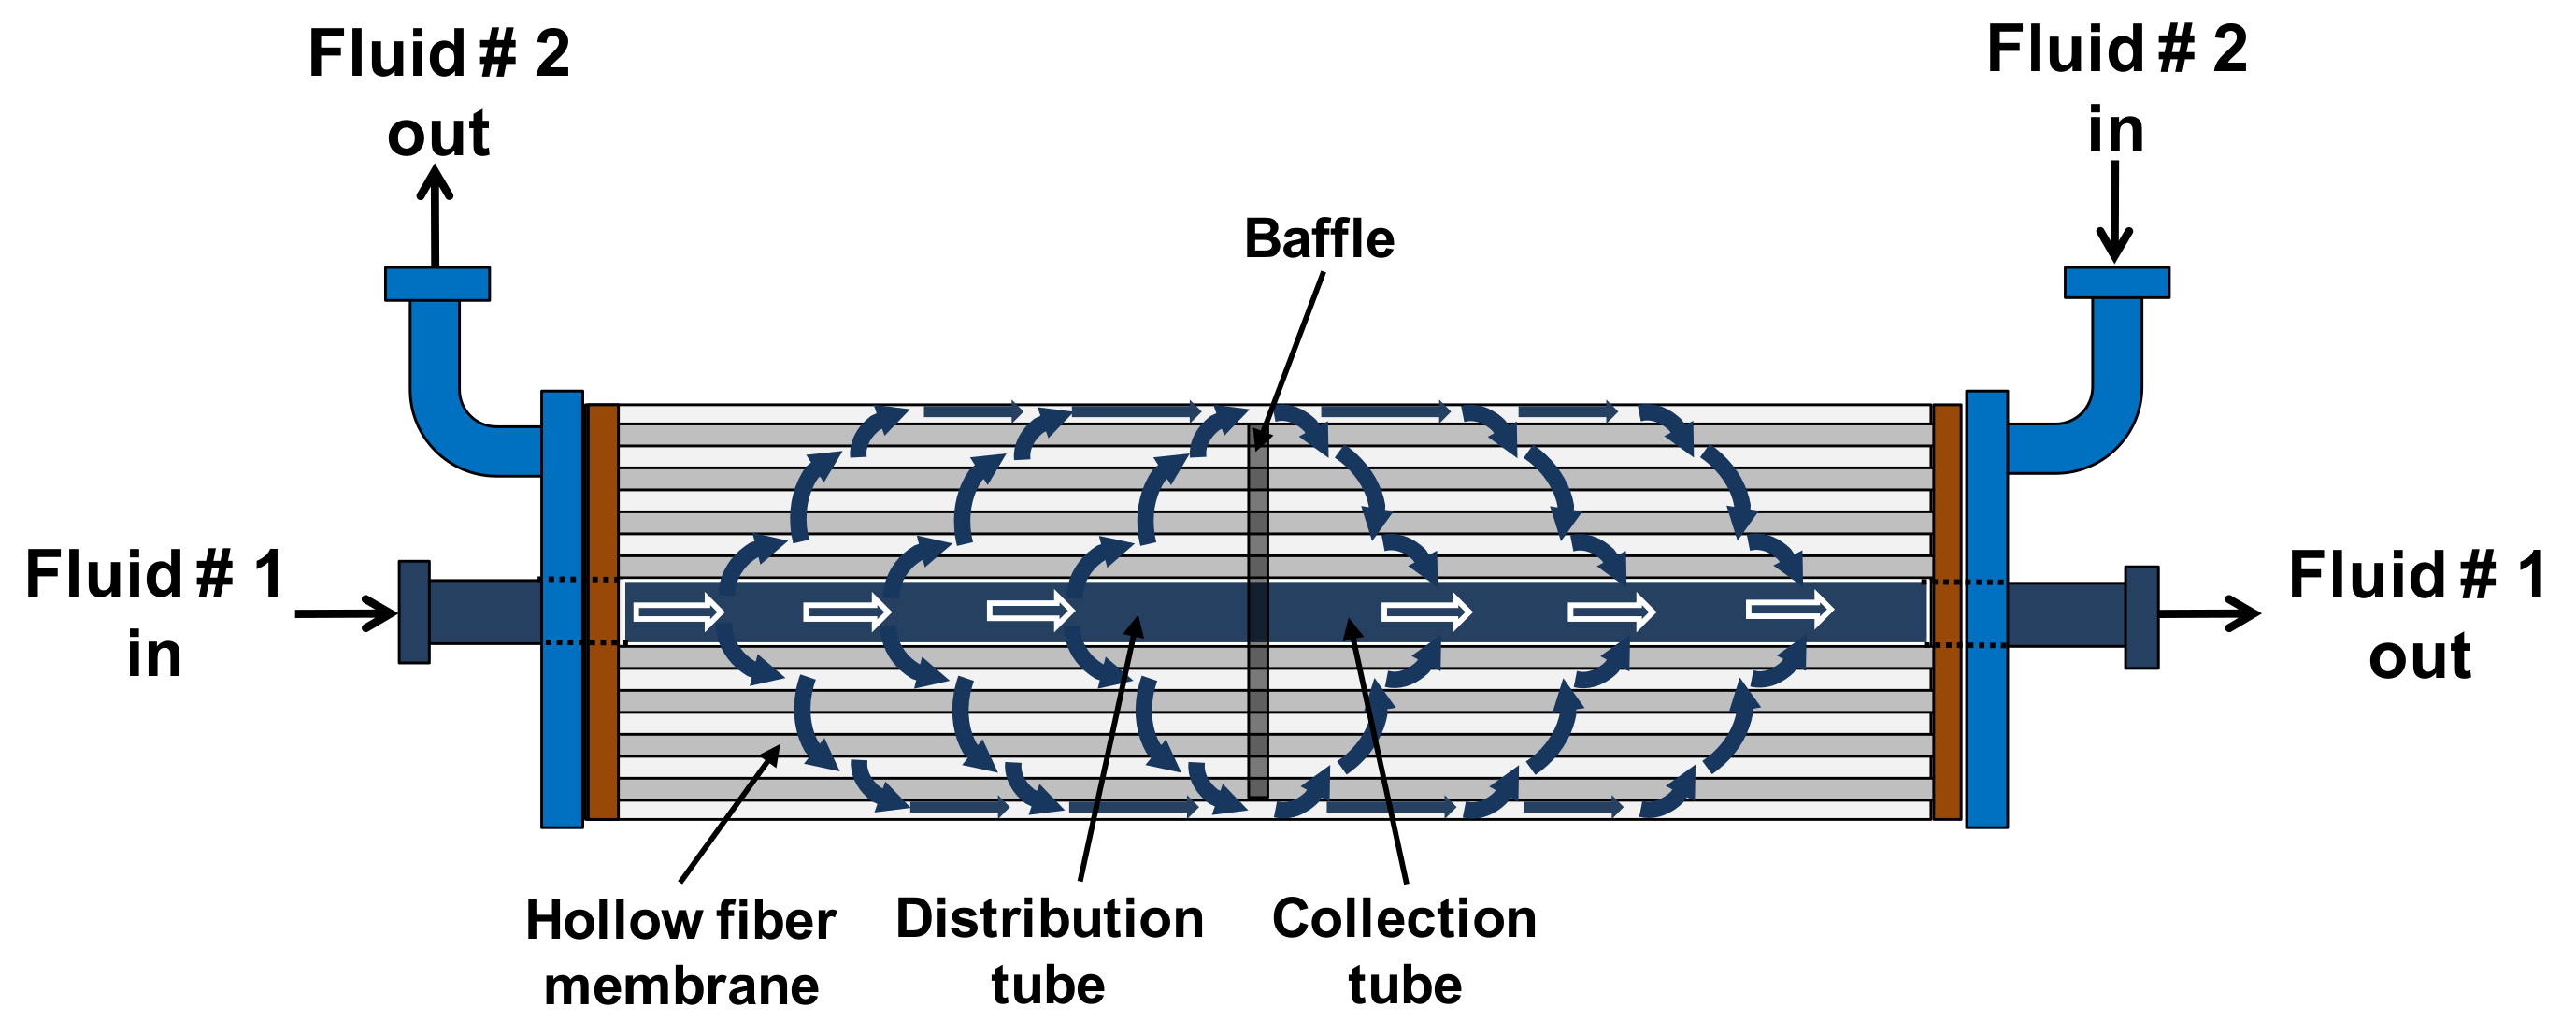
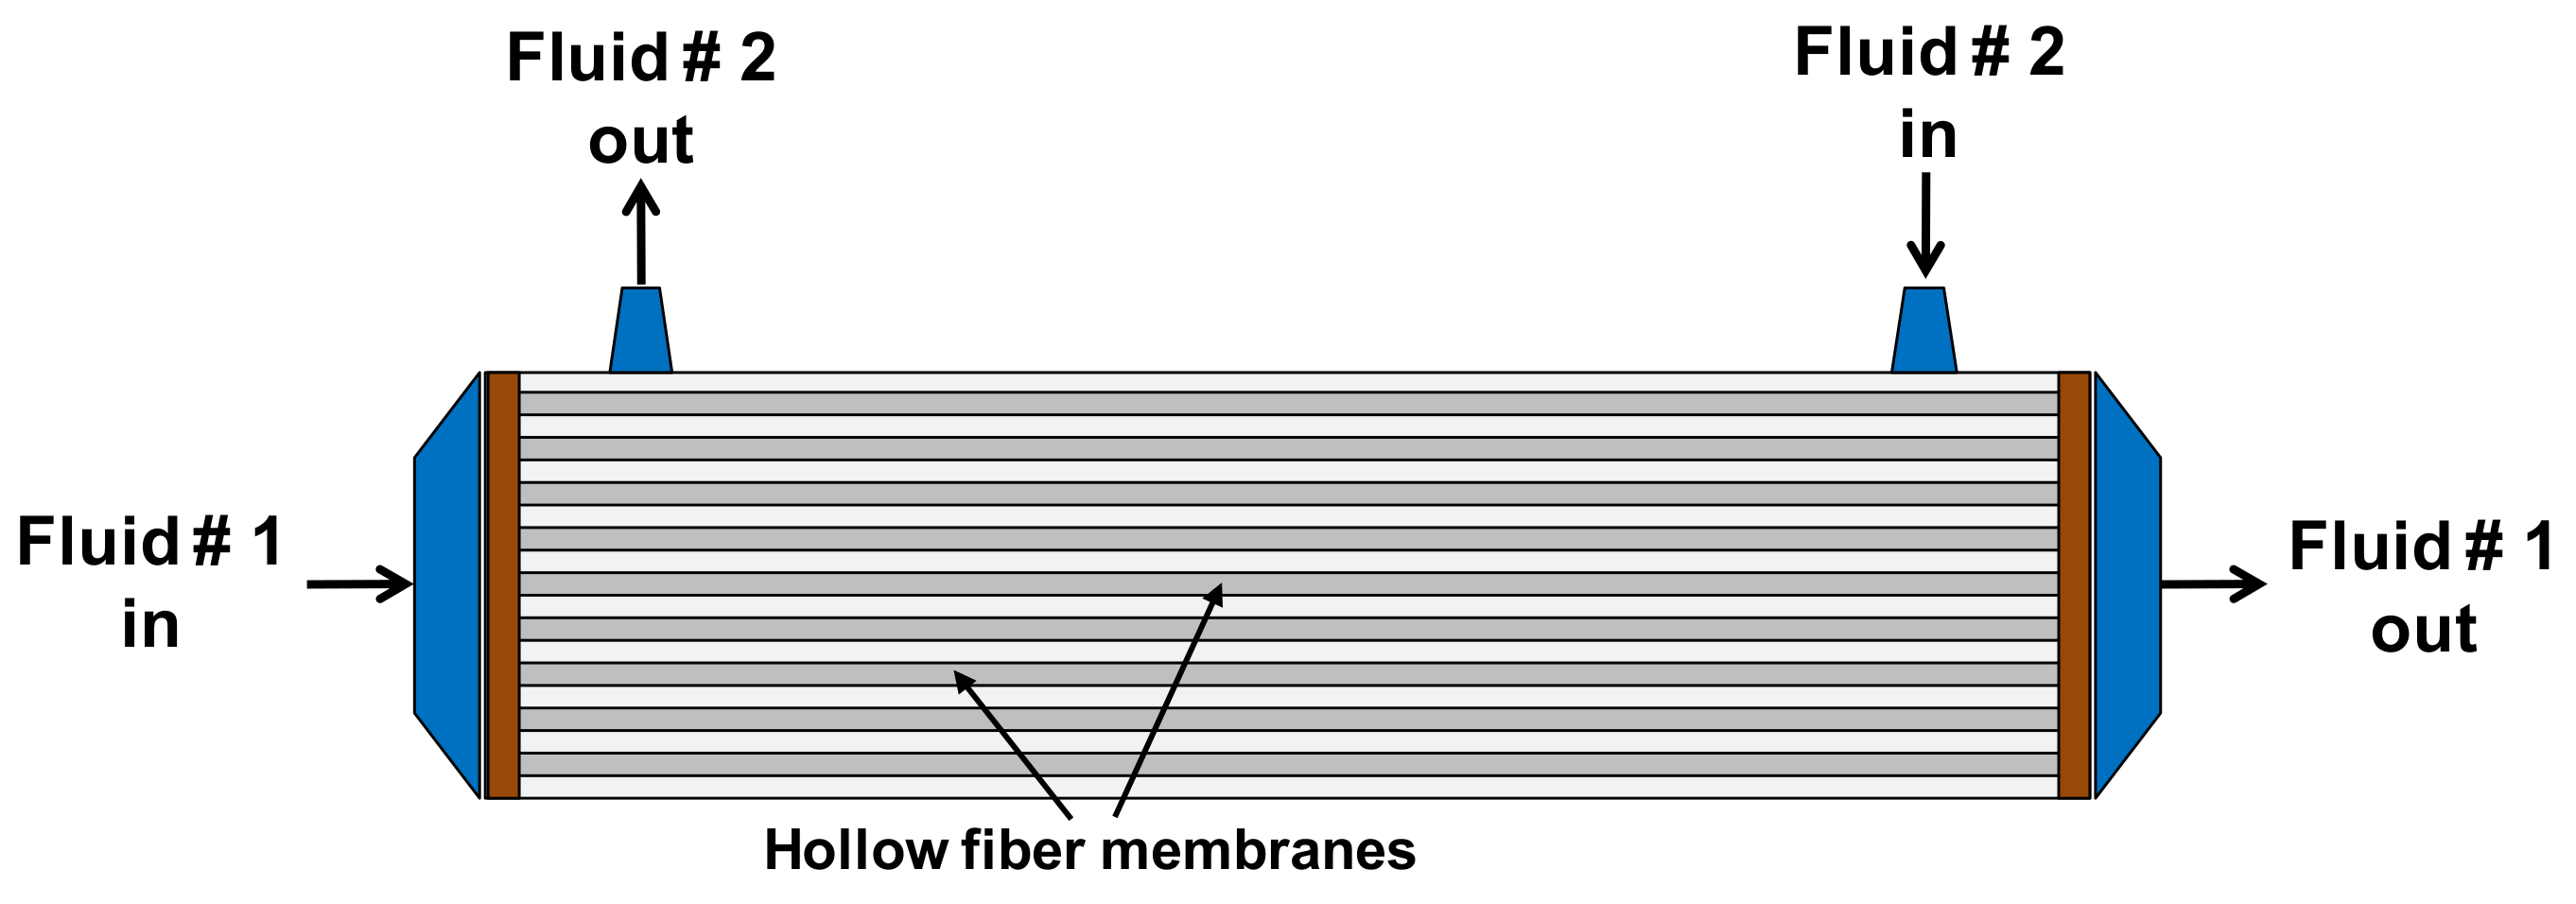
The industrial module developed by Liqui-CelTM is the Extra-Flow module (Figure 2), which includes a center baffle to promote a cross flow on the shell side, increasing the turbulence and, thus, the performance of these modules. Nevertheless, the conventional HFMC module used in experimental studies at laboratory scale is the cylindrical module having a parallel flow with no baffles, similar to the Minimodule supplied by Liqui-CelTM [10] (Figure 3), since it allows the treatment at low capacities. Experimental work developed in the previous study [3] was carried out in this type of module. The differences mentioned above cause issues in terms of the results obtained with these modules, because they do not have reproducibility with the industrial ones, since the overall mass-transfer coefficient value will be different, affecting the expected performance results between the experimental and industrial scales. This fact makes it difficult to design an industrial plant or pilot plant based on the laboratory results obtained in a specific application [17].
On the other hand, and based on our previous work [3], it is known that the mass-transfer resistance of the liquid phase flowing on the shell side is higher than 99% respect to the total mass-transfer resistance [3]. In this context, it is relevant to select an adequate mass-transfer correlation on the shell side and hence impact on the cyanide recovery in the GFMA process. Several mass-transfer correlations for the shell side have been developed in the literature, which can predict and fit the experimental results in the parallel flow configuration [8,18,19,20,21,22,23]. However, there are only five reported correlations for estimating mass-transfer coefficients in the shell side for the Extra-Flow modules [24,25,26,27,28], as summarized in Table 1. These correlations were obtained from the model 2.5 × 8 Extra-Flow module, showing a capacity from 0.1–0.7 m3/h. This module is the smallest Extra-Flow supplied by Liqui-CelTM, and is probably the cause for the limitation of the experimental studies that have been sized at lower capacity than the Minimodule’s operational capability (<2.5 L/min or 0.15 m3/h) [10].
Based on the aforementioned issue, the definition of an adequate correlation according to the type of module is essential to design a GFMA process. The correlations summarized in Table 1 can be used as a base information to develop a methodology for the adequate selection of an industrial Extra-Flow module.
2. Methodology
2.1. Selection of the Mass-Transfer Correlation on the Shell Side
Firstly, this study includes a comparison of results obtained by different mass-transfer coefficients (reported in Table 1) to describe the transport conditions in the shell side of Extra-Flow modules. The operational conditions considered for simulations were the same as those used in our previous work [3], where a cylindrical module with parallel flow—at laboratory scale—was used. Table 2 reports these experimental conditions, which were used to validate the phenomenological model developed in our previous study. A feed flow of 2.0 L/min (0.12 m3/h) was used in the simulation to estimate the mass-transfer coefficient, because the cylindrical and the 2.5 × 8 Extra-Flow modules are capable of treating feed flows ranging from 0.1 to 0.7 m3/h, according to the Liqui-CelTM specifications [10]. Table 3 shows the membrane contactor parameters for the 2.5 × 8 Extra-Flow module. Furthermore, the overall mass-transfer coefficient was calculated using Equations (2) and (3), changing Equation (3) according to the mass-transfer correlation reported in Table 2, depending on each case. Hence, one mass-transfer correlation was selected to be simulated by the phenomenological model, with focus on comparing the cyanide-recovery values with respect to the experimental ones [3]. The criterion to choose the mass-transfer correlation is based on a comparison between operational conditions used in the studies where correlations were developed and the operational conditions were those used in the previous work.
2.2. Performance Assessment of Industrial Extra-Flow Liqui-CelTM Modules
Table 3 shows four different industrial Extra-Flow Liqui-CelTM modules currently supplied by this company. These modules (8 × 40, 10 × 28, 14 × 28, and 14 × 40) have the highest capacities in the Liqui-CelTM catalogue, and therefore there is a potential interest in assessing them for a gold-mining application where the requiered capacities are higher than 100 m3/h. The current AVR plants installed worldwide have capacities ranging from 120–1400 m3/h (Yanacocha, Peru; Cerro Vanguardia, Argentina; Paracatu, Brazil; Álamo Dorado, Mexico) [29,30]. Simulations were performed using feed-flow rates varying from 10–125 m3/h, according to the membrane module specifications [10] and taking into account similar operational conditions to those applied in the experimental study reported in Table 2, modifying the total cyanide mass fed into the system (3000 kg, and 1200 mg/L of total cyanide concentration). The volume of the feed tank has been specified equal to 2.5 m3 according to previous analysis of batch systems [4]. Furthermore, the mass-transfer correlation of the shell side included in the phenomenological model was selected in the previous Section 2.1. Finally, the feed flow for each module obtaining the highest cyanide recovery was identified in this section.
2.3. Determination of the Optimal Operational Condition
The optimal operational condition for each module was determined through the assessment of the incomes with respect to both the cost for each module and feed flow tested in the previous section. The incomes are defined by the cyanide recovered for each module and feed flow and the costs are defined by the supply cost and the operational cost associated with energy consumption promoted by the pressure drop in the shell side of each module. Thus, the economic benefit has been estimated as follows:
where, B is the benefit (US$), In is the income defined by the cyanide recovery (US$), SC is the supply cost for each module (US$), and OC is the operational cost associated with energy consumption promoted by the pressure drop of each module. This equation allows estimation of an optimal operational condition where the cyanide-recovery process is still profitable. The prices of cyanide, energy and modules utilized in this study are summarized in Table 4. These values are based on recent quotations made in Chile for the selected modules. The supply value for the 8 × 40 module is higher than the 10 × 28 module because of the housing of the 8 × 40 module that is fabricated in stainless steel, instead of the housing of the 10 × 28 module manufactured in polyvinyl chloride (PVC). Moreover, the pressure drop values are used from Liqui-CelTM data sheets published [10] for each specific module. Figure 4 shows the pressure drop curves as a function of feed-flow rate in the shell side. These curves were used to estimate the energy consumption of pumping, considering a pump efficiency of 80%.
2.4. Design of a GFMA Plant
In a previous study [4], a GFMA plant design compared batch and continuous operation mode. This determined that the best economic results were obtained when the GFMA plant operated in continuous configuration with a parallel-in series arrangement to allow the treatment of high feed-flow rates (parallel circuit) and the available transfer surface area to achieve the cyanide-recovery set (in-series circuit). However, a cylindrical membrane module having parallel flow was simulated in that work. In this study, the phenomenological model was modified to simulate a continuous configuration for the industrial Liqui-CelTM modules analyzed in the earlier sections at optimum operational conditions. Thus, the phenomenological model simulated an equilibrium-stage separation operation for each membrane module. The objective of this assessment involves the determination of the best arrangement (parallel and/or in-series) for each industrial module and the best option of a Liqui-CelTM module to treat a specific flow capacity. For this purpose, two cases of study with 250 m3/h and 57 m3/h, at similar feed solution characteristics of Section 2.2 and Section 2.3, have been assessed in order to compare the impact of the treated feed-flow rate. The design of both cases has been developed to reach a goal of cyanide recovery equal to 95%.
3. Results and Discussion
3.1. Selection of the Mass-Transfer Correlation on the Shell Side
As explained above, the estimation of the mass-transfer coefficient was performed by using the correlations described in Table 1 for Liqui-CelTM modules. Table 5 shows the obtained values for the overall mass-transfer coefficients using different mass-transfer correlations for the Liqui-CelTM Extra-Flow module. The results show that the three first correlations [24,25,26] had similar values, fundamentally explained by similar conditions used in their respective experimental studies, such as aqueous phase flowing on the shell side, feed-flow rate and Reynolds number. Therefore, the simulations performed here can use any of these correlations. Nevertheless, it was found that the Fouad correlation [27] overestimates the values of the overall mass-transfer coefficient with respect to those obtained from the three first correlations shown in Table 5, because of the extremely low value of the Re number in the shell side (<0.1) at the simulated conditions of Table 2.
In the same way, the correlation reported by Shen et al. [28] underestimates the overall mass-transfer coefficient value. This behavior could be explained because the correlation was generated by fitting different experimental results, including gas-liquid extraction and solvent extraction systems [11,31].
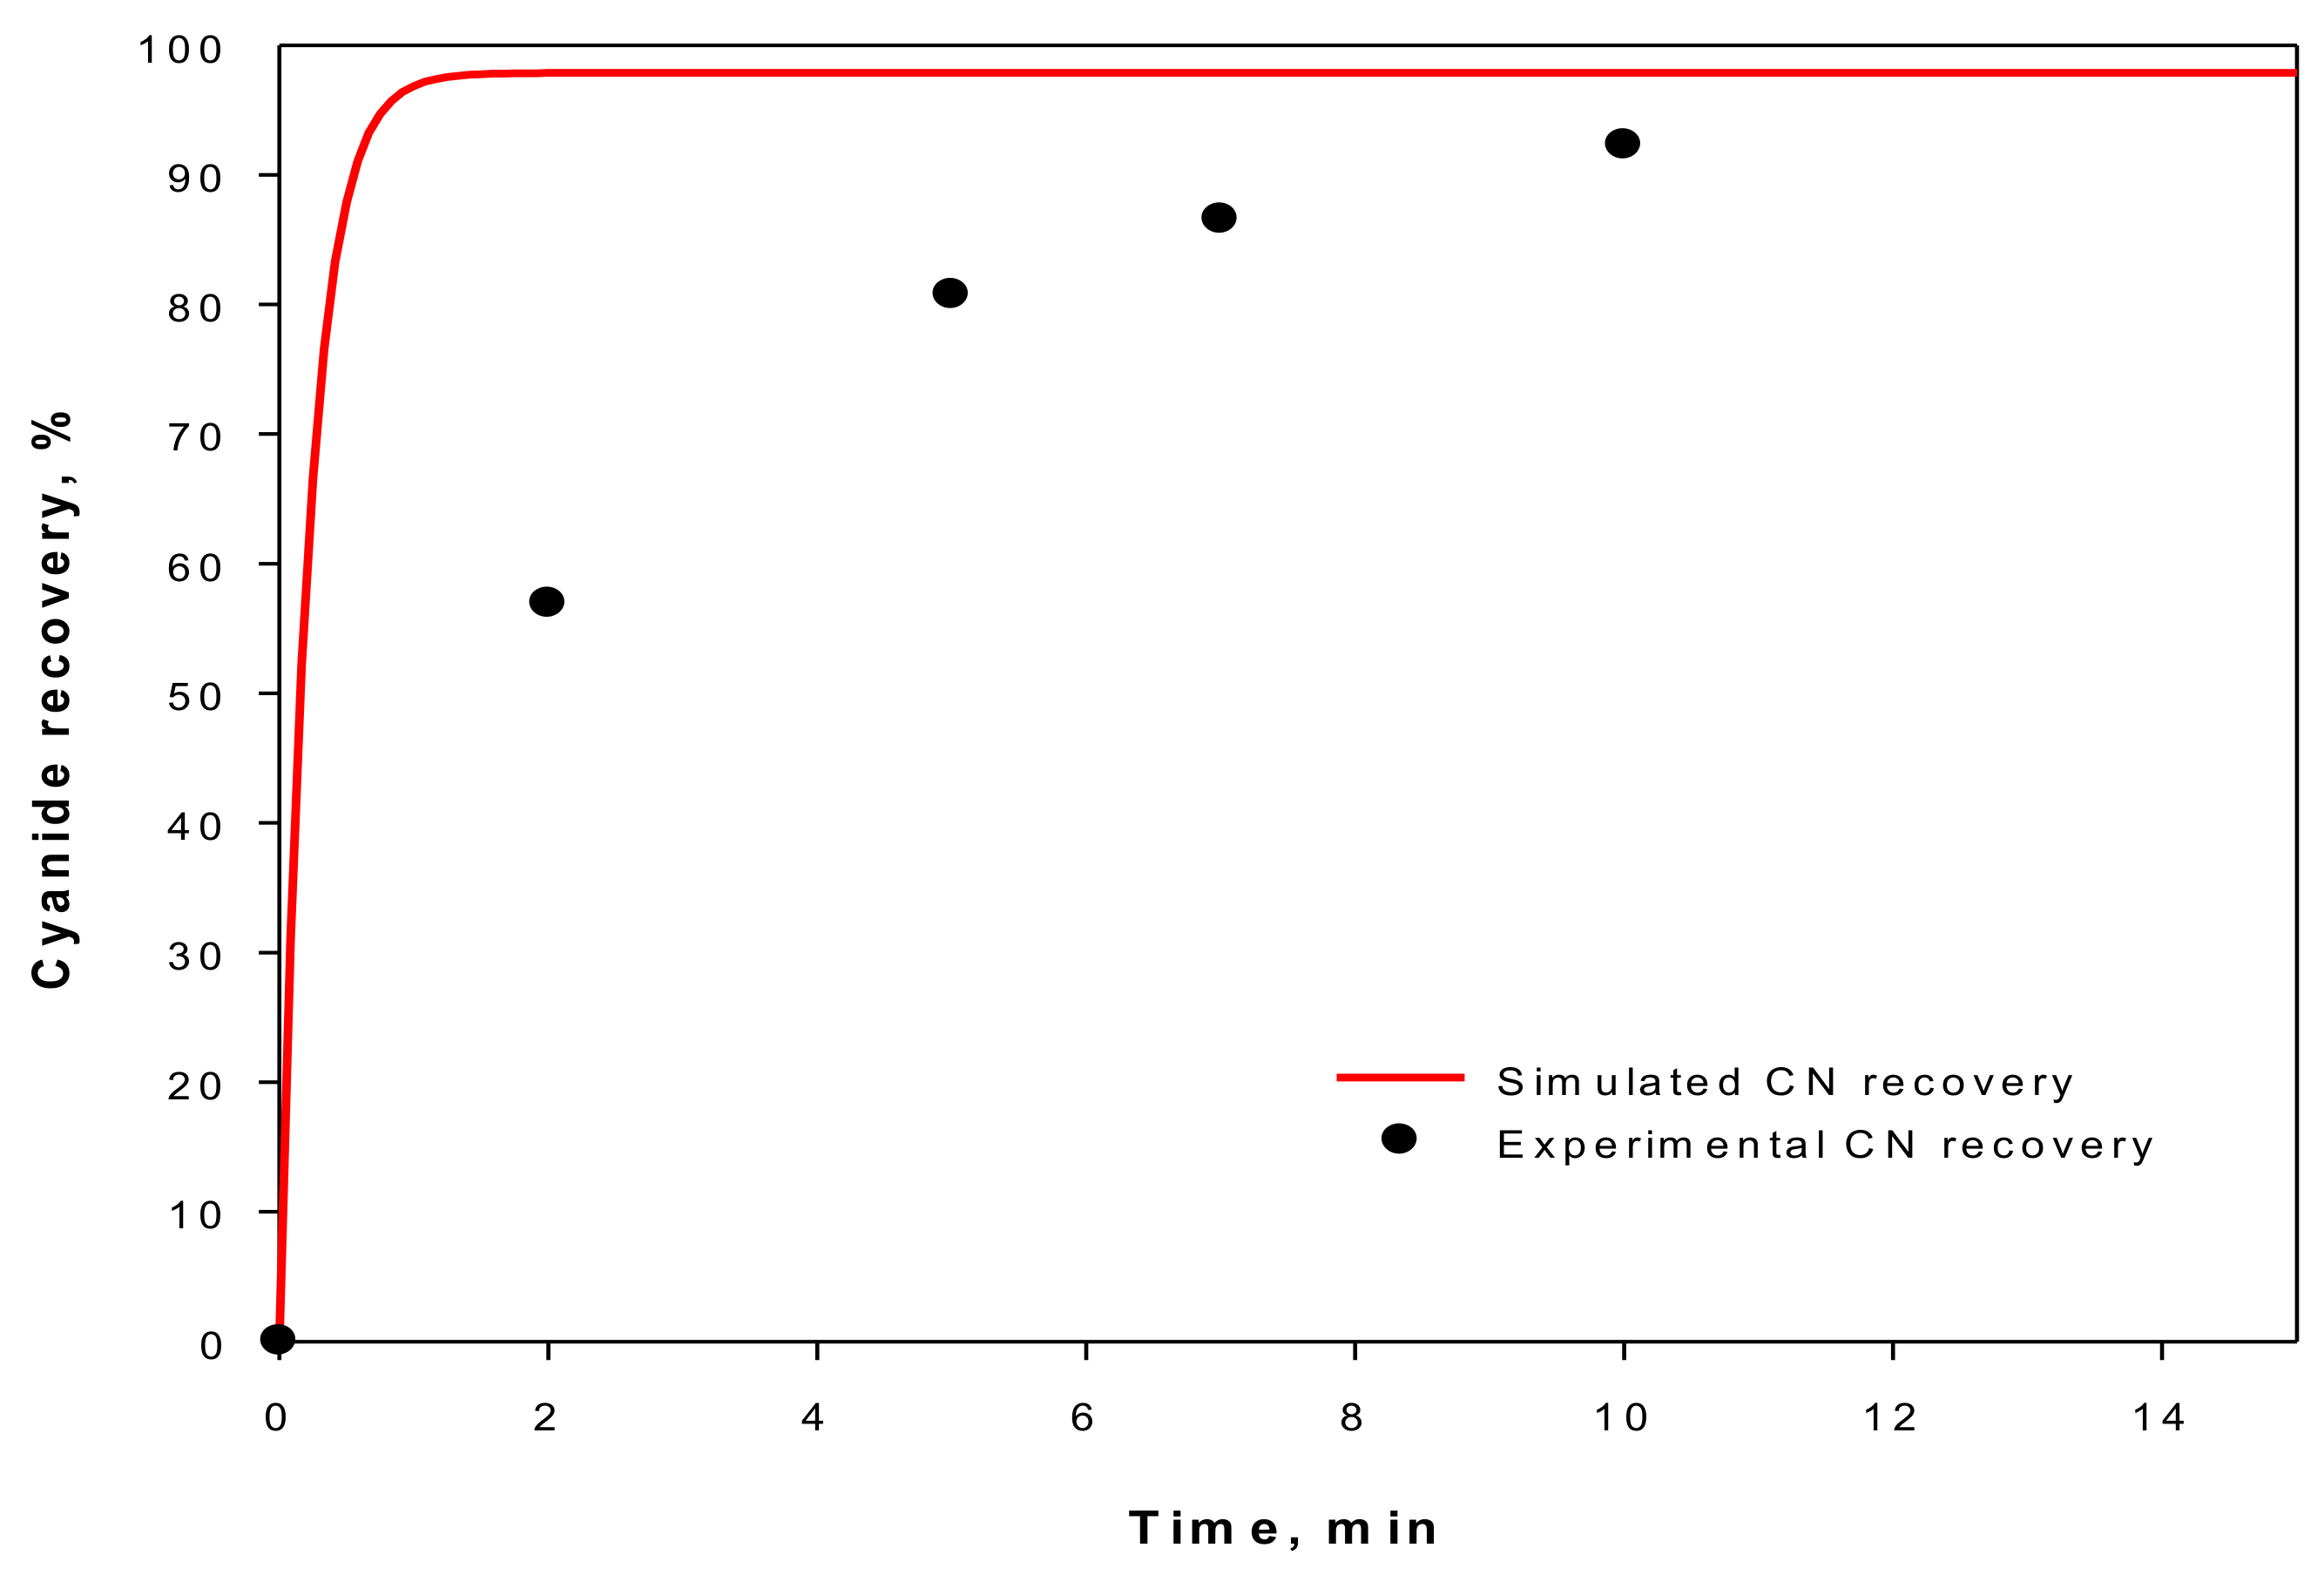
Even though the three first correlations presented in Table 5 present similar results, the correlation developed by Schoner and collaborators [24] was selected to simulate the performance of the GFMA process using the industrial Extra-Flow module from Liqui-CelTM. This correlation was the first proposed for ExtraFlow modules. Furthermore, a simulation of the phenomenological model of the 2.5 × 8 Extra-Flow module was developed in the same conditions as the previous experimental study [3] shown in Table 2, in order to compare the theoretical performance of the Extra-Flow module with respect to a cylindrical configuration with parallel flow mode (Table 2). This comparison is shown in Figure 5, where the cyanide recovery estimated to the Extra-Flow module reaches 97% at 1 min in relation to the experimental results that overcome the 90% cyanide recover after 10 min [17]. These results demonstrate the high performance that Extra-Flow Modules in this GFMA process might reach.
3.2. Performance Assessment of Industrial Extra-Flow Liqui-CelTM Modules
A phenomenological model has been developed in this work to predict the performance of the industrial membrane Liqui-CelTM modules in a GFMA process for cyanide recovery in a batch arrangement. This process configuration considers that the cyanide solution is fed into a membrane module and the treated solution is recirculated into the feed tank up to a complete 30 min of recirculation. Different cyanide feed-flow rates were carried out for each membrane module in order to determine the optimum capacity in each module. According to the Liqui-CelTM specifications, the capacity ranges for each membrane module are 16–125 m3/h, 16–91 m3/h, 7–28 m3/h, and 10–57 m3/h for 14 × 40, 14 × 28, 8 × 40, and 10 × 28 modules, respectively. Based on this information, the feed-flow rates tested in the phenomenological model ranged between 10 m3/h and 125 m3/h. Figure 6 presents the results of these simulations, where similar kinetics of cyanide recovery were obtained for each membrane module at the same feed-flow rate, overlapping some curves. This fact is explained by a compensation effect of K × A value; while K decreases when the capacity is decreasing, the area remains higher for the larger modules. This explains the presence of 8 curves in Figure 6 for 19 different simulated conditions.
Conversely, when the feed-flow rate is higher, the cyanide recovery increases because of the processed increase of the volume of cyanide solution. However, the expected results should have shown a better performance for a smaller membrane module while the feed-flow rate decreases; e.g., for 91 m3/h the 14 × 28 HFMC, for 57 m3/h the 10 × 28 HFMC and for 28 m3/h the 8 × 40 HFMC. Nevertheless, the obtained results are contrary to this expectation, because the scaling-up criteria was based on the feed-flow rate capacity (similar K × A value at the same capacity) instead of ensuring the performance at different membrane modules capacities. This criterion could affect the reproducibility of cyanide-recovery performance obtained at laboratory scale, and also complicates the methodology design for an industrial plant. A design analysis of the GFMA process, based on Equation (7), could explain the results obtained here. Equation (7) can be rewritten as follows:
where a is the contact-specific surface area (m2/m3, mass-transfer area per equipment volume), QF represents the volumetric feed flow (m3/s), L is the membrane fiber length, and vs is the fluid velocity in the shell side. Thus, the effective length to promote the cyanide transfer can be defined similar to the packed bed equipment, as shown in the following equation [32,33]:
Therefore, the mass-transfer equipment, e.g., membrane contactors, can be sized as a relation between the number of transfer units (NTU) and the length of transfer units (HTU). The NTU value is determined by operational parameters such as stream flow rates, solutes concentration and equilibrium constant value of solutes, while HTU is defined by the equipment characteristics such as mass-transfer area, stream velocities and mass-transfer coefficient values. In this regard, the terms NTU and HTU are related to Equation (10) by the following expressions:
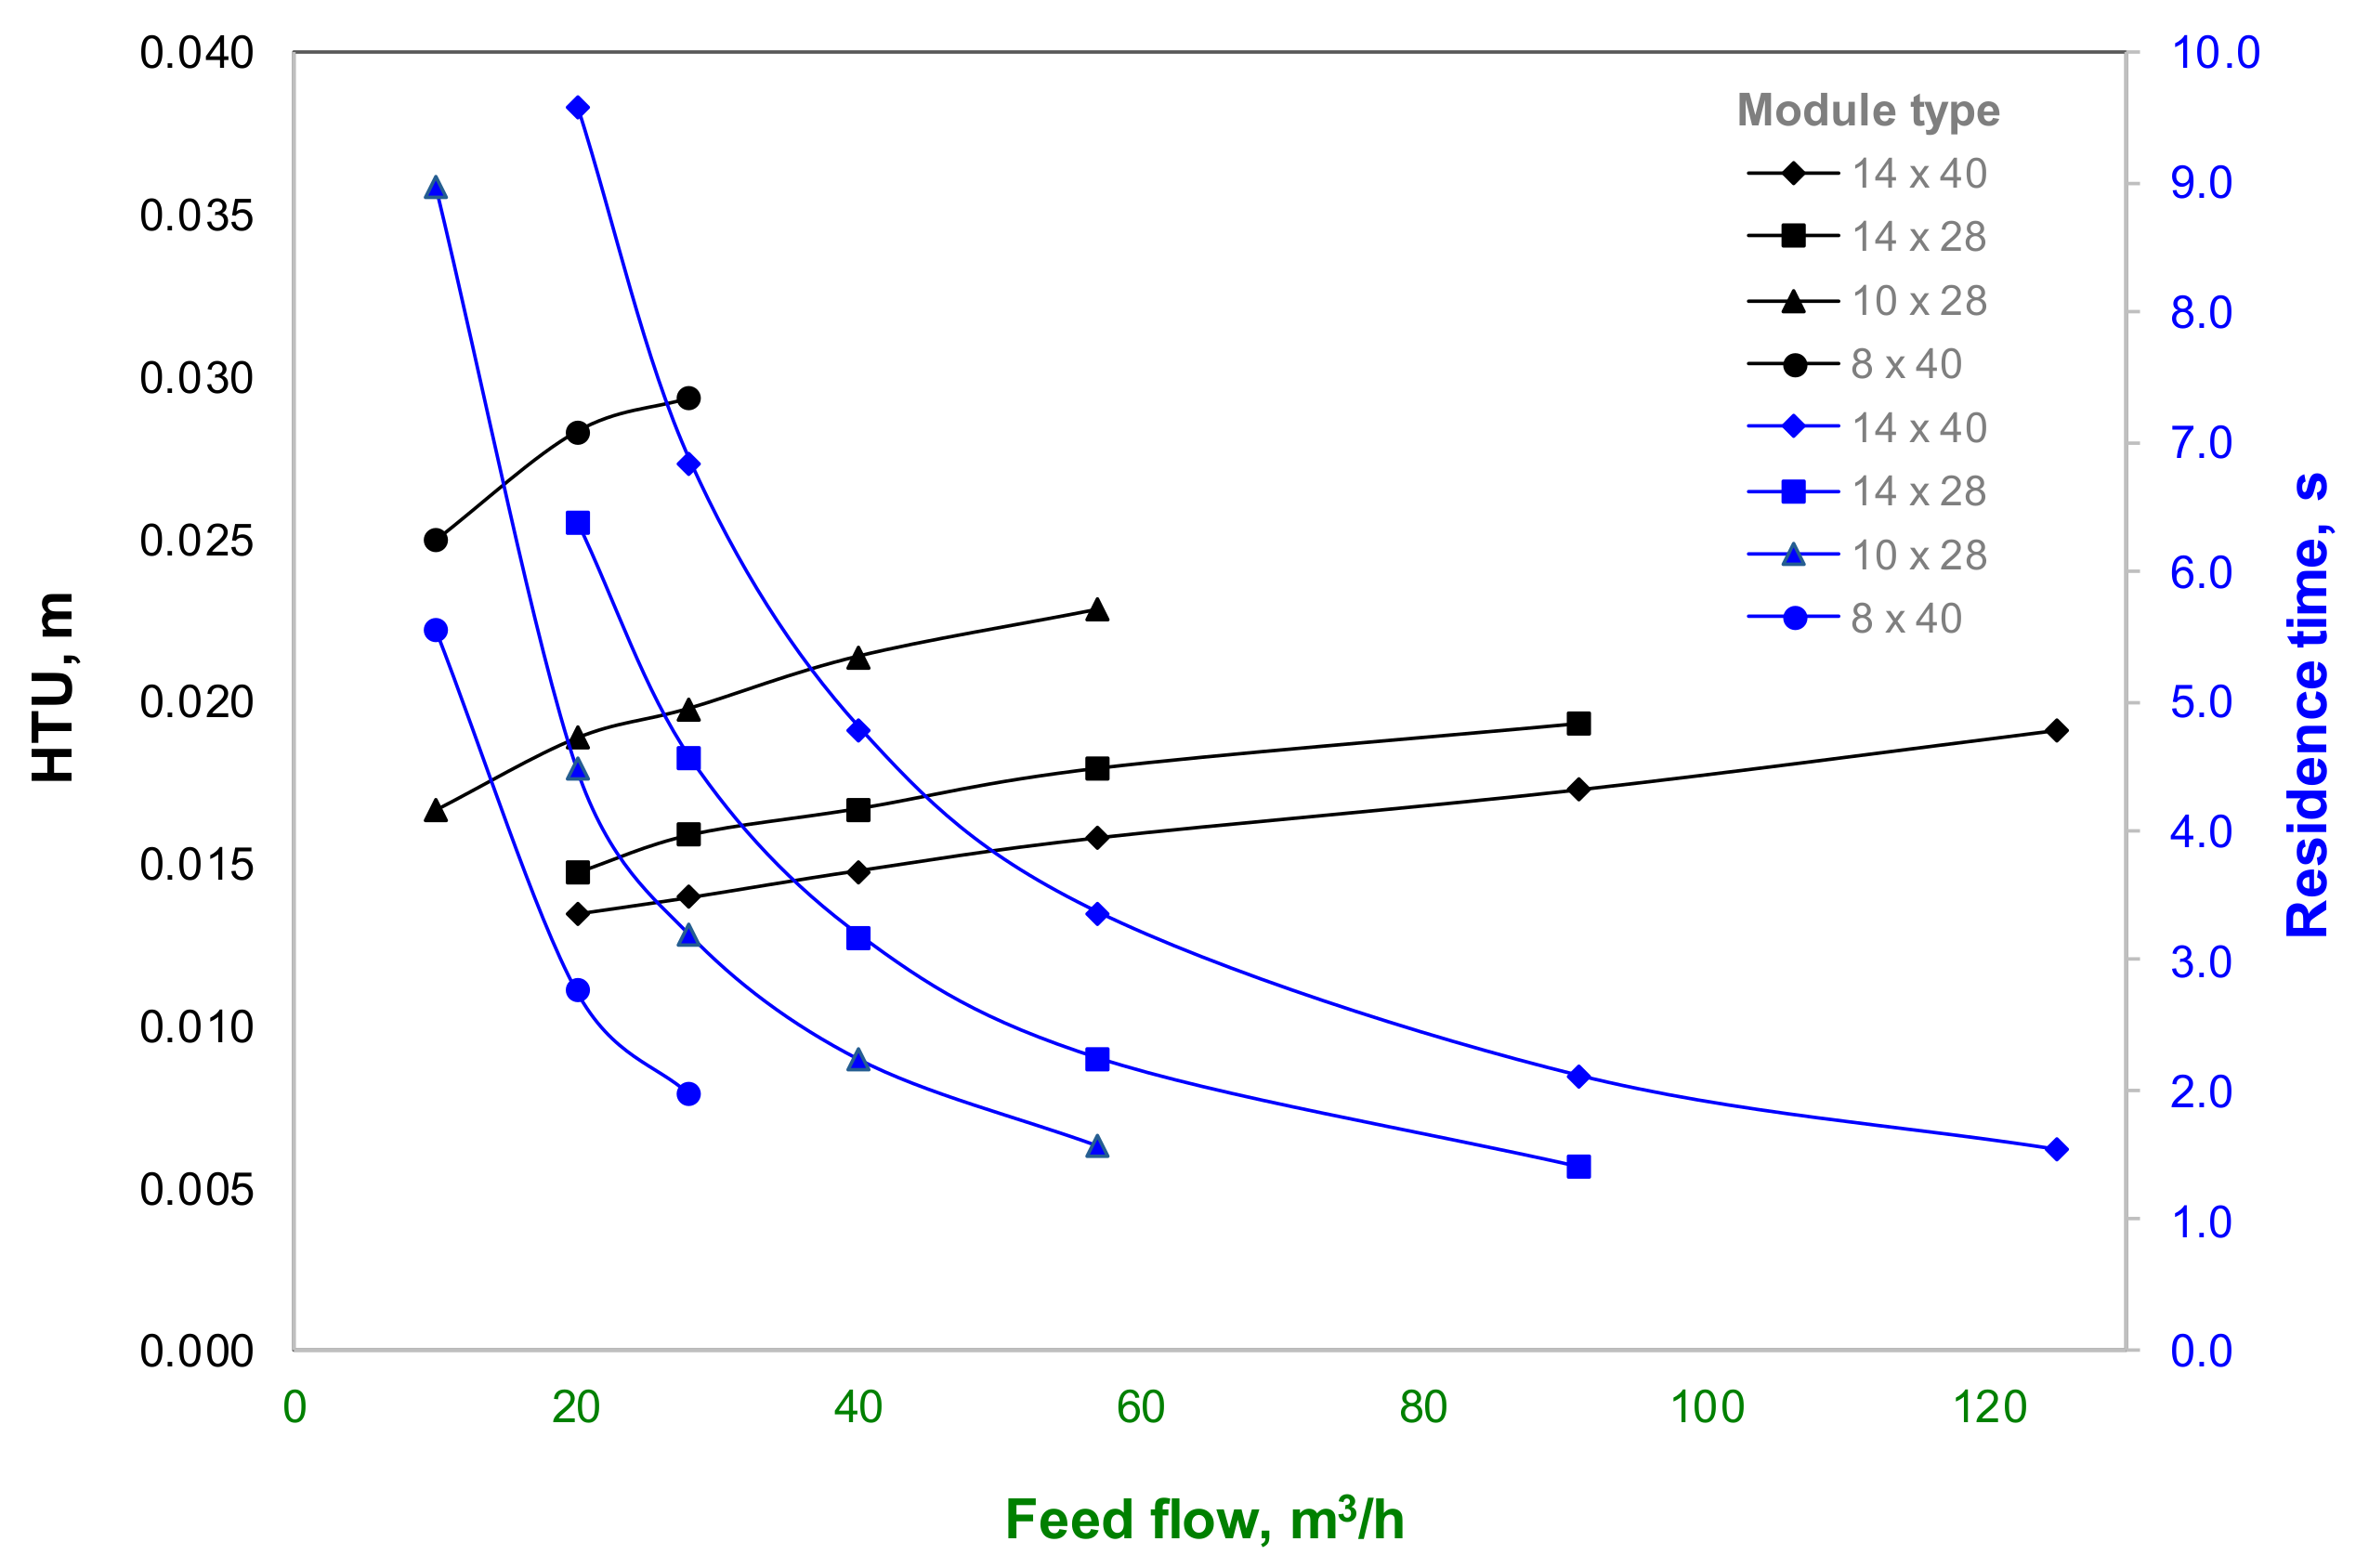
The HTU value is the main parameter for evaluating the performance of mass-transfer equipment, since this parameter depends on equipment dimensions and hydrodynamic characteristics; instead, the NTU value is defined by the operational conditions of the process. This supports the criterion for scaling-up based on ensuring the performance at different scales, where the HTU parameter should be the variable to keep it fixed at the maximum capacity of a membrane contactor module. This design criterion would allow the cyanide-recovery (process performance) expected for the maximum capacity of the different membrane modules to be ensured. Figure 7 shows the results of HTU values for the industrial Extra-Flow modules assessed as a function of the feed-flow rate. Here, the 14 × 40 Extra-Flow module presents the lowest HTU values and the HTU value at maximum capacity for each membrane module is different, so that it supports the earlier explanation of cyanide-recovery results from Figure 6. Hence, for a high requirement of cyanide solution treatment, the best performance represented by the highest cyanide recovery with minimum contact surface area could be achieved with the 14 × 40 Extra-Flow module at 125 m3/h. Nevertheless, when the required treatment capacity is lower and a membrane module with less capacity is selected for economic reasons, the kinetics of cyanide transfer will be slower, increasing the required contact surface area for mass transfer. Likewise, the same cyanide-recovery values having different HTU values for each membrane module are explained by different NTU values, i.e., when the HTU value increases, the NTU value decreases. This is promoted by the residence time reached for each membrane module at different feed-flow rates. Figure 7 shows the residence time values for each membrane module where the smallest modules present lower residence-time values with respect to the bigger ones. This fact promotes a decrease of cyanide transfer, yet the mass-transfer coefficient is higher in these modules with respect to the larger ones. Thus, the main issue of scaling-up a membrane module based on the flow rate capacity is the increase of surface area available for mass transfer, which should increase with additional membrane modules to reach a cyanide recovery higher than 90%, particularly for a plant with capacities below 57 m3/h.
3.3. Determination of the Optimal Operational Condition
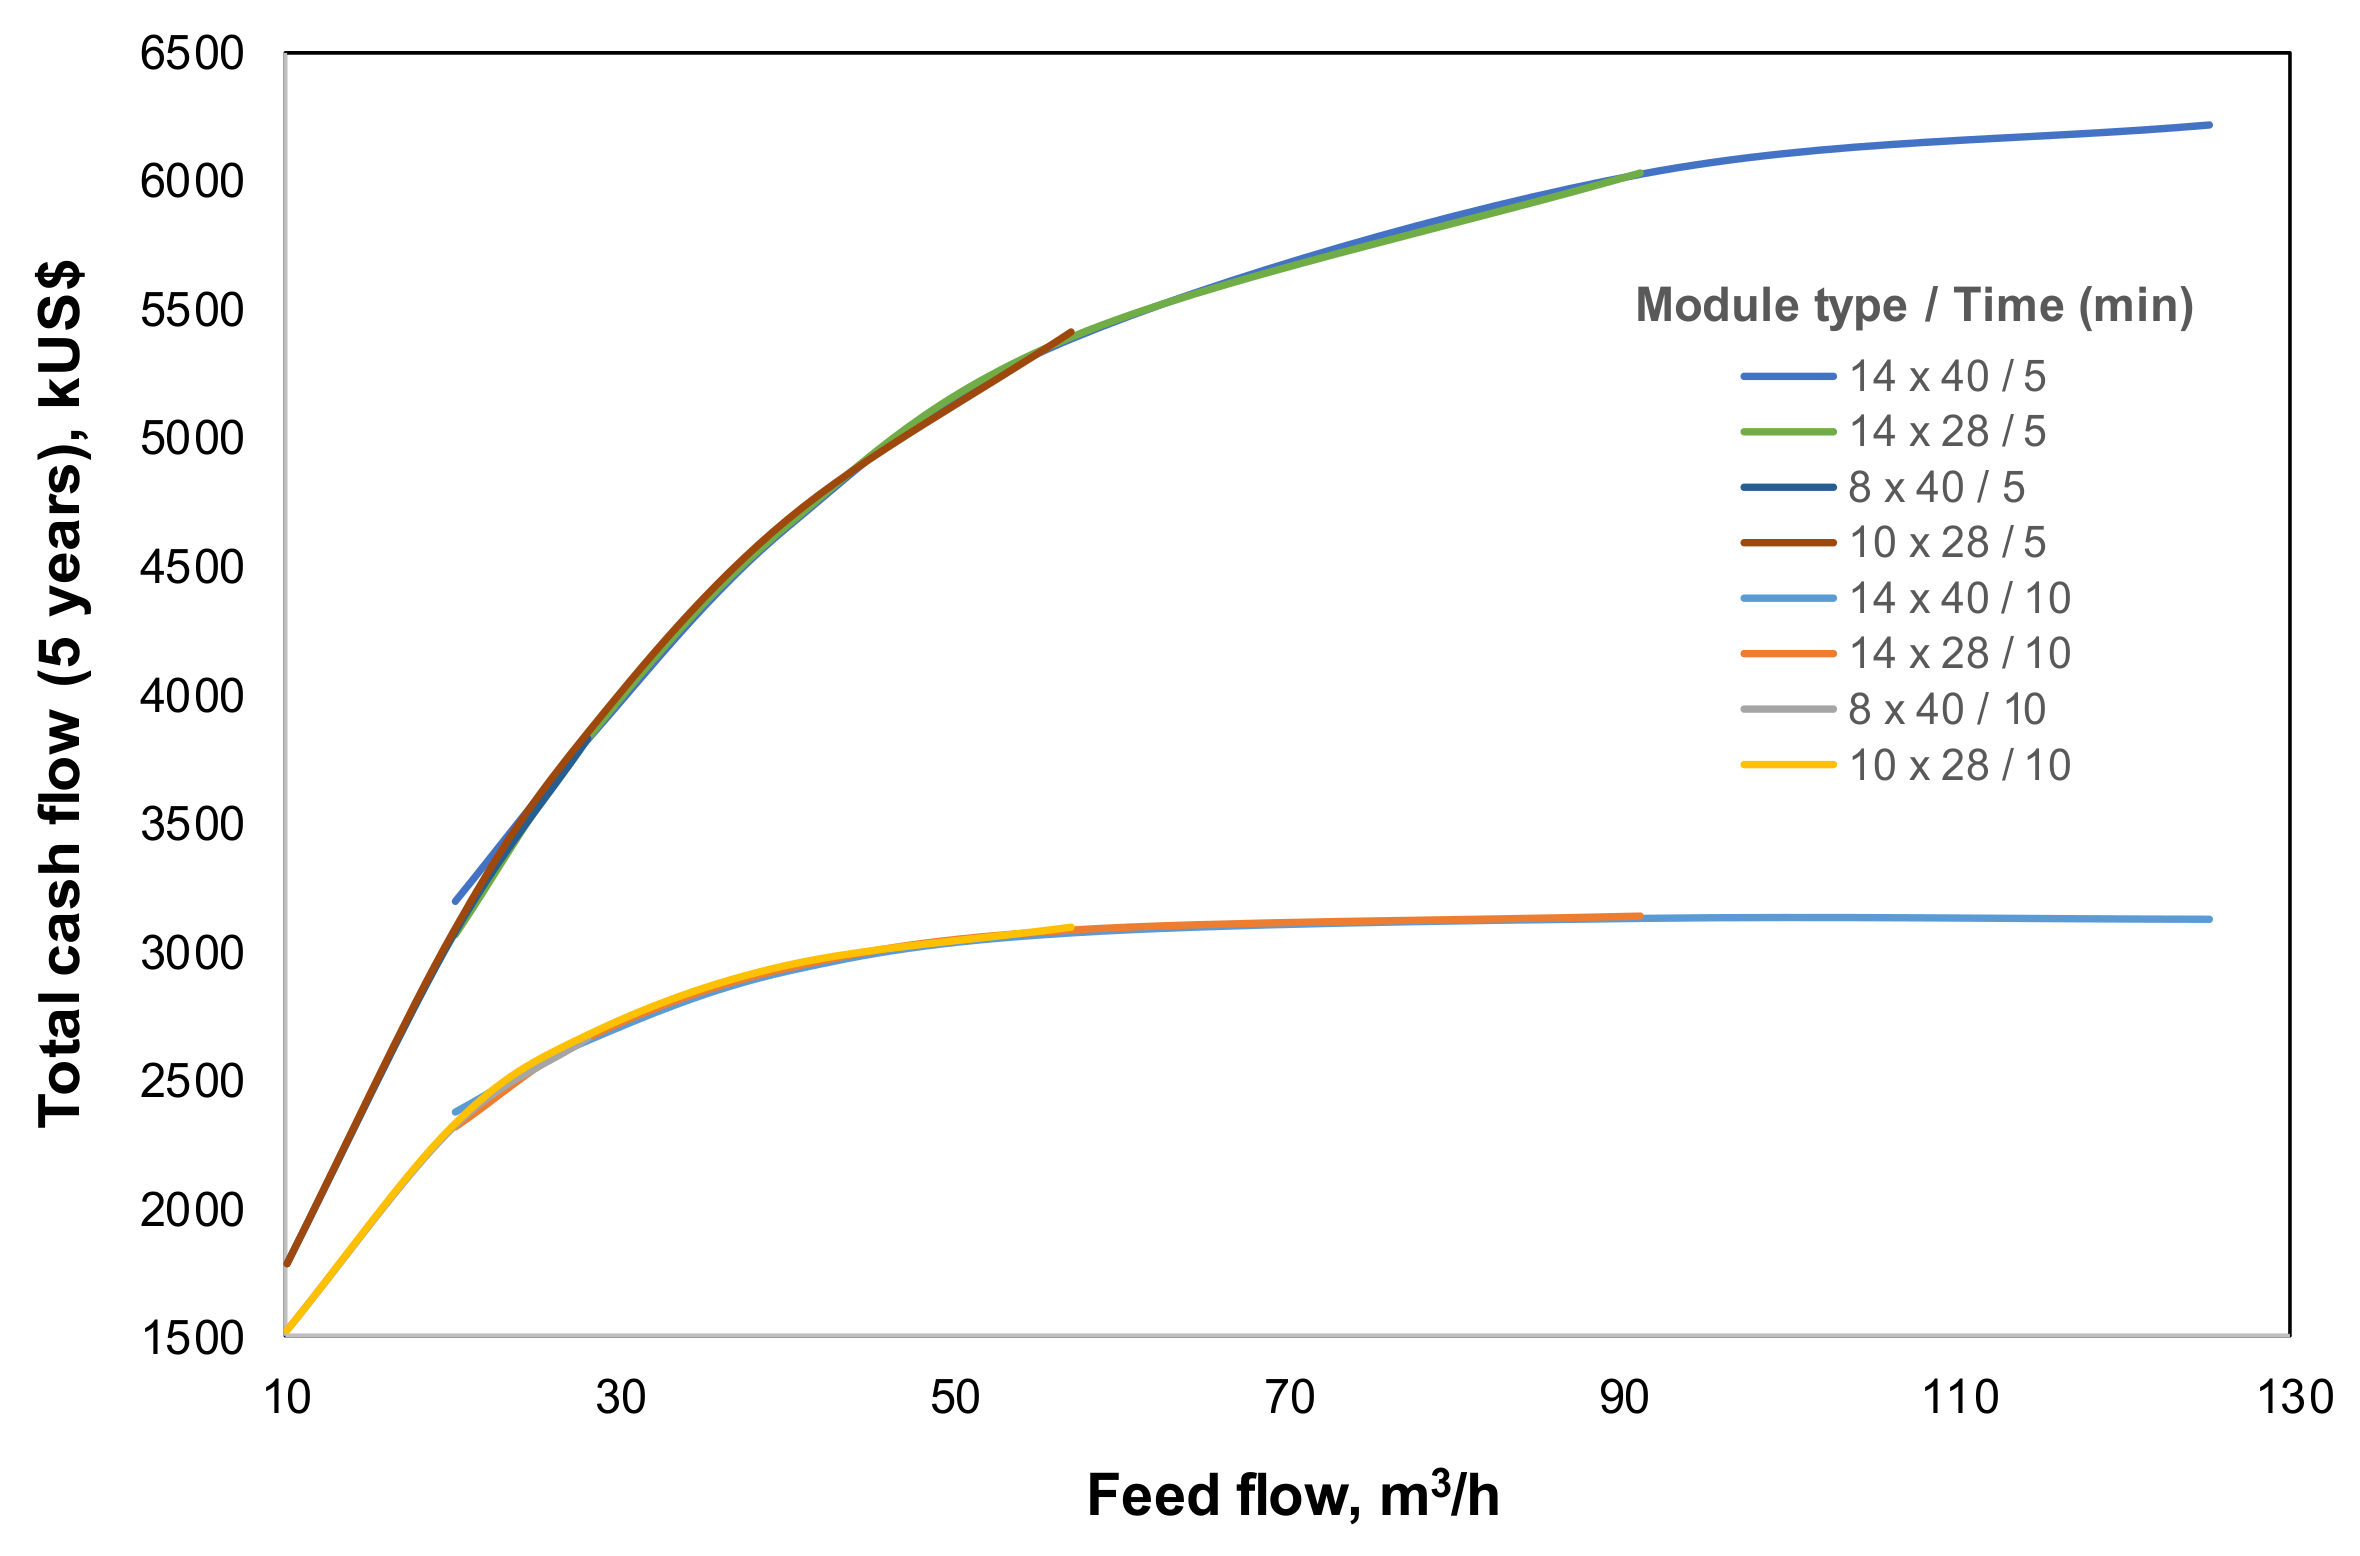
The energy losses promoted by the pressure drop in the membrane modules are the main cost intrinsically associated with a membrane contactor, and is related to the investment cost for each module. For the cyanide-recovery process, the acid consumption has to be considered in an economic evaluation; however, this cost is constant for each case because the initial mass of cyanide to be extracted is the same and equal to 3000 kg. Therefore, it has not been considered in this evaluation. Figure 8 presents the results of total cash flow for a 5-year time period, considering the cyanide recovery reached at 5 min and 10 min for each feed-flow rate and for each membrane module. These results show a minimum effect of pressure drop in the membrane module selection, due to the high cyanide-recovery value. In fact, the expected curve for each case should have a parabolic behavior, since the energy consumption increases when feed-flow rate does as well. However, in this case the increase in energy consumption is not enough to decrease the estimated cash flow. Furthermore, these results show a continuous behavior of each curve from each membrane module, generating a single cash flow curve for 5 min and 10 min. This result can be explained by the results of cyanide recovery reported in Figure 6 where the cyanide recovery determines the incomes, and is equal for each module at the same feed-flow rate of the treated solution. Moreover, the low impact of energy consumption does not allow a clear difference between the curves of cash flow for each module to be observed. The optimal operation for each module will, thus, always be observed at maximum flow rate, as explained by the increase of the mass-transfer coefficient, and consequently, by the cyanide recovery. Likewise, there is no difference in economic terms related to the selection of the best membrane module at a specific feed-flow rate of treated solution. These results could change for another element with a lower sale price, although this methodology should be performed to select the optimum feed-flow rate and membrane module. In this framework, the pressure drop information reported in Figure 4 is useful to predict the most efficient module in terms of energy, where the 14 × 40 HFMC shows the lowest curve of pressure drop.
Finally, the results obtained for 5 min of treatment are better than those estimated at 10 min, regardless of the higher cyanide recovery obtained at 10 min. In this case, the energy consumption is doubled, increasing the operational costs and, therefore, decreasing the related cash flow.
3.4. Design of GFMA Plant
The phenomenological model that considers Equations (1)–(3) as its main expressions has been solved and applied to estimate the surface contact area, and the required number of membrane modules for the cyanide recovery through the GFMA process. Table 6 shows the results of a case of study, which considers the treatment of a cyanide solution flow rate equal to 250 m3/h, using the different Extra-Flow modules tested in there. According to the results reported in Section 3.3, the best performance of each module is achieved at the maximum flow rate capacity; thereby, this analysis has been performed using the maximum feed-flow rate specified from the supplier for each membrane module. In this framework, the 14 × 28 Extra-Flow module shows the highest values of the overall mass-transfer coefficient, even better than the 14 × 40 Extra-Flow module that shows a high HTU value (Figure 7). This is because of its large contact surface area, higher than the value of the 14 × 28 Extra-Flow module. The higher mass-transfer coefficient determines, then, a lower area required per module with respect to the 14 × 40 module, and also the lowest area required in comparison with the other modules tested in this study. However, the higher transfer area of 14 × 40 module involves the lowest number of required modules (equal to 2), due to its high treatment capacity. Even though the use of the 14 × 40 module involves the lowest number of required modules and the 14 × 28 one includes the lowest contact surface area for mass transfer, all modules show a high overall mass-transfer coefficient. In fact, they associate the requirement of modules with the total flow rate capacity (total flow rate capacity/module capacity). This fact can be verified by the high performance that the Extra-Flow Liqui-Cel modules show with a design that maximizes the overall transfer coefficient. A similar result has been obtained by the study case that considers a cyanide solution flow rate equal to 57 m3/h (Table 7), where the number of required modules is proportional to the total capacity of treatment. Furthermore, the highest overall mass-transfer coefficient has been obtained for the 10 × 28 module operating at maximum capacity in this case, although the total area is lower than those of the 14 × 40 and 14 × 28 modules, determining a lower HTU value. Thus, the results of the overall mass-transfer coefficient from Table 6 and Table 7 are consistent with the results reported in Section 3.2 and Section 3.3, and there are no significant performance differences between the modules operating at the same flow rate because of their K × A relationship. In this way, a safe selection of membrane module for this application could be the 14 × 40 module, even taking into account its lower pressure drop and irrelevant difference of capital cost when compared with other modules. These results justify, as a design recommendation, the change in the scaling-up criteria: from keeping capacity to keeping the HTU value at different scales. Thus, when the treatment capacity is lower than 50–60 m3/h, a smaller membrane module will be more attractive.
The importance of the mass-transfer coefficient value can be verified from the results summarized in Table 8, which compares the estimations of this work with the data reported in a previous work [4]. Here, the 14 × 40 module was assessed in a parallel flow mode, using both the correlation proposed by Basu and collaborators [8,9] with the 14 × 40 module operating in cross-flow mode with a center baffle (Extra-Flow module), and also the correlations reported by Schoner and coworkers [24], and Shen and coworkers [28]. This last correlation was evaluated since it estimates the lowest mass-transfer coefficient value for the Extra-Flow modules (Table 5). The operational conditions of these results were fitted to the previous work. The results of Table 8 show the highest impact of the overall mass-transfer coefficient value in terms of design purposes, including the selection of the mass-transfer correlation and the type of module. The results obtained from the correlation proposed by Shen and coworkers increase the total number of modules from 4 to 28 with respect to the result using the correlation reported by Schoner and collaborators. As mentioned in Section 3.1, the correlation by Shen and coworkers is based on different systems and compiles a great variety of different results and systems in order to obtain a common correlation. Therefore, it is expected that the results are closer to those obtained from the correlation made by Schoner and collaborators. Nevertheless, it is recommended these results are verified with further experimental studies.
Finally, the results obtained in our previous study, where a cylindrical HFMC module operating in parallel flow mode was used and simulated, show the performance difference between the Extra-Flow module and a module in a typical parallel flow mode, increasing the number of required modules from 4 to 140 (156 according to the previous work [4], adding stand-by units). This last result is relevant not only for the obvious difference in the quantity of membrane modules, but also for the problems generated due to the high number of modules in-series. In addition, it is important to consider intermedia pumping systems because of the maximum tolerable feed pressure of modules as well as the increase of sensors, tanks and pumps associated with this requirement. This aspect was discussed in the previous work [4]. In this framework, an update of the economic evaluation using units operating at cross-flow mode with center baffle can be highly recommended in further research.
4. Conclusions
The Extra-Flow modules from Liqui-CelTM are the most widely HFMC used at industrial scale for absorption or stripping processes. In this study, an assessment of these modules for their application as a GFMA process for cyanide recovering in gold mining has been performed, based on a phenomenological model previously validated with experimental test-work. The results have shown scaling-up criteria for the different capacities of Extra-Flow modules, based on capacity, but neglecting to ensure performance results at different capacities. This fact could affect the use of experimental results to scale-up at industrial capacities, particularly for capacities below 50 m3/h, where the largest-capacity module (14 × 40) still presents similar performance and profits with respect to the smaller modules. However, the high mass-transfer coefficient reached by the Extra-Flow modules allows high performances to be obtained using low quantities of industrial modules with different capacity requirements, hiding the possible problems of the scaling-up criterion based on capacity. Nevertheless, the GFMA application for another element or for high-treatment capacities requirement, such as those of the mining industry, could show this scaling-up issue. Finally, the development of further studies focusing on scaling-up and mass-transfer correlation is highly recommended for Extra-Flow modules, using experimental and/or industrial data.
Acknowledgments
The authors thank the National Commission for Scientific and Technological Research (CONICYT, Chile) for financial support through Project Fund No. FB0809 PIA CONICYT and the FONDEF/IDeA Program, FONDEF/CONICYT 2017+ID17I10021.
Author Contributions
H.E., E.T. and R.R.-F. conceived and designed the experiments; H.E. and R.R.-F. performed the experiments; E.T., R.R.-F. and J.R. analyzed the data; H.E. wrote the paper.
Conflicts of Interest
The authors declare no conflict of interest.
References
- Imai, M.; Furusaki, S.; Miyauchi, T. Separation of Volatile Materials by Gas Membranes. Ind. Eng. Chem. Process Des. Dev. 1982, 21, 421–426. [Google Scholar] [CrossRef]
- Qi, Z.; Cussler, E.L. Hollow Fiber Gas Membranes. AIChE J. 1985, 31, 1548–1553. [Google Scholar] [CrossRef]
- Estay, H.; Ortiz, M.; Romero, J. A novel process based on gas filled membrane absorption to recover cyanide in gold mining. Hydrometallurgy 2013, 134–135, 166–175. [Google Scholar] [CrossRef]
- Estay, H.; Troncoso, E.; Romero, J. Design and cost estimation of a gas-filled membrane absorption (GFMA) process as alternative for cyanide recovery in gold mining. J. Membr. Sci. 2014, 466, 253–264. [Google Scholar] [CrossRef]
- Kuyucak, N.; Akcil, A. Cyanide and removal options from effluents in gold mining and metallurgical processes. Miner. Eng. 2013, 50–51, 13–29. [Google Scholar] [CrossRef]
- Gabelman, A.; Hwang, S. Hollow fiber membrane contactors. J. Membr. Sci. 1999, 159, 61–106. [Google Scholar] [CrossRef]
- Hasanoĝlu, A.; Romero, J.; Pérez, B.; Plaza, A. Ammonia removal from wastewater streams through membrane contactors: Experimental and theoretical analysis of operation parameters and configuration. Chem. Eng. J. 2010, 160, 530–537. [Google Scholar] [CrossRef]
- Basu, R.; Prasad, R.; Sirkar, K.K. Nondispersive membrane solvent back extraction of Phenol. AIChE J. 1990, 36, 450–460. [Google Scholar] [CrossRef]
- Yun, C.H.; Prasad, R.; Guha, A.K.; Sirkar, K.K. Hollow fiber solvent extraction removal of toxic heavy metals from aqueous waste streams. Ind. Eng. Chem. Res. 1993, 32, 1186–1195. [Google Scholar] [CrossRef]
- LiquiCel, LiquiCel Catalogue. (n.d.). Available online: http://www.liquicel.com/product-information/data-sheets.cfm (accessed on 3 November 2017).
- Sengupta, A.; Peterson, P.A.; Miller, B.D.; Schneider, J.; Fulk, C.W. Large-scale application of membrane contactors for gas transfer from or to ultrapure water. Sep. Purif. Technol. 1998, 14, 189–200. [Google Scholar] [CrossRef]
- Ulbricht, M.; Lakner, G.; Lakner, J.; Belafi-Bako, K. TransMembraneChemiSorption of ammonia from sealing water in Hungarian powder metallurgy furnace. Desalin. Water Treat. 2017, 75, 253–259. [Google Scholar] [CrossRef]
- Lee, J.G.; Kim, W.S.; Choi, J.S.; Ghaffour, N.; Kim, Y.D. A novel multi-stage direct contact membrane distillation module: Design, experimental and theoretical approaches. Water Res. 2016, 107, 47–56. [Google Scholar] [CrossRef] [PubMed]
- Cai, J.J.; Hawboldt, K.; Abdi, M.A. Analysis of the effect of module design on gas absorption in cross flow hollow membrane contactors via computational fluid dynamics (CFD) analysis. J. Membr. Sci. 2016, 520, 415–424. [Google Scholar] [CrossRef]
- Quek, V.C.; Shah, N.; Chachuat, B. Modeling for design and operation of high-pressure membrane contactors in natural gas sweetening. Chem. Eng. Res. Des. 2018, 132, 1005–1019. [Google Scholar] [CrossRef]
- Wan, C.F.; Yang, T.; Lipscomb, G.G.; Stookey, D.J.; Chung, T.S. Design and fabrication of hollow fiber membrane modules. J. Membr. Sci. 2017, 538, 96–107. [Google Scholar] [CrossRef]
- Estay, H.; Troncoso, E.; Ruby-Figueroa, R.; Romero, J. Performance evaluation of mass transfer correlations in the GFMA process: A review with perspectives to the design. J. Membr. Sci. 2018, 55, 140–155. [Google Scholar] [CrossRef]
- Yang, M.-C.; Cussler, E.L. Designing hollow-fiber contactors. AIChE J. 1986, 32, 1910–1916. [Google Scholar] [CrossRef]
- Prasad, R.; Sirkar, K.K. Dispersion-free solvent extraction with microporous hollow fiber modules. AIChE J. 1988, 34, 177–188. [Google Scholar] [CrossRef]
- Prasad, R.; Sirkar, K.K. Hollow fiber solvent extraction: Performances and design. J. Membr. Sci. 1990, 50, 153–175. [Google Scholar] [CrossRef]
- Viegas, R.M.C.; Rodríguez, M.; Luque, S.; Alvarez, J.R.; Coelhoso, I.M.; Crespo, J.P.S.G. Mass transfer correlations in membrane extraction: Analysis of Wilson-plot methodology. J. Membr. Sci. 1998, 145, 129–142. [Google Scholar] [CrossRef]
- Gawroński, R.; Wrzesińska, B. Kinetics of solvent extraction in hollow-fiber contactors. J. Membr. Sci. 2000, 168, 213–222. [Google Scholar] [CrossRef]
- Dahuron, L.; Cussler, E.L. Protein extractions with hollow fibers. AIChE J. 1988, 34, 130–136. [Google Scholar] [CrossRef]
- Schoner, P.; Plucinski, P.; Nitsch, W.; Daiminger, U. Mass transfer in the shell side of cross flow hollow fiber modules. Chem. Eng. Sci. 1998, 53, 2319–2326. [Google Scholar] [CrossRef]
- Baudot, A.; Floury, J.; Smorenburg, H.E. Liquid-liquid extraction of Aroma Compounds with Hollow Fiber Contactor. AIChE J. 2001, 47, 1780–1793. [Google Scholar] [CrossRef]
- Zheng, J.M.; Dai, Z.W.; Wong, F.S.; Xu, Z.K. Shell side mass transfer in a transverse flow hollow fiber membrane contactor. J. Membr. Sci. 2005, 261, 114–120. [Google Scholar] [CrossRef]
- Fouad, E.A.; Bart, H.J. Separation of zinc by a non-dispersion solvent extraction process in a hollow fiber contactor. Solvent Extr. Ion Exch. 2007, 25, 857–877. [Google Scholar] [CrossRef]
- Shen, S.; Kentish, S.E.; Stevens, G.W. Shell-Side Mass-Transfer Performance in Hollow-Fiber Membrane Contactors. Solvent Extr. Ion Exch. 2010, 28, 817–844. [Google Scholar] [CrossRef]
- Fleming, C.A. Cyanide recovery. Dev. Miner. Process. 2005, 15, 703–727. [Google Scholar] [CrossRef]
- Botz, M.M.; Scola, J.C.; Fueyo, R.; de Moura, W. Cyanide Recovery Practice at Cerro Vanguardia. In Proceedings of the SME Annual Meeting, Denver, CO, USA, 23–25 February 2004. [Google Scholar]
- Tarafder, S.A.; McDermott, C.I.; Schüth, C. Vacuum assisted removal of volatile to semi volatile organic contaminants from water using hollow fiber membrane contactors. II: A hybrid numerical-analytical modeling approach. J. Membr. Sci. 2007, 292, 9–16. [Google Scholar] [CrossRef]
- Karoor, S.; Sirkar, K.K. Gas Absorption Studies in Microporous Hollow Fiber Membrane Modules. Ind. Eng. Chem. Res. 1993, 32, 674–684. [Google Scholar] [CrossRef]
- Demontigny, D.; Tontiwachwuthikul, P.; Chakma, A. Comparing the absorption performance of packed columns and membrane contactors. Ind. Eng. Chem. Res. 2005, 44, 5726–5732. [Google Scholar] [CrossRef]
Figure 1.
Schematic diagram of the gas-filled membrane absorption (GFMA) process with two gas–liquid interfaces at the pore entrances.
Figure 1.
Schematic diagram of the gas-filled membrane absorption (GFMA) process with two gas–liquid interfaces at the pore entrances.

Figure 2.
Schematic configuration of an Extra-Flow hollow-fiber membrane contactor (HFMC) module, developed and supplied by Liqui-CelTM.
Figure 2.
Schematic configuration of an Extra-Flow hollow-fiber membrane contactor (HFMC) module, developed and supplied by Liqui-CelTM.

Figure 3.
Schematic configuration of an HFMC cylindrical module with parallel flow and no baffles.

Figure 4.
Pressure drop values for each Extra-Flow module evaluated (Data based on supplier information [10]).
Figure 4.
Pressure drop values for each Extra-Flow module evaluated (Data based on supplier information [10]).
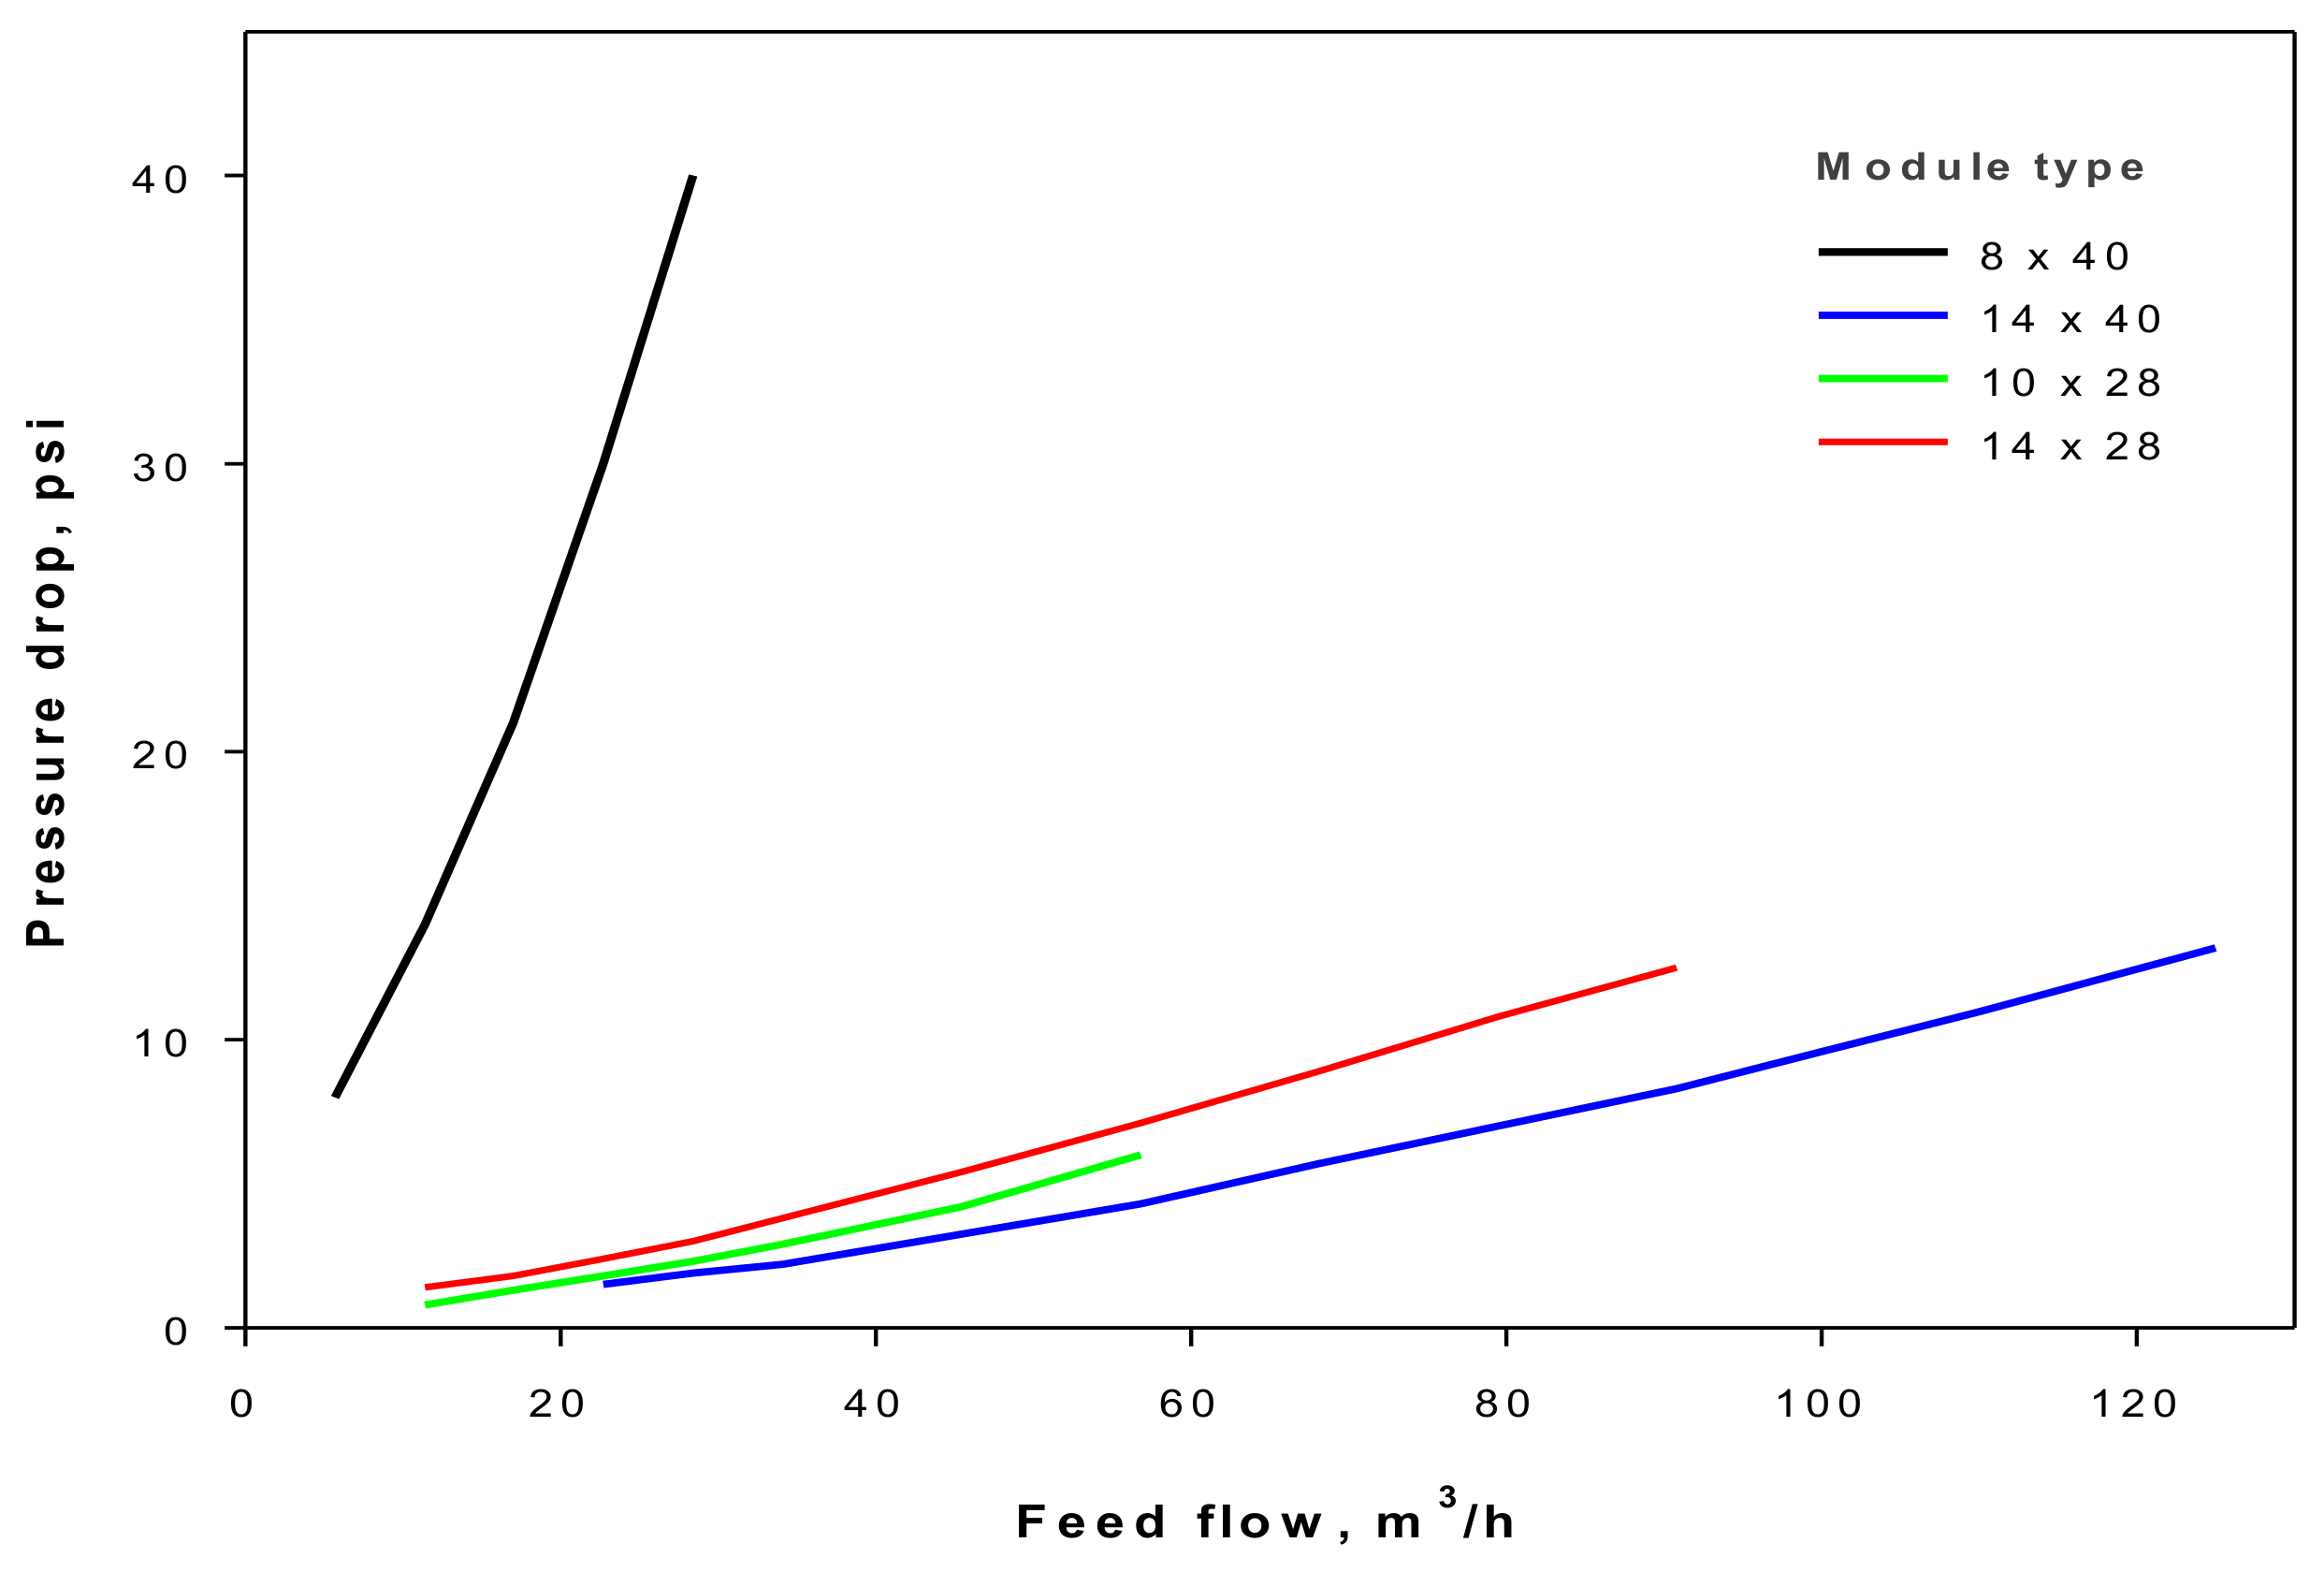
Figure 5.
Cyanide-recovery results in the GFMA process for the experimental results of the previous study [3] and the simulation of the 2.8 × 8 Extra-Flow module from Liqui-CelTM (based on results from previous work [17]).

Figure 6.
Cyanide recovery of the GFMA process for each Extra-Flow module simulated by using the phenomenological model.
Figure 6.
Cyanide recovery of the GFMA process for each Extra-Flow module simulated by using the phenomenological model.
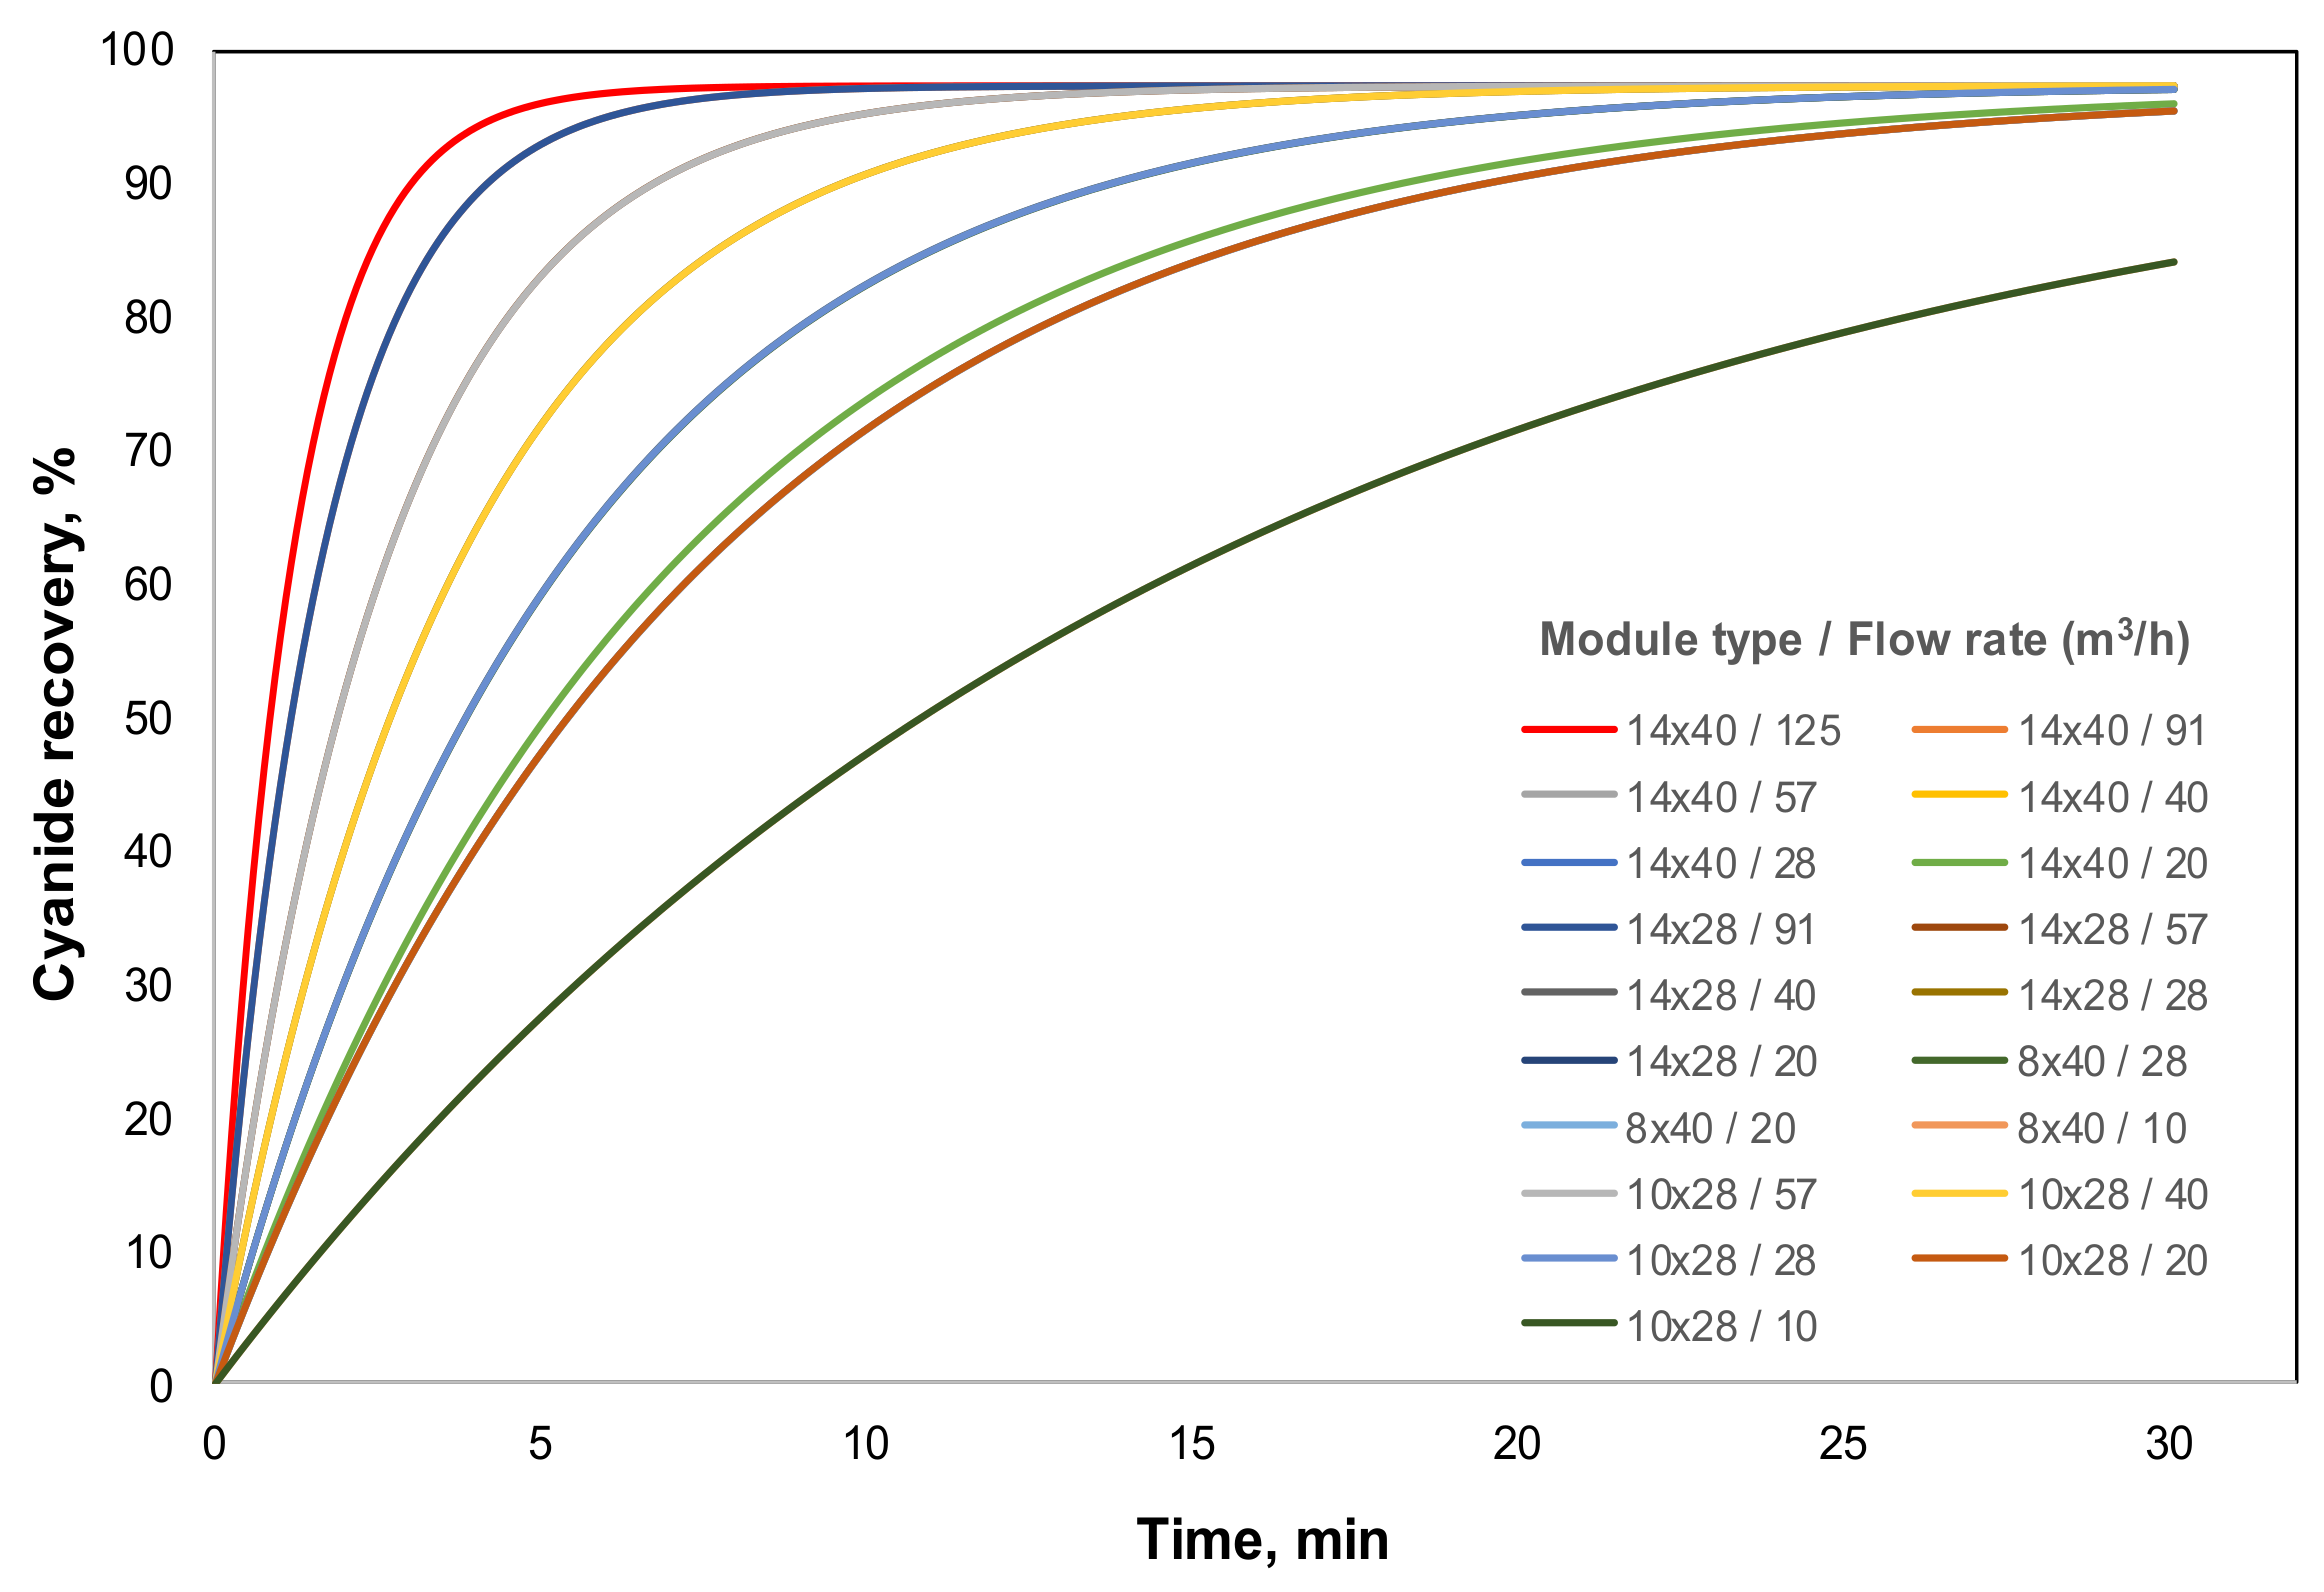
Figure 7.
Length of the transfer unit (HTU) and residence time values for Extra-Flow modules respect to the feed flow.
Figure 7.
Length of the transfer unit (HTU) and residence time values for Extra-Flow modules respect to the feed flow.

Figure 8.
Total cash flow for a 5-year time period and cyanide extraction times of 5 min and 10 min.
Figure 8.
Total cash flow for a 5-year time period and cyanide extraction times of 5 min and 10 min.


Table 1.
Mass transfer correlations for the shell side in the Extra-Flow modules.
| Author | Correlation 1 | Equation Number | Reference |
|---|---|---|---|
| Schoner et al., 1998 | (4) | [24] | |
| Baudot et al., 2001 | (5) | [25] | |
| Zheng et al., 2005 | (6) | [26] | |
| Fouad et al., 2007 | (7) | [27] | |
| Shen et al., 2010 | (8) | [28] |
1 Re depends on equivalent diameter and shell side velocity, defined by: de = [ds2 − dct2 − ndout2]/[ndout], vs = [2Q(ln(ds/dct)]/[πL(ds − dct)]; Re = [vsdeρ]/μ, where ds is the internal diameter of shell; dct is the outer diameter of the central tube; vs is the velocity in the shell side and Q is the volume flow fed into the shell side.
Table 2.
Operational conditions and parameters of membrane contactor used in our previous study (based on experimental data used in our previous work [3]).
Table 2.
Operational conditions and parameters of membrane contactor used in our previous study (based on experimental data used in our previous work [3]).
| Description | Value | Unit |
|---|---|---|
| Feed tank volume | 0.5 | L |
| Absorption tank volume | 0.5 | L |
| Feed cyanide solution flow | 2.0 | L min−1 |
| Feed–Absorption flow ratio | 1 | L L−1 |
| pH of cyanide solution | 5 | - |
| Total cyanide concentration | ~2000 | mg L−1 |
| Copper concentration | 100 | mg L−1 |
| Zinc concentration | 500 | mg L−1 |
| Temperature | 15 | °C |
| Membrane material | Polypropylene | - |
| Number of fibers | 7400 | - |
| Surface contact area | 0.58 | m2 |
| Fiber outside diameter | 330 | µm |
| Fiber inside diameter | 220 | µm |
| Shell inside diameter | 0.043 | m |
| Membrane contactor length | 0.12 | m |
Table 3.
Membrane contactor parameters for different Extra-Flow Liqui-CelTM modules.
| Description | 2.5 × 8 | 8 × 40 4 | 10 × 28 | 14 × 28 | 14 × 40 | Unit |
|---|---|---|---|---|---|---|
| Flow capacity reported 1 | 0.1–0.7 | 7–28 | 10–57 | 16–91 | 16–125 | m3 h−1 |
| Membrane material | polypropylene | polypropylene | polypropylene | polypropylene | - | |
| Number of fibers | 9950 2 | 126,363 3 | 226,122 3 | 382,668 3 | 389,533 3 | - |
| Surface contact area 1 | 1.4 | 121 | 130 | 220 | 373 | m2 |
| Fiber outer diameter 1 | 300 | 300 | 300 | 300 | 300 | µm |
| Fiber inside diameter 1 | 220 | 220 | 220 | 220 | 220 | µm |
| Shell inside diameter 1 | 0.056 | 0.212 | 0.245 | 0.29 | 0.29 | m |
| Center tube diameter 1 | 0.0222 | 0.0565 | 0.114 | 0.1102 | 0.1102 | m |
| Packing fraction 2 | 0.53 | - | 0.43 | - | - | - |
| Shell volume 1 | 0.4 | 15.4 | 24.9 | 35.4 | 53.2 | L |
| Membrane fiber length 1 | 0.15 | 1.016 | 0.61 | 0.61 | 1.016 | m |
Table 4.
Prices values used to determine the optimal operational conditions for each industrial module.
Table 4.
Prices values used to determine the optimal operational conditions for each industrial module.
| Description | Value | Unit |
|---|---|---|
| NaCN | 2200 | US$/ton |
| Energy | 100 | US$/MWh |
| 8 × 40 Extra-Flow module | 20,000 | US$ |
| 10 × 28 Extra-Flow module | 17,000 | US$ |
| 14 × 28 Extra-Flow module | 23,000 | US$ |
| 14 × 40 Extra-Flow module | 32,000 | US$ |
Table 5.
Results of the overall mass-transfer coefficients for the shell side mass-transfer correlations for the Liqui-CelTM module [17].
Table 5.
Results of the overall mass-transfer coefficients for the shell side mass-transfer correlations for the Liqui-CelTM module [17].
| Correlation | K, m/s | Original System |
|---|---|---|
| Schoner et al., 1998 [24] | 7.36 × 10⁻⁵ | Solvent extraction |
| Baudot et al., 2001 [25] | 2.0 × 10⁻⁵ | Solvent extraction |
| Zheng et al., 2005 [26] | 6.70 × 10⁻⁵ | Gas absorption |
| Fouad et al., 2007 [27] | 2.02 × 10⁻⁴ | Solvent extraction |
| Shen et al., 2010 [28] | 2.10 × 10⁻⁶ | Different systems |
Table 6.
Estimation of required area and number of Liqui-CelTM membrane modules for the treatment of 250 m3/h of cyanide solution in the GFMA process.
Table 6.
Estimation of required area and number of Liqui-CelTM membrane modules for the treatment of 250 m3/h of cyanide solution in the GFMA process.
| Description | 14 × 40 | 14 × 28 | 10 × 28 | 8 × 40 | Unit |
|---|---|---|---|---|---|
| Overall mass-transfer coefficient | 1.14 × 10⁻³ | 1.30 × 10⁻³ | 9.41 × 10⁻⁴ | 4.14 × 10⁻⁴ | m3 s−1 |
| Cyanide recovery | 95 | 95 | 95 | 95 | % |
| Total feed flow | 250 | 250 | 250 | 250 | m3 h−1 |
| Minimum required area 1 | 182.5 | 160 | 221.1 | 502.5 | m2 |
| Area of membrane module | 373 | 220 | 130 | 121 | m2 |
| Feed flow per module | 125 | 91 | 57 | 28 | m3 h−1 |
| Number of parallel circuits | 2 | 3 | 5 | 9 | - |
| Required area per module | 91.2 | 58.3 | 50.4 | 56.3 | m2 |
| Number of in-series modules | 1 | 1 | 1 | 1 | - |
| Total modules | 2 | 3 | 5 | 9 | - |
1 Estimated from Equation (7).
Table 7.
Estimation of required area and number of Liqui-CelTM membrane modules for the treatment of 57 m3/h of cyanide solution in the GFMA process.
Table 7.
Estimation of required area and number of Liqui-CelTM membrane modules for the treatment of 57 m3/h of cyanide solution in the GFMA process.
| Description | 14 × 40 | 14 × 28 | 10 × 28 | 8 × 40 | Unit |
|---|---|---|---|---|---|
| Overall mass-transfer coefficient | 6.03 × 10⁻⁴ | 9.10 × 10⁻⁴ | 9.41 × 10⁻⁴ | 4.14 × 10⁻⁴ | m3 s−1 |
| Cyanide Rrcovery | 95 | 95 | 95 | 95 | % |
| Total feed flow | 57 | 57 | 57 | 57 | m3 h−1 |
| Minimum required area 1 | 78.7 | 52.1 | 50.4 | 114.6 | m2 |
| Area of membrane module | 373 | 220 | 130 | 121 | m2 |
| Feed flow per module | 57 | 57 | 57 | 28 | m3 h−1 |
| Number of parallel circuits | 1 | 1 | 1 | 2 | - |
| Required area per module | 78.7 | 52.1 | 50.4 | 56.3 | m2 |
| Number of in-series modules | 1 | 1 | 1 | 1 | - |
| Total modules | 1 | 1 | 1 | 2 | - |
1 Estimated from Equation (7).
Table 8.
Impact analysis of the mass-transfer correlation used for estimating total membrane modules required to recover cyanide in the GFMA process.
Table 8.
Impact analysis of the mass-transfer correlation used for estimating total membrane modules required to recover cyanide in the GFMA process.
| Description | 14 × 40 Schoner | 14 × 40 Shen | 14 × 40 Basu | Unit |
|---|---|---|---|---|
| Overall mass-transfer coefficient | 6.29 × 10⁻⁴ | 1.51 × 10⁻⁵ | 2.00 × 10⁻⁶ | m3 s−1 |
| Cyanide recovery | 90 | 90 | 90 | % |
| Total feed flow | 240 | 240 | 240 | m3 h−1 |
| Minimum required area 1 | 244.2 | 10,172.7 | 76,906.6 | m2 |
| Area of membrane module | 373 | 373 | 559 2 | m2 |
| Feed flow per module | 60 | 60 | 60 | m3 h−1 |
| Number of parallel circuits | 4 | 4 | 4 | - |
| Required area per module | 61.1 | 2544 | 19,227 | m2 |
| Number of in-series modules | 1 | 7 | 35 | - |
| Total modules | 4 | 28 | 140 | - |
1 Estimated from Equation (7); 2 this area was estimated in the previous work, based on outer diameter of fibers. In this study, the area specified by Liqui-Cel has been used.
© 2018 by the authors. Licensee MDPI, Basel, Switzerland. This article is an open access article distributed under the terms and conditions of the Creative Commons Attribution (CC BY) license (http://creativecommons.org/licenses/by/4.0/).
Share and Cite
MDPI and ACS Style
Estay, H.; Troncoso, E.; Ruby-Figueroa, R.; Romero, J. Assessment of Industrial Modules to Design a GFMA Process for Cyanide Recovery Based on a Phenomenological Model. Processes 2018, 6, 34. https://doi.org/10.3390/pr6040034
AMA Style
Estay H, Troncoso E, Ruby-Figueroa R, Romero J. Assessment of Industrial Modules to Design a GFMA Process for Cyanide Recovery Based on a Phenomenological Model. Processes. 2018; 6(4):34. https://doi.org/10.3390/pr6040034
Chicago/Turabian StyleEstay, Humberto, Elizabeth Troncoso, René Ruby-Figueroa, and Julio Romero. 2018. "Assessment of Industrial Modules to Design a GFMA Process for Cyanide Recovery Based on a Phenomenological Model" Processes 6, no. 4: 34. https://doi.org/10.3390/pr6040034
Note that from the first issue of 2016, this journal uses article numbers instead of page numbers. See further details here.