Article

Effect of Alkane Chain Length on Crystallization in Emulsions during Supercooling in Quiescent Systems and under Mechanical Stress

Karlsruhe Institute of Technology (KIT), Institute of Process Engineering in Life Sciences (BLT), Section I: Food Process Engineering (LVT), Kaiserstr. 12, 76131 Karlsruhe, Germany
*
Author to whom correspondence should be addressed.
Processes 2018, 6(1), 6; https://doi.org/10.3390/pr6010006
Submission received: 15 November 2017 / Revised: 10 January 2018 / Accepted: 12 January 2018 / Published: 15 January 2018

Abstract

:
Crystallization behavior of hexadecane (C16H34), octadecane (C18H38), eicosane (C20H42), and docosane (C22H46) dispersions of similar mean droplet diameter (x50.2 ≈ 15 µm) was investigated in quiescent systems and compared to crystallization under mechanical stress. In quiescent systems, the required supercooling decreased with increasing chain length of the alkanes to initiate crystallization. Crystallization of alkane dispersions under mechanical stress resulted in similar onset crystallization supercooling, as during quiescent crystallization. Increase of mechanical stress did not affect the onset crystallization supercooling within alkane dispersions.

Graphical Abstract

1. Introduction

Crystalline dispersions are widely used in the chemical and life science industry [1,2,3]. They act as high performance lubricants or release agents, are applied as delivery systems with site-specific and controlled release kinetics or are added to foods and feeding stuffs to increase the bioavailability and biocompatibility of encapsulated active ingredients [4,5,6,7,8,9,10]. Due to the distinctive viscoelastic behavior of the encapsulating material, these dispersions are usually produced in a two-step melt emulsification process: in the first step, the dispersed phase is emulsified above its melting temperature and transferred under supercooling into a fine crystalline dispersion in the second step [11,12,13].
During emulsification, molten bulk (dispersed phase) is homogenized to countless small volume units—the droplets. Different to bulk crystallization in a macroscopic volume element, crystallization in dispersed droplets occurs individually and separately in each droplet, resulting in polydisperse crystallization behavior during supercooling [14,15]. The individual crystallization behavior in dispersions is strongly dependent on the formulation and process parameters, such as droplet size, additives, dispersed phase content, cooling rate, external forces and supercooling, as the driving force for crystallization in molten droplets [3,9,16,17,18]. Ideally, those parameters are adjusted to transform all droplets into spherical crystalline particles of the same size. Eventually, crystallization to different structures, incomplete crystallization and/or colloidal processes often occur during supercooling and destabilize the dispersions [19,20,21,22,23,24].
The final size, shape and physical state and thus the application properties of the dispersions are strongly connected to the nucleation within single droplets [25,26,27]. Usually, the formation of nuclei proceeds by heterogeneous nucleation mechanism due to catalytic impurities, which lower the nucleation barrier and allow crystallization at low supercooling [12]. In dispersions, the number of catalytic impurities is much lower than the number of droplets and require higher supercooling for crystallization compared to the bulk of the same material [3,12]. The droplet size becomes a critical parameter for nucleation in dispersions, since with increasing droplet size the probability of heterogeneous nucleation increases and crystallization becomes thermodynamically favorable [26,28]. In most crystalline dispersions droplets are comparatively small (diameter <1 µm up to some µm) and the size distribution is polydisperse. This causes incomplete crystallization depending on the supercooling [14,15].
In past decades, many researchers investigated crystallization in dispersed systems with a focus on the initiation of the nucleation. Different approaches, such as surface-initiated, collision-mediated and energy-induced nucleation were discussed [28,29,30,31,32,33,34,35,36]. One of the most promising approaches, combining surface-initiated, collision-mediated and energy-induced nucleation, is stress-controlled nucleation [15,37,38,39,40,41,42]. Mechanical stress-induced crystallization is already industrially applied in the confectionery (chocolate) or dairy (whipped cream) industry to control and adjust morphology, texture and mouthfeel [28,42,43,44,45,46]. However, the impact of mechanical stresses on crystallization in dispersed systems is still not fully understood and is a subject of many investigations.
In our previous investigations we discussed the individual and polydisperse crystallization in hexadecane (C16H34) dispersions [14] and the influence of rotation shear on the crystallization behavior in hexadecane dispersions of different mean droplet size [15]. This current investigation expands the homologous series by octadecane (C18H38), eicosane (C20H42), and docosane (C22H46) dispersions in order to compare the crystallization behavior of substances with similar chemical properties but different chain lengths, and focuses on the influence of oscillation mechanical stress, and discusses its impact on crystallization intensification in dispersed systems.

2. Materials and Methods

2.1. Materials

All substances were commercially available and used as purchased without further purification or processing. Hexadecane (HD, C16H34, purity 99%, melting point at 18 °C) was purchased from Sigma-Aldrich® (St. Louis, MO, USA). Octadecane (OD, C18H38, purity 99%, melting point at 28 °C) was purchased from Sigma-Aldrich® (St. Louis, MO, USA). Eicosane (EC, C20H42, purity 99%, melting point at 37 °C) was purchased from Sigma-Aldrich® (St. Louis, MO, USA). Docosane (DC, C22H46, purity 95%, melting point at 44 °C) was purchased from Sasol (Johannesburg, South Africa). Polyoxyethylen-20-sorbitanmonolaurat (Tween® 20) was purchased from Carl-Roth® (Karlsruhe, Germany). Water was purified in a Milli-Q® instrument Q-POD® at 18.2 MΩ (Darmstadt, Germany).

2.2. Emulsion Preparation

Every emulsion consisted of 1 wt % or 10 wt % alkane (dispersed phase: hexadecane (HD), octadecane (OD), eicosane (EC) or docosane (DC)), 1 wt % Tween® 20 (surfactant) and 98 wt % or 89 wt % purified water (continuous phase). First, Tween® 20 was dissolved under continuous stirring in tempered purified water 10 K above the melting temperature of the alkane ( ϑ m , a l k a n e ) in a glass vessel. Afterwards, the dispersed phase was added to the surfactant solution and tempered with the gear-rim dispersing element (rotating part) for another 15 min 10 K above ϑ m , a l k a n e without stirring. Then, the dispersed phase was homogenized with a gear-rim dispersing machine (IKA® T25 digital, ULTRA-TURRAX®, Staufen im Breisgau, Germany) at 2.2 m/s tangential speed (3200 rpm, 13 mm outer diameter of the rotating part) 10 K above ϑ m , a l k a n e for 10 min in a glass vessel of 25 mm inner diameter.
After emulsification, samples were taken for the quiescent crystallization (cryo-polarizing microscopy of 1 wt % emulsions) and crystallization under mechanical stress (oscillation mechanical stress of 10 wt % emulsions) analysis. Between emulsification and analysis, the emulsions were continuously stirred above ϑ m , a l k a n e to avoid creaming, crystallization and inhomogeneous sampling. During the sample preparation for the analytical part, emulsions did not show any sign of instability.

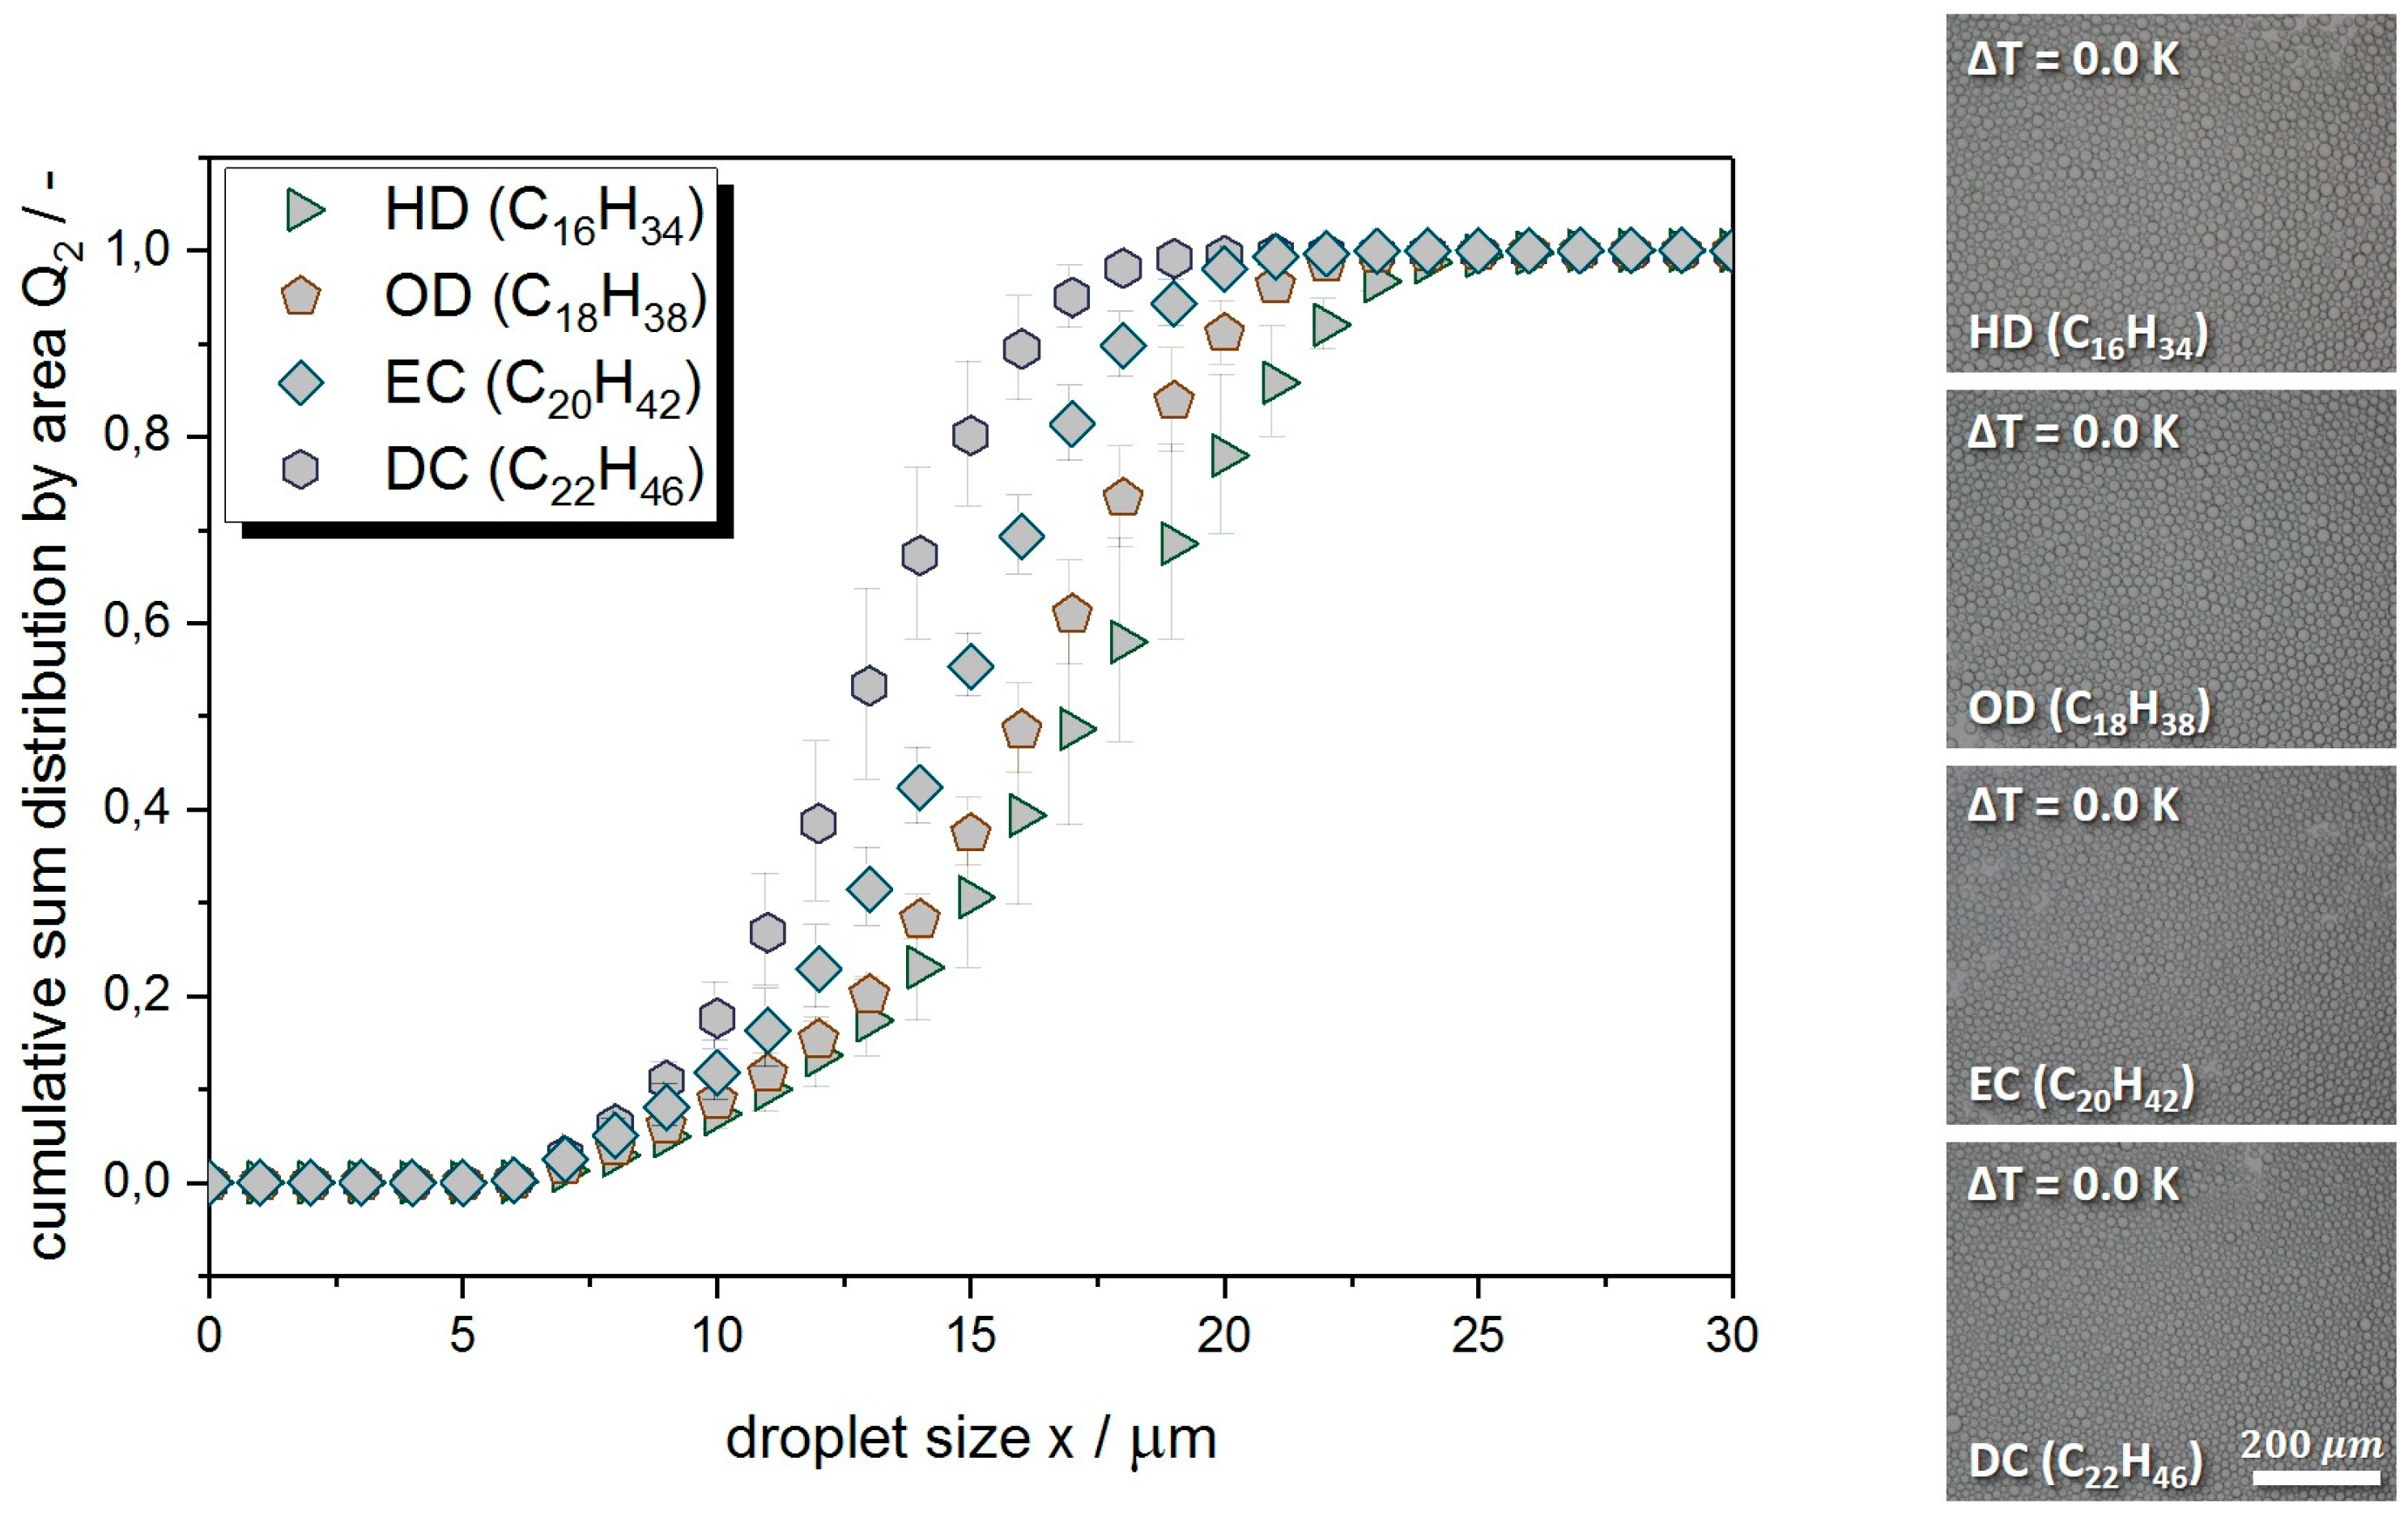
2.3. Droplet Size Distribution Analysis

The droplet size distributions (DSD) of emulsions were investigated using a customized polarizing light microscope (Eclipse Ci-L, Nikon, Shinagawa, Tokyo, Japan) equipped with an optically accessible temperature controlled stage (LTS 420, Linkam Scientific, Tadworth, UK). The optical components were customized by Nikon for long distance investigations and consisted of CFI ocular (magnification: 10×), CFI p-Fluor objective (magnification: 10×; optical aperture: 0.3; working distance: 15.2 mm) and LWD achromatic condenser (working distance 10 mm). The combined magnification during optical observations was 100×. To differentiate crystalline structures from liquid droplets the optical set up was expanded with polarization filter LV-PO, polarization filter C-SP and analyzer LV-FLAN FL (more details at Nikon homepage).
After the emulsification, 25 µL of 1 wt % alkane emulsions were pipetted between two microscope cover slips glued on a tempered microscope object slide using tempered pipette, then covered with a third cover slip and sealed with silicone 10 K above ϑ m , a l k a n e . The distance between the object slide and the cover slip was approximately 130 µm (sample thickness). Then, the sealed samples were cooled to ϑ m , a l k a n e and equilibrated for 5 min. Afterwards, images were taken of the emulsions in liquid state. The obtained micrographs were processed with ImageJ 1.46r (National Institute of Health, Bathesda, MD, USA) software to determine the characteristic values such as number, size and size distribution by area of the emulsions. Details are given in [14].

2.4. Quiescent Crystallization Analysis

In analogy to DSD analysis, same thermo-optical equipment and sample preparation procedure were applied to investigate quiescent crystallization behavior in alkane dispersions, as described in Section 2.3.
First, onset crystallization temperature and melting temperature of the dispersions were determined, since these values are subject of Kelvin effect and might vary in dependency of mean droplet size [47]. The samples were cooled to 18 K (entire crystallization of all droplets within the dispersion) supercooling with a cooling rate of 1 K/min. During supercooling, picture sequences of the crystallizing dispersions were taken every 0.2 K. The onset crystallization temperature of the dispersions was determined optically by the appearance of the first crystallized droplet (gray transparent droplet → green opaque spheroid) in the volume. Then, the samples were re-heated to 10 K above ϑ m , a l k a n e with a heating rate of 1 K/min. During heating, picture sequences of the melting dispersions were taken every 0.2 K. The melting temperature of the dispersions was determined optically by change of color and shape of the droplets (green opaque spheroids → gray transparent droplets).
Influence of the cooling rate on crystallization in alkane dispersions was investigated by varying the cooling rate. The samples were cooled to supercooling of 18 K with a cooling rate Δ T / Δ t of 0.1 K/min, 1 K/min and 10.0 K/min. During supercooling, picture sequences of the droplets were taken every 0.2 K. Due to polarization the crystallized droplets change their color from gray transparent to green opaque and can be easily differentiated from liquid droplets. The number of crystallized droplets was optically followed in dependency of cooling rate.
To exclude the effect of time dependency during crystallization in alkane dispersions isothermal observations were performed. Since the dependency of cooling rate on crystallization in alkane dispersions decreased with increasing chain length (see Appendix C, Figure A3), only HD dispersions were investigated. HD samples were cooled to supercooling of 2.5, 4.5 and 8.5 K and held at each supercooling for one hour. During the isothermal observations, picture sequences of the droplets were taken every 12 s. Due to polarization the crystallized droplets change their color from gray transparent to green opaque and can be easily differentiated from liquid droplets. The number of crystallized droplets was optically followed in dependency of time.
The main objective of thermo-optical investigations was to describe and quantify the crystallization behavior in alkane dispersions by determination of crystallization index by number CIN in quiescent systems. Similar to previous investigations, the alkane dispersion samples were cooled to 18 K supercooling with a cooling rate of 1 K/min. During supercooling, picture sequences of the crystallizing dispersions were taken every 0.2 K. The obtained micrographs were processed with ImageJ 1.46r software (National Institute of Health, Bathesda, MD, USA) to differentiate between liquid and crystalline structures, to determine the characteristic values such as number, size and size distribution of crystallized and supercooled droplets and to calculate the number-based crystallization index C I N within the dispersions:
C I N = N c r , p N d + N p
where N c r , p is the number of crystalline droplets, N d the number of droplets and N p the number of all solid structures (amorphous or crystalline droplets).Details of the thermo-optical method are shown in our earlier paper [14].

2.5. Crystallization under Mechanical Stress

Crystallization behavior of bulk alkane and alkane in water dispersions under oscillation mechanical stress was investigated using a rotational rheometer (Physica MCR 301, Anton Paar, Graz, Austria) equipped with a double gap geometry DG 26.7 (26.7 mm outer diameter, 464 µm width of the outer gap and 419 µm of the inner gap) in oscillation mode.
At this point, no rheological evaluation has been done yet. The rotational rheometer has been merely used as a precise tempered shear cell. Only mechanical values, such as torque ( M ) as a signal for crystallization, and deformation ( γ ) or frequency ( f ) as setting parameters to adjust oscillation mechanical stress, have been used to describe the crystallization behavior under mechanical stress during supercooling in alkane dispersions (see Figure 1).
Three major impacts on the torque during oscillation mechanical treatment are connected to the supercooling of organic dispersions: (1) constant increase in torque due to supercooling (increase in viscosity); (2) additional increase in torque due to crystallization/solidification of organic substances (increase of inner friction due to solidification) and (3) crystallization/solidification driven aggregation leading to fluctuation and further increase in torque (aggregate formation and breakage processes, dependent on the mechanical stress).
Sample preparation: 3.8 mL of 10 wt % alkane emulsion were pipetted into the tempered measuring cup using a tempered pipette 10 K above ϑ m , a l k a n e . The measuring bob was placed into the gap and tempered with alkane emulsion for additional 5 min 10 K above ϑ m , a l k a n e . To reduce impurities/alien nuclei, the measuring geometry was washed with water, then isopropanol, and afterwards dried for 5 min in dust and lint free environment.
Impact of mechanical stress on crystallization: Samples of 10 wt % alkane dispersion were cooled to 18 K supercooling with a cooling rate of 1 K/min. During cooling three different deformations γ , 1, 100 and 10,000%, and three different frequencies f , 1, 10 and 100 Hz, were applied. Deformation and frequency are proportional in square to the dissipated energy during oscillation and were used to vary the mechanical stress intensity during crystallization. To compare the torque within the experimental series, normalized torque was calculated:
M n o r m = M M m a x
Mechanical treatment is reported to accelerate nucleation and thus the crystallization progress in dispersed systems [3,48]. Acceleration of the crystallization process can be identified by: (1) decrease of required supercooling for crystallization and (2) increase of crystalline content. Therefore, we determined the onset crystallization supercooling (supercooling, at which first crystallization effects on torque were detected) and phase transition torque factor (quotient of torque after and before crystallization) to compare the impact of mechanical stress intensity on crystallization behavior in emulsions.
Onset crystallization supercooling: To determine the onset crystallization supercooling o n s e t   Δ T c r we evaluated the torque as function of supercooling and stress intensity. For this, we determined the first significant increase in torque (over 10%) as a result of supercooling and mechanical stress (see Figure 1, magnified diagram):
o n s e t   Δ T c r ( M ) = Δ T ( M i + 1 M i   1.1 )
Phase transition torque factor: To estimate the crystallization progress in dispersions we determined the phase transition torque M p h t in dependence of mechanical stress intensity. Therefore, we calculated the mean torque M c r ¯ between 16 K and 17 K supercooling (every droplet was crystalline at this supercooling during quiescent crystallization in alkane dispersions) and related it to the mean torque M l i q ¯ between 0 and 1 K supercooling (every droplet was liquid at this supercooling during quiescent crystallization in alkane dispersions):
M p h t = M c r ¯ M l i q ¯

2.6. Statistical Analysis

Every emulsion and every experiment was prepared/performed three times for triple determination. Uncertainty was calculated using commercial software MATLAB R2017a (the MathWorks, Natick, MA, USA), Microsoft Excel 2016 or Origin 2017 and expressed as standard deviation.

3. Results and Discussion

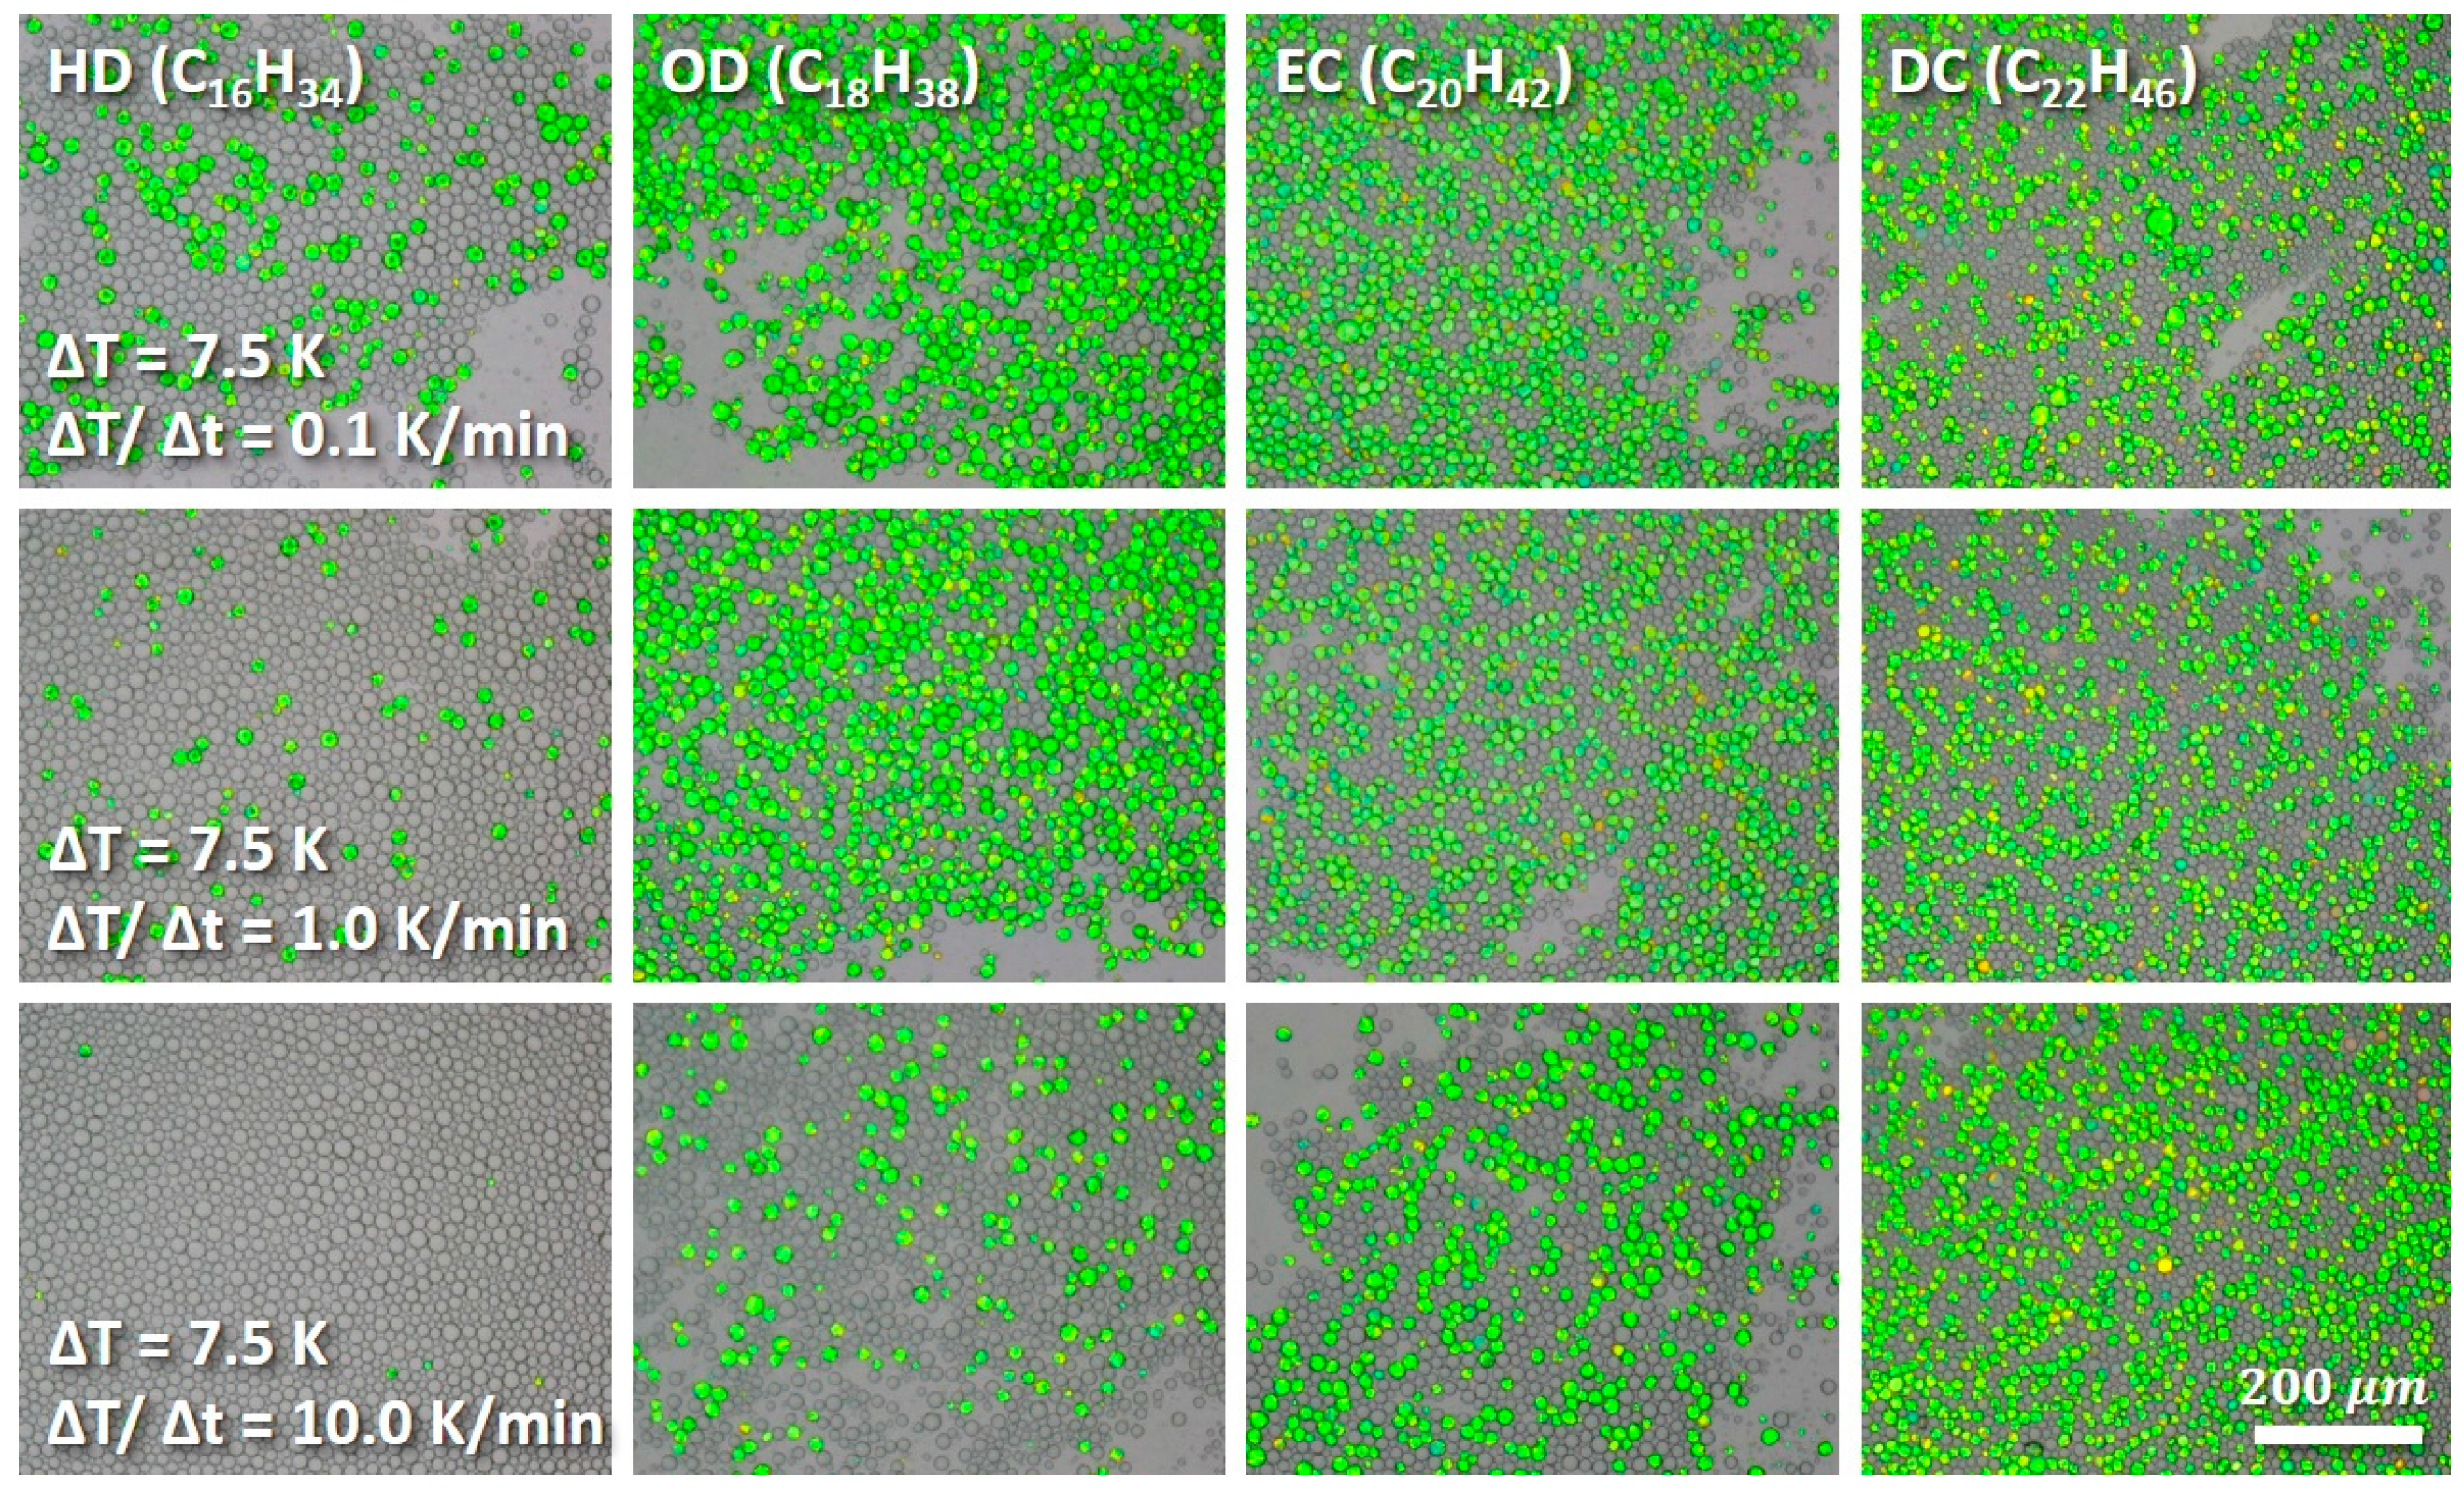
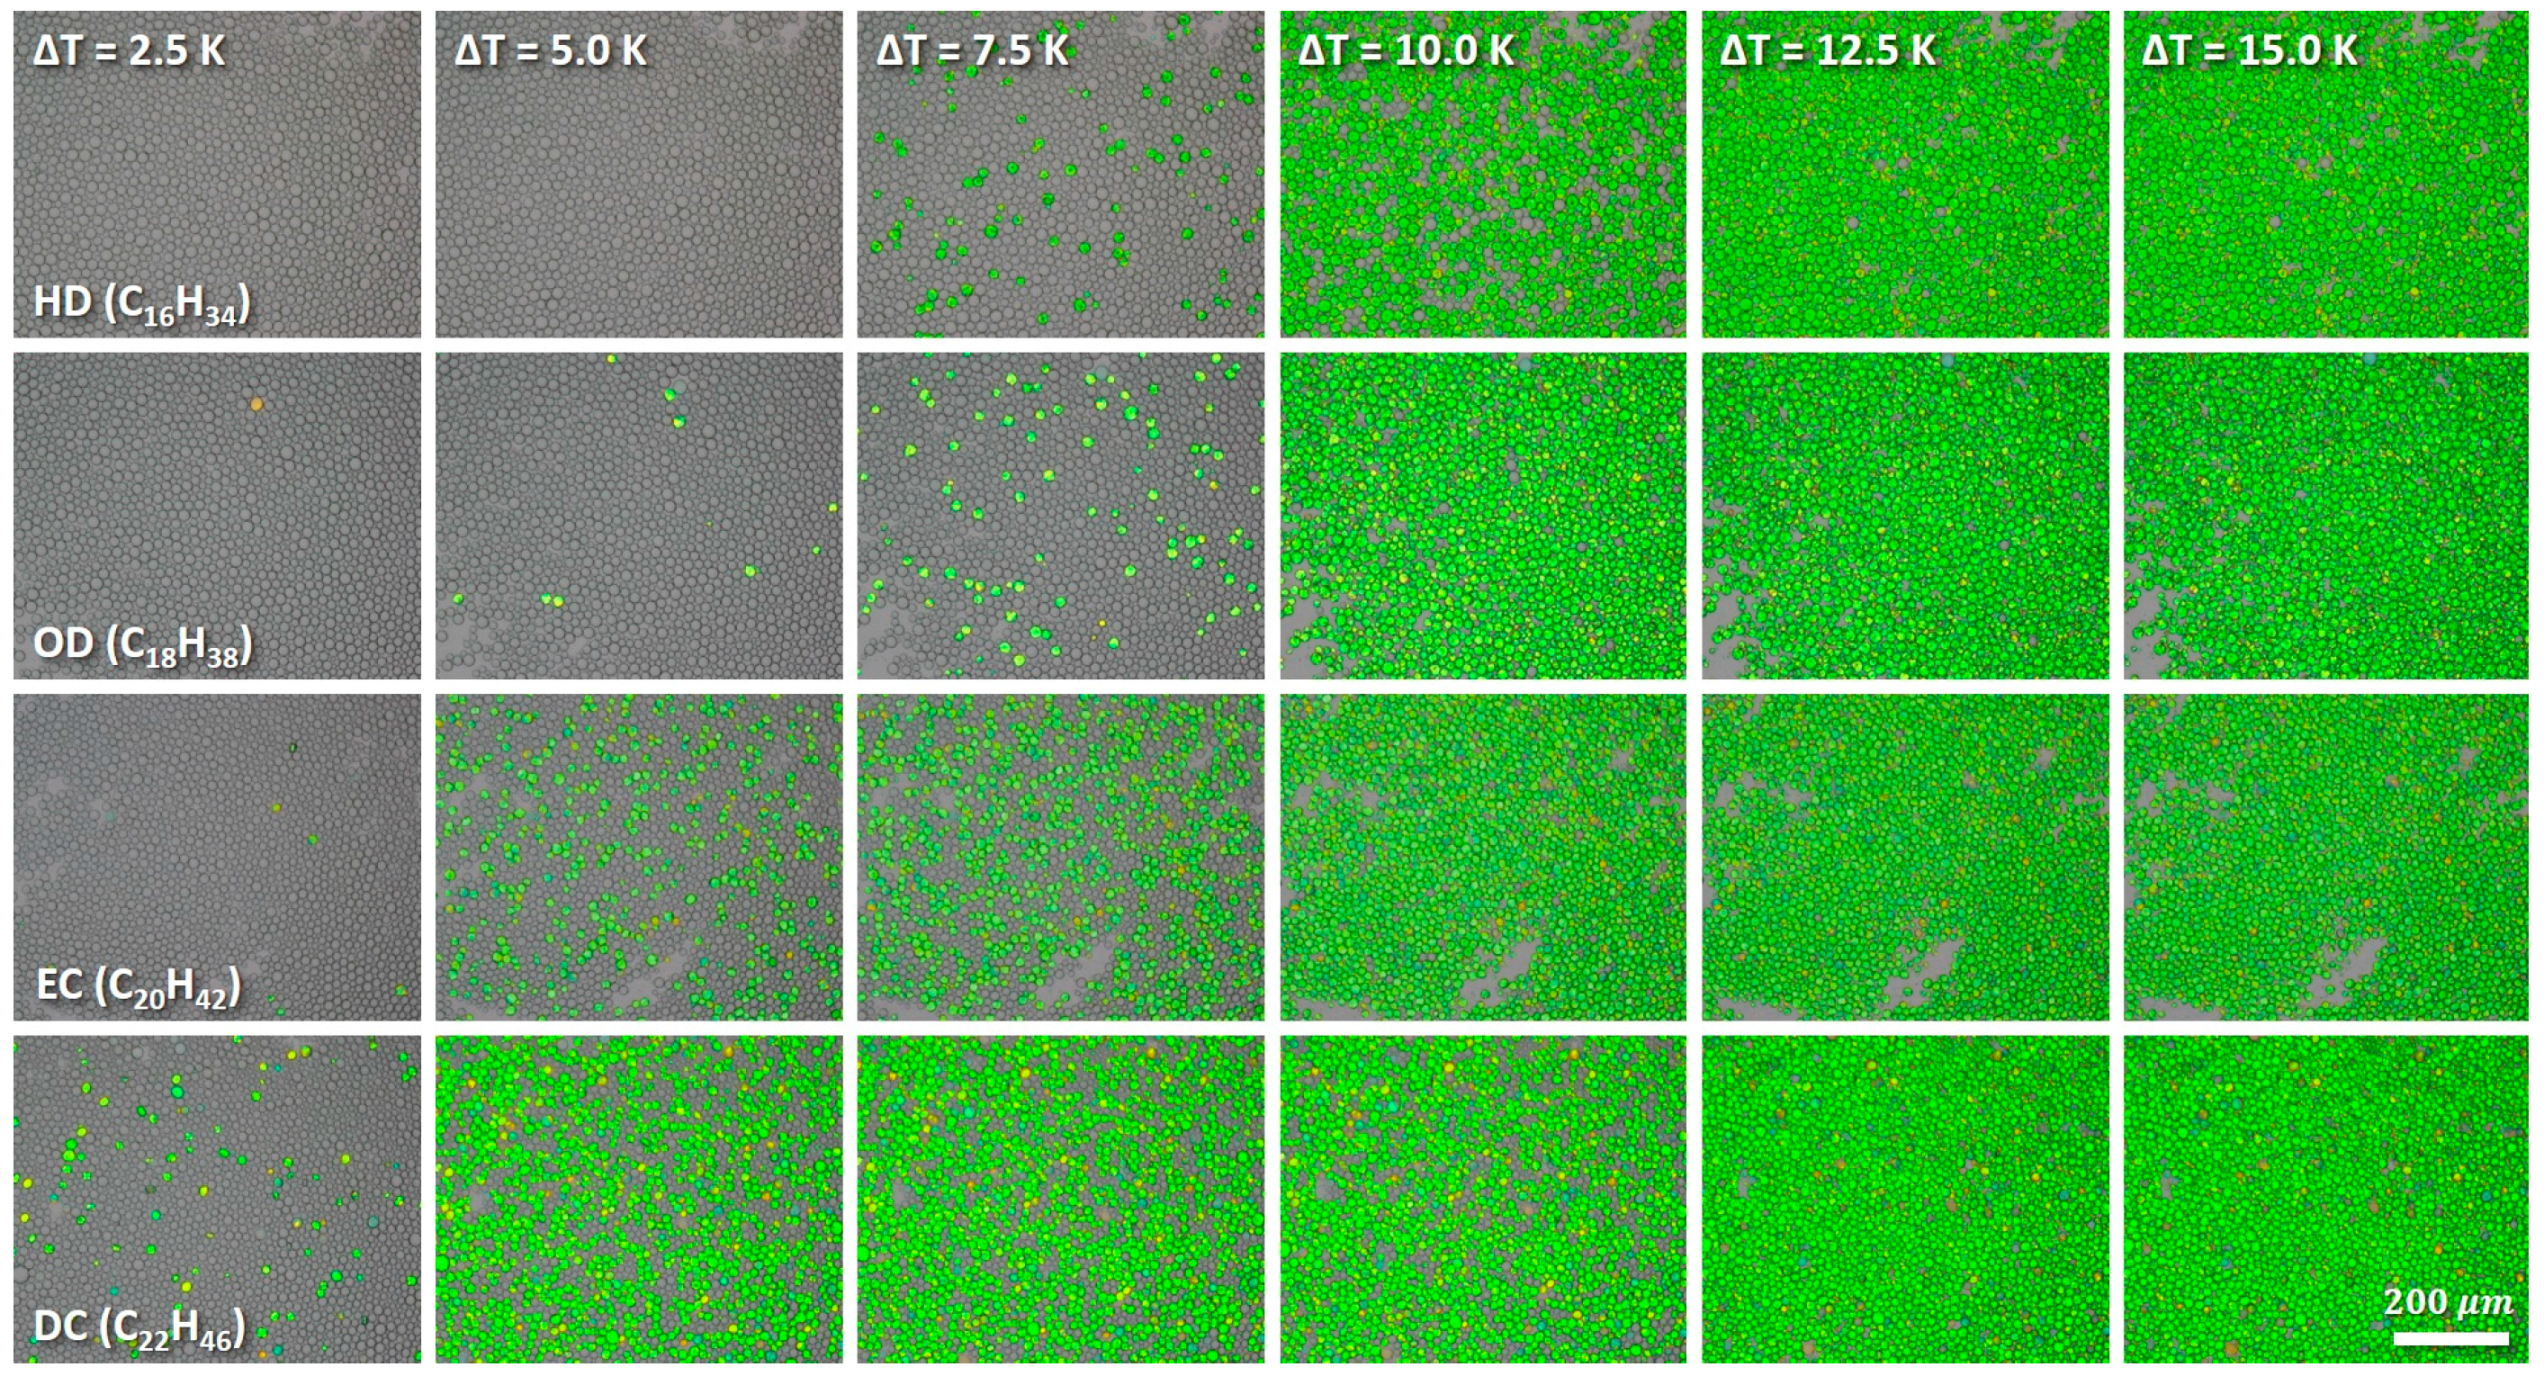
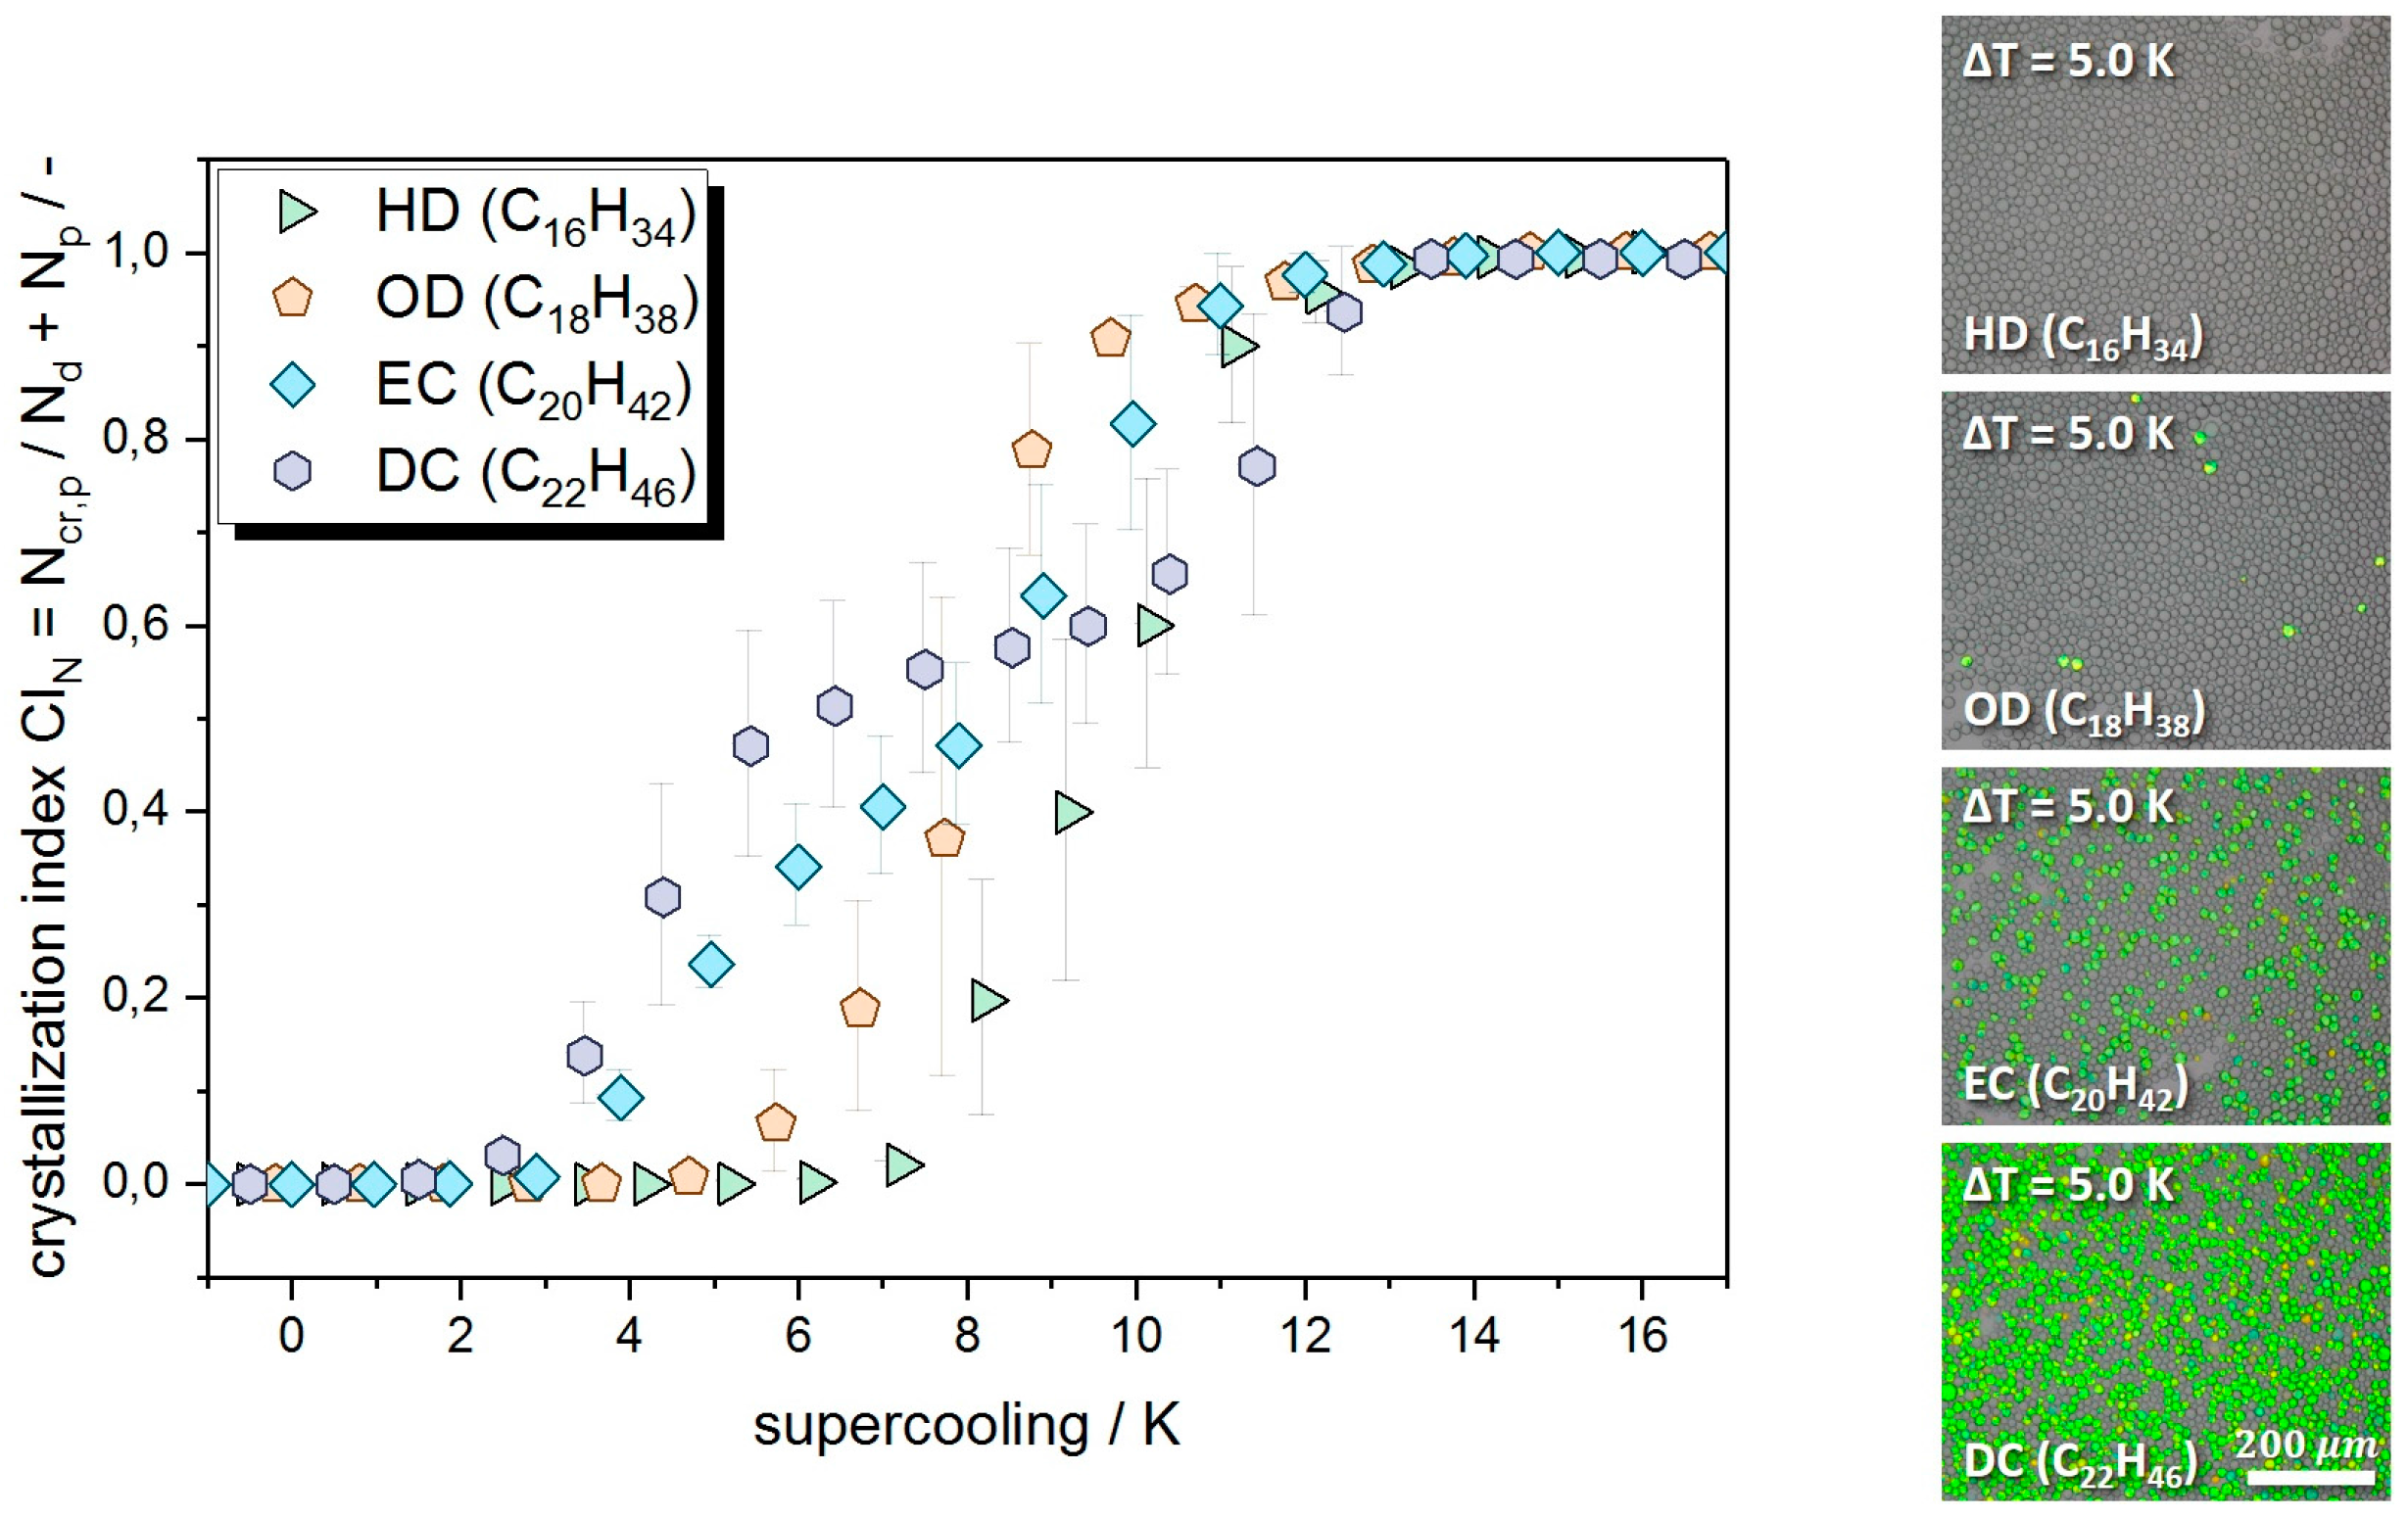
3.1. Quiescent Crystallization

Three parameters—droplet size (Appendix A), melting point (Appendix B) and time dependency (Appendix C)—of crystallization behavior in alkane dispersions were analyzed prior the determination of crystallization index. Since these parameters were needed for the quiescent crystallization analysis, but are not the main topic of our discussion, details are given in the Appendix A, Appendix B and Appendix C.
During the thermo-optical observations of quiescent crystallization behavior in 1 wt % alkane dispersion three different physical states occurred: liquid droplets above melting temperature (grey, transparent spheres), supercooled liquid droplets below melting temperature (grey, transparent spheres) and poly crystalline structures below melting temperature (green, opaque spheroids). We did not observe any amorphous structures (grey, opaque spheroids) or recrystallization to single crystalline structures (colored, transparent polygons) due to low supercooling rate and short experiment duration of 20 min. Alkane droplets crystallized to poly crystalline spheroids and retained nearly spherical (see Figure 2).
At low supercooling, droplets crystallized individually and stochastically distributed in the volume independent of their size. This crystallization behavior is connected to the impurity initiated crystallization, where impurities reduce the nucleation barrier in droplets and cause crystallization at relatively low supercooling [3,48]. In emulsions, the number of impurities is usually much smaller than the number of droplets. Therefore, crystallization in emulsion droplets containing no impurities requires higher supercooling and is strongly dependent on the droplet size. The general experience shows, that with increasing purity and decreasing droplet size high supercooling is required for nucleation in emulsions [3,15].
Within the homologues series HD (C16H34), OD (C18H38), EC (C20H42) and DC (C22H46), we observed different crystallization behavior of droplets in dependence of the alkane chain length. Similar to onset crystallization temperature (Appendix B), the onset crystallization supercooling decreased with increasing chain length of the alkanes. To quantify the crystallization progress in alkane dispersions, we calculated the crystallization index by number CIN (see Figure 3).
In HD dispersions, crystallization index remained nearly zero at low supercooling and increased continuously and linear during further supercooling. At a critical supercooling (ΔT = 12 K) all observed droplets crystallized. Similar to HD dispersions, crystallization index in OD dispersions increased continuously and linear, until complete crystallization of the droplets (ΔT = 10.5 K). The crystallization index of EC dispersion showed nonlinear increase with a stagnation region (stagnation between 6 K and 8 K supercooling). In case of DC dispersions, the nonlinear behavior of the crystallization increased with a more pronounced stagnation region (stagnation between 5 K and 10 K supercooling). The stagnation during EC and DC crystallization indicates two different nucleation types, low nucleation barrier (crystallization at low supercooling, type I) before the stagnation and high nucleation barrier (crystallization at high supercooling, type II) [28,48,49]. Those stagnation regions might be the cause of impurities, different nucleation mechanisms or most likely formation of intermediate structures (polymorphism).
The chain length of investigated alkanes had a great influence on the crystallization progress in alkane dispersions, as shown in Figure 3 in micrographs on the right. At 5 K supercooling alkane dispersions of similar mean droplet size showed different crystallization progress at the same formulation and process conditions: no crystallization in HD dispersions (CIN,HD = 0.00); OD dispersions crystallized to 1% (CIN,OD = 0.01); 24% of all droplets crystallized in EC dispersions (CIN,EC = 0.24); crystallization of 40% by number in DC dispersions (CIN,DC = 0.40).

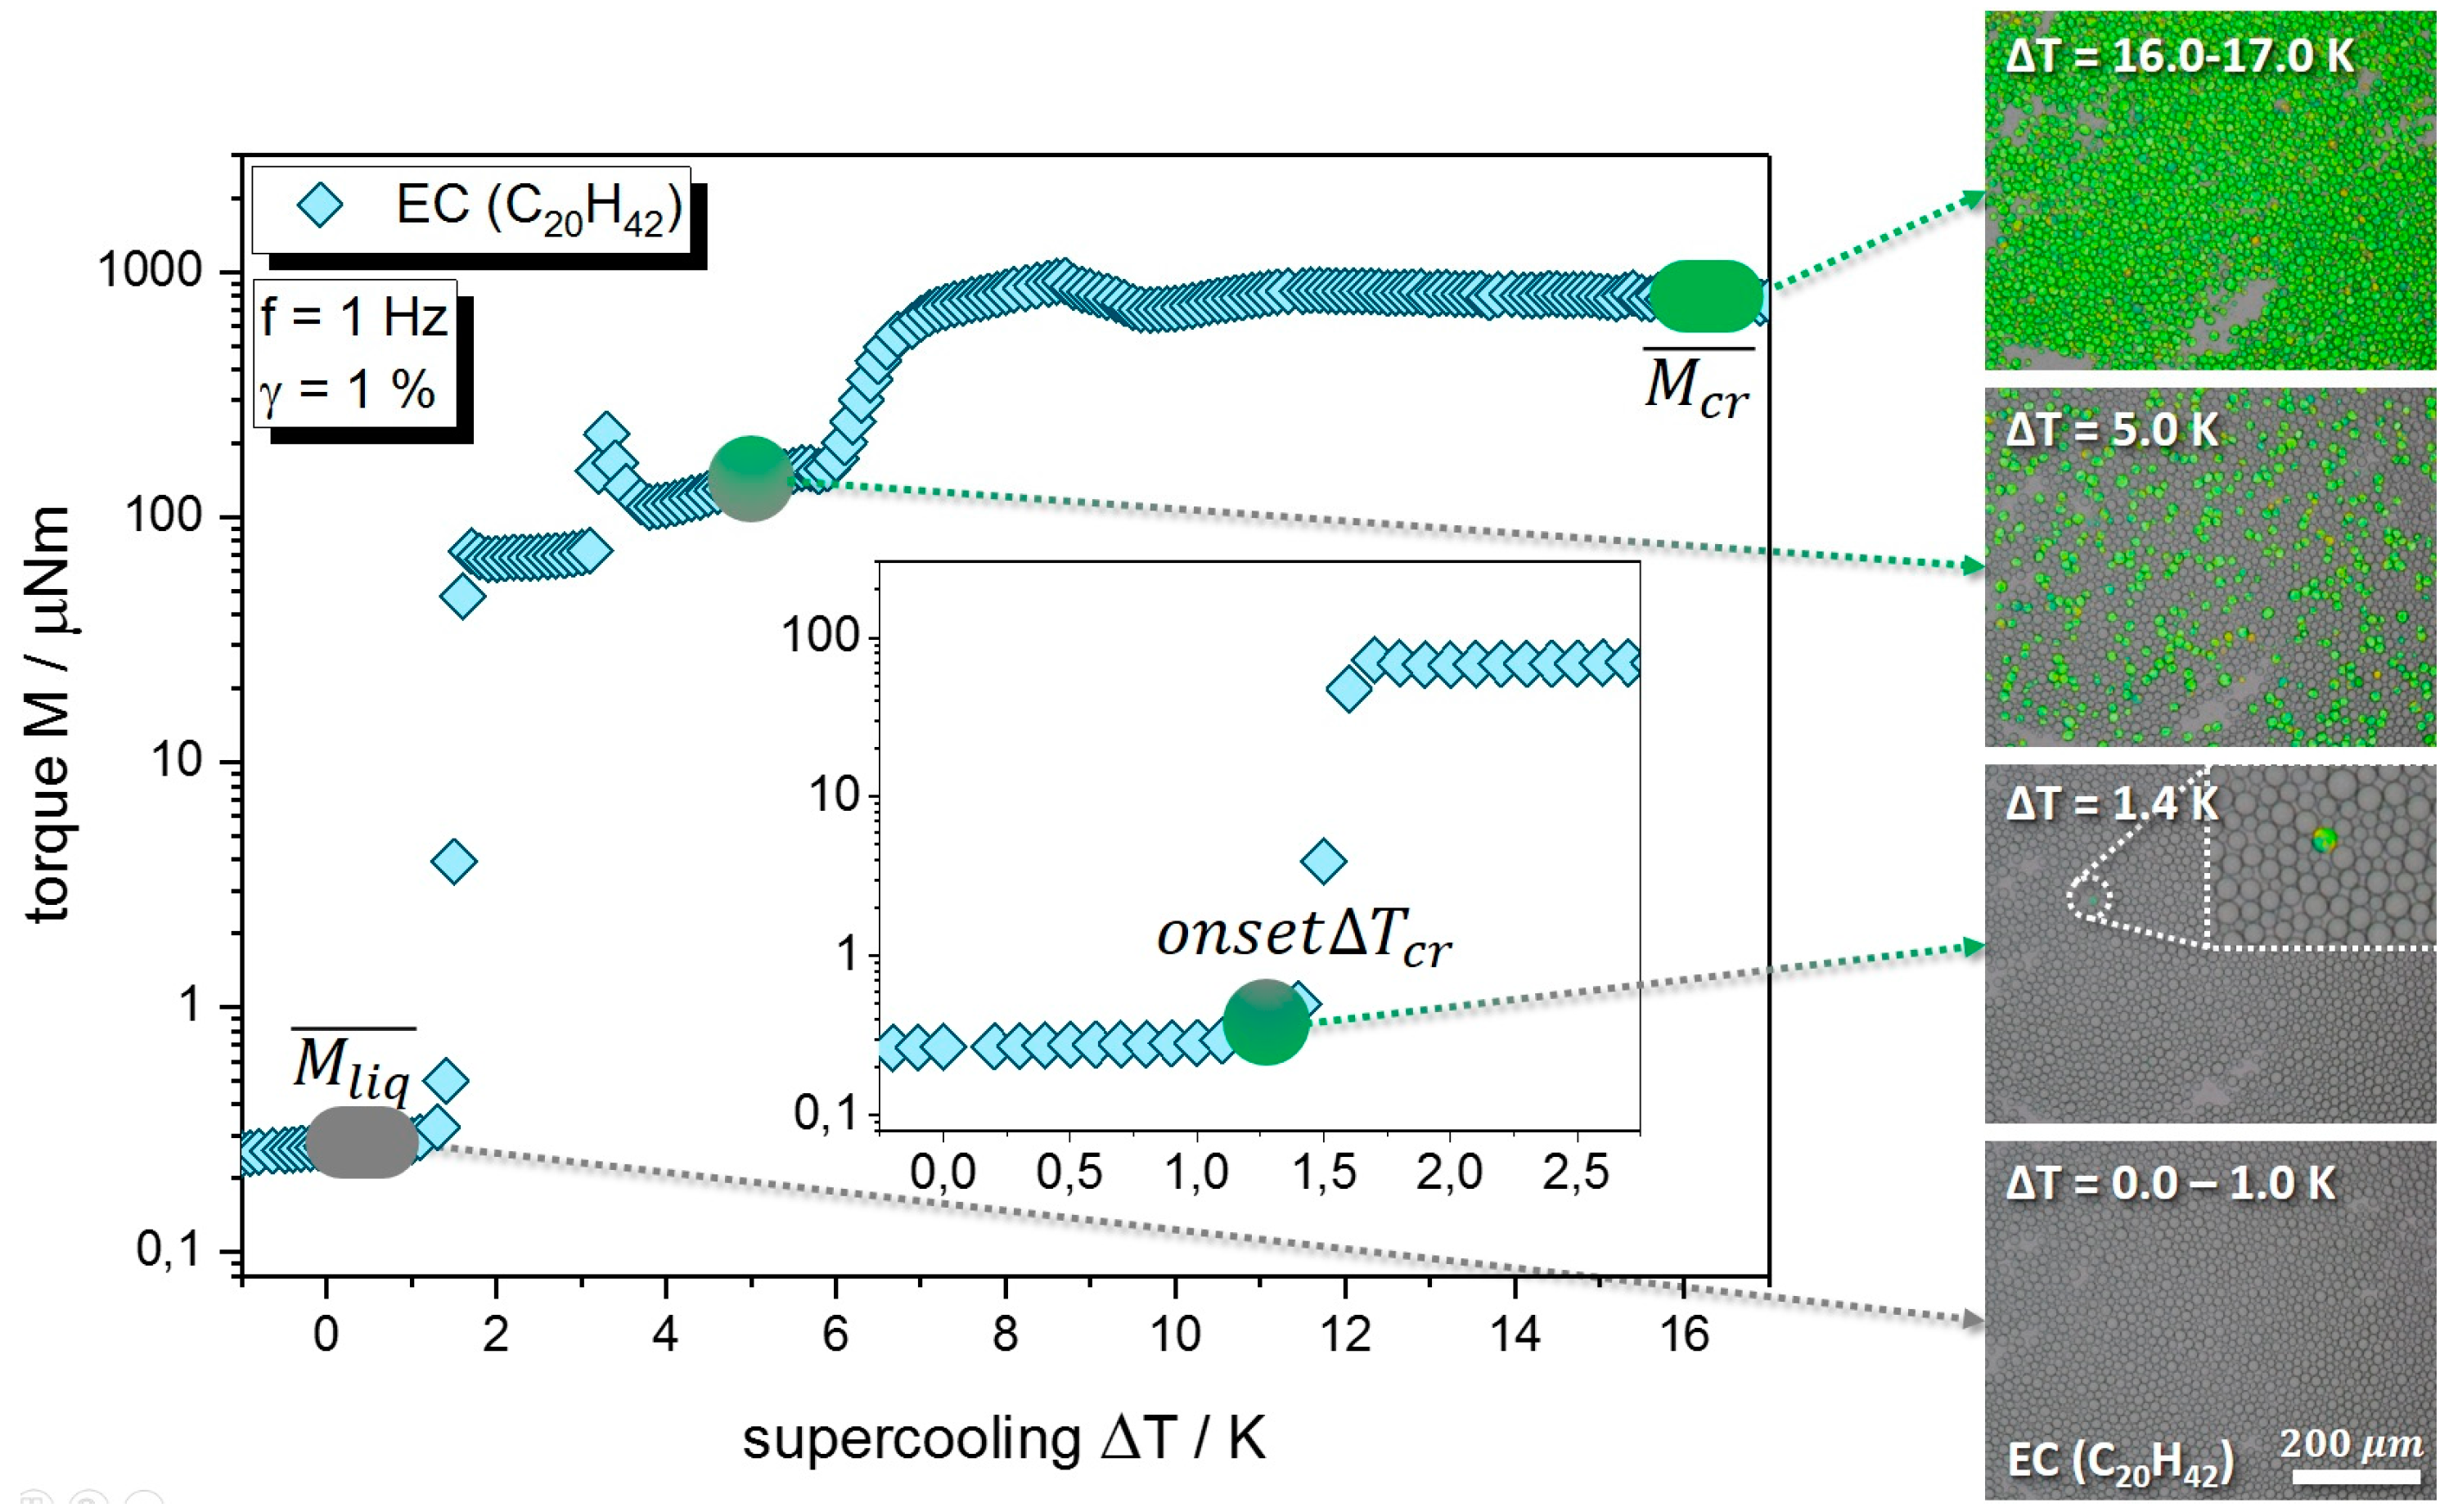
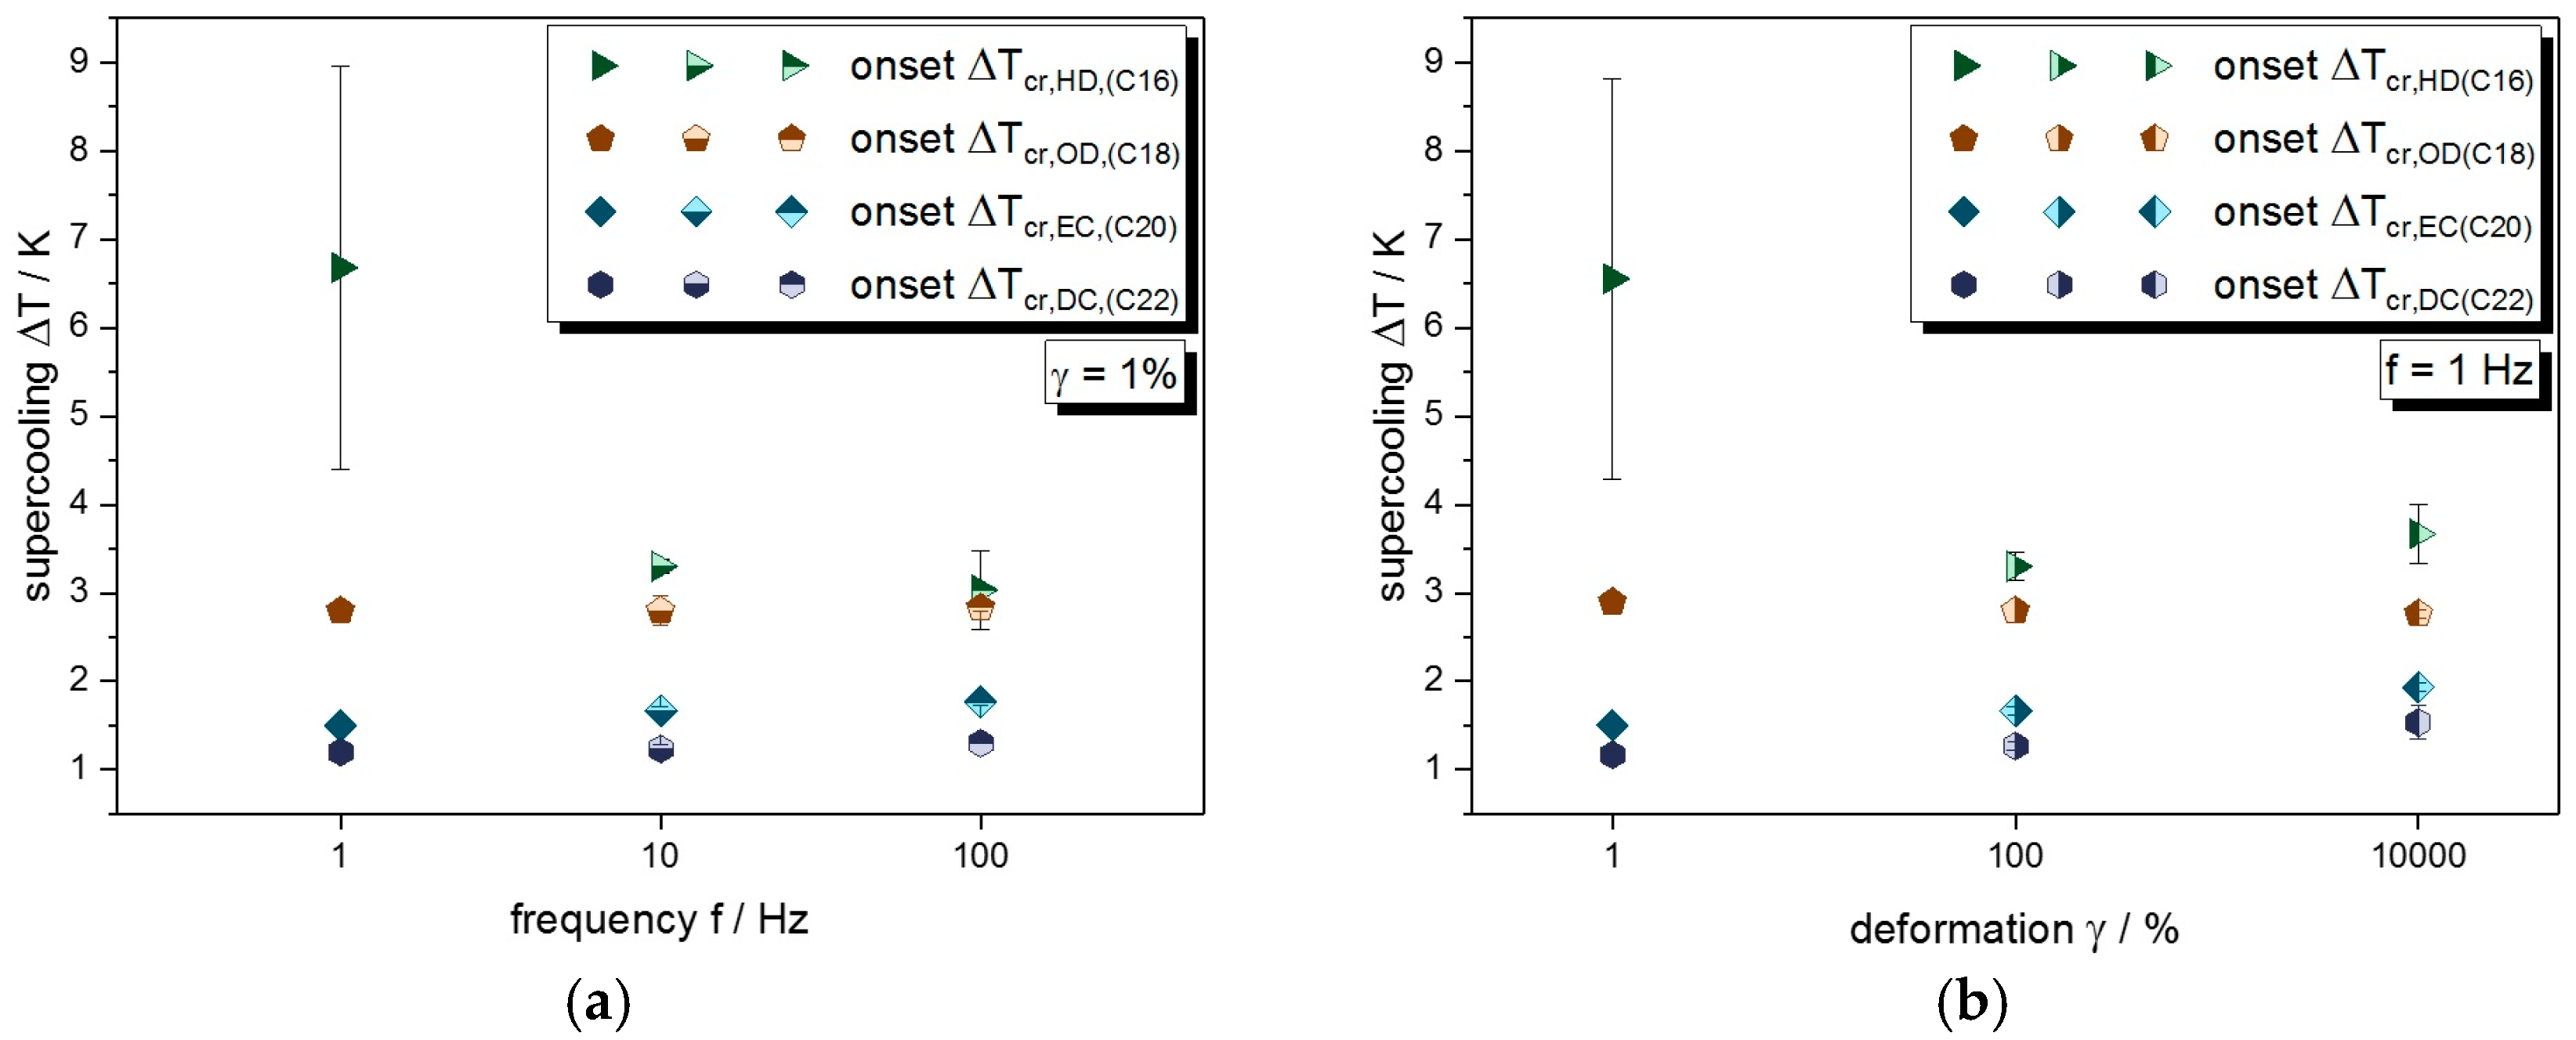
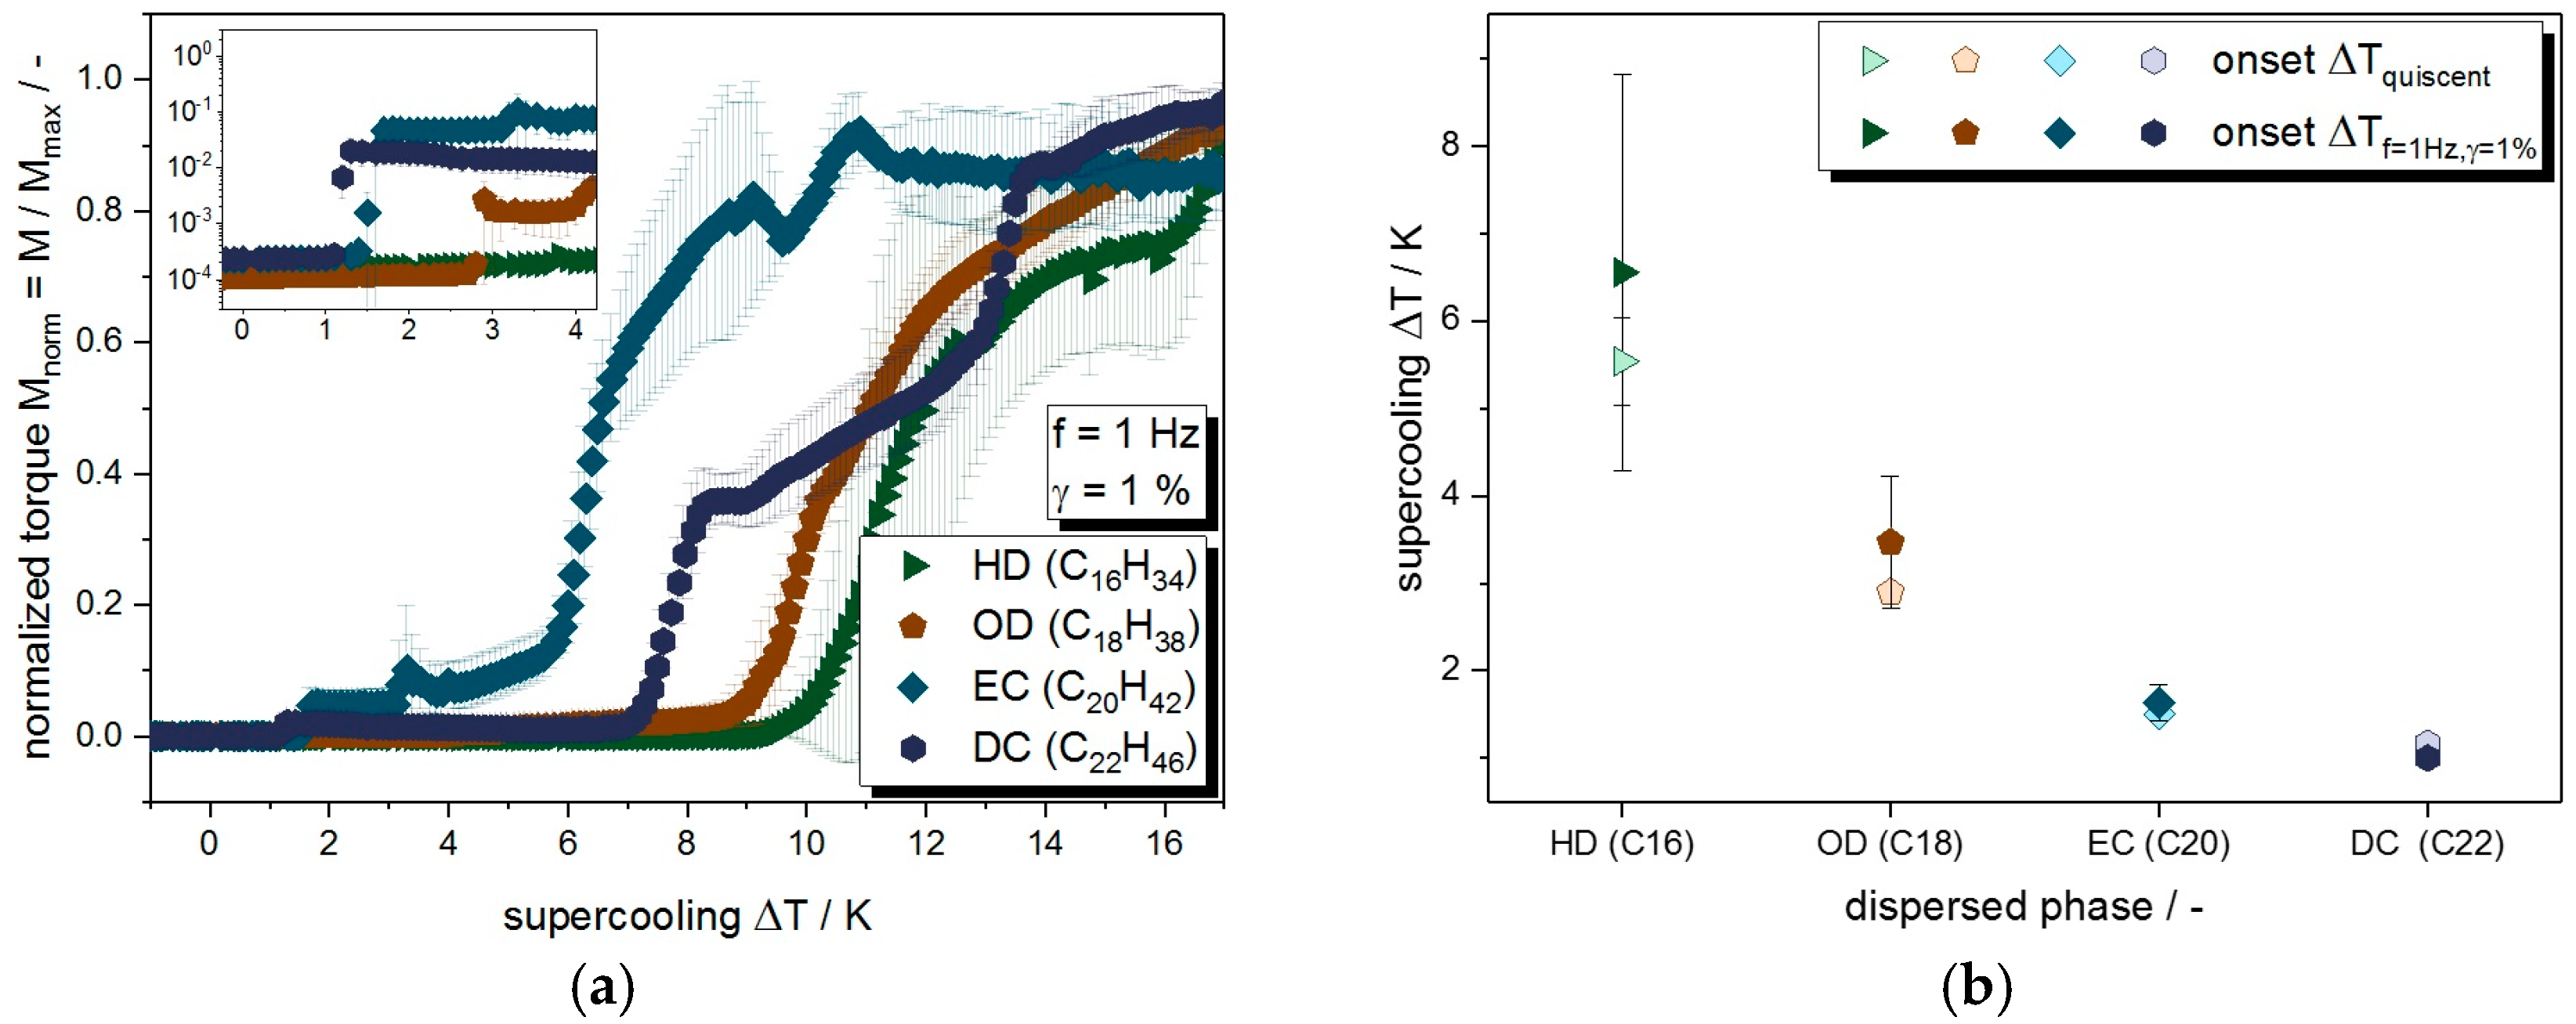
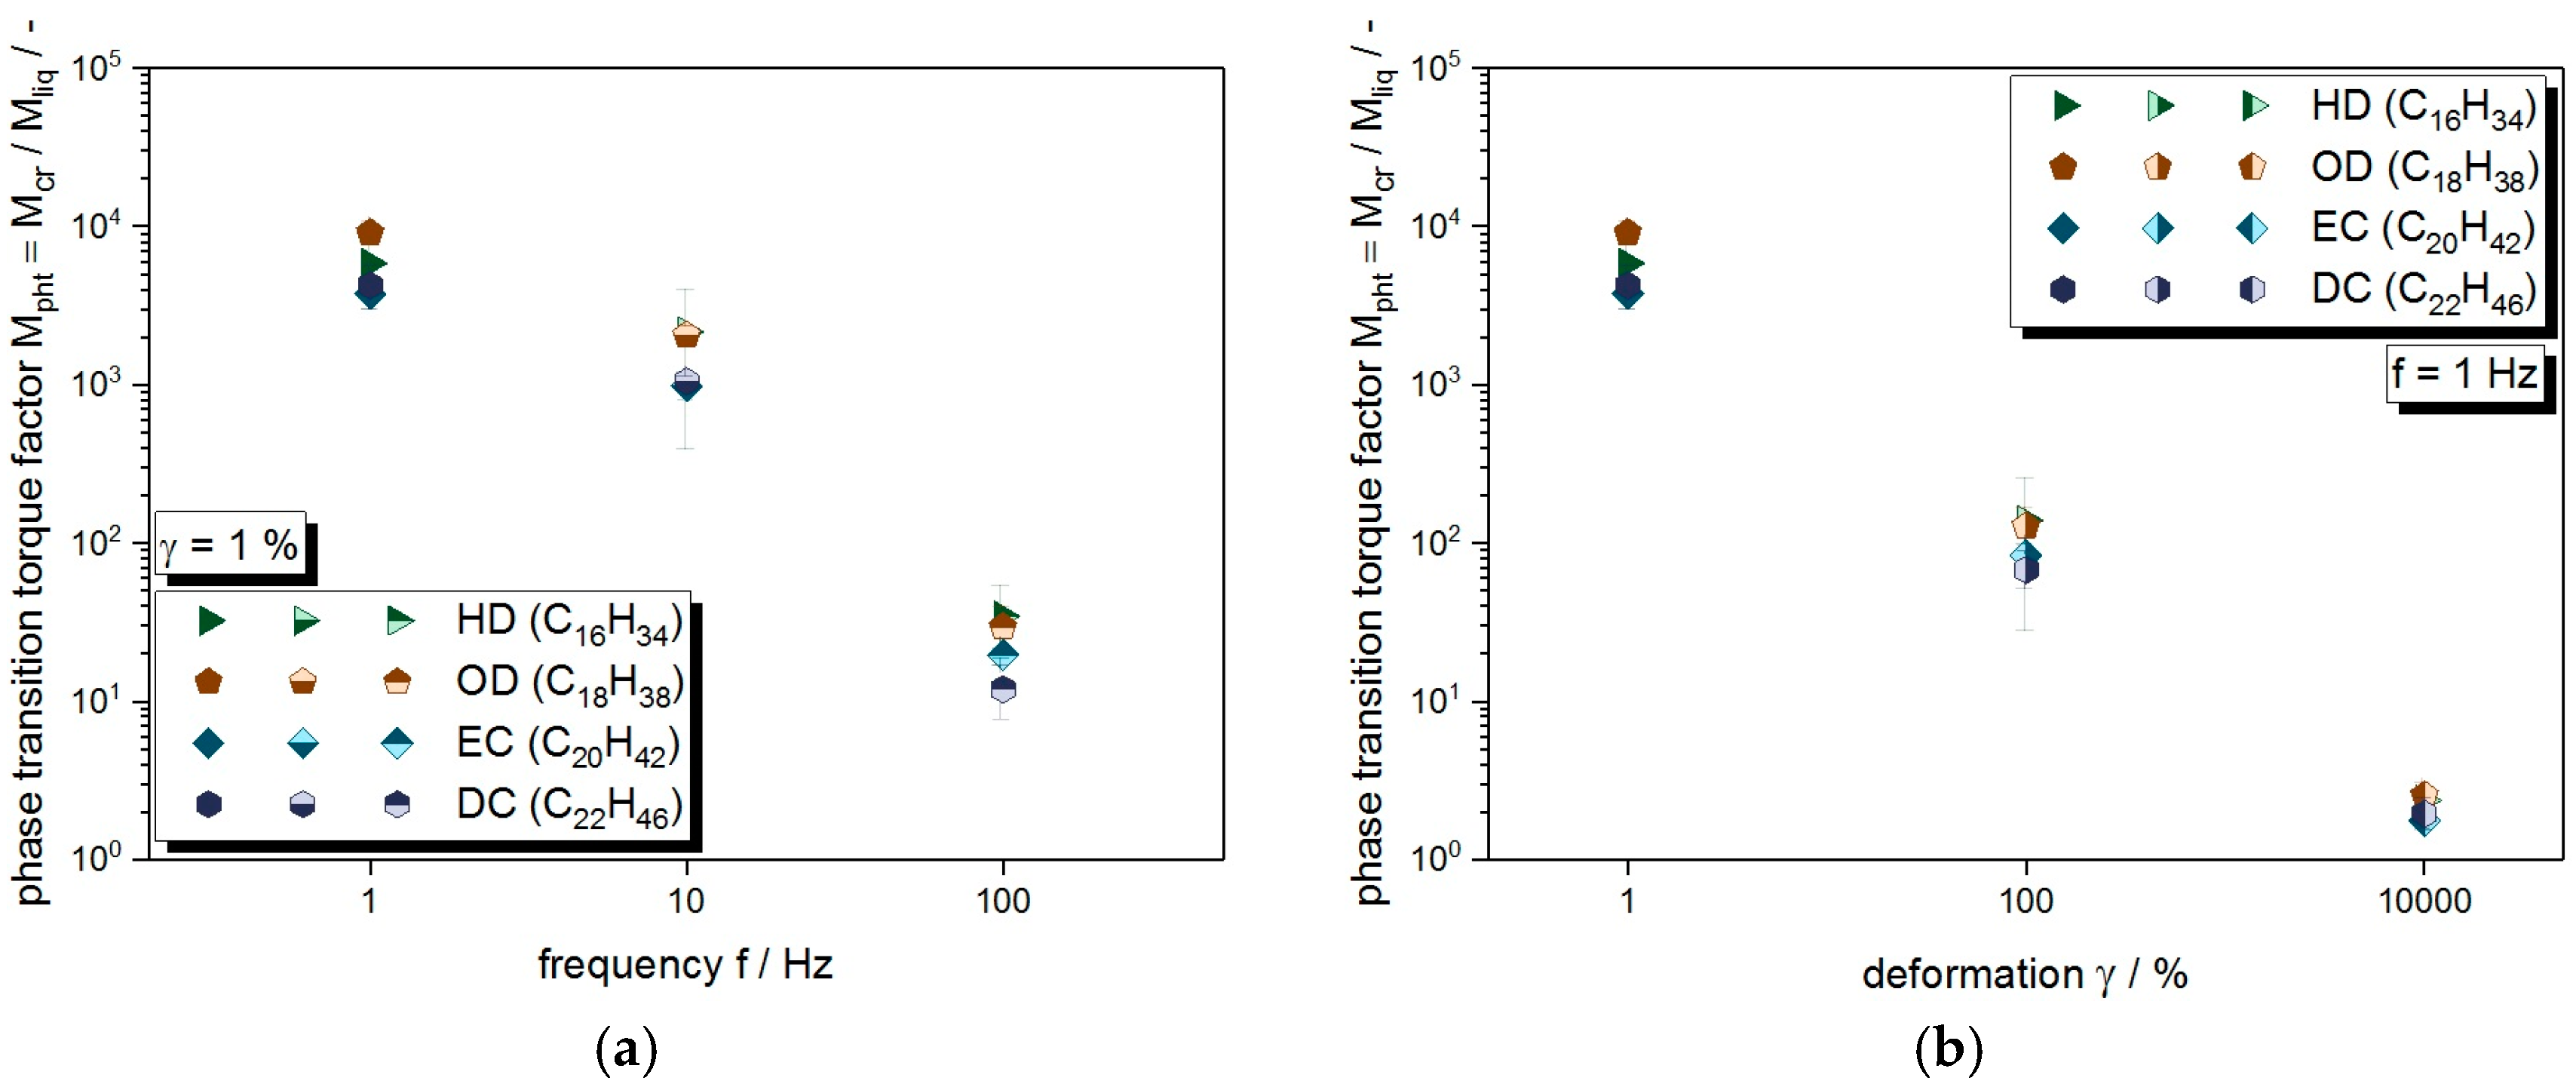
3.2. Crystallization under Mechanical Stress

Different to direct number-based observation of crystallization in previous chapter, torque was used as indirect integral signal to follow crystallization in alkane dispersions under mechanical stress. Liquid-solid phase transition, such as crystallization, is connected to an increase in inner friction or flow resistance during mechanical treatment. Therefore, crystallization under mechanical stress results in increased torque signal, which can be used as an indicator for crystallization events in dispersed systems [40,41,42].
Compared to the quiescent crystallization in Section 3.1, alkane dispersions under low mechanical stress ( f = 1 H z and γ = 1 % ) show similar trend in the start of crystallization: With increasing chain length the onset crystallization supercooling decreases in alkane dispersions (see Figure 4). However, the onset crystallization supercooling was equivalent within the standard deviation to quiescent crystallization behavior (see Figure 4b).
Two general effects of non-destructive mechanical treatment might influence the crystallization in dispersed systems: (1) Energy input over the mechanical work connected to immobilization of molecules for nucleation [50] and (2) collision of moving droplets/particles in the flow field leading to secondary nucleation [48]. Dissipated energy during oscillation mechanical stress treatment is proportional in square to the frequency f and deformation γ and can be adjusted by these two parameters. Theoretically, increasing the frequency at low deformation (such as 1%) mostly results in energy input (effect 1) and increasing the deformation at low frequency (such as 1 Hz) mostly results in flow field mediated collisions (effect 2). Therefore, we varied the frequency f at low deformation and deformation γ at low frequency to observe the influence of mechanical stress on the onset crystallization supercooling in alkane dispersions (see Figure 5).
In general, we observed no or only little influence of frequency or deformation during oscillation mechanical stress on onset crystallization supercooling in alkane dispersions. Onset crystallization supercooling tended to increase with increasing frequency and deformation and thus with increasing mechanical treatment. According to the comparatively small increase, standard deviations and the used analytical method, this might be also connected to the sensitivity of the method (no detection of crystallization events on single droplet level, several crystallization events are required for detection). The onset supercooling in dispersions represents only a small number of crystalline droplets. This small number of droplets, which crystallized at low supercooling, might also crystallize according to impurity-initiated mechanism and independent of mechanical treatment. However, the major fraction of droplets in dispersions crystallizes at higher supercooling. Consequently, to describe the crystallization progress in dispersions requires quantitative determination of crystallization index CIi as a function of mechanical stress over relevant supercooling range. Therefore, we evaluated the crystallization progress in alkane dispersions by calculation of the phase transition torque factor (see Figure 6), which takes the mean torque at high supercooling (between 16 K and 17 K, every droplet was crystalline during quiescent crystallization analysis) into ratio to mean torque at low supercooling (between 0 and 1 K, every droplet was liquid during quiescent crystallization analysis). Since liquid-solid phase transition causes higher flow resistance, dispersions with high crystallinity result in increase of torque during mechanical treatment. Additionally, crystallizing droplets do not only change their physical state but also form crystalline structures, which differ from the shape of spherical droplets. Those crystalline structures provide more interactive surface, than point contact of spheres and result in stronger aggregation due to van der Waals forces. During oscillation mechanical treatment, aggregation results in supplementary increase in torque, in addition to the increase due to supercooling and phase transition. Consequently, high torque transition factor indicates high state of crystallinity and/or crystallization initiated aggregation in dispersed systems.
At low frequency and low deformation, the phase transition torque factor was comparatively high in range of several thousand indicating advanced crystallization and/or crystallization-dependent agglomeration in dispersions. Different to low mechanical stress during supercooling, we measured a decrease in phase transition torque factor by applying both high frequencies and high deformations, indicating less flow resistance and consequently less crystallization and/or crystallization initiated aggregation. This was in contrast to the expectations, since mechanical treatment, especially at high deformation, increases the collision rates and therefore the secondary or collision-mediated nucleation in dispersions [3,48].
At this point it should be noted, that two aspects are important for the efficiency of collision mediated nucleation: (1) collision frequency/probability, which increases with increasing mechanical treatment; and (2) collision time, which decreases with increasing mechanical stress. Therefore, there is a limit in mechanical stress, which is able to promote secondary nucleation in dispersions. This limit is the collision time. The collision time must be larger than the required time for colliding supercooled droplet to wet the surface of crystallized droplet in contact, and initiate secondary nucleation. Otherwise, mechanical treatment will result in frequent collisions without nucleation leading to low crystallinity in dispersions. In addition, from thermodynamic point of view, every energy input, such as work or heat during mechanical treatment, increases the free energy of the system and might inhibit the nucleation. Of course, this strongly depends on ability of the system to convert and save the energy in order to increase its overall energy.
Still, the increase in torque during supercooling cannot be clearly connected to crystallization or aggregation/aggregation-breakage effects separately using torque as an indicator for crystallization in the tempered shear cell. To identify the mechanisms of crystallization under mechanical stress requires a combination of optical, mechanical and thermal measuring method, and is a subject of our ongoing work.

4. Conclusions

Crystallization behavior of alkane dispersions with different chain lengths, hexadecane (C16H34), octadecane (C18H38), eicosane (C20H42), and docosane (C22H46), showed strongly chain length-dependent crystallization behavior. With increasing chain length, the required supercooling and thus the driving force for the initiation of crystallization decreased within the investigated alkanes. Unlike the entire and instantaneous crystallization after nucleation in pure alkanes, crystallization in investigated alkane droplets occurred individually and were stochastically distributed among the observed supercooling range. Different to hexadecane and octadecane dispersions, eicosane and docosane dispersions had a stagnation region within the crystallization process indicating two different nucleation types. At high critical supercooling (13 K) and independent of the alkane chain length, every droplet crystallized within the investigated sample.
Applying mechanical stress during supercooling in alkane dispersions and following the crystallization process by measuring the torque led to qualitatively similar crystallization behavior, as in quiescent systems. Mechanical stress did not affect the required supercooling for initiation of the crystallization process. Consequently, increase of frequency or deformation during oscillation mechanical treatment led to similar onset crystallization supercooling. Increase of mechanical stress caused an unexpected decrease in torque indicating incomplete crystallization. This is contrary to the expected increase in secondary nucleation. However, the evaluation of torque allows only qualitative statements of the crystallization process in dispersed systems under mechanical stresses. A combination of optical, mechanical and thermal methods to quantify the crystallization behavior of dispersed systems is a subject of our ongoing investigations and will be presented in our following papers.

Acknowledgments

The authors thank AiF for funding our IGF-project 18462 N and the research association GVT.

Author Contributions

Serghei Abramov and Heike Petra Karbstein provided the idea, conceived and designed the experiments; Serghei Abramov, Kinza Shah and Lydia Weißenstein performed the experiments; Serghei Abramov, Kinza Shah and Lydia Weißenstein analyzed the data; Serghei Abramov wrote the paper; Heike Petra Karbstein corrected the paper.

Conflicts of Interest

The authors declare no conflict of interest.

Appendix A. Droplet Size Distribution

Droplet size distributions (DSD) of 1 wt % alkane dispersions, prepared with the same energy input Ev but at different temperatures (10 K above the melting temperature of respectively alkanes), are shown in Figure A1.
Figure A1. Cumulative sum distribution by area Q2 of 1 wt % alkane in water emulsions stabilized with 1 wt % Tween20® and measured at ϑ m , a l k a n e with PLM/IP. Triangles: DSD of hexadecane dispersions. Pentagons: DSD of octadecane dispersions. Diamonds: DSD of eicosane dispersions. Hexagons: DSD of docosane dispersions. Length of the scale bar is 200 µm.
Processes 06 00006 g0a1
We chose polarizing light microscopy and image processing instead of laser diffraction and dynamic light scattering for the characterization of the DSD to ensure the measurement of only liquid droplets. For this we worked at exact alkane melting temperature during the measurement and were able to detect possible crystalline structures due to polarization. This technique also allowed us to avoid unwanted measurements of agglomerates/aggregates, which might be formed due to colloidal processes in dispersed systems. As we showed in our previous investigations [14,15] the mean droplet diameter measured with thermo-optical method is almost identical within the standard deviation to the more statistic laser diffraction measurements and will be used as the characteristic size value for further discussions. The mean droplet diameter of the alkane dispersions is given in Table A1.
Table A1. Mean droplet diameter x50.2 and number of characterized droplets N with standard deviations. Measured with polarizing light microscopy/image processing.
Alkane (Dispersed Phase)x50.2 (µm)N (−)
C16: hexadecane (HD)17.2 ± 1.21297 ± 306
C18: octadecane (OD)16.1 ± 0.41653 ± 148
C20: eicosane (EC)14.6 ± 0.21774 ± 65
C22: docosane (DC)12.8 ± 1.02506 ± 86
Applying the same Ev in the emulsification process resulted in different DSDs and x50.2 values. The differences are caused by different emulsification temperatures and material properties resulting in different viscosity ratios and interfacial tensions between the dispersed and continuous phase. Both, the viscosity ratio and interfacial tension, influence the emulsification efficiency and thus the final DSD. Consequently, x50.2 decreased within the homologous series from 17.2 µm (HD, lowest emulsification temperature) to 12.8 µm (DC, highest emulsification temperature).

Appendix B. Onset Crystallization Temperature and Melting Point
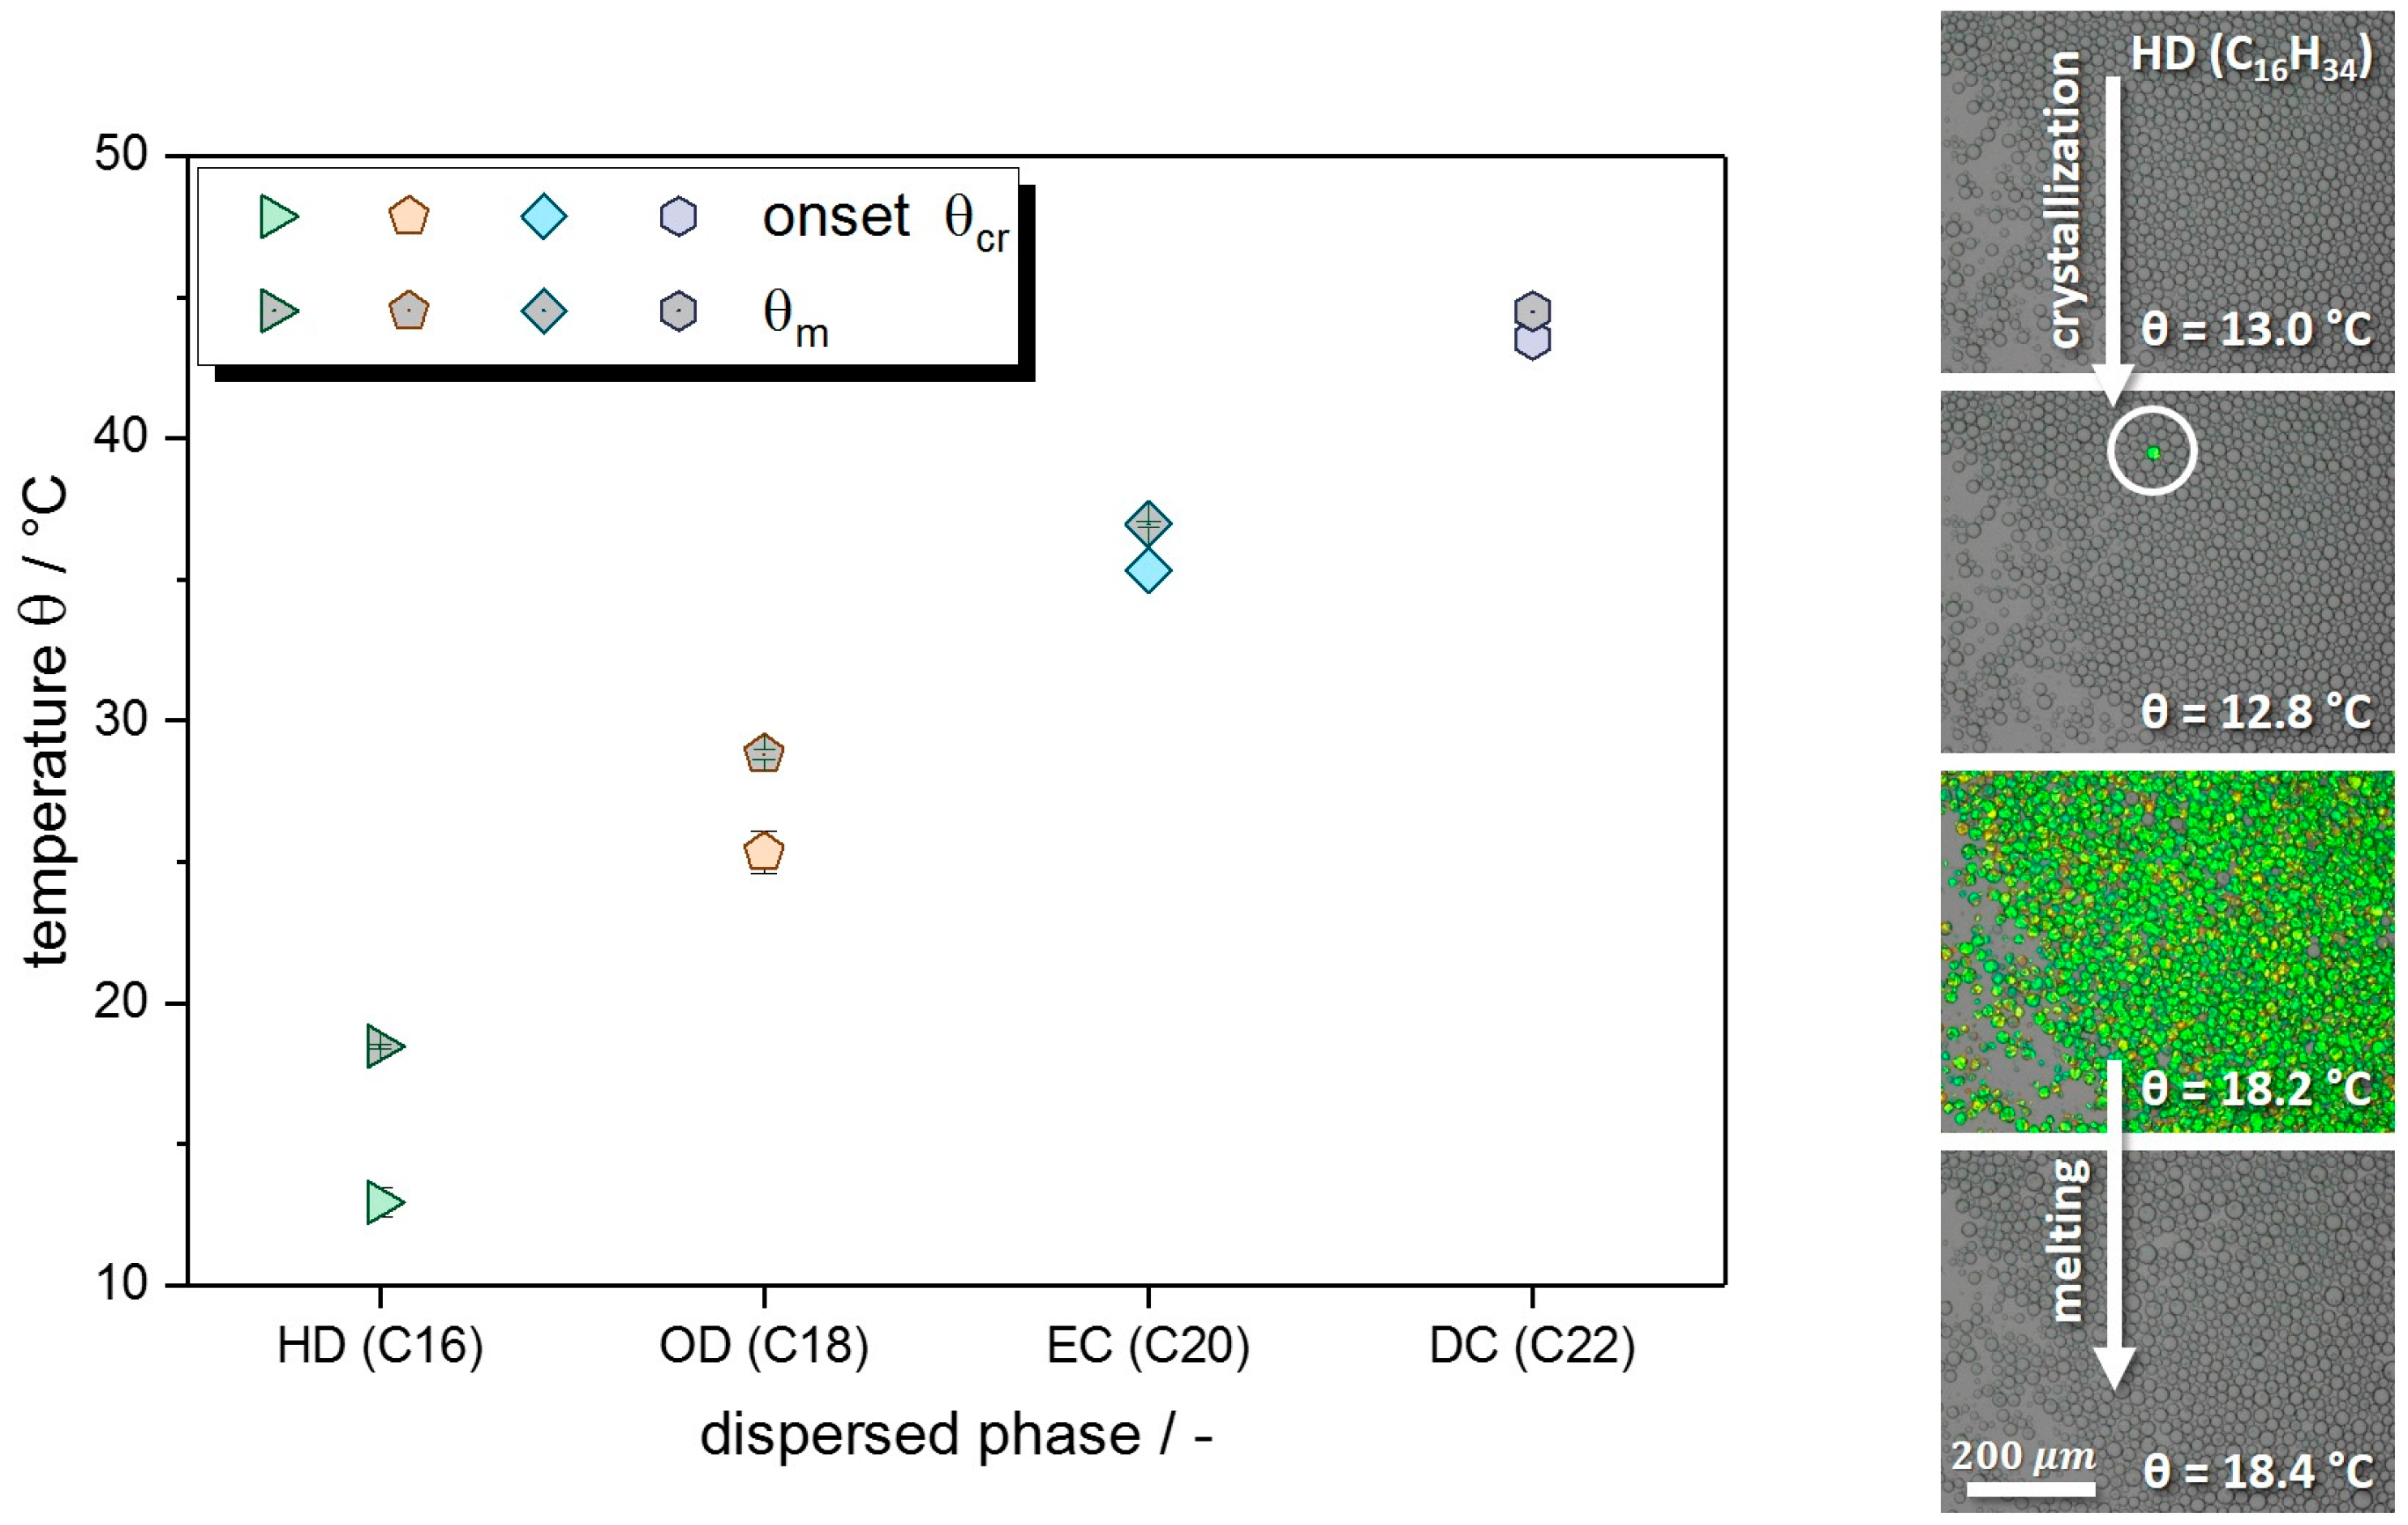
The onset crystallization and melting point in 1 wt % dispersions were determined optically using polarized cryo-microscopy and are shown in Figure A2, micrographs on the right. Since the crystallization in dispersions is an individual stochastic process, the onset crystallization temperature was determined by the first crystallized droplet. The melting temperature was determined by the melting of all crystalline structures within the dispersion.
Figure A2. Onset crystallization temperature o n s e t   ϑ c r , d i s p e r s i o n and melting point/ temperature ϑ m , d i s p e r s i o n of the alkane dispersions. Micrographs on the right show one of three exemplary determination of onset crystallization temperature and melting point in hexadecane dispersions. Length of the scale bar is 200 µm.
Processes 06 00006 g0a2
The melting temperature was always higher, then the onset crystallization. With increasing chain length of the alkanes, the difference between melting temperature and onset crystallization decreased. Consequently, with increasing chain length of the alkanes lower supercooling was required for crystallization in alkane dispersions. Melting temperature and onset crystallization are summarized in Table A2.
Table A2. Onset crystallization temperature o n s e t   ϑ c r , d i s p e r s i o n , melting point/ temperature ϑ m , d i s p e r s i o n of the alkane dispersions and reference melting temperature of the bulk ϑ m , r e f , b u l k according to [51].
Alkane (Dispersed Phase)Onset θcr,dispersion/°Cθm,dispersion/°Cθm,ref,bulk/°C [51]
C16: hexadecane (HD)12.9 ± 0.518.5 ± 0.118.2
C18: octadecane (OD)25.3 ± 0.828.8 ± 0.228.2
C20: eicosane (EC)35.3 ± 0.237.0 ± 0.136.6
C22: docosane (DC)43.5 ± 0.144.5 ± 0.044.1
We compared the melting temperatures of the dispersions with the reference melting temperature of the bulk (data from [51]) and detected differences in the range of 0.5 K. Those differences result from the resolution of the method (signal per time unit), the dispersed state (bulk vs. dispersion) and the purity of the substances. In this paper, we therefore refer the melting temperature ϑ m , a l k a n e or supercooling Δ T to the determined ϑ m , d i s p e r s i o n using our thermo-optical method.

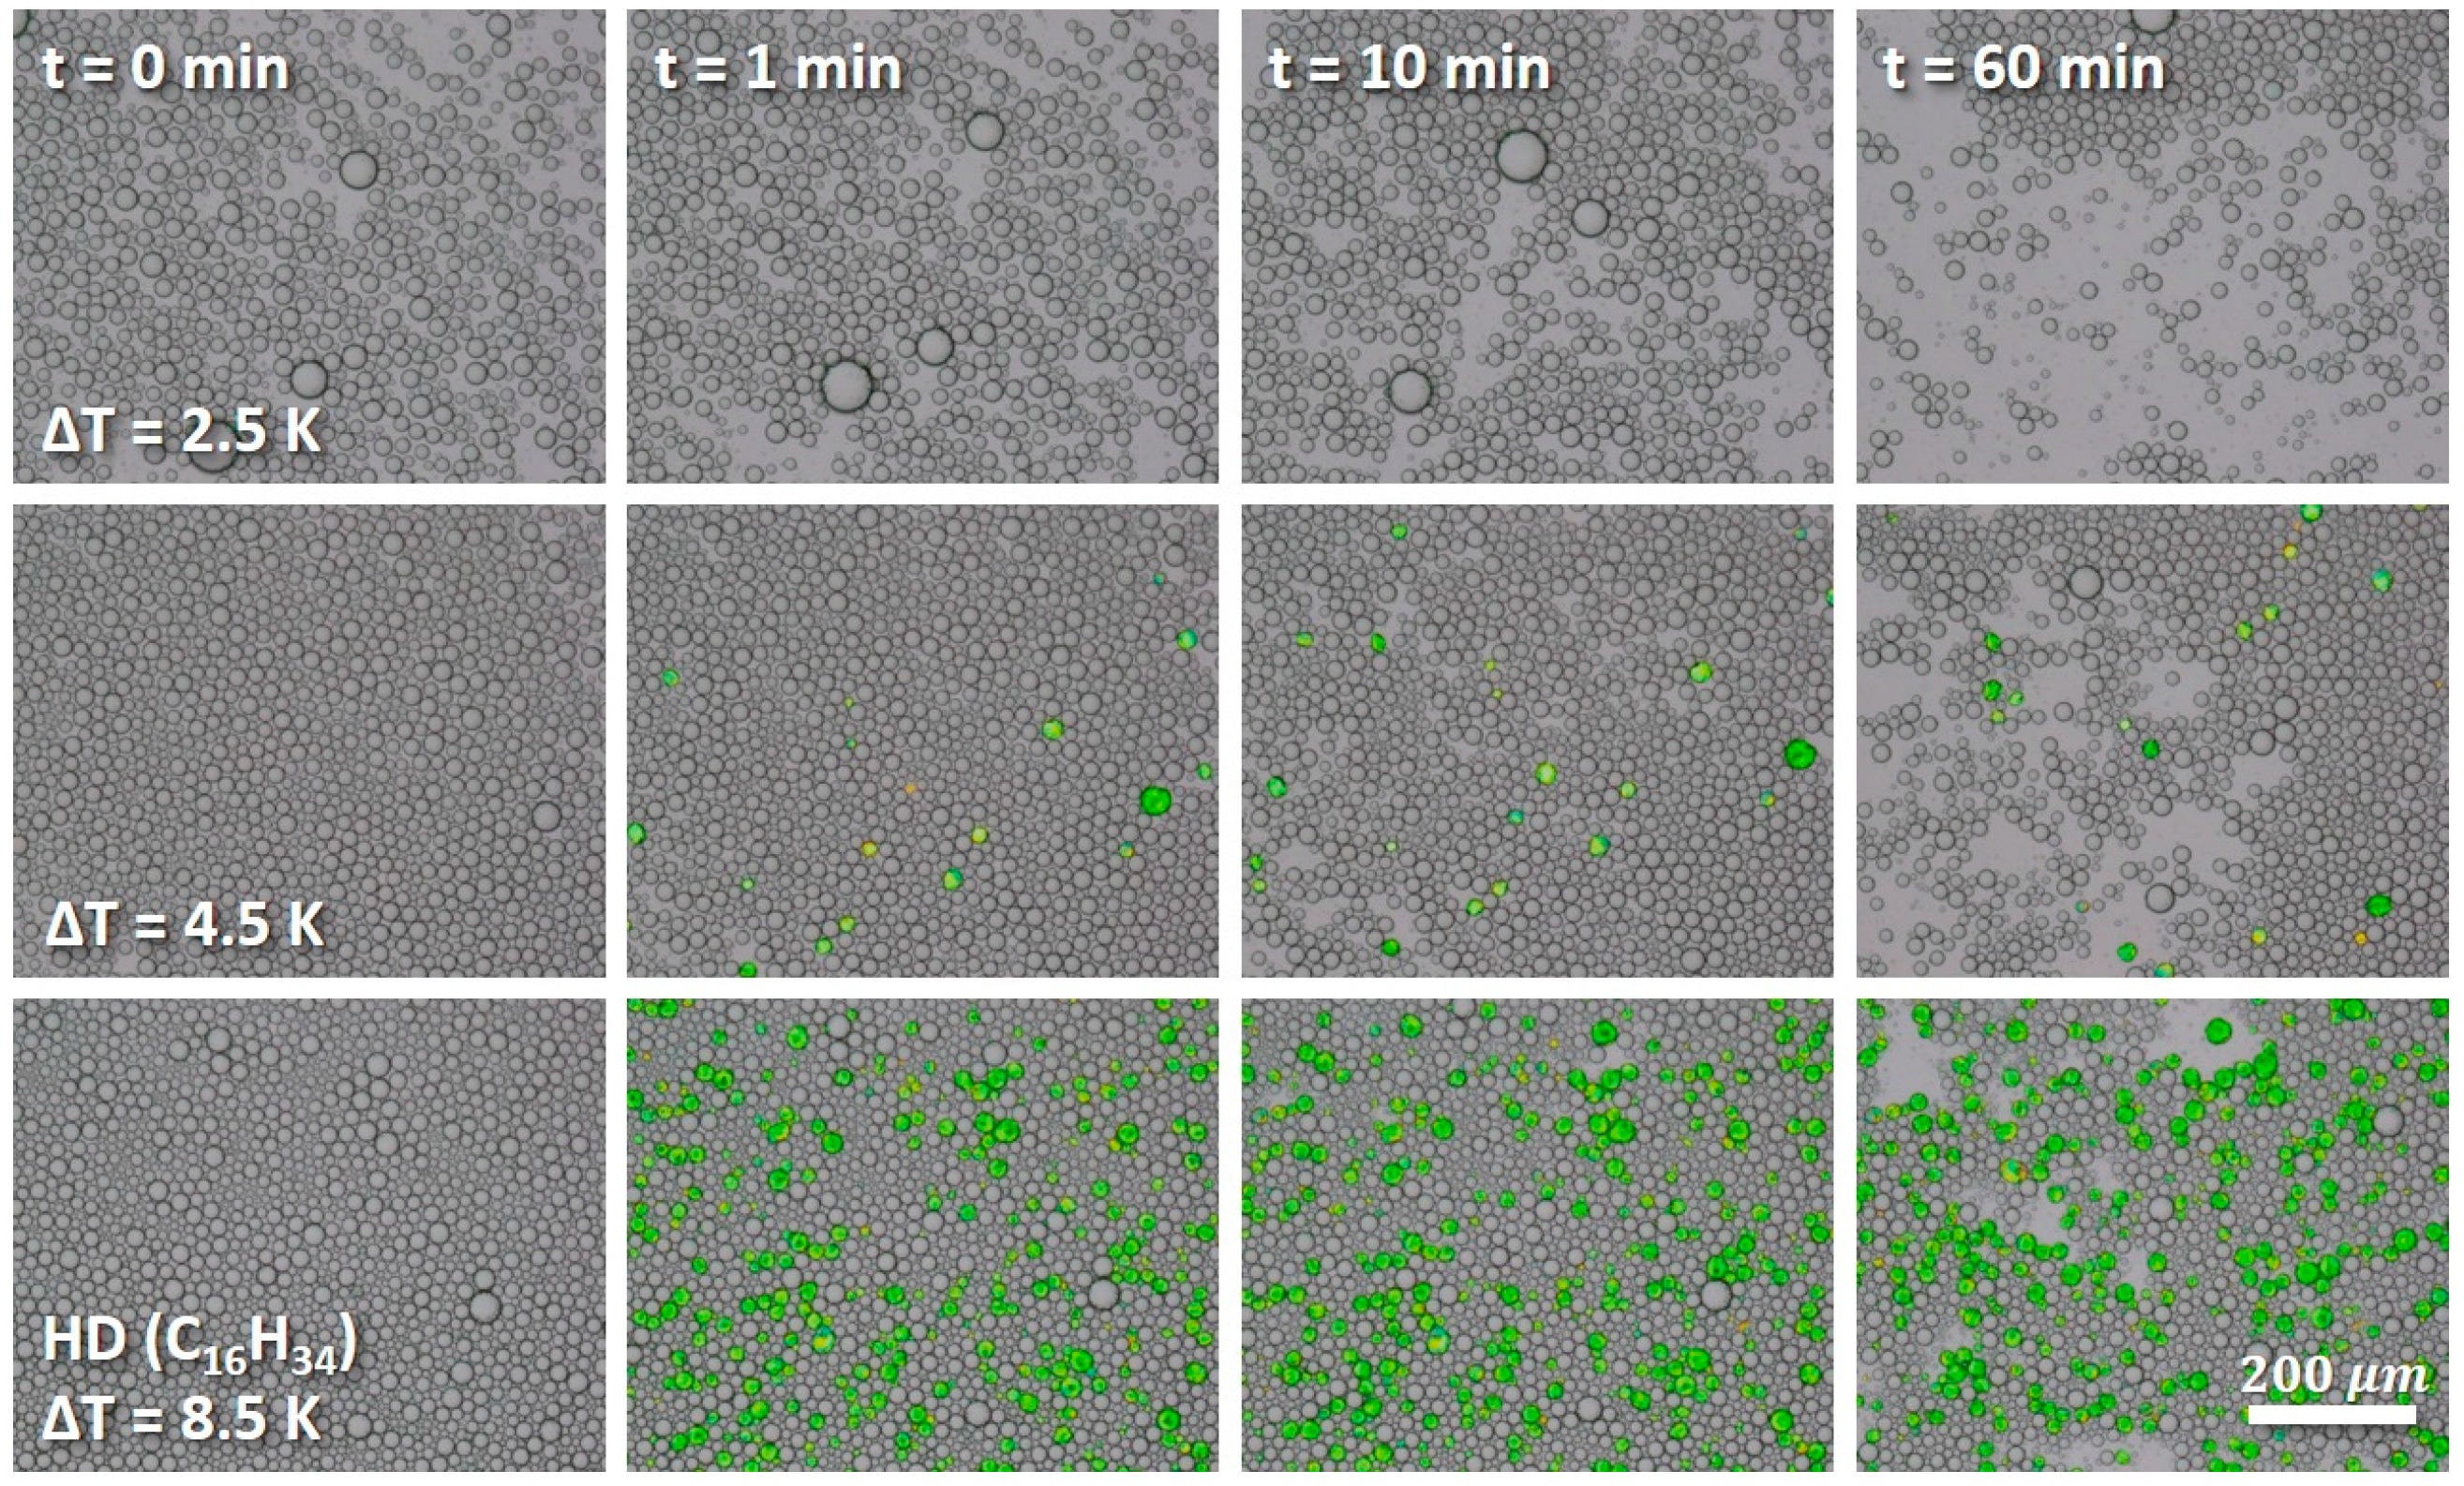
Appendix C. Time Dependency of Crystallization Process

Nucleation is a time-dependent process during the crystallization procedure. Exceeding the driving forces, such as supersaturation and/or supercooling, is usually required to overcome the nucleation barrier and still does not necessarily result in immediate crystallization. The induction time, which is required from certain supercooling/supersaturation to nucleation, differs in dependence of formulation and process. To describe the time dependency on nucleation in alkane dispersions we varied the cooling rate and followed optically the crystallization process (see Figure A3).
Figure A3. Micrographs of 1 wt % alkane dispersions at ΔT = 7.5 K during supercooling with different cooling rates. Length of the scale bar is 200 µm.
Processes 06 00006 g0a3
We observed decreasing time dependency of the crystallization in dispersions with increasing chain length from HD (C16) over OD (C18) and EC (C20) to DC (C22). In DC dispersions, the amount of crystallized droplets within triple determination was comparatively equal independent of the cooling rate. EC and OD dispersions showed similar crystallization behavior at low (0.1 K/min) and medium (1.0 K/min) cooling rates as DC dispersions. At high (10 K/min) cooling rate, both EC and OD dispersions, showed a lower number of crystallized droplets. The time dependency at the high cooling rate was higher in OD dispersions than in EC dispersions. In case of HD dispersions, the number of crystallized droplets increased with decreasing cooling rate and showed more time-dependent crystallization behavior as OD, EC and DC dispersions. In order to evaluate the time dependency compared to the driving force of supercooling we performed isothermal observations of crystallization in HD dispersions (see Figure A4).
Figure A4. Micrographs of 1 wt % HD dispersions at different supercooling during one-hour isothermal observations. Length of the scale bar is 200 µm.
Processes 06 00006 g0a4
During the isothermal observation at low supercooling (ΔT = 2.5 K) we did not detect any crystallization in HD dispersions within one-hour observation, which corresponds to the onset crystallization investigations in Appendix B. Increasing the supercooling (to ΔT = 4.5 K) led to crystallization of few droplets within one minute. The number of crystallized droplets remained comparatively equal within one-hour observation. At high supercooling (ΔT = 8.5 K) more droplets crystallized in HD dispersions within one minute. Also here, the number of crystallized droplets did not change within one hour.
The influence of supercooling was higher than the time dependency during isothermal observations in HD dispersions with no significant change in number of crystallized droplets after one minute. According to no change in number of crystallized droplets after one minute in HD dispersions and nearly no time dependency in investigated time scale in OD, EC and DC dispersions we chose 1 K/min as a cooling rate for further investigations.

References

  1. Müller, R.H.; Petersen, R.D.; Hommoss, A.; Pardeike, J. Nanostructured lipid carriers (NLC) in cosmetic dermal products. Adv. Drug Deliv. Rev. 2007, 59, 522–530. [Google Scholar] [CrossRef] [PubMed]
  2. Pardeike, J.; Hommoss, A.; Müller, R.H. Lipid nanoparticles (SLN, NLC) in cosmetic and pharmaceutical dermal products. Int. J. Pharm. 2009, 366, 170–184. [Google Scholar] [CrossRef] [PubMed]
  3. McClements, D.J. Crystals and crystallization in oil-in-water emulsions: Implications for emulsion-based delivery systems. Adv. Colloid Interface Sci. 2012, 174, 1–30. [Google Scholar] [CrossRef] [PubMed]
  4. Rostami, E.; Kashanian, S.; Azandaryani, A.H.; Faramarzi, H.; Dolatabadi, J.E.N.; Omidfar, K. Drug targeting using solid lipid nanoparticles. Chem. Phys. Lipids 2014, 181, 56–61. [Google Scholar] [CrossRef] [PubMed]
  5. Wissing, S. Cosmetic applications for solid lipid nanoparticles (SLN). Int. J. Pharm. 2003, 254, 65–68. [Google Scholar] [CrossRef]
  6. Müller, R. Solid lipid nanoparticles (SLN) for controlled drug delivery: A review of the state of the art. Eur. J. Pharm. Biopharm. 2000, 50, 161–177. [Google Scholar] [CrossRef]
  7. Mehnert, W. Solid lipid nanoparticles Production, characterization and applications. Adv. Drug Deliv. Rev. 2001, 47, 165–196. [Google Scholar] [CrossRef]
  8. Wissing, S.A.; Kayser, O.; Müller, R.H. Solid lipid nanoparticles for parenteral drug delivery. Adv. Drug Deliv. Rev. 2004, 56, 1257–1272. [Google Scholar] [CrossRef] [PubMed]
  9. Coupland, J.N. Crystallization in emulsions. Curr. Opin. Colloid Interface Sci. 2002, 7, 445–450. [Google Scholar] [CrossRef]
  10. Weiss, J.; Decker, E.A.; McClements, D.J.; Kristbergsson, K.; Helgason, T.; Awad, T. Solid Lipid Nanoparticles as Delivery Systems for Bioactive Food Components. Food Biophys. 2008, 3, 146–154. [Google Scholar] [CrossRef]
  11. Behr’s Verlag. Emulgiertechnik. Grundlagen, Verfahren und Anwendungen; Köhler, K., Schuchmann, H.P., Eds.; Behr’s Verlag: Hamburg, Germany, 2012. [Google Scholar]
  12. Walstra, P. Physical Chemistry of Foods; Marcel Dekker: New York, NY, USA, 2003. [Google Scholar]
  13. Köhler, K.; Hensel, A.; Kraut, M.; Schuchmann, H.P. Melt emulsification—Is there a chance to produce particles without additives? Particuology 2011, 9, 506–509. [Google Scholar] [CrossRef]
  14. Abramov, S.; Ruppik, P.; Schuchmann, H. Crystallization in Emulsions: A Thermo-Optical Method to Determine Single Crystallization Events in Droplet Clusters. Processes 2016, 4, 25. [Google Scholar] [CrossRef]
  15. Abramov, S.; Berndt, A.; Georgieva, K.; Ruppik, P.; Schuchmann, H.P. Investigation of the influence of mean droplet size and shear rate on crystallization behavior of hexadecane-in-water dispersions. Colloids Surf. A Physicochem. Eng. Asp. 2017, 529, 513–522. [Google Scholar] [CrossRef]
  16. Tippetts, M.; Martini, S. Effect of cooling rate on lipid crystallization in oil-in-water emulsions. Food Res. Int. 2009, 42, 847–855. [Google Scholar] [CrossRef]
  17. Bolzinger, M.A.; Cogne, C.; Lafferrere, L.; Salvatori, F.; Ardaud, P.; Zanetti, M.; Puel, F. Effects of surfactants on crystallization of ethylene glycol distearate in oil-in-water emulsion. Colloids Surf. A Physicochem. Eng. Asp. 2007, 299, 93–100. [Google Scholar] [CrossRef]
  18. Ghosh, S.; Cramp, G.L.; Coupland, J.N. Effect of aqueous composition on the freeze-thaw stability of emulsions. Colloids Surf. A Physicochem. Eng. Asp. 2006, 272, 82–88. [Google Scholar] [CrossRef]
  19. Samtlebe, M.; Yucel, U.; Weiss, J.; Coupland, J.N. Stability of Solid Lipid Nanoparticles in the Presence of Liquid Oil Emulsions. J. Am. Oil Chem. Soc. 2012, 89, 609–617. [Google Scholar] [CrossRef]
  20. Vanapalli, S.A.; Palanuwech, J.; Coupland, J.N. Stability of emulsions to dispersed phase crystallization: Effect of oil type, dispersed phase volume fraction, and cooling rate. Colloids Surf. A Physicochem. Eng. Asp. 2002, 204, 227–237. [Google Scholar] [CrossRef]
  21. Vanapalli, S.A.; Palanuwech, J.; Coupland, J.N. Influence of Fat Crystallization on the Stability of Flocculated Emulsions. J. Agric. Food Chem. 2002, 50, 5224–5228. [Google Scholar] [CrossRef] [PubMed]
  22. Ghosh, S.; Rousseau, D. Fat crystals and water-in-oil emulsion stability. Curr. Opin. Colloid Interface Sci. 2011, 16, 421–431. [Google Scholar] [CrossRef]
  23. Helgason, T.; Awad, T.S.; Kristbergsson, K.; McClements, D.J.; Weiss, J. Influence of Polymorphic Transformations on Gelation of Tripalmitin Solid Lipid Nanoparticle Suspensions. J. Am. Oil Chem. Soc. 2008, 85, 501–511. [Google Scholar] [CrossRef]
  24. Yang, D.; Hrymak, A.N. Crystal Morphology of Hydrogenated Castor Oil in the Crystallization of Oil-in-Water Emulsions: Part I. Effect of Temperature. Ind. Eng. Chem. Res. 2011, 50, 11585–11593. [Google Scholar] [CrossRef]
  25. Rousseau, D. Fat crystals and emulsion stability—A review. Food Res. Int. 2000, 33, 3–14. [Google Scholar] [CrossRef]
  26. Himawan, C.; Starov, V.M.; Stapley, A.G.F. Thermodynamic and kinetic aspects of fat crystallization. Adv. Colloid Interface Sci. 2006, 122, 3–33. [Google Scholar] [CrossRef] [PubMed]
  27. Kashchiev, D.; van Rosmalen, G.M. Review: Nucleation in solutions revisited. Cryst. Res. Technol. 2003, 38, 555–574. [Google Scholar] [CrossRef]
  28. Hindle, S.; Povey, M.J.; Smith, K. Kinetics of Crystallization in n-Hexadecane and Cocoa Butter Oil-in-Water Emulsions Accounting for Droplet Collision-Mediated Nucleation. J. Colloid Interface Sci. 2000, 232, 370–380. [Google Scholar] [CrossRef] [PubMed]
  29. Dickinson, E.; Ma, J.; Povey, M.J. Crystallization kinetics in oil-in-water emulsions containing a mixture of solid and liquid droplets. Faraday Trans. 1996, 92, 1213. [Google Scholar] [CrossRef]
  30. Petersen, S.; Ulrich, J. Role of Emulsifiers in Emulsion Technology and Emulsion Crystallization. Chem. Eng. Technol. 2013, 36, 398–402. [Google Scholar] [CrossRef]
  31. Kim, J.-W.; Ulrich, J. Prediction of degree of deformation and crystallization time of molten droplets in pastillation process. Int. J. Pharm. 2003, 257, 205–215. [Google Scholar] [CrossRef]
  32. Helgason, T.; Awad, T.S.; Kristbergsson, K.; McClements, D.J.; Weiss, J. Effect of surfactant surface coverage on formation of solid lipid nanoparticles (SLN). J. Colloid Interface Sci. 2009, 334, 75–81. [Google Scholar] [CrossRef] [PubMed]
  33. McClements, D.J.; Dungan, S.R.; German, J.B.; Simoneau, C.; Kinsella, J.E. Droplet Size and Emulsifier Type Affect Crystallization and Melting of Hydrocarbon-in-Water Emulsions. J. Food Sci. 1993, 58, 1148–1151. [Google Scholar] [CrossRef]
  34. Ruecroft, G.; Hipkiss, D.; Ly, T.; Maxted, N.; Cains, P.W. Sonocrystallization: The Use of Ultrasound for Improved Industrial Crystallization. Org. Process Res. Dev. 2005, 9, 923–932. [Google Scholar] [CrossRef]
  35. Alexander, A.J.; Camp, P.J. Single Pulse, Single Crystal Laser-Induced Nucleation of Potassium Chloride. Cryst. Growth Des. 2009, 9, 958–963. [Google Scholar] [CrossRef]
  36. Javid, N.; Kendall, T.; Burns, I.S.; Sefcik, J. Filtration Suppresses Laser-Induced Nucleation of Glycine in Aqueous Solutions. Cryst. Growth Des. 2016, 16, 4196–4202. [Google Scholar] [CrossRef] [Green Version]
  37. Da Pieve, S.; Calligaris, S.; Co, E.; Nicoli, M.C.; Marangoni, A.G. Shear Nanostructuring of Monoglyceride Organogels. Food Biophys. 2010, 5, 211–217. [Google Scholar] [CrossRef]
  38. Garbolino, C.; Ziegler, G.R.; Coupland, J.N. Ultrasonic determination of the effect of shear on lipid crystallization. J. Am. Oil Chem. Soc. 2000, 77, 157–162. [Google Scholar] [CrossRef]
  39. Saggin, R.; Coupland, J.N. Shear and longitudinal ultrasonic measurements of solid fat dispersions. J. Am. Oil Chem. Soc. 2004, 81, 27–32. [Google Scholar] [CrossRef]
  40. Sonwai, S.; Mackley, M.R. The effect of shear on the crystallization of cocoa butter. J. Am. Oil Chem. Soc. 2006, 83, 583–596. [Google Scholar] [CrossRef]
  41. Tarabukina, E.; Jego, F.; Haudin, J.-M.; Navard, P.; Peuvrel-Disdier, E. Effect of shear on the rheology and crystallization of palm oil. J. Food Sci. 2009, 74, 16. [Google Scholar] [CrossRef] [PubMed] [Green Version]
  42. Vanapalli, S.A.; Coupland, J.N. Emulsions under shear—The formation and properties of partially coalesced lipid structures. Food Hydrocoll. 2001, 15, 507–512. [Google Scholar] [CrossRef]
  43. Barfod, N.M.; Krog, N. Destabilization and fat crystallization of whippable emulsions (toppings) studied by pulsed NMR. J. Am. Oil Chem. Soc. 1987, 64, 112–119. [Google Scholar] [CrossRef]
  44. Goff, H.D. Instability and Partial Coalescence in Whippable Dairy Emulsions. J. Dairy Sci. 1997, 80, 2620–2630. [Google Scholar] [CrossRef]
  45. Stapley, A.G.F.; Tewkesbury, H.; Fryer, P.J. The effects of shear and temperature history on the crystallization of chocolate. J. Am. Oil Chem. Soc. 1999, 76, 677–685. [Google Scholar] [CrossRef]
  46. Hindle, S.A.; Povey, M.J.; Smith, K.W. Characterizing cocoa butter seed crystals by the oil-in-water emulsion crystallization method. J. Am. Oil Chem. Soc. 2002, 79, 993–1002. [Google Scholar] [CrossRef]
  47. Thomson, W. On the equilibrium of vapor at a curved surface of liquid. Philos. Mag. 1871, 448–452. [Google Scholar]
  48. Povey, M.J.W. Crystal nucleation in food colloids. Food Hydrocoll. 2014, 42, 118–129. [Google Scholar] [CrossRef]
  49. Pound, G.M.; La Mer, V.K. Kinetics of Crystalline Nucleus Formation in Supercooled Liquid Tin 1,2. J. Am. Chem. Soc. 1952, 74, 2323–2332. [Google Scholar] [CrossRef]
  50. Rodriguez-Spong, B.; Price, C.P.; Jayasankar, A.; Matzger, A.J.; Rodriguez-Hornedo, N. General principles of pharmaceutical solid polymorphism: A supramolecular perspective. Adv. Drug Deliv. Rev. 2004, 56, 241–274. [Google Scholar] [CrossRef] [PubMed]
  51. Domalski, E.S.; Hearing, E.D. Heat Capacities and Entropies of Organic Compounds in the Condensed Phase. Volume III. J. Phys. Chem. Ref. Data 1996, 25, 1–525. [Google Scholar] [CrossRef]
Figure 1. Torque M as a function of supercooling at constant deformation γ of 1% and frequency f of 1 Hz of 10 wt % eicosane dispersion. Micrographs on the right are depicted results of quiescent crystallization (without mechanical treatment).
Processes 06 00006 g001
Figure 2. Micrographs of 1 wt % alkane dispersions at different supercooling with a cooling rate of 1 K/min. Length of the scale bar is 200 µm.
Processes 06 00006 g002
Figure 3. Number-based crystallization index CIN of 1 wt % alkane dispersions as a function of supercooling Δ T with a cooling rate of 1 K/min. Length of the scale bar is 200 µm.
Processes 06 00006 g003
Figure 4. (a) Normalized torque M n o r m of 10 wt % alkane dispersions under low oscillation mechanical stress as a function of supercooling Δ T ; (b) Comparison of onset crystallization supercooling during quiescent crystallization o n s e t Δ T q u i s c e n t and crystallization under low mechanical stress o n s e t Δ T f = 1 H z , γ = 1 % .
Processes 06 00006 g004
Figure 5. (a) Onset crystallization supercooling of 10 wt % alkane dispersions o n s e t Δ T c r , d i s p e r s i o n as a function of frequency f ; (b) Onset crystallization supercooling of 10 wt % alkane dispersions o n s e t Δ T c r , d i s p e r s i o n as a function of deformation γ .
Processes 06 00006 g005
Figure 6. (a) Phase transition torque factor of 10 wt % alkane dispersions M p h t as a function of frequency f ; (b) Phase transition torque factor of 10 wt % alkane dispersions M p h t as a function of deformation γ .
Processes 06 00006 g006

