Optimization through Response Surface Methodology of a Reactor Producing Methanol by the Hydrogenation of Carbon Dioxide


Department of Industrial and Information Engineering and Economics, University of L’Aquila, Via Giovanni Gronchi 18, 67100 L’Aquila, Italy
Processes 2017, 5(4), 62; https://doi.org/10.3390/pr5040062
Submission received: 17 September 2017
/
Revised: 10 October 2017
/
Accepted: 10 October 2017
/
Published: 23 October 2017
(This article belongs to the Collection Process System Engineering for More Efficient Power and Chemicals Production)
Abstract
:Carbon dioxide conversion and utilization is gaining significant attention worldwide, not only because carbon dioxide has an impact on global climate change, but also because it provides a source for potential fuels and chemicals. Methanol is an important fuel that can be obtained by the hydrogenation of carbon dioxide. In this research, the modeling of a reactor to produce methanol using carbon dioxide and hydrogen is carried out by way of an ANOVA and a central composite design. Reaction temperature, reaction pressure, H2/CO2 ratio, and recycling are the chosen factors, while the methanol production and the reactor volume are the studied responses. Results show that the interaction AC is common between the two responses and allows improvement of the productivity in reducing the volume. A mathematical model for methanol production and reactor volume is obtained with significant factors. A central composite design is used to optimize the process. Results show that a higher productivity is obtained with temperature, CO2/H2 ratio, and recycle factors at higher, lower, and higher levels, respectively. The methanol production is equal to 33,540 kg/h, while the reactor volume is 6 m3. Future research should investigate the economic analysis of the process in order to improve productivity with lower costs.
1. Introduction
With the rapid development of the world’s society and economy, especially in developing countries, the growing needs for energy supply are becoming devastating. Global energy demand is expected to double by 2050 [1]. More than 80% of global energy demand is still satisfied by fossil fuels due to their abundance and availability [2]. However, the world fossil fuels are depleting and produce different environmental problems, suggesting that alternative solutions are needed.
For these reasons, renewable energies (RES) are suggested as an alternative to traditional fossil fuels, and significant progress has been achieved. The need to find clean and sustainable energy is a critical factor for society [3].
In this context, power-to-liquid (PtL) systems seem to represent an efficient solution for future energy scenarios: a PtL technology concerns a process that is able to absorb energy (overproduction of RES on the grid), converting and storing that energy into liquid fuels through the use of carbon dioxide as a reagent. This system is an effective way to moderate the intermittency of renewable energy in order to stabilize the electrical grid. In addition, the conversion of carbon dioxide into fuels allows the recycling of carbon dioxide and the reduction of greenhouse gas (GHG) emissions.
Processes based on methanol synthesis have received significant attention over the past decade. Carbon dioxide and hydrogen are used as raw materials according to hydrogenation catalytic reaction. In recent years, several efforts have been made to develop efficient CO2 utilization technologies, and the more attractive processes are the hydrogenation of CO2 and the reforming of CO2 with CH4 [4,5,6]. Sources of carbon dioxide can be: power plants, air, ammonia plants, anaerobic digestion plants, process industries like cement, iron, and steel, aluminum, pulp and paper, and refineries from which it is produced by way of carbon capture and utilization (CCU) processes [7]. Waste is then recovered and enhanced to produce chemical compounds. Hydrogen, instead, can be produced by the electrolysis of water using renewable energies such as solar or wind energy. It may be produced through the alkaline or proton exchange membrane electrolysis (PEM), while the solid oxide electrolyser cells (SOECs) are currently less developed [8]. Hydrogen can also be obtained by coke oven gas (COG) from steel works, syngas, methane steam reforming, chlorine alkali, and petrochemical plants [9]. An innovative technology allows the production of hydrogen by photocatalytic water splitting [10]. A catalytic reaction producing methanol takes place in the ranges of temperature and pressure equal to 423–523 K and 50–100 bar, respectively, on CuO/ZnO/Al2O3 as catalyst [11,12].
It is evident that the use of renewable resources to substitute fossil fuels is one of the technological options to mitigate GHG emissions [13]. Using this in relation to methanol production is then a green process, with lower environmental impacts.
Other routes can be used for the production of methanol, such as the dry reformation of methane and carbon dioxide into syngas that is converted into methanol through the Fischer–Tropsch reaction [14,15], the hydrogenation of syngas [16], the co-electrolysis of carbon dioxide and water [17,18], or the photocatalytic reaction of carbon dioxide and water [19,20]. Additionally, as an alternative to carbon dioxide, other raw materials can be used to produce methanol as natural gas through a reforming reaction or as coal and biomass via gasification [21]. Currently, methanol is predominantly produced from natural gas via steam reforming or from coal via gasification on an industrial scale [22].
Methanol is a key chemical intermediate for numerous commodities: dimethyl ether, methylamines, chloromethanes, solvents, propylene, olefins, formaldehyde, acetic acid, methyl methacrylate, gasoline/fuels [13,23,24]. Methanol-to-olefins (MTO) and methanol-to-propylene (MTP) demand has increased in recent years, rising from 6% of end use demand in 2011 to 22% by 2016, especially in China [25]. Other uses of methanol include wastewater de-nitrification, the hydrogen carrier for fuel cells and the transesterification of vegetable oils for biodiesel production and electricity generation [26,27]. Methanol can then be used from energy uses to chemical uses [28,29]. With a high-octane number, methanol ensures good antiknock performance, in addition to high volatility, denser fuel–air charge, and excellent lean burn properties [30]. The current annual consumption of methanol is over 60 million metric tons globally, and it will grow [31]. In 2030, meeting the European yearly demand will require 41–76 MtCO2/year, meaning that 16–31 MtCO2/year of CO2 will not be emitted, because through the use of CCU systems 28–52 Mt MeOH/year will be produced [32].
The production of methanol via the hydrogenation of carbon dioxide and hydrogen is a mature technology, and the literature mainly covers the economic and technical aspects of its process. Pilot plants that use renewable hydrogen are in operation in Japan, Iceland (with a capacity of 4000 ton/year, constructed by Carbon Recycling International and operating since 2011), and Osaka (with a capacity of 100 ton/year) [11]. The catalytic hydrogenation of carbon dioxide has become technically competitive with the industrial production of methanol from syngas [11,33,34], and shows great potential for large-scale applications and carbon dioxide consumption [35].
Bellotti et al. [22] analyzed a process for the production of methanol by capturing carbon dioxide from power plants and producing hydrogen from PEM electrolyzers. The power to process methanol is made possible by water electrolyzers and carbon capture systems, using amine solution and a methanol reactor. An economic feasibility study of the plant was carried out, taking into consideration three different sizes (4000, 10,000, 50,000 ton/year of CH3OH produced), using W-ECoMP software. A sensitivity analysis was also developed, varying methanol selling price, oxygen selling options for industrial applications, and the capital cost of PEM electrolyzers. Results show that the PEM electrolyzer affects more than 75% of total capital investment and a larger plant leads to higher capital investment but allows for a slower payback period.
Atsonios et al. [36] analyzed a process to produce methanol using carbon dioxide obtained by power plants or other intensive carbon emission industries (cement plant, steel industry) through mono-ethanolamine (MEA) absorption, while hydrogen is obtained by water electrolysis with alkaline electrolyzers. Different electric sources are considered: grids, thermal power plants, wind energies. An economic analysis of an H2 production scheme reveals that each of three main parameters for the determination of H2 cost (electrolyzer capital cost, electricity cost, and storage cost) can play a key role in the feasibility of the plant. Then, hydrogen production cost is the most significant factor influencing the economy of this methanol process. The total specific power consumption of the methanol plant was equal to 113.4 kWhe/tonMeOH.
Rivera-Tinoco et al. [37] found a methanol cost of 891 €/ton for the PEM/methanol process and 5459 €/ton for the SOEC/methanol process. Promising reduction can be obtained by improving the electrolyzed system: its energy efficiency is a key parameter to decrease costs. On the other hand, research activities for high-temperature CO2 electrolysis are accelerating [38].
Perez-Fortes et al. [7] evaluated a techno-economic and environmental analysis for a process producing methanol from H2 and CO2 captured by power plants. In particular, the net reduction of CO2 emissions and production cost were evaluated in comparison with the conventional synthesis processes of MeOH in Europe. The evaluated plant produces 440 kton/year of methanol, and its configuration is the result of a heat integration process. A simulation of the system was developed in ChemCad 6.3® software (Chemstation, Huston, Texas, USA). Results show that in order to have an economically feasible plant, the price of methanol should be around 800 €/ton, H2 costs should be around 1236 €/ton, or CO2 should have a value of around 222 €/t. Additionally, compared to traditional plants, the process has a lower capital cost but higher variable costs. Regarding an environmental analysis, the system allows the emission of 2 tons of carbon dioxide to be avoided for one ton of produced methanol.
Kiss et al. [9] developed a new process to produce methanol by the hydrogenation of carbon dioxide, using wet hydrogen available as a by-product in chlor-alkali production. The key feature of this novel process is the use of a stripping unit, where wet hydrogen (saturated with water) flows in counter-current with a condensed mixture of methanol–water resulting from flash separation after reaction. In this way, COx is removed by methanol–water mixture, allowing a complete recycling of CO2, also removing water from wet hydrogen (initially saturated with water) and thus avoiding a negative impact on reaction equilibrium conversion.
Atsonios et al. [39] developed a new membrane reactor with high selectivity either in methanol permeation or in water permeation. Methanol was produced according to the hydrogenation of carbon dioxide obtained by power plants while hydrogen was obtained by the electrolysis of water in alkaline cells. Results showed that the membrane did not influence thermal efficiency, but increased methanol yield. This allows the reduction of the recycling gas flow rate, leading to reduced reactor dimensions and investment costs.
Al-Kalbani et al. [31] compared two different processes to produce methanol using Aspen Hysys software: the hydrogenation of carbon dioxide for the first scheme and the co-electrolysis of water and carbon dioxide for the second scheme. Results show that a higher co-electrolysis temperature determines a lower energy demand compared to hydrogenation systems. The energy efficiency of co-electrolysis is equal to 41%—almost double that of the hydrogenation processes. A heat integration is suggested by recovering heat from methanol reaction in order to produce electricity through a Rankine cycle.
Harp et al. [40] developed a process by integrating a methanol plant in a steelworks plant with a section for the capture of CO2 by power plant flue gas, a pressure swing adsorption (PSA) section for hydrogen separation from coke oven gas, and the use of the residual gas within the works gas grid, a water electrolysis section, a methanol synthesis section, and its distillation. Oxygen from water electrolysis replaced oxygen required for the blast furnace. In addition to PSA processes to recover hydrogen from COG, membranes are under development. In China, the first plant according to this scheme has been realized: with a purity above 99%, a recovery rate of up to 90% is possible [41].
An integration between the methanol and biogas plant was developed by Pedersen and Schultz [42]: the biogas plant provided carbon dioxide for a hydrogenation reaction producing methanol. Hydrogen was obtained by water electrolysis. Additionally, methane recovered by the upgrading of biogas can be used with carbon dioxide to produce methanol through steam reforming reaction. In Matzen et al. [43], carbon dioxide was obtained by fermentation of ethanol, while wind energy was used for the electrolysis of water producing hydrogen. The energy efficiency of the process is comparable with others based on syngas.
A comparison of different processes to produce methanol was developed by Gai et al. [44], where co-electrolysis of CO2 and H2O with a F-T reactor, a photocatalytic reactor for CO2 and H2O, and an electro-catalytic reactor for CO2 and H2O are analyzed. The overall NZCE (near-zero-carbon-emission) power plant using CO2–CH3OH circulation as the working medium was simulated and analyzed using Aspen Plus software. Results suggest that the energy consumption of methanol synthesis from CO2 and H2O through photo-catalysis is lower than other routes. The NZCE power plant can reduce CO2 emission of 3.8 × 10⁶ ton/year, while supplying the electricity of 5.87 × 10⁶ MWh/year.
In this research, an ANOVA analysis was developed for the reactor producing methanol by the hydrogenation of carbon dioxide. Hydrogen was obtained by water electrolysis using solar energy, while carbon dioxide was captured by fuel gas. Compared to other production methods, the water electrolysis has the advantages of wide availability, flexibility, and high product purity [31]. A similar work to those shown above is not present in literature regarding the design and economic analysis of plants that produce methanol. Reaction temperature, reaction pressure, H2/CO2 ratio, and the recycle of produced stream are the chosen factors in the factorial design. The methanol production and the reactor volume are the analyzed responses. In this way, it is possible to determine how to improve the methanol production reducing the reactor volume, as well as factors that are significant in the chosen responses. A central composite design (CCD) was also developed in order to find the optimal operating conditions of the process and a response surface plot for the methanol production, with a respective mathematical model. Modeling data for the two analyses were obtained from the simulation of the reactor in ChemCad 6.3® software. The reactor was modelled according to the kinetics of Graaf et al. [45] using Cu/ZnO/Al2O3 as catalyst. It is evident that the production of MeOH is especially attractive in emerging economies as a liquid fuel to replace conventional sources of energy. Additionally, CCU appears as a developing alternative, with an important potential to motivate carbon capture.
2. Materials and Methods
2.1. Modeling of the Catalytic Reactor
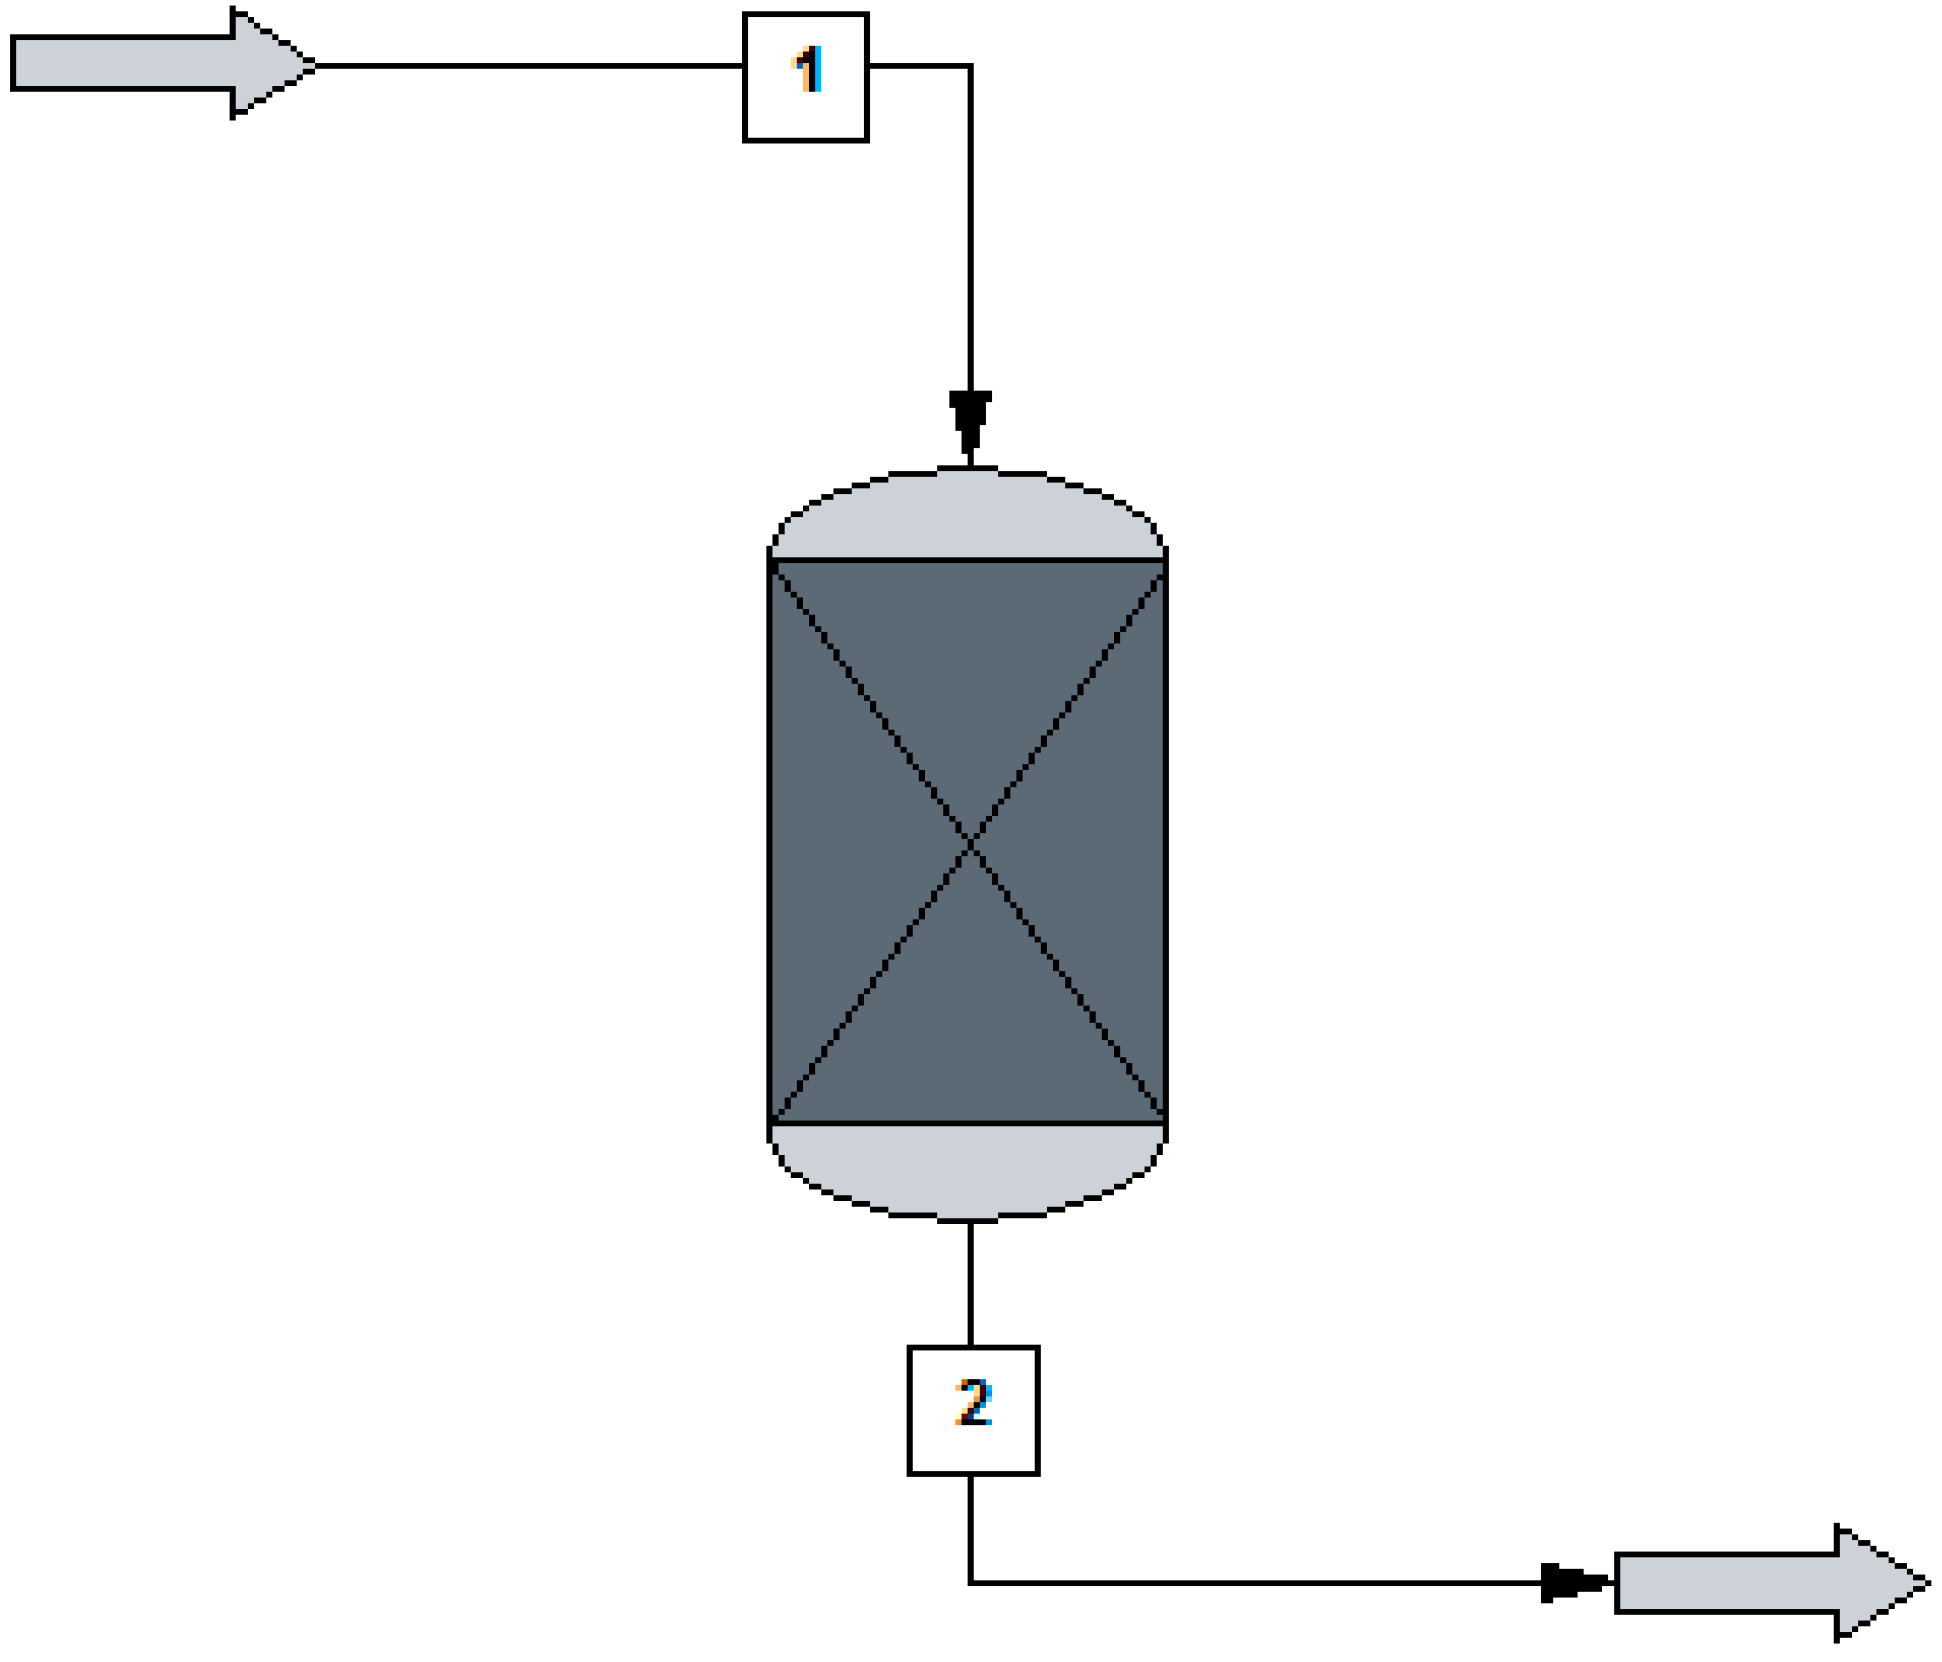
The reactor for the methanol production which is analyzed in this research was modelled in ChemCad 6.3® software using a kinetic reactor, as shown in Figure 1. It is an adiabatic ideal plug flow reactor using commercial Cu/ZnO/Al2O3 catalyst. This catalyst was studied by several authors [46,47] for the methanol production from CO2, although it is less efficient with supply of CO2 than CO/CO2 [47]. The catalyst density is equal to 1775 kgcat/m3cat, the fixed bed porosity is 0.5, the pellet diameter is 0.000055 m, and the pellet height is 0.00003 m [12]. Copper acts as the main active component, ZnO acts as a supporter, and Al2O3 acts as a promoter.
Methanol is obtained from the hydrogenation of CO2 according to the following reactions (see Equations (1)–(3)):
According the kinetics of Graaf et al. [45], reaction rates are expressed, respectively, by the following expressions (see Equations (4)–(6)) in kmol/kgcat × s:
where partial pressures pi are in bars and exponential factors k1, k2, k3 have the following expression (see Equation (7)):
where Ea is the activation energy in J/mol, R is the constant of universal gas equal to 8.314 J/mol K, T is the temperature in Kelvin and A is a pre-exponential factor. Table 1 shows the values of activation energies and pre-exponential factors in the three relations.
The expression for thermodynamic equilibrium constant is as follows (see Equation (8)) [45]:
where A and B are parameters and T is temperature in Kelvin.
In addition, for three reaction rates, these expressions are considered (see Equations (9)–(11)) [45]:
where T is the temperature in Kelvin and R is the universal gas constant.
The kinetics of Graaf et al. [45] was explained by a dual-site Langmuir–Hinshelwood mechanism based on hydrogen adsorption and on three reactions: methanol formation from CO, methanol formation from CO2, and water gas-shift reaction. Depending on which elementary reaction step is rate-controlling in each of these three reactions, 48 different kinetic models are possible. Based on χ2 statistic and consistency tests, the above-described model was obtained. In addition, the developed experiments supported the assumption of dissociative hydrogen adsorption. The above kinetic reaction provides a significantly better agreement with experimental results than kinetic models taken from recent literature. Graaf et al. [45] developed the model considering a spinning basket reactor at 15–50 bar and 483–518 K, and experimental evidence showed that methanol can be formed simultaneously from both CO and CO2.
Carbon dioxide conversion in the reaction was set equal to 30% [48]. Temperature, pressure, and gas composition were set according to factorial design, as explained below. Generally, reaction pressure and temperature in methanol synthesis are between 50–100 bar and 473–573 K, respectively [49]. However, an inlet flowrate equal to 400 t/h was considered. Carbon dioxide was captured by fuel gas in a power plant with amine chemical absorption, while hydrogen was produced by the electrolysis of water using alkaline electrolysis. The alkaline (KOH) electrolysis is the best available technology, as it is quite mature up to large-scale H2 production [50]. Additionally, the electrolysis method can produce pure hydrogen. Using solar energy, it is the best option for a suitable and non-fossil fuel-oriented hydrogen production. On the other hand, the chemical absorption technique with amine scrubbing is the most mature technology with the highest technology readiness level and has already been tested and implemented in large-scale applications [36]. The production of by-product was not considered in this model, and CO2, CO, H2, and H2O were considered in the inlet gas composition.
For the simulation of the reactor, it is necessary to set an enthalpy model to determine energy balances and a global K model to calculate activity coefficients involved in equilibrium phases. Soave–Redlich–Kwong (SRK) Equation of State (EOS) was chosen since it is widely used in gas processing simulation due to its accuracy and simplicity [12,51]. Additionally, this equation is able to represent both liquid and vapor phases in conditions far from ideality, which is the case of this high-pressure process. The simulations were carried out in steady-state conditions.
2.2. ANOVA Modeling
For the methanol reactor, the estimation of main and interaction effects was developed by ANOVA analysis (analysis of variance); it was determined if effects and interactions among the investigated factors were significant with respect to experimental error (σε). Main factors were evaluated by Yates’s algorithm through Excel 2016 software. Statistical significance was checked by F-value (Fischer variation ratio) and p-value (significant probability value). Model terms were selected or rejected based on probability value within 95% of confidence interval (or 5% significance level). In this research, σε was evaluated by means of the mean square (MS) of interactions that were not significant. A 24 full factorial design with 16 simulations test was performed for this research [52]. A mathematical model could be obtained with significant factors and the quality of the model was assessed by coefficient of determination R2. R2 represents a pure correlation between measured and predicted values, and it is indicative of response variation explained by model. Then, in this statistic method all factor levels (process parameters) are fully changed so that it is possible to measure any variation in response. One of the most important advantages of this method is the limited number of experiments necessary to identify the best solution.
Reaction temperature (K), reaction pressure (bar), H2/CO2 ratio, and the recycle of produced stream were considered as factors in this research. The methanol production (kg/h) and the reactor volume (m3) were considered as responses, for which a mathematical model was developed.
2.3. Response Surface Methodology
Response surface methodology (RSM) combined with central composite design is an efficient technique for experimentally exploring relationships between investigated factors and system response [53]. The aim of RSM is to find the optimal operating conditions of the process or to determine a region which satisfies the operating specifications, maintaining a reduced number of experiments [54]. For these reasons, RMS is used in process design and optimization. The design procedure for RSM is as follows [53]: to design a series of experiments for sufficient and reliable measurement of the desirable response; to develop a mathematical model with a second-order response surface and maximum fitting; to determine the most desirable set of experimental parameters that produce a maximum or minimum value of the response; to express the direct and interactive effects of process parameters as two- and three-dimensional plots.
CCD requires three types of tests: 2k factorial tests, 2k axial tests, and nc center point tests, where k is the number of factors studied in the experiment [52]. In order to be ratable, the design is represented by five levels −α, −1, 0, 1, α, with α equal to (2k)0.25 [55]. This property ensures a constant variance at points that are equidistant from the central point, and therefore provides the equal precision of response estimation in any direction of the design.
The experimental data were used to develop a second-order polynomial model as in the following correlation (see Equation (12)) [56]:
where βo is intercept, βi, βij, βii are first-order, interactive, and second-order effects, respectively, i and j represent the number of k factors, while ε is residual error. This method is then able to evaluate interaction effects, pure quadratic effects, or third- and fourth-order effects and so on; it is the most efficient evaluation method, and it improves the quality of data.
To determine the significance of each term in the equation and to estimate the goodness or fitting quality, the polynomial equation was validated by analysis of variance (ANOVA). A response surface plot was constructed by using the fitted model.
A CCD design with four factors at five levels with 26 simulations test was developed in this research in order to find a response surface for the methanol production. In particular, 16 cubical, 2 center, and 8 axial points were tested in the CCD design. Values at the center point are used to detect curvature in the response, and they contribute to estimation of coefficients for quadratic terms. Axial points (located at distance α from central point) are also used to estimate the coefficients of quadratic terms, while factorial points (located at the corners of cube with a side length equal to 2) are used mainly in order to estimate the coefficients of linear terms and two-way interactions.
The analyzed factors were the same as those of the ANOVA analysis: reaction temperature (K), reaction pressure (bar), H2/CO2 ratio, the recycle of produced stream. JMP 13 software was used for this analysis.
3. Results and Discussion
3.1. Results of ANOVA Analysis
ANOVA has not been used yet to study methanol reactors in literature. Table 3 shows factors (reaction temperature, reaction pressure, H2/CO2 ratio, the recycle of produced stream) and the values of their levels selected for the system, producing methanol by the hydrogenation of carbon dioxide. Levels taken in consideration for each factor identify different factorial plans.
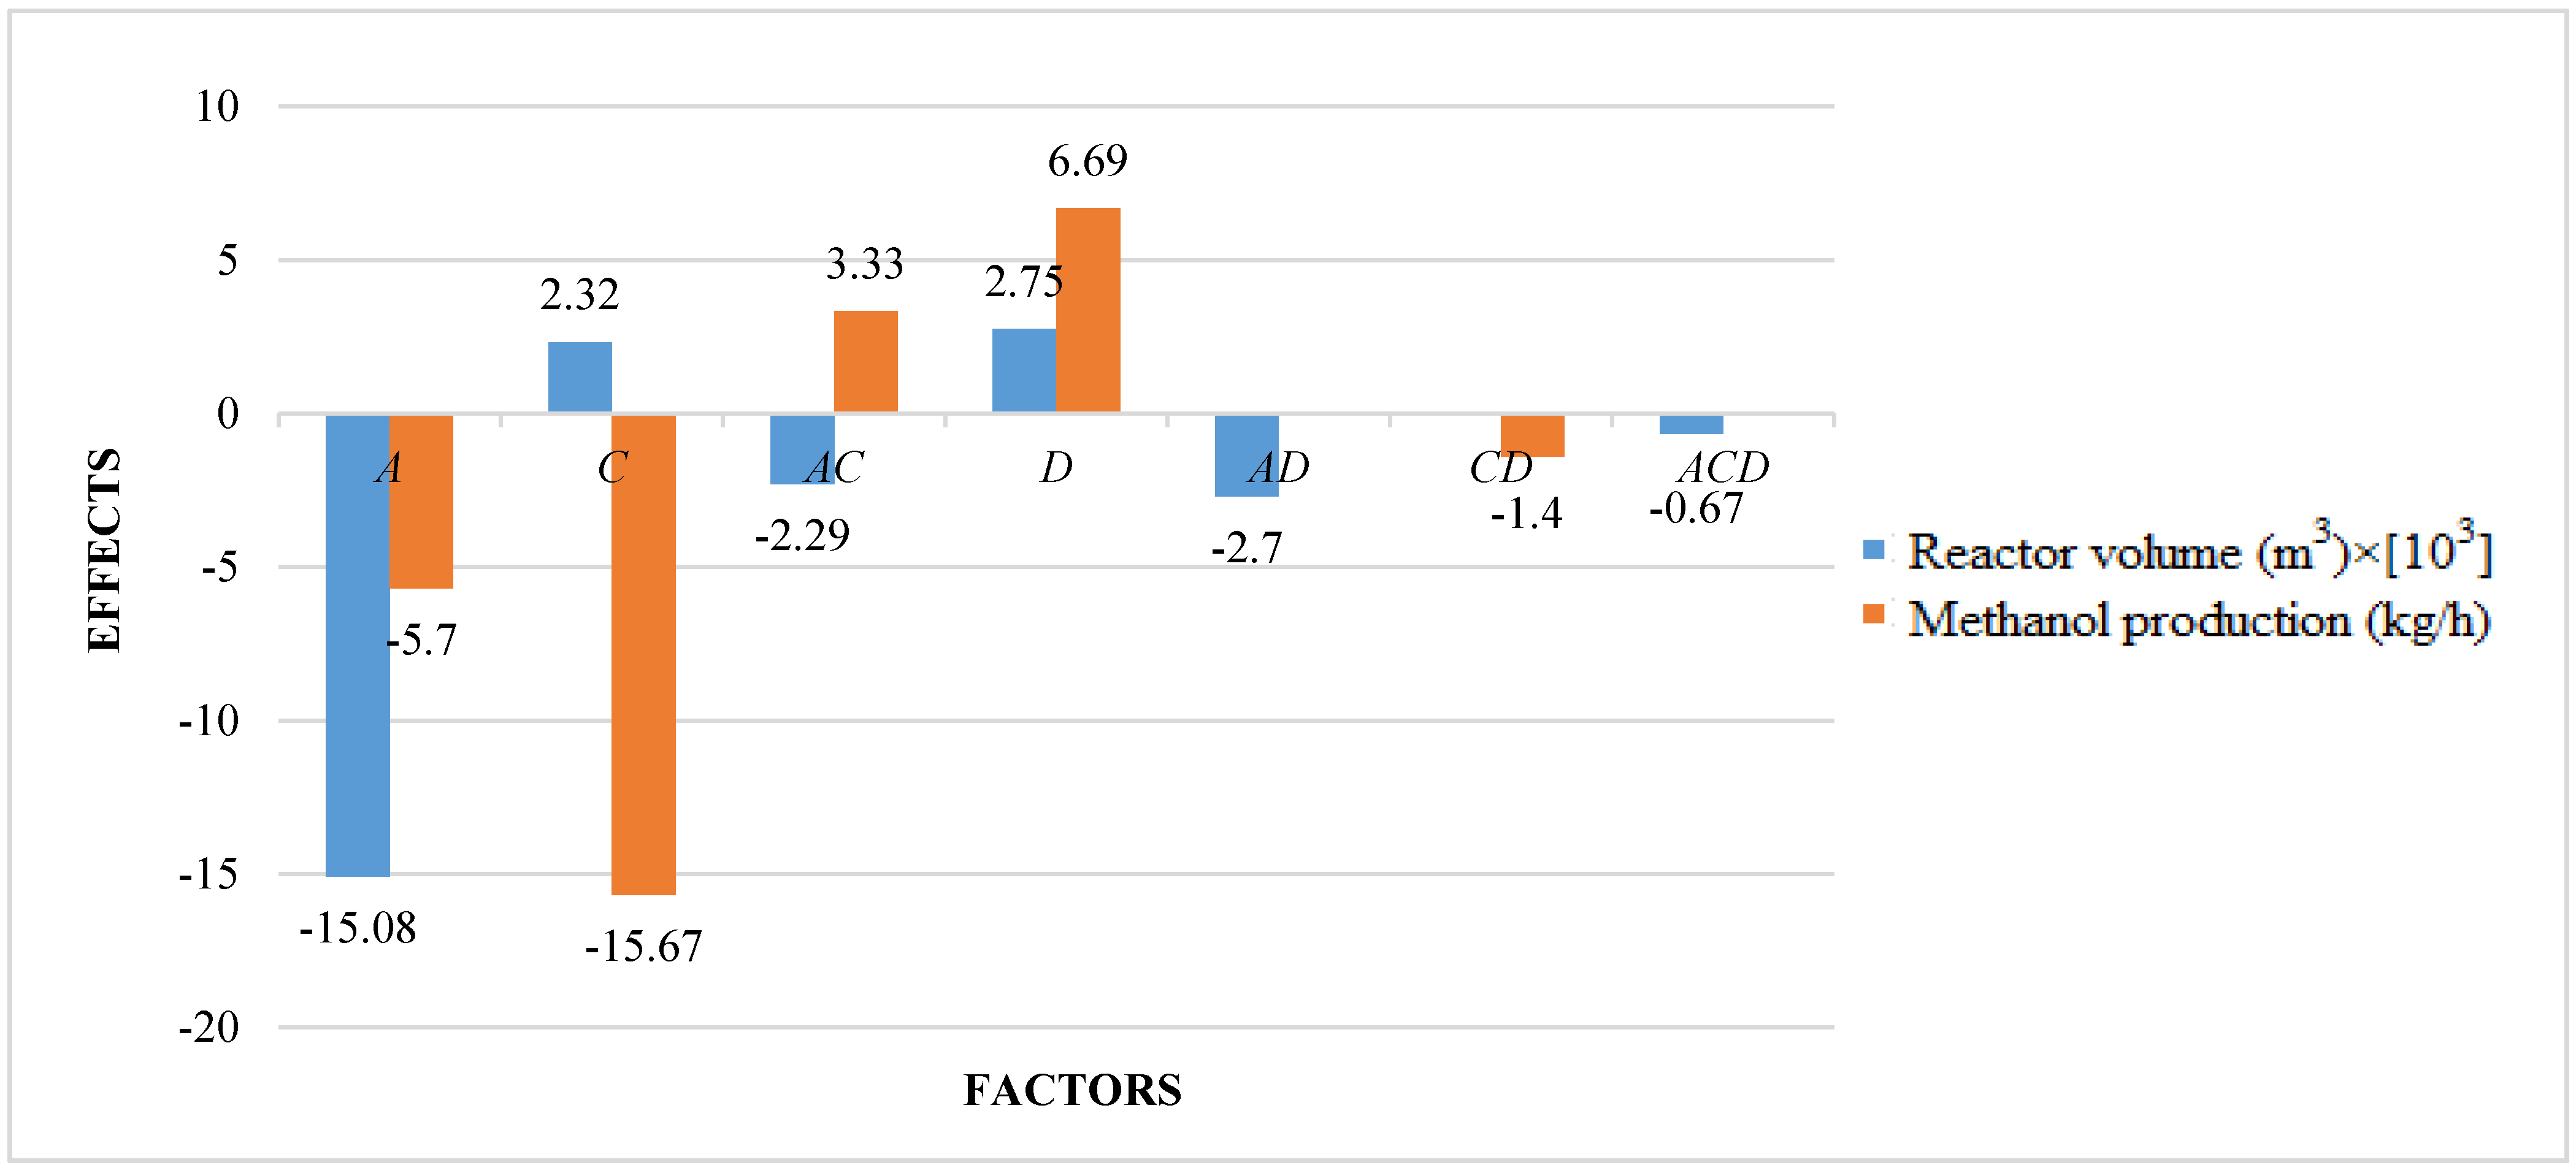
The studied responses were the methanol production and the reactor volume. The first response provides information about the productivity of the process, while the second response provides information about reactor and catalyst costs. A higher volume determines a higher catalyst mass and thus higher catalyst costs, in addition to higher reactor costs. It is preferable to have a higher productivity with lower costs. Figure 2 shows the results of ANOVA analysis: only significant factors and the values of their effects for the studied responses are reported. An effect can be considered as the variation of the analyzed response after the variation of the considered factor. In a positive effect, the increase of a factor produces an increase of response; in a negative effect, the increase of a factor produces a decrease of response. Meanwhile, in an interaction, the variation of two or three factors produces the variation (with a positive or negative effect) of response.
Table 4 shows the statistical results of ANOVA analysis for methanol production obtained in all tests.
Results show that reaction temperature has a negative effect on the methanol production: the increase of temperature leads to a decrease of the production. Since hydrogenation reactions of CO and CO2 are exothermic, their rates increase with temperature, but only up to a certain temperature. At higher temperatures, rates begin to decrease because the thermodynamic equilibrium constant decreases as temperature increases [57]. Xin et al. [58] found that methanol yield and carbon dioxide conversion decrease with temperature. Yang et al. [59] proposed that low-temperature methanol production enables high conversions of up to 50–80% and the reduction of production costs without any thermodynamic equilibrium. Extreme temperature limits the efficiency of methanol production due to thermodynamic limitations. Shen et al. [60] found that both temperature and pressure have a considerable effect on equilibrium yields. The equilibrium conversion of CO2 to methanol increases distinctively with increasing pressure and decreases strongly as temperature increases.
H2/CO2 ratio has the highest effect on the methanol production: it has a negative effect, but in interaction with factor A, in second-order interaction AC, the effect is positive. Then, a simultaneous variation of factors A and C determines the increase of methanol production.
Generally, the methanol production increases with the increasing of carbon dioxide mole fraction in the feed, and then with the decreasing of H2/CO2 ratio. Al-Dwani [61] showed that methanol production rate increases with the increasing of mole percent in the feed up to the optimum value of carbon dioxide mole percent in the feed of 4.7, at which point methanol production rate reaches a maximum value and after which methanol production rate starts to decrease with the increasing of carbon dioxide mole percent in the feed. This behavior can be attributed to fact that the hydrogenation of one mole of CO to methanol needs two moles of H2, compared to CO2 which needs three moles of H2 to form methanol. Therefore, under lean hydrogen conditions, hydrogenation of CO activity is increased. However, as CO2 content in the feed increases, overall rate decreases since the hydrogenation of CO is inhibited by increased amounts of CO2 in the feed. Then both CO and CO2 conversions in the methanol reactor decrease with the increase of CO2 fraction. Generally, the optimal H2/CO2 ratio is about 3 [62].
The same consideration is for the recycle of produced stream, factor D: it has a positive effect on the methanol production (by increasing recycling, the methanol production increases), but the effect is negative in interaction with factor C. In fact, methanol reaction is limited by chemical equilibrium, and the recycling flow can prevent related problems—particularly at high temperature, increasing the methanol production [63]. Obviously, recycling the stream increases the amount of total feed, and consequently CO and CO2 conversion is decreased due to decreased residence time. However, since productivity is defined as the product of feed flow rate and conversion, net productivity is improved. A mathematical model can be obtained by ANOVA analysis for the methanol production, as in the following relation, as a function of significant factors and interactions (see Equation (13)):
where Y is the methanol production in kg/h, X1 is reaction temperature in Kelvin, X3 is H2/CO2 ratio, and X4 is the recycle of produced stream. A value of R2 equal to 0.99 is close to unity, which indicates that the predictive model is precise enough to explain a relation between process parameters and the methanol production.
Analyzing the obtained results for the reactor volume, reaction temperature has a negative effect: with a higher temperature, there is a lower methanol production and a lower reactor volume. In fact, with a lower methanol production and thus with a lower outlet flow rate, the reactor volume is lower, being calculated with an integration of molar flow rate at the inlet and at the outlet of the reactor [64]. H2/CO2 ratio has a positive effect on the reactor volume. In fact, with a higher ratio, a higher hydrogen is available for reactions thatevolving require a higher catalyst mass, which increases the reactor volume. However, interaction AC has a negative effect on the reactor volume: the positive effect of factor C is avoided in interaction with factor A. Recycling has a positive effect on the reactor volume, because a higher flow rate is present in the feed and then at the outlet of the reactor. Instead, the second-order interaction AD has a negative effect. The third order interaction ACD is also significant with a negative effect, but its effect is lower compared to other significant effects for the analyzed response. For the reactor volume, a mathematical model can be obtained with significant factors, as in the following relation (see Equation (14)):
where y is the reactor volume in m3, X1 is reaction temperature in Kelvin, X3 is H2/CO2 ratio, and X4 is the recycle of produced stream. A value of R2 equal to 0.99 ensures a good agreement between simulation and modeling data. Table 5 shows the results obtained by ANOVA analysis for the reactor volume.
Comparing the results of two factorial designs, it is evident that only interaction AC allows the methanol production to be increased and the reactor volume and thus the catalyst mass to be decreased. A higher production is ensured with lower costs. In fact, upon increasing reaction temperature, both methanol production and reactor volume decrease. Increasing H2/CO2 ratio, the methanol production decreases but the reactor volume increases. Increasing recycling, the two analyzed responses increase. These solutions, then, are not suitable to improve the production of the system with lower costs. Only interaction AC ensures that the aim of this study is satisfied. Varying reaction temperature and H2/CO2 ratio, the methanol production increases, while the reactor volume decreases. This consideration can be observed in Figure 3a, where a surface plot of the methanol production in kg/h is obtained as a function of temperature and H2/CO2 ratio with a recycling equal to 30%. The plot is obtained considering the mathematical model of Equation (14). According to previous results and considering one factor at a time, the plot decreases when increasing reaction temperature, while it increases with increasing H2/CO2 ratio. The presence of an interaction between factors A and C is evident, where interaction AC has a positive effect. In fact, the plot does not have a linear pattern, underling the second-order nature of the interaction. It is possible to notice that only H2/CO2 ratios that are higher than 1.6 can be accepted in the process, because for lower ratios a negative methanol production is obtained by the mathematical model. In this way, it is possible to find the possible operating conditions of the reactor. Optimal operating conditions can be obtained at higher temperature and H2/CO2 ratio. Higher values of methanol production that can be obtained are in the range of 1,000,000–1,500,000 kg/h.
3.2. Analysis of Factors and Interactions in ANOVA Analysis
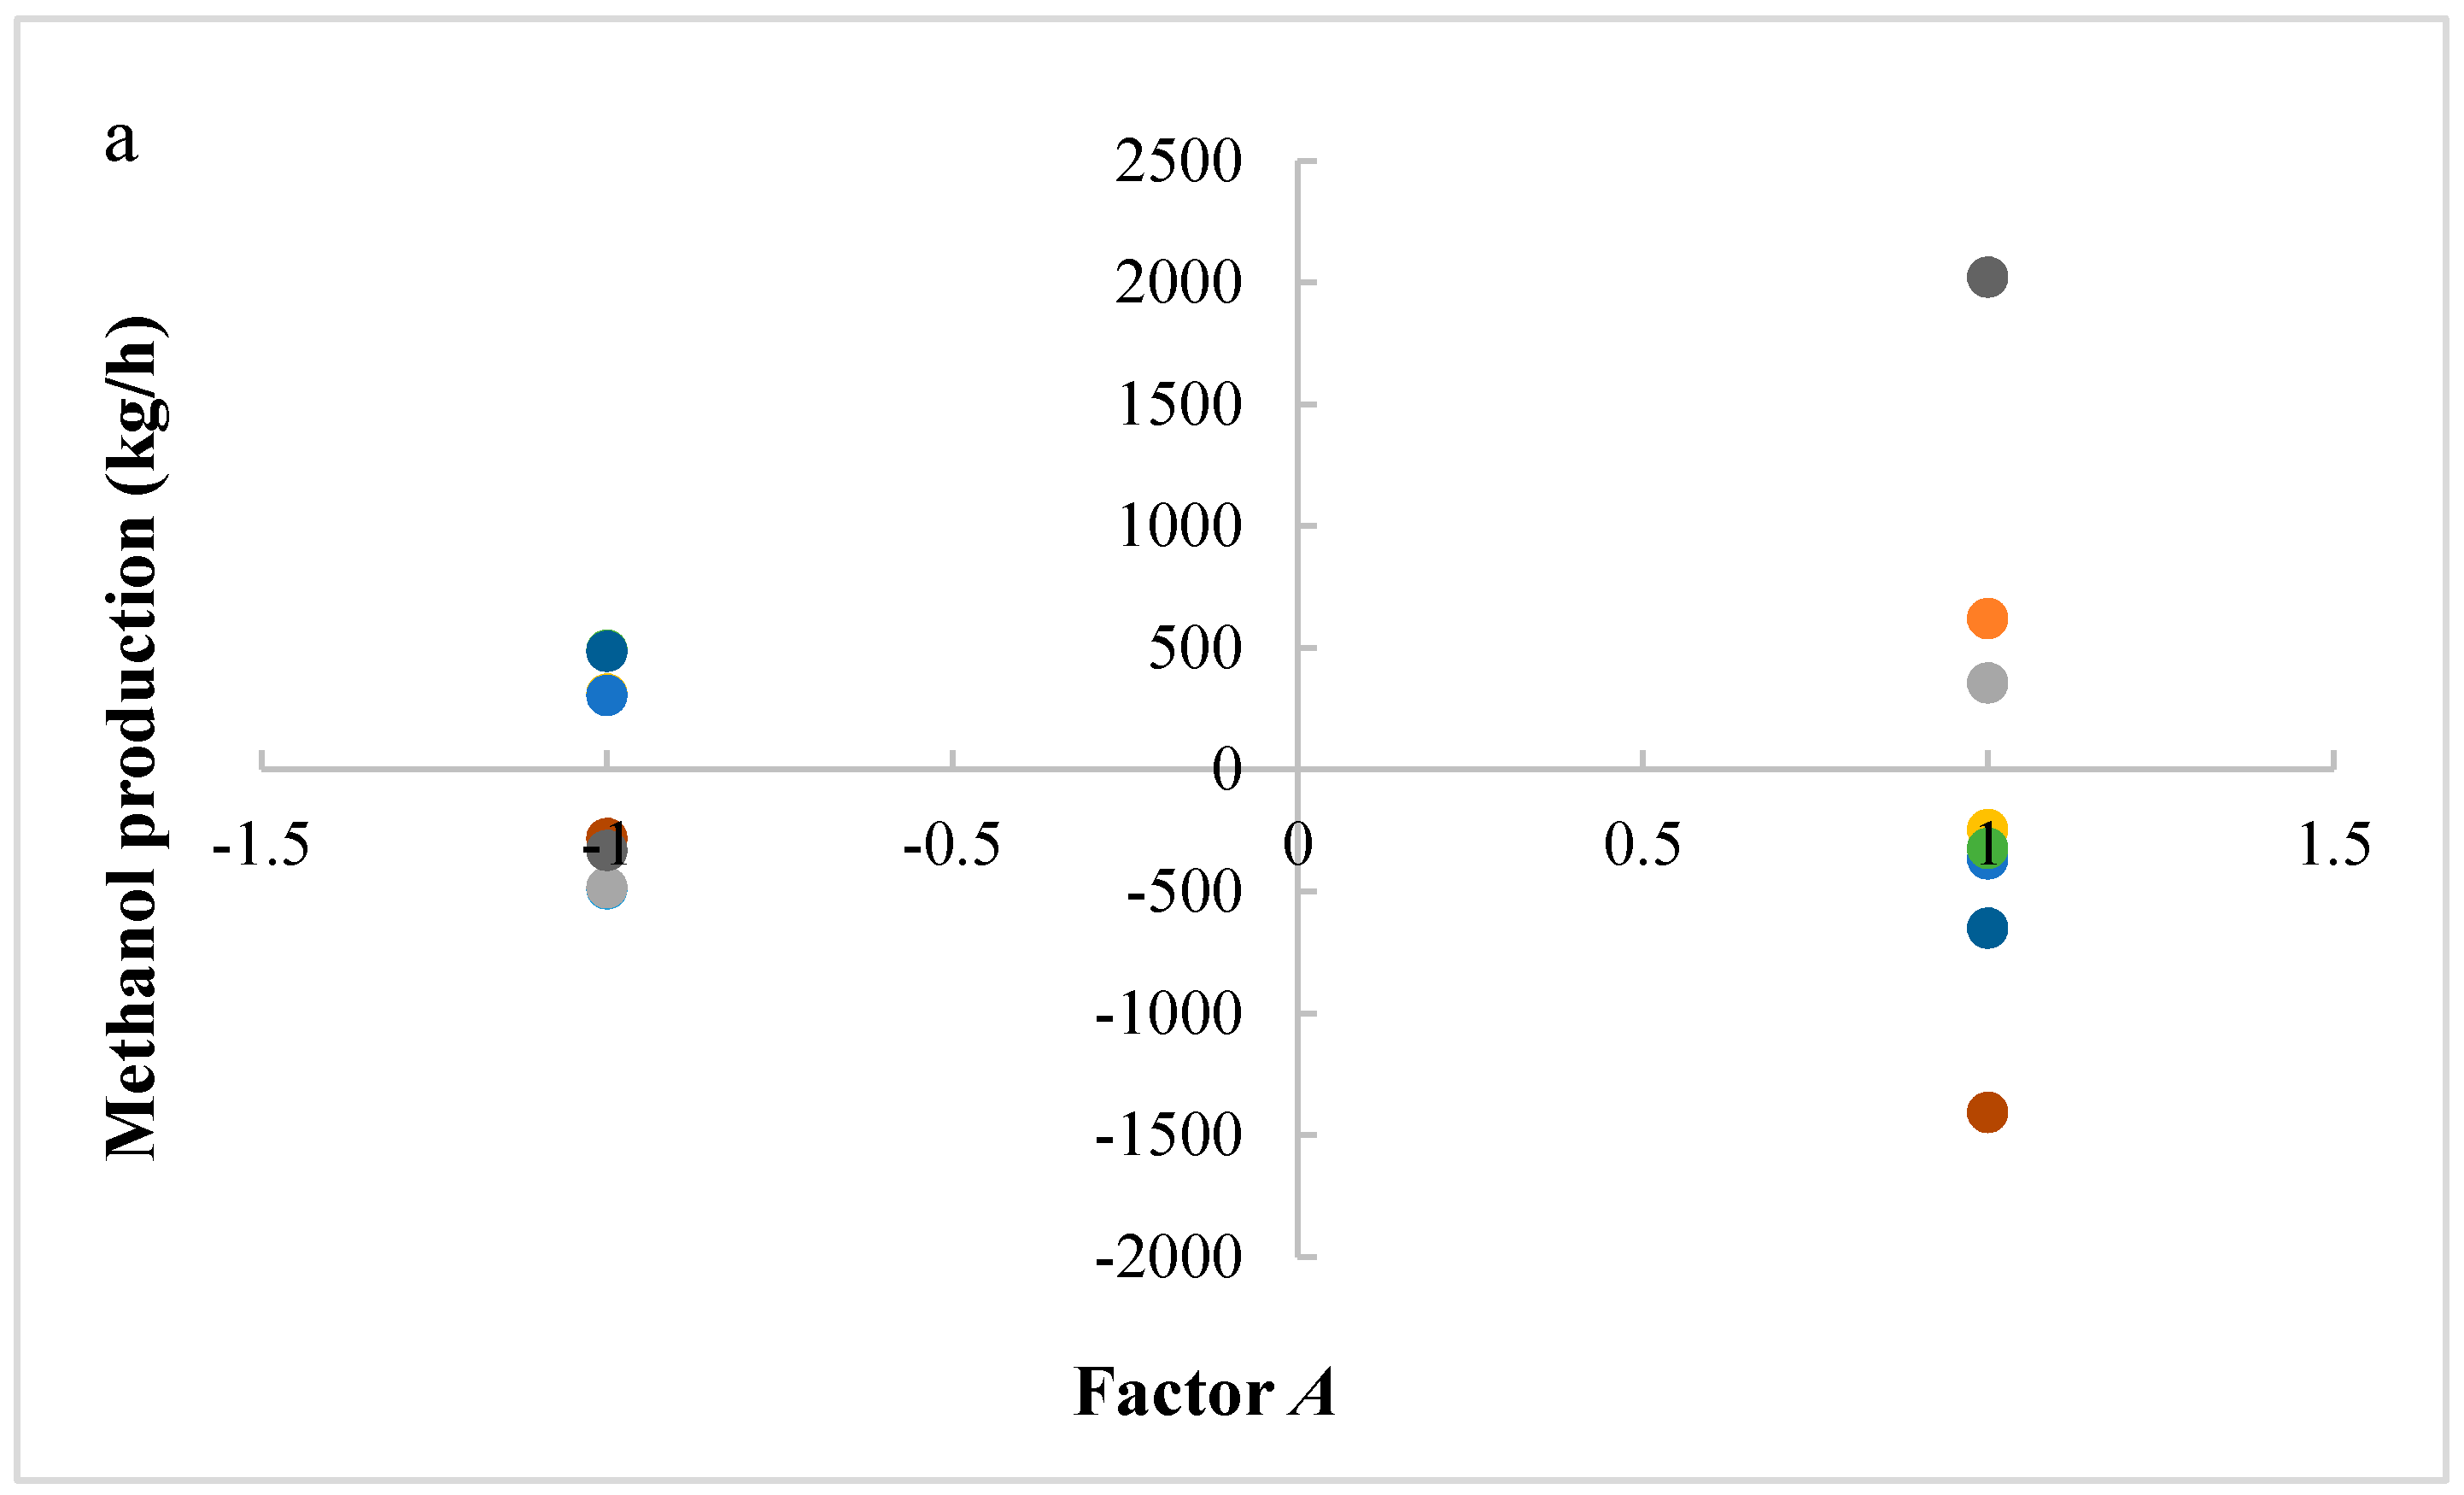
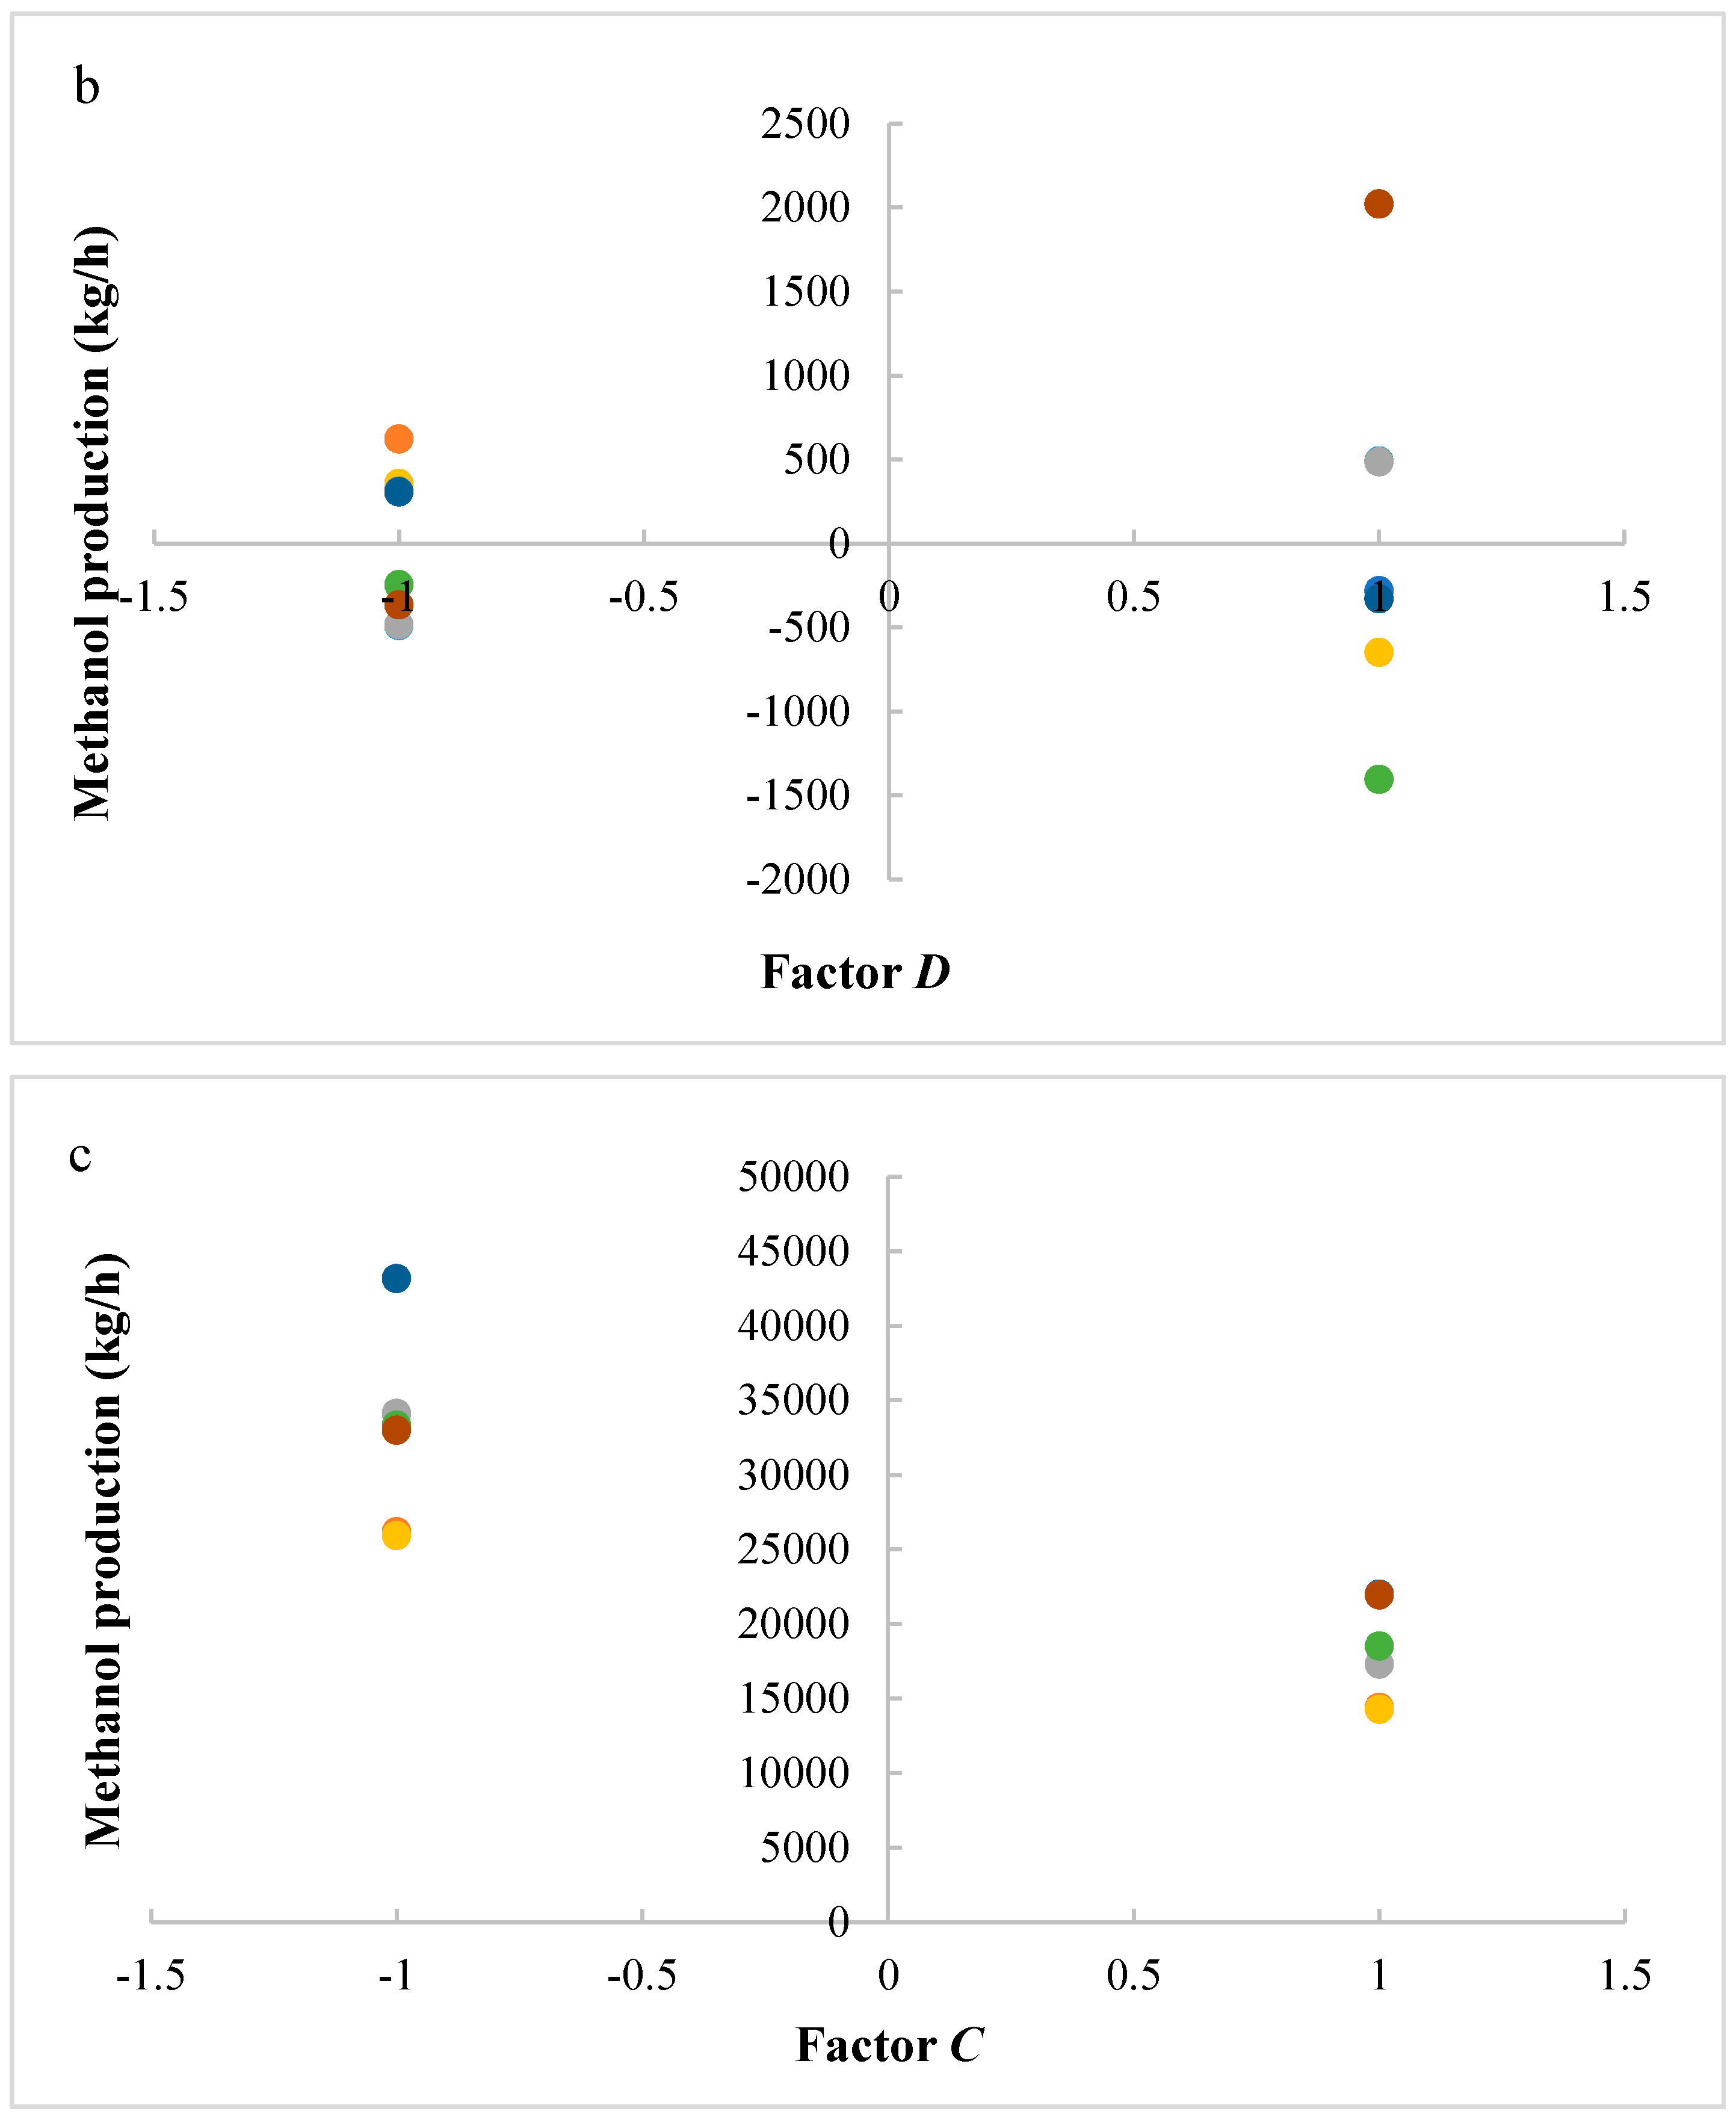
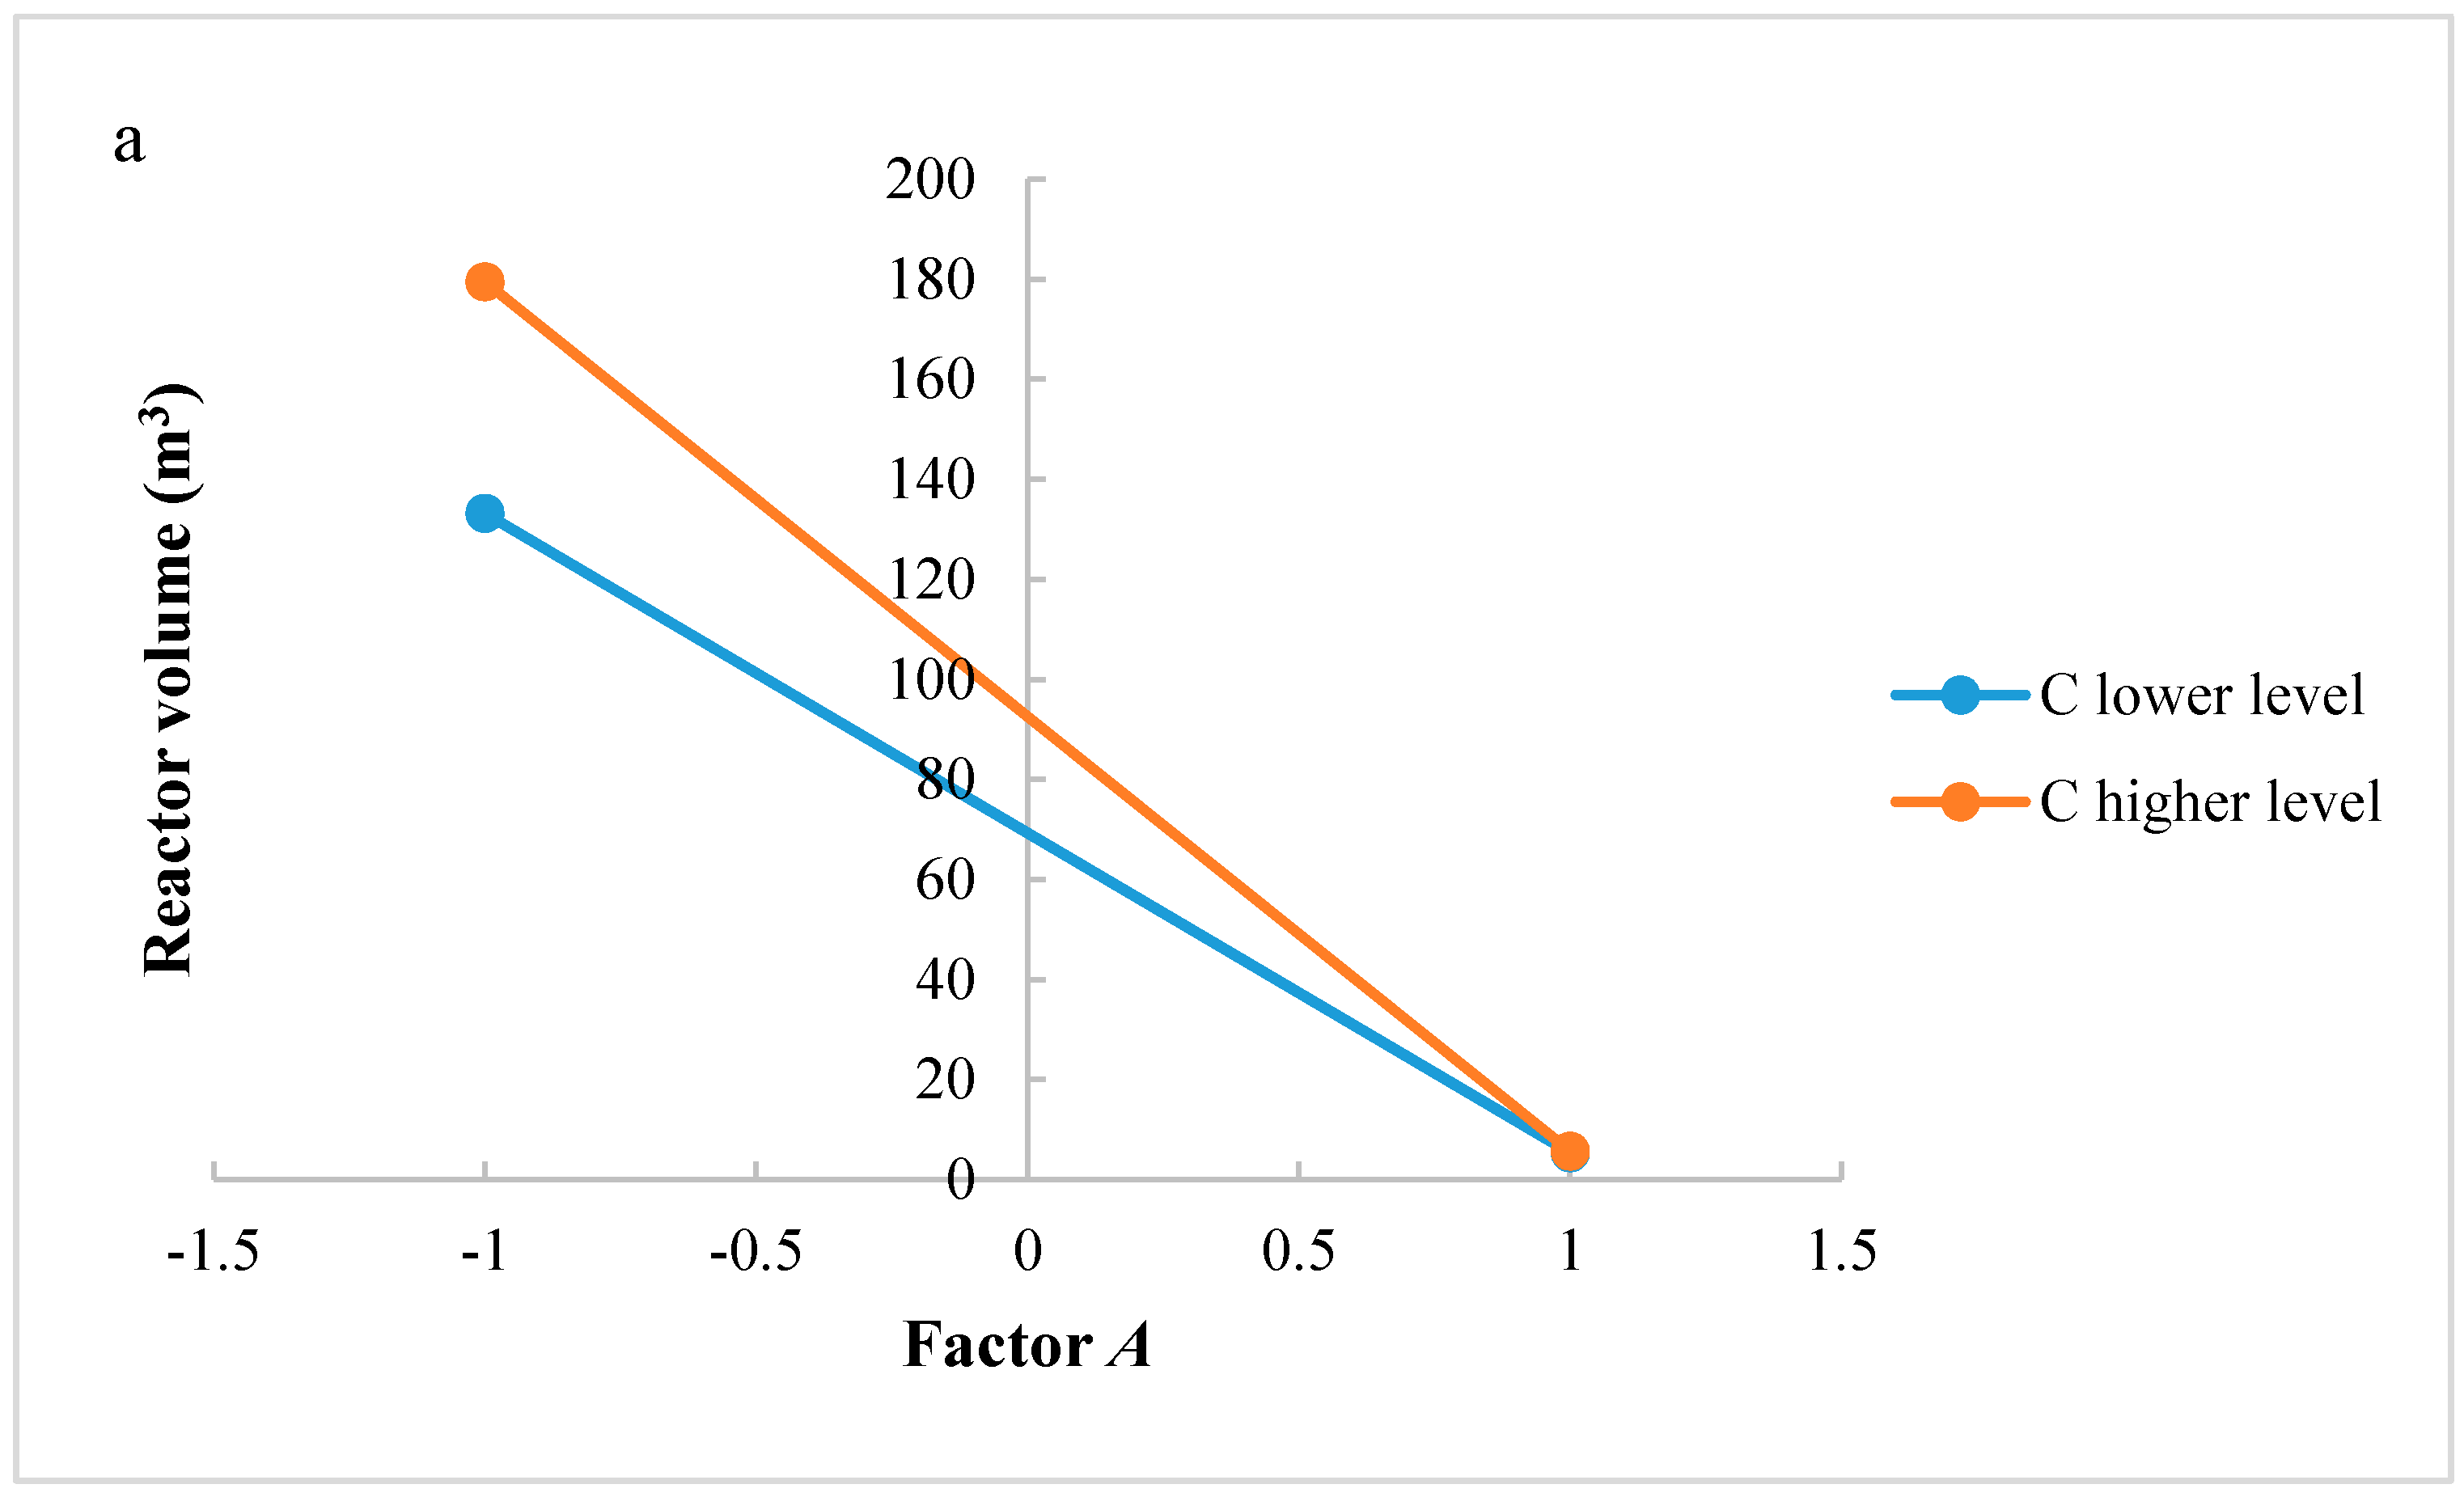
Significant factors and interactions were found with ANOVA analysis for both methanol production and reactor volume. An accurate analysis could be also developed to support the significance of interaction factors. Figure 4a,b shows interactions AC and CD, respectively, for the methanol production. If reaction temperature is at a higher level, H2/CO2 ratio at lower level produces a higher methanol flow rate at the outlet of the reactor; if reaction temperature is at a lower level, H2/CO2 ratio at a higher level produces a lower methanol flow rate at the outlet of the reactor. Interaction AC is positive: the negative effect of temperature decreases at the lowest level of H2/CO2 ratio. The same consideration can be carried out for the CD interaction: at higher level of factor D, the methanol production decreases when increasing factor C, while at lower level of factor D a higher productivity is ensured with factor C at a lower level. Interaction CD is negative: this means that the positive effect of recycling decreases at the highest level of H2/CO2 ratio.
Figure 5a–c shows residues (difference between an observation and its estimated value from mathematical model) versus the levels of factors A, C, and D, respectively, in order to study the variability of the process. A lower variability in methanol production is present with factors A and D at lower levels and factor C at a higher level. These operative conditions are then preferable, because they ensure a higher process stability.
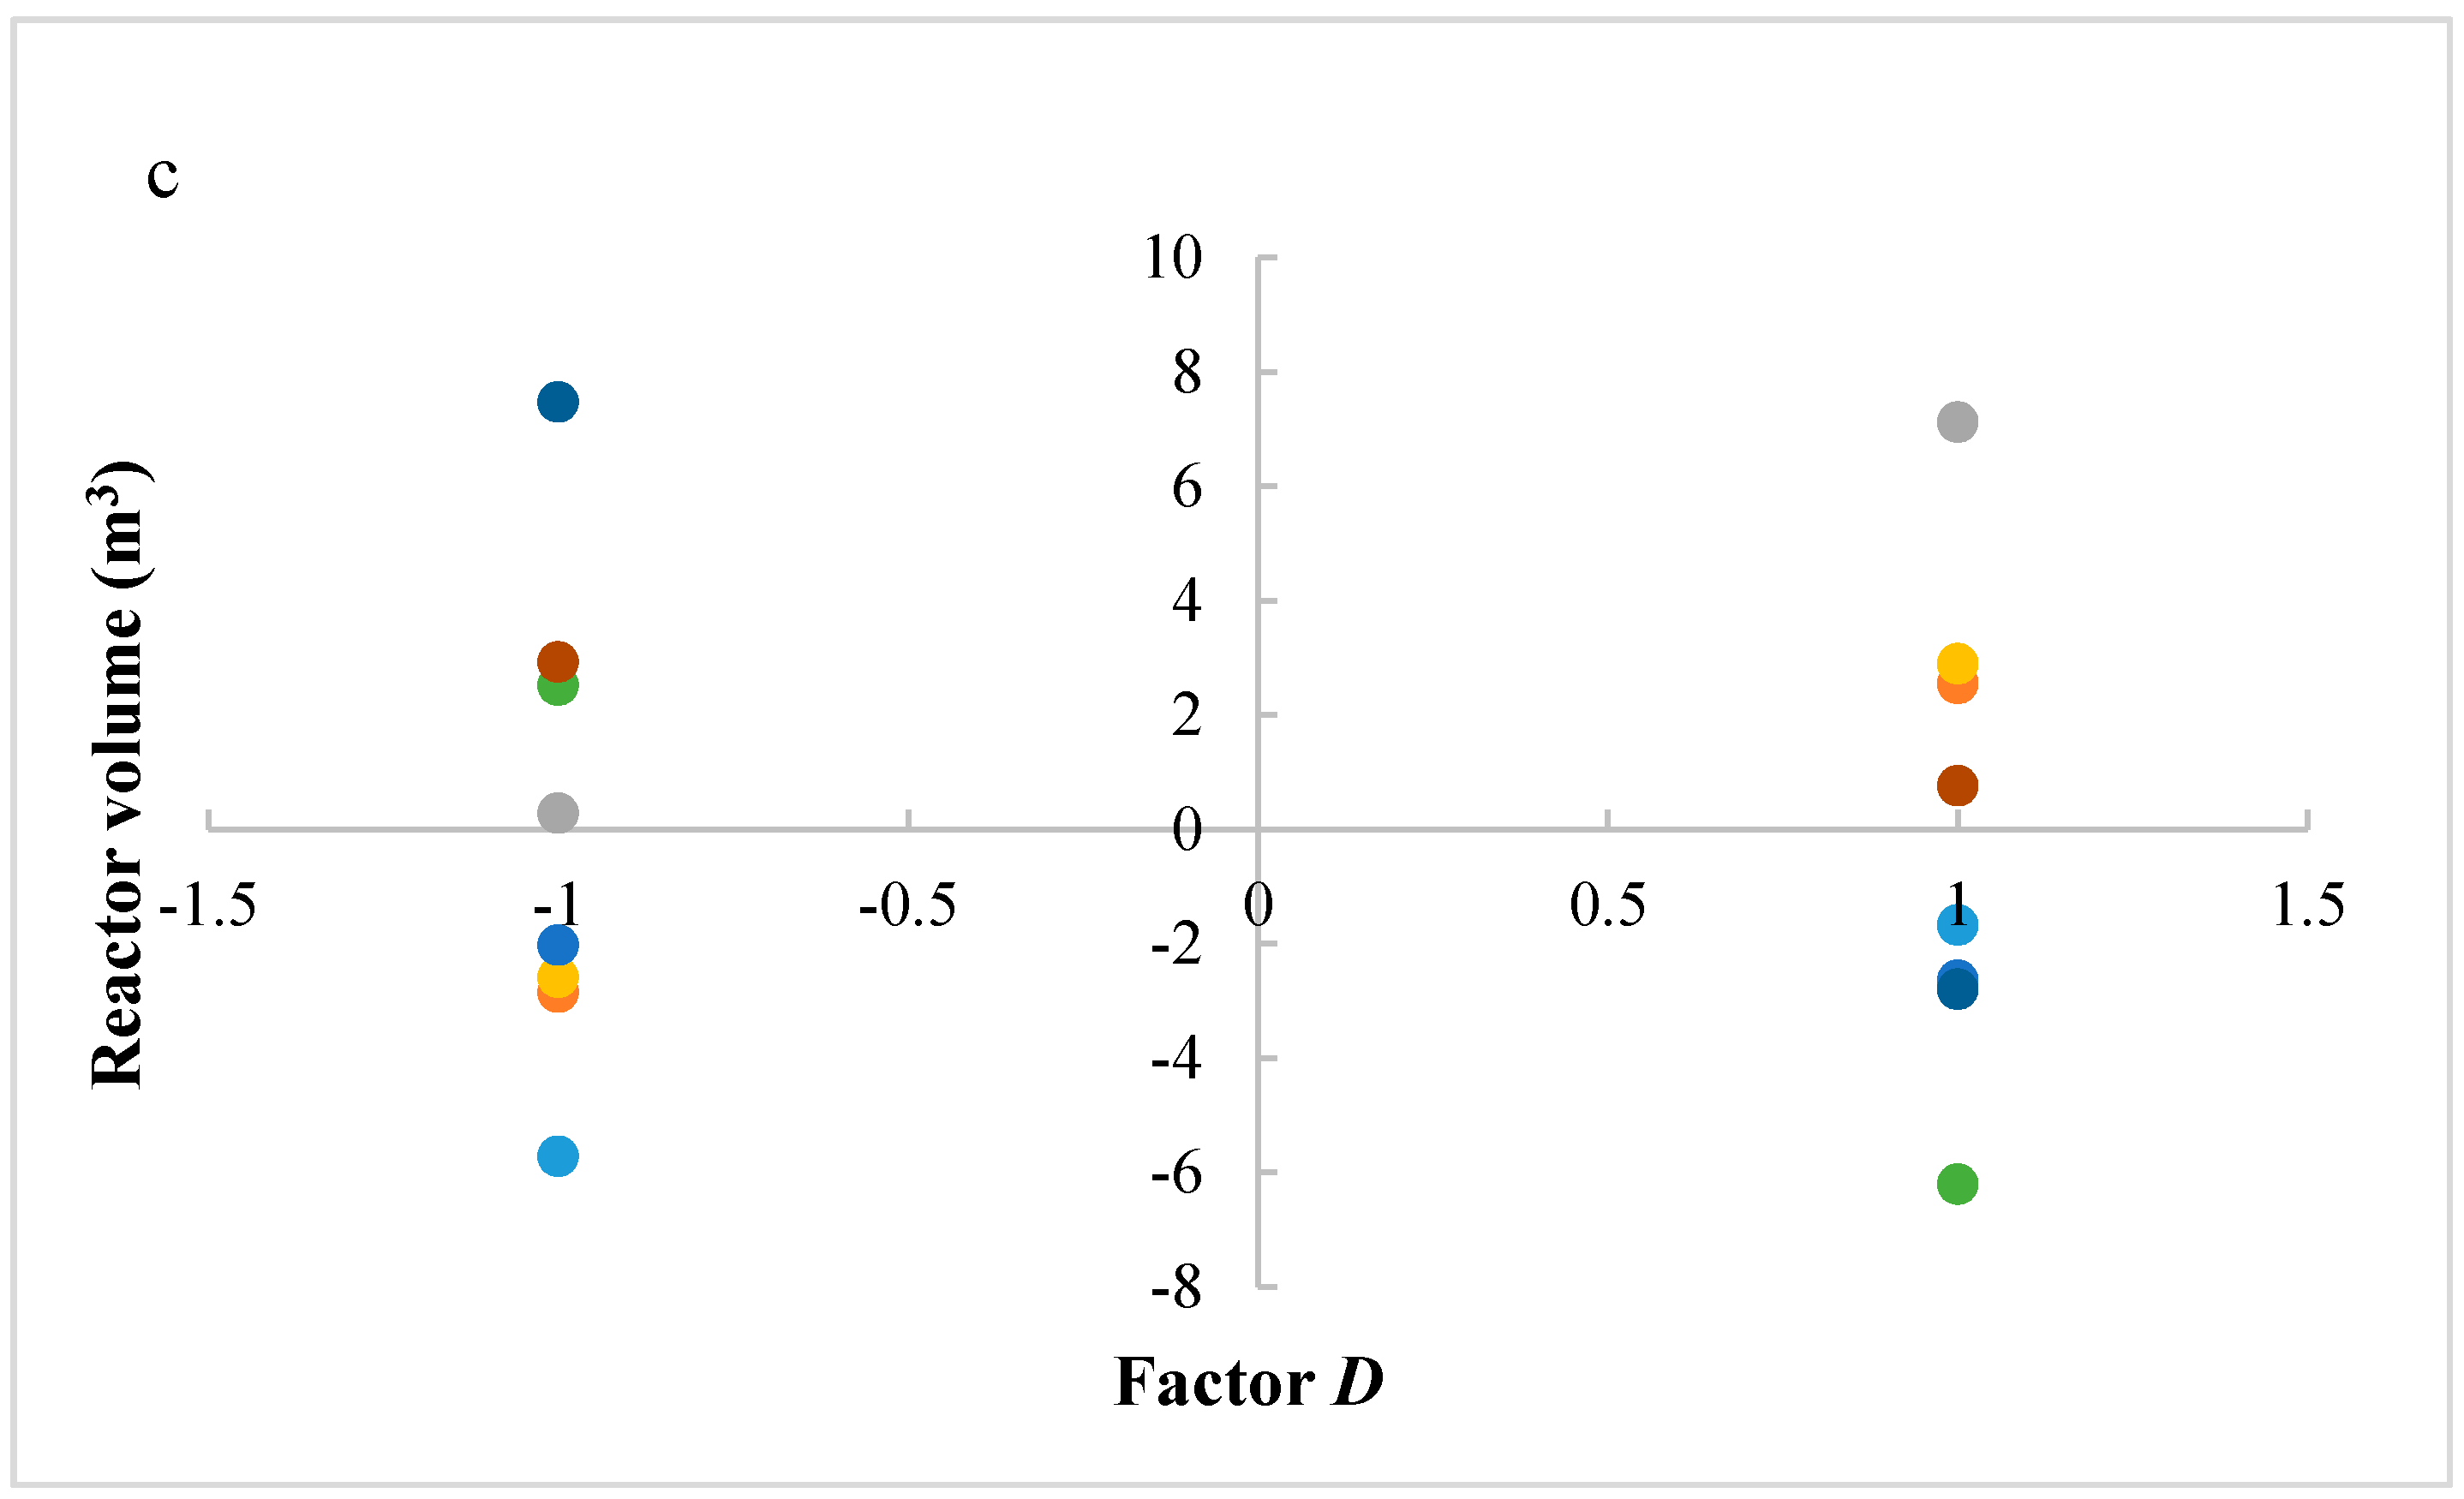
The same considerations regarding the study of significant interactions could be carried out for the reactor volume. Figure 6a,b shows interactions AC and AD, respectively. In interaction AC, for factor A at higher level, an increase of H2/CO2 ratio does not improve the reactor volume. However, when factor A is at a lower level, H2/CO2 ratio increases the reactor volume. Interaction AC has a negative effect on the reactor volume: the positive effect of factor A decreases at the lowest level of factor C. In interaction AD, when factor A is at the higher level, an increase of factor D does not increase the reactor volume; in contrast, at lower level of factor A, a higher level of factor D determines a higher reactor volume. Interaction AD has a negative effect on the reactor volume: the positive effect of factor A decreases at the lowest level of factor D.
A common interaction for the two analyzed responses is AC. Results show that in order to have an increase of the methanol production without increasing the reactor volume, the better solution is to work with factor A at a higher level and H2/CO2 ratio at a lower level. In fact, even if the increase of methanol production is not the maximum available, the reactor volume is lower. At a higher level of factor A, a variation of factor C does not significantly affect the reactor volume: it is possible to choose a level that maximizes the production and minimizes the reactor volume. This allows lower catalyst and reactor costs to be obtained.
Figure 7a–c shows residues versus the level of factors A, C, and D, respectively. Results show that a lower variability of the reactor volume is present with factor A at a higher level. In other cases, significant differences are not present. It is evident that a key interaction for the process is interaction AC: a higher productivity is ensured with a lower catalyst mass and reactor volume. In particular, it is preferable to work with factor A at a higher level and factor C at a lower level.
3.3. Results of Response Surface Methodology
RSM is an effective statistical tool that helps in analysis considering interactions between different parameters, and reduces time, cost, and process variability percentage, thus providing an optimal global solution. Table 6 shows the chosen factors and their levels set in a composite central design, used to find the response surface plot for the methanol production. Factors are the same used in previous ANOVA analysis: reaction temperature in Kelvin, reaction pressure in bar, H2/CO2 ratio in the feed of reactor, the recycle of produced stream. The methanol production is the analyzed response. The aim of the response surface methodology in this research was to find the optimal operating conditions of the process, in a better way compared to previous ANOVA analysis. After a primary general study, a better comprehension of the process was then obtained.
Table 7 shows the result of ANOVA analysis for CCD study, carried out with JMP software. Parameters showing p values lesser than 0.05 were considered to be significant and were involved in the development of the regression equation. A p-value less than 0.05 indicates a good model term, whereas a value greater than 0.05 indicates a poor model term, which can be ignored.
With significant factors and interactions, a mathematical model for the methanol production was found according to following polynomial quadratic equation (see Equation (15)):
where Meth is the methanol flow rate in kg/h, X1 is reaction temperature in Kelvin, X3 is H2/CO2 ratio, X4 is the recycle of produced stream. A regression coefficient, R2, equal to 0.99 indicates a high degree of correlation between simulation and predicted data. This ensures the use of the model as a promising representative of the simulator for further analysis.
Figure 8 shows a normal diagram, in which the normality estimate of effects are shown: the statistical significance of both main and interaction factors are easily seen. Significant factors and interactions are evident, because they are far from the line. The slope of the blue line is the same of pseudo standard error, while the red line has a slope equal to 1. Factor X3 has the highest negative effect, but in interaction with factor X1 produces a significant positive effect. Other significant factors and interactions are X1, X1X1, X1X3, as reported in the mathematical model.
The mathematical model allows to find a response surface plot related to methanol production. Regarding to this, Figure 9a,b shows the trend of response surface for the methanol production versus significant main factors. Figure 9a shows the methanol production versus X1 and X3, respectively factors A and C: a higher production of methanol is obtained with factor A and C at lower level, as found in previous analysis. Figure 9b shows the methanol production versus X1 and X4, respectively factors A and D: a higher methanol production is obtained with factor A at lower level and factor D at higher level. However, these considerations are not related to the reactor volume, which must be minimized.
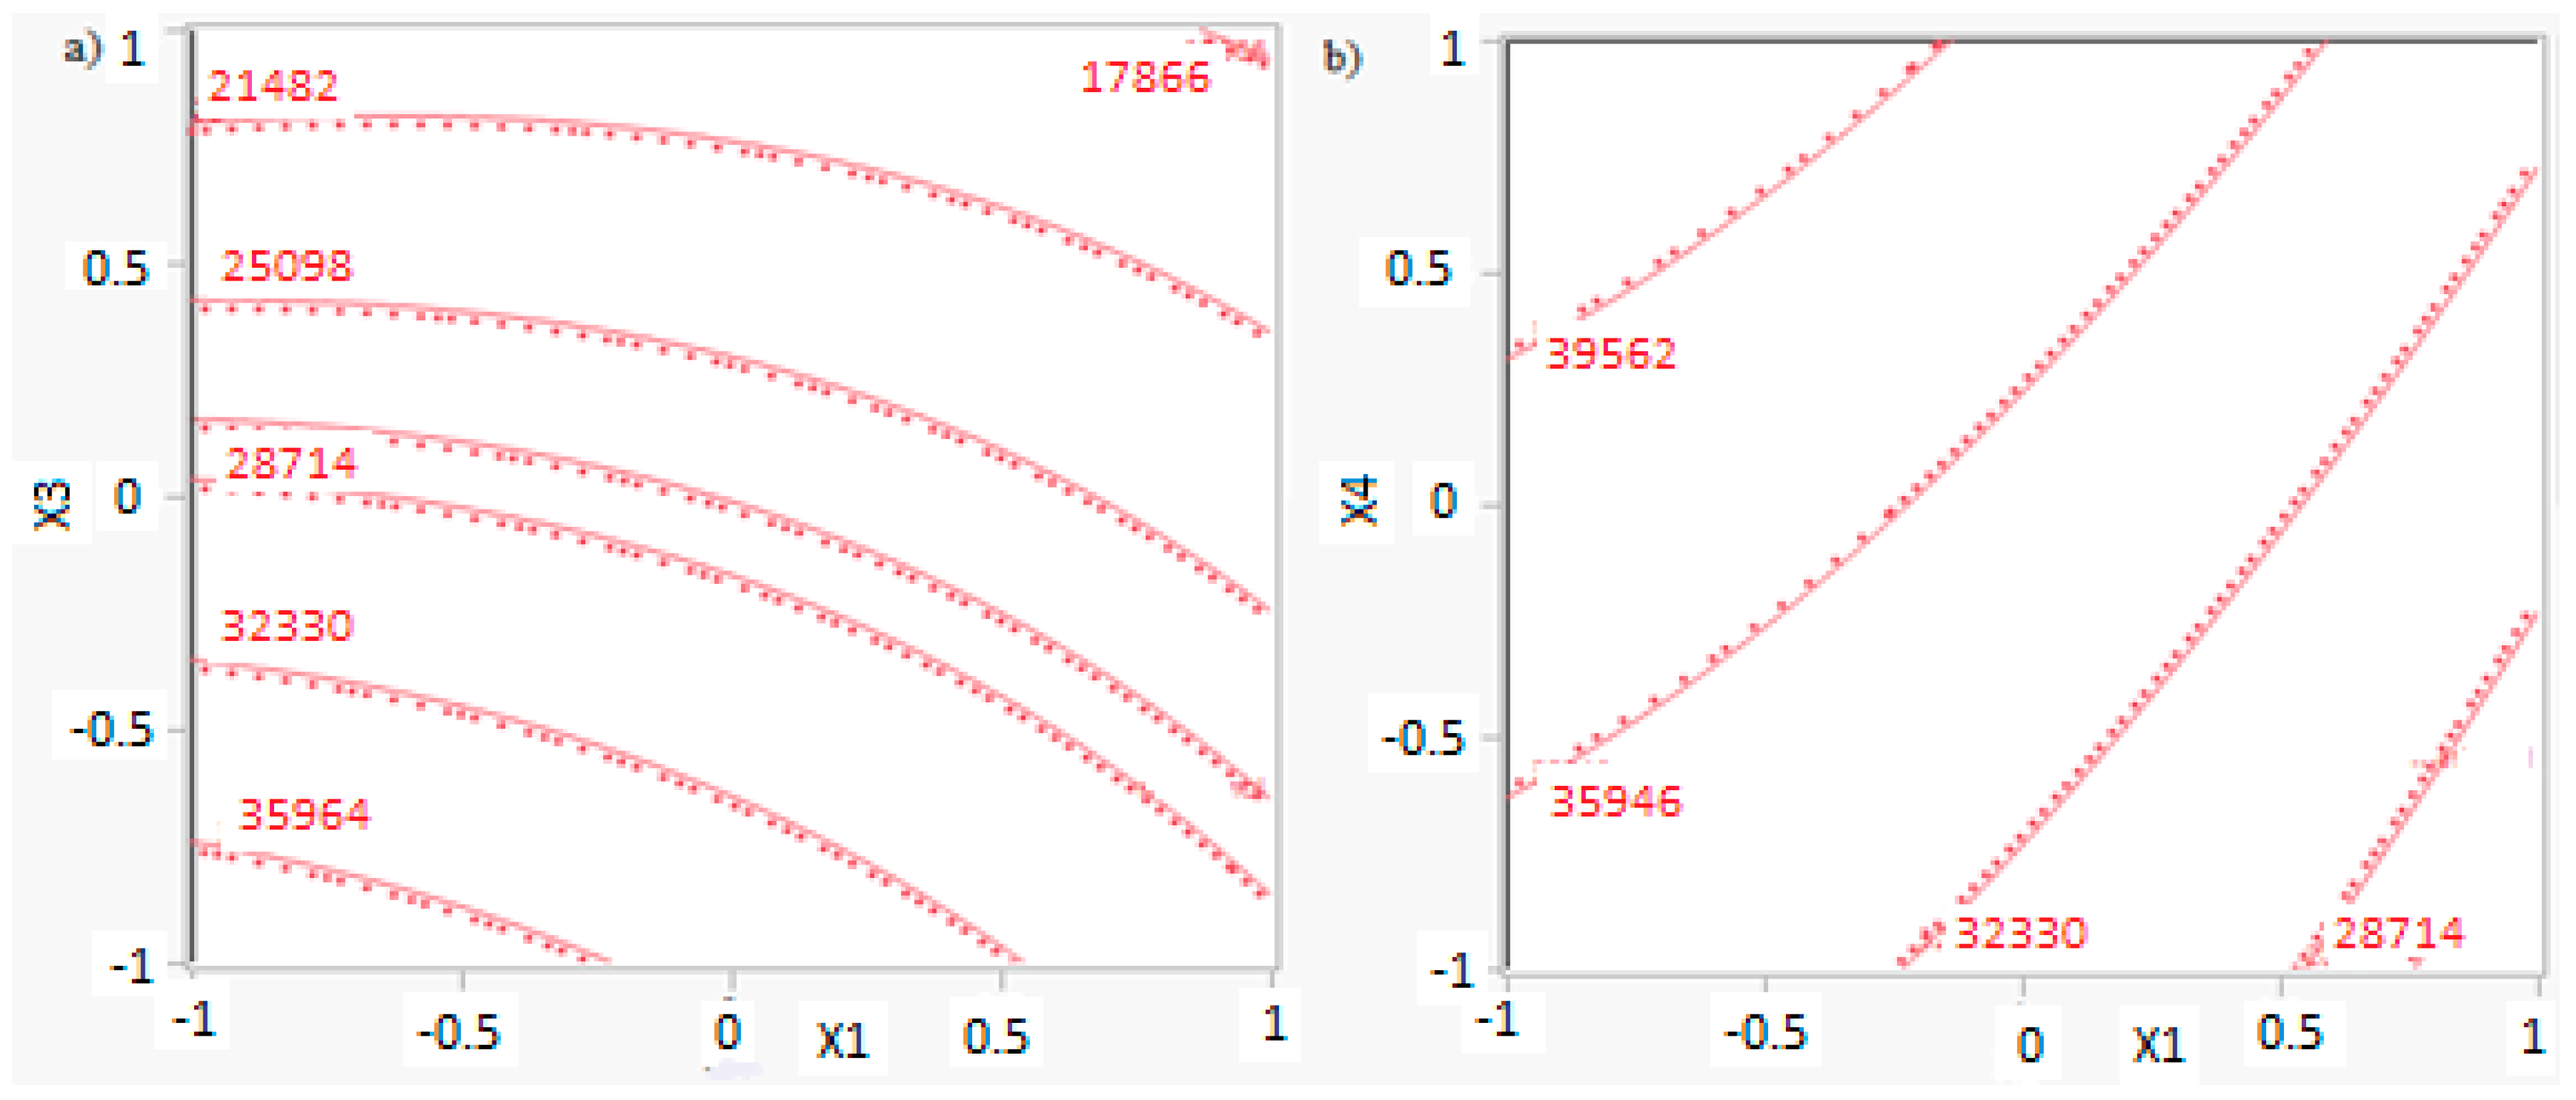
The isometric profile in Figure 10a shows optimal operating conditions in order to have the maximum methanol production: a lower level of factors A and C ensures a higher productivity, equal to 37,771 kg/h.
However, in order to have also a lower reactor volume, according to previous results it is preferable to work with a higher value of factor A. In these conditions, the methanol production is equal to 17,888 kg/h, as shown in Figure 10a. Considering these results and factor D in the isometric profile shown in Figure 10b, the optimal methanol production is obtained for factor D at higher level. Then, optimal conditions are present with factor A at higher level, factor C at lower level, and factor D at higher level. These conditions allow a methanol production equal to 33,540 kg/h while the reactor volume is equal to 6 m3.
4. Conclusions
Carbon capture and utilization (CCU) is presented as a medium-term alternative to mitigate climate change. Carbon dioxide can be used to produce many chemical compounds, such as methanol, methane, syngas, formic acid, and dimethyl ether through hydrogenation reactions.
Methanol is one of the most valuable chemicals, with a series of uses either as fuel or as building block for the synthesis of other chemicals. Methanol synthesis by the hydrogenation of carbon dioxide is a feasible and efficient process, in an exothermic reaction. Other different raw materials and routes can be used to produce methanol. However, the use of carbon dioxide and hydrogen by renewable energy allows a green process with a lower environmental impact.
In this research, an ANOVA analysis and a central composite design were developed for a reactor producing methanol by the hydrogenation of carbon dioxide. The reactor was modelled in ChemCad 6.3® software and simulation results were used for two analyses. The aim of this study was to find the conditions that allow a higher methanol production and a lower reactor volume to be obtained. The kinetics of Graaf were used to describe the methanol production, while Cu/ZnO/Al2O3 was used as catalyst. The kinetic model contains the hydrogenation of CO and CO2. Major kinetic studies for methanol synthesis were conducted as early as 1977, and even recently researchers have been trying to model the kinetic process. In ANOVA analysis, reaction temperature (factor A), reaction pressure (factor B), H2/CO2 ratio (factor C), and the recycle of produced stream (factor D) were the chosen factors, while the methanol production and the reactor volume were the analyzed responses. Two different mathematical models for these responses were obtained with significant factors and interactions. Results show that AC is a common interaction, and it allows a higher methanol production to be obtained with a lower reactor volume. In particular, it is preferable to work with factor A at higher level and factor C at lower level. An analysis of residues and a test of the two levels for the significant interactions were also carried out, for a better comprehension of the process. A central composite design was developed in order to find the response surface plot of methanol production: an analysis of four factors with five levels was developed. Optimal conditions were also found: factors A, C, D must be at their higher, lower, and higher levels respectively. In these conditions, the optimal methanol production is equal to 33,540 kg/h, while the reactor volume is 6 m3. The operative conditions of a catalytic reactor that produces methanol by the hydrogenation of carbon dioxide were then obtained in this research, maximizing the productivity and reducing the costs. A similar work is not present in literature, so the novelty of the study is evident. Future researchers should consider a detailed economic analysis in order to have lower costs. Important considerations were obtained by the developed analysis that can be used for the design of methanol reactors or for the optimization of existing reactors.
Acknowledgments
The author of the study would like to thank the University of L’Aquila for funding this work.
Conflicts of Interest
The author declares no conflict of interest.
References
- Varone, A.; Ferrari, M. Power to liquid and power to gas: An option for the German Energiewende. Renew. Sustain. Energy Rev. 2015, 45, 207–218. [Google Scholar] [CrossRef]
- Kumar, S.; Kwon, H.T.; Choi, K.H.; Cho, J.H.; Lim, W.; Moon, I. Current status and future projections of LNG demand and supplies: A global prospective. Energy Policy 2011, 39, 4097–4104. [Google Scholar] [CrossRef]
- Katoch, S.S.; Bhat, I.K. Clean Energy Technology Approaches of Mitigating Greenhouse Gases. Chem. Eng. Trans. 2010, 21, 607–612. [Google Scholar]
- Min, J.E.; Lee, Y.J.; Park, H.G.; Zhang, C.; Jun, K.W. Carbon dioxide reforming of methane on Ni–MgO–Al2O3 catalysts prepared by sol–gel method: Effects of Mg/Al ratios. J. Ind. Eng. Chem. 2015, 26, 375–383. [Google Scholar] [CrossRef]
- Olah, G.A.; Goeppert, A.; Czaun, M.; Prakash, G.S. Bi-reforming of methane from any source with steam and carbon dioxide exclusively to metgas (CO–2H2) for methanol and hydrocarbon synthesis. J. Am. Chem. Soc. 2012, 135, 648–650. [Google Scholar] [CrossRef] [PubMed]
- Wang, W.; Wang, S.; Ma, X.; Gong, J. Recent advances in catalytic hydrogenation of carbon dioxide. Chem. Soc. Rev. 2011, 40, 3703–3727. [Google Scholar] [CrossRef] [PubMed]
- Pérez-Fortes, M.; Schöneberger, J.C.; Boulamanti, A.; Tzimas, E. Methanol synthesis using captured CO2 as raw material: Techno-economic and environmental assessment. Appl. Energy 2016, 161, 718–732. [Google Scholar] [CrossRef]
- Redissi, Y.; Bouallou, C. Valorization of carbon dioxide by co-electrolysis of CO2/H2O at high temperature for syngas production. Energy Proc. 2013, 37, 6667–6678. [Google Scholar] [CrossRef]
- Kiss, A.A.; Pragt, J.J.; Vos, H.J.; Bargeman, G.; de Groot, M.T. Novel efficient process for methanol synthesis by CO2 hydrogenation. Chem. Eng. J. 2016, 284, 260–269. [Google Scholar] [CrossRef]
- Acar, C.; Dincer, I.; Zamfirescu, C. A review on selected heterogeneous photocatalysts for hydrogen production. Int. J. Energy Res. 2014, 38, 1903–1920. [Google Scholar] [CrossRef]
- Jadhav, S.G.; Vaidya, P.D.; Bhanage, B.M.; Joshi, J.B. Catalytic carbon dioxide hydrogenation to methanol: A review of recent studies. Chem. Eng. Res. Des. 2014, 92, 2557–2567. [Google Scholar] [CrossRef]
- Van-Dal, E.S.; Bouallou, C. Design and simulation of a methanol production plant from CO2 hydrogenation. J. Clean. Prod. 2013, 57, 38–45. [Google Scholar] [CrossRef]
- Riaz, A.; Zahedi, G.; Kleme, J.J. A review of cleaner production methods for the manufacture of methanol. J. Clean. Prod. 2013, 57, 19–37. [Google Scholar] [CrossRef]
- Davis, B.H. Overview of reactors for liquid phase Fischer—Tropsch synthesis. Catal. Today 2002, 71, 249–300. [Google Scholar] [CrossRef]
- Kathiraser, Y.; Wang, Z.; Kawi, S. Oxidative CO2 reforming of methane in La0.6Sr0.4Co0.8Ga0.2O3-δ (LSCG) hollow fiber membrane reactor. Environ. Sci. Technol. 2013, 47, 14510–14517. [Google Scholar] [CrossRef] [PubMed]
- Shi, J.; Shi, F.; Song, N.; Liu, J.-X.; Yang, X.-K.; Jia, Y.-J.; Xiao, Z.-W.; Du, P. Anovel electrolysis cell for CO2 reduction to CO in ionic liquid/organic solvent electrolyte. J. Power Sources 2014, 259, 50–53. [Google Scholar] [CrossRef]
- Ahmed, N.; Morikawa, M.; Izumi, Y. Photocatalytic conversion of carbondioxide into methanol using optimized layered double hydroxide catalysts. Catal. Today 2012, 185, 263–269. [Google Scholar] [CrossRef]
- Carlesi, C.; Carvajal, D.; Vasquez, D.; Arratia, R.S. Analysis of carbondioxide-to-methanol direct electrochemical conversion mediated by an ionic liquid. Chem. Eng. Process. Process Intensif. 2014, 85, 48–56. [Google Scholar] [CrossRef]
- Liu, Y.; Huang, B.; Dai, Y.; Zhang, X.; Qin, X.; Jiang, M.; Whangbo, M.H. Selective ethanol formation from photocatalytic reduction of carbon dioxide in water with BiVO4 photocatalyst. Catal. Commun. 2009, 11, 210–213. [Google Scholar] [CrossRef]
- Du, P.; Carneiro, J.T.; Moulijn, J.A.; Mul, G. A novel photocatalytic monolith reactor for multiphase heterogeneous photocatalysis. Appl. Catal. A Gen. 2008, 334, 119–128. [Google Scholar] [CrossRef]
- Martín, M.; Grossmann, I.E. Towards zero CO2 emissions in the production of methanol from switchgrass. CO2 to methanol. Comput. Chem. Eng. 2017, 4, 308–318. [Google Scholar] [CrossRef]
- Bellotti, D.; Rivarolo, M.; Magistri, L.; Massardo, A.F. Feasibility study of methanol production plant from hydrogen and captured carbon dioxide. J. CO2 Util. 2017, 21, 132–138. [Google Scholar] [CrossRef]
- Kang, S.C.; Jun, K.W.; Lee, Y.J. Effects of the CO/CO2 ratio in synthesis gas on the catalytic behavior in Fischer-Tropsch synthesis using K/Fe–Cu–Al catalysts. Energy Fuel 2013, 27, 6377–6387. [Google Scholar] [CrossRef]
- Yao, Y.; Liu, X.; Hildebrandt, D.; Glasser, D. Fischer-Tropsch synthesis using H2/CO/CO2 syngas mixtures over an iron catalyst. Ind. Eng. Chem. Res. 2011, 50, 11002–11012. [Google Scholar] [CrossRef]
- Johnson, D. Global Methanol Market Review. Available online: http://www.ptq.pemex.com/productosyservicios/eventosdescargas/Documents/Foro%20PEMEX%20Petroqu%C3%ADmica/2012/PEMEX_DJohnson.pdf (accessed on 1 June 2012).
- Biedermann, P.; Grube, T.; Höhlein, B. Methanol as an Energy Carrier. Energy Technology; Forschungszentrum Jülich GmbH: Jülich, Germany, 2006. [Google Scholar]
- Kreuer, K.D. On the development of proton conducting polymer membranes for hydrogen and methanol fuel cells. J. Membr. Sci. 2001, 185, 29–39. [Google Scholar] [CrossRef]
- Bertau, M.; Offermanns, H.; Plass, L.; Schmidt, F.; Wernicke, H.J. Methanol: The basic Chemical and Energy Feedstock of the Future; Springer-Verlag: Berlin/Heidelberg, Germany, 2014. [Google Scholar]
- Olah, G.A. Beyond oil and gas: The methanol economy. Angew. Chem. Int. Ed. 2005, 44, 2636–2639. [Google Scholar] [CrossRef] [PubMed]
- Chen, Z.; Yao, M.; Zheng, Z.; Zhang, Q. Experimental and numerical study of methanol/dimethyl ether dual-fuel compound combustion. Energy Fuels 2009, 23, 2719–2730. [Google Scholar] [CrossRef]
- Al-Kalbani, H.; Xuan, J.; García, S.; Wang, H. Comparative energetic assessment of methanol production from CO2: Chemical versus electrochemical process. Appl. Energy 2016, 165, 1–13. [Google Scholar] [CrossRef]
- Pérez-Fortes, M.; Tzimas, E. Techno-Economic and Environmental Evaluation of CO2 Utilisation for Fuel Production; JRC Science Hub: ZG Petten, The Netherlands, 2016. [Google Scholar] [CrossRef]
- Gallucci, F.; Paturzo, L.; Basile, A. An experimental study of CO2 hydrogenation into methanol involving a zeolite membrane reactor. Chem. Eng. Process. Process Intensif. 2004, 43, 1029–1036. [Google Scholar] [CrossRef]
- An, X.; Li, J.; Zuo, Y.; Zhang, Q.; Wang, D.; Wang, J. A Cu/Zn/Al/Zr fibrous catalyst that is an improved CO2 hydrogenation to methanol catalyst. Catal. Lett. 2007, 118, 264–269. [Google Scholar] [CrossRef]
- Quadrelli, E.A.; Centi, G.; Duplan, J.L.; Perathoner, S. Carbon dioxide recycling: Emerging large-scale technologies with industrial potential. ChemSusChem 2011, 4, 1194–1215. [Google Scholar] [CrossRef] [PubMed]
- Atsonios, K.; Panopoulos, K.D.; Kakaras, E. Investigation of technical and economic aspects for methanol production through CO2 hydrogenation. Int. J. Hydrog. Energy 2016, 41, 2202–2214. [Google Scholar] [CrossRef]
- Rivera-Tinoco, R.; Farran, M.; Bouallou, C.; Aupretre, F.; Valentin, S.; Millet, P.N.; Gameni, J.R. Investigation of power-to-methanol processes coupling electrolytic hydrogen production and catalytic CO2 reduction. Int. J. Hydrog. Energy 2016, 41, 4546–4559. [Google Scholar] [CrossRef]
- Uhm, S.; Kim, Y.D. Electrochemical conversion of carbon dioxide in a solid oxide electrolysis cell. Curr. Appl. Phys. 2014, 14, 672–679. [Google Scholar] [CrossRef]
- Atsonios, K.; Panopoulos, K.D.; Kakaras, E. Thermocatalytic CO2 hydrogenation for methanol and ethanol production: Process improvements. Int. J. Hydrog. Energy 2016, 41, 792–806. [Google Scholar] [CrossRef]
- Harp, G.; Harp, K.; Tran, C.; Bergins, C.; Buddenberg, T.; Drach, I.; Koytsoumpa, E.I.; Sigurbjornsson, O. Application of Power to Methanol Technology to Integrated Steel works for Profitability, Conversion Efficiency, and CO2 Reduction. In Proceedings of the 2nd European Steel Technology and Application Days, Duesseldorf, Germany, 15–19 June 2015. [Google Scholar]
- Adam, J.; Harp, G. LOCIMAP Low carbon industrial manufacturing park–potential for symbiosis between Steel and Chemical industry on lowering CO2 emissions 2014. In Proceedings of the European Steel Environment Energy Congress, Teeside, UK, 15–17 September 2014. [Google Scholar]
- Pedersen, T.H.; Schultz, R.H. Technical and Economic Assessment of Methanol Production from Biogas. Master’s Thesis, University of Aalborg, Aalborg, Denmark, 31 May 2012. [Google Scholar]
- Matzen, M.J. Sustainability Assessment for Energy Systems and Chemical Process Industries. Master’s Thesis, University of Nebraska-Lincoln, Department of Chemical and Biomolecular Engineering, Lincoln, NE, USA, December 2015. [Google Scholar]
- Gai, S.; Yu, J.; Yu, H.; Eagle, J.; Zhao, H.; Lucas, J.; Doroodchi, E.; Moghtaderi, B. Process simulation of a near-zero-carbon-emission power plant using CO2 as the renewable energy storage medium. Int. J. Greenh. Gas Control 2016, 47, 240–249. [Google Scholar] [CrossRef]
- Graaf, G.H.; Stamhuis, E.J.; Beenackers, A.A.C.M. Kinetics of low pressure methanol synthesis. Chem. Eng. Sci. 1988, 43, 3185–3195. [Google Scholar] [CrossRef]
- Mignard, D.; Pritchard, C. Processes for the synthesis of liquid fuels from CO2 and marine energy. Chem. Eng. Res. Des. 2006, 84, 828–836. [Google Scholar] [CrossRef]
- Mignard, D.; Sahibzada, M.; Duthie, J.M.; Whittington, H.W. Methanol synthesis from flue-gas CO2 and renewable electricity: A feasibility study. Int. J. Hydrog. Energy 2003, 28, 455–464. [Google Scholar] [CrossRef]
- Anicic, B.; Trop, P.; Goricanec, D. Comparison between two methods of methanol production from carbon dioxide. Energy 2014, 77, 279–288. [Google Scholar] [CrossRef]
- Pontzen, F.; Liebner, W.; Gronemann, V.; Rothaemel, M.; Ahlers, B. CO2-based methanol and DME e efficient technologies for industrial scale production. Catal. Today 2011, 171, 242–250. [Google Scholar] [CrossRef]
- Wilkinson, S.K.; van de Water, L.G.A.; Miller, B.; Simmons, M.J.H.; Stitt, E.H.; Watson, M.J. Understanding the generation of methanol synthesis and water gas shift activity over copper-based catalysts—A spatially resolved experimental kinetic study using steady and non-steady state operation under CO/CO2/H2 feeds. J. Catal. 2016, 337, 208–220. [Google Scholar] [CrossRef]
- Zoulias, E.; Varkaraki, E.; Lymberopoulos, N.; Christodoulou, C.N.; Karagiorgis, G.N. A review on water electrolysis. TCJST 2004, 4, 41–71. [Google Scholar]
- Dutta, A.; Dowe, N.; Ibsen, K.N. An economic comparison of different fermentation configurations to convert corn stover to ethanol using Z. mobilis and Saccharomyces. Biotechnol. Prog. 2009, 26, 64–72. [Google Scholar]
- Montgomery, D.C. Design and Analysis of Experiments; John Wiley & Sons: New York, NY, USA, 2005. [Google Scholar]
- Dutka, B.M.; Ditaranto, M.; Løvås, T. Application of a Central Composite Design for the Study of NOx Emission Performance of a Low NOx Burner. Energies 2015, 8, 3606–3627. [Google Scholar] [CrossRef] [Green Version]
- Bas, D.; Boyaci, I.H. Modeling and optimization I: Usability of response surface methodology. J. Food Eng. 2007, 78, 836–845. [Google Scholar] [CrossRef]
- Box, G.E.P.; Hunter, J.S.; Hunter, W.G. Statistics for Experimenters: Design, Innovation, and Discovery; Wiley-Interscience: Hoboken, NJ, USA, 2005; pp. 447–455. [Google Scholar]
- Khamparia, S.; Jaspal, D. Study of decolorisation of binary dye mixture by response surface methodology. J. Environ. Manag. 2017, 201, 316–326. [Google Scholar] [CrossRef] [PubMed]
- Rahman, D. Kinetic Modeling of Methanol Synthesis From Carbon Monoxide, Carbon Dioxide, and Hydrogen Over A Cu/ZnO/Cr2O3 Catalyst. Master’s Thesis, San Jose State University, San Jose, CA, USA, 2012. [Google Scholar]
- Xin, A.N.; Yizan, Z.; Qiang, Z.; Jinfu, W. Methanol synthesis from CO2 hydrogenation with a Cu/Zn/Al/Zr fibrous catalyst. Chin. J. Chem. Eng. 2009, 17, 88–94. [Google Scholar]
- Yang, R.; Yu, X.; Zhang, Y.; Li, W.; Tsubaki, N. A new method of low-temperature methanol synthesis on Cu/ZnO/Al2O3 catalysts from CO/CO2/H2. Fuel 2008, 87, 443–450. [Google Scholar] [CrossRef]
- Shen, W.J.; Jun, K.W.; Choi, H.S.; Lee, K.W. Thermodynamic Investigation of Methanol and Dimethyl Ether Synthesis from CO2 Hydrogenation. Korean J. Chem. Eng. 2000, 17, 210–216. [Google Scholar] [CrossRef]
- Al-Dwani, H.A. A Kinetic Study of Methanol Synthesis in Slurry Reactor Using a CuO/ZnO/Al2O3 Catalyst. Master’s Thesis, Texas&M University, College Station, TX, USA, 1992. [Google Scholar]
- Park, N.; Park, M.J.; Ha, K.S.; Lee, Y.J.; Jun, K.W. Modeling and analysis of a methanol synthesis process using a mixed reforming reactor: Perspective on methanol production and CO2 utilization. Fuel 2014, 129, 163–172. [Google Scholar] [CrossRef]
- Fogler, H.S. Elements of Chemical Reaction Engineering, 4th ed.; New Jersey, USA, Prentice Hall: Upper Saddle River, New Jersey, USA, 2004. [Google Scholar]
Figure 1.
Methanol reactor used in ChemCad 6.3® environmental for the simulations (1 = inlet feed; 2 = produced stream with the produced methanol).
Figure 1.
Methanol reactor used in ChemCad 6.3® environmental for the simulations (1 = inlet feed; 2 = produced stream with the produced methanol).

Figure 2.
Results of ANOVA analysis (only significant factors and values of their effects) considering the reactor volume and the methanol production as responses (A = reaction temperature in K, B = reaction pressure in bars, C = H2/CO2 ratio, D = the recycle of produced stream).
Figure 2.
Results of ANOVA analysis (only significant factors and values of their effects) considering the reactor volume and the methanol production as responses (A = reaction temperature in K, B = reaction pressure in bars, C = H2/CO2 ratio, D = the recycle of produced stream).

Figure 3.
Surface plot of methanol production versus reaction temperature and H2/CO2 ratio (color code = methanol production in kg/h).
Figure 3.
Surface plot of methanol production versus reaction temperature and H2/CO2 ratio (color code = methanol production in kg/h).
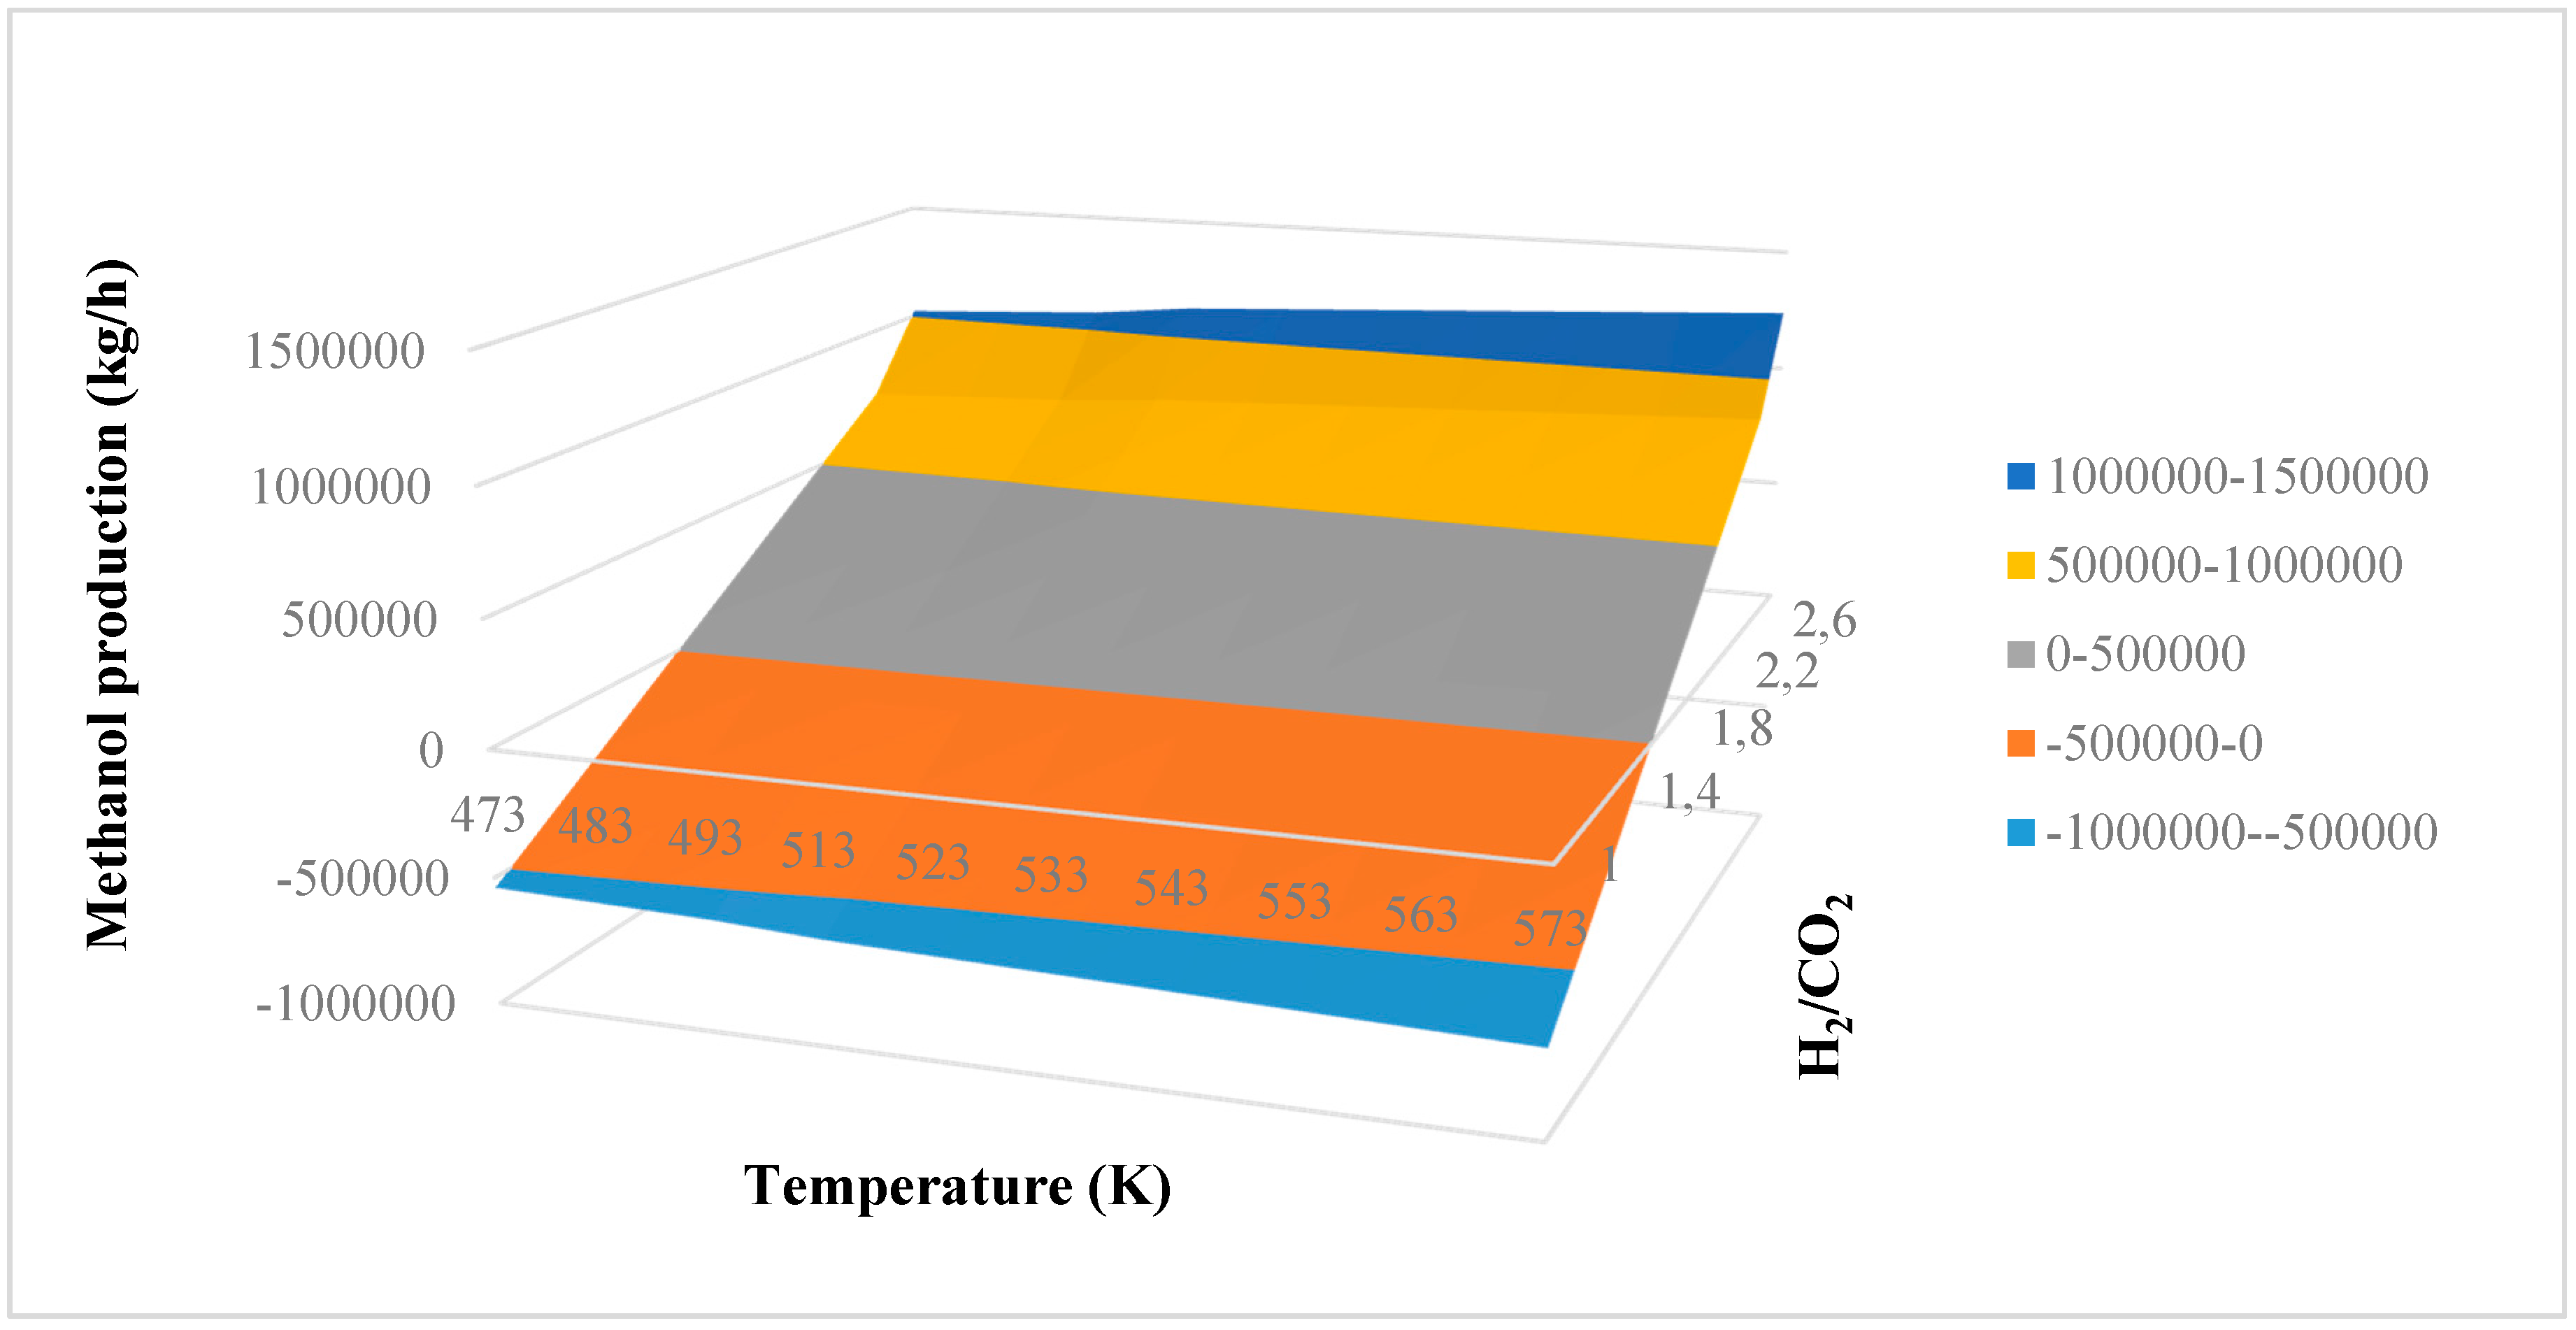
Figure 4.
(a) Test of two levels for the analysis of interaction AC in the methanol production; (b) Test of two levels for the analysis of interaction CD in the methanol production. (A = reaction temperature in K, C = H2/CO2 ratio, D = the recycle of produced stream).
Figure 4.
(a) Test of two levels for the analysis of interaction AC in the methanol production; (b) Test of two levels for the analysis of interaction CD in the methanol production. (A = reaction temperature in K, C = H2/CO2 ratio, D = the recycle of produced stream).
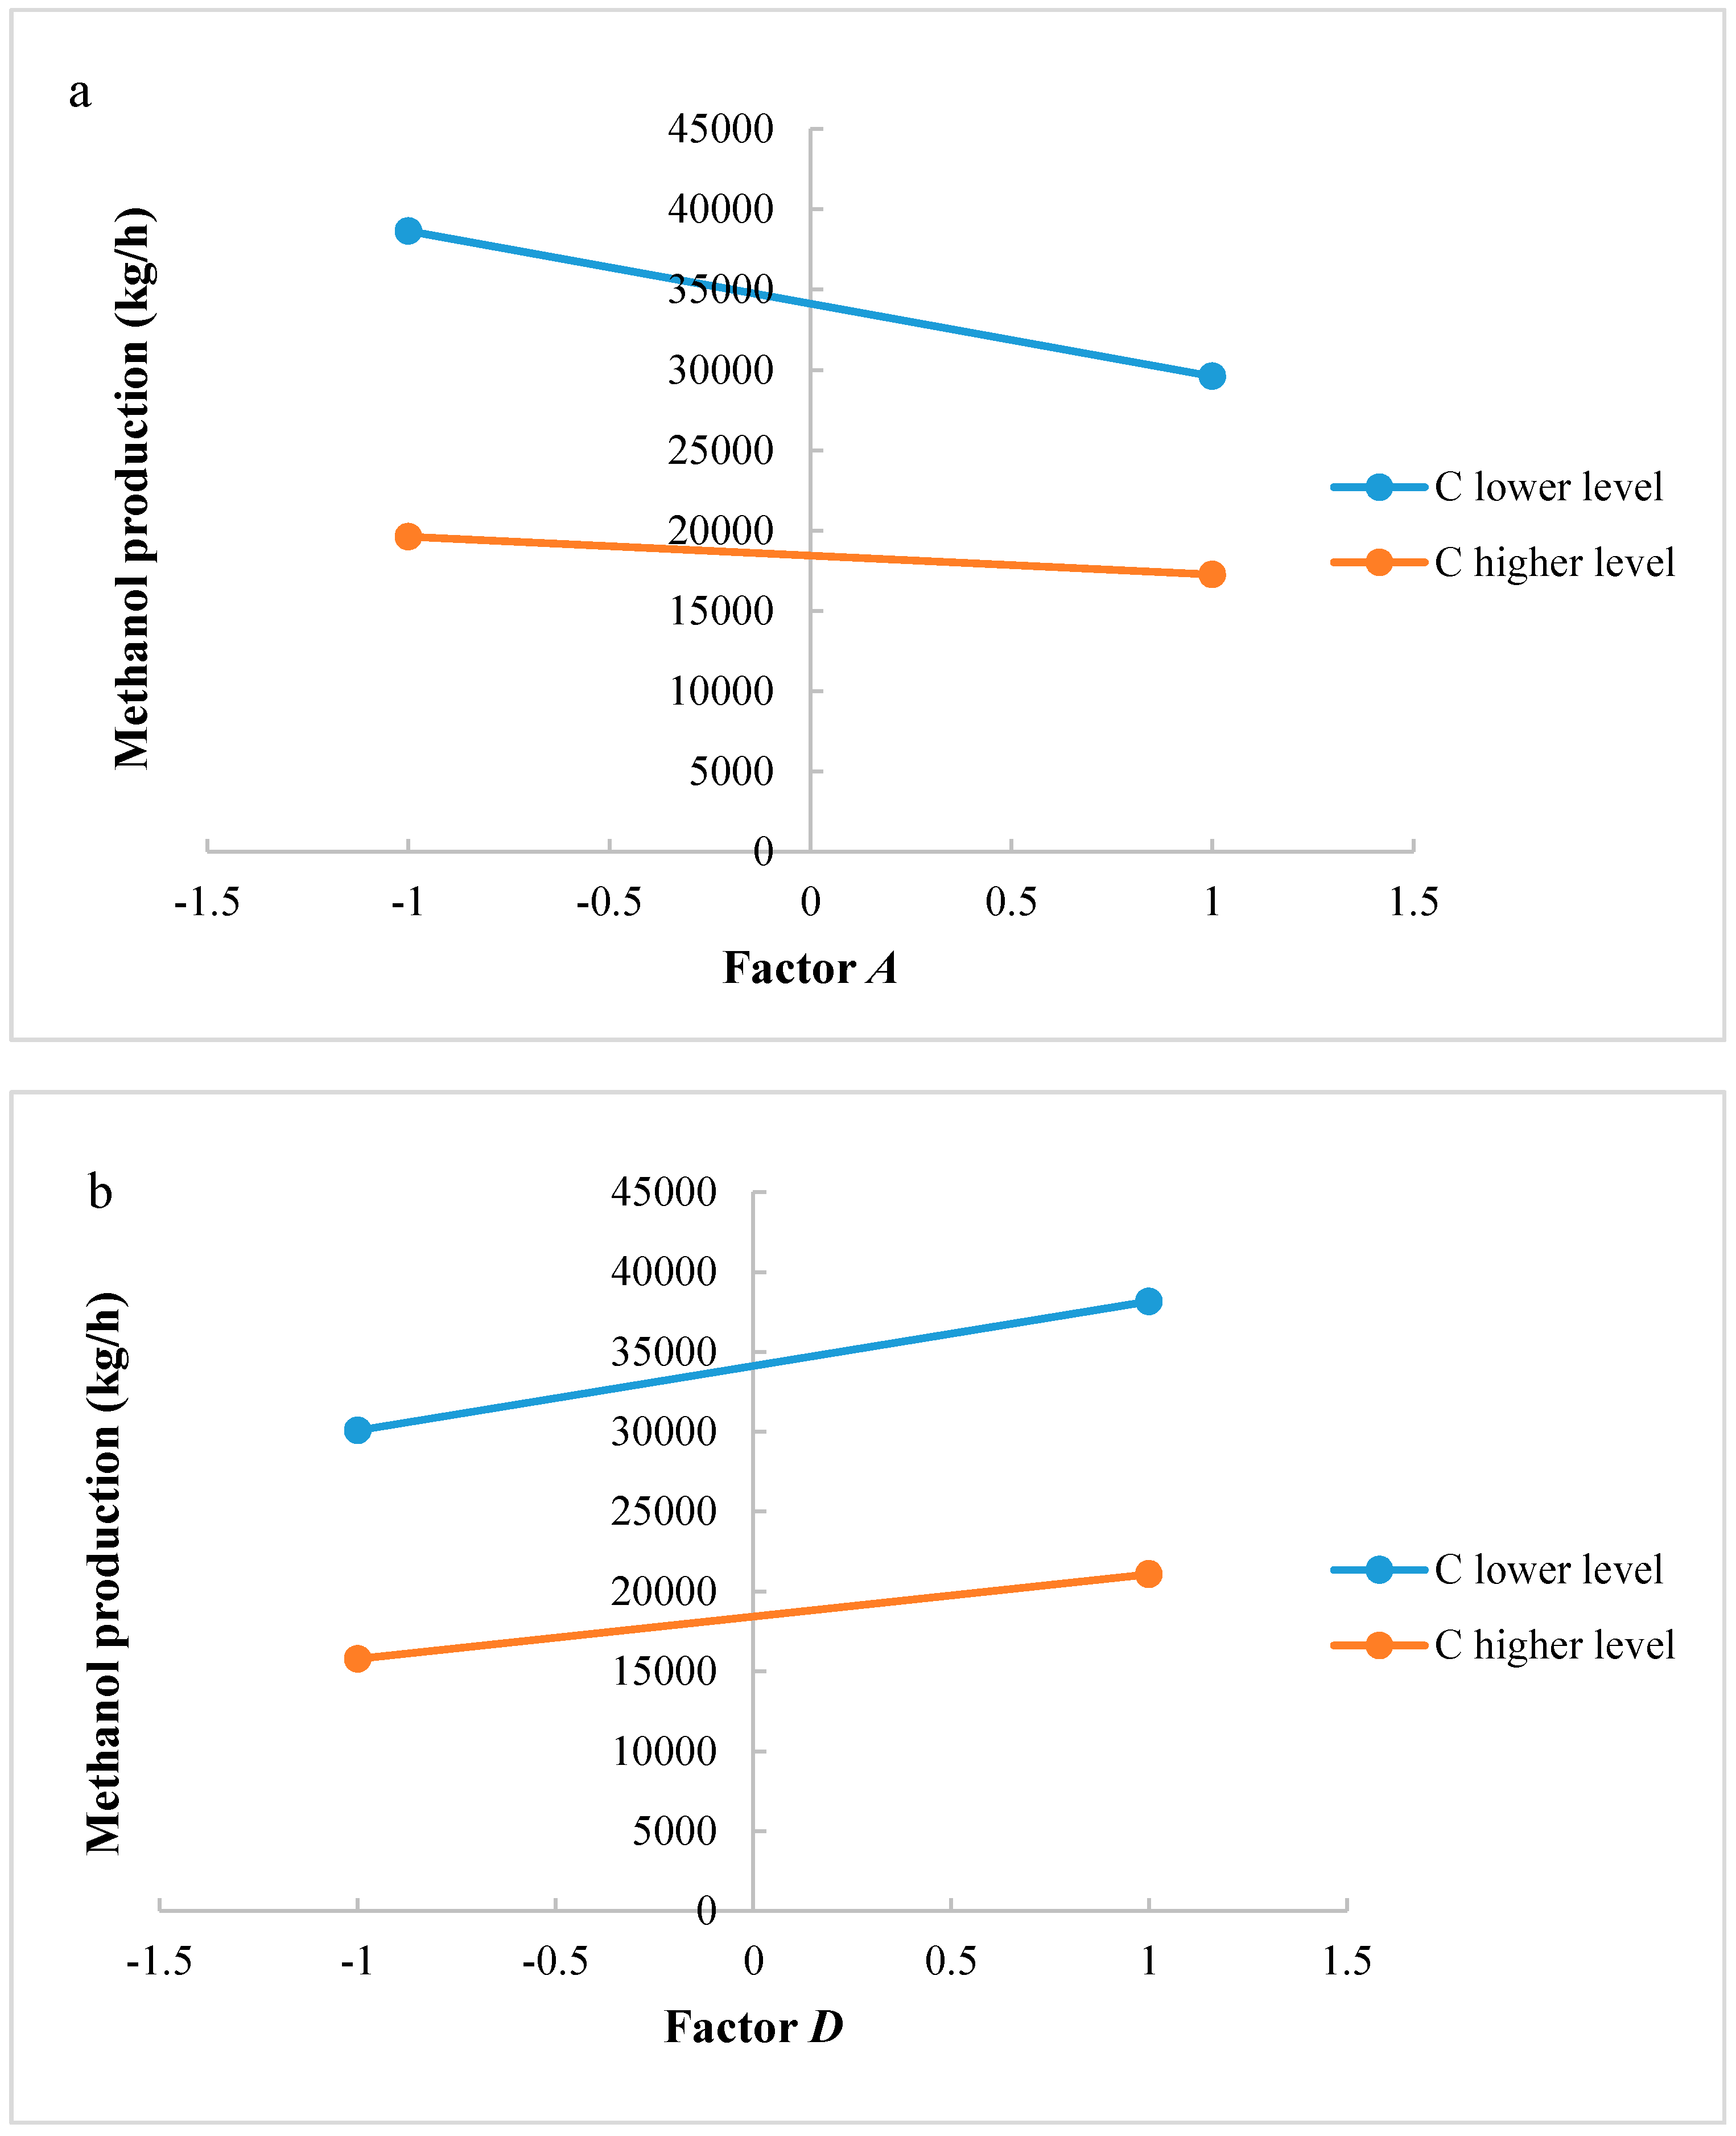
Figure 5.
(a) Residues of methanol production versus levels for factor A; (b) Residues of methanol production versus levels for factor D; (c) Residues of methanol production versus levels for factor C. (A = reaction temperature in K, C = H2/CO2 ratio, D = the recycle of produced stream).
Figure 5.
(a) Residues of methanol production versus levels for factor A; (b) Residues of methanol production versus levels for factor D; (c) Residues of methanol production versus levels for factor C. (A = reaction temperature in K, C = H2/CO2 ratio, D = the recycle of produced stream).


Figure 6.
(a) Test of two levels for the analysis of interaction AC in the reactor volume; (b) Test of two levels for the analysis of interaction CD in the reactor volume. (A = reaction temperature in K, C = H2/CO2 ratio, D = the recycle of produced stream).
Figure 6.
(a) Test of two levels for the analysis of interaction AC in the reactor volume; (b) Test of two levels for the analysis of interaction CD in the reactor volume. (A = reaction temperature in K, C = H2/CO2 ratio, D = the recycle of produced stream).

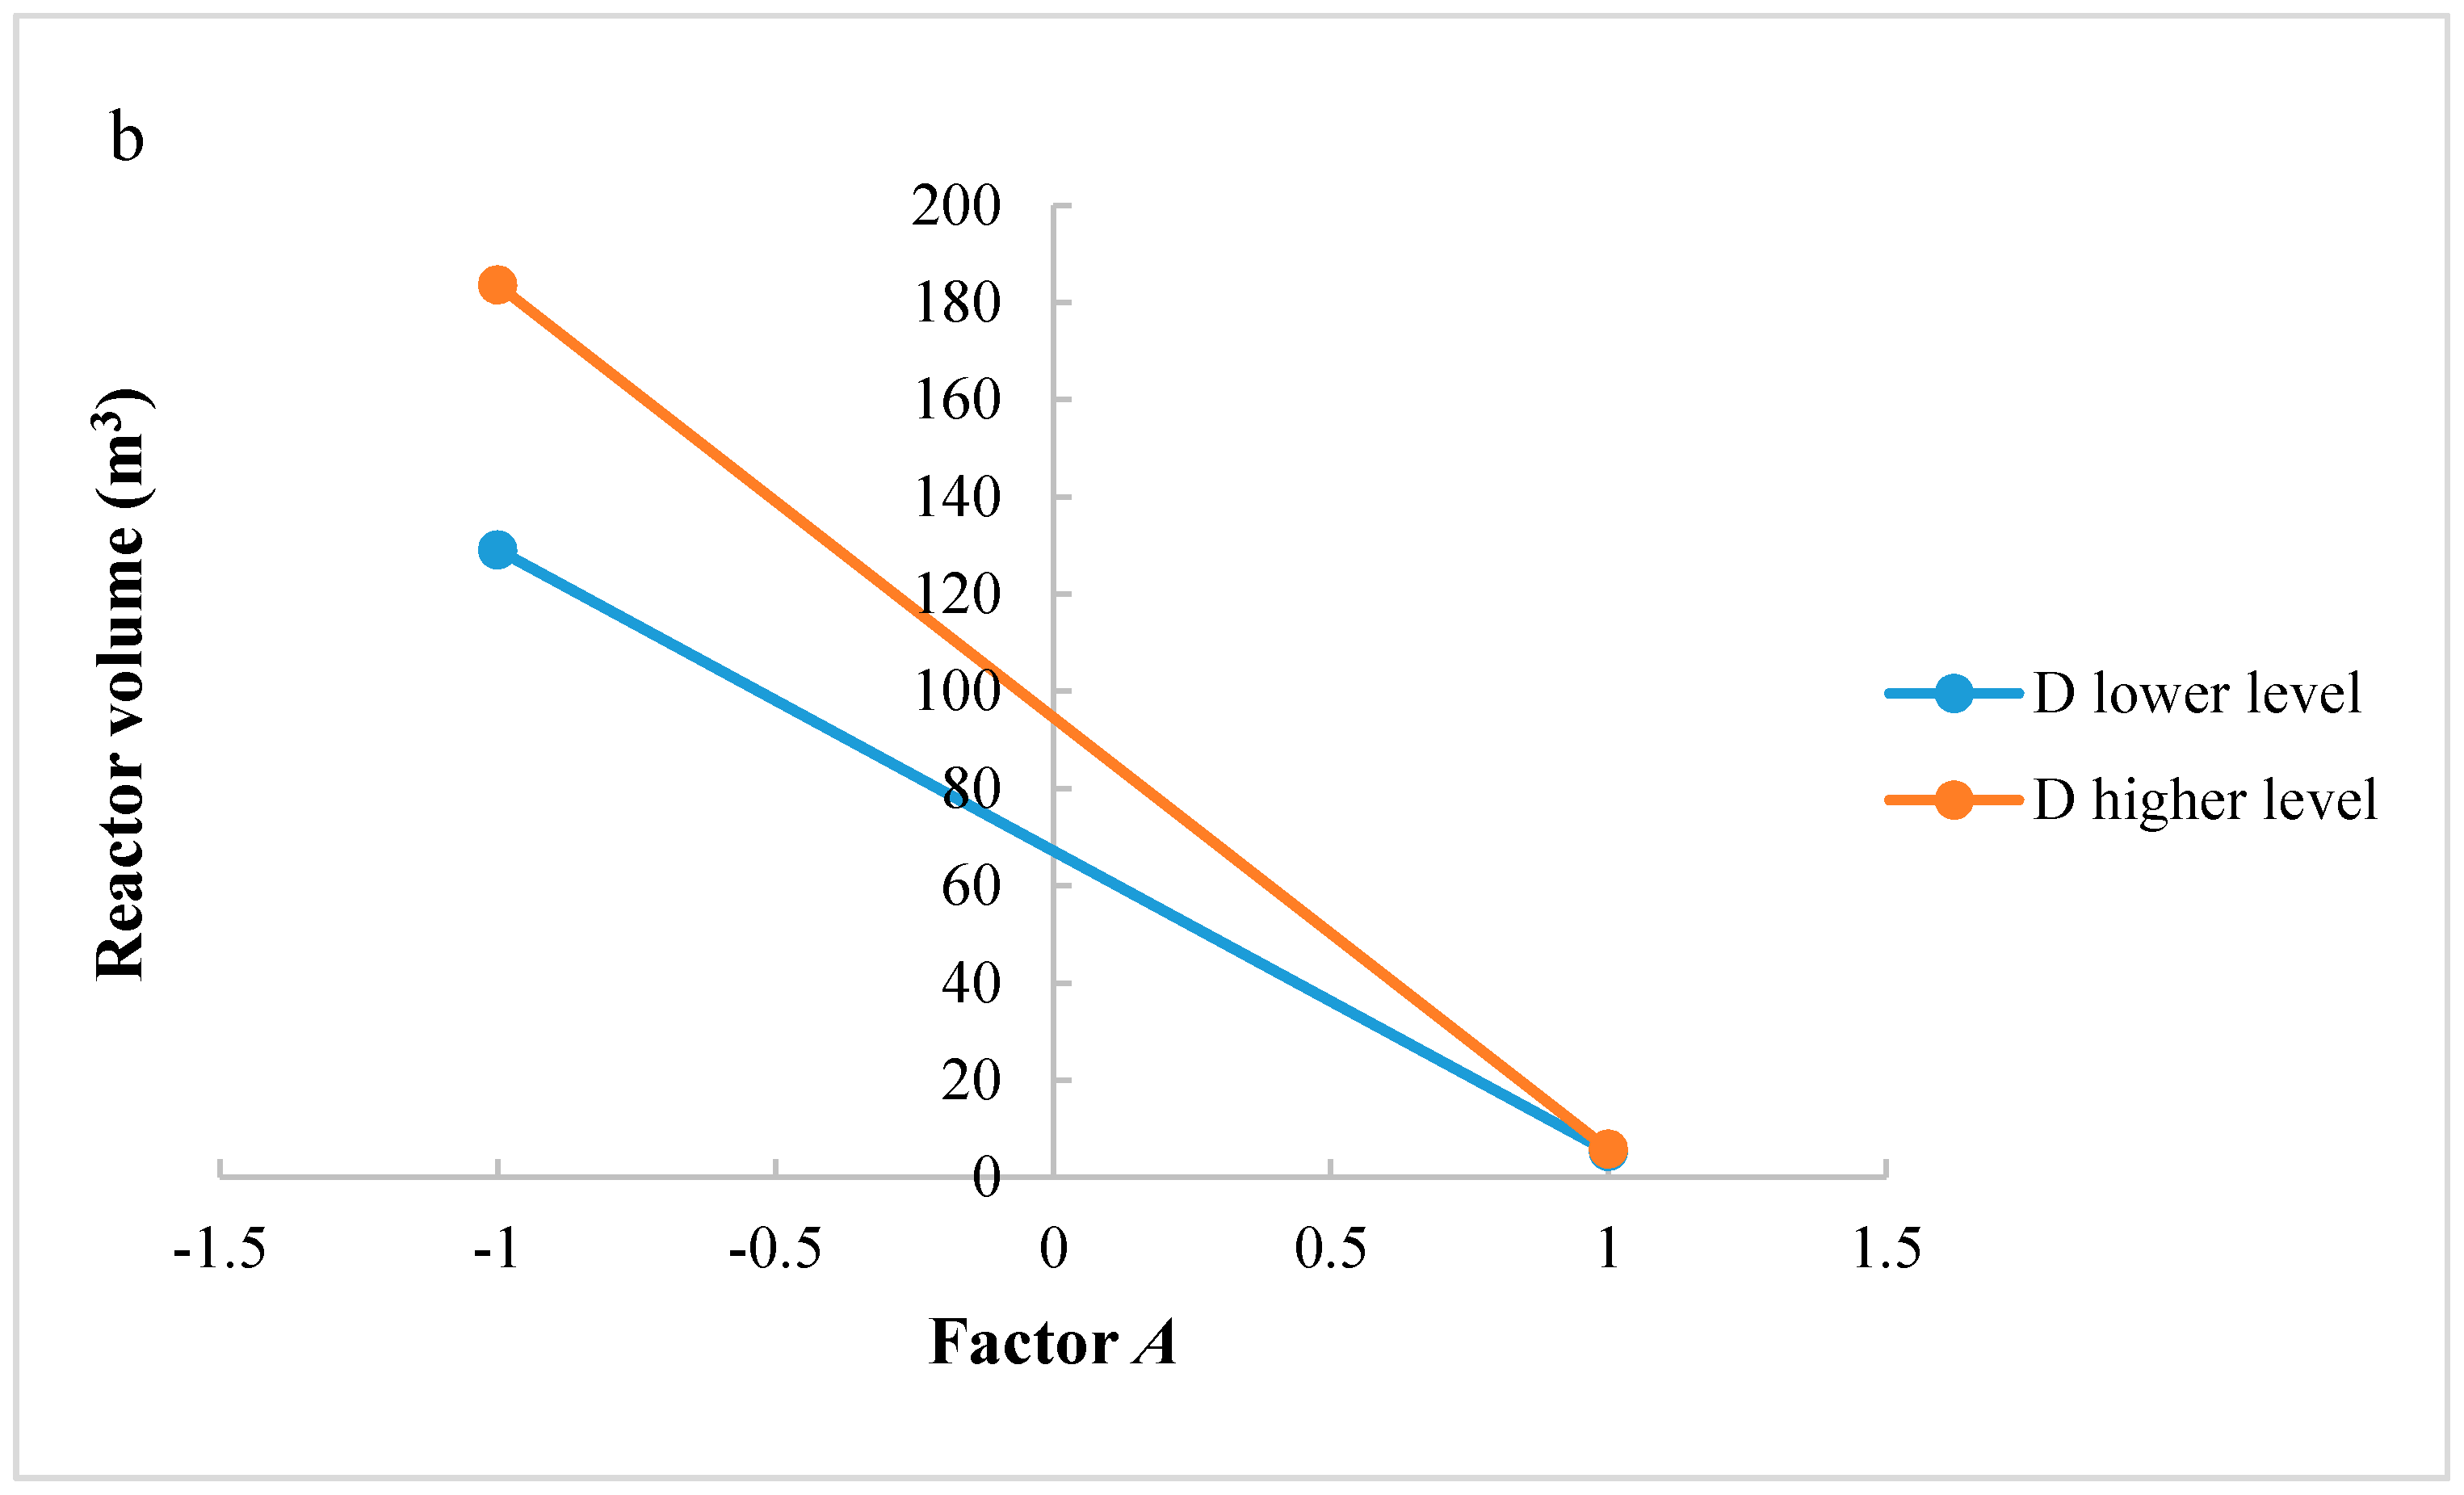
Figure 7.
(a) Residues of reactor volume versus levels for factor A; (b) Residues of reactor volume versus levels for factor C; (c) Residues of reactor volume versus levels for factor D. (A = reaction temperature in K, C = H2/CO2 ratio, D = the recycle of produced stream).
Figure 7.
(a) Residues of reactor volume versus levels for factor A; (b) Residues of reactor volume versus levels for factor C; (c) Residues of reactor volume versus levels for factor D. (A = reaction temperature in K, C = H2/CO2 ratio, D = the recycle of produced stream).
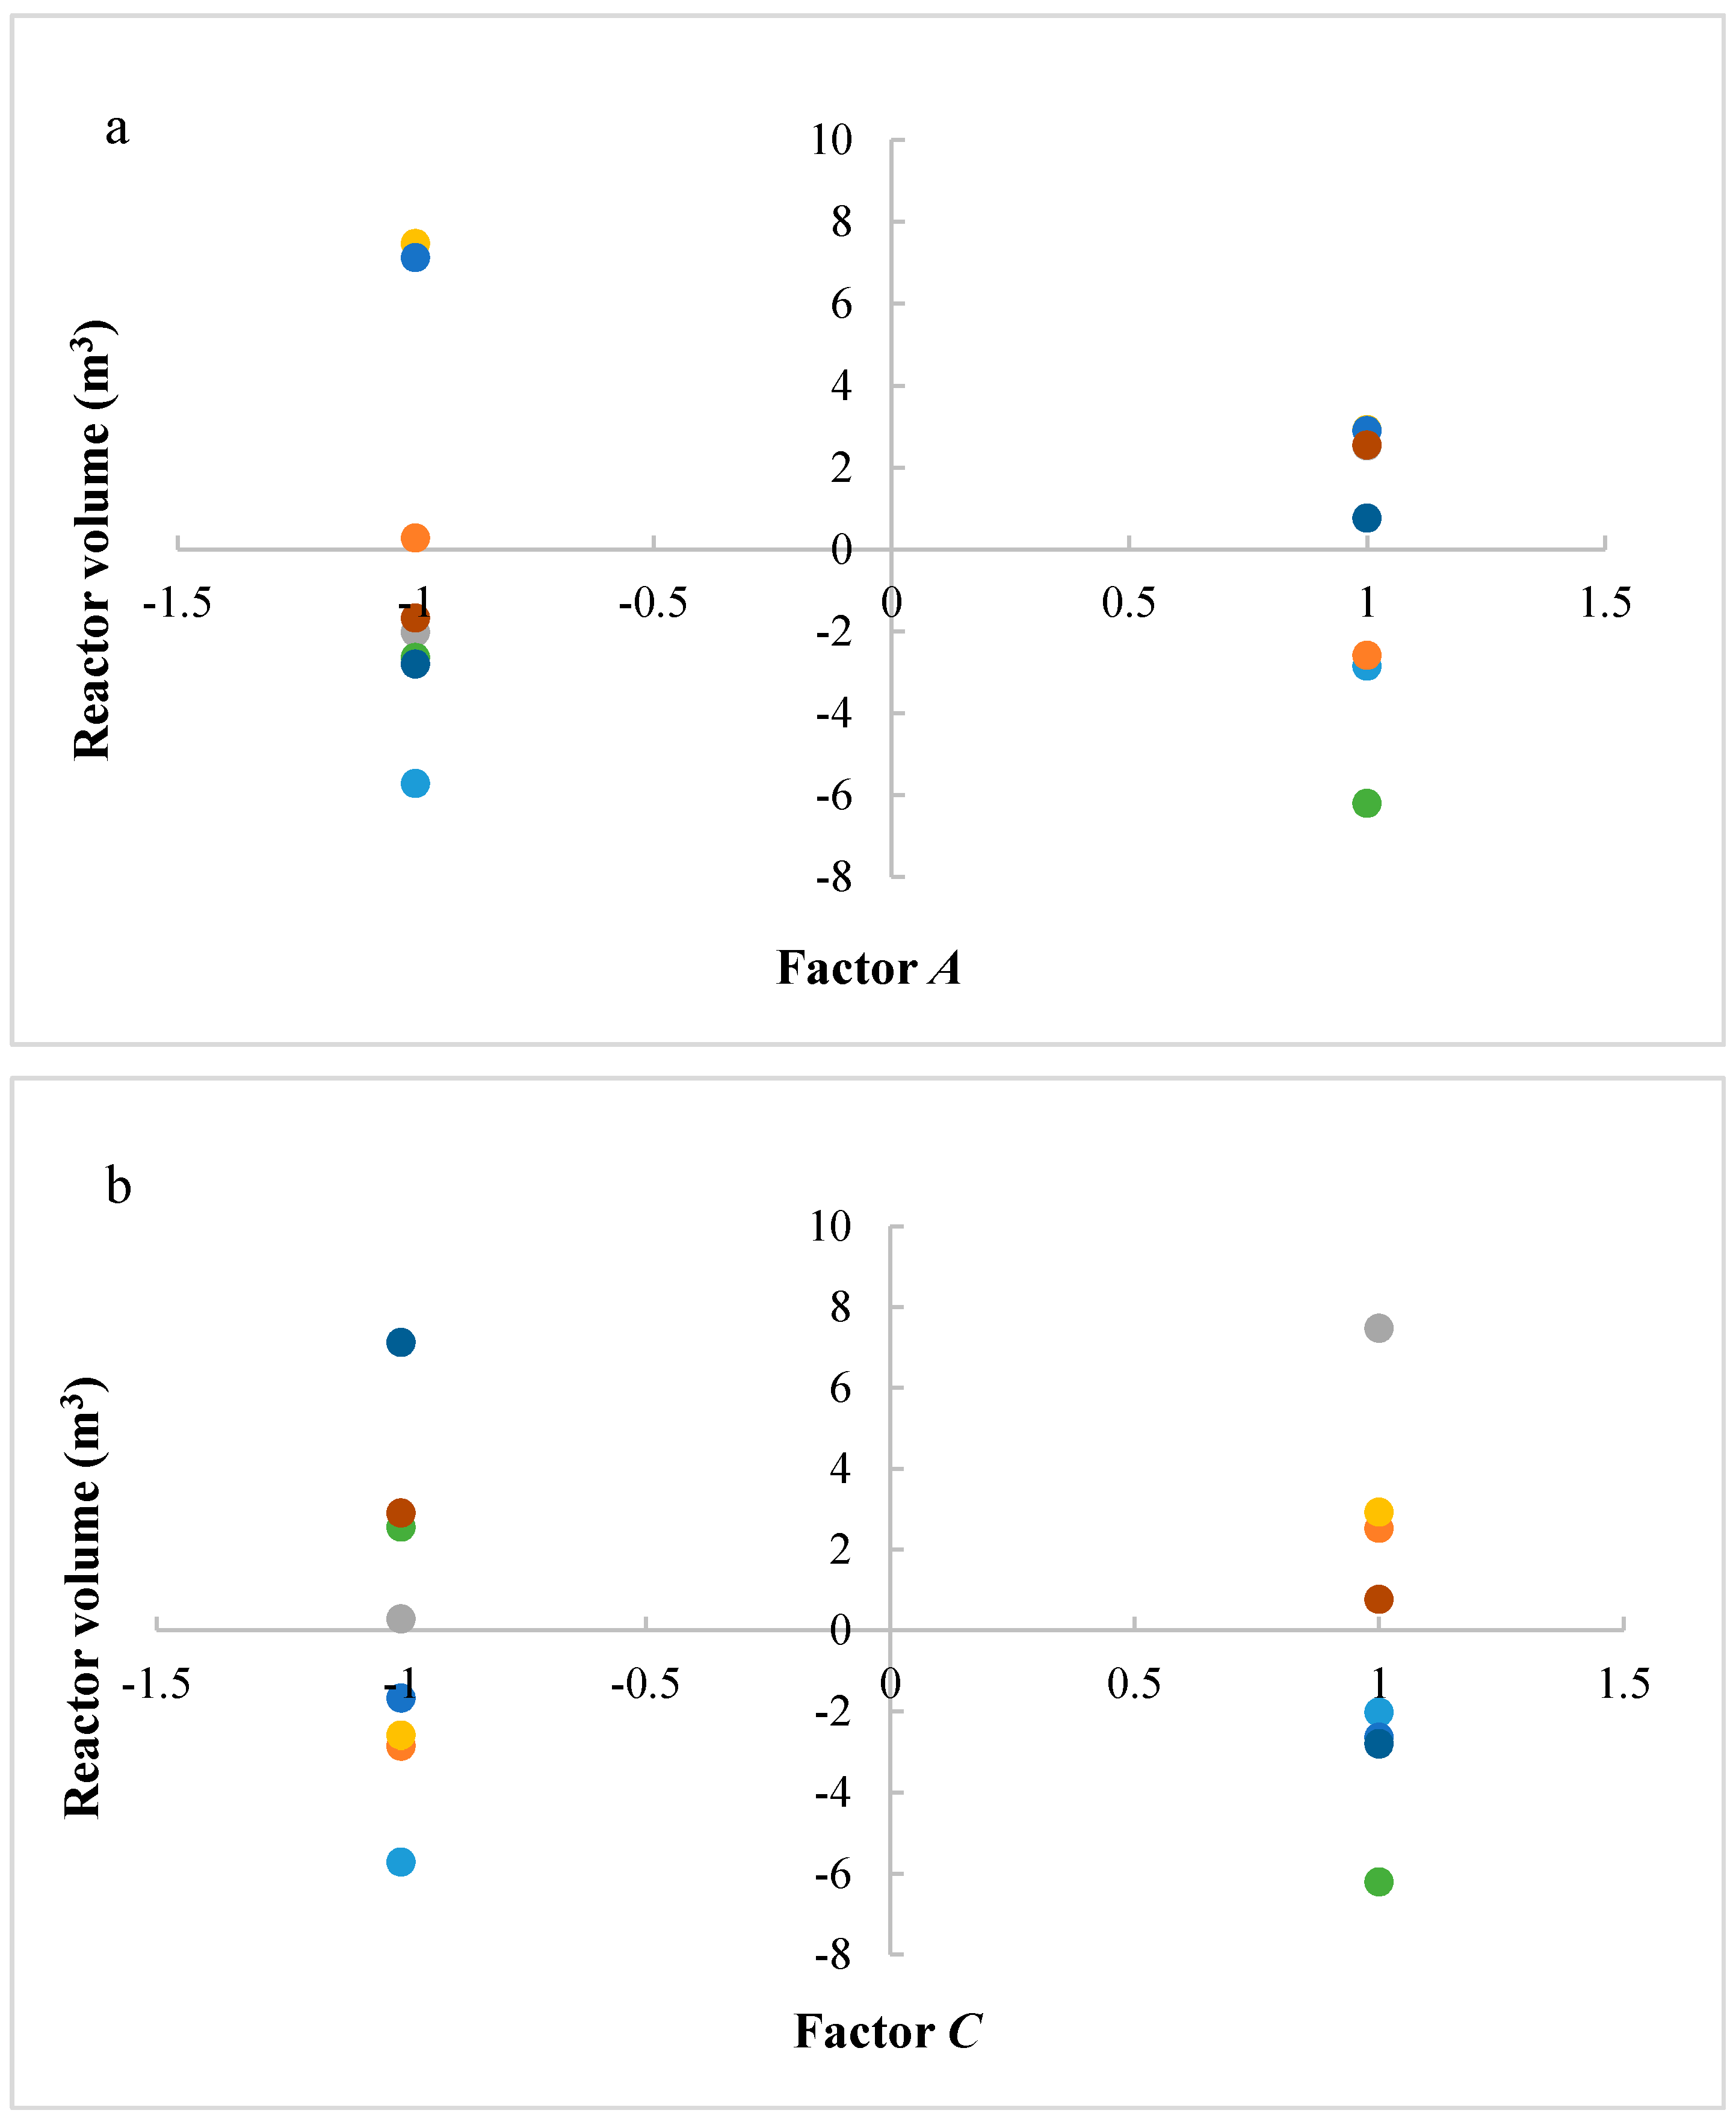

Figure 8.
Normal diagram for factors in CCD analysis, considering the methanol production as response (X1 = reaction temperature in K, X2 = reaction pressure in bar, X3 = H2/CO2 ratio, X4 = the recycle of produced stream).
Figure 8.
Normal diagram for factors in CCD analysis, considering the methanol production as response (X1 = reaction temperature in K, X2 = reaction pressure in bar, X3 = H2/CO2 ratio, X4 = the recycle of produced stream).
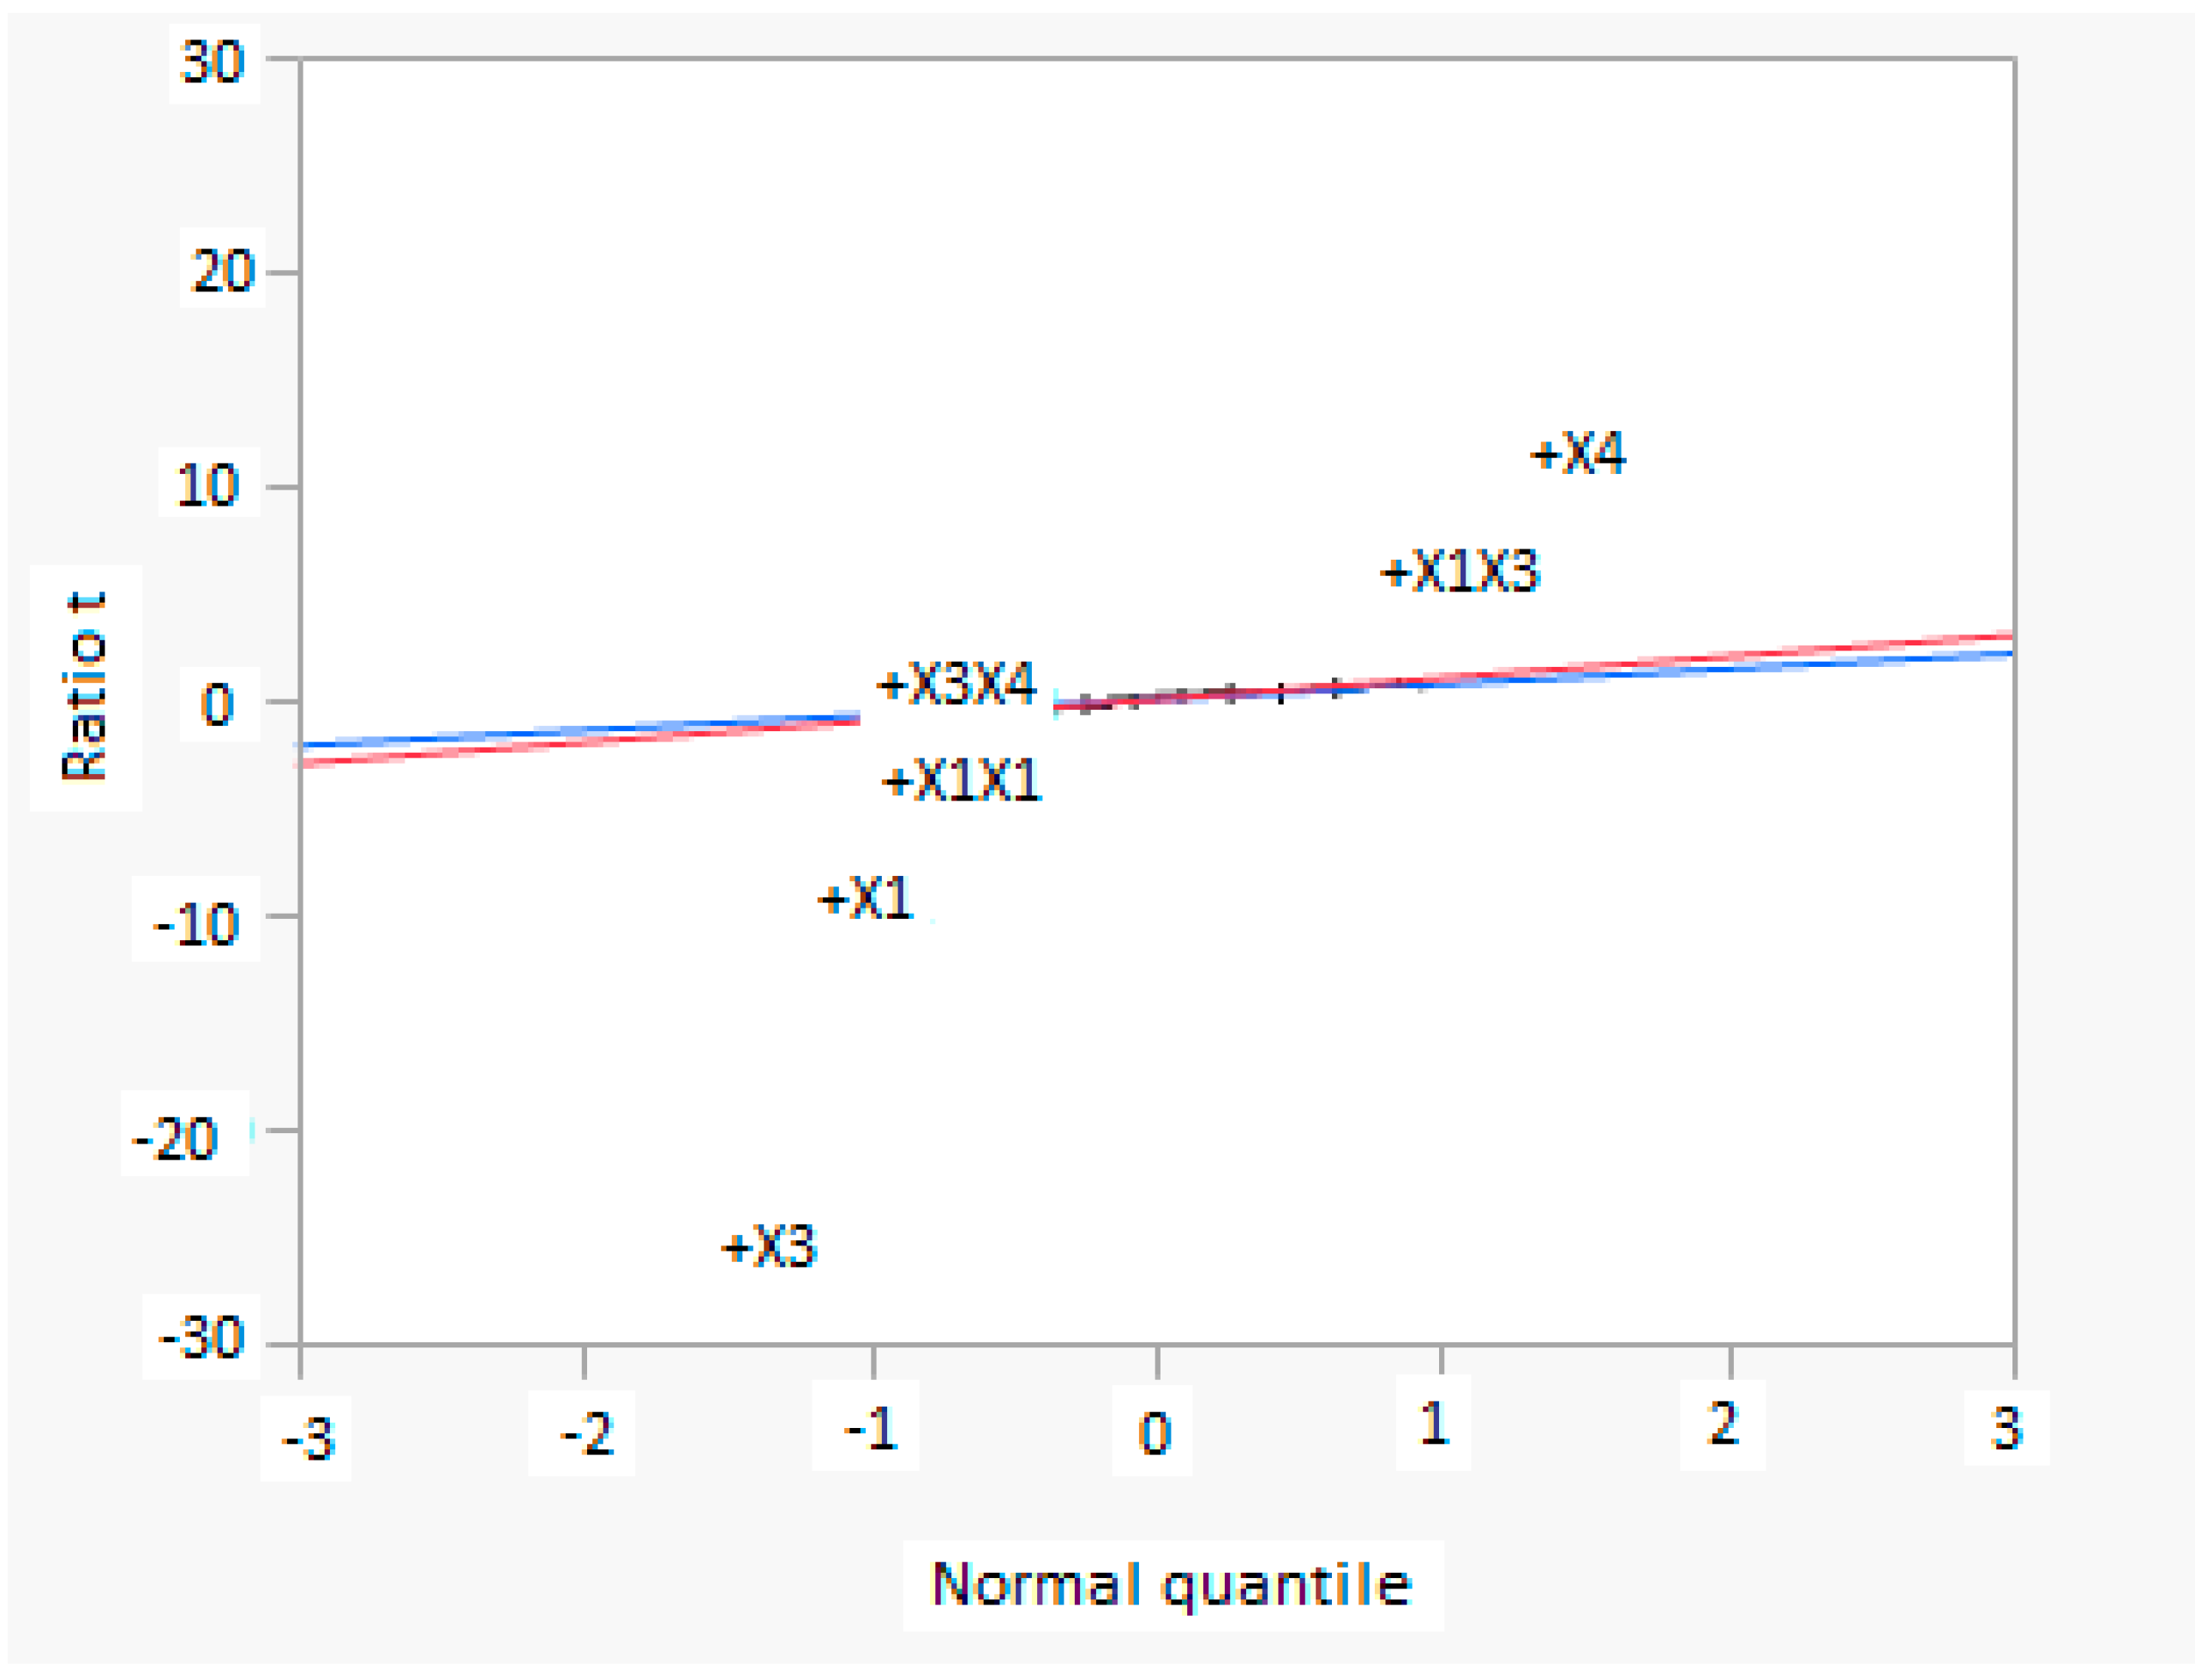
Figure 9.
(a) Response surface plot of the methanol production and residues versus factor X1 (reaction temperature) and factor X3 (H2/CO2 ratio); (b) Response surface plot of the methanol production and residues versus factor X4 (the recycle of produced stream) and factor X1 (reaction temperature).
Figure 9.
(a) Response surface plot of the methanol production and residues versus factor X1 (reaction temperature) and factor X3 (H2/CO2 ratio); (b) Response surface plot of the methanol production and residues versus factor X4 (the recycle of produced stream) and factor X1 (reaction temperature).
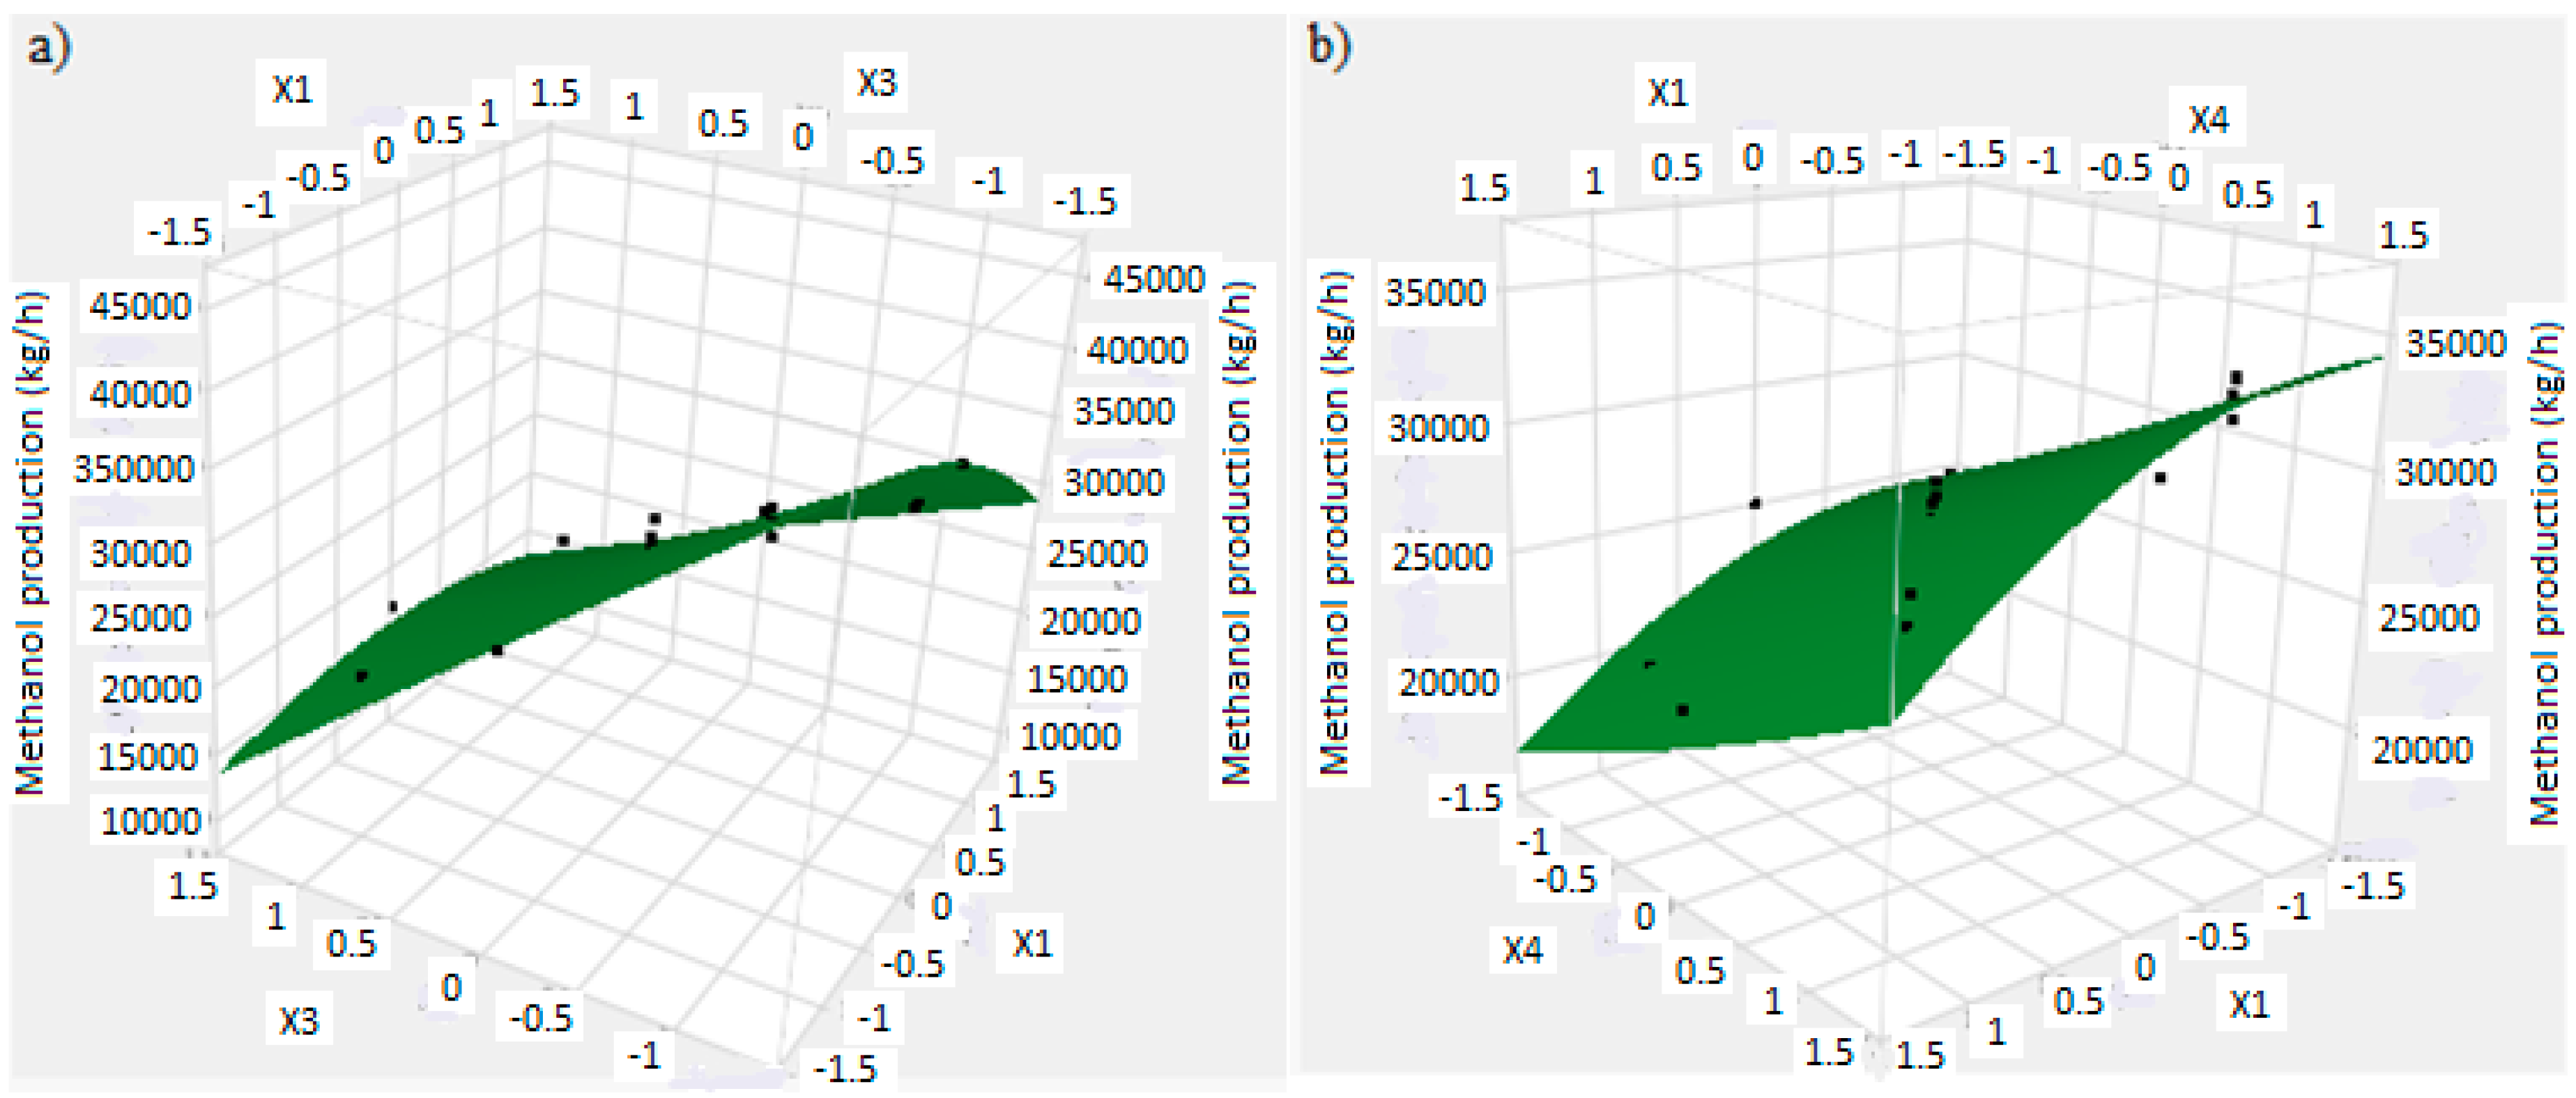
Figure 10.
Isometric profile for the methanol production according to (a) factor X1 (reaction temperature) and factor X3 (H2/CO2 ratio) while factor X4 (the recycle of produced stream) is at 0 level; (b) factor X1 (reaction temperature) and factor X4 (the recycle of produced stream) while factor X3 (H2/CO2 ratio) is set at the higher level.

Table 1.
Pre-exponential factor (A) and activation energy (Ea) for reaction 1: CO + 2H2↔CH3OH, reaction 2: CO2 + H2↔CO + H2O, reaction 3: CO2 + 3H2↔CH3OH + H2O involved in methanol synthesis.
Table 1.
Pre-exponential factor (A) and activation energy (Ea) for reaction 1: CO + 2H2↔CH3OH, reaction 2: CO2 + H2↔CO + H2O, reaction 3: CO2 + 3H2↔CH3OH + H2O involved in methanol synthesis.
| Reaction | A (s−1) | Ea (J/mol) |
|---|---|---|
| 1 | 7.31 ×10¹⁰ | 1.23 × 10⁵ |
| 2 | 2.90 × 10⁷ | 1.10 × 10⁵ |
| 3 | 4.36 × 10² | 6.52 × 10⁴ |
Table 2.
Values of parameters A and B in the expression of equilibrium constant for reaction 1: CO + 2H2↔CH3OH, reaction 2: CO2 + H2↔CO + H2O, reaction 3: CO2 + 3H2↔CH3OH + H2O involved in methanol synthesis.
Table 2.
Values of parameters A and B in the expression of equilibrium constant for reaction 1: CO + 2H2↔CH3OH, reaction 2: CO2 + H2↔CO + H2O, reaction 3: CO2 + 3H2↔CH3OH + H2O involved in methanol synthesis.
| Reaction | A | B |
|---|---|---|
| 1 | −2073 | 2.029 |
| 2 | 5139 | −12.621 |
| 3 | 3066 | −14.65 |
Table 3.
Factors and values of levels chosen in the factorial design of ANOVA analysis.
| Code | Factors | Levels | |
|---|---|---|---|
| (−) | (+) | ||
| A | Reaction temperature (K) | 473 | 573 |
| B | Reaction pressure (bar) | 50 | 100 |
| C | H2/CO2 ratio | 1 | 3 |
| D | The recycle of produced stream | no | yes |
Table 4.
Results of ANOVA analysis considering the response of methanol production.
| Trial | Methanol Production (kg/h) | Effect (kg/h) | Sum of Square | F-Value | p-Value | Significance |
|---|---|---|---|---|---|---|
| (1) | 34,108 | |||||
| a | 26,181 | −5700 | 1.30 × 10⁸ | 128.98 | 0.00146 | 100% |
| b | 34,113 | 332.5 | 4.42 × 10⁵ | 0.44 | 0.54388 | 46% |
| ab | 25,915 | 346 | 4.79 × 10⁵ | 0.48 | 0.52849 | 47% |
| c | 17,289 | −15678 | 9.83 × 10⁸ | 975.79 | 0.00001 | 100% |
| ac | 14,371 | 3337.5 | 4.46 × 10⁷ | 44.22 | 0.00266 | 100% |
| bc | 17,285 | 481 | 9.25 × 10⁵ | 0.92 | 0.39215 | 61% |
| abc | 14,250 | 494 | 9.76 × 10⁵ | 0.97 | 0.38071 | 62% |
| d | 43,178 | 6692 | 1.79 × 10⁸ | 177.78 | 0.00018 | 100% |
| ad | 33,326 | −180.5 | 1.30 × 10⁵ | 0.13 | 0.73730 | 26% |
| bd | 43,172 | 429 | 7.36 × 10⁵ | 0.73 | 0.44086 | 56% |
| abd | 32,999 | 443 | 7.85 × 10⁵ | 0.78 | 0.42728 | 57% |
| cd | 21,992 | −1397.5 | 7.81 × 10⁶ | 7.75 | 0.04959 | 95% |
| acd | 18,505 | 794.5 | 2.52 × 10⁶ | 2.51 | 0.18859 | 81% |
| bcd | 21,943 | 447 | 7.99 × 10⁵ | 0.79 | 0.42346 | 58% |
| abcd | 21,933 | 455.5 | 8.30 × 10⁵ | 0.82 | 0.41544 | 58% |
Table 5.
Results of ANOVA analysis considering the response of reactor volume.
| Trial | Reactor Volume (m3) | Effect (m3) | Sum of Square | F-Value | p-Value | Significance |
|---|---|---|---|---|---|---|
| (1) | 115 | |||||
| a | 4.63 | −150.83 | 9.10 × 10⁴ | 4058.65 | 0.0000004 | 100% |
| b | 109 | −4.02 | 6.45 × 101 | 2.88 | 0.1652 | 83% |
| ab | 4.37 | 2.02 | 1.63 × 101 | 0.73 | 0.4416 | 56% |
| c | 150.9 | 23.27 | 2.17 × 10³ | 96.61 | 0.0006 | 100% |
| ac | 6.2 | −22.99 | 2.11 × 10³ | 94.30 | 0.0006 | 100% |
| bc | 141.4 | −0.16 | 1.06 × 10⁻¹ | 0.005 | 0.9486 | 5% |
| abc | 5.8 | −1.53 | 9.33 | 0.42 | 0.5539 | 45% |
| d | 158.8 | 27.51 | 3.03 × 10³ | 135.00 | 0.0003 | 100% |
| ad | 6.4 | −27.00 | 2.92 × 10³ | 130.09 | 0.0003 | 100% |
| bd | 150 | 0.02 | 2.50 × 10⁻³ | 0.0001 | 0.9921 | 1% |
| abd | 6.05 | −1.69 | 1.14 × 101 | 0.51 | 0.5148 | 49% |
| cd | 212.69 | 5.45 | 1.19 × 10² | 5.29 | 0.0829 | 92% |
| acd | 8.77 | −6.66 | 1.78 × 10² | 7.93 | 0.0481 | 95% |
| bcd | 212.85 | 0.75 | 2.24 | 0.10 | 0.7680 | 23% |
| abcd | 1.8 | −2.37 | 2.24 × 101 | 1.00 | 0.3739 | 63% |
Table 6.
Factors and values of the levels chosen in central composite design.
| Code | Factors | Levels | ||||
|---|---|---|---|---|---|---|
| −2 | −1 | 0 | 1 | 2 | ||
| A | Reaction temperature (K) | 423 | 473 | 523 | 573 | 623 |
| B | Reaction pressure (bar) | 25 | 50 | 75 | 100 | 125 |
| C | H2/CO2 ratio | 0.8 | 1 | 1.5 | 3 | 3.2 |
| D | The recycle of produced stream | purge | no | 5% | yes | 20% |
Table 7.
Results of statistical analysis of evaluated parameters in central composite design (CCD) (X1 = reaction temperature in K, X2 = reaction pressure in bar, X3 = H2/CO2 ratio, X4 = the recycle of produced stream).
Table 7.
Results of statistical analysis of evaluated parameters in central composite design (CCD) (X1 = reaction temperature in K, X2 = reaction pressure in bar, X3 = H2/CO2 ratio, X4 = the recycle of produced stream).
| Parameter | Estimate | Standard Error | Sum of Square | F-Ratio | p-Value | Status |
|---|---|---|---|---|---|---|
| X1 | −2717.75 | 725.66 | 1.51 × 10⁸ | 83.8758 | 0 | Significant |
| X2 | 130.56 | 296.74 | 3.48 × 10⁵ | 0.1936 | 0.6684 | Not Significant |
| X3 | −7715.95 | 296.74 | 1.21 × 10⁹ | 676.12 | 0 | Significant |
| X4 | 3089.59 | 296.74 | 1.95 × 10⁸ | 108.4 | 0 | Significant |
| X1X2 | 173 | 335.03 | 4.79 × 10⁵ | 0.2666 | 0.6158 | Not Significant |
| X1X3 | 1668.75 | 335.03 | 4.46 × 10⁷ | 24.8 | 0.00041 | Significant |
| X1X4 | −90.25 | 335.03 | 1.30 × 10⁵ | 0.0726 | 0.7926 | Not Significant |
| X2X3 | 240.5 | 335.03 | 9.25 × 10⁵ | 0.5153 | 0.48782 | Not Significant |
| X2X4 | 214.5 | 335.03 | 7.36 × 10⁵ | 0.4099 | 0.53513 | Not Significant |
| X3X4 | −698.75 | 335.03 | 7.81 × 10⁶ | 4.3498 | 0.0611 | Not Significant |
| X1X1 | −1078.74 | 431.12 | 1.12 × 10⁷ | 6.2586 | 0.02942 | Significant |
| X2X2 | 63.836 | 431.12 | 3.94 × 10⁴ | 0.0219 | 0.8849 | Not Significant |
| X3X3 | −100.62 | 431.12 | 9.78 × 10⁴ | 0.0545 | 0.81973 | Not Significant |
| X4X4 | 152.55 | 431.12 | 2.25 × 10⁵ | 0.1252 | 0.73014 | Not Significant |
© 2017 by the author. Licensee MDPI, Basel, Switzerland. This article is an open access article distributed under the terms and conditions of the Creative Commons Attribution (CC BY) license (http://creativecommons.org/licenses/by/4.0/).
Share and Cite
MDPI and ACS Style
Leonzio, G. Optimization through Response Surface Methodology of a Reactor Producing Methanol by the Hydrogenation of Carbon Dioxide. Processes 2017, 5, 62. https://doi.org/10.3390/pr5040062
AMA Style
Leonzio G. Optimization through Response Surface Methodology of a Reactor Producing Methanol by the Hydrogenation of Carbon Dioxide. Processes. 2017; 5(4):62. https://doi.org/10.3390/pr5040062
Chicago/Turabian StyleLeonzio, Grazia. 2017. "Optimization through Response Surface Methodology of a Reactor Producing Methanol by the Hydrogenation of Carbon Dioxide" Processes 5, no. 4: 62. https://doi.org/10.3390/pr5040062
Note that from the first issue of 2016, this journal uses article numbers instead of page numbers. See further details here.