1. Introduction
Process industries, like other industrial sectors, are compelled by the market and the regulatory norms to operate more and more efficiently. This means better product quality, higher production, fulfilment of environmental legislation, etc., with better use of resources and minimum cost. Achievement of all these aims requires, among other things, proper use of the resources and assets as well as better production management. This is why, increasingly, the topics and methods related to production optimization are gaining attention in industry. Once the basic automation layer is in operation in a factory, so that production reaches a certain degree of stability and adequate information from the process is available, the next logical step is to move up in the management of the process. This can be done, first, by enhancing the control layer to take care of interactions, constraints and future consequences of current actions in the operation of the process units, that is, incorporating Model Predictive control (MPC), and, in a second step, trying to find out the best operating conditions, considering not only technical aspects, but also the economy of the process. This requires a more global vision than considering in isolation the operation of the individual process units, because what can be good from the point of view of a specific process may not be so good for the whole factory. Real-Time Optimization (RTO) uses, such as global view, try to incorporate different aspects and interrelations among processes in a model in order to compute operational decisions that optimize process efficiency and economy.
Both layers, MPC and RTO, have different targets and normally they use different types of models, linear dynamic models in the case of MPC and non-linear first principles ones in the RTO, but they are not independent. Normally, RTO is placed on top of MPC, computing optimal values of key variables that later on are passed as set points to the MPC in a cascade structure. This architecture assumes that there exists an optimum steady state that the MPC must follow, which can be a sensible assumption in many cases. Nevertheless, it also happens quite often that, due to the plant scale or complex dynamics involved or because of the presence of significant disturbances, the plant is rarely at steady state, so some alternatives have to be used. Of course, in many cases, one can formulate a dynamic RTO, or an MPC with an economic target, merging dynamic control with economic target optimization as in [
1,
2], and in fact they are examples of very large dynamic optimization problems solved efficiently with state-of-the-art software and methodology [
3]. However, this formulation may present stability problems and, in other cases, the computational load and the difficulties of estimating properly the process states may render the approach not very adequate for real-time operation.
In addition, other factors that contribute to the difficulties of industrial implementation of the RTO/MPC architecture are the fact that large RTO, based on rigorous models, are difficult to keep up-to-date and there is a lack of resources in industry to maintain these applications, due to limited number of qualified personnel, to the relatively frequent changes and revamping in the process and to the intrinsic difficulties of the task that is time consuming and rather specialized. The reference [
4] gives a good summary of these problems. However, the benefits of RTO normally repay the efforts, not only in terms of the gains obtained through its on-line implementation, but because of other side benefits, such as improved process information, detection of groups of constraints that limit the possibility of reaching the targets, reliable feedback to upper production layers (planning), etc.
All these elements have to be taken into account when defining the approach and the implementation of the system, exploring, besides the traditional cascade RTO/MPC, other flexible alternatives in which the possibilities offered by available commercial technology have to be considered, as they provide integrated local Linear Programming (LP) based optimization with predictive multivariable controllers [
5]. In the same way, one should consider the options that sometimes appear for carrying out similar solutions as the ones computed by the RTO with a specially designed control system, in line with the self-optimizing approach [
6].
Besides integration of RTO with the lower layer represented by MPC, successful implementations of real-time optimization systems have to take into account that RTO normally only covers certain aspects of the operation of a large-scale process plant. In fact, there are many elements related to what should be produced or when it should be produced and at what price, that concern to the upper layer of plant planning. Then, RTO should operate in the framework and global aims defined by the planning layer of the company, receiving production aims, prices and constraints imposed by other parts of the process, that have to be considered by the RTO and MPC. This aspect concerns the information flow from top to lower layers of the control hierarchy, but additional benefits can be obtained by considering also the opposite flow by better feedback of the results of the operation to the planning layer, helping to correct gaps between what is planned and what is achieved in practice and detecting the active constraints whose removal can improve production and efficiency in a significant way.
This paper deals with these topics, presenting a large-scale optimization problem related to the management of the hydrogen distribution network of an oil refinery and discussing its real-time implementation.
Hydrogen has become an important and expensive utility required in many new processes in oil refineries for breaking long hydrocarbon chains into lighter and more valuable products and for removal of Sulphur and aromatics in order to comply with environmental legislation. Hydrogen, either imported or produced in-house, is distributed by means of a network from producer to consumer plants. In consumer plants, hydrogen is mainly used as a reactant for desulfurization, de-nitrification and de-aromatization of naphtha and diesel, in order to avoid generating acid gases when used as heating fuel or in combustion engines, thus avoiding atmosphere pollution.
In recent years, when heavier fuels are being processed and also due to more strict environmental regulations, hydrogen requirements have experienced a steady increase, gaining significant importance in the refinery global economic balance. An efficient use of H2 in the daily operation is desired not only for its high production cost, but also because the economic penalty is even higher in scenarios where hydrogen production capacity is the bottleneck for oil processing capacity. Nevertheless, decisions related to hydrogen management are not easy as there are many interrelated plants and constraints involved in the operation of the network, not only from a modelling and optimization perspective, but also from a practical point of view because, quite often, several operators in different control rooms are in charge.
The approach to deal with the hydrogen network optimal management is driven by an operational framework where hydrogen production must always exceed consumption, with reactors operating with excess hydrogen, because hydrogen deficit is extremely damaging for catalysts which are very expensive and accumulation in a buffer vessel is not sensible. One of the main problems to perform appropriate decisions regarding the management of hydrogen networks is the lack of information on many variables and the uncertainty associated with the existing measurements. Because of this, data reconciliation has been used as a way to estimate unknown magnitudes and to correct inconsistencies in the data, before a model based optimization procedure could be applied to determine the best use of hydrogen in the network.
The optimal management of hydrogen in oil refineries has been studied mainly from a design viewpoint as in [
7], as well as integrated with other utility systems in the refinery operation, as in [
8], but has received less attention from the perspective of real-time operation and control.
This paper tries to contribute to the automated optimal operation of the hydrogen networks in oil refineries and is organized as follows: First, the process is described in
Section 2, showing the architecture, operation and targets of the main plants and the functioning of the network as a whole. Next,
Section 3 presents a Data Reconciliation and Real-Time Optimization system developed with the purpose of achieving the optimal management of the hydrogen network. Then,
Section 4 is devoted to discussing the ways in which the system is implemented in the refinery, in particular through the use of a predictive Dynamic Matrix Controller (DMC) operating on several H
2 production and consumption plants. Finally,
Section 5 presents and evaluates the results achieved, as well as the integration of the operation of RTO and MPC layers as a decision Support System (DSS) supervising the network performance. To conclude, the Discussion section centers on the future perspectives and challenges of process optimization.
2. Process Description
The process taken as reference is the refinery of Petronor, a company of the Repsol group located in Muskiz, in northern Spain. The refinery processes crude oil in standard distillation circuits but, as with many other modern installations, incorporates additional ones as well. Among them, conversion units transform heavy hydrocarbons into more valuable light ones, besides other units dedicated to the removal of Sulphur from the processed products in order to comply with the environmental legislation. Both conversion and desulphurization processes use hydrogen as raw material of the chemical reactions involved, so this product has become one of the most important utilities in a petrol refinery.
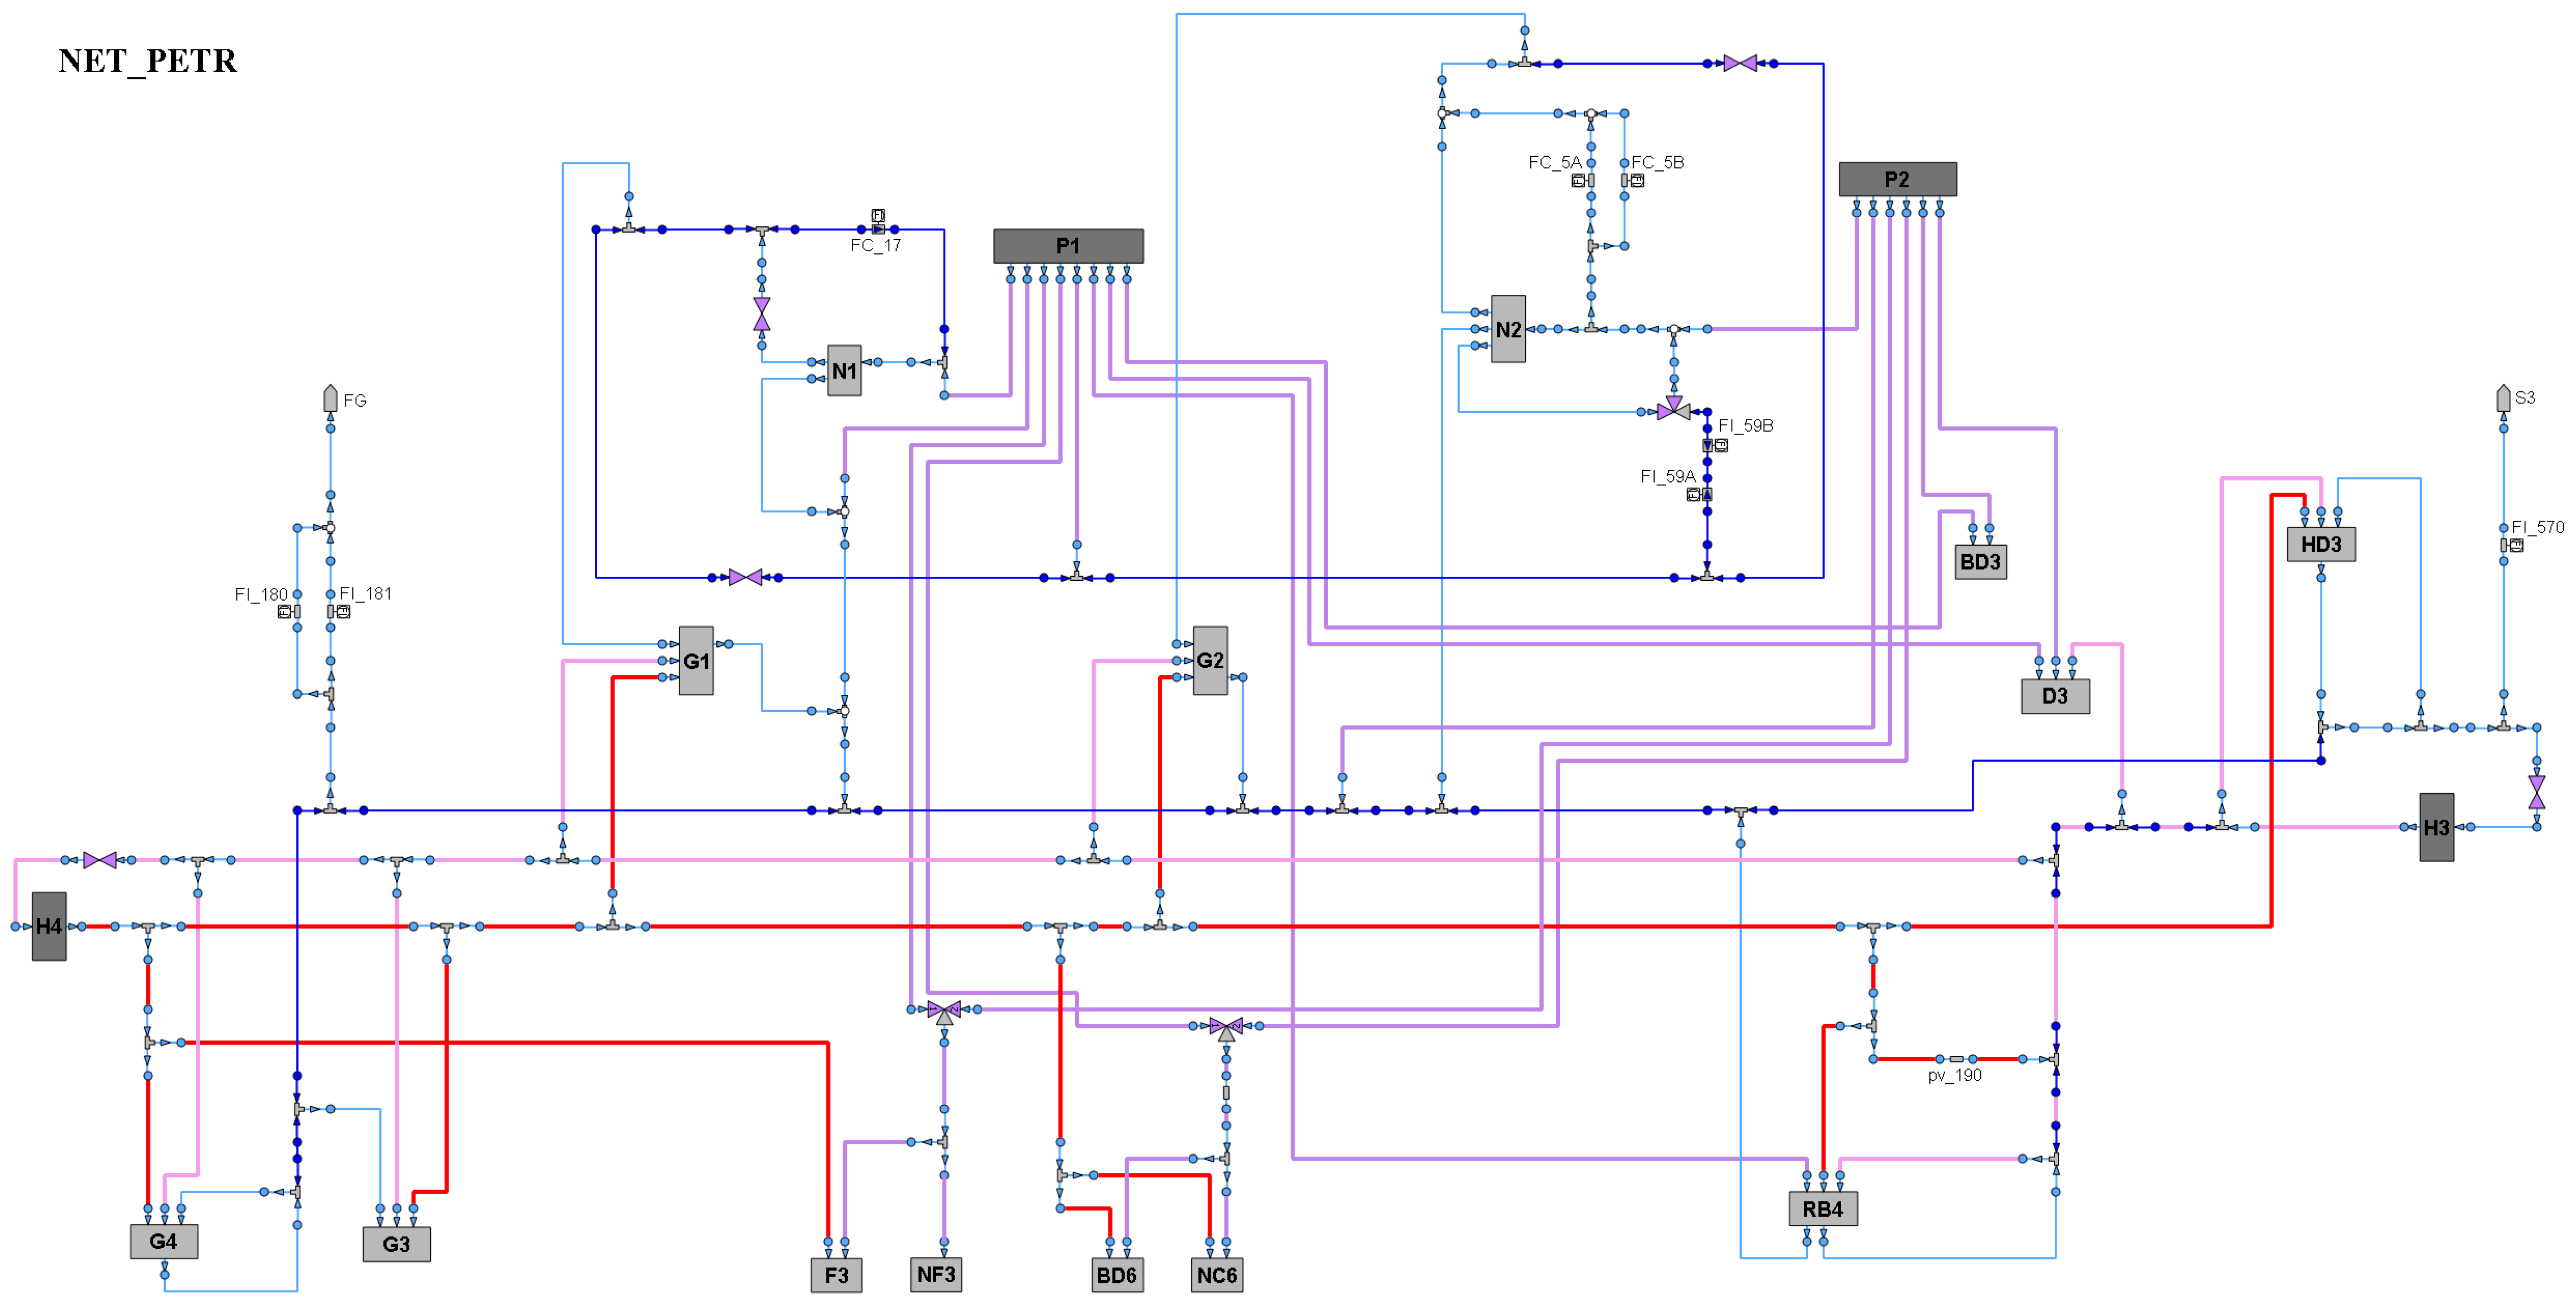
High purity hydrogen is produced in steam-reforming furnaces in two plants, named H3 and H4, in the refinery under consideration. Additionally, two platformer plants (P1 and P2) generate lower purity hydrogen as a byproduct of the catalytic reforming process, which increases the octane number of naphtha. From these four plants, hydrogen is distributed to the consumer ones using several interconnected networks at different purities and pressures, as can be seen in the schematic of
Figure 1. The network interconnects a total of eighteen plants, four producers and fourteen consumers.
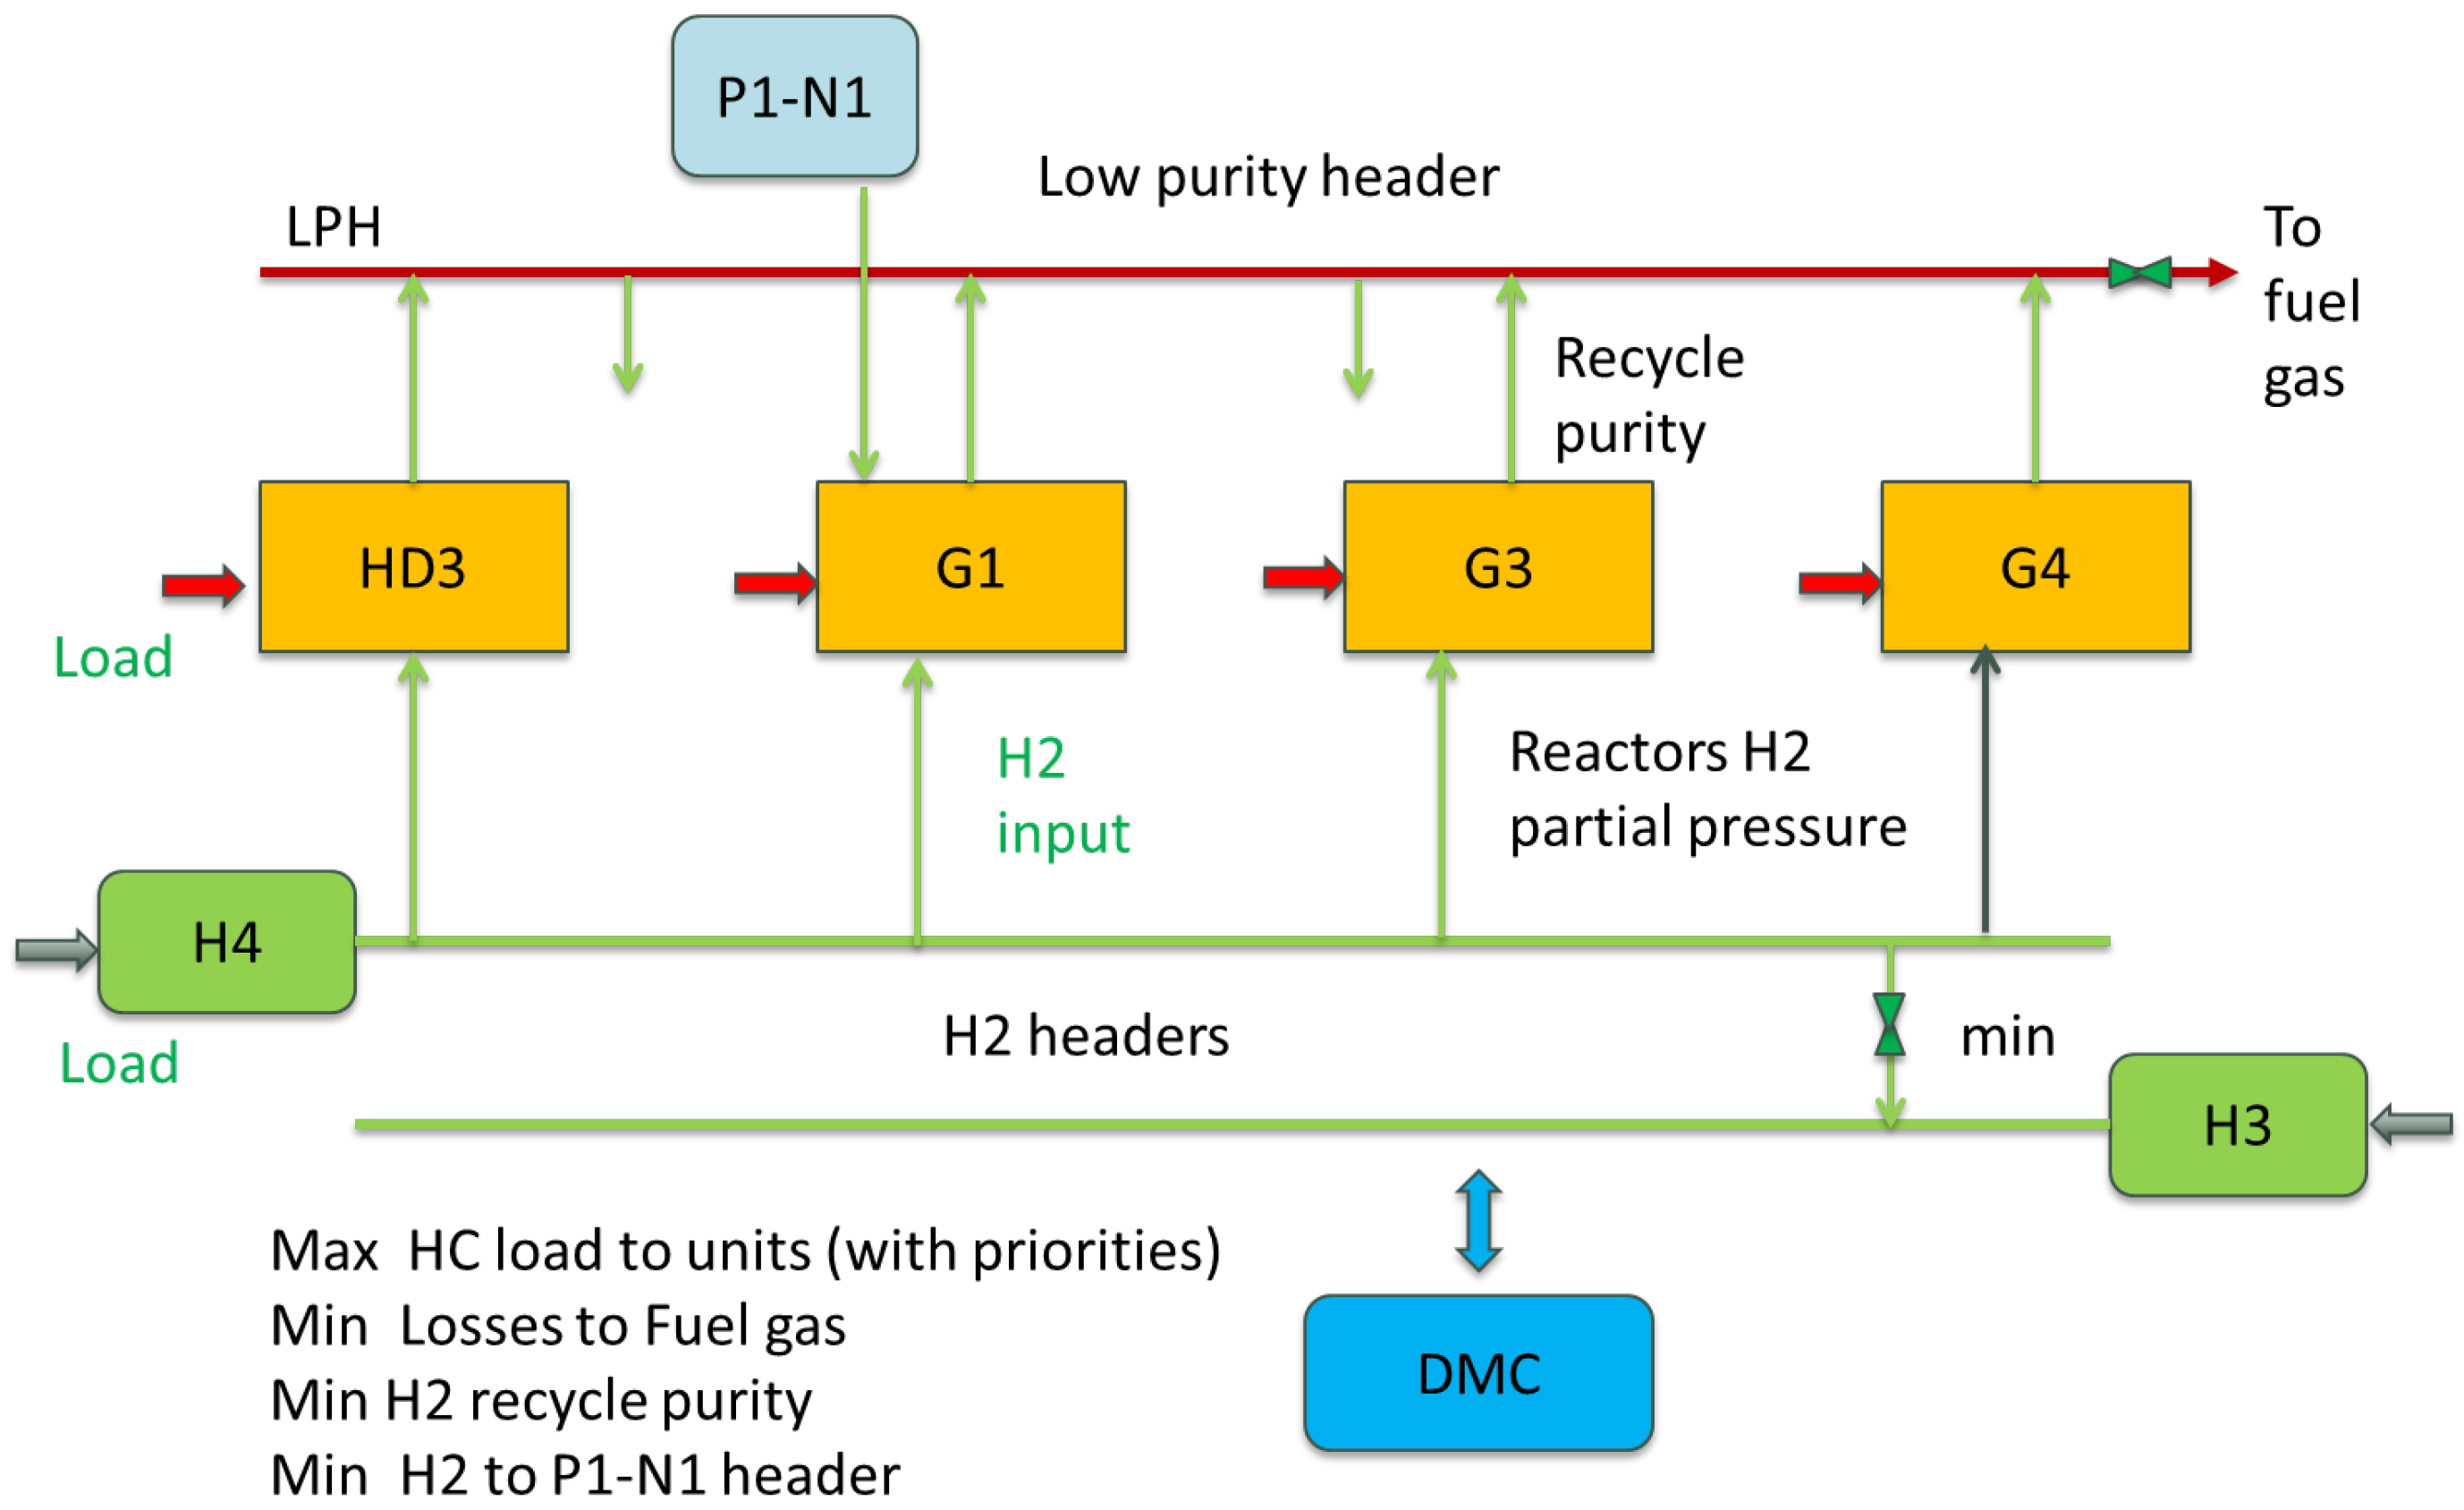
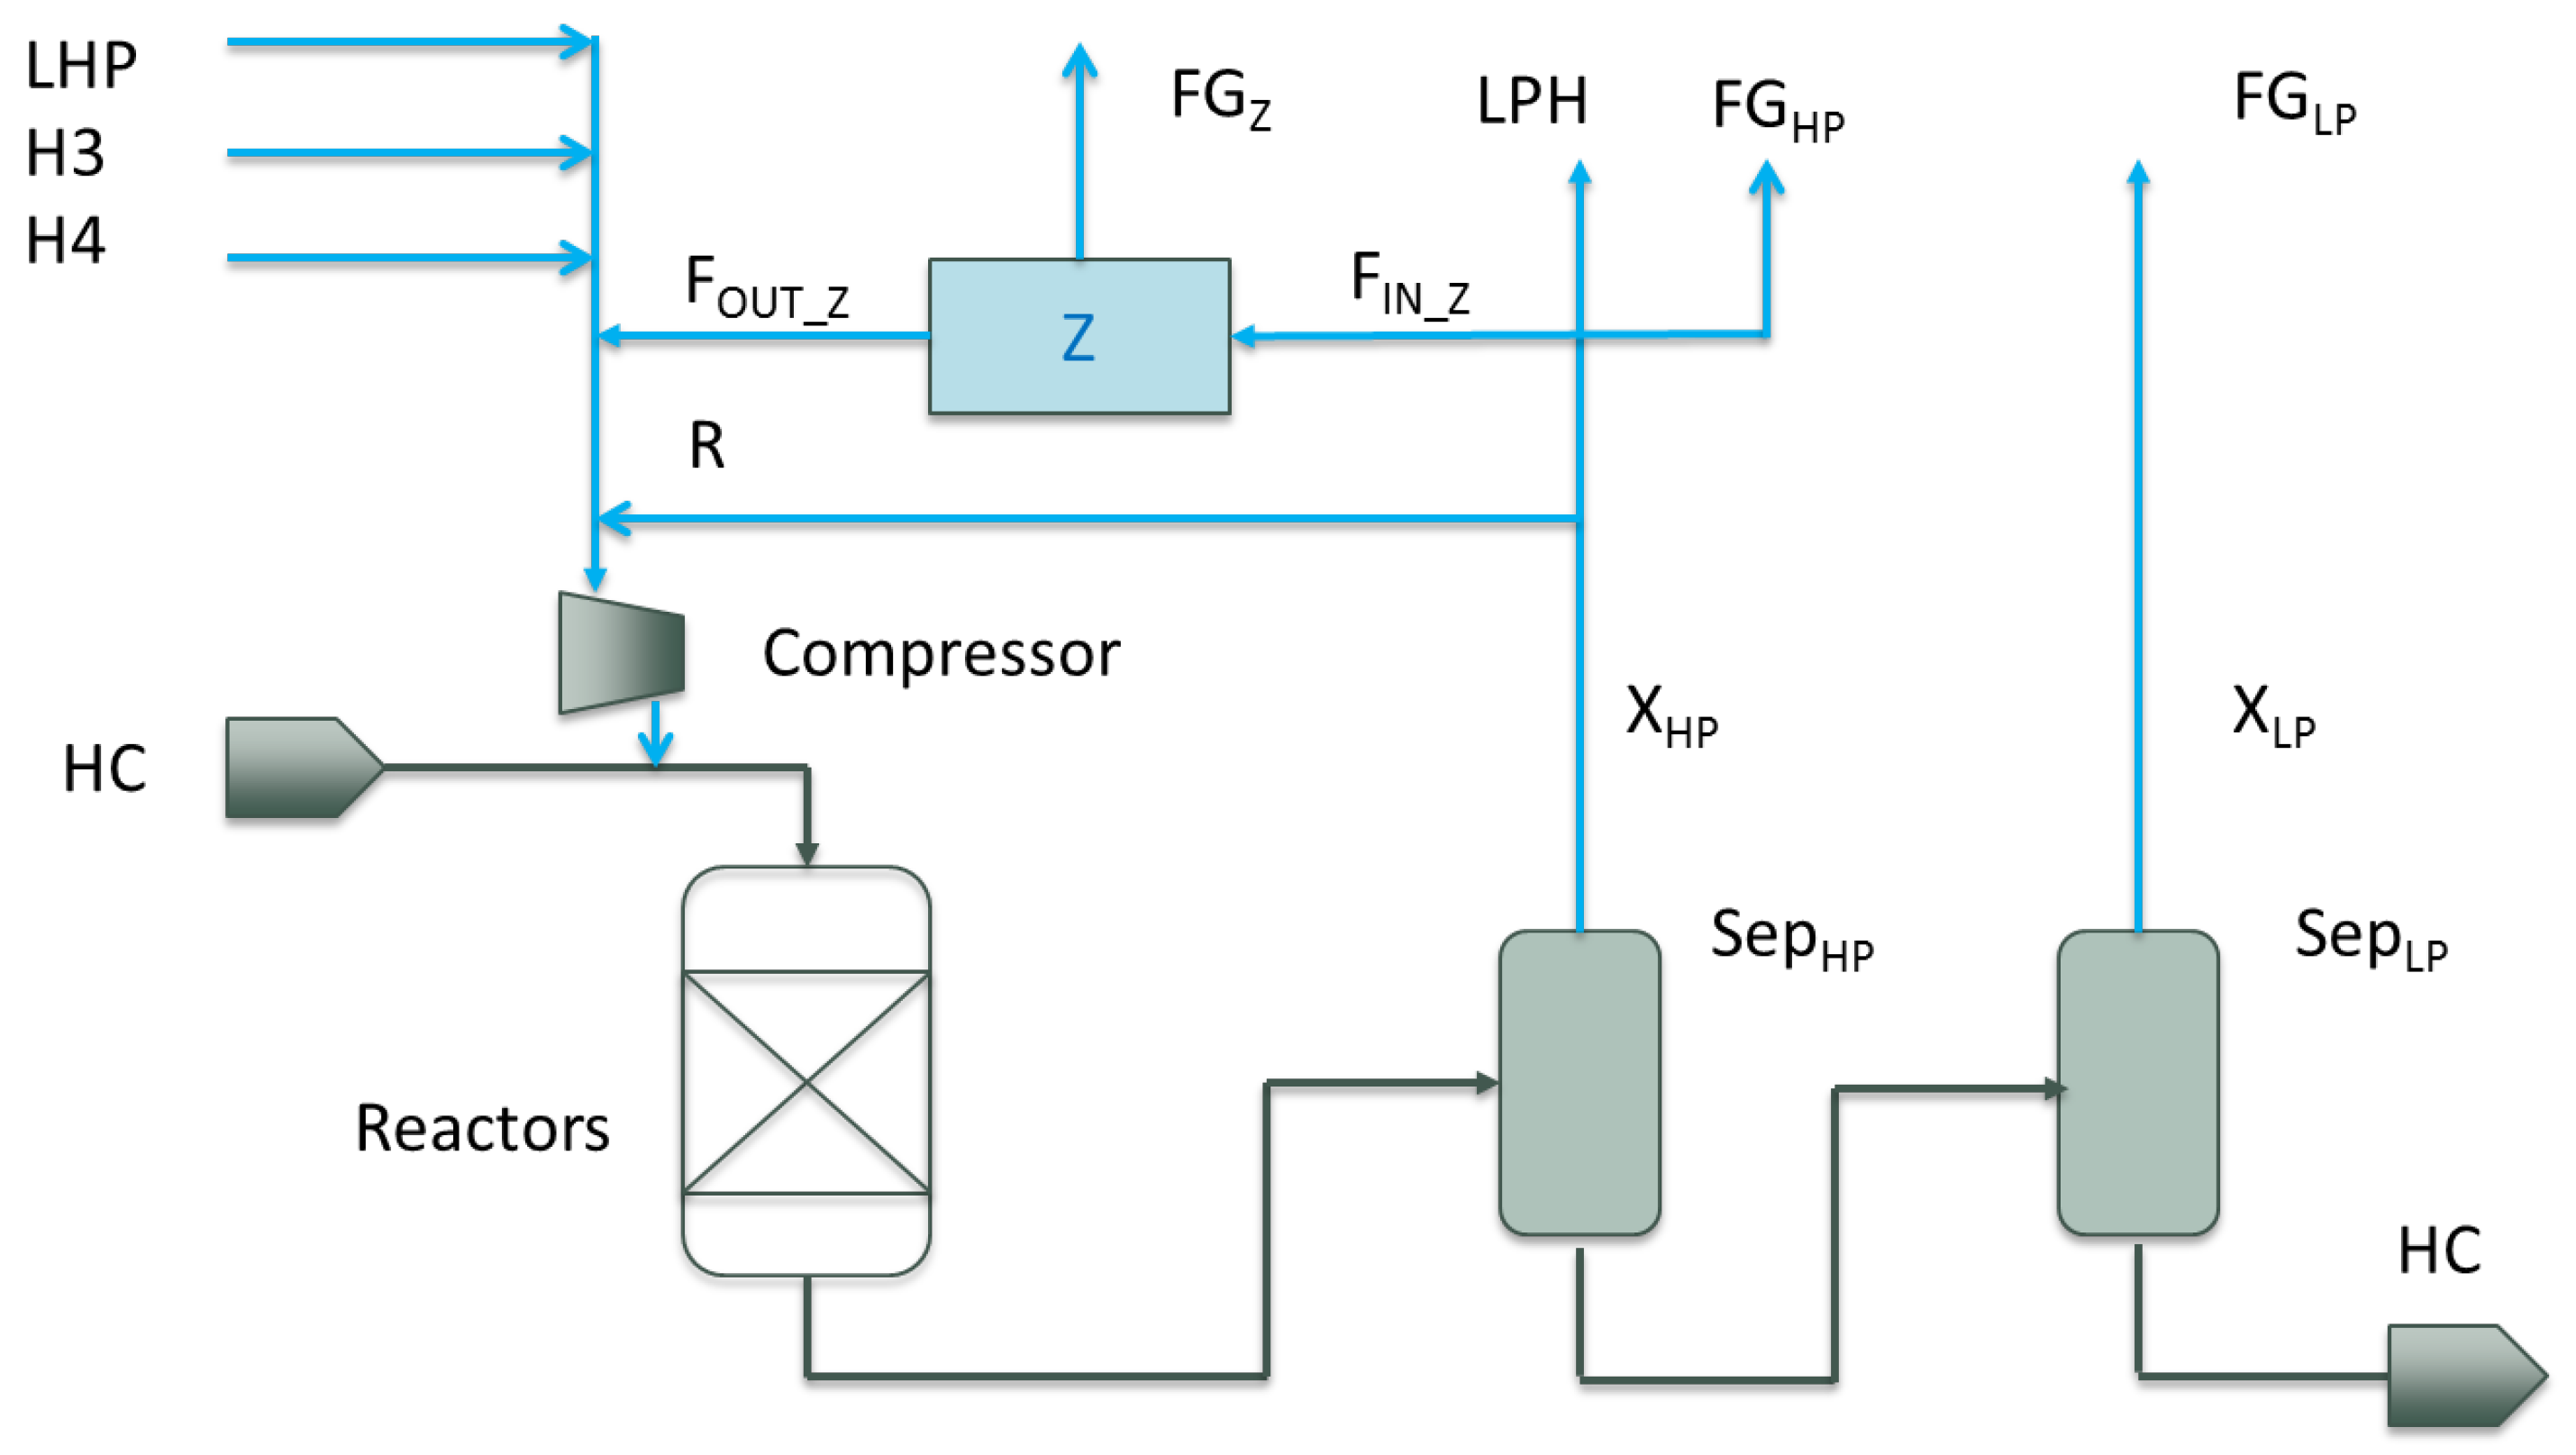
A simplified schematic of a typical consumer plant can be seen in
Figure 2, in this case a hydrodesulphurization one (HDS) dedicated to the removal of Sulphur from its hydrocarbon feed. Before entering the reactors, the hydrocarbon feed (HC) (black lines) is mixed with hydrogen (blue lines) coming from the distribution network: in the diagram from two producer plants (H4 and H3) and the Low Purity distribution Header (LPH), as well as with recycled hydrogen streams (R, F
OUT_Z). This mixture reacts endothermically under high temperature in the reactors where sulfur is converted into hydrogen sulfide H
2S, which can be removed later on by absorption on an amine solution. It is important to remark that the feed to the reactors must contain an excess of hydrogen required to prevent shortening the life of the expensive catalysts. As a consequence of this, the reactor output has still surplus hydrogen. In addition, other light end gases generated in the reactor are also present in the mixture (a mixture of CH
4, C
2H
6, C
3H
8 and other gases) which are considered as impurities.
Hydrogen and light ends are separated from the treated hydrocarbon stream in high-pressure separation units (Sep
HP). Most of the hydrogen rich gas from the HP separator, with purity X
HP, is recycled (R) into the reactor inlet, but a certain HP purge is usually needed to avoid the accumulation of light ends in the system, either to the Fuel-gas (FG
HP) network of the refinery, where the gases are burnt in furnaces, or to the Low Purity distribution Header (LPH) to be reused later on. Also, some of the recycled hydrogen (F
IN_Z) can be fed to a set of membranes (Z) in order to increase its purity, with the low purity retentate flow (FG
Z) being sent to the fuel gas network. Referring to
Figure 2, the hydrocarbon outflow of the high-pressure separators still contains hydrogen that is further removed in medium or low pressure separation units (Sep
LP), but this hydrogen is sent to the fuel gas network (FG
LP) due to its low purity (X
LP) that prevents it from being reused in the reactors in a profitable way.
The hydrogen purity at the reactors’ input depends on the ratio of flow rates coming from the different producer plants (H3, H4, P1, P2), distribution headers (e.g., low-purity header LPH) and recycles, with the mixture having to satisfy several operational constraints, that must be achieved by proper management of the plant.
Thus, from the point of view of the hydrogen network, these plants operate with a feed of hydrogen from different sources that is partially consumed in the reactors, partially sent to the Fuel Gas (FG) network and partially reused, either internally or recycled from the low purity header LPH.
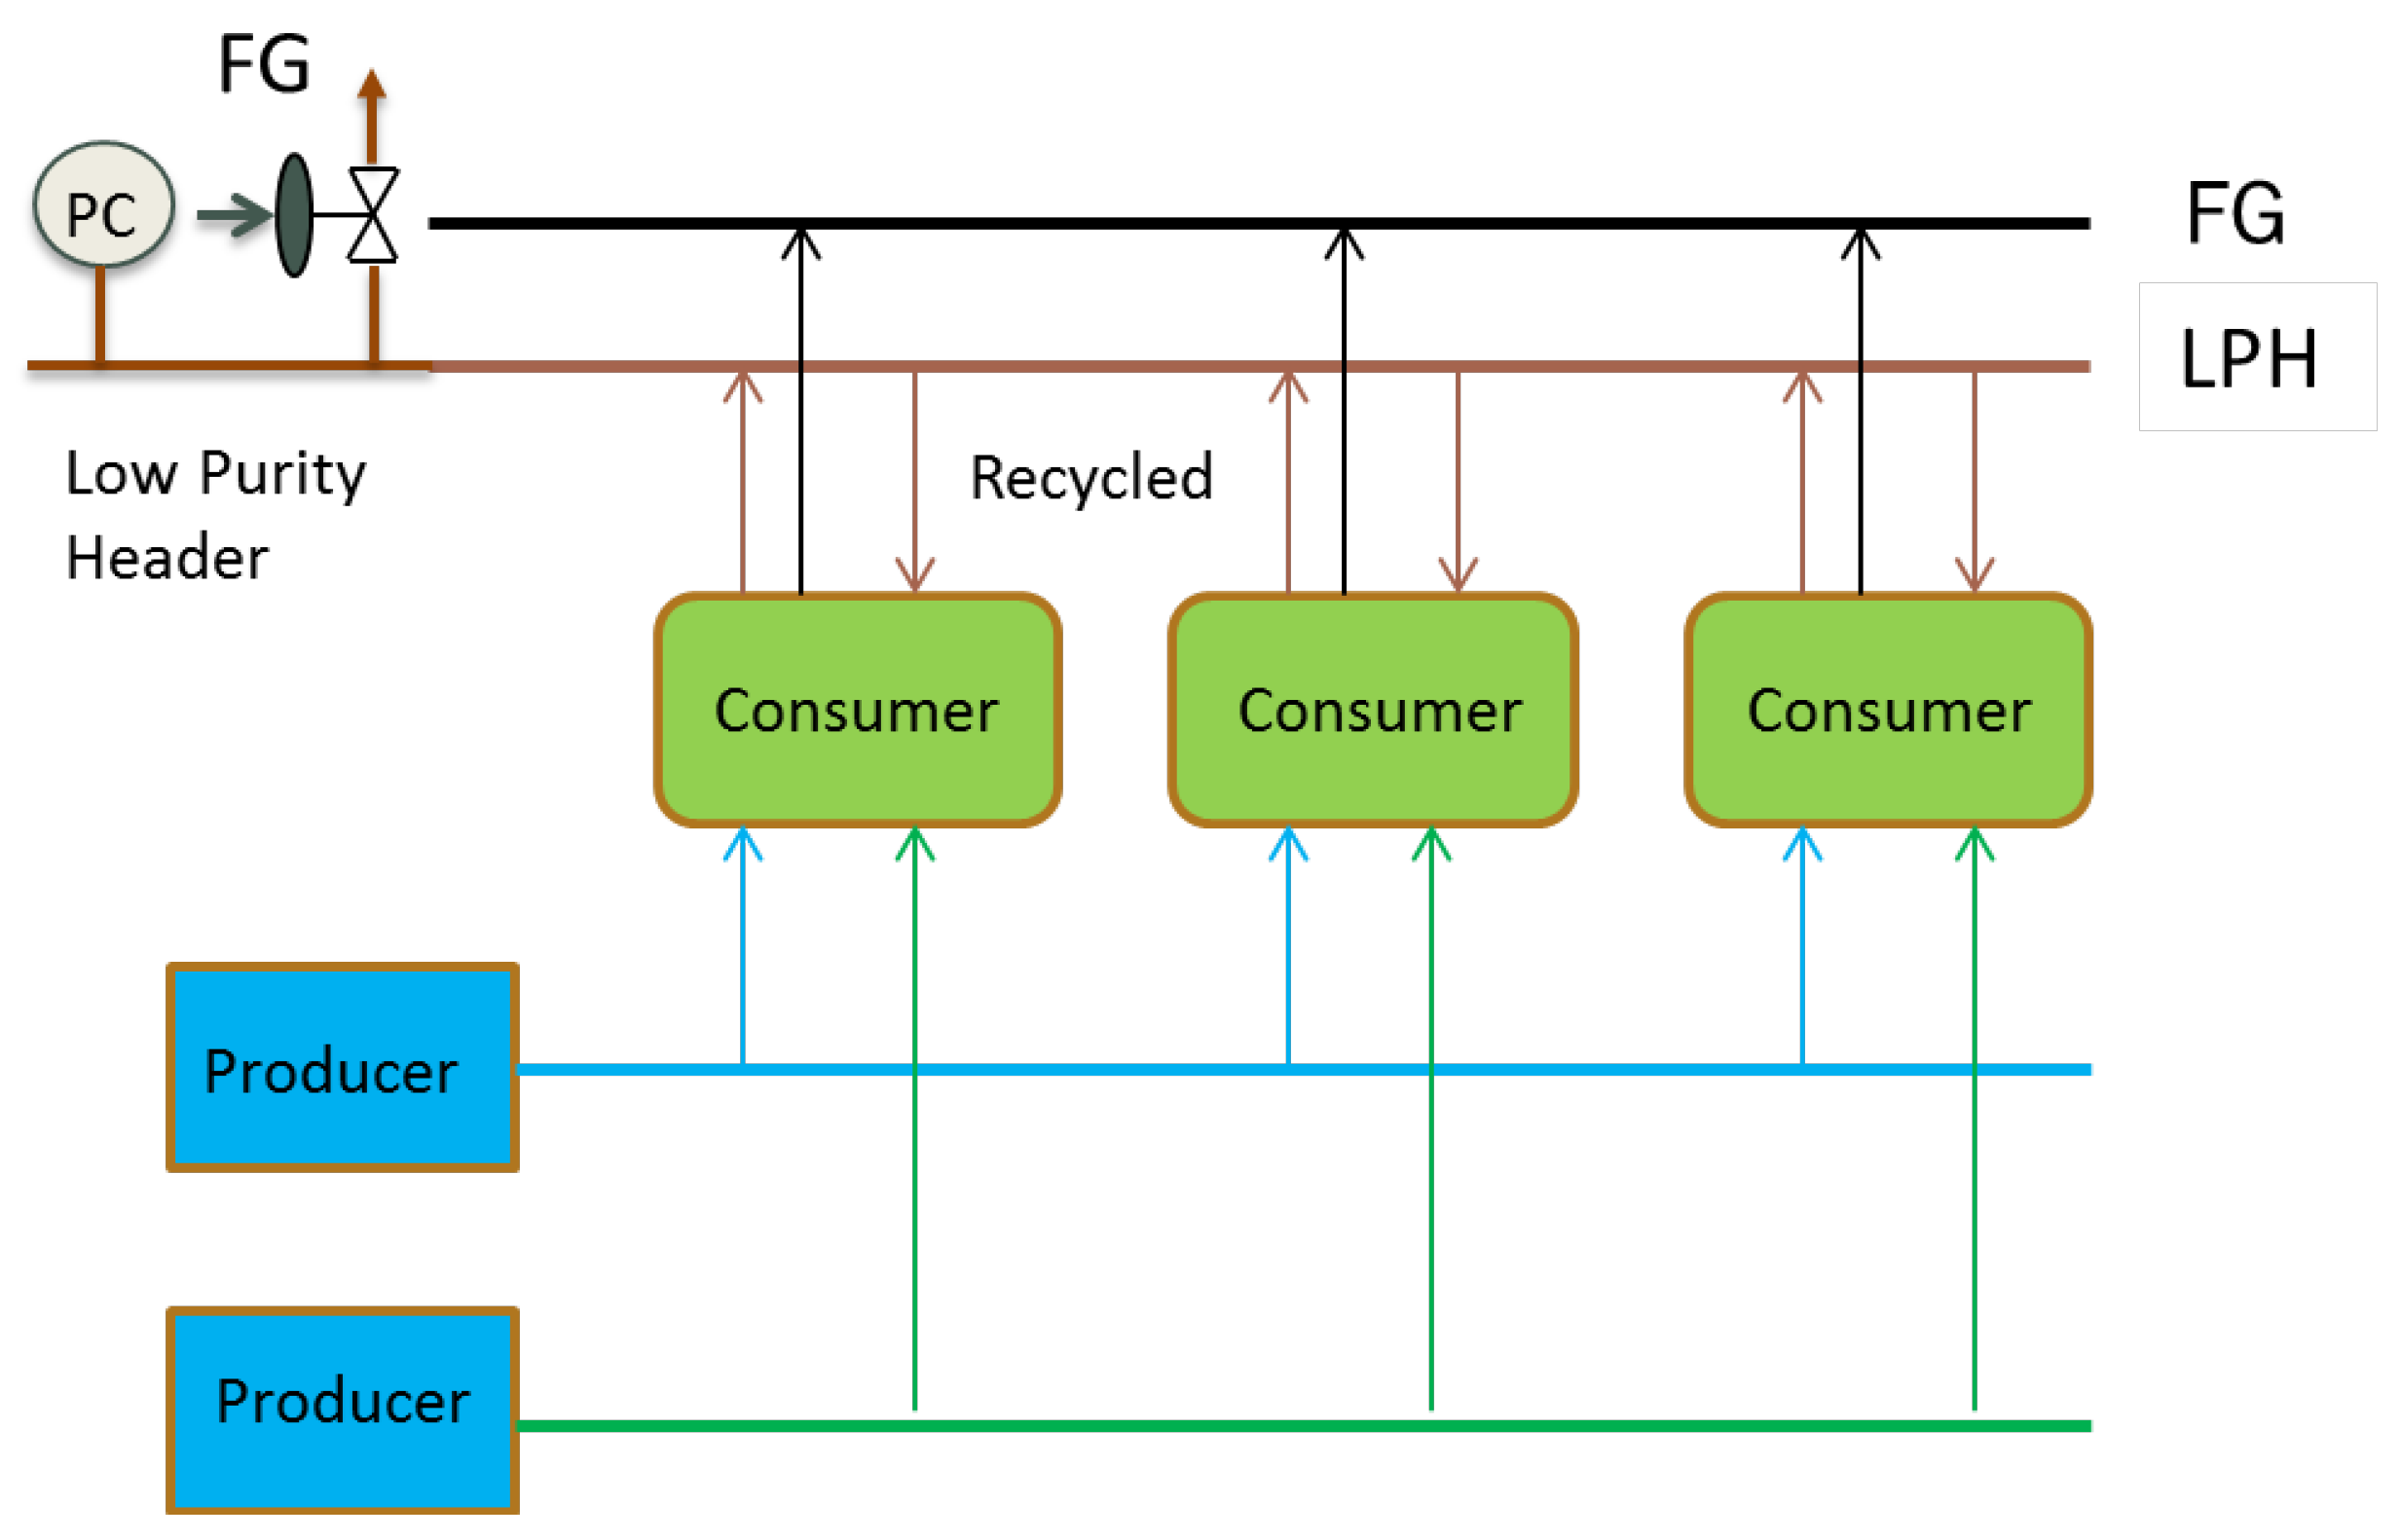
The global operation of the network outside the plants can be better explained using
Figure 3, which is a simplified representation where only a small number of producer and consumer plants are represented. As mentioned above, the producer plants are of two types: the ones that generate controllable flows of fresh high purity hydrogen (H3 and H4) and the ones that generate hydrogen of lower purity as a by-product (P1 and P2) so that their flows can be considered as non-controllable disturbances to the network. The generated hydrogen is distributed to the consumer plants through the corresponding headers. The hydrogen demand of every plant depends on the amount and quality of the hydrocarbons being treated, which may experience strong changes every two or three days according to the crude that is being processed. Excess hydrogen from these plants is partially collected in the low purity header and recycled back to the consumer plants, while the rest goes to the fuel gas network, where it is mainly burnt in furnaces.
2.1. Process Operation
Both plants and networks are operated from control rooms equipped with Distributed Control Systems (DCS) implementing basic controls (flow, pressure, …) and several MPCs (DMC) in charge of more complex multivariable tasks, such as sulfur removal in the plants. In the past, operators decided on key variables such as hydrocarbon inflow, use of membranes and fresh hydrogen feed to the plants in a largely decentralized way with the overall operation relying on the experience of the production managers. This provides flexibility in the operation, but limits the possibilities of implementing coordinated functioning and optimization.
The main network operation aims are:
Distribute the available fresh hydrogen and the recycled hydrogen (including internal plant recycles) so that the requirements of hydrogen at the reactors’ inputs in all plants are satisfied.
Be as close as possible to the production targets of hydrocarbon feeds to the plants established by the refinery planning system.
Balance the hydrogen that is produced and the hydrogen that is consumed so that the hydrogen losses to fuel gas are minimized.
They are listed in order of importance: proper distribution of hydrogen fulfilling operation constraints is a must for the operation of the plants, so it goes on top. Then, production should be increased as much as possible and this target should be achieved with minimum hydrogen losses, or equivalently, with minimum fresh hydrogen production. These aims, far from being independent, are linked together: good distribution and reuse of hydrogen allows reduced losses to fuel gas, increasing the hydrogen available for a further increase in hydrocarbon production when hydrogen capacity is a limiting factor or for reducing fresh hydrogen production if the production targets were already met.
In order to achieve these targets, the main decision variables are the fresh hydrogen production of H3 and H4 plants, the hydrocarbon feed to the fourteen consumer plants and the hydrogen distribution and reuse in the network, including the use of membranes where available. Hydrogen from the platformer plants P1 and P2, being a by-product of their operation, can be considered a disturbance more than a decision variable.
The overall operation is framed by the specific production targets given by the planning system of the refinery that change according to the market conditions and crudes available, and it is constrained by the physical and operational limitations imposed by the equipment.
3. Data Reconciliation and RTO
Safe and optimal operation of this system is a difficult problem due not only to its large scale, complexity and interrelated aims, but also because of the presence of significant disturbances that affect the process and the fact that the information available about many key variables is limited and unreliable.
Uncertainty is mainly caused by:
The changes in hydrogen consumption in the reactors of the hydrotreating plants, which depend not only on the amount of hydrocarbons being processed, but also on its sulphur content; the sulphur product specification; and the type of hydrocarbon processed, in particular its light-cyclic-oil (LCO) content.
The use of orifice-plate differential pressure flow meters for gas streams is common in the process industry, but creates particular problems when installed in hydrogen streams. These meters provide volumetric flow measurements. In order to be converted to mass flow, they need to be compensated in temperature, pressure and molecular weight, as the operating conditions normally differ from the calibration ones of the instruments. Pressure and temperature are normally available, but molecular weight of the streams is not, which prevents proper computation of the mass flow, normally expressed as Nm3/h. In addition, few hydrogen purity analysers are installed in the process and the molecular weight of the streams experience significant variations for small changes in purity or light ends composition (which is unknown). This is due to the low value of H2 molecular weight, 2 g/mol, as compared to those of the main impurities, CH4, C2H6, and C3H8, which are 16, 30 and 44 respectively. This is an important difference as opposed to other gas networks, such as the networks of natural gas, where composition can be assumed constant.
3.1. Data Reconciliation
In spite of these difficulties, decisions about the operation of the process can be improved if a model is available and better process information can be obtained from plant measurements.
A first principles model of the hydrogen behavior in the network and associated plants is available from previous work [
9,
10]. It was developed to provide support in process optimization and it is based on mass balances of hydrogen and light ends (considered as a single pseudo-component) in the pipes and units. In addition, it incorporates other equations for compressors, membranes, separation units (including a solubility model), etc., some of which are reduced order models fitted to experimental data or with some adjustable parameters. Taking into account the much faster dynamics of the hydrogen compared to the dynamics of the hydrogen of the reactors, the hydrogen distribution model is static and contains flows, purities, molecular weights of hydrogen and light ends of all streams and hydrogen consumption in the reactors as main variables.
When data present significant uncertainty, data reconciliation is the first step to be applied in a model based approach to process optimization. The target is to estimate consistent values of all plant variables from available on-line measurements based on a process model. Data reconciliation requires redundancy in measurements, taking advantage of the fact that the core of the model, being based on mass balances, does not present structural errors. Accurate, consistent, and robust estimations are looked for, irrespective of process disturbances, measurement noise, etc., while at the same time enabling the update of certain unknown model parameters.
The benefits of implementing data reconciliation are three-fold:
It provides information about unknown important variables such as hydrogen consumption in reactors, molecular weights, purities, etc.
It allows for reliable computation of Key Performance Indicators (KPIs) and Resource Efficiency Indicators (REIs) to perform process supervision.
It provides consistent measurements and a model to be used in process optimization.
Data reconciliation is formulated as a large optimization problem searching for the values of variables and parameters that satisfy the model equations and constraints and that, simultaneously, minimize a function of the deviations (e) between model and measurements, properly normalized.
When a sum of squared errors is used as the cost function to be minimized in data reconciliation, one of the main obstacles to obtain adequate solutions is the presence of gross errors, generated usually by faulty instruments, which may distort the estimation, spreading the errors among other variables. Instruments with gross errors can be detected by a combination of data analysis and repeated execution of the data reconciliation and removed [
11]. Nevertheless, this procedure is slow and implies additional difficulties for industrial implementation. An alternative is the use of robust estimators that substitute the least squares cost function with another cost function that coincides with it for small errors, but for larger ones grows at lower speeds, such as the Fair function [
12] ((Equation 1a), first term of the sum), limiting the spread of errors among other variables and increasing robustness. In our case, the robust data reconciliation has been formulated as:
The cost Equation 1a includes three terms: the sum of the Fair functions of the normalized errors e, the sum of penalty terms of possible range violations ε of variables to help to assure a feasible solution and the sum of regularization terms R to favor smooth changes over time of some model parameters. The coefficients α are possible weighting/removal terms and c is a tuning parameter of the Fair function. In the equations, e represents errors between the model and measurements of flows F and hydrogen purities X, with η normalization factors and β compensation factors for flows. MW refers to molecular weights, and P and T to pressures and temperatures, with the sub-index d indicating design values and imp impurities. Finally, p represents model adjustable parameters. The minimization of Equation 1a is performed under the constraint of the network model and a set of operational and range constraints Equation 1b which includes slack variables ε to help avoiding infeasibilities. Main decision variables are flows, purities and molecular weights of all streams and hydrogen consumption rates in the reactors.
The data reconciliation problem is a large Non-Linear Programming (NLP) problem that is formulated and solved with a simultaneous approach in the General Algebraic Modeling System (GAMS) environment using the Interior Point Optimizer (IPOPT) as the optimization algorithm. The implementation involves more than 4400 variables and 4700 equality and inequality constraints. It takes less than five Central Processing Unit (CPU) minutes in a PC with i7 processor and 8 Gb RAM, giving robust results against gross errors and helping to detect faulty instruments.
3.2. Real-Time Optimization (RTO)
After the data reconciliation step, once the model incorporates the estimated parameters and reliable estimations of variables are available, it is possible to search for the best way of operating the process according to the aims specified in
Section 2.1, regarding feasible hydrogen distribution, achievement of hydrocarbon production targets and minimization of fresh hydrogen generation or losses. The formulation of the optimization incorporates additional constraints oriented to keep the operation of the control rooms as undisturbed as possible. Because of that, it assumes as fixed quantities many specific values related to the current operation of the units, such as specific hydrogen consumption or specific generation of light ends and its molecular weight in reactors; specific reactor quench flows for temperature management or separation factors; and specific purge flows and its properties in separation units. In the same way, the state of functioning or stopping the plants and the current structure of the network are respected, assuming that they are mainly imposed either by maintenance or global production planning reasons.
Under these assumptions, the optimal redistribution is formulated as the RTO problem:
| s.t. |
| Process model |
| Process constraints |
| Refinery planning specifications |
where the three terms of the cost Equation (2a) aim to maximize the hydrocarbon load (
HCi) to consumer plants, minimize the use of fresh hydrogen generated in the steam reforming plants (
FHj) and minimize the internal recycles of hydrogen (
Rk) in the consumer plants, which is linked to the operation of the recycle compressors. Here, p
HC, p
H and p
R stand for prices associated with hydrocarbons, fresh hydrogen and compressors in order to provide an economic meaning to the cost function.
The problem has to be solved under the constraints imposed by the model and operation of the units, taking also into account the targets coming from the refinery planning. Constraints apply mainly to pipes’ capacity, recycle purity in the consumer plants, ratio hydrogen/hydrocarbon at the reactors’ input, operating range of membranes, producer plants’ capacity, reciprocating and centrifugal compressors’ capacity, etc. Main decision variables include production of fresh hydrogen, feeds to consumer plants, hydrogen flows and recirculation, purges, purities and membranes operation.
Again, the problem is a NLP one and has been formulated in the GAMS environment above mentioned. It involves nearly 2000 variables and more than 1800 equality and inequality constraints and is solved with a simultaneous approach and the IPOPT algorithm in less than one minute CPU time. The execution follows that of the data reconciliation according to the block diagram of
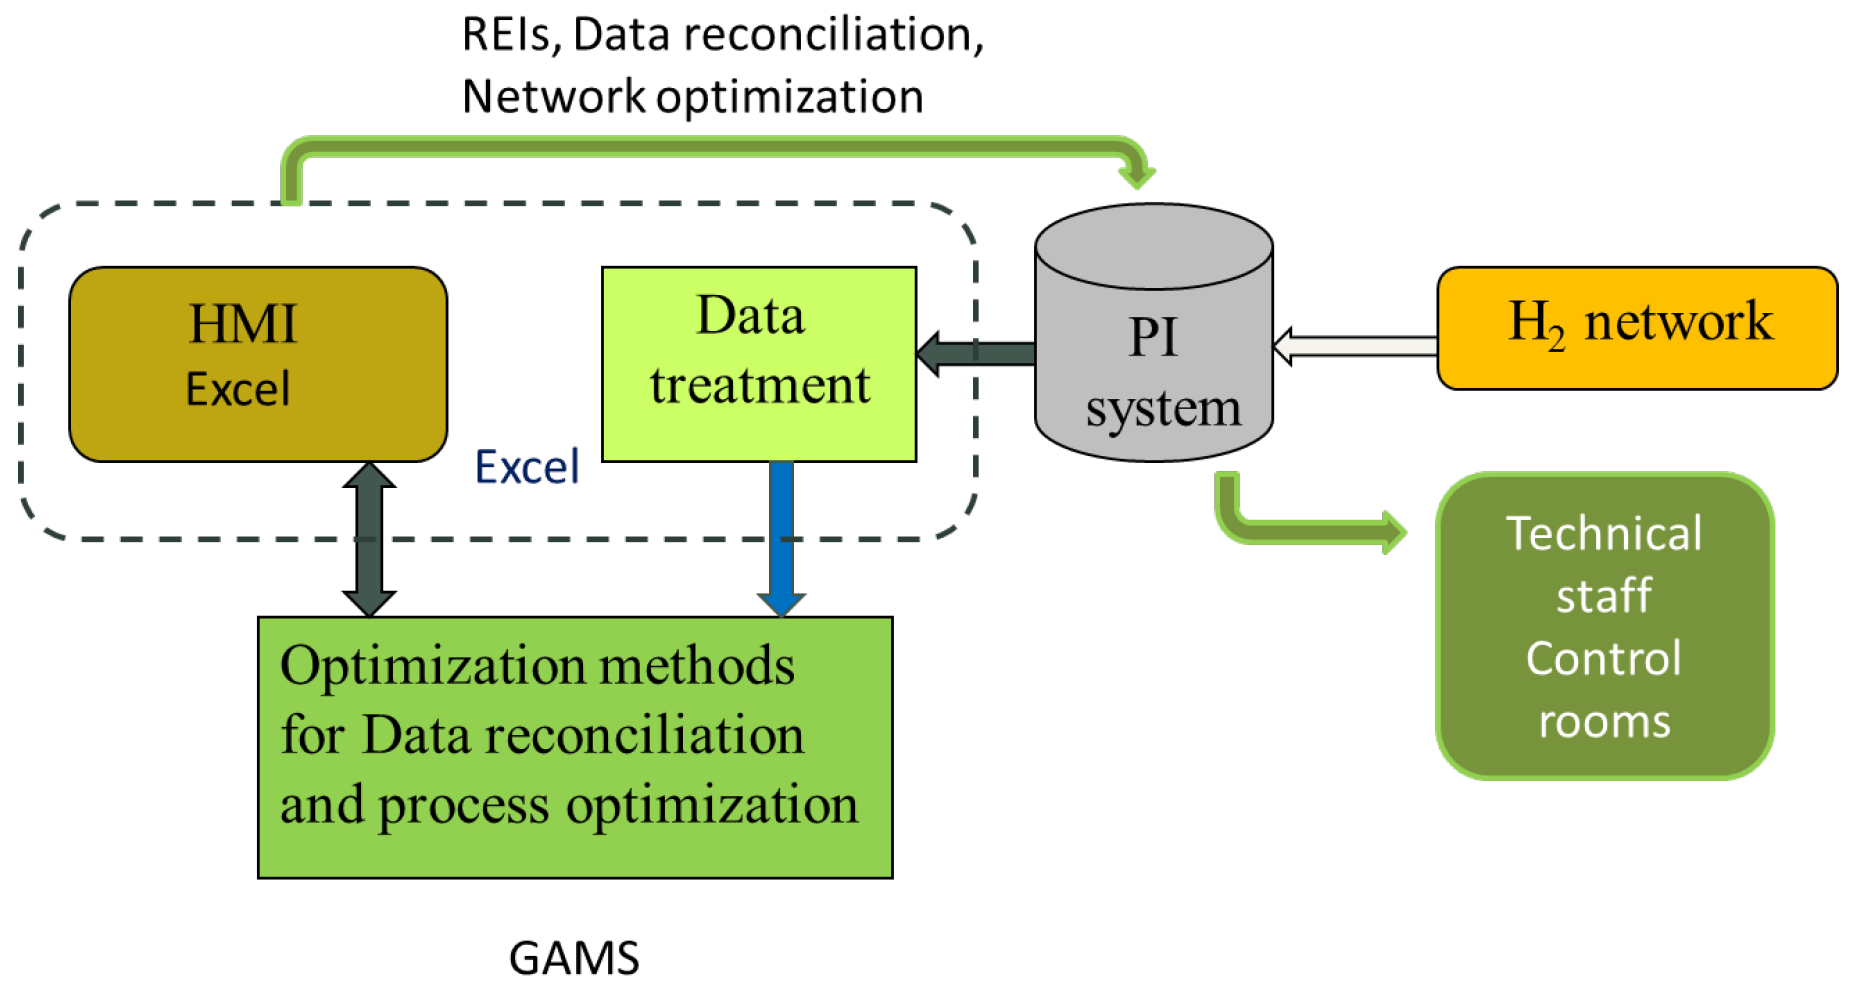
Figure 4, running every two hours, and its results are available in the Excel HMI and through the Osisoft PI system.
4. System Implementation
The implementation of the hydrogen network optimal management system in the refinery followed three stages. In the first one, data reconciliation and process optimization run off-line, following the schematic of
Figure 4. The system is built around an Excel application in a dedicated PC that performs different tasks: Process data are read at regular intervals from a real-time data base connected to the process (PI system) and then analyzed and treated to eliminate inconsistencies, outliers, prepare ranges of variables, etc. One important part of the analysis concerns the state of functioning of the plants and possible structural changes in the network. Rules for detecting if a plant is operating or stopped exist, as well as other ones based on valve openings that identify different ways of operating the hydrogen network using different paths, activated manually. This means that the model has to be adjusted automatically to the structural changes. For this purpose, the model includes a set of binary variables that activate or deactivate groups of equations corresponding to different operating modes. Nevertheless, these binary variables are fixed by the data analysis before the computation of the data reconciliation takes place, so that the type of optimization problem solved is NLP and not Mixed Integer Non Linear Programming (MINLP).
The application reads 171 flows and 18 purity measurements, plus other variables and configuration parameters from the PI (temperatures, pressures, valve openings, etc.) totaling around 1000 variables, averaging them in two-hour periods to smooth the effects of transients and disturbances. Once data are analyzed and filtered, they are passed to the GAMS environment, which runs the data reconciliation problem and gives back estimations of all model variables consistent with the model and constraints and as close as possible to the process measurements. These estimations can be visualized in the Excel Human Machine Interface (HMI) in different formats.
Notice that no steady state detector is normally in operation. This is due to two reasons: on one hand, pressure controllers in headers and consumer plants help to maintain mass balances fairly well, operating with time constants no greater than a few minutes, which is small compared with the two-hour average of the data. On the other hand, due to the large scale of the process, it is very unlikely that all variables are sensibly constant for reasonable time periods, so waiting for the green light of steady state detectors will lead to not running the system, except for short time intervals. A more flexible approach has been taken assuming that the fast system dynamics above mentioned and data averaging allow the obtainment of sensible results.
After the data reconciliation step, the system calls GAMS again to perform the network optimization as presented in
Section 3.2. The optimal values of the process variables can be seen as well in the Excel HMI.
4.1. Validation and Implementation Problems
The data reconciliation system has been validated analyzing trends for periods of several days in different seasons with the technical staff of the refinery. Consistency in the estimated values of the variables, stability of the solutions and correspondence with the measured values, were some of the criteria used. During the validation, faulty instruments were detected and corrections and updates in the model were made. Particular attention was devoted to the rules that analyze the raw data from the PI and convert them into useful information for the model and the data reconciliation constraints.
In the same way, the results of the open loop execution of the RTO problem (2) were studied, which provide clues and directions on how to run the network optimally. The analysis of the way in which the network operates by the refinery team and the results of the RTO, lead to the identification of several action patterns and partial aims required for an optimal management of the process. The most important ones can be summarized as follows:
Losses from the HP separators of a plant to fuel gas, required to avoid light ends accumulation, should be made at the lowest hydrogen purity compatible with the one required at the reactor input and the H
2/HC minimum ratio, see
Figure 2. This implies controlling the HP separators’ purity
XHP at these minimums, sending the gas to the FG purge from those plants that operate with the lowest purity, while, in the others, the excess hydrogen is sent to the LPH for recycle.
As excess hydrogen is recycled to the Low Purity Header (LPH), hydrogen unbalance in the network, that is, hydrogen generated minus hydrogen consumed in the reactors, reflects in the LPH pressure (see
Figure 3). This pressure is maintained with a pressure controller venting gases to the fuel gas network. Then, production of fresh hydrogen could be modified so that the adjustments of the unbalance performed by the LPH pressure controller are made with minimum average valve opening compatible with non-saturated pressure control. This is similar to the so-called valve-position control. In this way, losses to fuel gas from LPH are minimized while guaranteeing that enough hydrogen to the consumer plants is provided to cover the demand, as the pressure is maintained.
Maximization of the hydrocarbon load to the consumer plants, which is the most important target, can be made until either maximum hydrogen capacity is reached or another technical constraint is faced.
Sending higher purity hydrogen (H4) to lower purity header (H3) should be minimized as purity degrades.
At the same time, the automated implementation of the RTO calculations to the plant control system is not easy and presents several important problems:
The models used in the data reconciliation and RTO are static, with results updated every two hours, but the implementation of the optimal values has to be applied to the process taking into account the time evolution of variables. In particular, HC load and hydrogen production have to be changed dynamically at a higher frequency to balance hydrogen production and consumption.
In the same line, due to the presence of disturbances, changing aims, etc., constraints’ fulfilment requires dynamic actions to be performed at a higher rate.
Possible changes in hydrogen flows interact among them so that a proper implementation of the RTO solution would require multivariable control to take care of the interactions.
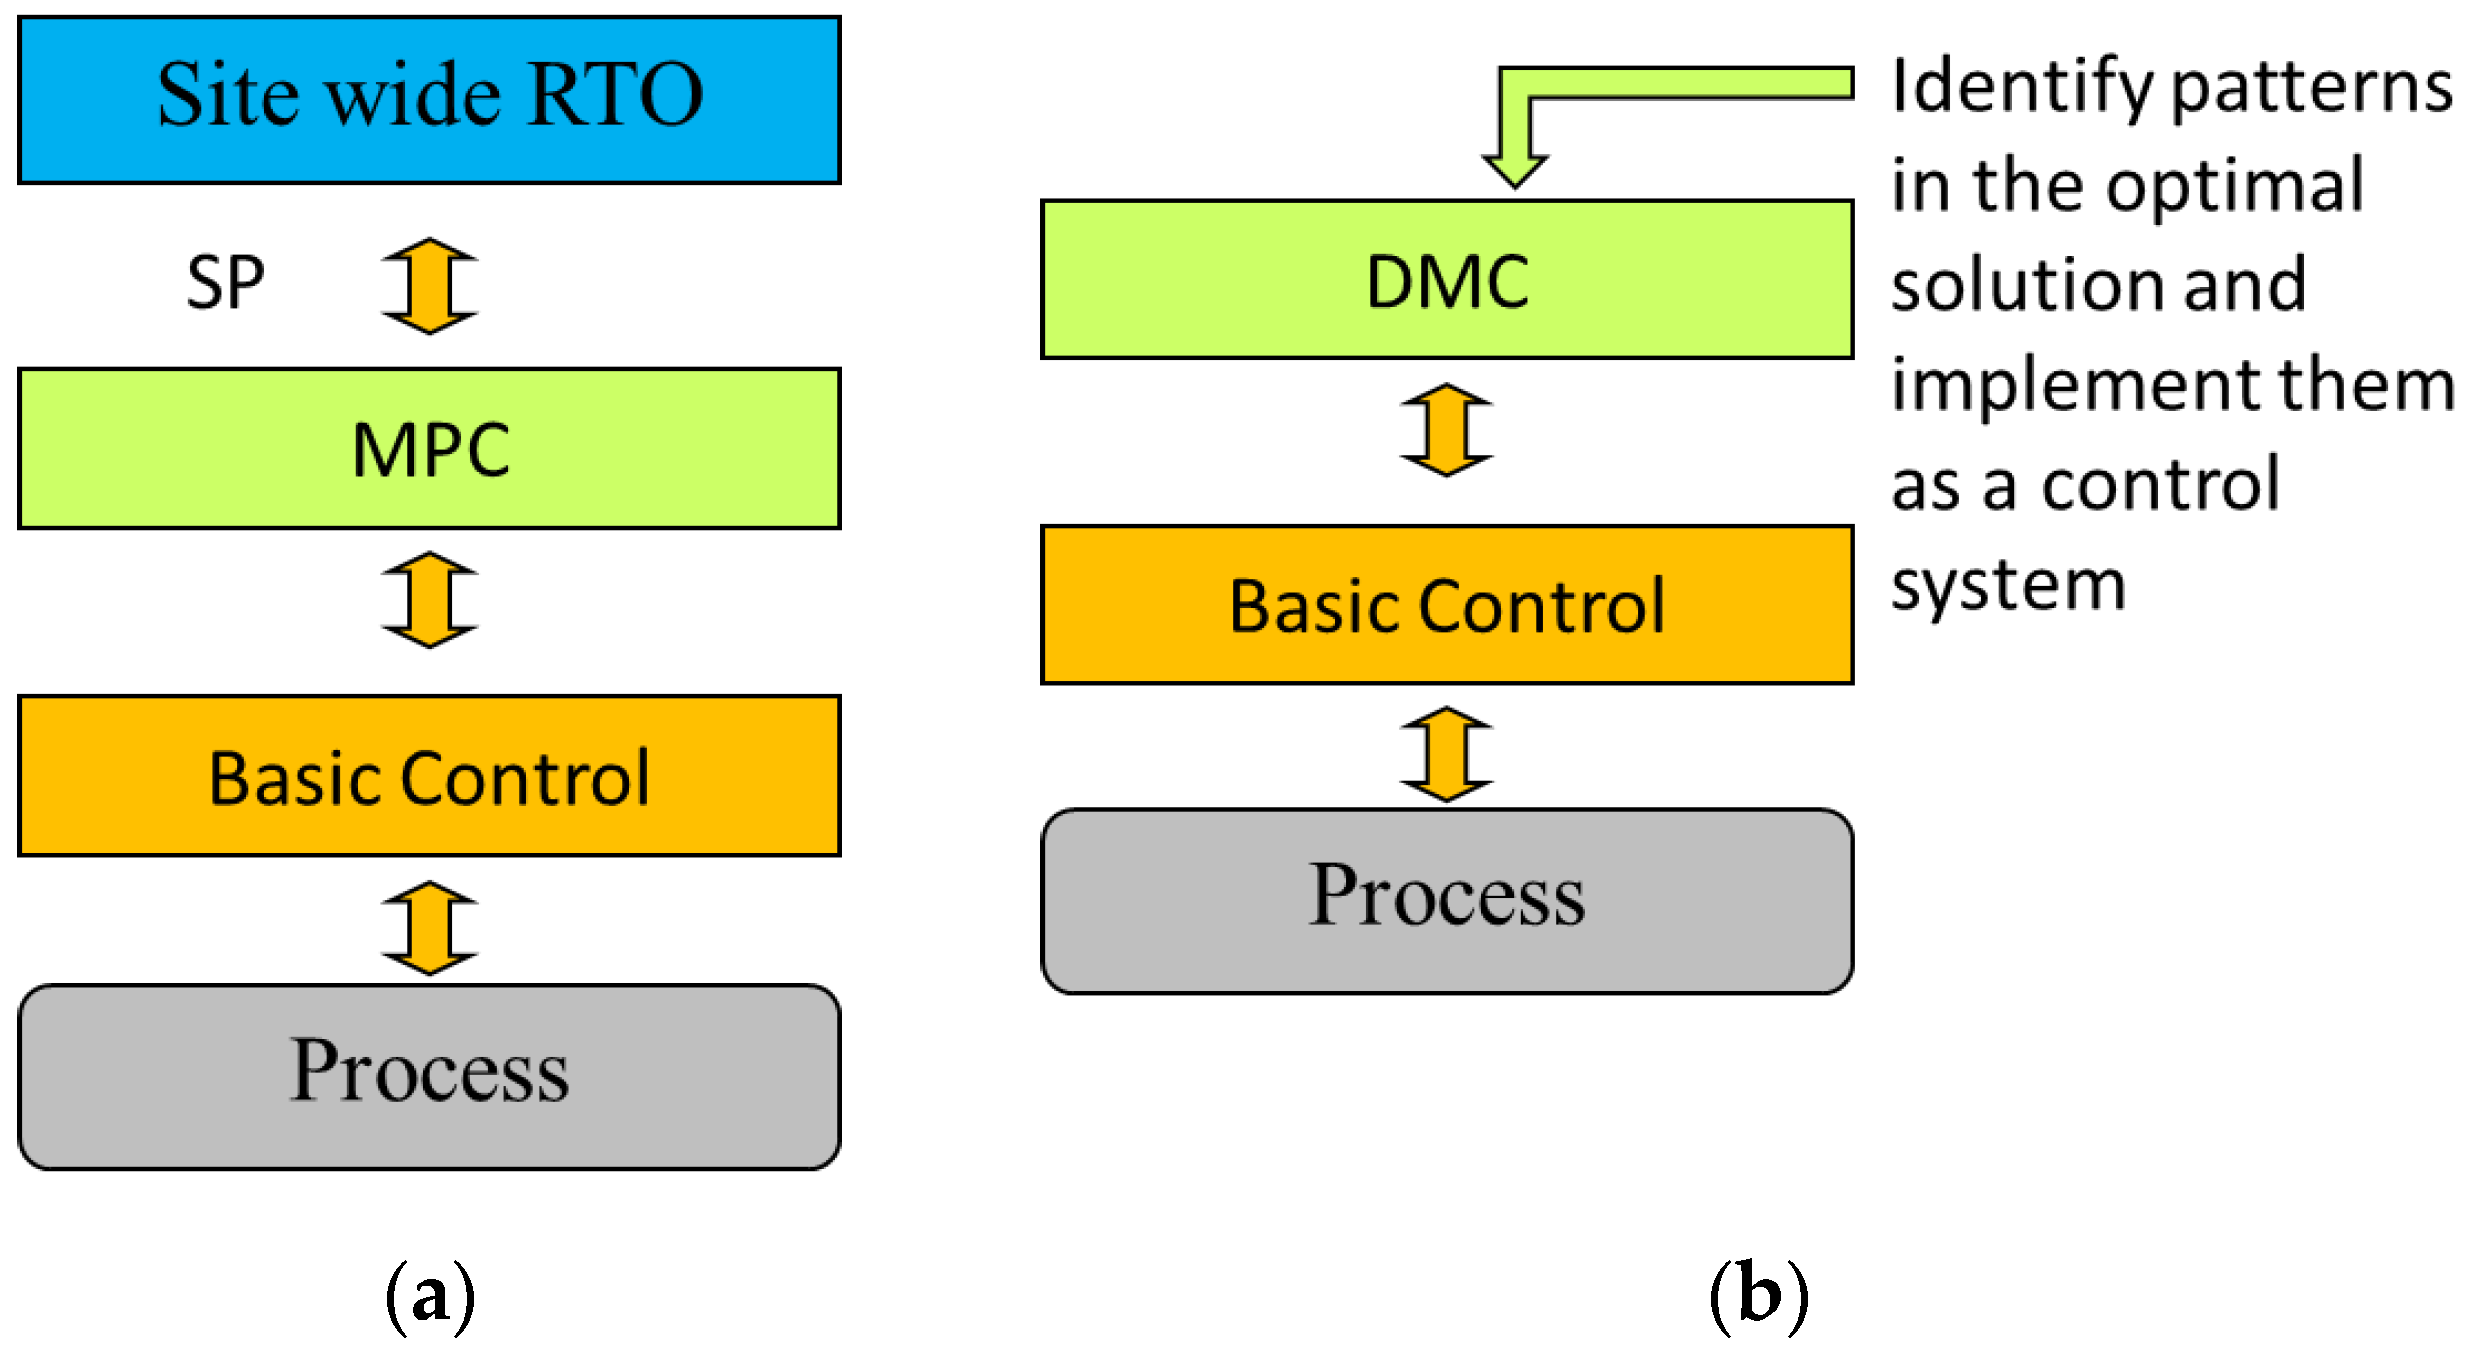
These requirements of dynamic and multivariable actions lead in a natural way to the implementation of a MPC layer between the RTO and the basic control system of the network and plants implemented in the control room DCS, as in
Figure 5a. Nevertheless, this architecture does not solve the problem of a fast update of the optimization targets and requires maintaining and operating in real-time the large-scale system composed by the data reconciliation and RTO. A dynamic RTO executed with a shorter sampling time or an economic MPC merging the economic and production targets Equation 2a with dynamic MPC control could be more appropriate but it is not realistic due to the large scale of the system.
4.2. Implementation in the DMC Environment
In view of the existence of the problems and solution patterns of the optimal network management mentioned in the previous sub-section, an alternative approach that combines these patterns, offering a simpler implementation, is presented next. It can be considered as stage two of the system implementation and it is shown schematically in
Figure 5b. It takes advantage of the extended functionality of the commercial MPC used in the refinery, DMCPlus (Dynamic Matrix Control) from AspenTech [
5], that mixes local LP optimizers and a predictive controller to implement the patterns that define the optimal operation and to perform multivariable control of several plants simultaneously.
In a certain way, it follows the path of the self-optimizing control [
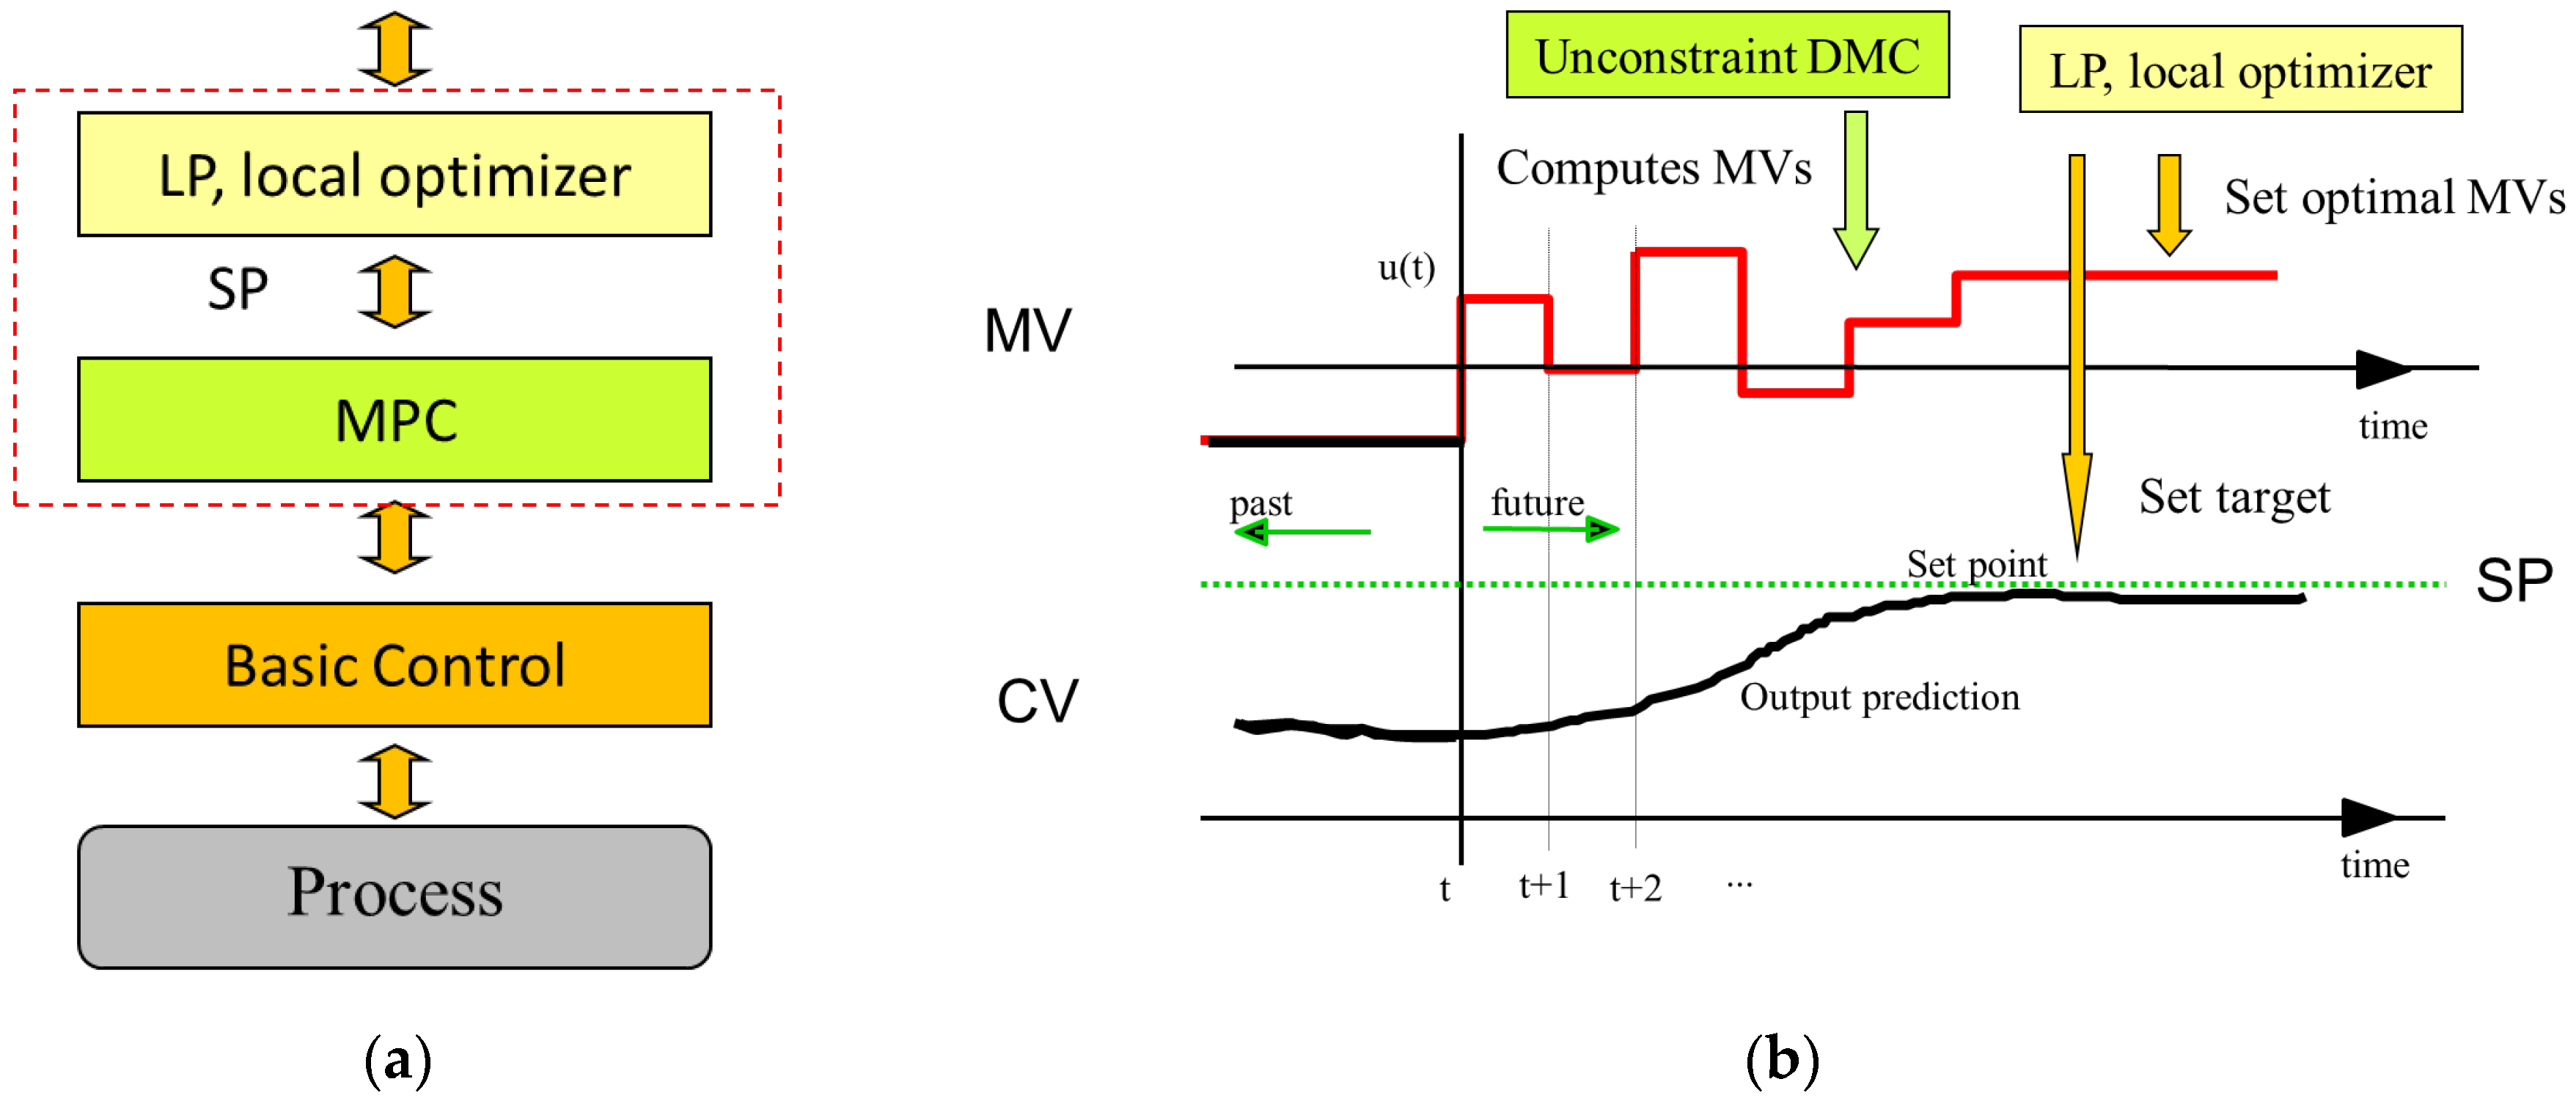
6], which substitutes the on-line optimization layer by a control system such that maintaining, in their set points, the so-called self-optimizing variables, keeps the system close to its economic optimum in spite of disturbances. Nevertheless, the formulation mentioned above is different because here there are no self-optimizing variables but the selection of targets that define the optimal operation in cascade with a standard DMC controller. Yet, the basic idea is to implement, as a control system, as much as possible of the optimal management solutions and keep its implementation as simple as possible. The commercial DMC is composed of two layers: an unconstraint DMC controller, which uses a linear step response model of the process linking controlled variables with manipulated ones and disturbances; and a LP optimizer that constitutes the second layer, as in
Figure 6a. The LP uses the same model as the controller but in steady state, and includes a linear cost function of the manipulated variables that is minimized at every sampling time under a set of constraints. Both layers are executed at the same rate and the results of the LP are passed as future Set Point (SP) targets to the DMC controller, as can be seen in
Figure 6b.
The optimal action patterns defined in
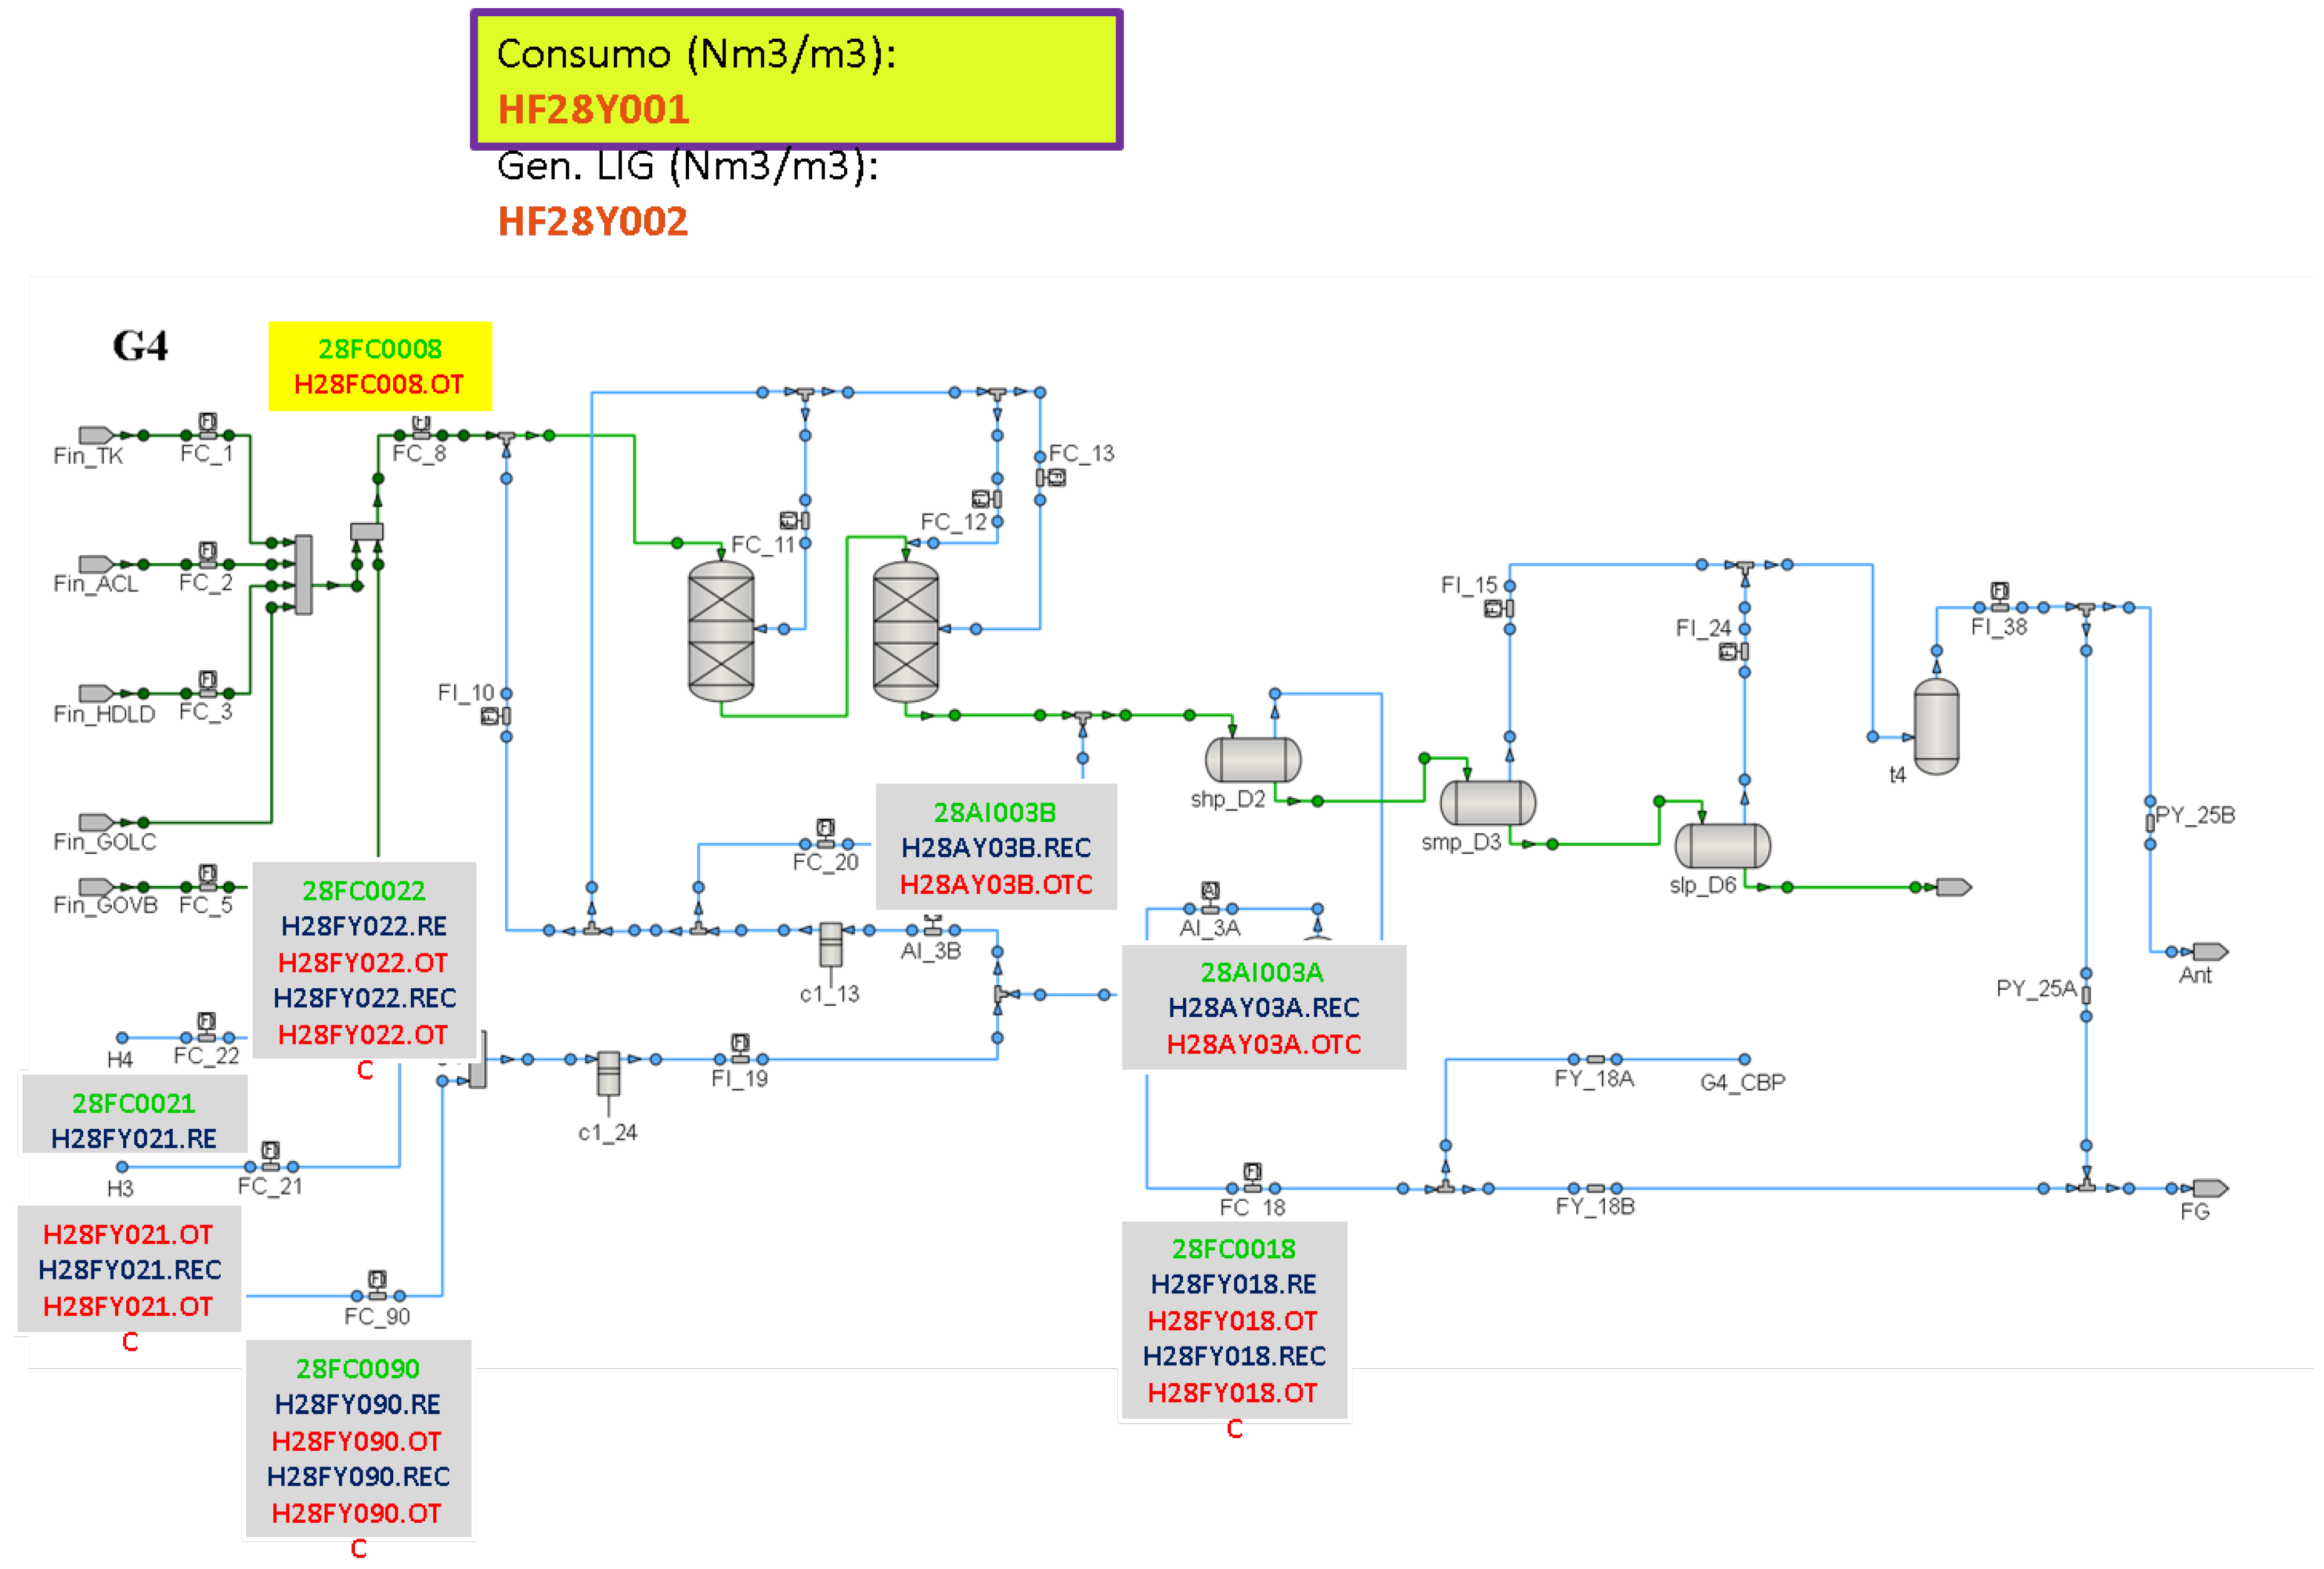
Section 4.1 can be implemented in the LP layer of a DMC in terms of partial aims in the LP cost function. At the same time, as they involve the joint on-line manipulation of several process plants, and in order to keep the implementation as simple of possible, only the most important ones from the point of view of hydrogen consumption and hydrocarbon processed were included in the design of the DMC. At present, it controls the operation of six plants: two hydrogen producers H3 and H4 and four consumers G1, G3, G4 and HD3, as can be seen in
Figure 7.
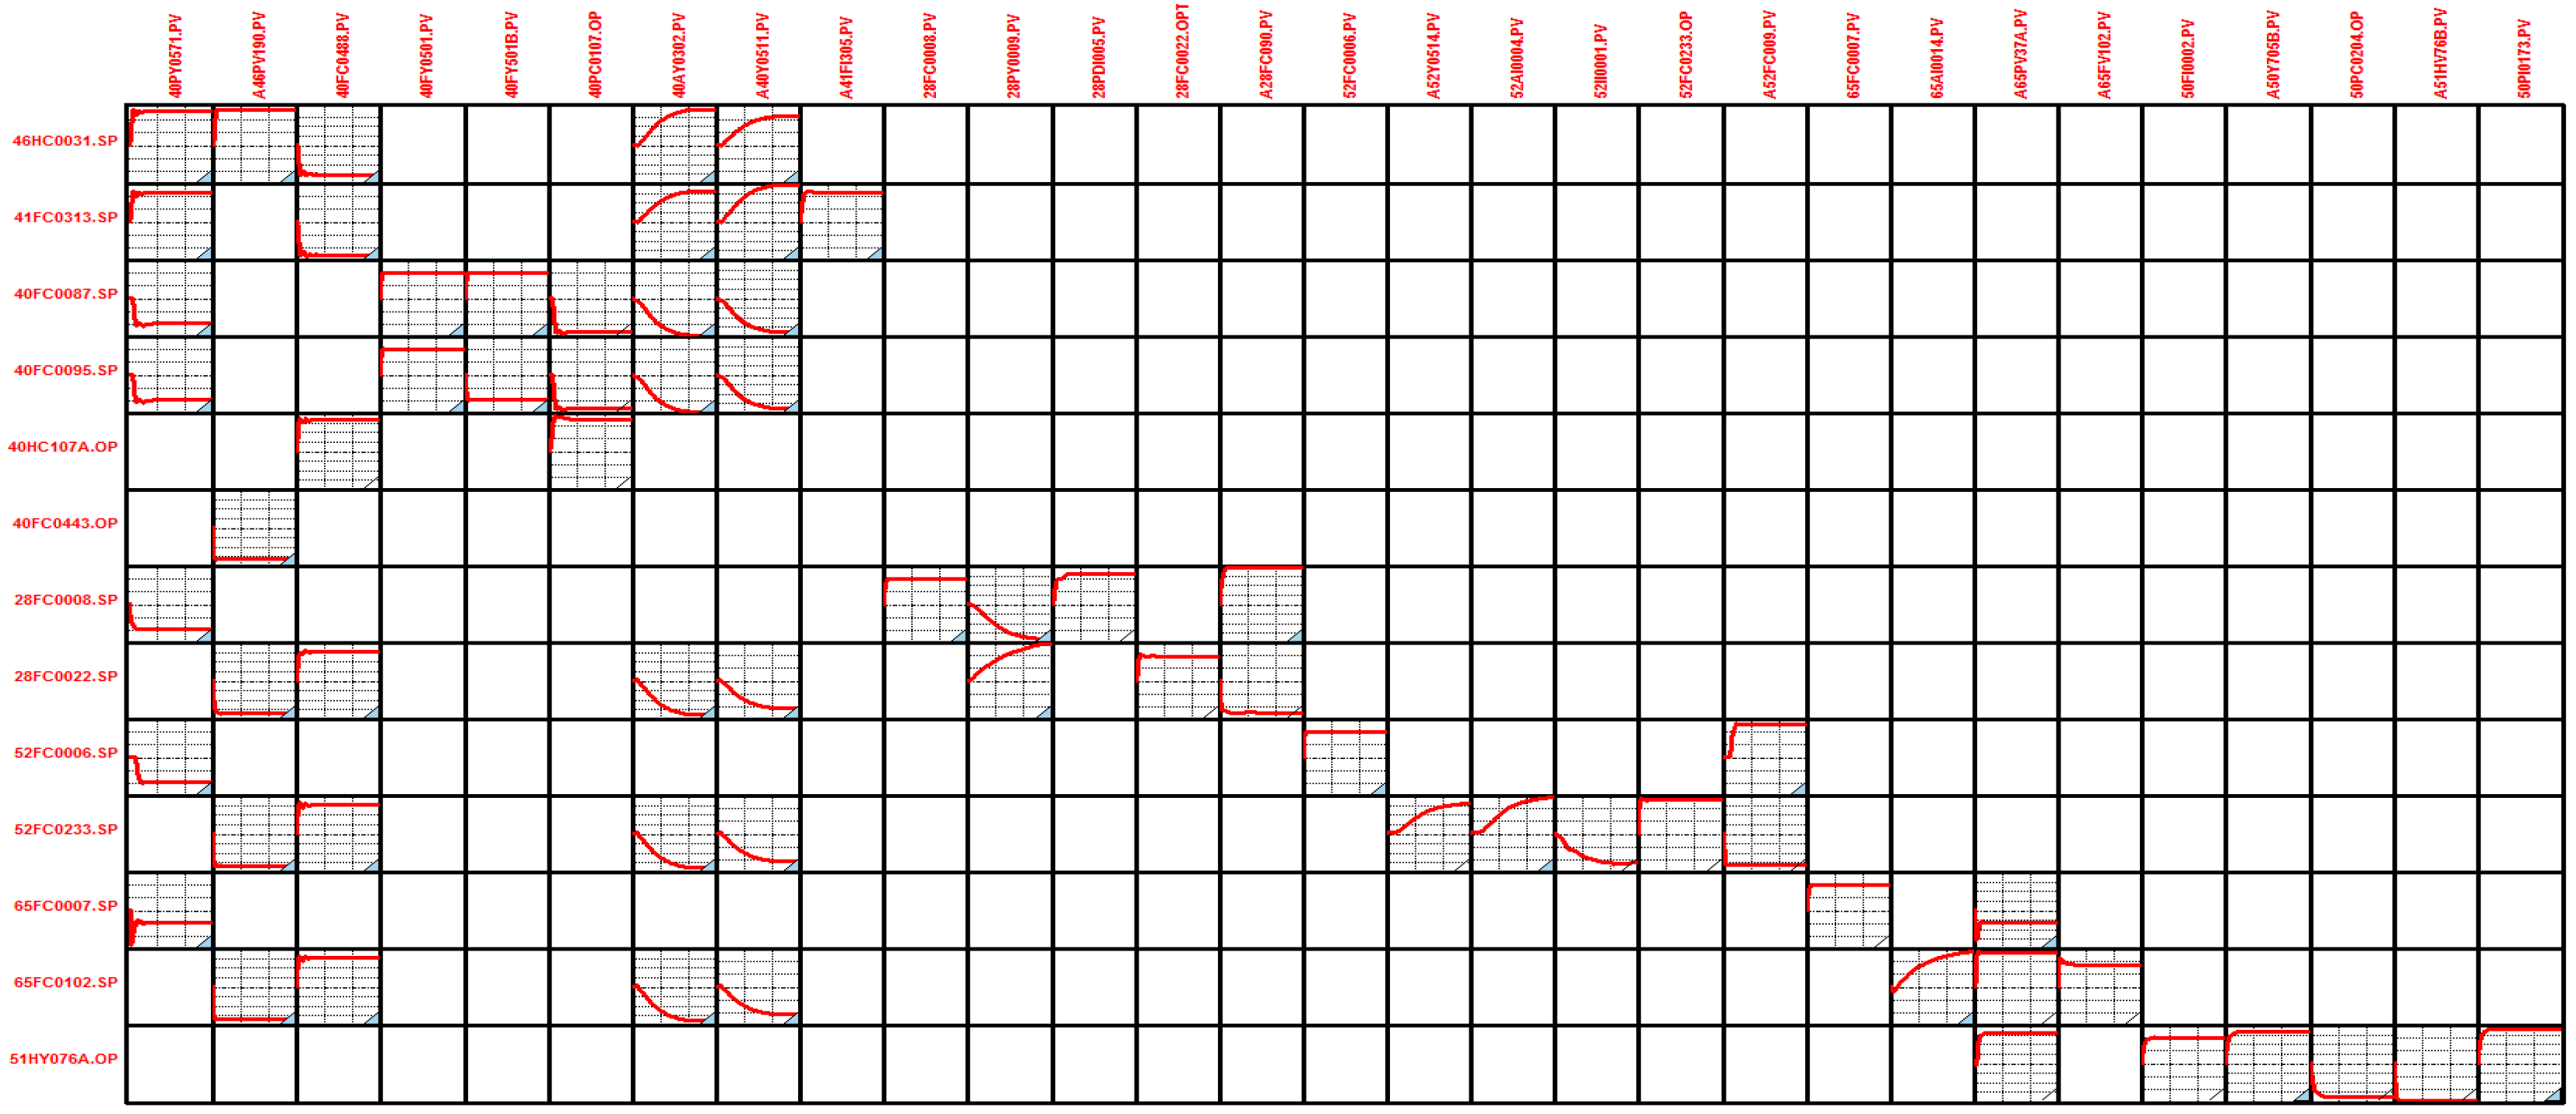
The controller was developed and implemented by the refinery team and is based on linear models obtained by identification using data from step-tests that forms a dynamic matrix such as the one in
Figure 8, involving 12 manipulated variables and 29 controlled ones. The main manipulated variables refer to the set points of hydrocarbon loads to the consumer units, fresh hydrogen production, hydrogen feed to the consumers from the high purity collector and supply of hydrogen from one of the platformer plants. The main controlled variables are hydrogen partial pressure in the reactors of the consumer plants, losses to fuel gas from the Low Purity Header (valve opening), recycle purity and HP losses to FG from some plants, hydrocarbon loads and valve openings to avoid control saturation. They are organized in four sub-controllers, so that each one can be disconnected without affecting the rest of them in case it is required due to process conditions or maintenance actions.
The LP layer minimizes a cost function that plays with four aims:
Maximize hydrocarbon loads to the consumer plants
Minimize losses from the LPH to FG
Minimize hydrogen purity in the recycles of the consumer plants
Minimize hydrogen transfers from higher to lower purity headers
These four objectives are combined in a single linear cost function assigning different weights to the variables associated with them that reflect their relative importance and priority. This cost function is optimized under the constraints imposed by the dynamic matrix model and range constraints in the model variables. The solutions are given as targets to the predictive controller, as in
Figure 6, which computes the corresponding dynamic actions and passes them to the lower basic control layer of the control room.
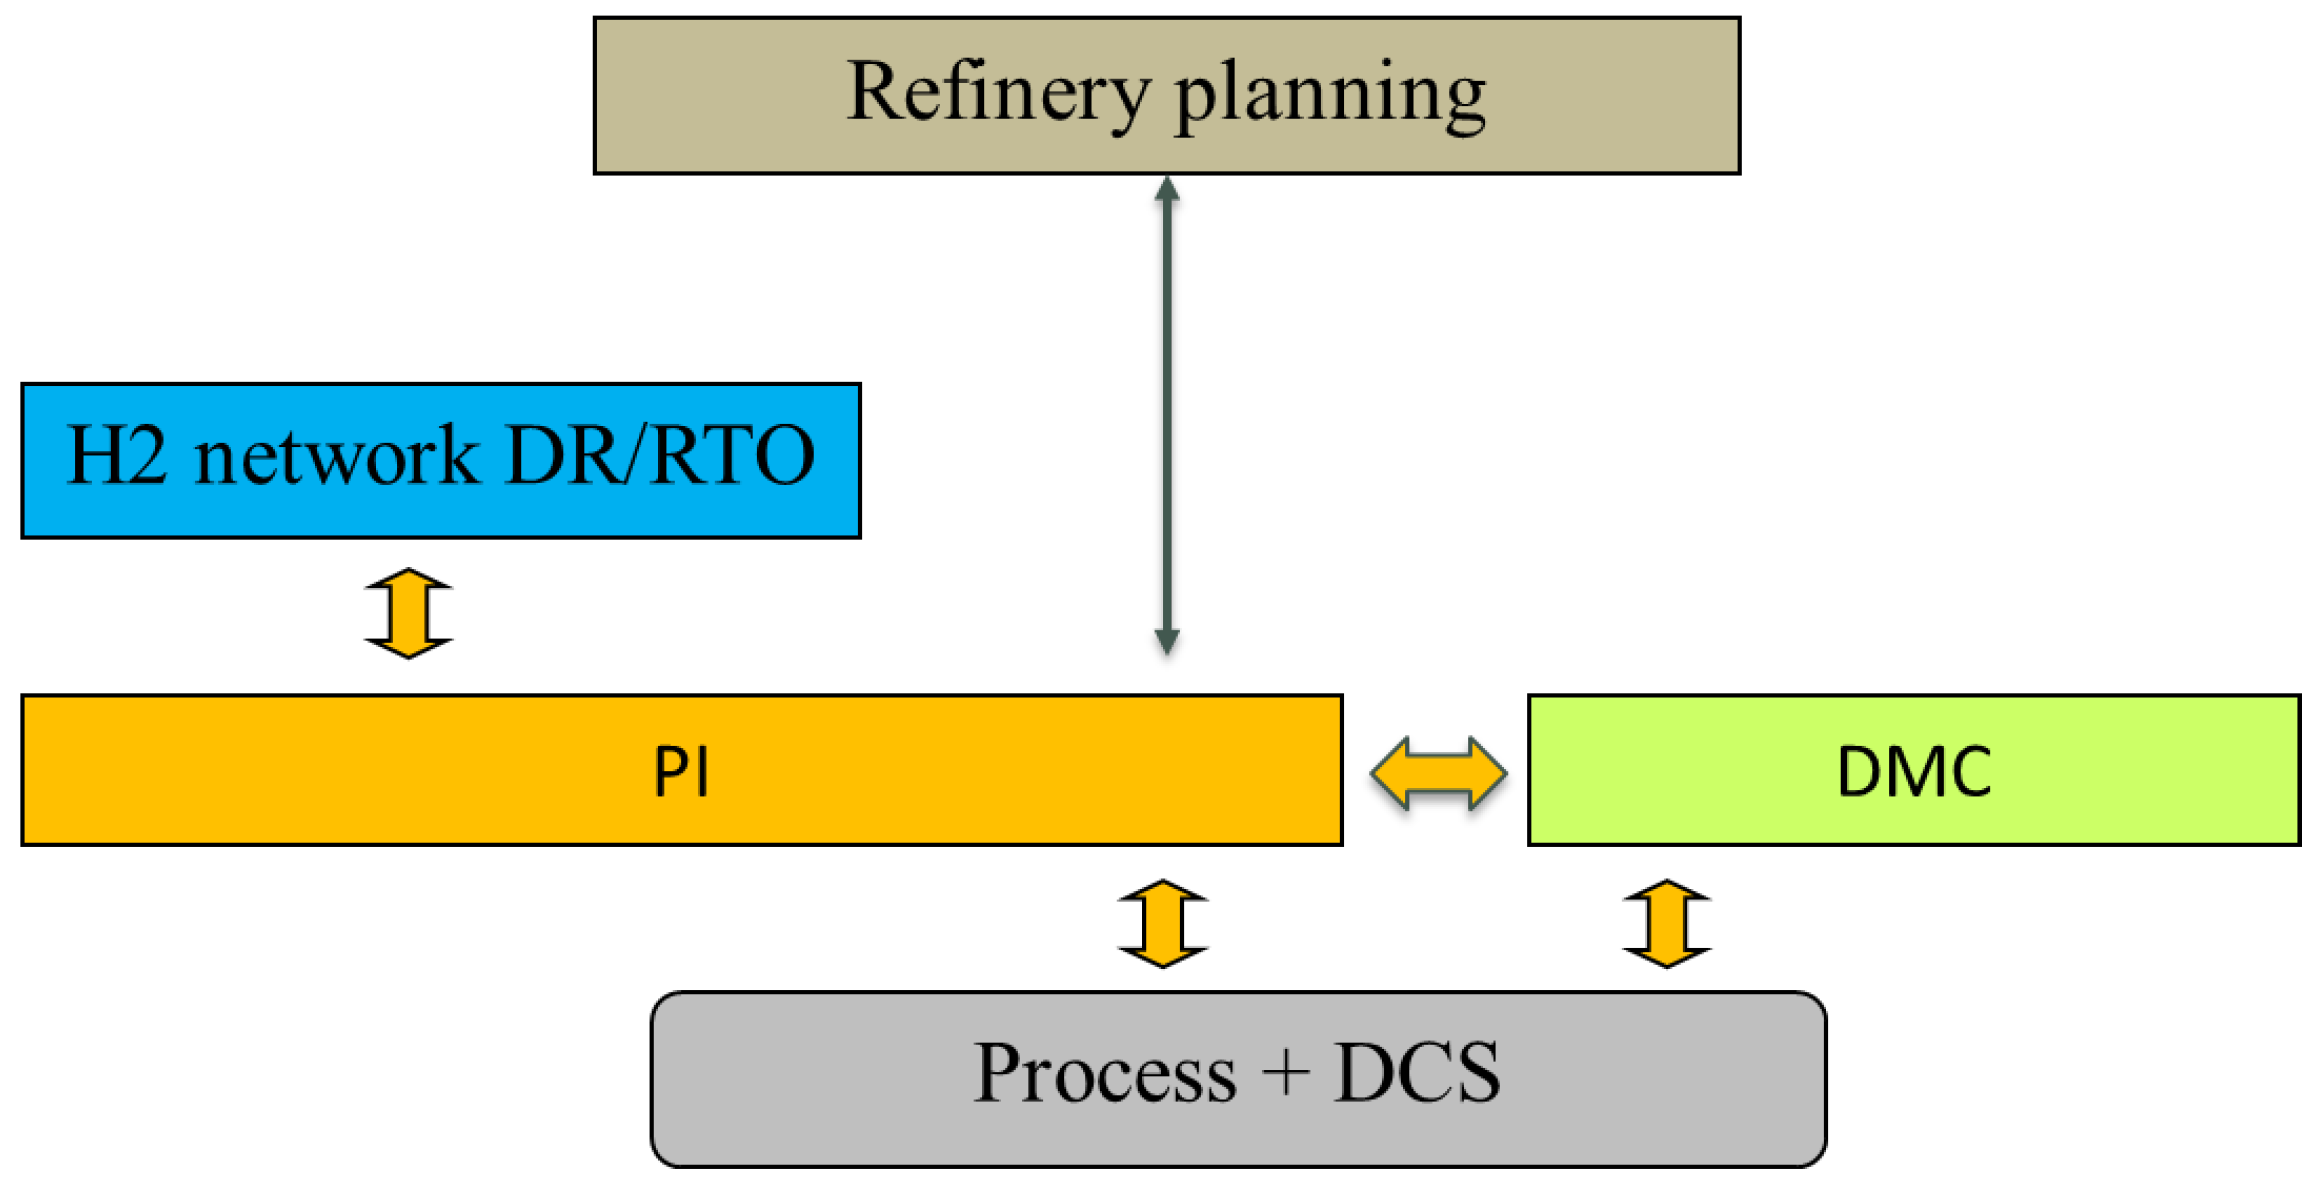
4.3. Planning, RTO and DMC Integration
The DMC is operating in the refinery, giving consistent improvements for several months. Its implementation represented a big step forward in the automation and optimal management of the hydrogen network of the refinery. Nevertheless, it covers only a subset of the total number of process plants and headers involved in the hydrogen network and it does not consider all possible hydrogen management strategies or non-linear effects. This is why further benefits can be obtained by additional use of the global information obtained from the data reconciliation and use of the network wide RTO solutions in a Decision Support System (DSS), which corresponds to stage three of the system implementation.
Main aims of the DSS can be summarized as:
Provide reliable and full information about the process functioning
Supervise the operation of the DMC and the hydrogen network
Identify ways in which the operation of the hydrogen network can be improved
Suggest changes that improve the DMC operation
Report to the planning system on the achievable targets and limiting constraints
Notice that both RTO and DMC have to operate in the framework of the refinery planning system, which sets production and quality targets for the various refinery products every two or three days according to the market and crude to be processed. This information is read from the PI system by the RTO and DMC and it is used in both to fix many operation ranges, targets and priorities. One example is the allowed range for the hydrocarbon load of a certain diesel HDS plant that should be maximized within that range, and the indication that increasing it has higher priority than the hydrocarbon load of other naphtha HDS. Nevertheless, that information does not cover all parameters involved in the RTO and DMC optimization problems. In particular, hydrocarbon prices in Equation (2a) or the weights of the four aims involved in the LP cost function of the DMC are not given explicitly. The reason is that assigning proper prices to intermediate hydrocarbon streams is not an easy task, mainly when the crude and outcomes of the refinery change frequently. Because of that, the HC prices in Equation (2a) and the weights of the LP have been considered as weighting factors reflecting the relative priorities of the products and aims involved. The way in which they are tuned includes extensive off-line tests in simulation to find sets of parameters that respond to different priorities of the several aims involved, combined with the on-line use of the priorities read from the planning system, which are associated with the selection of a specific set of parameters. The control room operators can activate buttons in the consoles of the DCS that modify the priorities and the cost function accordingly. Notice that, in this way, the cost functions themselves do not have a real economic meaning, but meaningful economic interpretation can be obtained from the values of the process variables proposed by the optimization.
The proposed system therefore operates taking into account the modules and interrelations displayed in
Figure 9. More than in a hierarchy, RTO and DMC operate in parallel, with the aim of using the RTO calculations to improve the operation of the DMC and to be a guide for other corrections. The PI real-time information system is at the core of the information flow, allowing the results of the Data Reconciliation/RTO to be used on-line by the different departments involved.
The software has been tested off-line extensively, incorporating updates, corrections and improvements, and it is now functioning on-line in the refinery.
5. Results
The benefits obtained from the implementation of the system can be classified in four types:
Improved network information
Increased hydrocarbon production
Better use of hydrogen
Integrated network management
Improved network information is the result of data reconciliation that provides reliable values of all process variables. This is important as a help to daily operation, because many of them were not available previously, e.g., hydrogen consumption in the reactors or purity of many streams. The estimated values of the main variables are now accessible to all staff in a dedicated application in the PI system in different formats, e.g., the one in
Figure 10. A significant part of the success of the data reconciliation step is due to the incorporation of robust estimators in the formulation of the problem that allow the obtainment of sensible solutions in spite of the presence of faulty instruments, as it is very difficult to not have something wrong in the plant instrumentation. Several estimators were tested, for instance, the Redescending, Fair and Welsh estimators, [
12] with the Fair function selected finally for its simplicity and good behavior.
However, the data reconciliation results are also important for other purposes, such as helping in the detection and correction of faulty instruments, as they allow one to focus attention on those instruments that present consistent deviations between what is measured and what is estimated. At the same time, the data reconciliation provides coherent values for other computations, among them, the possible revamping of the network structure and the updated model for RTO calculations or the computation of efficiency indicators in the network management. This last point is particularly important.
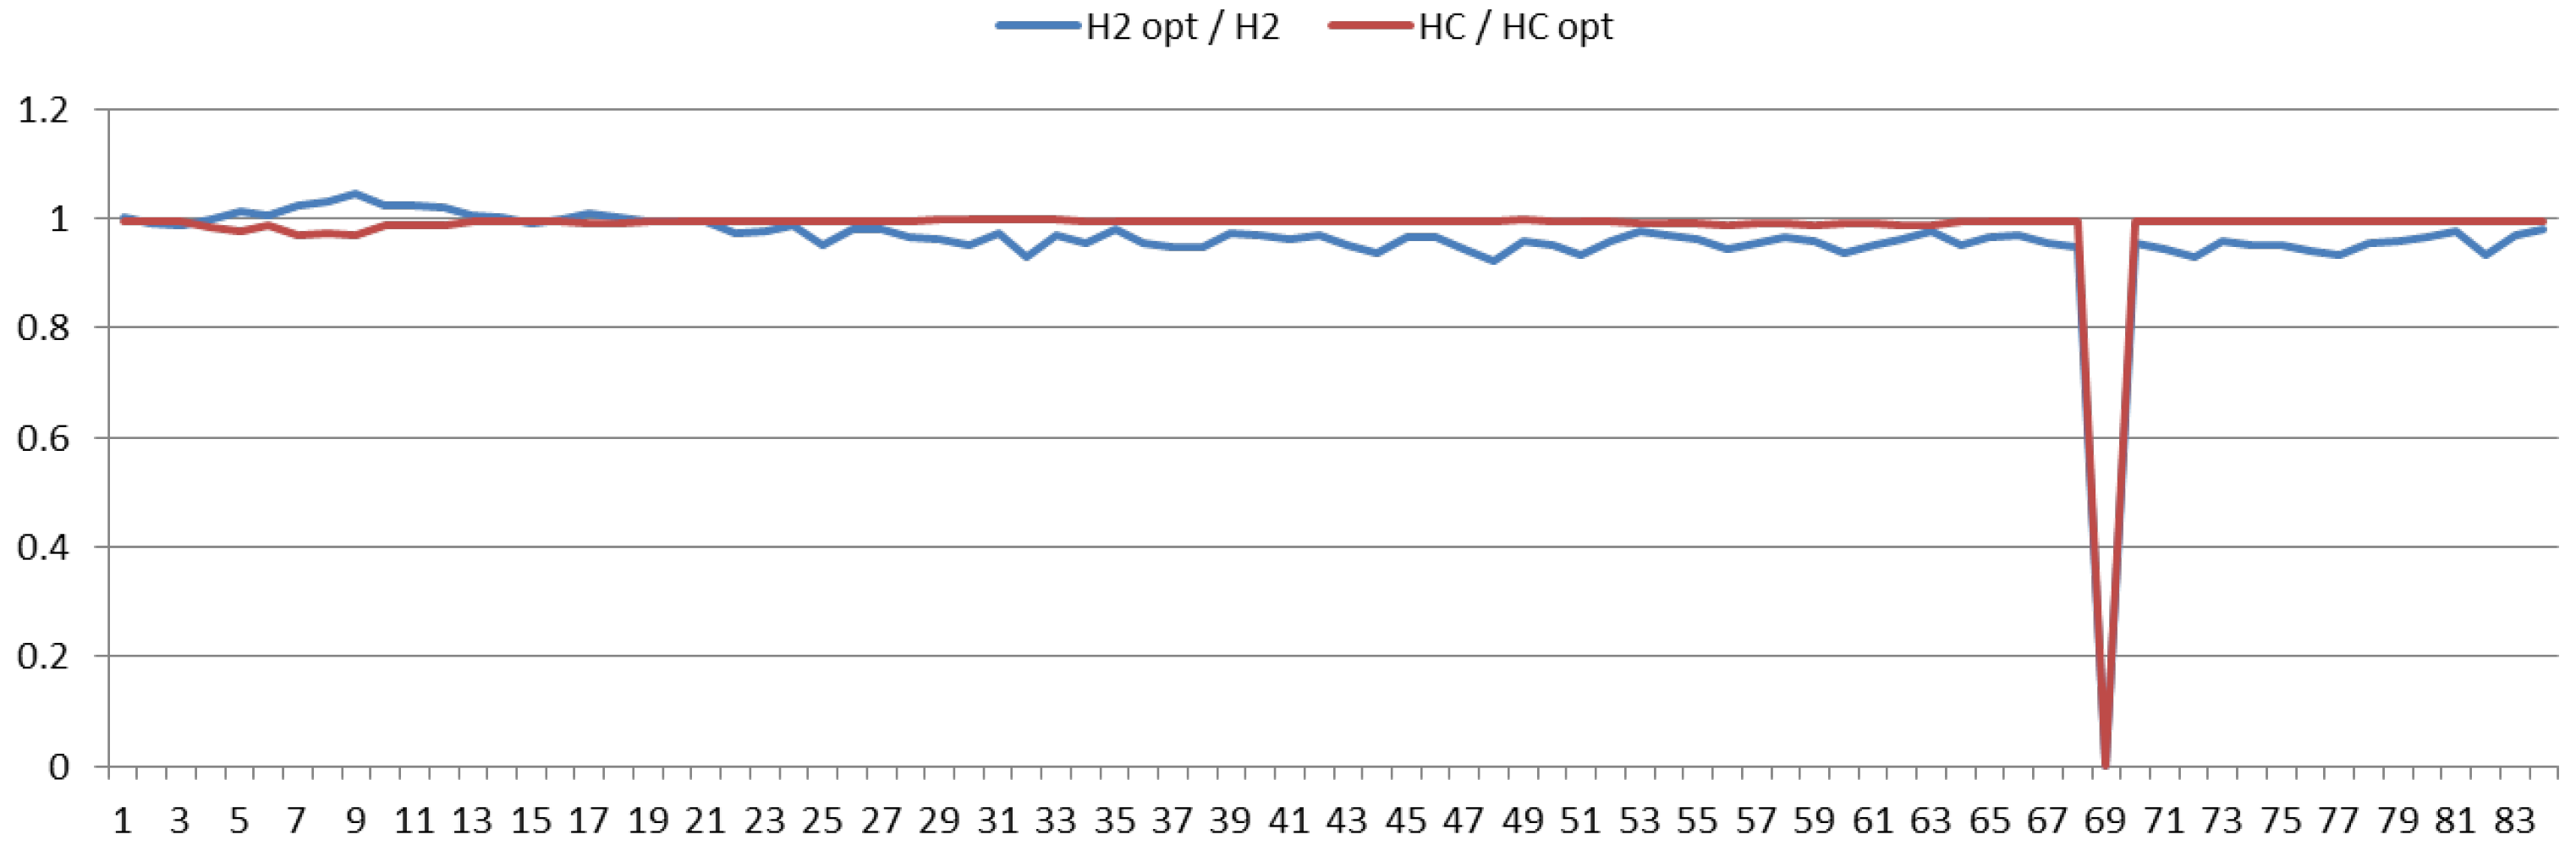
Supervision of the network operation is made using Resource Efficiency Indicators (REIs) that were defined in the MORE project [
13]. They are computed thanks to the availability of process values provided by the data reconciliation. Among them, the most useful ones are those that relate the actual value of a resource to the optimum one computed from the RTO solution, as they measure how well the process is reaching the targets computed by the optimization.
Two of them are displayed for one week of operation in
Figure 11 and refer to the ratio between the optimal and actual fresh hydrogen production (in blue) and the ratio between the actual and optimal hydrocarbon load to the consumers (in red), as shown in Equation 3. They are defined in such a way that they indicate better operation when they are close to one.
In the figure, we can observe that, for that week, the HC load is very close to the optimal value that can be attained according to the network conditions, while some savings of hydrogen are still possible. Notice that the hydrogen index in day one exceeds unity in day one because the hydrogen index on hydrocarbon has dropped, so both indicators have to be analyzed jointly. The graph also shows a short stop on day six.
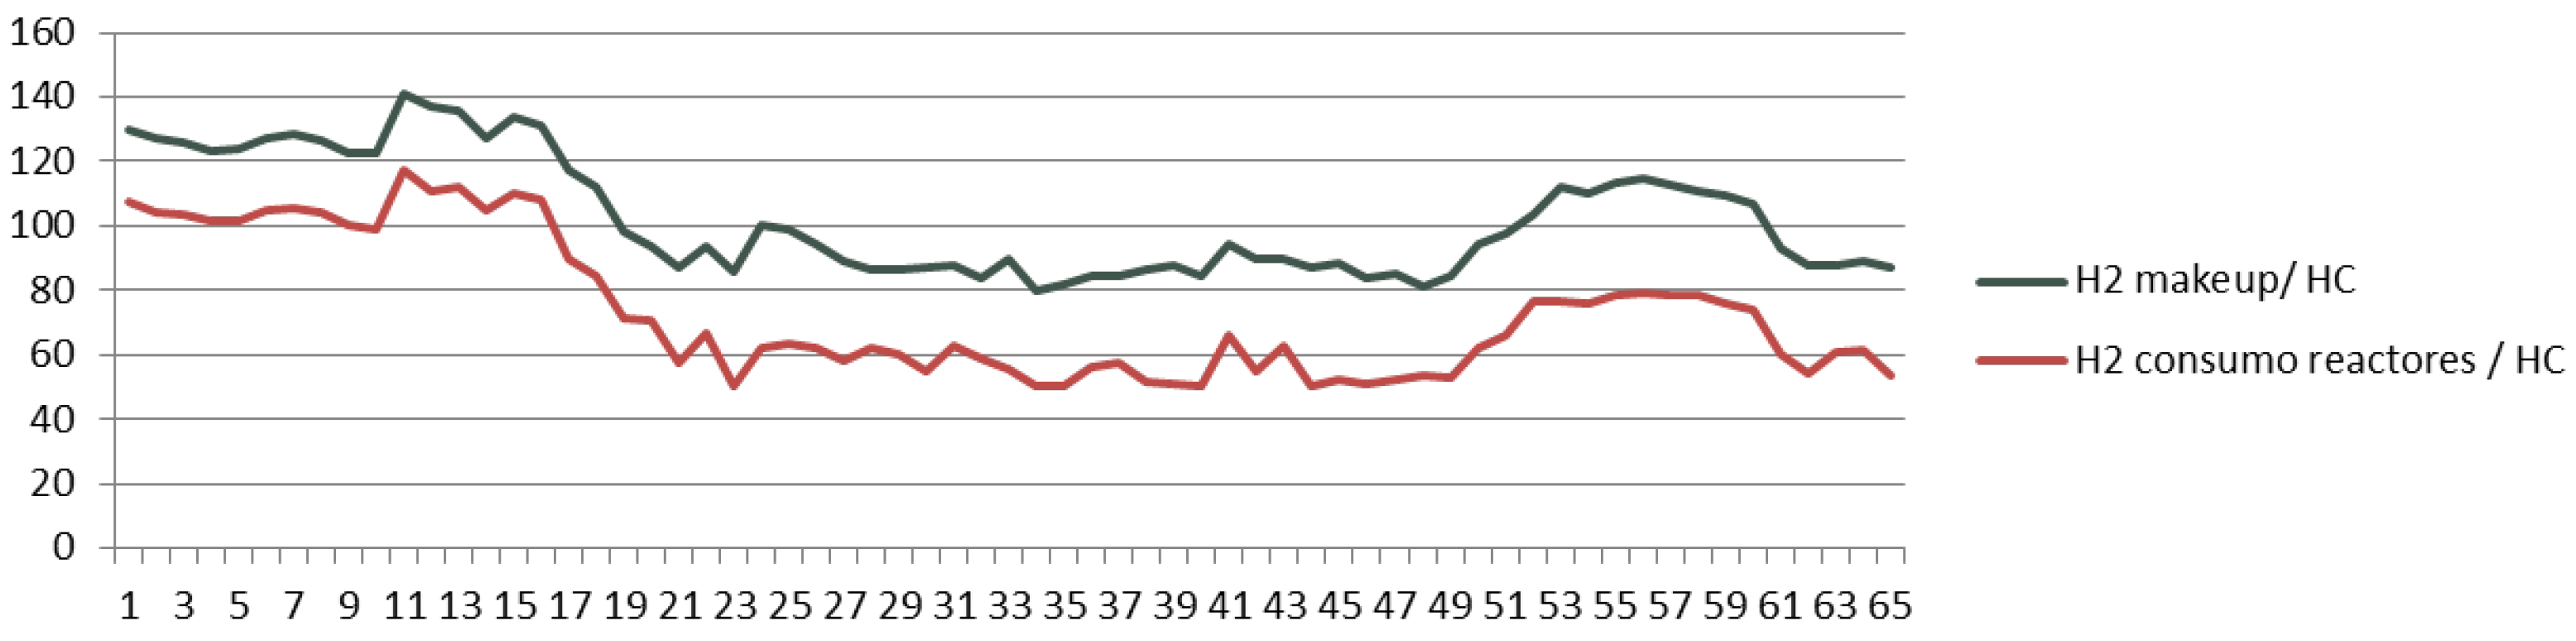
Other REIs are also computed, but the information provided by them suffers from the fact that they depend on the type of hydrocarbons being processed or the product specifications, which make them less useful for supervising the efficiency of the operation. As an example,
Figure 12 displays two of them: the specific use of makeup hydrogen (in blue) and the specific hydrogen consumption in the reactors (in red) of a certain HDS, for six days of operation. As can be seen, they experience stronger changes coinciding with the change of hydrocarbon processed around days two and five than during daily operation. However, the distance between the two curves gives useful information about the efficiency of the operation in the plant regarding the use of the hydrogen.
Improvements in the amounts of hydrocarbon processed and the use of hydrogen are also important benefits of the implementation of the system. Nevertheless, quantifying them is not easy. A sensible evaluation implies measuring something (costs, resources, …) before and after the implementation of a new system and comparing results in both situations to compute the gains. However, this procedure requires performing the comparison in the same conditions, i.e., setting a base line. The problem when evaluating the system described in this paper is that the raw material, targets and operating conditions change quite often, as seen in the example of
Figure 12, and it is very difficult to find similar situations in the eighteen plants involved in the hydrogen network for sensible periods of time. This is due mainly to the change in the crude being processed every few days, which may imply a noticeable variation in its properties, in particular hydrogen demand.
Keeping this in mind, it is possible to perform evaluations of the results, disconnecting and connecting again the DMC for short periods of time when the operating conditions do not change significantly, and comparing the values before and after. Based on this procedure, it is possible to estimate a saving of 2.5% in the hydrogen production, while the increment of hydrocarbon loads is more difficult to estimate by this procedure, because the operators tend to be kept constant. In any case, there has been a clear improvement of the operating conditions since the online DMC started functioning, in the sense that hydrogen availability is no longer a bottleneck for production. Nevertheless, this period coincided with an average supply of lighter crudes to the refinery, so it is difficult to assign numbers to both factors. At the same time, indicators such as REI
2 in Equation (3) provide values close to one for long periods of time, as in
Figure 11, indicating that hydrocarbon production, which is the most valuable target, approached the maximum feasible according to the operating conditions and the targets fixed by the refinery planning.
In addition to providing indicators to supervise the behavior of the network under the DMC, improvements to the network operation can be obtained by the analysis of the results of the RTO optimization compared to the actual operating conditions. At present, the teams involved in the analysis are the ones that have developed the system, but the trend is to move it to the personnel responsible for the network management in the control rooms. For this purpose, the main results are displayed in the PI information system for every plant as in
Figure 11, where, by clicking on the different tags, one obtains displays of trends of the measured, estimated, optimized variables and REIs, facilitating the analysis to the staff involved in decision making in the refinery.
Below are two of the main points where the analysis is focused:
One is the hydrogen distribution strategies. Notice that the RTO considers the whole network, while the DMC only considers a subset of the plants and headers and does not manipulate certain elements as e.g., the membranes. This means that sometimes there is room for further improvements, implementing a different hydrogen redistribution policy, as the feasible set of actions is larger in the RTO. For instance, in the case of the membranes, as the DMC does not manipulate them, the operators fix their behavior according to local needs, while the RTO can compute the best way of operating them according to the global aims.
The second refers to the identification of persistent active constraints in the optimization that stop further changes in some variables that could improve the attainment of the targets. Examples include the maximum compressor capacity in a recycle or minimum hydrogen purity in a high-pressure separator. The limiting values of the constraints can be structural or operational, and should be analyzed individually to see the convenience of changing them. In order to select the important ones, the value of the associated Lagrange multipliers can be used as they provide the sensitivities of the cost function w.r.t. the constraints, indicating the benefits that could be obtained by every unit change in the value of the constraint. Referring to the above examples, the compressor capacity is a structural decision that is linked to a unit revamping, but the minimum hydrogen purity is operational and could be relaxed, for instance, at the end of life of the reactor catalyzer.
The results of the analysis can be implemented or not considering the efforts involved and expected benefits, which require familiarity with the process and global views of the problems. This is not a problem with the technical staff, but further training is required with the constraint analysis and the interpretation of the Lagrange multipliers.
The implementation of the results of the analysis follows two paths:
The application of the hydrogen redistribution strategy, deciding, for instance, on a different use of the membranes or proportions in the hydrogen feed sources. Notice that changes in the global strategy of hydrogen distribution can help the DMC to reach its own aims. At the same time, this can help to evaluate the convenience of extending the DMC to other plants or controlled and manipulated variables not included within its scope.
The possible changes on some DMC constraints. As an illustrative example, we will mention the ratio hydrogen/hydrocarbon in a plant. Data reconciliation estimates its current value, which is imposed as a lower bound to the RTO as a way to protect catalyst life. However, the DMC may use other limiting expressions, e.g., the linearized model of the hydrogen partial pressure obtained experimentally in a certain operating point. If the last one is consistently active and the ratio hydrogen/hydrocarbon is not, one may decide to change the DMC constraint accordingly, obtaining more space for improvements, while keeping a safe operation.
Finally, the forth benefit obtained from the system refers to the implementation of feedback to the upper planning layer. The identification of gaps between the targets given by the planning system of the refinery and what the RTO/DMC compute as feasible targets according to the current condition is valuable information for better tuning and improvements of models in the planning layer. In the same way, the detection of active constraints and sensitivity analysis complement this information that can be relevant when deciding changes in the elements of the plant, such as the compressors’ capacity that was mentioned above.
6. Discussion
Development and implementation of the system described above have been the outcome of a fruitful cooperation between the industrial and academic teams over several years which is giving clear benefits in terms of better process information, increased production, and savings in the use of hydrogen and smoother operation. Overall, the system implemented in the refinery is a clear improvement in the efficiency of the use of resources and represents a significant step forward to further integration with other advanced systems in the refinery and enhancements of its functionality.
Nevertheless, the project is still under development, and several problems are open to further research. Among them, model maintenance appears as a key one to maintain the system alive for a long period of time. Revamping or major changes are not infrequent in all process plants, and this requires model (and optimization) adaptation, which should be generated automatically from some type of schematic.
The RTO system could also be improved in two directions: One is by incorporating a measure of the uncertainty present in the process, either using stochastic optimization of the modifier adaptation approaches, as we are aware that the two-step approach of data reconciliation and RTO can lead to suboptimal targets in the presence of structural errors. The other one is considering plant dynamics at this level, so that the non-linear effects could be better taken into account.
Regarding the analysis of the RTO solutions and decisions about their implementation, the development of on-line tools, such as predictive simulation, could help to better evaluate and increase the confidence in the results.
Finally, the current model could also be used as the base for studies on the convenience of larger structural changes in the hydrogen network, using superstructures and MINLP software to discover possible optimal solutions not considered at present.


 ,
, 