Article

From Single Microparticles to Microfluidic Emulsification: Fundamental Properties (Solubility, Density, Phase Separation) from Micropipette Manipulation of Solvent, Drug and Polymer Microspheres

1
Department of Physics Chemistry and Pharmacy, University Southern Denmark, Odense 5230, Denmark
2
EmulTech b.v., Eindhoven 5600 AB, The Netherlands
3
Nature Science and SUND, University Southern Denmark, Odense 5230, Denmark
4
Department of Mechanical Engineering and Material Science, Pratt School of Engineering, Duke University, Durham, NC 27708-0300, USA
*
Author to whom correspondence should be addressed.
Processes 2016, 4(4), 49; https://doi.org/10.3390/pr4040049
Submission received: 30 October 2016 / Revised: 18 November 2016 / Accepted: 25 November 2016 / Published: 30 November 2016
(This article belongs to the Special Issue Emulsification Processes)

Abstract

:
The micropipette manipulation technique is capable of making fundamental single particle measurements and analyses. This information is critical for establishing processing parameters in systems such as microfluidics and homogenization. To demonstrate what can be achieved at the single particle level, the micropipette technique was used to form and characterize the encapsulation of Ibuprofen (Ibp) into poly(lactic-co-glycolic acid) (PLGA) microspheres from dichloromethane (DCM) solutions, measuring the loading capacity and solubility limits of Ibp in typical PLGA microspheres. Formed in phosphate buffered saline (PBS), pH 7.4, Ibp/PLGA/DCM microdroplets were uniformly solidified into Ibp/PLGA microparticles up to drug loadings (DL) of 41%. However, at DL 50 wt% and above, microparticles showed a phase separated pattern. Working with single microparticles, we also estimated the dissolution time of pure Ibp microspheres in the buffer or in detergent micelle solutions, as a function of the microsphere size and compare that to calculated dissolution times using the Epstein-Plesset (EP) model. Single, pure Ibp microparticles precipitated as liquid phase microdroplets that then gradually dissolved into the surrounding PBS medium. Analyzing the dissolution profiles of Ibp over time, a diffusion coefficient of 5.5 ± 0.2 × 10⁻⁶ cm2/s was obtained by using the EP model, which was in excellent agreement with the literature. Finally, solubilization of Ibp into sodium dodecyl sulfate (SDS) micelles was directly visualized microscopically for the first time by the micropipette technique, showing that such micellization could increase the solubility of Ibp from 4 to 80 mM at 100 mM SDS. We also introduce a particular microfluidic device that has recently been used to make PLGA microspheres, showing the importance of optimizing the flow parameters. Using this device, perfectly smooth and size-homogeneous microparticles were formed for flow rates of 0.167 mL/h for the dispersed phase (Qd) and 1.67 mL/h for the water phase (Qc), i.e., a flow rate ratio Qd/Qc of 10, based on parameters such as interfacial tension, dissolution rates and final concentrations. Thus, using the micropipette technique to observe the formation, and quantify solvent dissolution, solidification or precipitation of an active pharmaceutical ingredient (API) or excipient for single and individual microparticles, represents a very useful tool for understanding microsphere-processes and hence can help to establish process conditions without resorting to expensive and material-consuming bulk particle runs.

Graphical Abstract

1. Introduction

Emulsions and other colloidal materials are usually studied as multi-particle suspensions. Processes that the emulsion may undergo include formation, creaming, settling, coalescence, coagulation, Ostwald-ripening, dissolution, solvent-exchange, phase separation, and phase inversion. Although the scale-up of emulsion formulation at a manufacturing level has been well-established, in order to improve and develop the study of emulsions and polymer microparticles, for example, of drug encapsulation in a biodegradable PLGA polymer particle, it would be an advantage to be able to make observations of individual particle formation as a function of composition, any emerging structure, and measurements of fundamental properties like mechanical deformation of these materials at the single microparticle level.
In this respect, we introduce here our micropipette manipulation technique [1,2,3,4], capable of making fundamental single particle measurements and analyses, and how this information is critical to processing parameters such as in microfluidic processing, and also homogenization. Thus, in this paper, where we start to combine the two techniques, we simply wanted to introduce and show that the micropipette manipulation technique can guide certain aspects of scale-up study associated with parameters especially the use of microfluidic devices. We introduce a particular microfluidic device, that of de Bruijn that has recently been used to make PLGA microspheres [5], where the flow parameters have been critically established, as an example of where the pairing of the two technologies could impact future emulsion and microparticle processing. This contribution to the special edition of “Emulsification Processes” therefore presents and discusses both technologies and suggests that these technologies can support each other to study the fundamental properties of microparticle formation. Thus, we believe that introducing these details of each technique can inform readers of the major concepts of single particle studies and scaling up of microparticle formation to the manufacturing level.

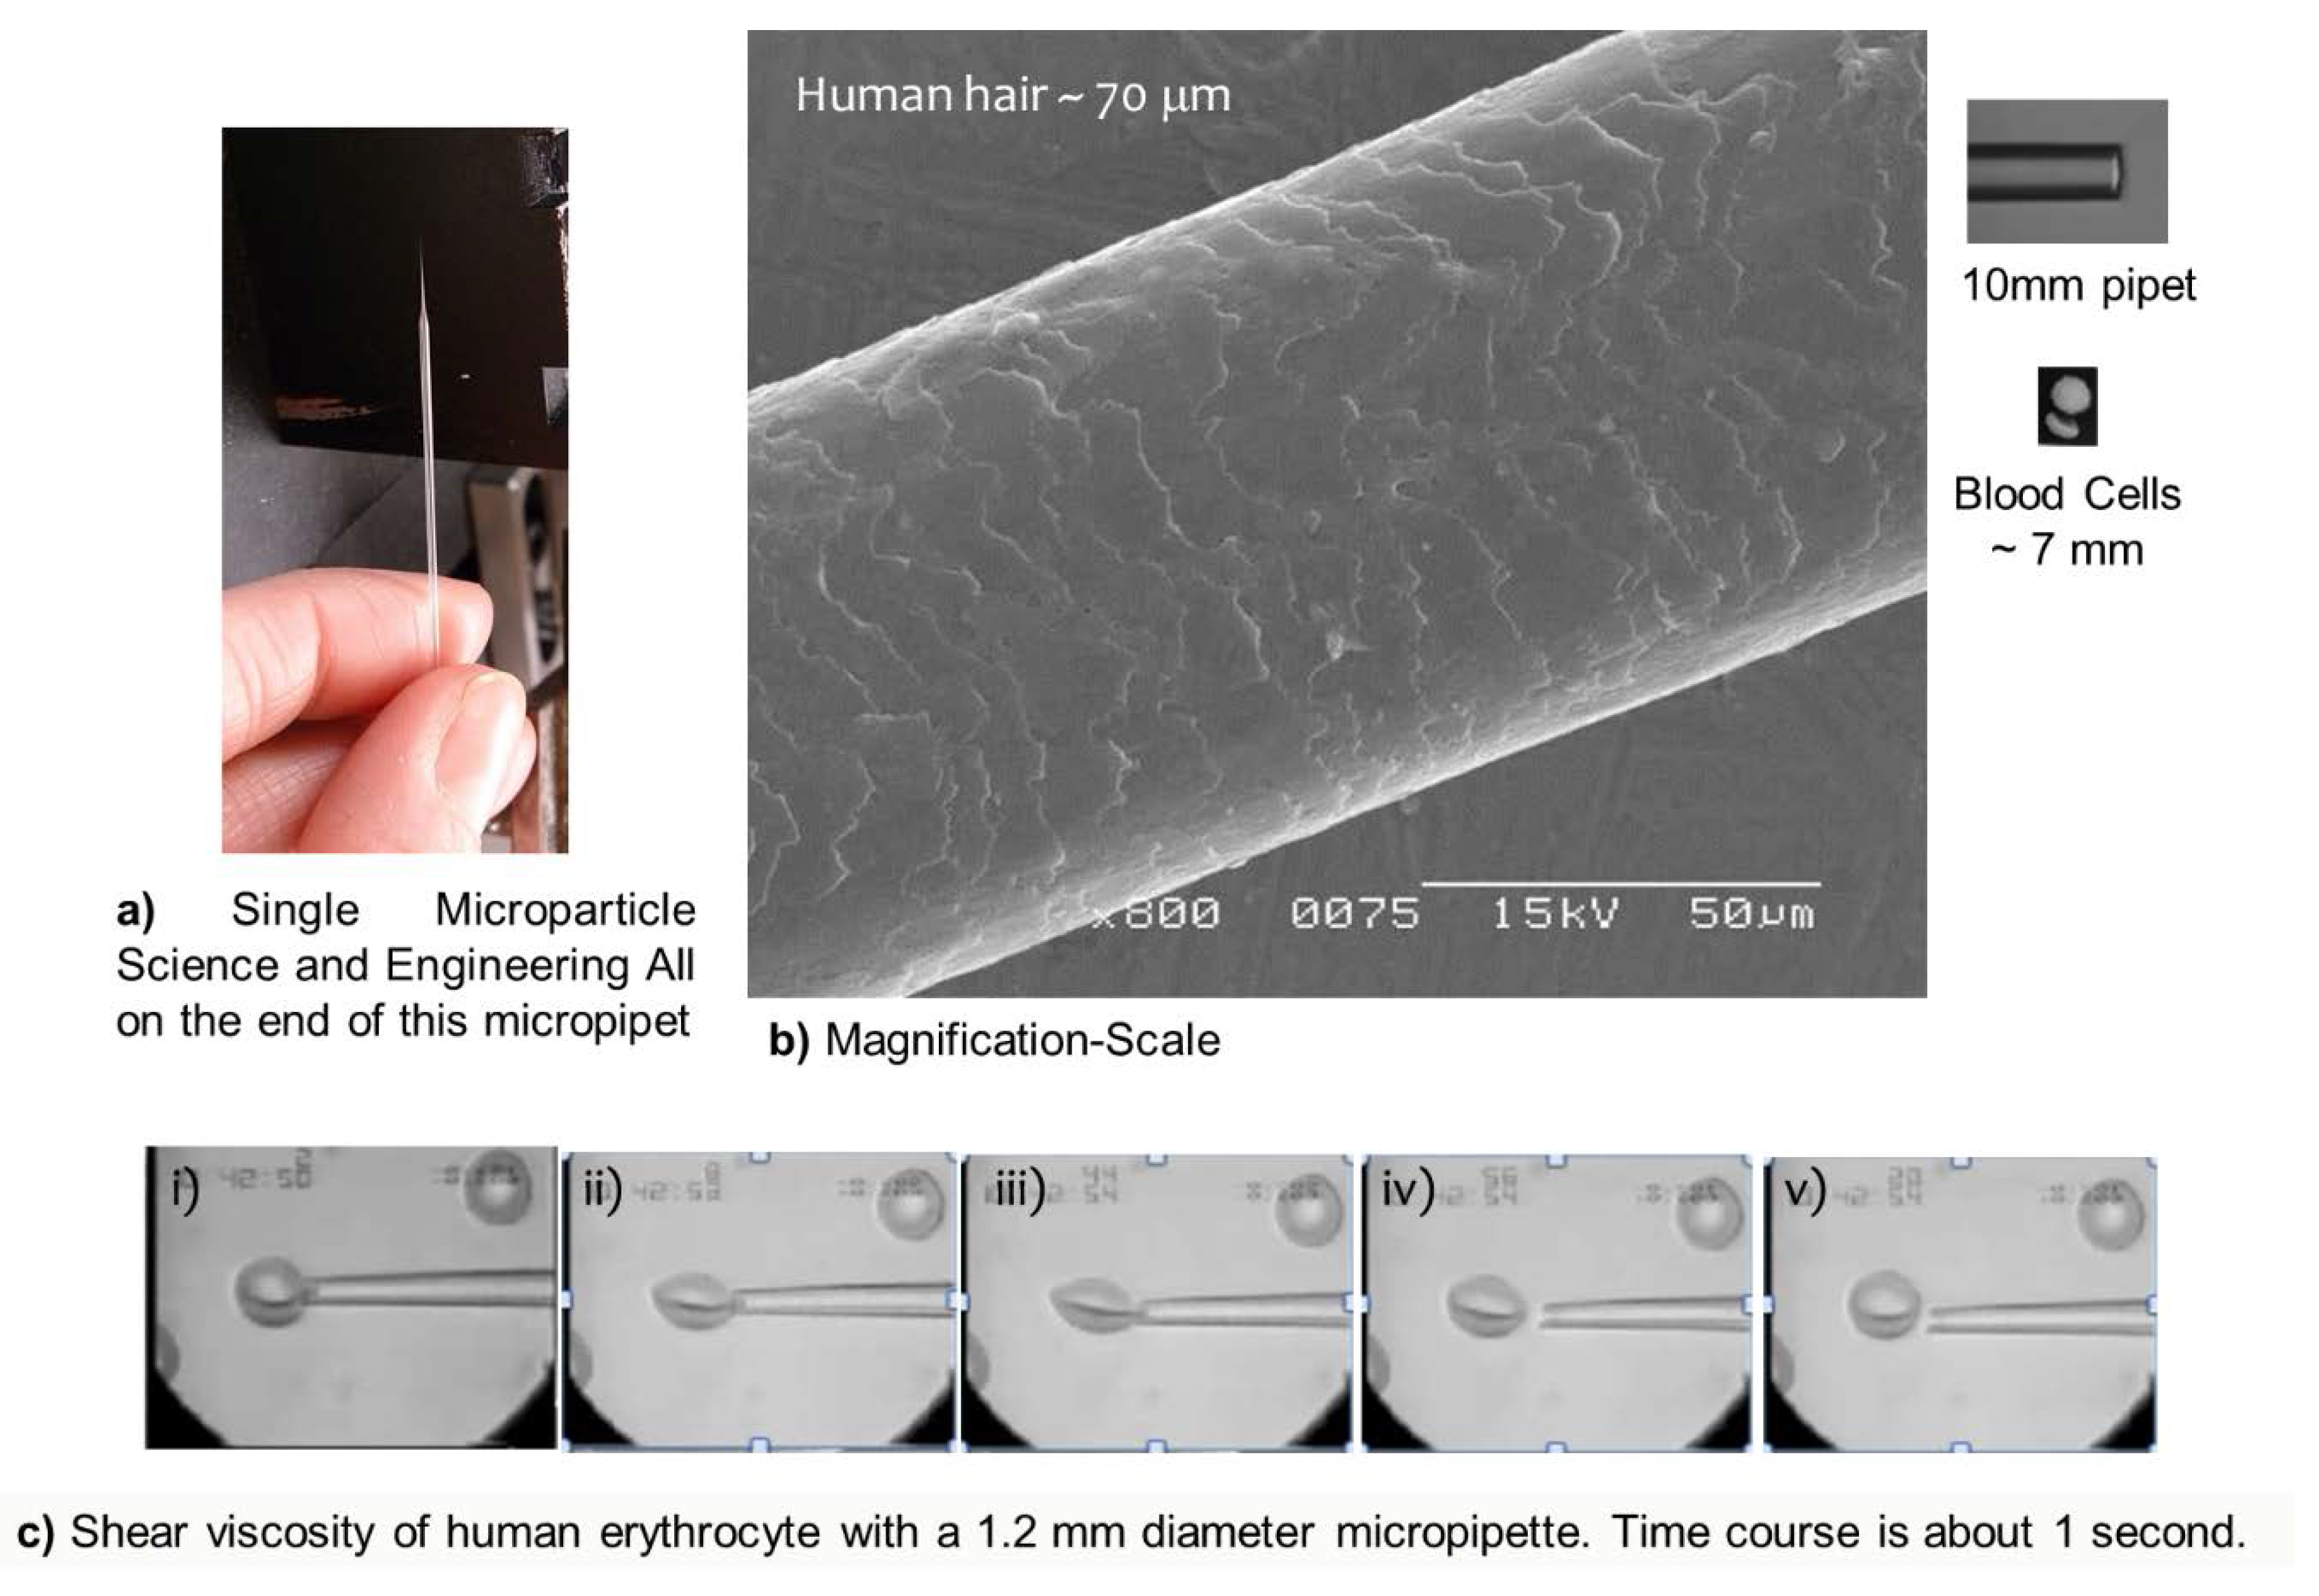
1.1. The Micropipette Technique

As shown in Figure 1b, if a human hair is 70 μm in diameter, the micropipette tip we routinely use to manipulate single microparticles is around 10 μm, and compares with the size of red- and white-blood cells that are on the order of 7 μm diameter. In some of the original studies that used micropipette techniques for exploring the micromechanical properties of biological cells, it can be as small as 1.2 μm for experiments with single erythrocytes, as shown in the experiment pictured in Figure 1c. Hochmuth et al., as far back as 1979 [6], the deformation of red blood cell under micropipette aspiration was already measured. An initial aspiration of the discoid erythrocyte membrane, that was point-attached to the glass cover slip, allows the cell to be extended in shear to full extension as the micropipette is moved back. The cell was then released by reducing the suction pressure to zero, and was observed to recoil elastically, limited by its intrinsic membrane shear viscosity, returning to its discoid shape in ~1 s. This could be repeated several times, as shown in the Video S1 in Supplementary Materials.
As reviewed in a series of recent papers [7,8,9,10], experimental developments in micropipette manipulation, measurements, analyses, and modeling were initially focused on biological cells, principally the red and white blood cells. Since the pioneering studies on sea-urchin eggs of Mitchison and Swann in 1954 [11,12], and ten years later, when Rand and Burton were interested in the problem of the shape of the red cell [13], these micropipette techniques have provided a unique ability to apply well-defined stresses for dilation, shear, and bending modes of membrane and cellular deformation. The simultaneous measurement of strain, and rates of strain, resulting from these applied stresses has generated the elastic moduli and viscous coefficients for cell membrane material, and the cellular constituents [14] of individual erythrocytes [15], leukocytes [16], and cancer cells [17] as well as their inter-surface interactions [18].
Starting in the 1980s, the technique was adapted and developed by Evans and Kwok [19,20] and then by Evans and Needham [21] to study the ultra-thin, two-molecule-thick lipid bilayer membrane of individual Giant Unilamellar Vesicles (GUVs) of various lipid compositions [10]. A recent insightful, retro- and pro-spective, review on the mechanics and thermodynamics of lipid biomembranes has been given by Evans et al. [22]. It emphasized the inherent softness of fluid–lipid biomembranes and the important entropic restrictions inherent in the elastic properties of vesicle bilayers exemplified by experimental results from studies of neutral phosphatidylcholine (PC ) lipid bilayers, and especially ones containing cholesterol. Thus, the technique and mechano-chemical analyses have been well established for micromechanical studies and mechanistic understanding of biological cells and lipid vesicle membranes.
It was with this background and knowledge that Needham et al. took the technique into the realm of colloidal particles and interfaces. First used in a non-mechanical way in 1998 to simply position micro-hydrogel beads with and without a loaded-drug (doxorubicin) in a controlled flow field of different pH [23,24], the micropipette technique was then developed by Needham et al. [1,2,3,4,25,26,27,28,29,30,31,32,33,34,35,36,37], Tony Yeung et al. [38], and others, in a series of papers on adsorption at interfaces and two-phase oil-aqueous systems. It has now become a highly versatile experimental setup that allows a wide variety of studies at microscopic interfaces and with single- and pairs- of microparticles. Among other applications, the technique has been established for studying solvent dissolution, measuring fundamental properties such as diffusion coefficients and solubilities of the dissolving liquids [4,27,30], and for evaluating the phase separation, precipitation of droplets containing different solutes upon solvent loss, such as the micro-glassification of proteins by fast removal of water into water-imbibing solvents like octanol [3,31], and drug-containing polymer microspheres by removal of the organic solvent into water [28,29]. It is this last application that has motivated and guided the current studies with poly(lactic-co-glycolic acid) (PLGA) microparticles containing Ibuprofen [34].

1.2. Microfluidics

Microfluidic emulsification, or “droplet microfluidics”, has been reported since 2001 as a tool for generating uniform droplets in a carrier liquid [39]. In therapeutic applications, microspheres are complex formulations employing a carrier material, typically a biodegradable polymer, that molecularly, or physically, encapsulates an active pharmaceutical ingredient (API), typically a drug substance. The usual goal is to achieve a well-controlled sustained-release of the encapsulated drug for subcutaneous or intramuscular depot delivery, which is mostly achieved by degradation of the polymer in vivo, providing prolonged exposure to drug substances that would otherwise have been cleared quickly if simply injected as a solution. These formulations can deliver high added value in difficult and chronic treatments, by providing therapeutic quantities of an API for months of treatment in one injection. Especially retinal diseases and other intraocular pathologies can effectively be treated by using biodegradable microspheres [40]. One of the most well-known controlled-release microsphere systems is the commercially available Lupron depot [41], a synthetic gonadotropin-releasing hormone used in men to treat the symptoms of prostate cancer, and in women to treat symptoms of endometriosis or uterine fibroids. Despite its commercialization, on-going research is still being carried out [42] on the effects of various incubation media on release from leuprolide-loaded PLGA microspheres in order to more fully understand the influence of external pH, plasticization, and buffer type on mechanism of accelerated release. As described in general in many reviews [43], while PLGA has been well-studied as a polymeric carrier for biodegradable microparticles, multiple factors affect their formation and API release. These include: polymer molecular weight; viscosity of the internal phase of the emulsion formed when preparing the microspheres; the content of terminal COOH groups on low-molecular-weight polymers; and indeed the burst release —an ever-present problem that appears to be somewhat due to the use of lyophilized material. In general, each of these has to be evaluated and solved case-by-case.
Microfluidic emulsification is an excellent tool to prepare microspheres and microbeads, because of the direct production of droplets and elimination of errors and disruptions related to turbulent processes like homogenization. Moreover, the approach developed by de Bruijn et al., in the patent “Process for preparing monodispersed emulsions” [5], adds exquisite control over the droplet formation and eventual microparticle size. Optimizing the operating flow conditions provides consistent size and eliminates fouling and other process failures. What de Bruijn et al. have established is a unique process for preparing a microscopic emulsion where flow rates are controlled dependent on a series of physicochemical parameters [5].

1.3. Ibuprofen Formulations

Ibuprofen [2-(4-isobutylphenyl) propionic acid] (Ibp) belongs to the clinically designated group of non-steroidal anti-inflammatory drugs (NSAID). It is one of the most commonly used pain relievers due to its effectiveness and high tolerability when taken orally in recommended doses of 200 mg and 400 mg [44]. However, the long-term use of Ibp and related NSAIDs are associated with a variety of well-recognized side effects [45], in particular those involving the gastro-intestinal system (GIT) such as erosions and ulcerations, because of loss or diminished protection of the GIT mucosa. Therefore, in order to reduce such side effects during NSAIDs treatment of patients, a localized therapeutic approach that is based on the development of intra-articular drug delivery systems has been suggested [46,47,48,49,50]. In order to improve the permanence of drugs in the joint cavity, biodegradable polymers including PLGA have been proposed with the ability to provide long-term sustained release, and maintain a therapeutic concentration of drug in joint cavity [51]. Fernandez-Carballido et al. addressed the problem of previous studies where Ibp shows a high initial burst when formulated as microspheres. In order to get a more controlled release rate of Ibp, a biodegradable oil, Labrafil® (M1944CS, polyethylene glycol 300 derivative), was used as an additive and lowered the initial Ibp burst, prolonging the release rate of the drug from 24 h (without additive) up to 8 days incorporating the oil.
Also, of note, Ibp has been considered and tested in vitro for non-traditional uses including as an anti-cancer agent. Bonelli et al. [52] delivered Ibp by PLGA nanoparticles to a cell culture of the human gastric cancer cell line MKN-45, and found that they exerted anti-proliferative activity at concentrations ~100 times less than free Ibp administration.

1.4. The Main Aims of This Work

The aims of the present work are to introduce a new single-microparticle technique for studying emulsified solvent and drug-microparticle dissolution, as well as polymer microsphere-drug formation, and use it to characterize the encapsulation of Ibp into PLGA microspheres, measuring the loading capacity and solubility limits of Ibp in typical PLGA microspheres. Working with single microparticles we also estimate the dissolution time of pure Ibp microspheres in buffer or in detergent micelle solutions, as a function of the microsphere size and compare that to calculated dissolution times using the Epstein-Plesset model [53] as developed for the droplet dissolution [27]. Other characterization was also of interest including the extent to which Ibp would undergo supercooling, i.e., if it was a solid microparticle or still liquid, when it was precipitated by the solvent dissolution as the pure material.

2. Materials and Methods

2.1. Materials

Ibuprofen sodium (purity ≥ 98%) was purchased from Fluka Analytical. Poly(d,l-lactide-co-glycolide) (PLGA) 50:50, MW(average) 54,000–69,000, Sodium dodecyl sulphate (SDS, ≥99.0%), dichloromethane HPLC grade, buffers and other reagents were obtained from Sigma Aldrich (Saint Louis, MO, USA). Hydrochloric acid (HCl) and ethanol 96% were purchased from VWR.

2.2. Preparation and Recrystallization of Ibuprofen H

Ibp crystals were obtained by precipitating the sodium-form of Ibp and then recrystallizing it using dichloromethane (DCM). The aim with this approach was to obtain the low water-soluble form of Ibp, and use it as a hydrophobic model drug. Ibp was precipitated as the free acid form (Ibuprofen-H), by first solvating 1.5 g of Ibp-Na with 5 mL Milli-Q water, forming a clear solution, where the concentration of Ibp-Na was below the solubility limit. This solution was then acidified by adding an excess amount (3 mL) of 1N HCl to the solution, giving a pH of the mixture of 1.4. The predicted pKa value of Ibp used was 4.41. The formed suspension was vacuum-filtered, and Ibp was recrystallized from DCM, dried in an oven for 2 h at 55 °C to remove any residual solvent or water, and stored at 4 °C.

2.3. Thermal Characterization of Ibuprofen

The crystallized Ibp was thermally characterized using a Differential Scanning Calorimetry (DSC) apparatus (Perkin-Elmer, DSC 8500, Waltham, MA, USA). This was done in order to assess the crystallinity, melting point, enthalpy of fusion and possible polymorphism of Ibp. The DSC apparatus utilized a liquid cooling system, with a gas flow of 20 mL/min. Samples of Ibp were accurately weighed (3.5–5 mg) in a 30 µL aluminum pan, and hermetically sealed. A heating rate of 10 °C/min was used, and the range of the temperature-scan was between 30 and 100 °C. After an initial heating, the sample was held for 1 min at 100 °C, and then cooled at 10 °C/min to 30 °C thereby bracketing the melting transition of Ibp (measured in the literature to be ~75 °C [54,55]). Because of evidences of supercooling, in some instances the sample was taken to −10 °C, and then reheated. The thermograph was analyzed on the associated software, PYRIS (PerkinElmer), in terms of onset of melting temperature and enthalpy of fusion. Three sample measurements were conducted.

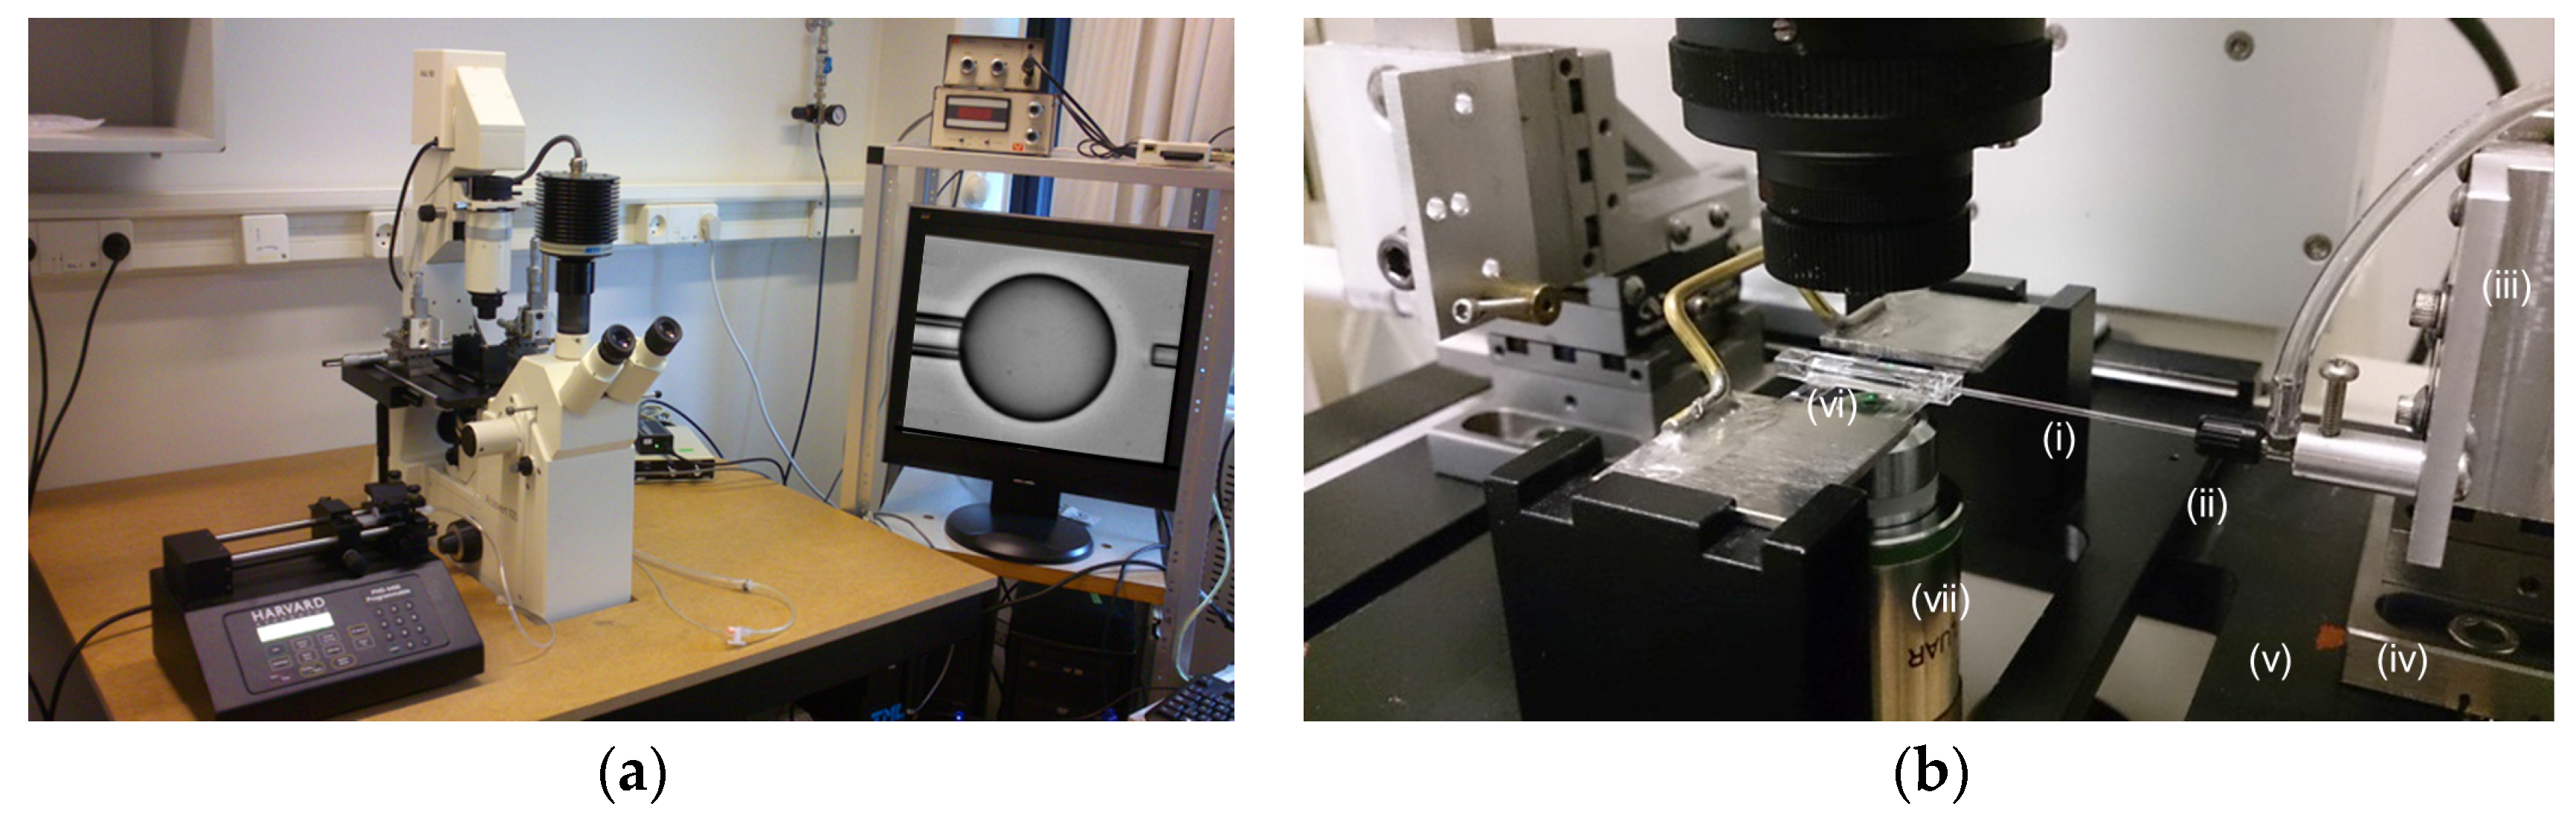
2.4. The Micropipette Technique

As shown in Figure 2, the micropipette manipulation technique is centered around an inverted microscope that can mount up to 4 micromanipulators directly on the microscope stage plate [9,56]. Control over micropipette suction pressure is in the range of micro-atmospheres to tenths of atmospheres (0.1 N/m2 to 10,000 N/m2) and is achieved by a water-filled manometer equipped with a sensitive micrometer-driven displacement and coarser syringe control; positive and negative pressures are recorded by in-line pressure transducers (Validyne, Northridge, CA, USA).
A temperature-controlled chamber allows the sample temperature to range from 5 °C to 50 °C. Recent increases in data storage and image processing allow all experiments, along with the temperature and pressure data, to be recorded using digital recording and analyzed after the experiment.
The setup is built around an inverted optical microscope (Axiovert 200, Zeiss, Oberkochen, Germany) with 3D micrometers (Newport, Irvine, CA, USA) mounted on the stage that hold the micropipettes and the experimental chamber. To fabricate the tapered pipettes, borosilicate capillaries (A–M Systems) were heated and pulled using a horizontal pipette puller (Sutter Instruments, Novato, CA, USA) and the tips were cut down to the desired radius (~1–10 µm) by using a microforge (MF 900, Narishige, East Meadow, NY, USA). Pressure control was achieved by a simple syringe and monitored by using a pressure transducer (Valydine Engineering Corp., Northridge, CA, USA). Real-time images were acquired using a CCD camera (DAGE-MIT, Michigan City, IN, USA), all monitored image was recorded in real time on a computer by using a home-built LabVIEW program, and analyzed with ImageJ software provided by National Institutes of Health (NIH, Bethesda, MD, USA) [1].

2.5. Microdroplet Dissolution: Calculation of Diffusion Coefficient of Solvent or Drug in the Aqueous Phase

The dissolution process of a single liquid microdroplet into water is accurately explained by the Epstein-Plesset model [53] that was originally developed for the gas microbubble dissolution and growth. The application of this model was described for the dissolution of single gas microbubbles into aqueous media [53] and later modified by Duncan and Needham for liquid-liquid systems [27]. If the water solubility of the dissolving liquid (here, solvent or drug) is known, the model provides a direct measure of its diffusion coefficient into the surrounding medium; conversely, if the diffusion coefficient of the dissolving material is known, then its water solubility can be obtained. According to this model, the time dependent decrease of the microdroplet radius, R, upon dissolution into the surrounding medium, follows the equation:
d R d t = D C s ( 1 f ) ρ [ 1 R + 1 π D t ]
where D and Cs are, respectively, the diffusion coefficient and solubility limit of the dissolving material (here, DCM or Ibp) into the surrounding medium (water); f is the saturation fraction for the dissolving material in the initial surrounding medium; and ρ is the density of the dissolving material. In the present experiments, we assume an essentially infinite dilution (given the chamber volume, 200 μL, and the droplet volume of only 20–30 pL, we get a dilution of around 0.05 ppm), and therefore we can assume f ~ 0. Furthermore, the time to establish the stationary layer, given by t = R 2 / π D , around a droplet of R ~ 50 μm and D ~ 10−5 cm2/s is only ~0.8 s. It is then possible to neglect the transient approach to steady state if R π D t t R 2 / π D :
d R d t ~ D C s ρ [ 1 R ]
This expression can then be integrated and the following linearized expression is obtained:
R 0 2 R 2 = 2 D C s ρ t

2.6. Formation and Investigation of Microdroplets/Microparticles

This section will briefly present the method(s) employed in a series of experiments focused on the formation of microdroplets or microparticles of three compositions, DCM, PLGA/DCM, Ibp/PLGA/DCM, and a solution of just the drug, Ibp/DCM. Since the procedure for these experiments was essentially the same (forming a microdroplet and observing the solvent or drug loss), the experiment is described in detail for the formation of DCM microdroplets, and additional pertinent details are then provided for each of the other systems as necessary.

2.6.1. Preparation of Samples

The organic solvent, DCM, was used as obtained from the supplier. For the formation of pure PLGA microparticles, a solution of PLGA/DCM was made at a PLGA concentration of 25 mg/mL (2.5% w/v). For the formation of Ibp/PLGA microparticles, DCM solutions containing 2.5% w/v PLGA and Ibp drug loadings DL% (= Ibp/(Ibp + PLGA) × 100) of 0 wt%, 15wt%, 50 wt% and 60wt% were prepared. The determined amounts of PLGA and Ibp were weighed accurately and dissolved in 0.5 mL DCM. For the formation of pure Ibp microparticles, 5% (w/v) Ibp/DCM solutions were prepared, dissolving the aforementioned recrystallized Ibp.

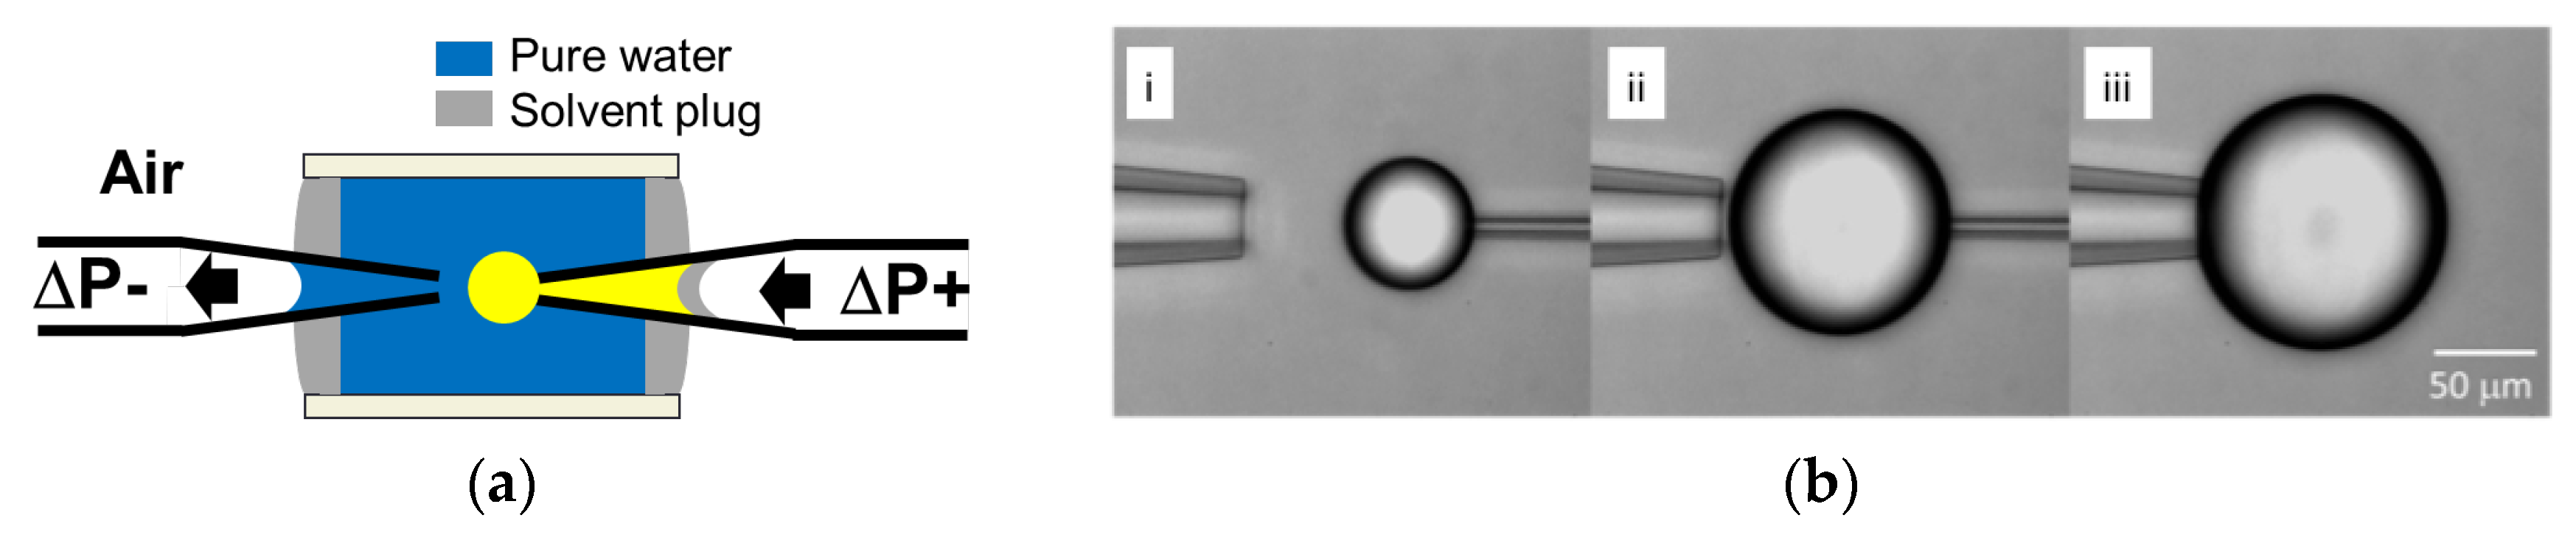
2.6.2. Solvent Microdroplet Formation and Dissolution

All solutions were prepared in small (1 mL) glass vials, in which the delivery pipettes are vertically inserted to front-load them with the sample by applying suction with an external syringe. Prior to this, the delivery pipettes were front-loaded with a small volume (~nL, comparable to the loaded sample volume) of DCM-saturated Milli-Q water, which provides a “pipette cap” used in all of the experiments to minimize DCM evaporation. A small volume (~150 µL) of Milli-Q water was transferred to the microchamber, functioning as the dissolution medium.
As shown in Figure 3a, the two pipettes, the “delivery” and the “catching” pipette [1], were held in the 3D stage micrometers and aligned inside the chamber. In order to make diffusion-controlled dissolution of the microdroplets, the chamber was then sealed with hexadecane to avoid water convection due to water evaporation at the chamber edges.
As shown by the video micrographs in Figure 3b, a single microdroplet (~40 μm diameter) was then injected by the delivery pipette and transferred to the catching pipette and held in the center of the chamber, as recently described [1]. The droplet formation and dissolution process were recorded by using a CCD camera. Data from at least three separate runs for each condition tested was subsequently analyzed by using ImageJ [57].

2.6.3. Polymer Microsphere and Polymer Microsphere-Drug Formation

Single PLGA/DCM and PLGA/Ibp/DCM solution microdroplets were formed in a similar manner to the pure DCM droplets. Because this polymer solution was slightly more viscous than pure DCM, a larger initial microdroplet diameter was used (~60 μm diameter) to enable catching and holding the microdroplet and the formation of the subsequent microparticle. For each concentration, at least three different runs were recorded and analyzed.

2.6.4. Formation and Dissolution of Pure Ibuprofen Microdroplets

Ibp/DCM microdroplets were prepared and formed similarly to the DCM microdroplets described above, although containing just 5% (w/v) Ibp in solution. Four videos were recorded, of which three were used in the investigation: one with a short observation time, another showing a long observation time, and the last one was used to observe the physical nature of Ibp. It was also of interest to measure the dissolution rate of Ibp into in the presence of a micellar sink, and so a series of single Ibp microparticles were formed into aqueous media containing sodium dodecyl sulphate (SDS). Specifically, Ibp/DCM microdroplets were formed and held with the micropipette, and 5 mM PBS solutions, pH 7.4, with 1, 5, 20, 40, 60, 80 and 100 mM SDS were used as the dissolving medium.

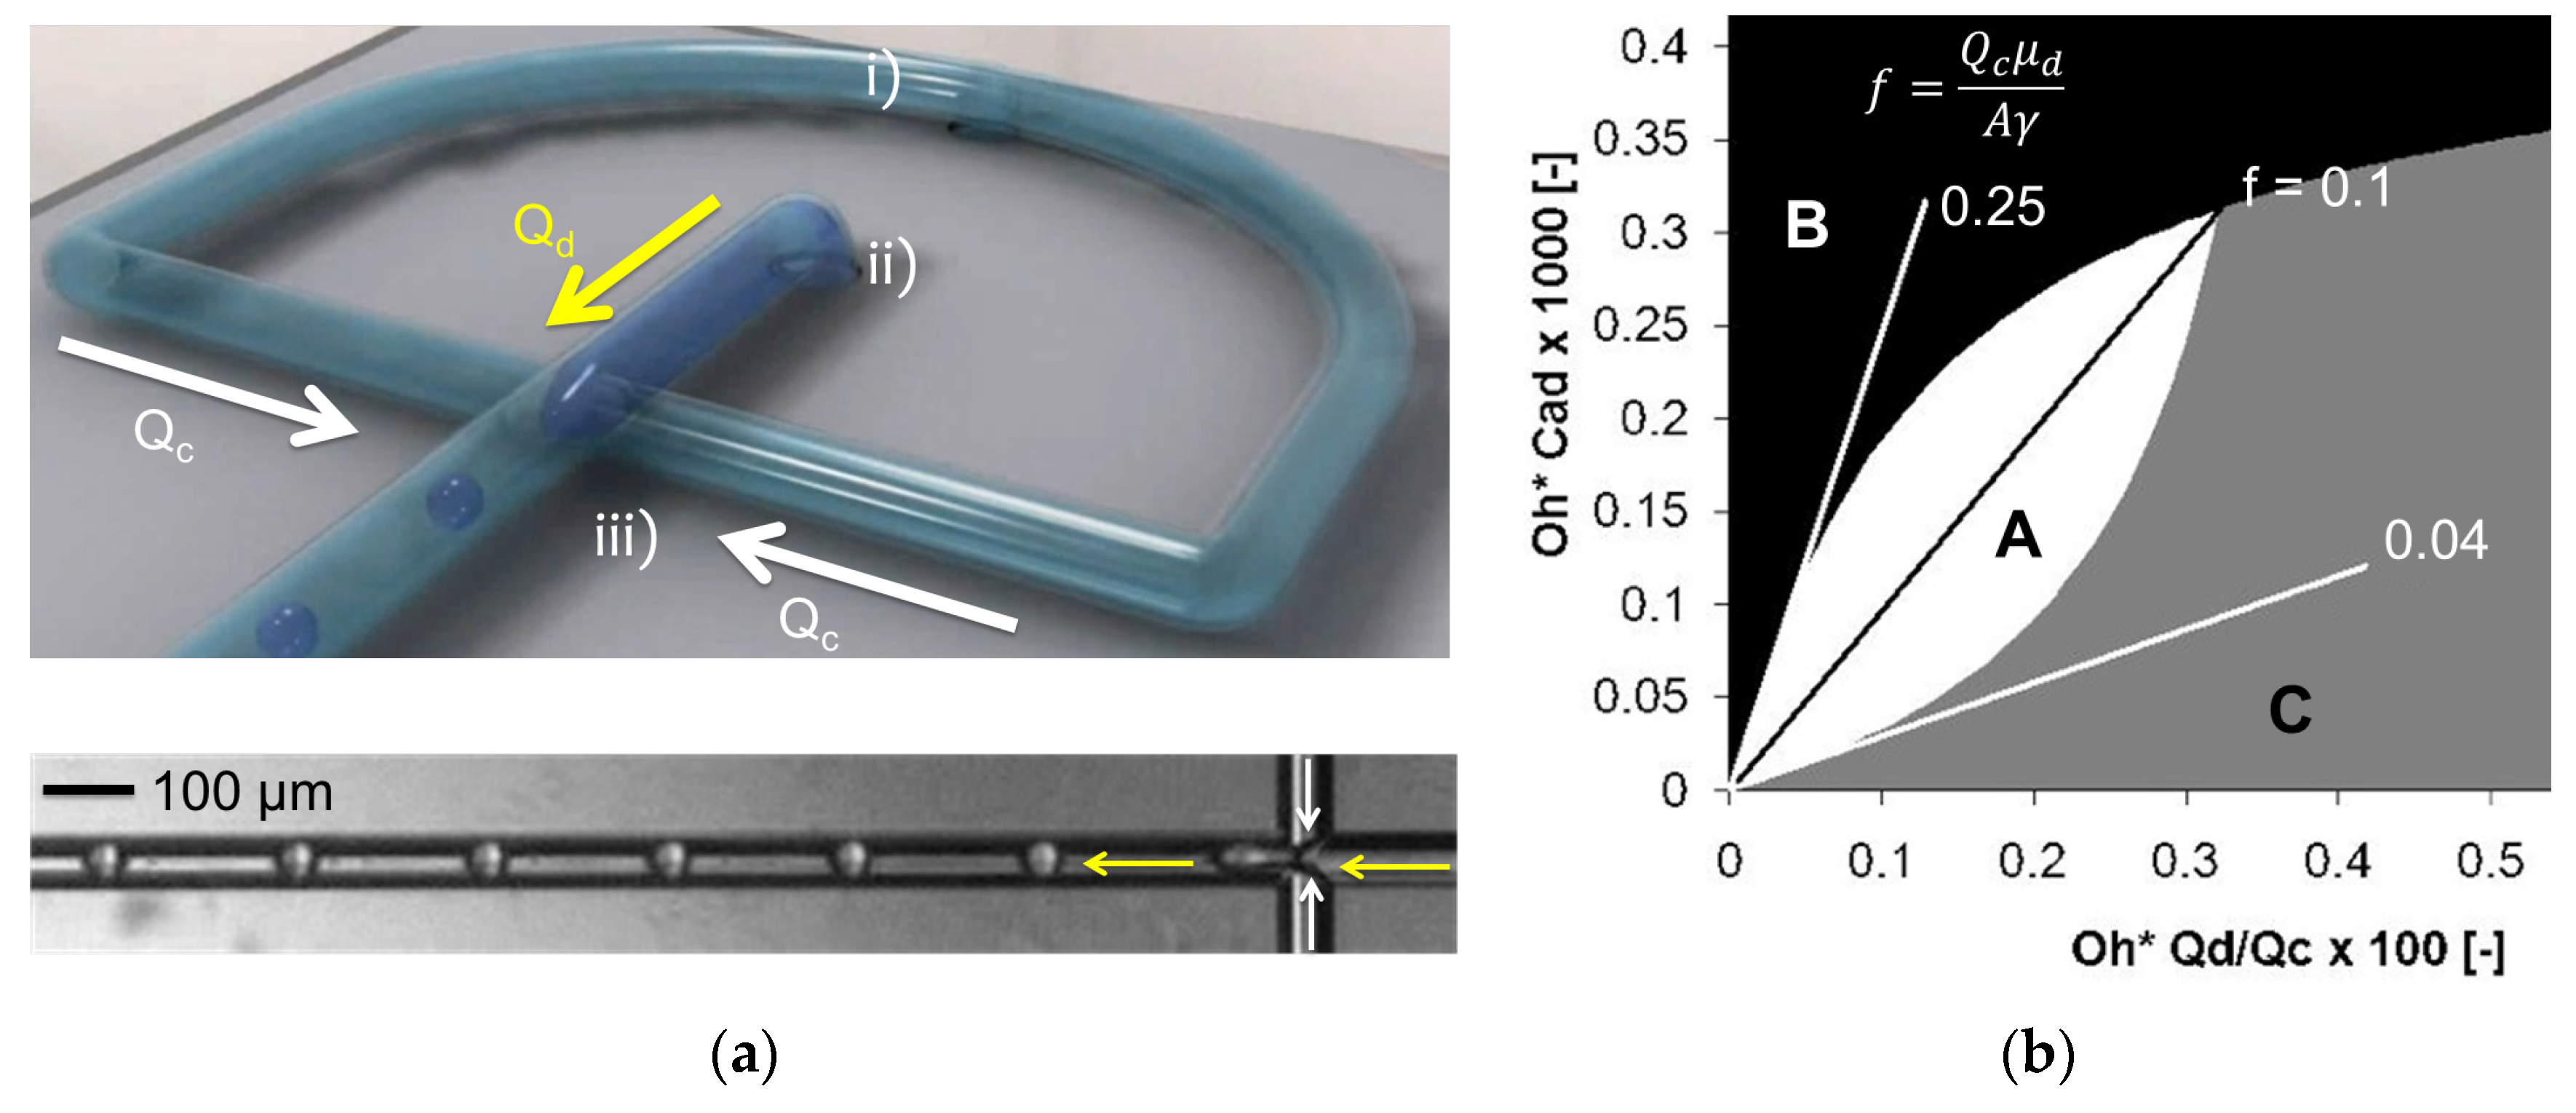
2.7. Microfluidic Emulsification for PLGA Microsphere Production

2.7.1. Single Channel System

Dripping and jetting flow regimes of microfluidic systems have been investigated to control the formulation of microdroplets [58,59], and several microfluidic devices have been introduced, such as flow-focusing [60,61], coaxial [62,63,64] and T-junction [39,65]. The flow-focusing technique in particular has been developed for monodisperse microdroplet-formulation devices [5,66,67,68]. Droplet formation in this technique is controlled by hydrodynamic confinement, where the dispersed and continuous phase flows are forced in a common exit channel.
Figure 4 shows the process of microfluidic emulsification using one of these flow-focusing devices, designed to prepare polymer or polymer/drug microspheres [5], which involves the injection of two solutions: the dispersed solvent phase (the liquid to form the droplet containing the polymer and any API, flow rate Qd); and the aqueous continuous phase (the carrier liquid surrounding the droplet, also called the dissolution medium, flow rate Qc). With this device, the dispersed phase is injected through the central inlet, indicated as (ii), which is continuous with a cross-junction geometry that connects it to the outer cross-inlet, labeled as (i), through which the continuous phase flows.
The dispersed phase is pumped into a microchannel that can be varied in size, between 5 and 1000 μm, shown in Figure 4a, iii. When the dispersed phase enters the cross junction, the so-called ‘hydrodynamic flow focusing’ of the continuous phase breaks the polymer solution into microdroplets. To characterize the microdroplet formation, parameters such as viscosity, μ, flow rate, Q, and interfacial tension, γ, become important according to fluid physics [58,68,69]. In order to create well-defined and perfectly controlled droplet sizes, the key is a precise control over the flow rate Qc and Qd from the inlet channels (Figure 4a). The control of the process lies in the two most important force-balances at the intersection: the balance between interfacial and viscous forces (characterized by the capillary number of dispersion phase, Cad [58]); and the balance between the dispersed phase and the continuous phase that is forced into the same outlet (characterized by the ratio of flow rates Qd/Qc). The dimensionless parameter of Qd/Qc is cited often to show the profile of characterized microdroplet distribution such as the flow map (Figure 4b). In region A, the produced microparticles become nicely spherical. However, in regions B and C, the microdroplets become non-uniform and can be larger than the exit channel, respectively.
While the cross-junction is an essential part of the flow system that generates the microdroplets, in order to use the droplet formation in this setup in the most robust way, the correct flow rates are best calculated using the flow mapping [5], schematically given in Figure 4b. The pertinent equations for pre-setting the flow rates are:
Q c = f × A γ μ c
Q d Q c = 0.00272 O h c × O h d
O h i = μ i ρ i γ R
where A is the exit area of the microchannel (17), γ is the interfacial tension between the two liquids; μc is the viscosity of the continuous phase, f is an empirical constant parameter in the range from 0.04 to 0.25; Ohi, μi and ρi are the Ohnesorge number, viscosity and density, respectively, of phase i (either the continuous or the dispersed phase, denoted by “c” and “d”, respectively); and R is the radius of the exit microchannel.
For the process of creating an emulsion it is preferred that the ratio of the dispersed phase flow rate Qd to the continuous phase flow rate Qc is ≤0.00272 Oh*, where Oh* is the Ohnesorge number of the system, being:
O h = μ c μ d ρ c ρ d γ R
When microdroplets of a solvent-polymer solution (e.g., DCM/PLGA) are formed in this way, they are the templates for the eventual microspheres, which reduce in size and eventually precipitate and solidify by losing the solvent into the continuous phase. Straightforward preparation of microspheres and microbeads of controlled size is confirmed by a light microscopy directly after the process, or by an electron microscopy after drying.

2.7.2. Multichannel System

A multichannel system comprised of multiple copies of the single-channel shown in Figure 4a, arranged radially around a central collection orifice, is shown in Figure 5a [5]. An actual high-speed microscopic image of the exit of a multi-channel prototype device and the droplets moving towards the collection tube is shown in Figure 5b.

3. Results and Discussion

Results will now be presented and discussed for each of the single microdroplet and microparticles systems of DCM, DCM/PLGA, DCM/PLGA/Ibp and pure DCM/Ibp. Data will also be provided for a scaled-up PLGA microsphere system using the microfluidic emulsification system [5] where a series of simple PLGA microsphere samples (not containing Ibp) were made in order to evaluate and demonstrate the predicted flow regimes.

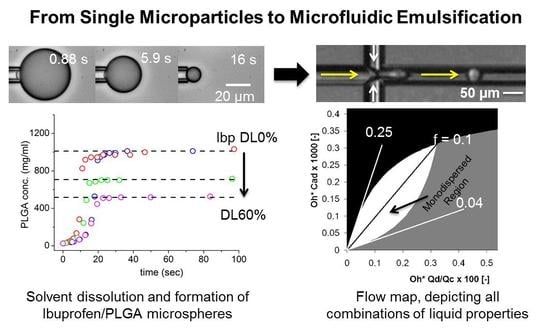
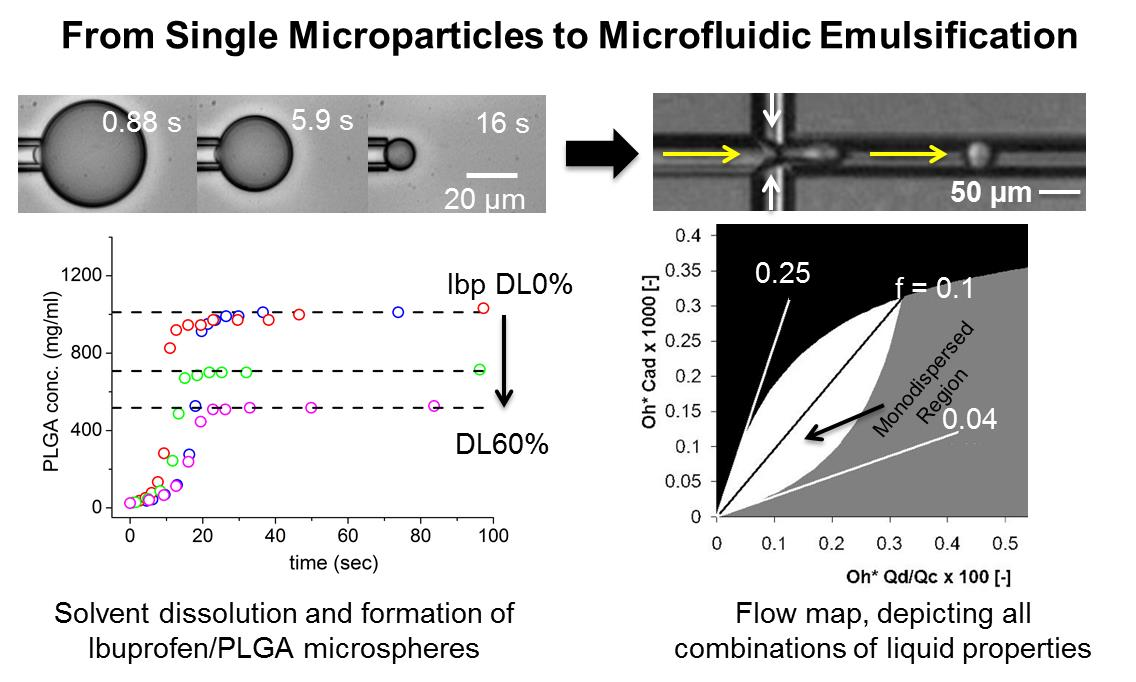
3.1. Solvent Droplet-Dissolution

The first and simplest experiment that was carried out in analyzing these multicomponent systems was to measure the droplet dissolution of the pure solvent, in this case DCM into water. As shown in Figure 6a–i, once the microdroplet of DCM has been formed using the “microdroplet catching method” [1], it was clearly immiscible with water, and so could be held stationary on the end of the holding pipette by applying a small suction pressure that did not exceed its interfacial tension of 28.0 mN/m [70]. Subsequent video images in Figure 6a then show the droplet held on the end of the pipette (Figure 6a–ii), and simply dissolving in the aqueous phase (Figure 6a–iii), until it has completely dissolved (Figure 6a–iv). Quantitative plots of the data obtained for three independent microdroplets of around 20 μm initial radii were represented as radius versus time, and shown in Figure 6b–i. For the particular droplet shown here in Figure 6a, it can be clearly observed that it rapidly dissolved and reached the size of the holding pipette in 9 s (dotted line in Figure 6b–i), at which point the holding suction pressure in the pipette aspirated the small droplet far into the pipette.
A re-plot of the data is presented in Figure 6b–ii, and fitted to the linear form of the Epstein-Plesset (EP) model, Equation (3). This representation collapses the data onto a single line, independent to the droplet initial size. This model predicts that the R02R2 vs. time plot will follow a linear trend, whose slope would be equal to 2DCs/ρ. Considering the following parameters for DCM dissolution into water: CS = 17.22 mg/mL and ρ = 1325 mg/mL (both at 25 °C), the EP model provided an experimental value for the diffusion coefficient of DCM in water of D = 1.77 ± 0.01 × 10⁻⁵ cm−2/s. The estimated D value of DCM from the Wilke and Lee model was 1.22 × 10⁻⁵ cm2/s [71], which was in fairy good agreement, given the range of reference values for Cs, i.e., the solubility of DCM in water of 0.0132–0.0200 g/mL. Thus, this kind of experiment can be done for any of the immiscible solvents used in these microsphere processes, as we have shown for example for ethyl and other acetates [30]. These parameters were then used to represent the theoretical R vs. time curves shown in Figure 6b–i for the different initial radius.

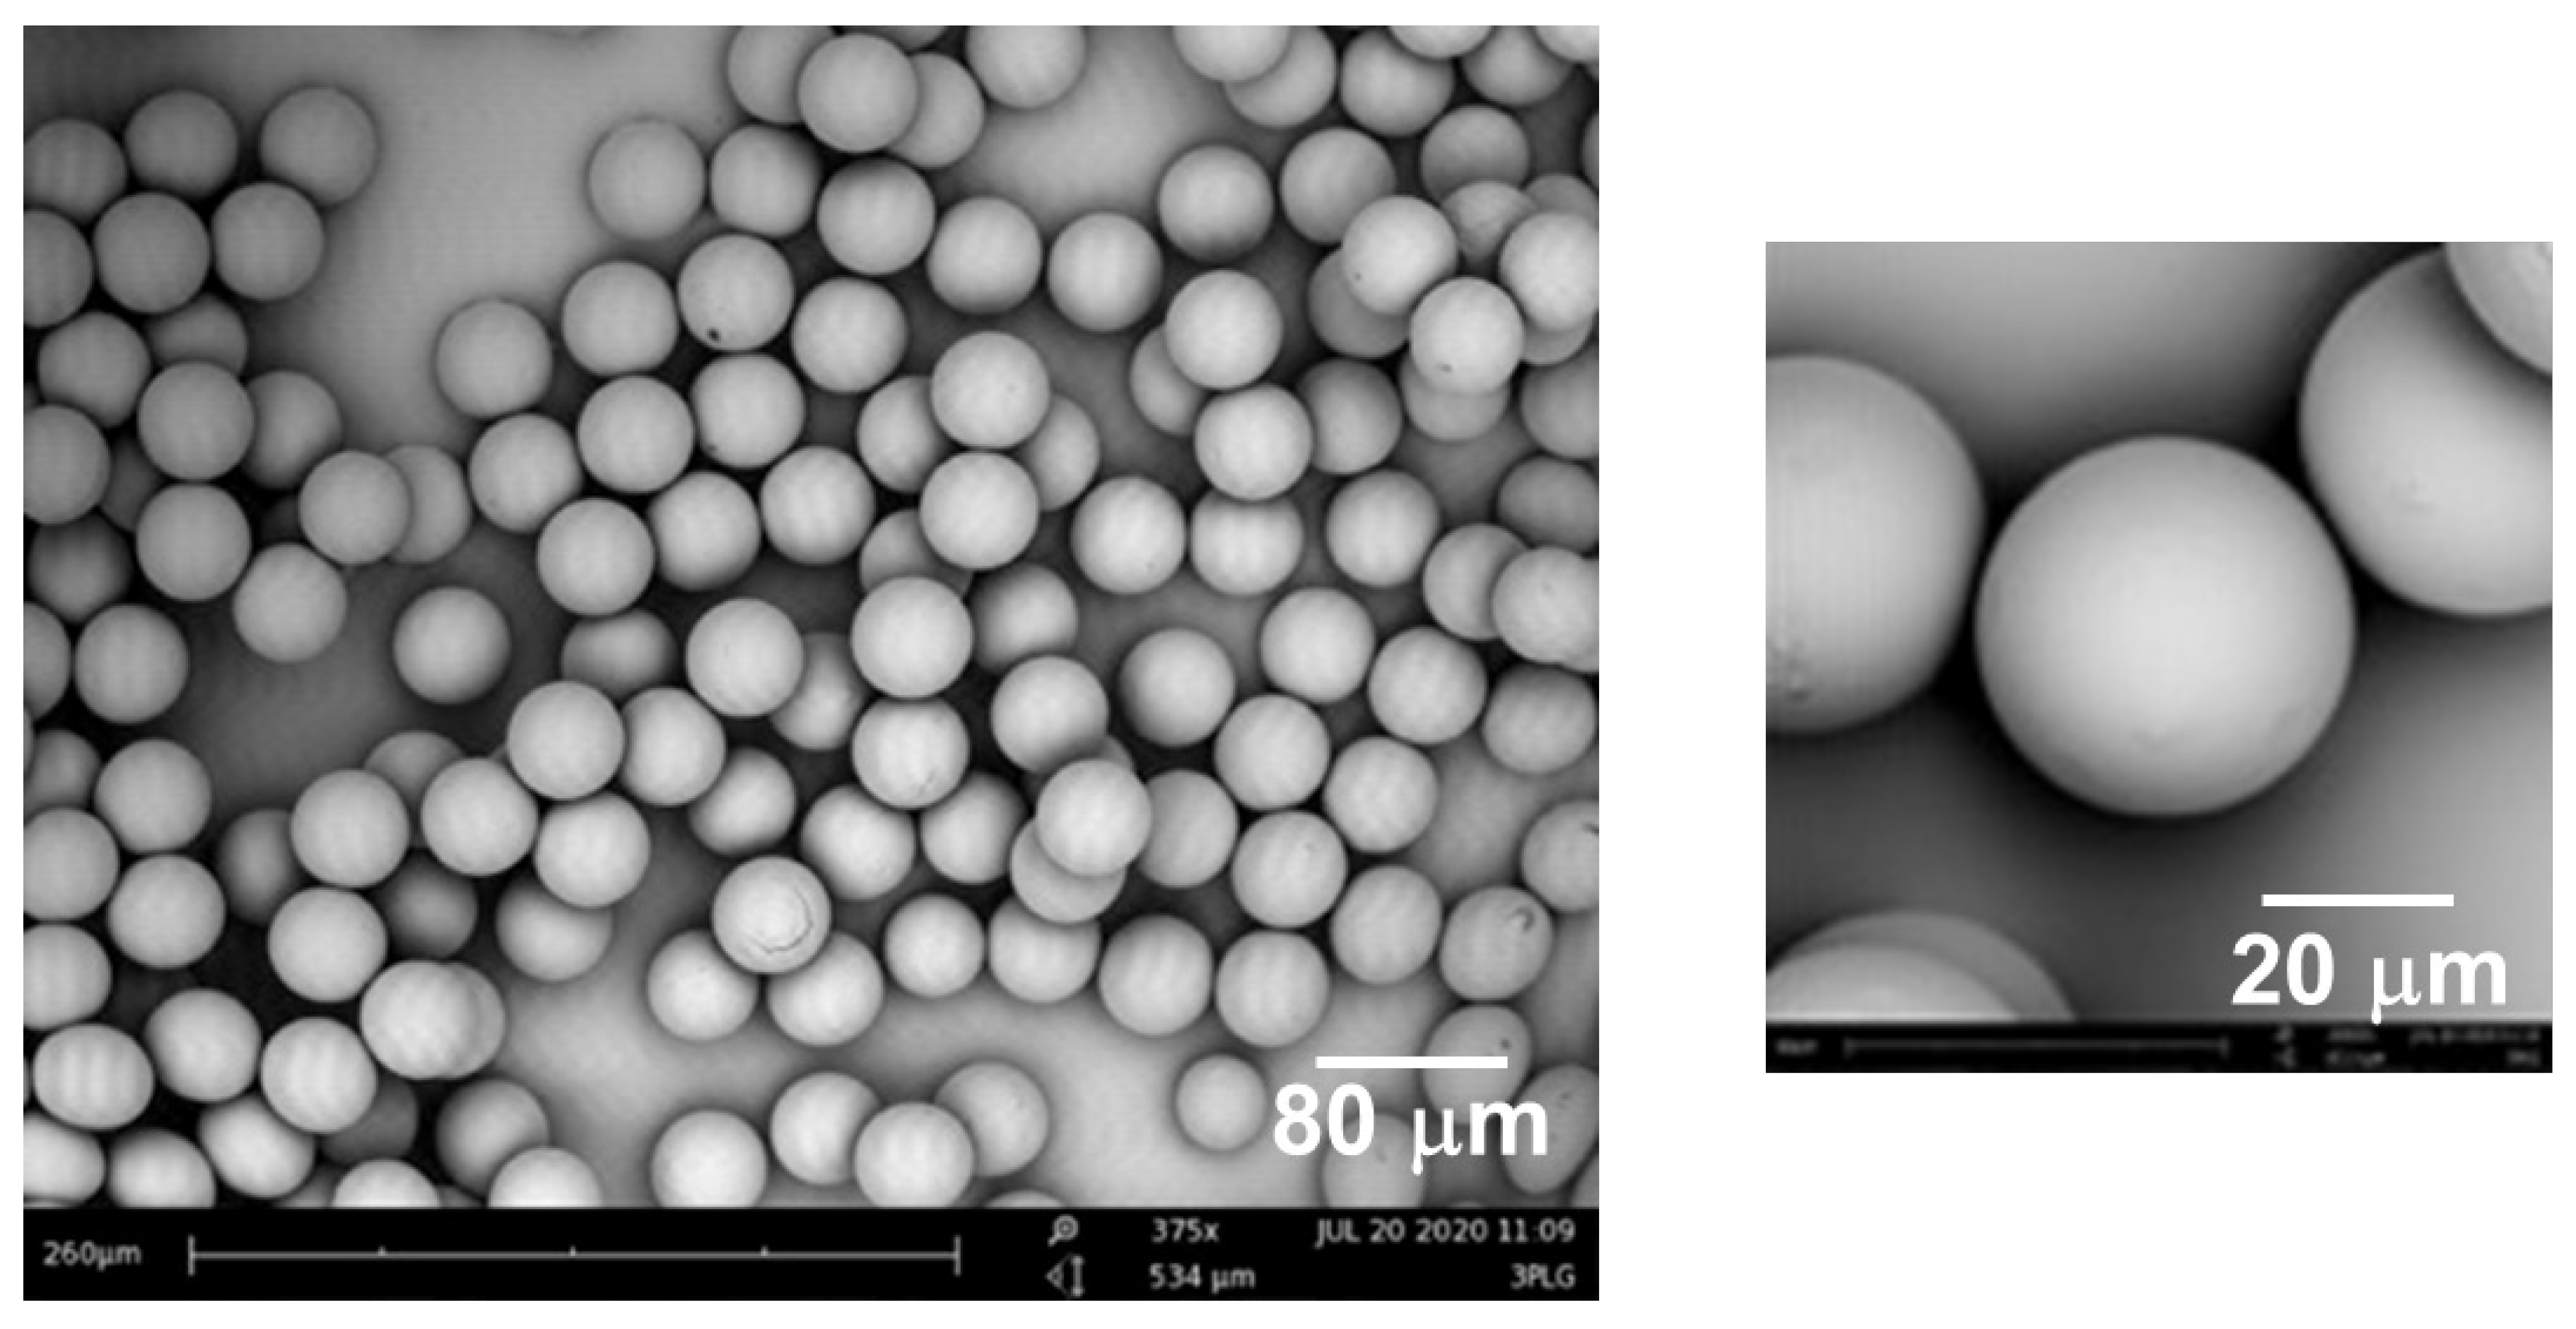
3.2. PLGA Microsphere Formation in PBS

Similar to the pure DCM solvent dissolution shown in Figure 6, the dissolution of a DCM/PLGA solution microdroplet shown in Figure 7a, was quite homogeneous in appearance, with no inclusions, phase separation, or structure during solvent loss and concentration of the PLGA, leaving a solidified microparticle of PLGA in 5 mM PBS (pH 7.4).
Formed in less than a second, the held microdroplet of 60 μm diameter lost DCM into the aqueous phase over a period of 19 s, at which point the dissolution ceased and the microparticle of PLGA was formed and remained so for the hundreds of seconds of further recording. The formed microparticle, indicating a very viscous state initially, became eventually solid-like state about 10 min after reaching the final size. Until reach the solid-like state, it could be slightly deformed by the indentation test. Plotting the microdroplet radius versus time, see Figure 7b–i, shows that the DCM was lost to the aqueous phase at approximately the same rate as for pure DCM. This signifies that there was little influence of the dissolved polymer on the transport of DCM out of the ever-concentrating solution. Again, a replot of the data in Figure 7b–ii, according to Equation (3), yields a value for the diffusion coefficient of DCM in water D = 1.77 ± 0.01 × 10⁻⁵ cm−2/s, which is in excellent agreement with that from the pure solvent dissolution. Again, as with pure solvents, the solvent dissolution experiment can also be carried out for any solvent polymer-solvent solution where the solvent is dissolved into the aqueous phase and the polymer either emerges from the solvent as in the case of PLGA, or precipitates or even crystallizes in a critical phase separation event, as we have seen previously for other materials including: octaethylporphyrin from chloroform-triolein mixtures [35]; waxes from ethyl acetate (unpublished data); or from aqueous solutions dissolving into oil (long chain alcohol) systems where microdroplets of aqueous lysozyme [3] or albumin [3,31] formed microglassified beads upon loss of the aqueous solvent.

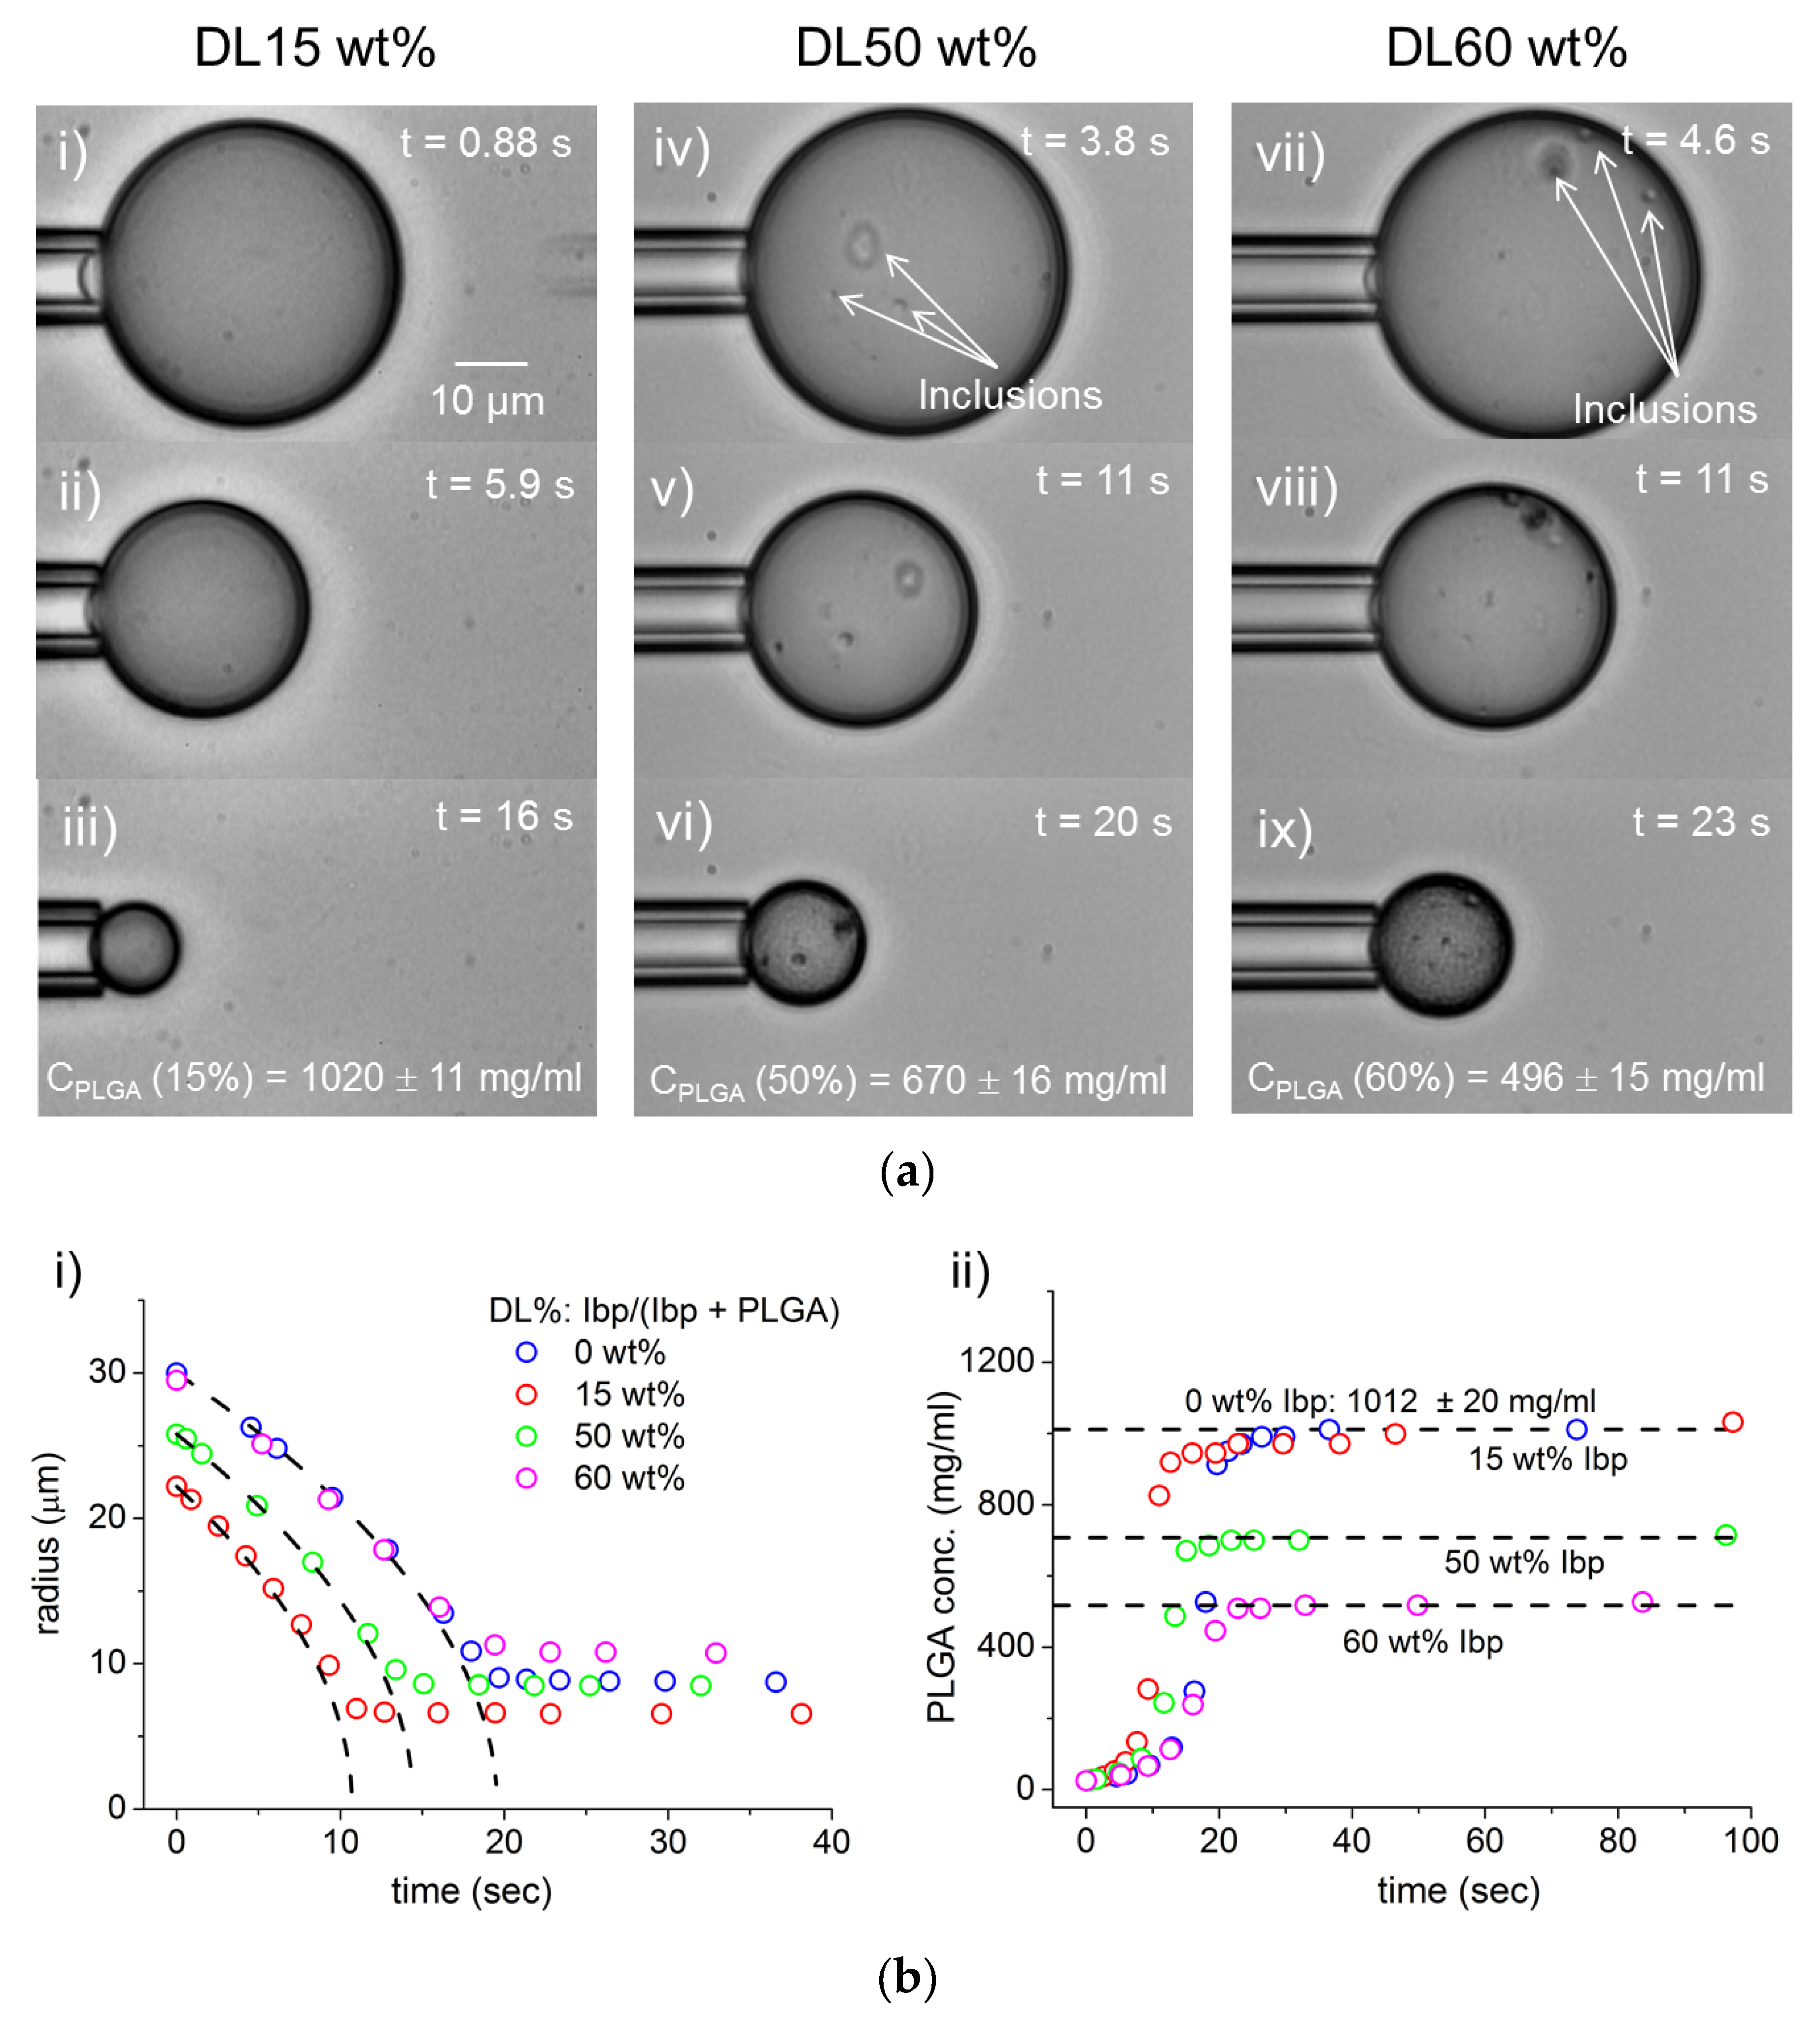
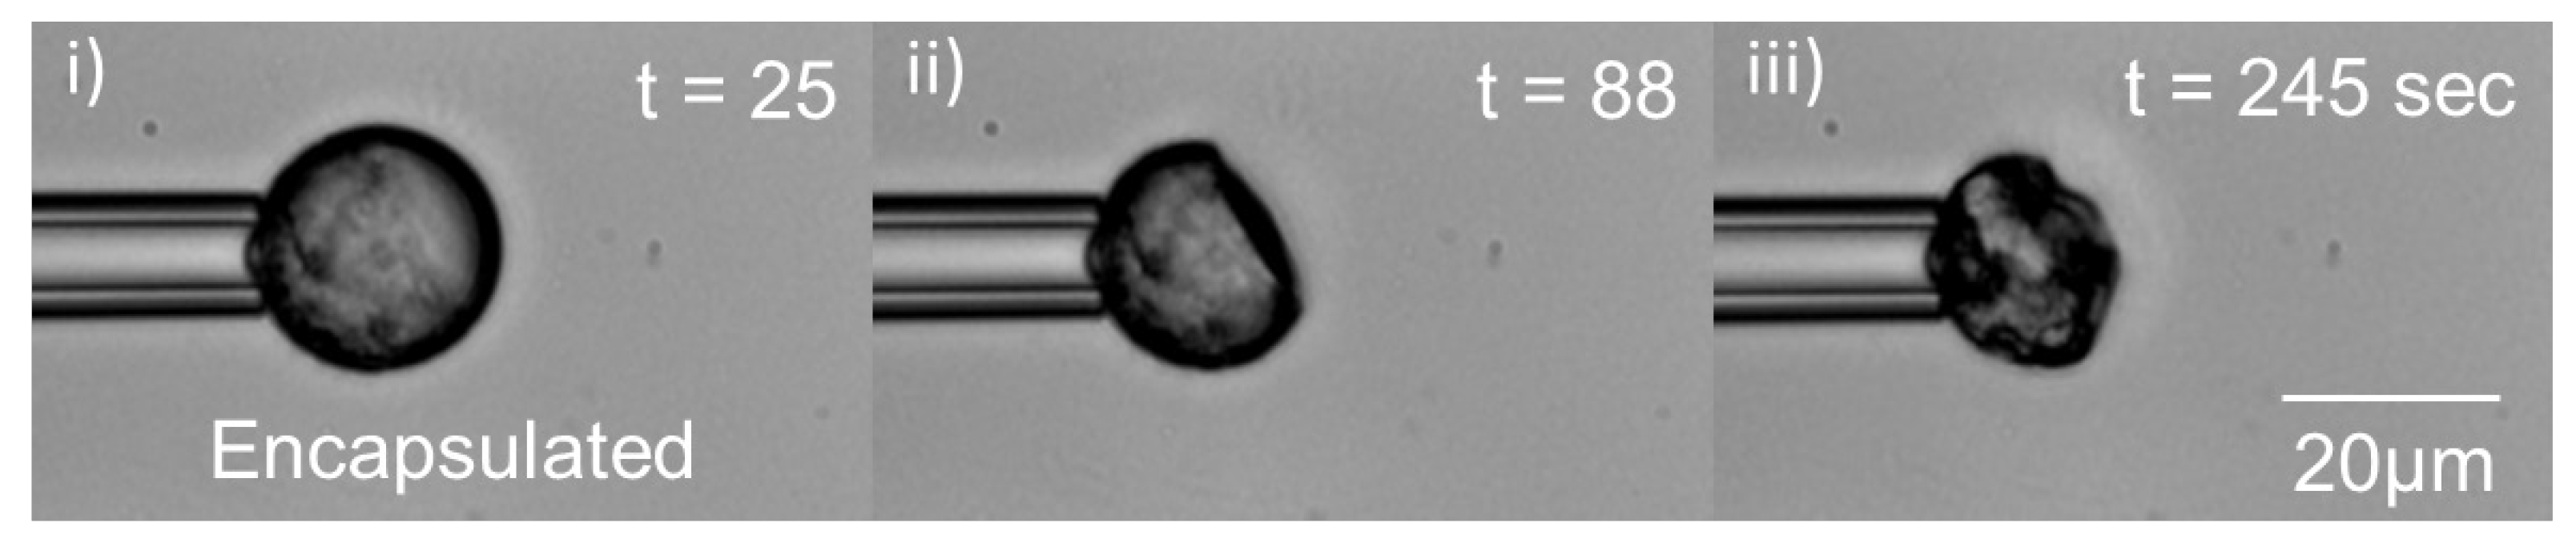
3.3. Ibuprofen Encapsulation in PLGA Microparticles

Having evaluated the dissolution of the solvent DCM and the formation of PLGA microspheres as shown above, the third experiment was to measure the solvent dissolution rate and final concentrations of the multicomponent DCM/PLGA/Ibp system. Shown in Figure 8, is the DCM dissolution plot from a DCM/PLGA/Ibp solution microdroplet in PBS at room temperature for drug-loadings, DL = 0 wt%, 15 wt%, 50 wt% and 60 wt%. The experiment again provided important parameters that characterized the dissolution and formation of the multicomponent system. As before, comparing the plot of the dissolution phase (Figure 8b–i) to the pure DCM microdroplet system, the rate of loss of DCM into the aqueous phase of 5 mM PBS is indeed still the rate-determining step. Importantly, as shown in Figure 8a, there are no other structures visually evident in the microdroplet that could potentially retard this transport mechanism, such as a shell formation by the drug.
By measuring the final size of the microsphere and considering the initial solute concentration, we can also obtain critical information about the encapsulation process. The radius vs. time plot (Figure 8b–i) was easily converted into a concentration of PLGA vs. time plot (Figure 8b–ii) by simply assuming that no solute was lost into the water medium. Thus, the volume decrease was directly translated into a concentration increase both for PLGA and Ibp. In the absence of ibuprofen (0 wt% Ibp), from Figure 7, the pure PLGA concentration reached the final concentration (which was actually its “hydrated density”) of 1012 ± 20 mg/mL. In general, the PLGA concentration in a dried microparticle is higher than for a water-wetted microparticle because the wetted PLGA particles adsorb some of their surrounding liquid—in fact this is how they begin their hydrolytic-degradation, by adsorbing water. Therefore, a wetted PLGA microparticle will have lower “concentration” than that of a dried microparticle. Here, a “concentration” (of drug/polymer in the organic solution) becomes a “density” (of a drug/polymer microparticle, with respect to the total particle volume). Arnord et al. showed that the swelling ratio dw/dd, as the diameter between a wet (dw) and dry (dd) particle of PLGA (50:50, Mw 31,000) polymer, is 1.06–1.10 [72]. Therefore, the volume ratio, Vw/Vd, of wet and dry PLGA particle was calculated to be 1.16–1.37. By using the swelling ratio, we estimated a possible dry PLGA particle concentration of 1200–1400 mg/mL from our measured microparticles, which was quite a reasonable density value for pure PLGA (50:50), reported as ρPLGA = 1340 mg/mL [29,72].
Figure 8b-ii shows that, when Ibp was added into the system, the final PLGA concentration became 1020 ± 11 mg/mL for DL 15 wt% Ibp, and the final Ibp concentration became 180 ± 2 mg/mL—calculated from the initial concentrations and the relative volume change of the droplet. Increasing the amount of Ibp to DL 50 wt%, the final PLGA and Ibp concentration became 670 ± 16 mg/mL and 670 ± 16 mg/mL; and for DL 60 wt% Ibp, the final PLGA and Ibp concentration became 496 ± 15 mg/mL and 745 ± 22 mg/mL. Observing this process in real time and visualizing the single microdroplet also allowed us to determine any morphological change in the microdroplets. At the lower concentration of Ibp DL ≤ 15 wt%, the encapsulation of Ibp showed a quite uniform image of the microparticle without visible phase separation or surface structure. However, at DL = 50 wt% and 60 wt%, small inclusions were evident in the microdroplet and were retained in the final microparticle (Figure 8a–vi and –ix).
We have seen similar inclusions before (E. Laureano, 2012, unpublished data) in experiments that formed PLGA microspheres from ethyl acetate, and that we assumed were attributable to trapped water condensing out of the solvent, since ethyl acetate has a relatively high solubility for water of ~3%. DCM, on the other hand, has a much lower solubility for water and no inclusions were seen for the formation of pure DCM/PLGA microspheres. In the present case, there could be one or more explanations for the inclusions seen in Figure 8. One source of the inclusions could be caused by a phase separation of Ibp from PLGA because of such a high concentration-encapsulation of Ibp. Alternatively, Ibp could help to imbibe water that then condenses out. Another explanation could be that the high Ibp concentrations help the otherwise non-wetting DCM/PLGA solution to wet the glass pipette to an extent that allows trapped water at this solution-glass boundary to be brought into the droplet as it forms. Since these inclusions seem to be formed during the process of making the initial droplet, we favor the latter explanation that it was the poor wetting of the micropipette wall by the Ibp solution that initiated the inclusions at this glass boundary. Thus, it appears that at higher concentrations of Ibp, the interface with the micropipette could capture some PBS droplets during the action of pushing out the droplet and during microdroplet isolation. In any event, in the micropipette experiments (Figure 8a–iv and –ix) at these high Ibp DL of 50 wt% and 60 wt%, visible trapped inclusions were formed in the liquid microdroplet and solidified microsphere. If such wetting also occurs in a microfluidic channel, then here is another example of the additional information that the micropipette experiment can bring to an otherwise unobservable event in the microdroplet formation of bulk samples. Obviously, these observations deserve further experimentation and analyses, including making and observing bulk emulsification samples.

3.4. Ibuprofen Phase-Separation from DCM/PLGA

Looking more closely at the resulting microspheres for DL = 50 wt% and 60 wt% Ibp shown in Figure 8a–vi and –ix, there was also some graininess (mosaic pattern) that was not evident at lower Ibp concentrations. This could signify some kind of phase separation and therefore solubility limit for Ibp in this polymer system. In fact, further evidence for the phase separation of Ibp from the PLGA into its own Ibp-rich phase-domains was observed at very high Ibp concentrations. Figure 9 shows a microdroplet formed with an initial DL of 80 wt% Ibp encapsulation, and the resulting PLGA-Ibp microparticle. 25 s after forming the microdroplet, once all the DCM had dissolved out, the microdroplet was precipitated as a solid particle. As can be seen in the image in Figure 9i at t = 25 s, the top right hand portion of the microparticle had a more clear appearance than the mottled appearance of the rest of the microsphere. Then, over the next tens of seconds, this part of the particle at the top right hand side started dissolving into the PBS bulk solution. After 245 s, at Figure 9iii, the shape was not spherical anymore, and the size became visually nearly half of the initial diameter, as other Ibp-rich domains dissolved out from the microparticle. These images clearly show that the PLGA polymer had a limitation for the encapsulation of Ibp, and that the Ibp phase-separated between DL = 60 wt% and 80 wt%.
A similar kind of phase separation was spectacularly shown to occur in real-time in previous work with Yang [28], where fusidic acid (FA) was seen to precipitate out of a DCM/PLGA/FA solution microdroplet, and even form surface spheroids that were clearly not entrapped or retained in the polymer microsphere. In the current experiment, as shown in Figure 9, the phase-separated Ibp then simply dissolved away, presumably at its own dissolution rate. In the final experiment, we measured directly the dissolution rate for pure Ibp, as presented and discussed next.

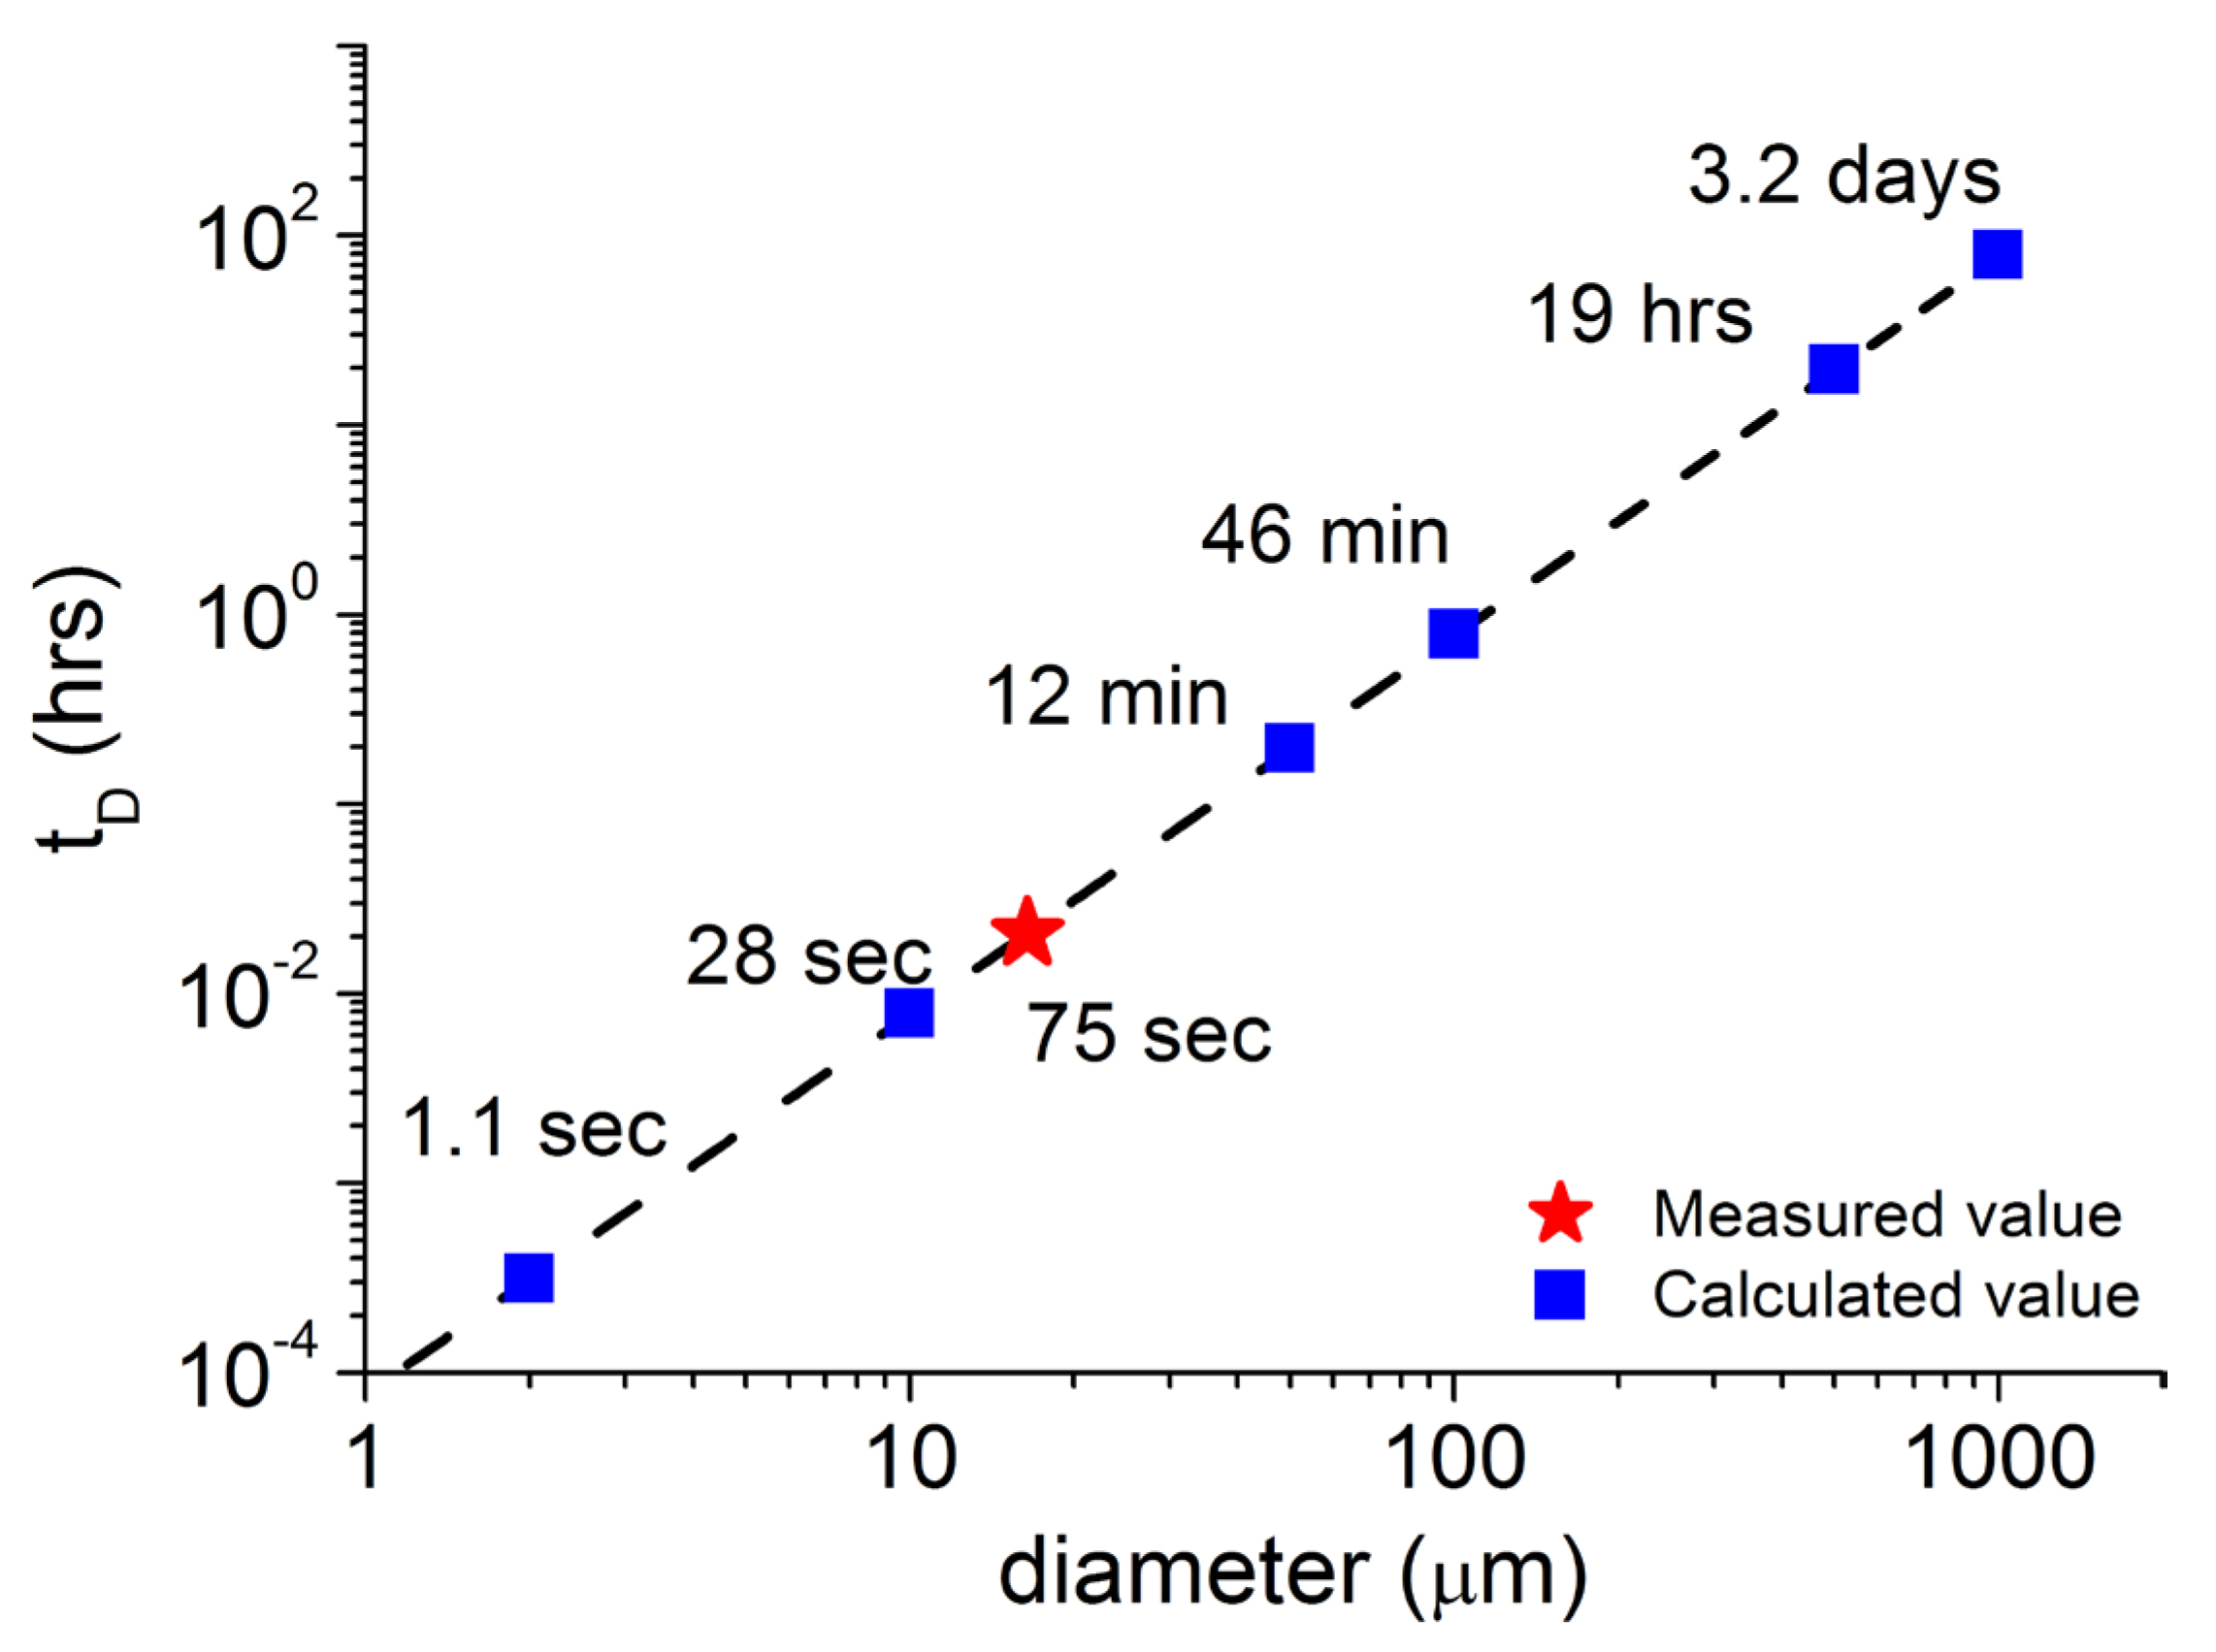
3.5. New Measure of Ibp Diffusion Coefficient and Dissolution Time from DCM/Ibp Microparticle Dissolution into PBS

Finally, in these single-microparticle formation and dissolution experiments, it was also possible to characterize the formation of pure Ibp microparticles from DCM and then observe and quantify Ibp dissolution itself into an aqueous phase. As shown in the video micrographs of Figure 10a and the radius vs. time plots of Figure 10c–i, the DCM solvent, as expected, rapidly dissolved into the surrounding buffer, over a period of only 10 s. What remained in Figure 10b was a pure Ibp microparticle that itself then continued to dissolve into the buffer, as shown in the next series of videomicrographs in Figure 10b at 15–50 s. The slower dissolution was thus represented in the lower part of the radius vs. time plot in Figure 10c–i, where the radius of the pure Ibp reduced over the next 50 s as it dissolved in the buffer. Actually, a back-extrapolation shows that a significant amount (~30 wt%) of the ibuprofen could dissolve during the initial solvent-loss phase, where, as shown by Su and Needham [30] (short dashed lines at time 0 s on Figure 10c–i), mixture-dissolution followed an analysis in which the area fraction of each component dissolved in accordance with their volume fraction in the microdroplet, which was continually changing. We simply assume that there was this initial dissolution of Ibp from the DCM/Ibp microdroplet.
Regarding the second dissolution regime, corresponding to the pure Ibp dissolution, we used again the linearized EP model to obtain an experimental value for the Ibp diffusion coefficient in PBS (pH 7.4) at room temperature, yielding D = 5.5 ± 0.2 × 10⁻⁶ cm2/s. This value for the Ibp diffusion coefficient was exactly the same as that measured by NMR, 5.5 × 10⁻⁶ cm2/s, [73], and by another method for free Ibp in a phosphate buffer utilizing a USP-2 dissolution bath [74]. To calculate the D value from the dissolution profile, the solubility of Ibp, 0.825 mg/mL, in 5 mM PBS pH 7.4 at 25 °C was used [75,76].
Another important parameter for scale-up in emulsification mixers and in microfluidics is the actual time for dissolution, since this is the point at which all the solvent has been removed and the particles are less likely to coalesce. For microfluidics, this time has an inverse relation to the velocity of the fluid in the microchannel and is directly proportional to the length of that channel. Thus, calculations of the time for dissolution are readily obtained from the EP model for the dissolution of microparticles as done previously [2,4,27,30]. The time, tD, for a spherical microparticle of Ibp to dissolve in infinite medium is given by the following equation,
t D   =   R o 2 2 D   ρ C s
where Ro is the initial radius of the particle, ρ is the density of the Ibp (1030 mg/mL), D is the diffusion coefficient of the molecule in aqueous media (5.5 ± 0.2 × 10⁻⁶ cm2/s), and Cs is its solubility limit in PBS (pH 7.4) buffer, 0.825 mg/mL (4 mM) [75]. This calculation can be used to estimate the time for dissolution of any material knowing the above parameters, including in the presence of a non-limiting hydrophobic lipid sink if the solubility in this sink is known. The tD analysis for Ibp in buffer is shown in Figure 11 for different sized Ibp microparticles, from 2 μm to 1000 μm diameter. Since the time for dissolution goes as the radius squared, small particles dissolve very quickly. For example, a 2 μm diameter particle dissolves in 1.1 s, but a 1000 μm particle can take 3.2 days in infinite dilution. Testing this equation, we see that for the 14.6 μm diameter Ibp microparticle shown in Figure 10b, the predicted initial Ibp microparticle at t = 0 s would have a pure Ibp diameter of 16.4 μm. The time to dissolution measured in Figure 10c (blue symbols), was ~75 s (red star in Figure 11) which agrees very well with the predicted value on the plot of Figure 11. This calculation shows how important it is in applications of the pure drug dissolution to not only know the size of the drug microparticles but to actually control it. And so, the microfluidic system now offers exquisite control over size and therefore the dissolution rates for pure drug microparticles.
As with other aspects of the micropipette technique for studying single microdroplets and microparticles, the pure drug dissolution experiment can be performed on many such drugs when formed from solvent and observed dissolving in PBS or indeed into surfactant micelles or other sink conditions, as shown next for Ibp dissolution into a micellar sink.

3.6. Ibuprofen Dissolution into a Micellar Sink

The experiments of Ibp precipitation from DCM solution and Ibp dissolution into an aqueous medium were carried out in the presence of a hydrophobic sink. Namely, SDS solutions below, around and above the detergent CMC were used in order to study the effect of the presence of SDS monomers and micelles on Ibp dissolution rates, and evaluate the potential micellization of the drug. The ability of SDS and other detergents to solubilize Ibp molecules has been already characterized in bulk solutions [77,78], but a more detailed and microscopic characterization of Ibp micellization can be achieved using the micropipette technique, together with a quantitative description of dissolution rates as a function of Ibp and SDS concentrations. In order to do this, we measured the dissolution profiles (radius vs. time) of DCM/Ibp microdroplets formed in 5 mM PBS, and in PBS with increasing SDS concentrations, namely 1, 5, 20 and 100 mM, where the CMC value of SDS in the buffer equals 4.7 mM [77]. The SDS concentrations tested here correspond to Ibp-to-SDS molar ratios of 121.2, 24.2, 6.0 and 1.2, respectively, and so they range between relatively high detergent-to-drug ratios to practically 1:1 molar ratio. The dissolution experiments were each performed for three independent droplets; for convenience, the results for one representative droplet tested at each condition are shown in Figure 12. As can be seen in Figure 12a for all SDS concentrations, and similarly for pure PBS solutions, the radius vs. time plots clearly showed the presence of two distinct regions of droplet dissolution, as discussed previously: the first one occurred faster, which corresponds to DCM (and a small part of Ibp) dissolution, and the second one corresponds exclusively to pure Ibp dissolution. We then converted these plots into R 0 2 R 2 vs. time plots in order to apply the linearized form of the Epstein-Plesset model (Equation (3)), as shown in Figure 12b.
The representation in Figure 12b collapsed the first region of the data onto a single line until the point at which all the DCM was lost, which showed that there was no significant differences in the slopes (2DCS/ρ) for DCM dissolution with increasing SDS concentrations. In Figure 12b, the linear fit was represented for this first region using the average slope value of all the measured droplets (~50 μm2/s), a rate of dissolution that would contain contributions from the two dissolving compounds, DCM and Ibp, in a solubility- and concentration-dependent manner as carefully analyzed in the previous microdroplet studies [30], but that is again beyond the present study. Therefore, this common slope indicated that the dissolution rates of DCM + Ibp were not significantly affected by the presence of SDS monomer or micelles. On the contrary, the second part of the droplet dissolution curves in Figure 12a did show significant differences with SDS concentration, and, as seen in Figure 12b, the slopes measured for the dissolution of pure Ibp particles were higher for increasing SDS concentrations above the CMC (4.7 mM), while no difference was observed below the CMC at between 0 and 1 mM SDS.
In order to further quantify the effect of SDS micelles on Ibp solubility, we analyzed the dissolution of the pure Ibp microparticles, after all DCM was lost. At and above the CMC, micellar solubilization can occur, so hydrophobic compounds can be incorporated into the micelles rather than remaining in solution in the water phase. This would create, in turn, an increase in the apparent solubility limit (Cs) of Ibp in the micelle suspension, compared to the one in buffer. Furthermore, we assumed here that the diffusion coefficient of molecular-Ibp in the aqueous media, D, was not affected by increasing SDS concentrations. That is, the initial loss of Ibp from the microparticle relied exclusively on its diffusion from that surface into the receiving micellar solution, and that any diffusion in micelles would be slower according to the Stokes-Einstein model of being proportional to 1/R, i.e., approximately a factor of at least 0.5 nm of Ibp to 5 nm for the micelle. Also, at this surface, there is a solubility limit for Ibp in water, but for the purposes of the new solubility calculation, we assume that the solubility of Ibp in the micellar solution is increased. This approximation seems reasonable since the effective volume occupied in solution by SDS monomers or micelles in the millimolar range is negligible compared to the total volume of the solution, and so the rate-determining loss of Ibp from the microparticle would be its initial dissolution into the aqueous phase, and micelles would diffuse slower than the single molecule. Thus, we applied the Epstein-Plesset model (Equation (3)) to obtain the apparent solubility limit, Cs, of Ibp in increasing SDS concentrations, by using the diffusion coefficient obtained for Ibp dissolution in PBS (D = 5.5 ± 0.2 × 10⁻⁶ cm2/s), and the density of Ibp (ρ = 1.03 mg/mL). As shown in Figure 13, the apparent solubility limit determined this way for single Ibp microparticles increased significantly from 0.83 mg/mL at 0 mM SDS, to 0.87 mg/mL at 1 mM, and up to around 3 mg/mL in the presence of 100 mM SDS, indicating a 3–4 fold increase in solubility above the CMC that appeared to follow a somewhat exponential fashion when plotted in the semi log plot of Figure 13.
We can compare these results to other studies already published for Ibp solubilization into increasing SDS concentrations, where experimental Cs values of Ibp have been obtained from bulk experiments by spectroscopical methods [77]. In the study by Rangel-Yagui and coworkers, the Ibp solubility limit was measured to be Cs = 4 mM = 0.825 mg/mL. They found a significant increase in Cs values of around 5.5 times between 0 and 80 mM SDS, which although relatively higher is quite comparable to our measured 3–4 fold increase between 0 and 100 mM SDS.
Our assumptions that the rate-determining step for dissolution is molecular diffusion of Ibp could account for this slight discrepancy. That is, this more sustained increase in apparent solubility measured with our microscopic method might indicate that the rate-determining step for dissolution studied from single microdroplets could be micelle diffusion to or away from the droplet surface; in that case, the dissolution rate (slope of the linear representation, 2DCS/ρ) would increase less than expected theoretically, since the effective D would be also reduced.
It is finally worth mentioning that, during these experiments, spontaneous emulsification was directly observed under the microscope at 5 mM SDS and above, seen as very faint layers of material being formed and expelled from the microparticle surface during Ibp dissolution. This observation might suggest that mixed Ibp/SDS microscopic emulsified structures were created by mutual Ibp/SDS hydration. This would be consistent with the amphiphilicity of Ibp and with other studies that have shown the aggregation behavior of Ibp with other amphiphilic compounds and the formation of mixed structures [79,80,81]. It also indicates that mixed monolayers of SDS and Ibp have a quite low interfacial tension such that the lateral, repulsive force between SDS molecules in the monolayer is sufficient to curve the interface and emulsify the liquid material.

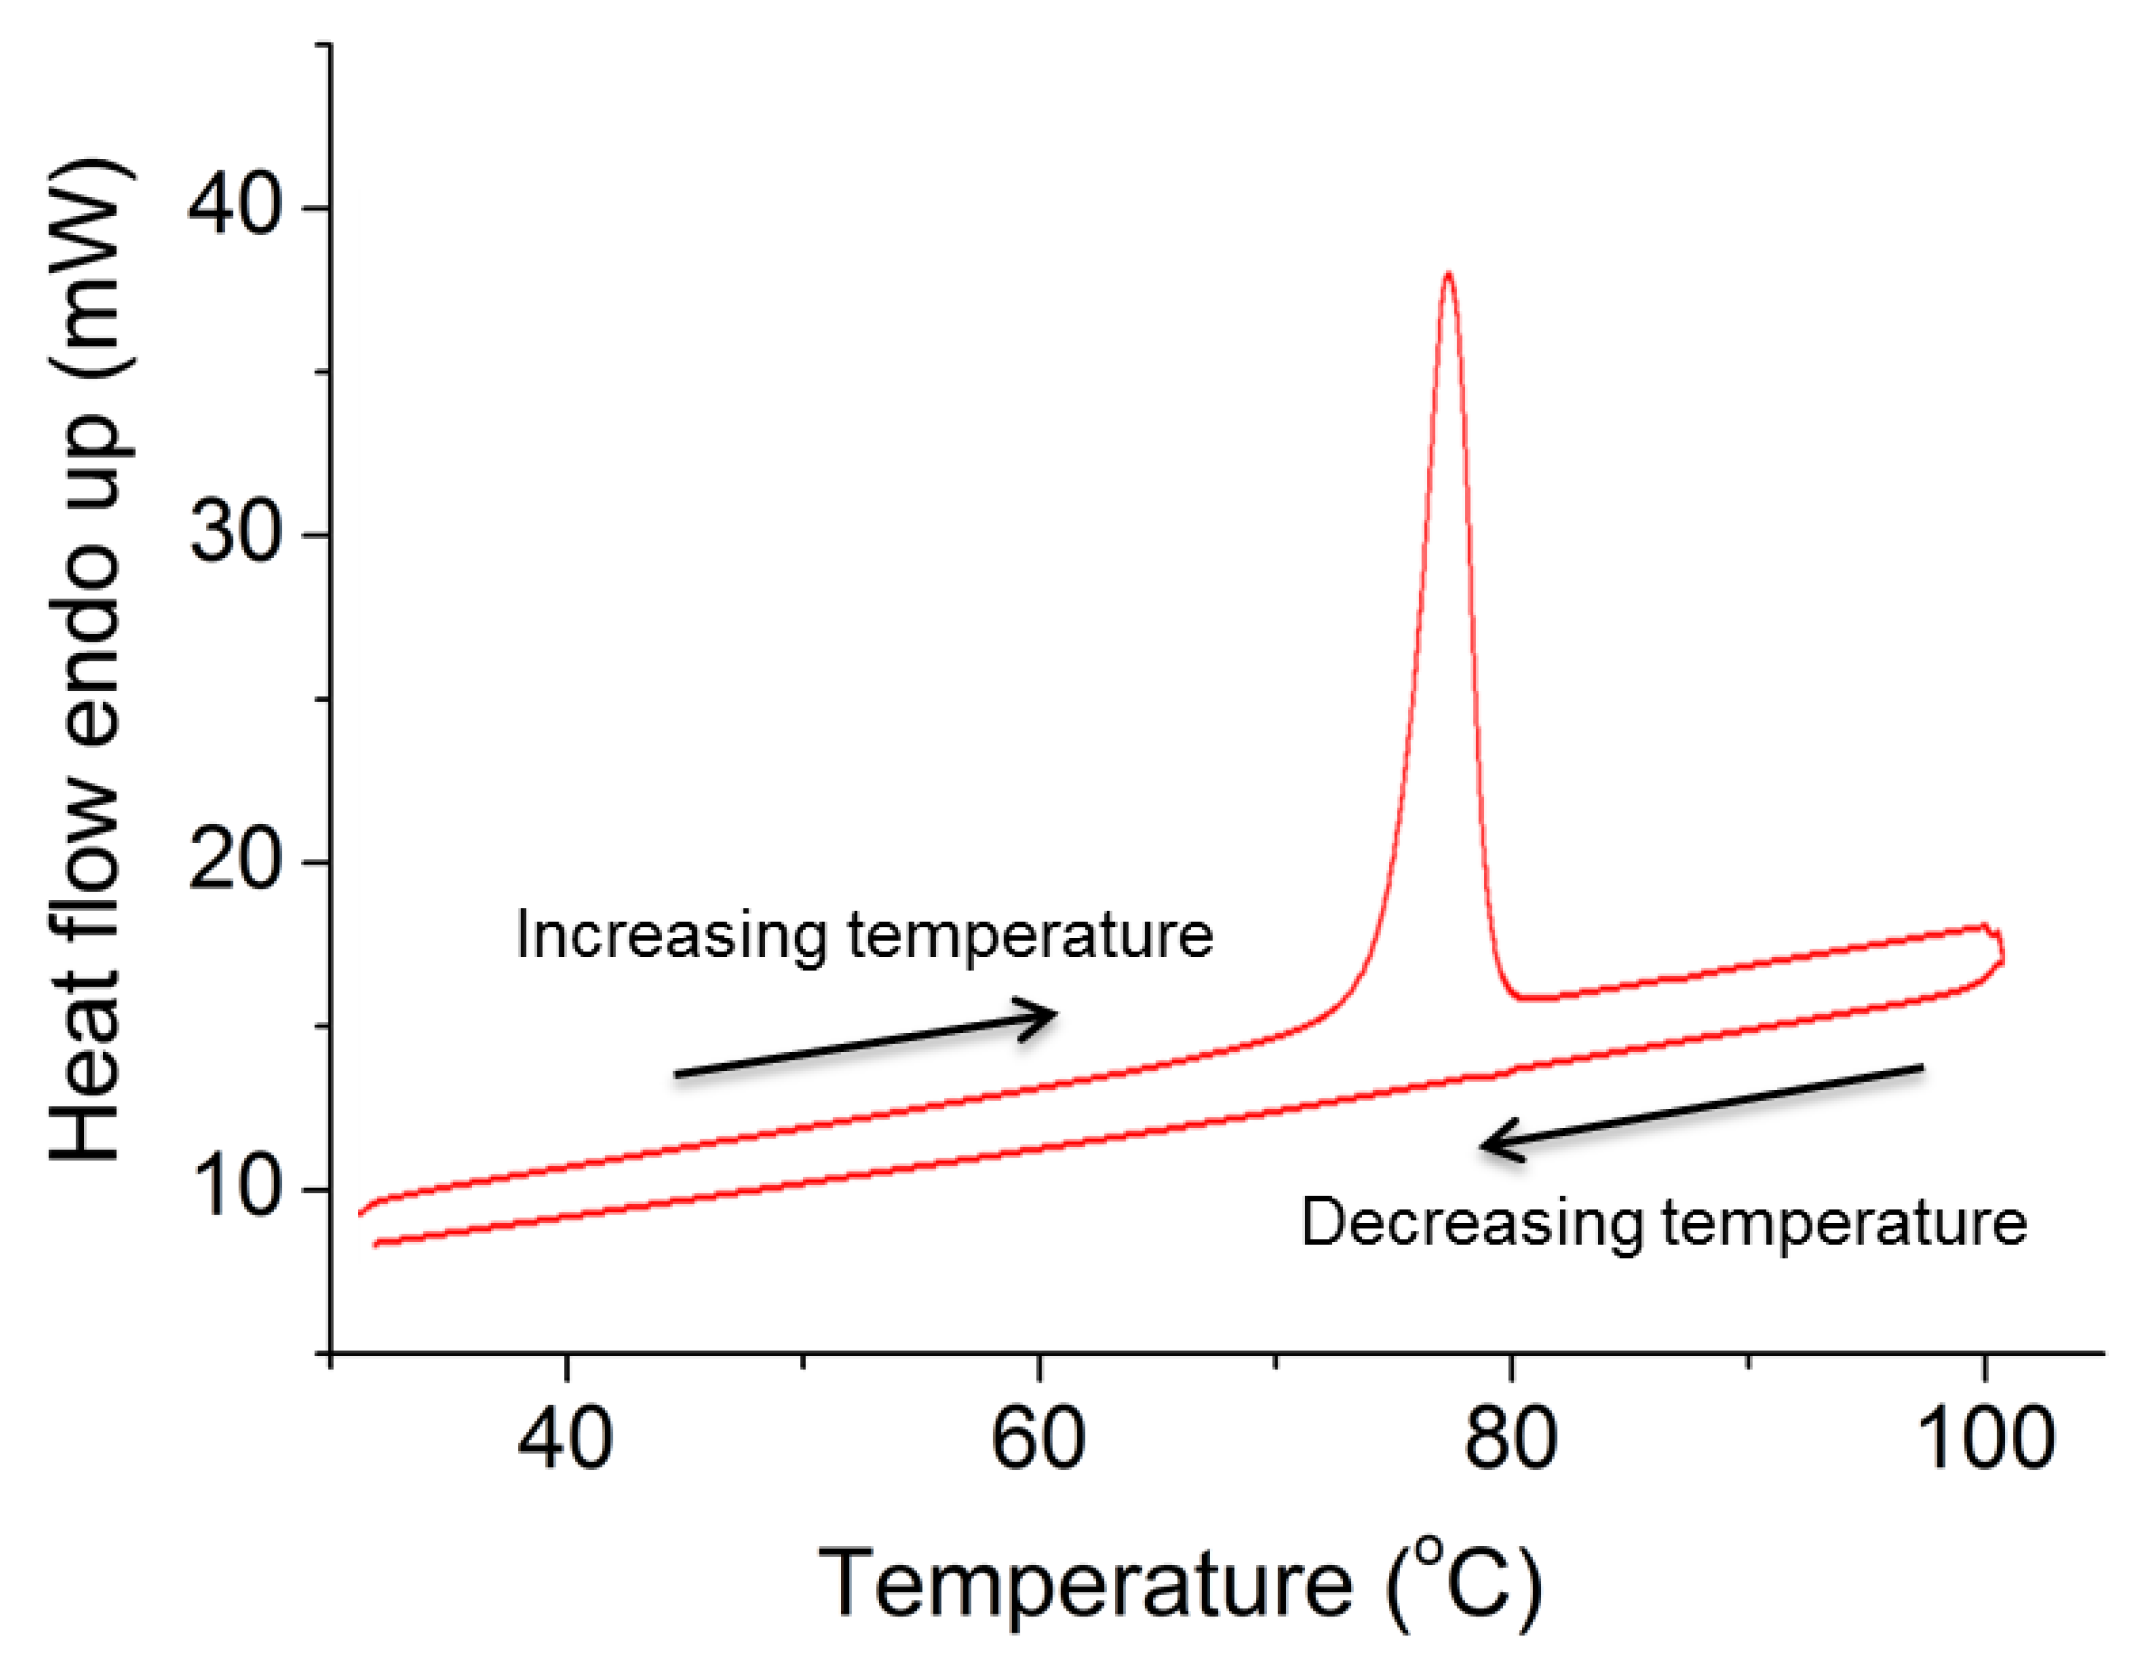
3.7. Micromanipulation and DSC Showed That Ibp Microparticles Are Possibly Supercooled Liquids

Since the micropipette technique also allows us to apply a suction pressure to the formed microparticle, and hence deform it in situ, another interesting observation was that the Ibp microparticle that was formed, for example, in Figure 10b, was actually deformable, and behaved like a liquid droplet. When a suction pressure was applied at the tip of catching pipette, the Ibp microdroplet was easily aspirated inside of the micropipette tip and was deformed from sphere to an elongated shape, indicating it was a liquid microparticle at room temperature. For the pure solid material, the melting temperature and the enthalpy of fusion were determined to be 74.98 °C and 21.25 ± 1.08 kJ/mol respectively, which were in good agreement with literature values [54,55]. Figure 14 shows the heat endotherm associated with the phase transition from crystalline to liquid phase by increasing temperature.
However, the thermograph showed no exothermic depression during the cooling process, which indicates that there was no recrystallization from the melt. Also, when cooled to −10 °C and then reheated, there was no endothermic peak during the reheating process of the Ibp sample. Therefore, a liquid phase microparticle of Ibp that emerged from its DCM dissolution at room temperature, even though Ibp was 50 °C below its melting temperature, did not solidify and possibly remained as a supercooled liquid microdroplet at 25 °C. The characteristic of supercooled amorphous phase of ibuprofen (Tg ~ −45 °C) at room temperature has been described in the literature [82,83]. Bras et al. [82] verified the existence of intermolecular hydrogen-bonded associations in the supercooled Ibp by IR spectroscopy, electrospray ionization mass spectrometry and molecular dynamic simulation. They assumed that there was a specific supramolecular arrangement of Ibuprofen aggregation that could form a liquid crystalline mesophase, which persisted in supercooled state.
For a bulk sample in a round bottom flask, Ibp did crystallize when the DCM solvent was evaporated, showing that crystal formation could take place on the inner surface of the round bottom glass, indicating that heterogeneous nucleation was propagated [84]. However, for an isolated microdroplet, it is possible to achieve supercooling without heterogeneous nucleation and maintain a supercooled liquid of Ibp on the end of the pipette. Future experiments using the micropipette technique (as done previously for other oil-water systems [38]) will use this phenomenon to measure surface tensions against aqueous media for a range of drugs, including Ibp in its supercooled state at the more convenient room temperature.

3.8. Microfluidic Single Channel Scale-Up

Finally, we present some data on microfluidic emulsification of DCM/PLGA droplets that lead to PLGA microsphere formation, informed by the parameters and observations that the single-particle micropipette techniques can offer. Given the control over flow rates, the microfluidic equipment and flow method [5] provides a very robust microfluidic system, ensuring droplet uniformity. Flow rates need to be tuned together and optimized to achieve the perfect microsphere quality.
Several formulations have already been carried out using this technology, including stable cacao butter emulsions, W/O/W emulsions, and polystyrene microspheres formed from DCM [5]. An additional microfluidics system, that pairs with our current micropipette studies on PLGA, is shown in Figure 15. A range of flow rate conditions were assessed in order to evaluate the final particle morphology and quality, characterized by scanning electron microscopy (SEM).
As shown, by keeping the flow rate of the dispersed phase Qd at 0.167, and decreasing the flow rate of the continuous phase Qc from 3.33 to 2.5 and finally to 1.67, perfectly smooth and homogeneous microparticles were formed. Thus, the PLGA microsphere morphology was optimized at flow rates of 0.167 mL/h for the dispersed phase and 1.67 mL/h for the water phase, so that the optimum flow rate ratio Qd/Qc was 10. Flow rates were kept lower to prevent acute blockage by polymer deposition in the chip (with 50 μm by 50 μm channel size). The monodispersed droplets were gradually hardened by solvent dissolution into the surrounding water phase. Optimized microspheres prepared under these kinds of conditions are presented in a higher resolution image in Figure 16.

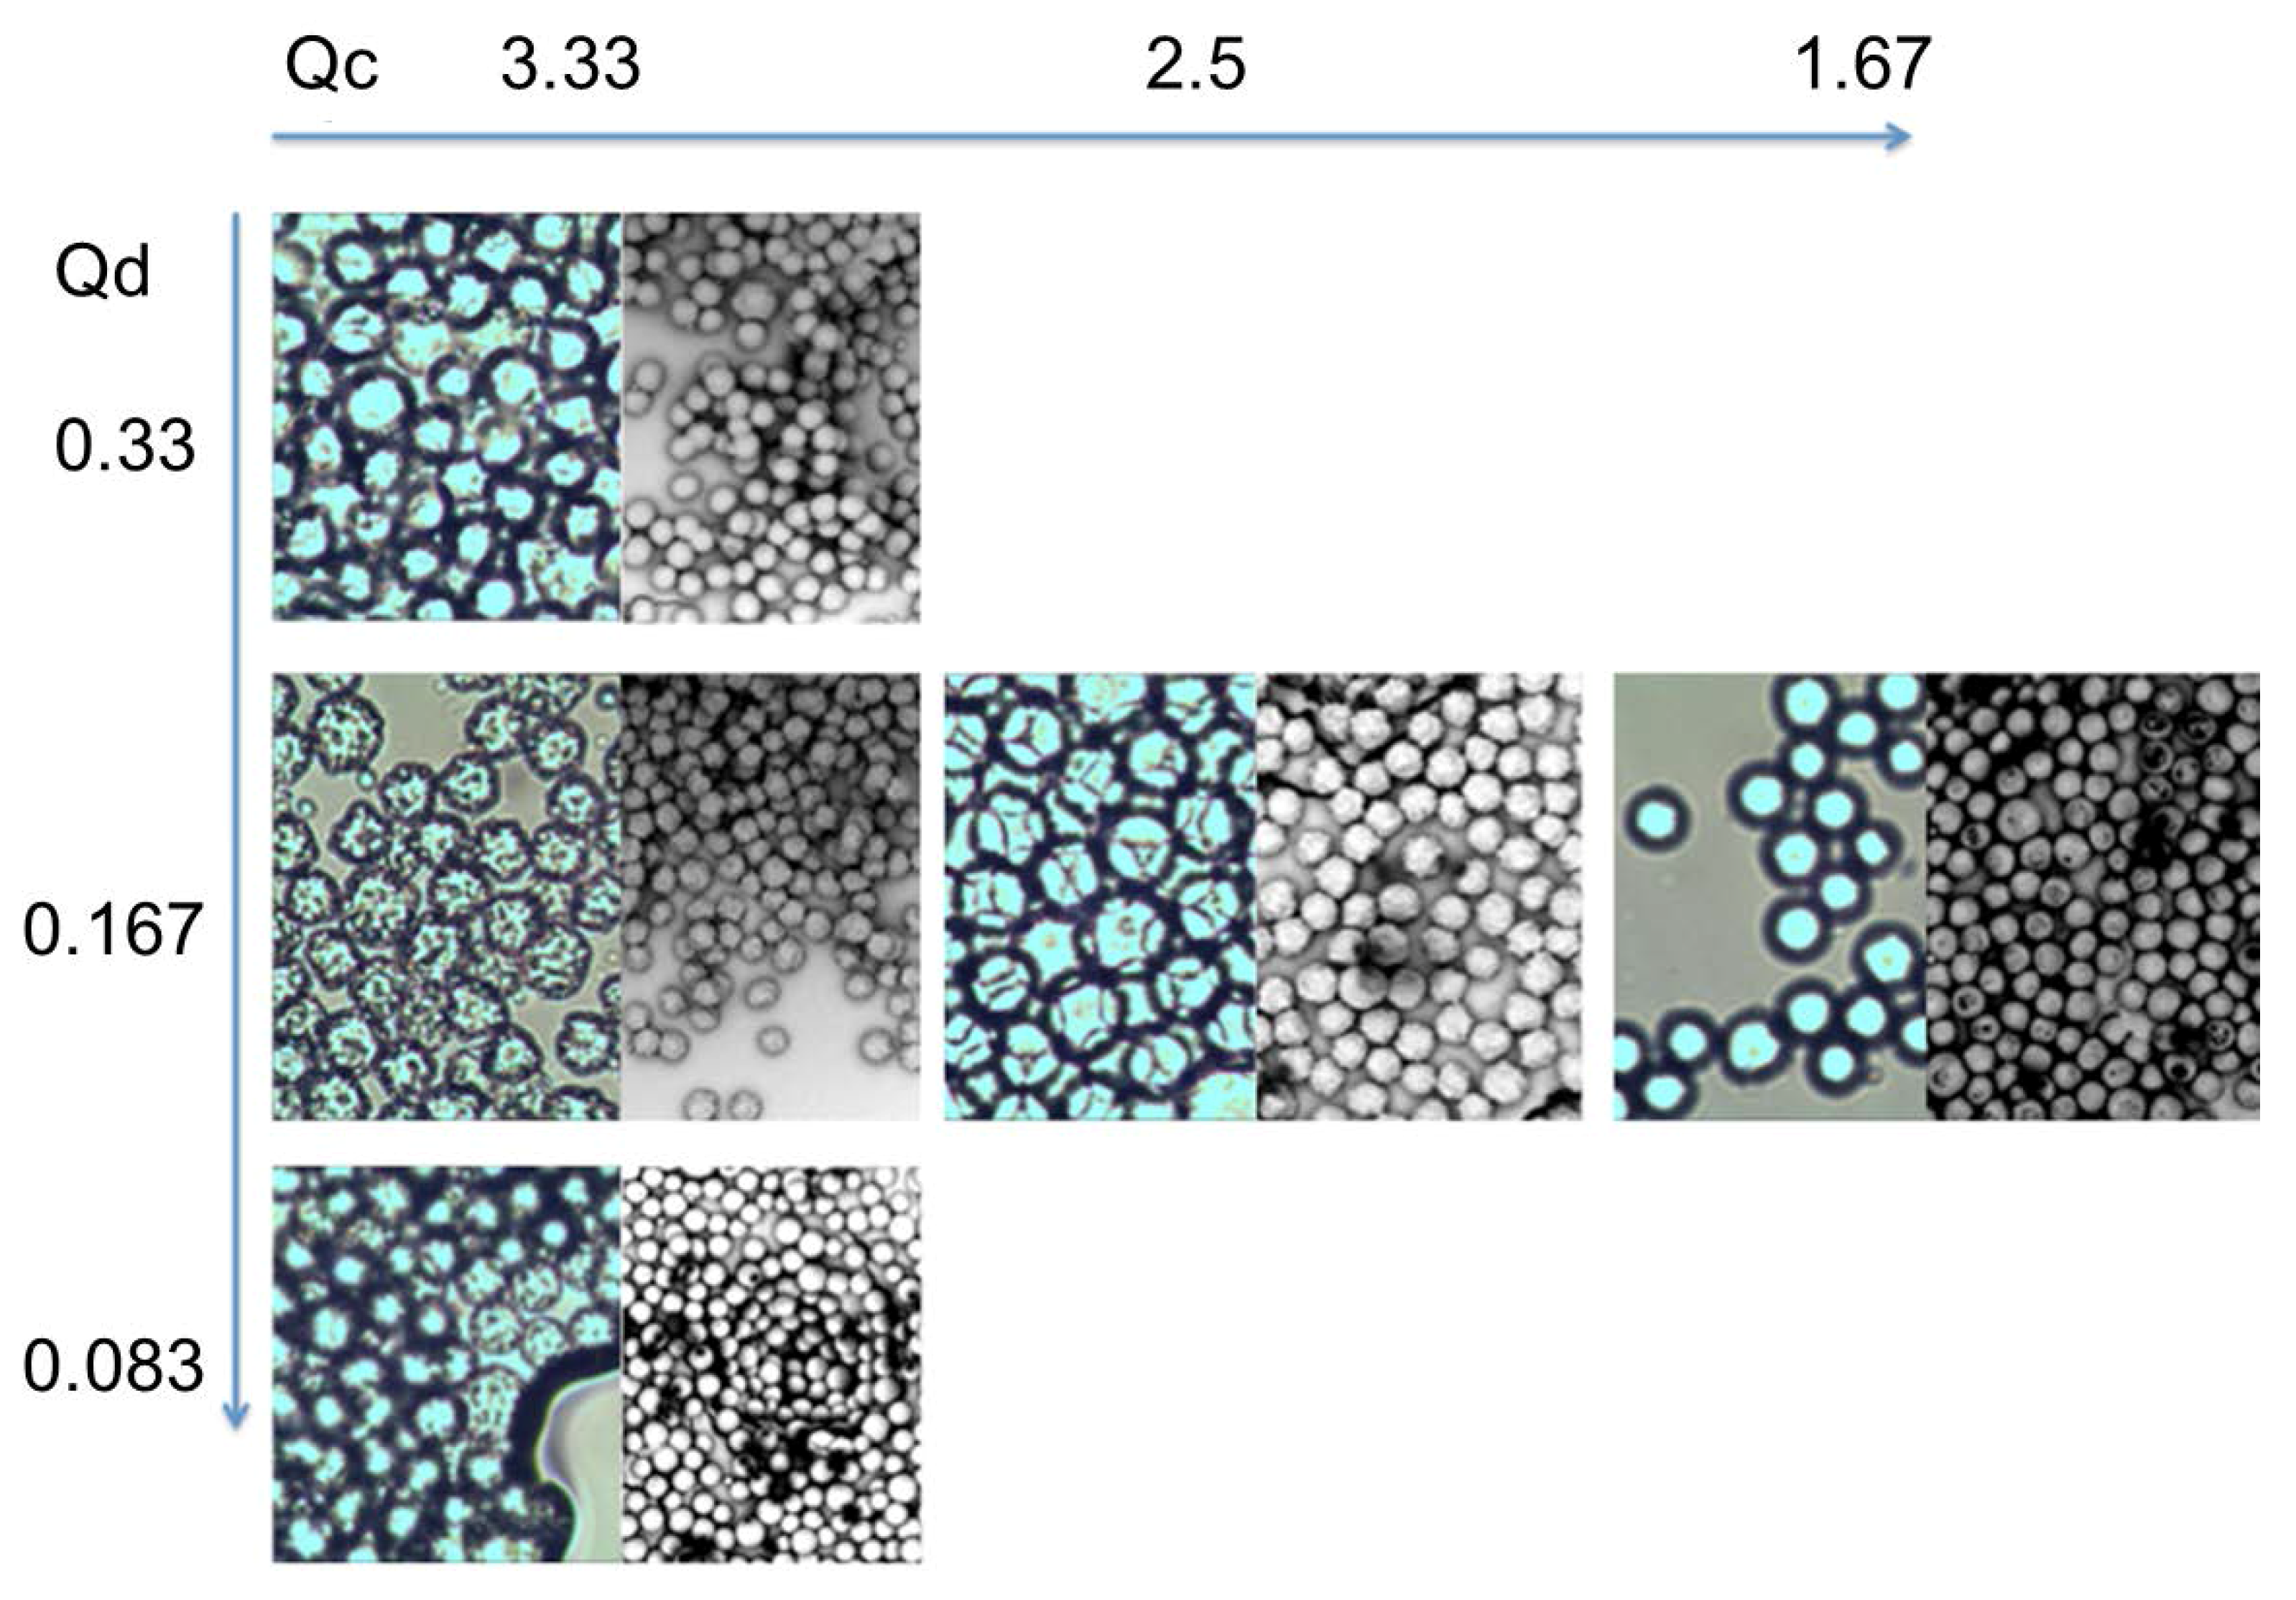
3.9. Multichannel Microfluidic Scale-Up

For the typical polymer microsphere process, the rates for a single channel device yield ~5 mg/h of microspheres. In order to achieve quantities that can be used for drug release experiments, and indeed to provide materials for pre-clinical and clinical trials, scale-up is done on a chip with up to 400 parallel channels (as shown earlier in Figure 5). The current manufacturing capacity is up to 1 kg dry weight of microspheres. However, depending on the application, a typical sustained-release product can require up to 500-kg batches. The manufacturing plant, requiring a next hundreds-fold scale up, is planned to be designed in the same fashion as the first: by parallelization. A ‘microfluidic reactor’ is being designed that will generate up to 20 million microspheres per second. The pilot plant project, that has started, has the goal to design, build and test this reactor.

4. Summary and Conclusions

The aim of the present work was to investigate the encapsulation of a typical hydrophobic drug, Ibuprofen, into PLGA microparticles by using the micropipette technique. By studying such microdroplets, solvent dissolution and microparticle formation, the technique could obtain quantitative information about times, rates of change, diffusion coefficients and even solubility of the drug in micellar solutions. Ibp was precipitated in aqueous media both as a pure drug microparticles and formulated into PLGA microspheres. Using the micropipette technique and our newly developed “single microdroplet catching method”, we obtained precise, microscopic and real-time information about the compound precipitation, final drug loadings (DL) and evidences for phase separation at and above DL = 50 wt%. Interestingly, we also found that pure Ibp precipitated as a supercooled material from organic solutions both by DSC and microscopy/micromanipulation. The pure drug microparticle gradually dissolved into the surrounding aqueous medium, consistent with its already published solubility limit of around 0.83 mg/mL (in 5 mM PBS pH 7.4). From this experiment, the measured diffusion coefficient of pure Ibp dissolution into the buffer was found to be D = 5.5 ± 0.2 × 10⁻⁶ cm2/s, obtained by using the Epstein-Plesset model, which was in excellent agreement with already published values measured by NMR of 5.5 × 10⁻⁶ cm2/s [73]. Based on the measured dissolution rates, the total dissolution times for pure Ibp microparticles in infinite dilution were also estimated as a function of size, with dissolution times ranging from 1.1 s for a 2 μm diameter particle to 3.2 days for a 1000 μm particle. Our measured value of 75 s for a 14.6 µm diameter Ibp microparticle fit exactly on the predicted line. In addition, evidence of the micellar solubilization of Ibp into SDS micelles was directly visualized for the first time using a microscopic technique, estimating the increased apparent solubility limit of Ibp in SDS solution from a solubility of 4 mM (0.825 mg/mL) in water to 80 mM (~3 mg/mL) in 100 mM SDS. All these fundamental properties of Ibp as pure drug microparticles and encapsulated in PLGA microspheres can be readily used to guide the microsphere scale-up production as in the microfluidic emulsification in multichannel devices presented here. Thus, using the micropipette technique to observe the formation, and quantify solvent dissolution, solidification or precipitation of an API or excipient for single and individual microparticles, represents a very useful tool for understanding microsphere processes and hence can help to establish process conditions without resorting to expensive and material-consuming bulk particle runs.

Supplementary Materials

The following are available online at www.mdpi.com/2227-9717/4/4/49/s1, Video S1: Original video of the experimental measures and mechanical analyses of the shear viscosity of a single erythrocyte; Video S2: PLGA microsphere formation by solvent dissolution in 5 mM PBS at room temperature, formed at the tip of the micropipette from a solution droplet of DCM:PLGA (PLGA concentration = 25 mg/mL); Video S3: Pure Ibuprofen microparticle formation from DCM solution (25 mg/mL) and pure Ibp dissolution into PBS buffer at room temperature.

Acknowledgments

We gratefully acknowledge the generous support of the Danish National Research Foundation through a Niels Bohr Professorship Award to D. Needham, Center for Single Particle Science and Engineering, grant project No. 232149. Regarding the patented microfluidic device development, we acknowledge the works of J. van der Schaaf, N. Patil and J. C. Schouten. We also acknowledge the work of undergraduates, T. Muala and H. A. Mohamud and their bachelor projects that provided preliminary data for this study.

Author Contributions

D.N. and R.d.B. conceived and designed the experiments; K.K., E.P., A.H., A.U., P.W. and R.d.B. performed the experiments; K.K., E.P., A.H. and R.d.B. analyzed the data; D.N. and R.d.B. contributed reagents/materials/analysis tools; K.K., E.P., A.H., R.d.B. and D.N. wrote the paper.

Conflicts of Interest

R.d.B. holds the patent on the microfluidic emulsification technology presented here (US patent number 20110165311 A1). The rest of the authors declare no commercial associations or other conflicts of interest.

References

  1. Kinoshita, K.; Parra, E.; Needham, D. New sensitive micro-measurements of dynamic surface tension and diffusion coefficients: Validated and tested for the adsorption of 1-octanol at a microscopic air-water interface and its dissolution into water. J. Colloid Interface Sci. 2017, 488, 166–179. [Google Scholar] [CrossRef] [PubMed]
  2. Duncan, P.B.; Needham, D. Test of the epstein-plesset model for gas microparticle dissolution in aqueous media: Effect of surface tension and gas undersaturation in solution. Langmuir 2004, 20, 2567–2578. [Google Scholar] [CrossRef] [PubMed]
  3. Rickard, D.L.; Brent, D.; David, N. Hydration potential of lysozyme: Protein dehydration using a single microparticle technique. Biophys. J. 2010, 1075–1084. [Google Scholar] [CrossRef] [PubMed]
  4. Su, J.T.; Duncan, P.B.; Momaya, A.; Jutila, A.; Needham, D. The effects of hydrogen bonding on the diffusion of water in n-alkanes and n-alcohols measured with a novel single microdroplet method. J. Chem. Phys. 2010, 132, 044506. [Google Scholar] [CrossRef] [PubMed]
  5. De Bruijn, R.; Van Der Schaaf, J.; Narendra, P.; Schouten, J.C. Process for Preparing Monodispersed Emulsions. US20110165311 A1, 25 March 2010. [Google Scholar]
  6. Hochmuth, R.M.; Worthy, P.R.; Evans, E.A. Red-cell extensional recovery and the determination of membrane viscosity. Biophys. J. 1979, 26, 101–114. [Google Scholar] [CrossRef]
  7. Bagatolli, L.A.; Needham, D. Quantitative optical microscopy and micromanipulation studies on the lipid bilayer membranes of giant unilamellar vesicles. Chem. Phys. Lipids 2014, 181, 99–120. [Google Scholar] [CrossRef] [PubMed]
  8. Needham, D.; Zhelev, D. The mechanochemistry of lipid vesicles examined by micropipet manipulation techniques. In Vesicles; Rosoff, M., Ed.; Marcell Dekker: New York, NY, USA, 1996; Volume 62, p. 373. [Google Scholar]
  9. Needham, D.; Zhelev, D. Use of micropipet manipulation techniques to measure the properties of giant lipid vesicles. In Giant Vesicles; Luisi, P.L., Walde, P., Eds.; John Wiley & Sons Ltd.: Chichester, UK, 2000; pp. 103–147. [Google Scholar]
  10. Parra, E.; Needham, D. Mechanic assays based on micropipette aspiration. In The Giant Vesicle Book; Dimova, R., Marques, C., Eds.; CRC Taylor & Francis: Boca Raton, FL, USA, 2016; in press. [Google Scholar]
  11. Mitchison, J.; Swann, M. The mechanical properties of the cell surface I. The cell elastimeter. J. Exp. Biol. 1954, 31, 443–460. [Google Scholar]
  12. Mitchison, J.; Swann, M. The mechanical properties of the cell surface iii. The sea-urchin egg from fertilization to cleavage. J. Exp. Biol. 1955, 32, 734–750. [Google Scholar]
  13. Rand, R.; Burton, A. Mechanical properties of the red cell membrane: I. Membrane stiffness and intracellular pressure. Biophys. J. 1964, 4, 115. [Google Scholar] [CrossRef]
  14. Evans, E.; Skalak, R. Mechanics and Thermodynamics Biomembranes; CRC Press: Boca Raton, FL, USA, 1980. [Google Scholar]
  15. Evans, E.; Hochmuth, R.M. Mechanochemical properties of membranes. In Current topics in Membranes and Transport; Bonner, F., Kleinzeller, A., Eds.; Academic Press: New York, NY, USA, 1978; Volume 10, p. 1. [Google Scholar]
  16. Meiselman, H.J.; Lichtman, M.A.; LaCelle, P.L. White cell mechanics: Basic science and clinical aspects. In Proceedings of the a symposium held at the Kroc Foundation, Santa Ynez Valley, CA, USA, 12–16 September 1984.
  17. Tran-Son-Tay, R.; Needham, D.; Yeung, A.; Hochmuth, R.M. Time-dependent recovery of passive neutrophils after large deformation. Biophys. J. 1991, 60, 856–866. [Google Scholar] [CrossRef]
  18. Needham, D.; McIntosh, T.; Evans, E. Thermomechanical and transition properties of dimyristoylphosphatidylcholine/cholesterol bilayers. Biochemistry 1988, 27, 4668–4673. [Google Scholar] [CrossRef] [PubMed]
  19. Evans, E.; Kwok, R. Mechanical calorimetry of large dimyristoylphosphatidylcholine vesicles in the phase transition region. Biochemistry 1982, 21, 4874–4879. [Google Scholar] [CrossRef] [PubMed]
  20. Kwok, R.; Evans, E. Thermoelasticity of large lecithin bilayer vesicles. Biophys. J. 1981, 35, 637–652. [Google Scholar] [CrossRef]
  21. Evans, E.; Needham, D. Physical-properties of surfactant bilayer-membranes—Thermal transitions, elasticity, rigidity, cohesion, and colloidal interactions. J. Phys. Chem. 1987, 91, 4219–4228. [Google Scholar] [CrossRef]
  22. Evans, E.; Rawicz, W.; Smith, B.A. Back to the future: Mechanics and thermodynamics of lipid biomembranes. Faraday Discuss 2013, 161, 591–611. [Google Scholar] [CrossRef] [PubMed]
  23. Kiser, P.F.; Wilson, G.; Needham, D. A synthetic mimic of the secretory granule for drug delivery. Nature 1998, 394, 459–462. [Google Scholar] [PubMed]
  24. Kiser, P.F.; Wilson, G.; Needham, D. Lipid-coated microgels for the triggered release of doxorubicin. J. Control. Release 2000, 68, 9–22. [Google Scholar] [CrossRef]
  25. Lee, S.; Kim, D.H.; Needham, D. Equilibrium and dynamic interfacial tension measurements at microscopic interfaces using a micropipet technique. 2. Dynamics of phospholipid monolayer formation and equilibrium tensions at the water-air interface. Langmuir 2001, 17, 5544–5550. [Google Scholar] [CrossRef]
  26. Lee, S.; Kim, D.H.; Needham, D. Equilibrium and dynamic interfacial tension measurements at microscopic interfaces using a micropipet technique. 1. A new method for determination of interfacial tension. Langmuir 2001, 17, 5537–5543. [Google Scholar] [CrossRef]
  27. Duncan, P.B.; Needham, D. Microdroplet dissolution into a second-phase solvent using a micropipet technique: Test of the epstein-plesset model for an aniline-water system. Langmuir 2006, 22, 4190–4197. [Google Scholar] [CrossRef] [PubMed]
  28. Yang, C.; Plackett, D.; Needham, D.; Burt, H.M. Plga and phbv microsphere formulations and solid-state characterization: Possible implications for local delivery of fusidic acid for the treatment and prevention of orthopaedic infections. Pharm. Res. 2009, 26, 1644–1656. [Google Scholar] [CrossRef] [PubMed]
  29. Gilchrist, S.E.; Rickard, D.L.; Letchford, K.; Needham, D.; Burt, H.M. Phase separation behavior of fusidic acid and rifampicin in plga microspheres. Mol. Pharm. 2012, 9, 1489–1501. [Google Scholar] [CrossRef] [PubMed]
  30. Su, J.T.; Needham, D. Mass transfer in the dissolution of a multicomponent liquid droplet in an immiscible liquid environment. Langmuir 2013, 29, 13339–13345. [Google Scholar] [CrossRef] [PubMed]
  31. Gaul, D.A.; Rickard, D.L.; Needham, D. Microglassificationtm: A novel technique for protein dehydration. J. Pharm. Sci. 2014, 103, 810–820. [Google Scholar]
  32. Kinoshita, K.; Parra, E.; Utoft, A.; Needham, D. Saturation and supersaturation measurement of hydrophobic solute with micropipette manipulation technique. In Proceedings of the 29th Conference of the European Colloid and Interface Society, Bordeaux, France, 4–9 September 2015.
  33. Bitterfield, D.; Anders, U.; Needham, D. Dissolution rates of solute-containing microdroplets: An activity-based dissolution model. Langmuir 2016, in press. [Google Scholar] [CrossRef] [PubMed]
  34. Kinoshita, K.; Parra, E.; Utoft1, A.; Hussein, A.; Muala, T.; Mohamud, H.; Walke, P.; Needham, D. New single microparticle technique for forming and characterizing polymer microsphere-drug encapsulation and dissolution: Initial tests for ibuprofen-PLGA-DCM. In Presented at Annual Meeting & Exposition of the Controlled Release Society, Seattle, WA, USA, 17–20 July 2016.
  35. Parra, E.; Hervella, P.; Needham, D. Real-time visualization of the precipitation and phase behavior of octaethylporphyrin in lipid microparticles. J. Pharm. Sci. 2016, in press. [Google Scholar]
  36. Kinoshita, K.; Parra, E.; Needham, D. Saturation and supersaturation measurement of cholesterol and cholesteryl ester with micropipette manipulation technique. Langmuir 2016, in press. [Google Scholar]
  37. Parra, E.; Kinoshita, K.; Needham, D. Micropipette technique study of natural and synthetic lung surfactants at the air-water interface: Presence of a sp-b analog peptide promotes membrane aggregation, formation of tightly stacked lamellae, and growth of myelin figures. Langmuir 2016, 32, 10570–10581. [Google Scholar] [CrossRef] [PubMed]
  38. Yeung, A.; Dabros, T.; Masliyah, J.; Czarnecki, J. Micropipette: A new technique in emulsion research. Coll. Surf. A Physicochem. Eng. Asp. 2000, 174, 169–181. [Google Scholar] [CrossRef]
  39. Thorssen, T.; Roberts, R.W.; Arnold, F.H.; Quake, S.R. Dynamic pattern formation in a vesicle-generating microfluidic device. Phys. Rev. Lett. 2001, 86, 4163–4166. [Google Scholar] [CrossRef] [PubMed]
  40. Herrero-Vanrell, R.; Bravo-Osuna, I.; Andrés-Guerrero, V.; Vicario-de-la-Torre, M.; Molina-Martínez, I.T. The potential of using biodegradable microspheres in retinal diseases and other intraocular pathologies. Prog. Retin. Eye Res. 2014, 42, 27–43. [Google Scholar] [CrossRef] [PubMed]
  41. Okada, H. One- and three-month release injectable microspheres of the lh-rh superagonist leuprorelin acetate. Adv. Drug Deliv. Rev. 1997, 28, 43–70. [Google Scholar] [CrossRef]
  42. Hirota, K.; Doty, A.C.; Ackermann, R.; Zhou, J.; Olsen, K.F.; Feng, M.R.; Wang, Y.; Choi, S.; Qu, W.; Schwendeman, A.S.; et al. Characterizing release mechanisms of leuprolide acetate-loaded plga microspheres for ivivc development i: In vitro evaluation. J. Control. Release 2016. [Google Scholar] [CrossRef] [PubMed]
  43. Uhrich, K.E.; Cannizzaro, S.M.; Langer, R.S.; Shakesheff, K.M. Polymeric systems for controlled drug release. Chem. Rev. 1999, 99, 3181–3198. [Google Scholar] [CrossRef] [PubMed]
  44. Davies, N.M. Clinical pharmacokinetics of ibuprofen-the first 30 years. Clin. Pharm. 1998, 34, 101–154. [Google Scholar] [CrossRef] [PubMed]
  45. Wiegand, T.J. Nonsteroidal Anti-Inflammatory Agent Toxicity. Available online: http://emedicine.medscape.com/article/816117-overview. (accessed on 30 November 2016).
  46. Bédouet, L.; Pascale, F.; Moine, L.; Wasse, M.; Ghegediban, S.H.; Nguyen, V.-N.; Bonneau, M.; Labarre, D.; Laurent, A. Intra-articular fate of degradable poly(ethyleneglycol)-hydrogel microspheres as carriers for sustained drug delivery. Int. J. Pharm. 2013, 456, 536–544. [Google Scholar] [CrossRef] [PubMed]
  47. Bedouet, L.; Moine, L.; Pascale, F.; Nguyen, V.N.; Labarre, D.; Laurent, A. Synthesis of hydrophilic intra-articular microspheres conjugated to ibuprofen and evaluation of anti-inflammatory activity on articular explants. Int. J. Pharm. 2014, 459, 51–61. [Google Scholar] [CrossRef] [PubMed]
  48. Bedouet, L.; Pascale, F.; Bonneau, M.; Laurent, A. In vitro evaluation of s-(+)-ibuprofen as drug candidate for intra-articular drug delivery system. Drug Dev. Ind. Pharm. 2015, 41, 85–94. [Google Scholar] [CrossRef] [PubMed]
  49. Gerwin, N.; Hops, C.; Lucke, A. Intraarticular drug delivery in osteoarthritis. Drug Deliv. Degener. Jt. Dis. 2006, 58, 226–242. [Google Scholar]
  50. Larsen, C.; Østergaard, J.; Larsen, S.W.; Jensen, H.; Jacobsen, S.; Lindegaard, C.; Andersen, P.H. Intra-articular depot formulation principles: Role in the management of postoperative pain and arthritic disorders. J. Pharm. Sci. 2008, 97, 4622–4654. [Google Scholar] [CrossRef] [PubMed]
  51. Fernandez-Carballido, A.; Herrero-Vanrell, R.; Molina-Martinez, I.T.; Pastoriza, P. Biodegradable ibuprofen-loaded plga microspheres for intraarticular administration. Effect of labrafil addition on release in vitro. Int. J. Pharm. 2004, 279, 33–41. [Google Scholar] [CrossRef] [PubMed]
  52. Bonelli, P.; Tuccillo, F.M.; Federico, A.; Napolitano, M.; Borrelli, A.; Melisi, D.; Rimoli, M.G.; Palaia, R.; Arra, C.; Carinci, F. Ibuprofen delivered by poly(lactic-co-glycolic acid) (plga) nanoparticles to human gastric cancer cells exerts antiproliferative activity at very low concentrations. Int. J. Nanomed. 2012, 7, 5683–5691. [Google Scholar] [CrossRef] [PubMed]
  53. Epstein, P.S.; Plesset, M.S. On the stability of gas bubbles in liquid-gas solutions. J. Chem. Phys. 1950, 18, 1505. [Google Scholar] [CrossRef]
  54. Dudognon, E.; Danede, F.; Descamps, M.; Correia, N.T. Evidence for a new crystalline phase of racemic ibuprofen. Pharm. Res. 2008, 25, 2853–2858. [Google Scholar] [CrossRef] [PubMed]
  55. Williams, P.A.; Hughes, C.E.; Harris, K.D.M. New insights into the preparation of the low-melting polymorph of racemic ibuprofen. Cryst. Growth Des. 2012, 12, 5839–5845. [Google Scholar] [CrossRef]
  56. Olbrich, K.C. Water Permeability and Mechanical Properties of Unsaturated Lipid Membranes and Sarcolemmal Vesicles; Duke University: Durham, NC, USA, 1997. [Google Scholar]
  57. Schneider, C.A.; Rasband, W.S.; Eliceiri, K.W. Nih image to imagej: 25 years of image analysis. Nat. Methods 2012, 9, 671–675. [Google Scholar] [CrossRef] [PubMed]
  58. Nunes, J.K.; Tsai, S.S.H.; Wan, J.; Stone, H.A. Dripping and jetting in microfluidic multiphase flows applied to particle and fibre synthesis. J. Phys. D Appl. Phys. 2013, 46, 114002–114021. [Google Scholar] [CrossRef] [PubMed]
  59. Christopher, G.F.; Anna, S.L. Microfluidic methods for generating continuous droplet streams. J. Phys. D Appl. Phys. 2007, 40, R319–R336. [Google Scholar] [CrossRef]
  60. Anna, S.L.; Bontoux, N.; Stone, H.A. Formation of dispersions using “flow focusing” in microchannels. Appl. Phys. Lett. 2003, 82, 364–366. [Google Scholar] [CrossRef]
  61. Dreyfus, R.; Tabeling, P.; Willaime, H. Ordered and disordered patterns in two-phase flows in microchannels. Phys. Rev. Lett. 2003, 90, 14505. [Google Scholar] [CrossRef] [PubMed]
  62. Utada, A.S.; Fernandez-Nieves, A.; Stone, H.A.; Weitz, D.A. Dripping to jetting transitions in coflowing liquid streams. Phys. Rev. Lett. 2007, 99, 094502. [Google Scholar] [CrossRef] [PubMed]
  63. Herrada, M.A.; Ganan-Calvo, A.M.; Guillot, P. Spatiotemporal instability of a confined capillary jet. Phys. Rev. E 2008, 78, 1398–1411. [Google Scholar] [CrossRef] [PubMed]
  64. Utada, A.S.; Lorenceau, E.; Link, D.R.; Kaplan, P.D.; Stone, H.A.; Weitz, D.A. Monodisperse double emulsions generated from a microcapillary device. Science 2005, 308, 537–541. [Google Scholar] [CrossRef] [PubMed]
  65. Nisisako, T.; Okushima, S.; Torii, T. Controlled formulation of monodisperse double emulsions in a multiple-phase microfluidic system. Soft Matter 2005, 1, 23–27. [Google Scholar] [CrossRef]
  66. Gu, H.; Duits, M.H.G.; Mugele, F. Droplets formation and merging in two-phase flow microfluidics. Int. J. Mol. Sci. 2011, 12, 2572–2597. [Google Scholar] [CrossRef] [PubMed]
  67. Martin-Banderas, L.; Flores-Mosquera, M.; Riesco-Chueca, P.; Rodriguez-Gil, A.; Cebolla, A.; Chavez, S.; Ganan-Calvo, A.M. Flow focusing: A versatile technology to produce size-controlled and specific-morphology microparticles. Small 2005, 1, 688–692. [Google Scholar] [CrossRef] [PubMed]
  68. Zhou, C.F.; Yue, P.T.; Feng, J.J. Formation of simple and compound drops in microfluidic devices. Phys. Fluids 2006, 18, 092105. [Google Scholar] [CrossRef]
  69. Squires, T.M.; Quake, S.R. Microfluidics: Fluid physics at the nanoliter scale. Rev. Mod. Phys. 2005, 77, 977–1026. [Google Scholar] [CrossRef]
  70. Donahue, D.J.; Bartell, F.E. The boundary tension at water-organic liquid interfaces. J. Phys. Chem. 1952, 56, 480–484. [Google Scholar] [CrossRef]
  71. Lyman, W.J.; Reehl, W.F.R. Handbook of Chemical Property Estimation Methods: Environmental Behavior of Organic Compounds; American Chemical Society: Washington, DC, USA, 1990. [Google Scholar]
  72. Arnold, M.M.; Gonnan, E.M.; Schieber, L.J.; Munson, E.J.; Berkland, C. Nanocipro encapsulation in monodisperse large porous plga microparticles. J. Control. Release 2007, 121, 100–109. [Google Scholar] [CrossRef] [PubMed]
  73. Derrick, T.S.; McCord, E.F.; Larive, C.K. Analysis of protein/ligand interactions with nmr diffusion measurements: The importance of eliminating the protein background. J. Magn. Reson. 2002, 155, 217–225. [Google Scholar] [CrossRef] [PubMed]
  74. Zhang, P.; de la Torre, T.Z.G.; Forsgren, J.; Bergstrom, C.A.S.; Stromme, M. Diffusion-controlled drug release from the mesoporous magnesium carbonate upsalite. J. Pharm. Sci. 2016, 105, 657–663. [Google Scholar] [CrossRef] [PubMed]
  75. Rangel-Yagui, C.O.; Hsu, H.W.L.; Pessoa, A., Jr.; Tavares, L.C. Micellar solubilization of ibuprofen—Influence of surfactant head groups on the extent of solubilization. Rev. Bras. Ciênc. Farm. 2005, 41, 237–246. [Google Scholar] [CrossRef]
  76. Shaw, L.R.; Irwin, W.J.; Grattan, T.J.; Conway, B.R. The effect of selected water-soluble excipients on the dissolution of paracetamol and ibuprofen. Drug Dev. Ind. Pharm. 2005, 31, 515–525. [Google Scholar] [CrossRef] [PubMed]
  77. Rangel-Yagui, C.O.; Pessoa, A.; Tavares, L.C. Micellar solubilization of drugs. J. Pharm. Pharm. Sci. 2005, 8, 147–163. [Google Scholar] [PubMed]
  78. Stephenson, B.C.; Rangel-Yagui, C.O.; Pessoa, A.; Tavares, L.C.; Beers, K.; Blankschtein, D. Experimental and theoretical investigation of the micellar-assisted solubilization of ibuprofen in aqueous media. Langmuir 2006, 22, 1514–1525. [Google Scholar] [CrossRef] [PubMed]
  79. Ridell, A.; Evertsson, H.; Nilsson, S.; Sundelöf, L.O. Amphiphilic association of ibuprofen and two nonionic cellulose derivatives in aqueous solution. J. Pharm. Sci. 1999, 88, 1175–1181. [Google Scholar] [CrossRef] [PubMed]
  80. Rub, M.A.; Azum, N.; Kumar, D.; Asiri, A.M.; Marwani, H.M. Micellization and microstructural studies between amphiphilic drug ibuprofen with non-ionic surfactant in aqueous urea solution. J. Chem. Thermodyn. 2014, 74, 91–102. [Google Scholar] [CrossRef]
  81. Prakash, P.; Sayyed-Ahmad, A.; Zhou, Y.; Volk, D.E.; Gorenstein, D.G.; Dial, E.; Lichtenberger, L.M.; Gorfe, A.A. Aggregation behavior of ibuprofen, cholic acid and dodecylphosphocholine micelles. Biochim. Biophys. Acta 2012, 1818, 3040–3047. [Google Scholar] [CrossRef] [PubMed]
  82. Bras, A.R.; Noronha, J.P.; Antunes, A.M.M.; Cardoso, M.M.; Schonhals, A.; Affouard, F.; Dionisio, M.; Correia, N.T. Molecular motions in amorphous ibuprofen as studied by broadband dielectric spectroscopy. J. Phys. Chem. B 2008, 112, 11087–11099. [Google Scholar] [CrossRef] [PubMed]
  83. Johari, G.P.; Kim, S.; Shanker, R.M. Dielectric relaxation and crystallization of ultraviscous melt and glassy states of aspirin, ibuprofen, progesterone, and quinidine. J. Pharm. Sci. 2007, 96, 1159–1175. [Google Scholar] [CrossRef] [PubMed]
  84. Descamps, M.; Dudognon, E. Crystallization from the amorphous state: Nucleation-growth decoupling, polymorphism interplay, and the role of interfaces. J. Pharm. Sci. 2014, 103, 2615–2628. [Google Scholar] [CrossRef] [PubMed]
Figure 1. Micropipette and scale. (a) Photograph of an actual micropipette held by hand; (b) Magnification and scale comparing the diameter of a human hair of ~70 μm, to scale with the tip of a typical micropipette of 10 μm that is routinely used for manipulation of emulsion microdroplets and microparticles. Also shown are a neutrophil and erythrocyte that are ~7 μm in diameter; (c) A 1.2 μm diameter micropipette as used in the experimental measures and mechanical analyses of the shear viscosity of a single erythrocyte, and the experiment that takes about 1 s: (i) initial aspiration of the discoid erythrocyte membrane that was point attached to the glass cover slip; (ii) movement of the micropipette back extends the cell in shear; (iii) full extension; (iv) release of the cell and observation of its elastic recoil against its shear viscosity; (v) cell returns to its discoid shape (see Video S1 in Supplementary Materials).
Processes 04 00049 g001
Figure 2. The micropipette manipulation station. (a) The setup consists of an inverted microscope to place and visualize the micropipette tip, operated by micromanipulators, connected to a pressurization system (μatm to matm); the samples are placed in a custom-made microchamber and all the experiments are recorded in real time by using a side-port camera for subsequent analysis; (b) The micropipette (i) is mounted via a chuck (ii) in a custom-built holder controlled by micromanipulators (iii); mounted on a stage micrometer; (iv) bolted firmly to the microscope platform (v); The image of the pipette tip in the microchamber (vi) is viewed via a 40× objective lens (vii).
Processes 04 00049 g002
Figure 3. Single microdroplet catching method. (a) Two micropipettes, sample-filled (loading, right hand) and water-filled (catching, left hand) pipettes, were inserted in a water-filled glass chamber under proper applied pipette pressure for each one. The chamber was sealed with hexadecane plugging after the pipettes were inserted; (b) Microdroplet dissolution in medium at 20 °C. A microdroplet was formed by injection with the loading micropipette (i), and it was trapped instantly with the catching pipette just by capillarity forces (ii, iii). The isolated microdroplet dissolved gradually into the surrounding medium phase, and all the process was recorded continuously for the subsequent video analysis.
Processes 04 00049 g003
Figure 4. The microfluidic system. (a) (top) Schematic 3D picture of droplet formation showing the arrangement of the two inlet tubes: (i) continuous phase inlet that then splits into two tubes; (ii) dispersed phase inlet; (iii) mixing head. (bottom) High-speed microscope image of the single-channel production window; (b) Flow map, depicting all combinations of liquid properties, microchannel size and flow rates. Combinations in the white area (region A) yield the desired process, i.e., spherical particles; combinations in the black area (region B) lead to instabilities and non-uniform droplets; and, in the grey area (region C), to droplets larger than the exit channel.
Processes 04 00049 g004
Figure 5. Multichannel chip. (a) Picture of multichannel chip showing each individual droplet head; (b) Actual high-speed microscopic image of the exit of a multi-channel prototype device and the droplets moving towards the collection tube. Droplets were 50 μm in diameter. Reproduced with permission from [5], World Intellectual Property Organization, 2010.
Processes 04 00049 g005
Figure 6. Solvent microdroplet dissolution. (a) Video micrographs of a microdroplet formation and dissolution: (i) a microdroplet was formed with the delivery pipette (t = 0.6 s); (ii) the isolated microdroplet lost dichloromethane (DCM) over time (t = 3 s); (iii) the isolated microdroplet lost DCM over time (t = 5 s); (iv) the isolated microdroplet reached the size of the holding pipette (t = 9 s) and was aspirated inside of the micropipette; (b) Graphs representing microdroplet dissolution: (i) droplet radius vs. time for three separate microdroplets of DCM dissolving in water. Extrapolation of the data (green open circles) for the droplet shown in video micrographs (i)–(iv) to radius = 0, shows that the droplet was entirely dissolved in ~10 s. Dotted line is the radius of the micropipette tip and so when droplet reaches this size it was aspirated up the pipette; (ii) R02R2 vs. time plot that collapsed the data onto a single line.
Processes 04 00049 g006
Figure 7. Poly(lactic-co-glycolic acid) (PLGA) microsphere formation by solvent dissolution in 5 mM PBS (pH 7.4) at room temperature. (a) Dissolution of DCM from a solution droplet of DCM/PLGA at the tip of the micropipette (PLGA concentration = 25 mg/mL); (b) Graphs representing microdroplet dissolution: (i) Droplet radius vs. time for three separate DCM/PLGA microdroplets of dissolving in 5 mM PBS. Extrapolation of the data (green open circles) for the droplet shown in video micrographs (i)–(iv) to radius = 10 μm, shows that this microdroplet lost almost all of its DCM, in ~19 s and concentrated to a final density of CPLGA = 1,012 ± 20 mg/mL. In this case, the measured loss of DCM gave a DCM diffusion coefficient D = 1.77 ± 0.01 × 10⁻⁵ cm−2/s); (ii) R 0 2 R 2 vs. time plot that collapsed the data onto a single line up until the PLGA solidified out of the solvent.
Processes 04 00049 g007
Figure 8. DCM/PLGA/Ibp solution microdroplet dissolution in PBS at room temperature. (a) Videomicrographs of three different PLGA microdroplets formation and precipitation with different DL of Ibp. (i)–(iii) DL 15 wt% Ibp obtaining a final PLGA concentration of 1020 ± 11 mg/mL and a final Ibp concentration of 180 ± 2 mg/mL (the original video is available at Supplementary Materials, Video S2); (iv)–(vi) DL 50 wt% Ibp, obtaining a final PLGA concentration of 670 ± 16 mg/mL and a final Ibp concentration of 670 ± 16 mg/mL; (vii)–(ix) DL 60 wt% Ibp, obtaining a final PLGA concentration of 496 ± 15 mg/mL and a final Ibp concentration of 745 ± 22 mg/mL. At DL = 50 wt% and 60 wt%, a mosaic pattern was observed during the solidification (vi,ix). At these high concentrations, visible trapped inclusions were also formed in the microdroplets and particles; (b) (i) Droplet radius vs. time for four separate microdroplets of DCM/PLGA/Ibp (DL = 0%, 15%, 50% and 60% Ibp) dissolving in 5 mM PBS; (ii) PLGA concentration (mg/mL) vs. time for the same four microdroplets, indicating the final concentrations (“hydrated densities”, see main text) by dashed lines.
Processes 04 00049 g008
Figure 9. Evidence for Phase of Ibp separation at very high Ibp concentrations. Images of Ibp/PLGA (50:50) microsphere at DL = 80 wt%. (i) 25 s after formation of the droplet the microparticle formed in which all the DCM had been dissolved into aqueous phase; (ii) at t = 88 s, a large part of the microparticle had dissolved; (iii) at 245 s other parts of the microparticle were lost and the microparticle became deformed This loss of material appeared to be dissolution of large domains of Ibp that were not seen for DL = 60 wt% and below, signifying massive phase separation into Ibp rich domains.
Processes 04 00049 g009
Figure 10. Ibp microparticle formation from DCM/Ibp solution and pure Ibp dissolution in 5 mM PBS (pH 7.4) solution at room temperature. (a) Newly formed microdroplet of 25 mg/mL Ibp in DCM showing dissolution of the DCM into PBS, in videomicrographs at t = 0, 5, and 10 s. Original video is available at Supplementary Materials (Video S3); (b) Pure Ibp particle dissolution into PBS, in videomicrographs at 15–50 s; (c) (i) Plot of radius and (ii) the R 0 2 R 2 vs. time plot of three microdroplets of DCM/Ibp and then pure Ibp as it dissolves in PBS, showing data for the same droplet as in the video micrographs from (a) to (b) (green symbols). Each fitting (i) curves and (ii) lines follow the EP model with the parameters.
Processes 04 00049 g010
Figure 11. Ibp dissolution time tD vs. microparticle diameter. Blue filled squares are calculated values using Equation (8) and the red star is the measured value from Figure 10.
Processes 04 00049 g011
Figure 12. Dissolution profiles of representative microdroplets of 25 mg/mL Ibp in DCM solution injected into 5 mM PBS containing increasing sodium dodecyl sulphate (SDS) concentrations. (a) Change of microdroplet radius versus time, where two distinct regions were clearly observed: joint DCM/Ibp dissolution, and pure IBP dissolution; (b) Linearized representation where the two regions were fitted by the Epstein-Plesset model (Equation (3)).
Processes 04 00049 g012
Figure 13. Apparent solubility limit CS of Ibp as a function of SDS concentration in 5 mM PBS, measured from single microdroplets and determined by using the Epstein-Plesset model. A constant diffusion coefficient for Ibp was assumed, D = 5.5 × 10⁻⁶ cm2/s, obtained at 0 mM SDS, at which the solubility limit of Ibp was experimentally determined to be 4 mM = 0.82 mg/mL [77]. Mean and standard deviation for at least three different droplets are indicated.
Processes 04 00049 g013
Figure 14. DSC thermograph scanning of recrystallized Ibp. The scanning rate was 10 °C/min, and the temperature range was from 30 to 100 °C.
Processes 04 00049 g014
Figure 15. PLGA microspheres formed by microfluidic emulsification of DCM/PLGA solution droplets. SEM images show the effect of flow rates (Qc = flow rate of continuous phase and Qd = flow rate of continuous phase) on the process stability and quality of the microspheres.
Processes 04 00049 g015
Figure 16. High resolution SEM image of PLGA microspheres prepared by microfluidic emulsification. Monodispersed microspheres of 40 μm diameter.
Processes 04 00049 g016

