
An Integrated Membrane Process for Butenes Production


Abstract
:1. Introduction
2. Materials and Methods
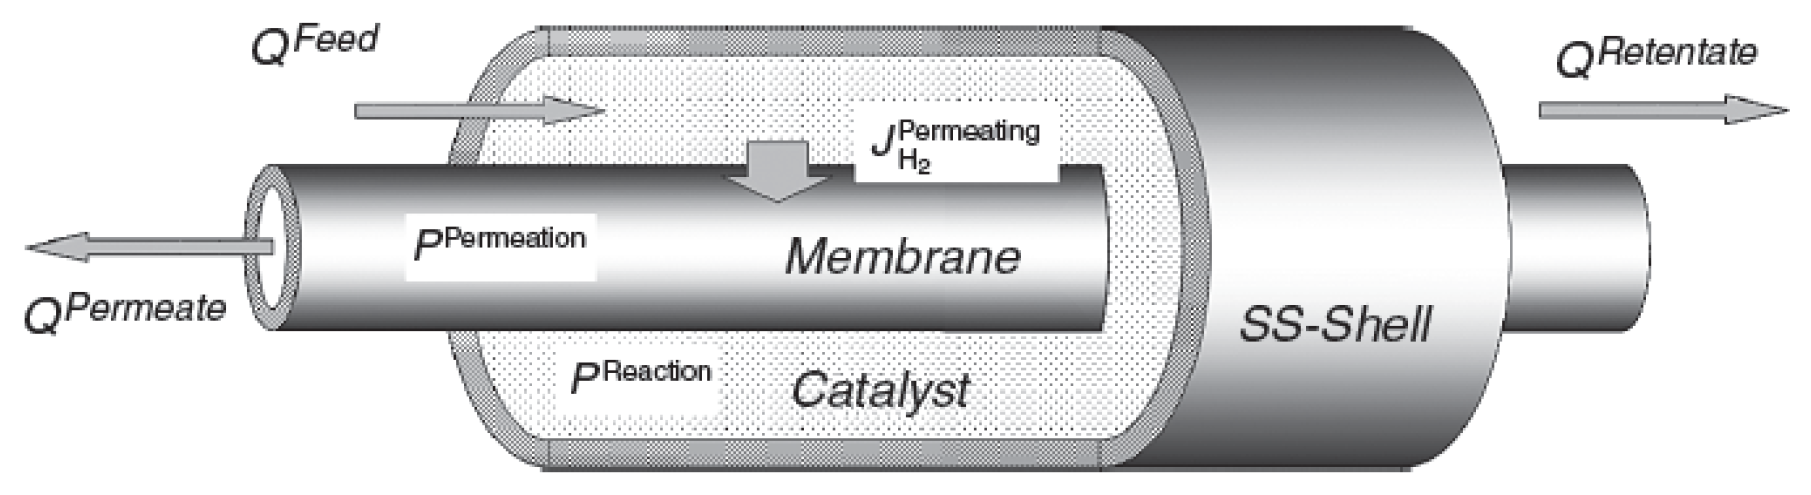
2.1 Membrane Reactor
- (1)
- An equimolecular mixture of n-butane and nitrogen, as in the Al Megren et al. [23] work.
- (2)
- A n-butane/hydrogen mixture, as in the thermodynamics analysis reported below.
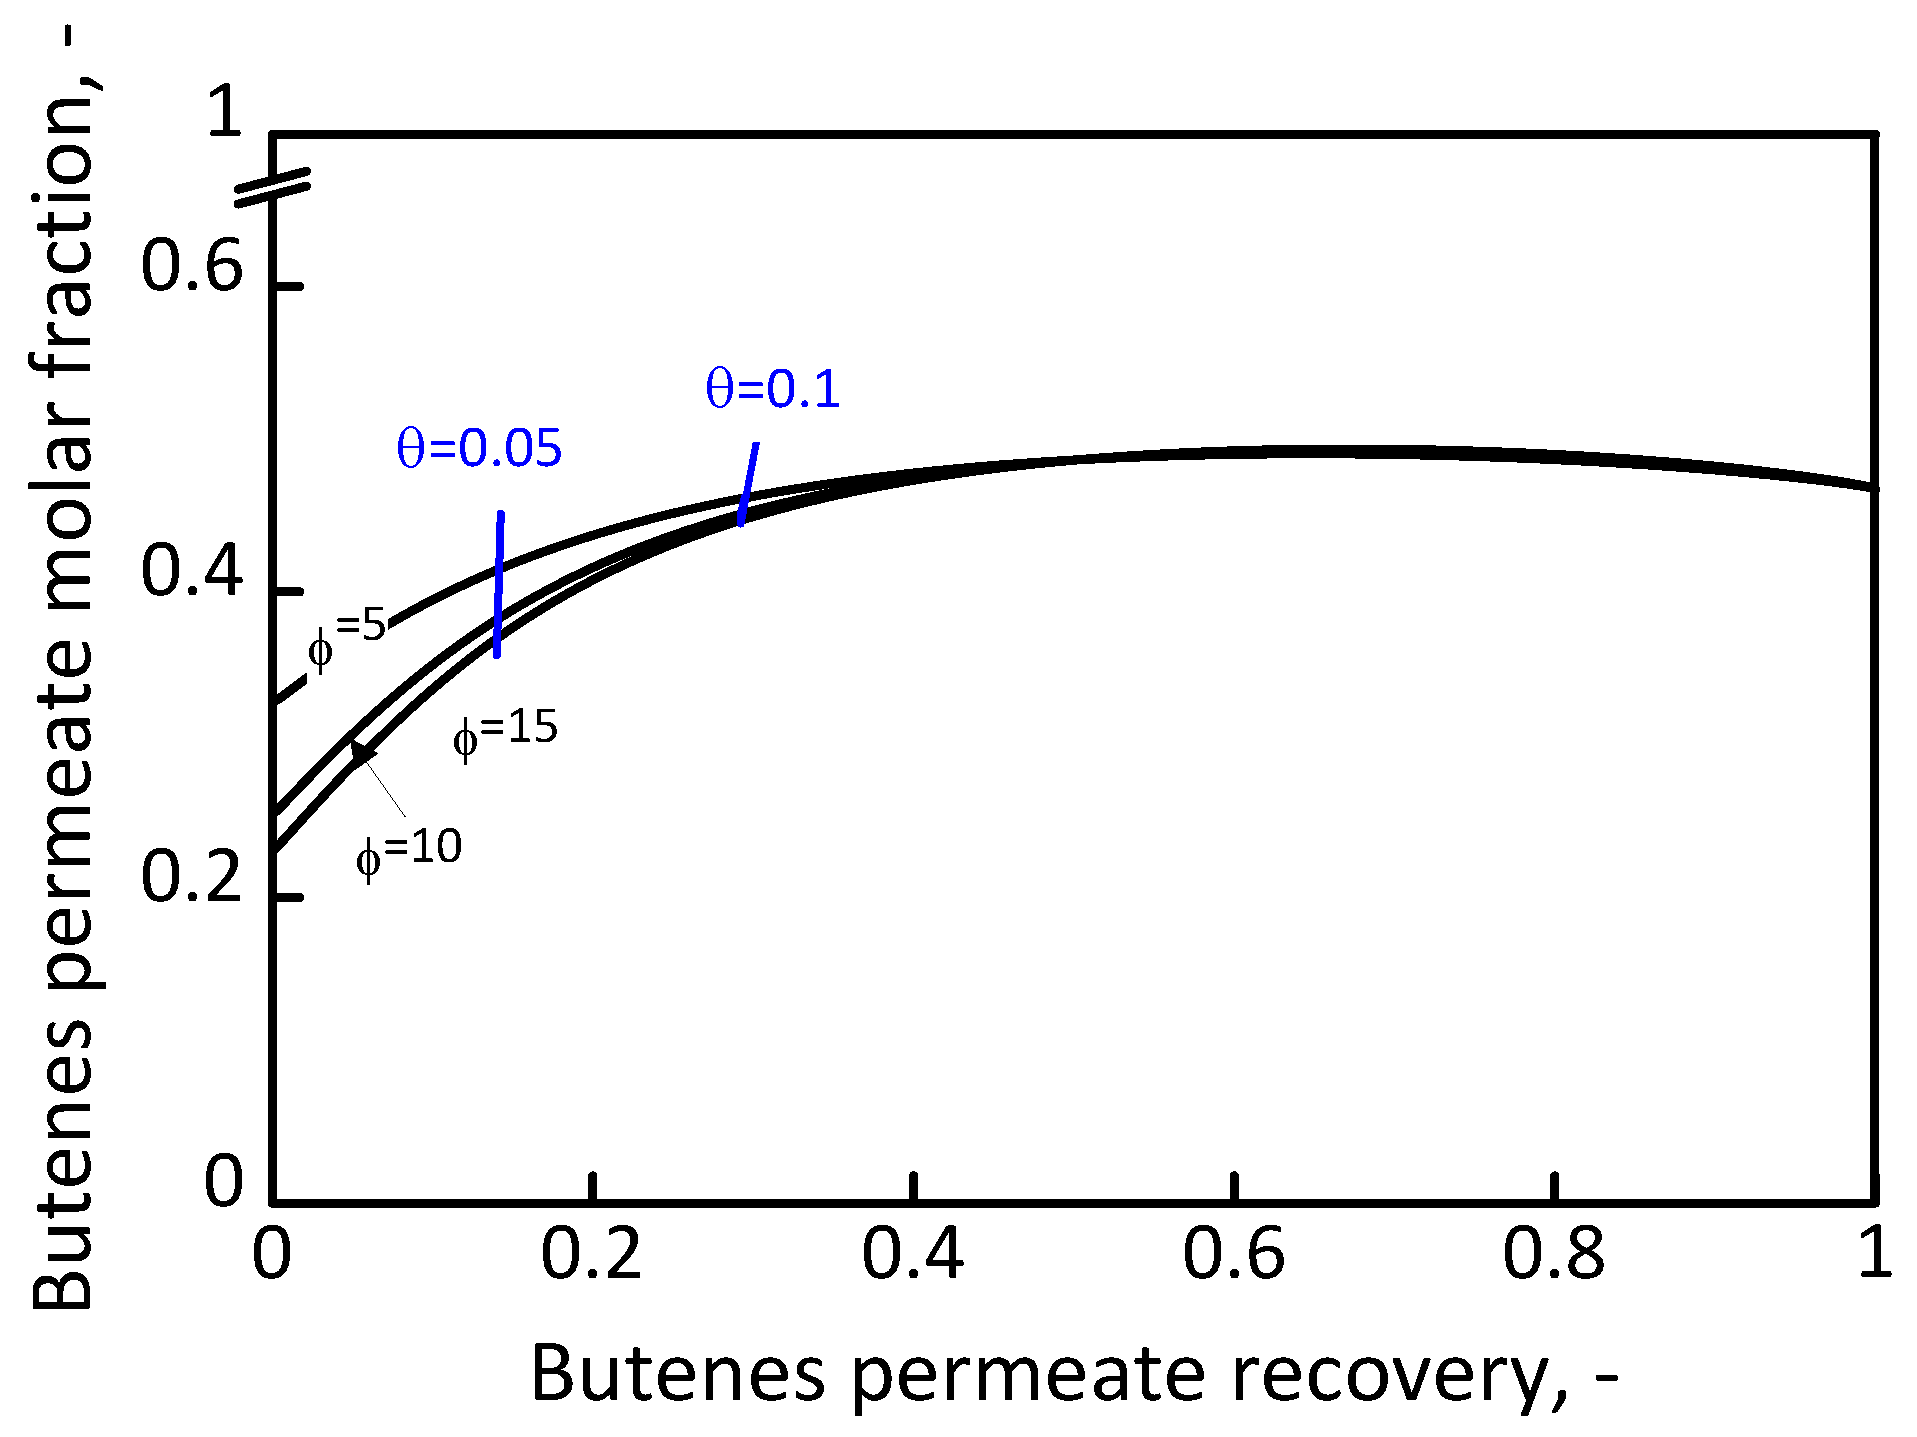
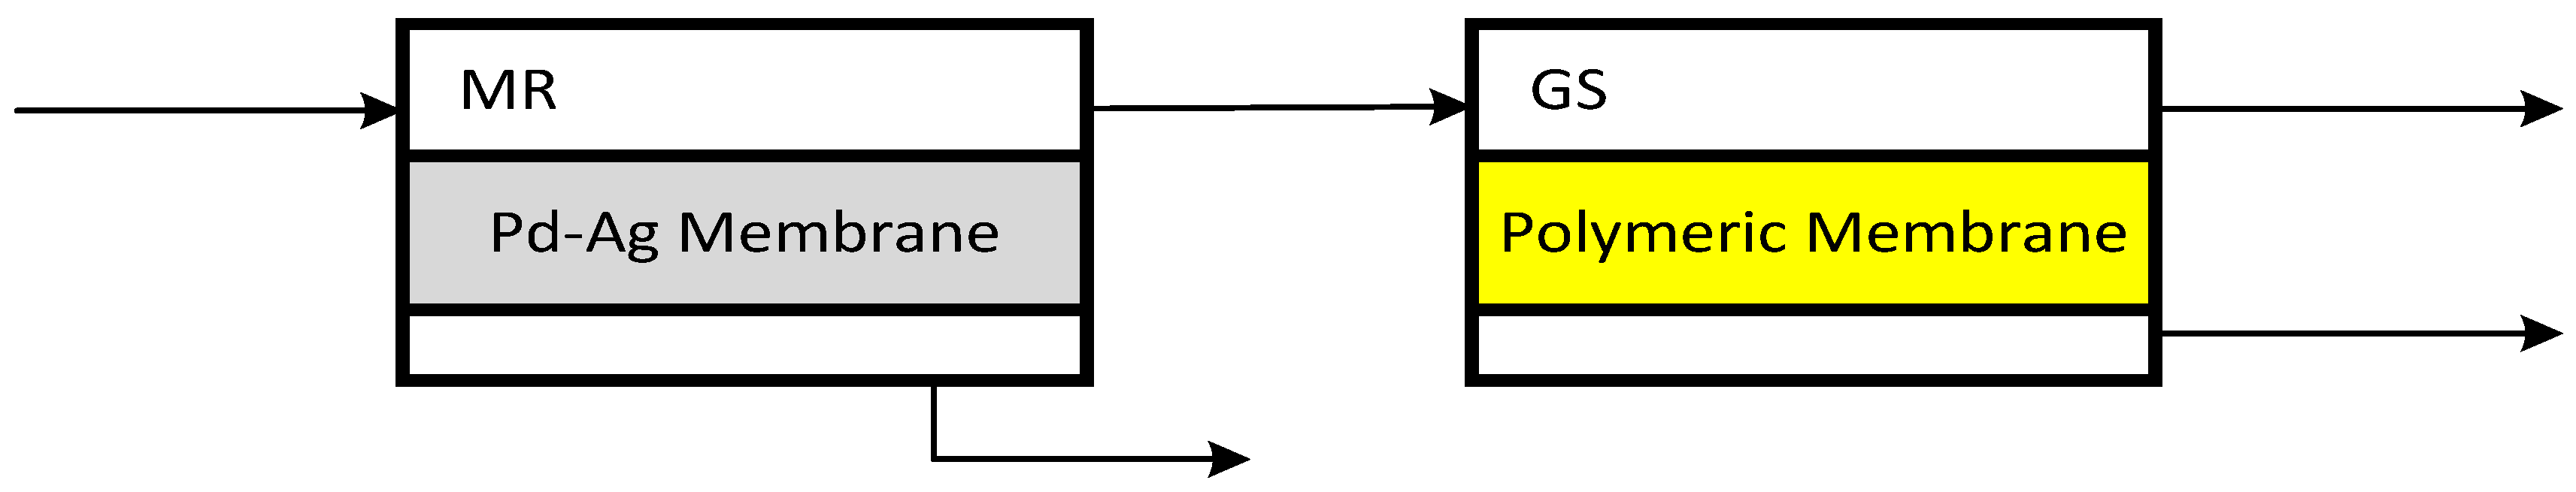
2.2 Separation System
3. Results
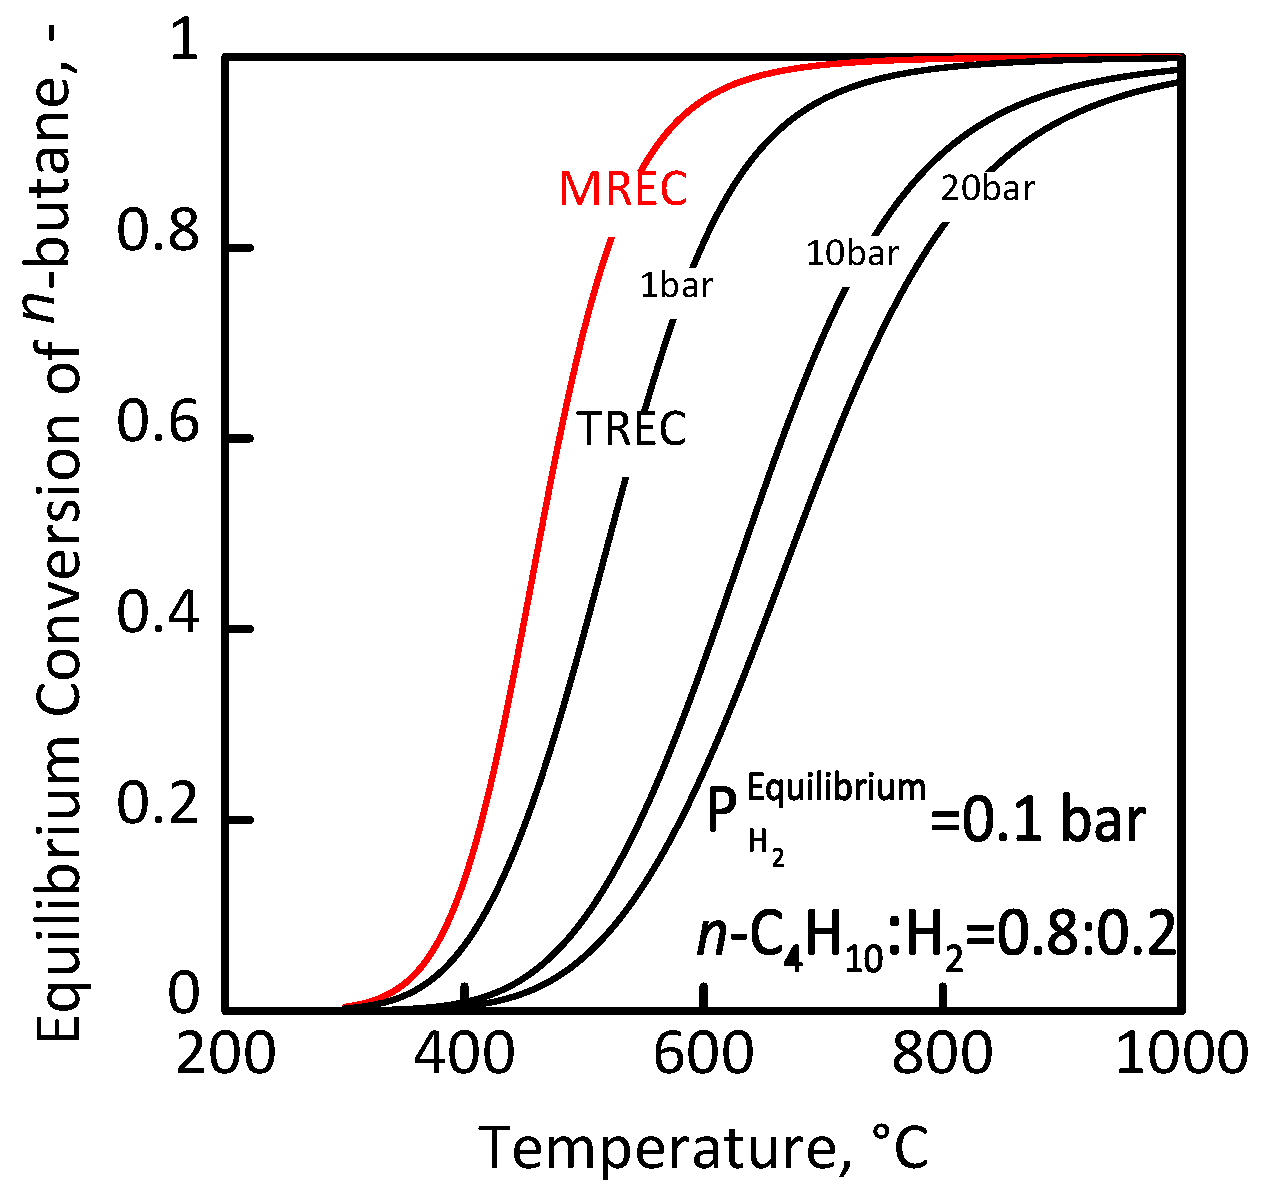
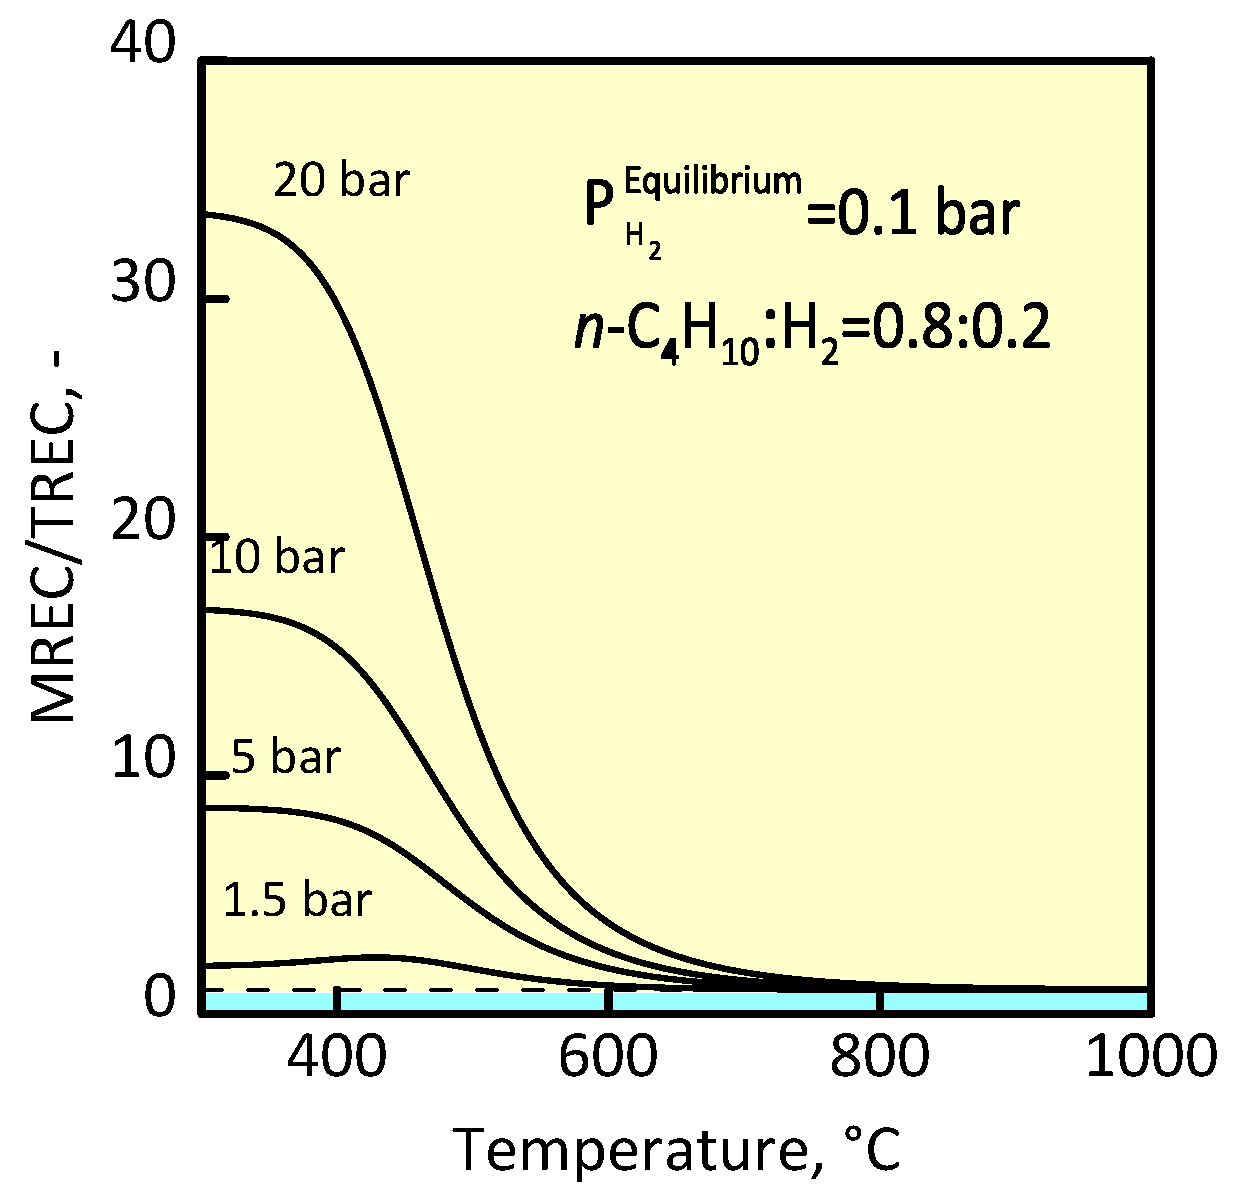
3.1 Membrane Reactor for n-Butane Conversion
3.2 Plant Schemes for Butenes Production and Capture
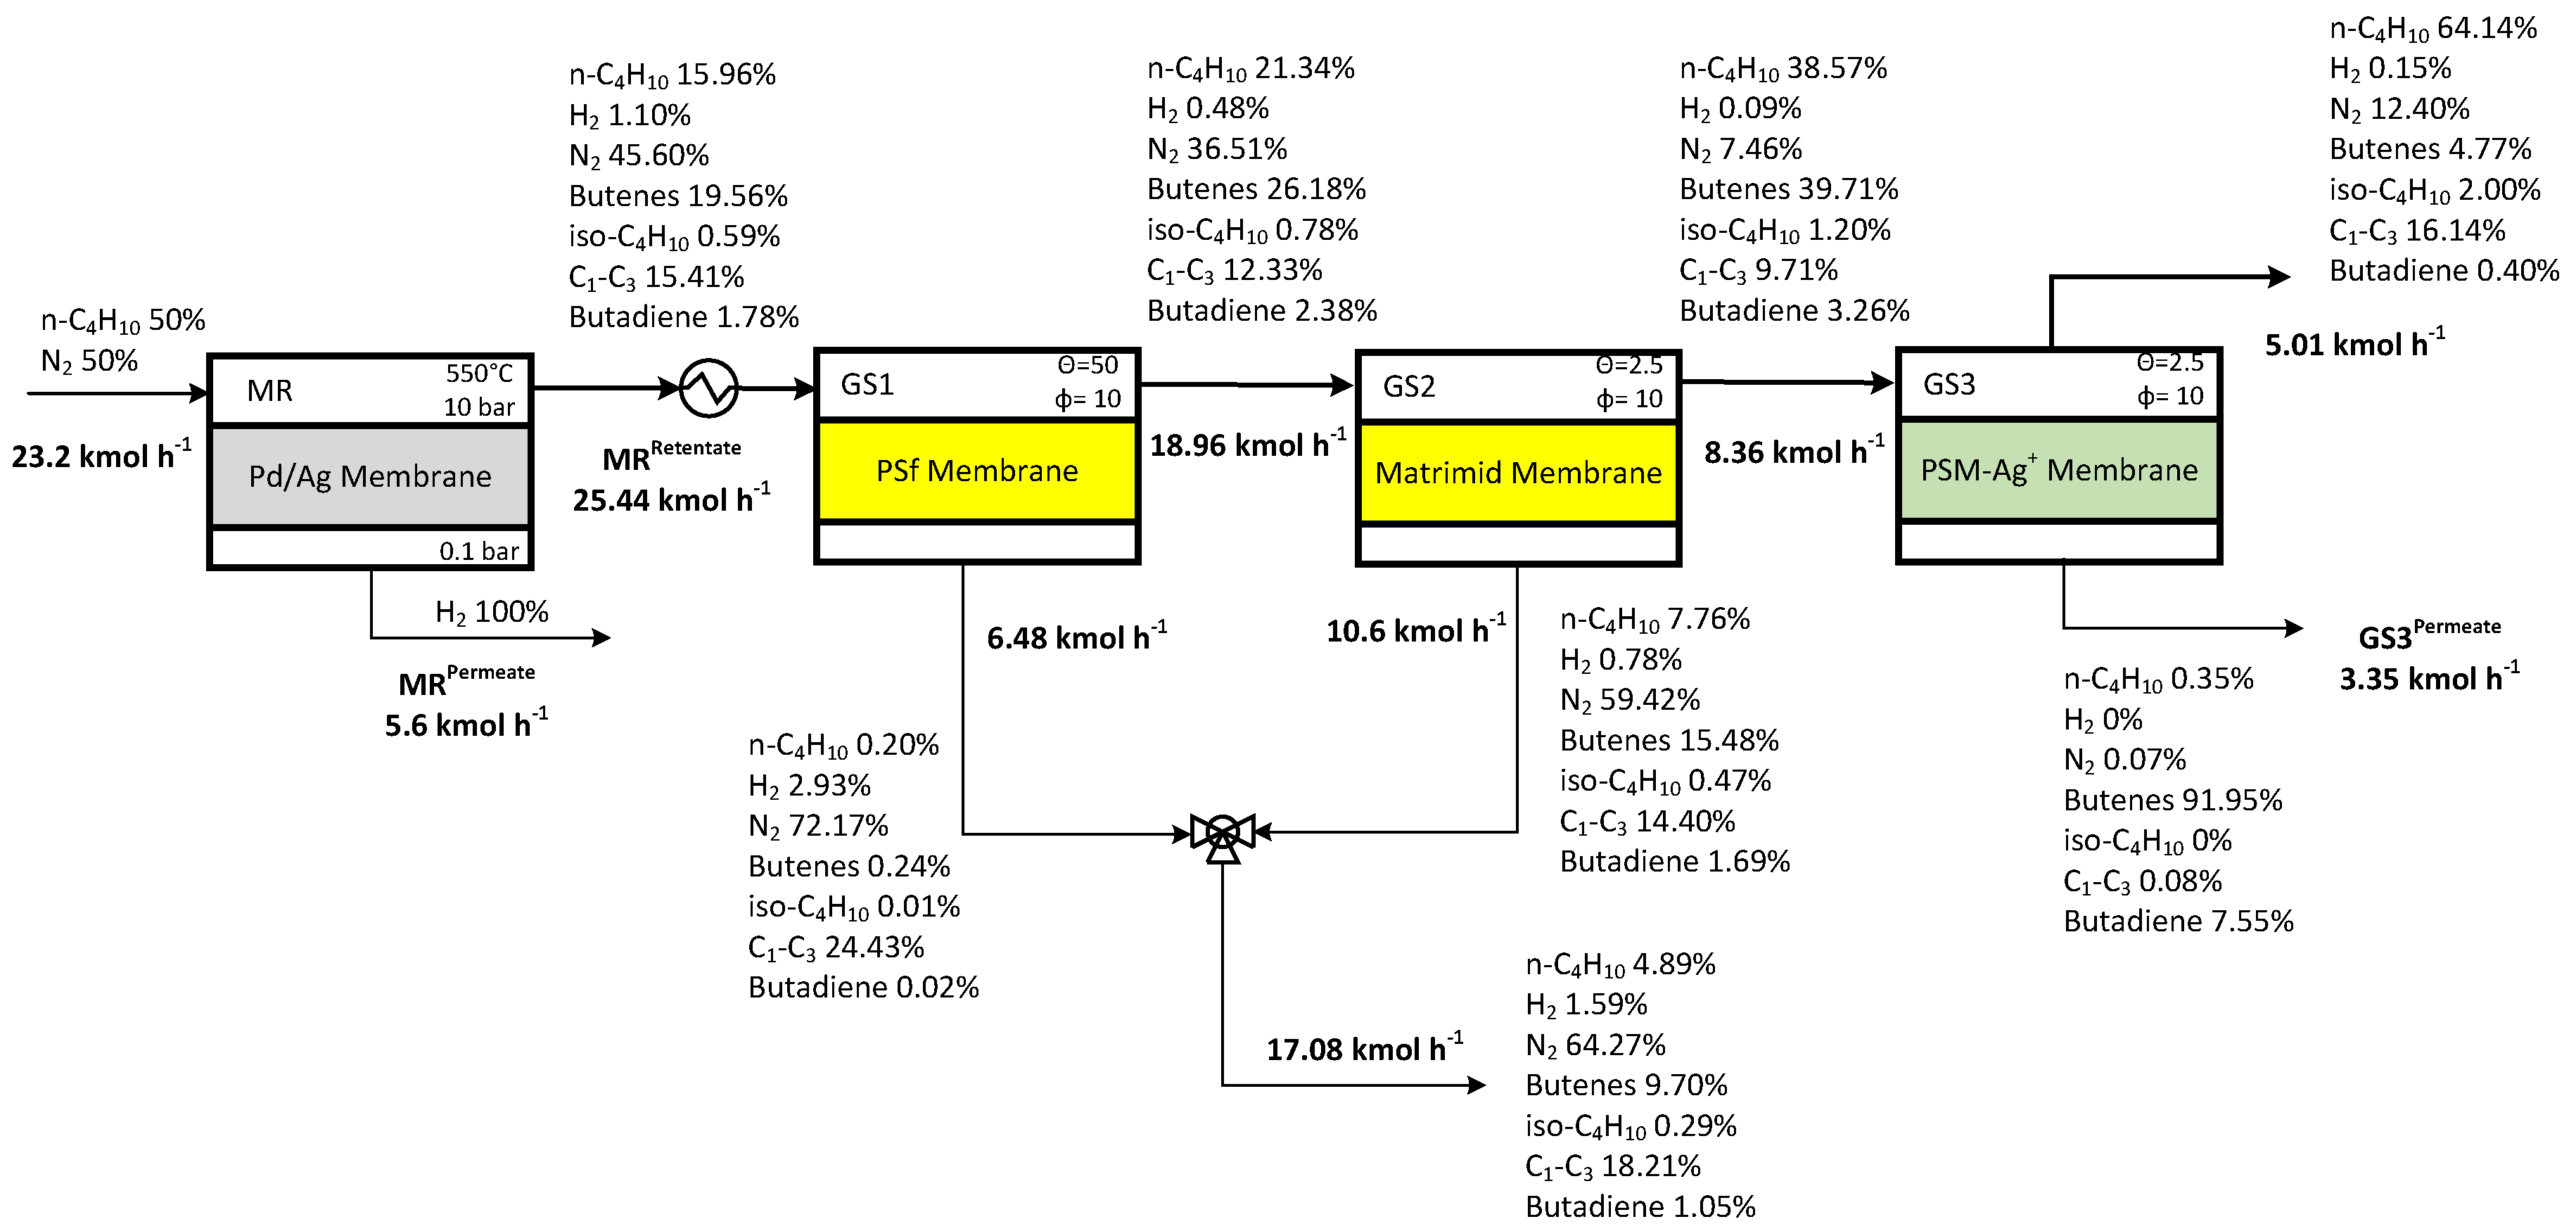
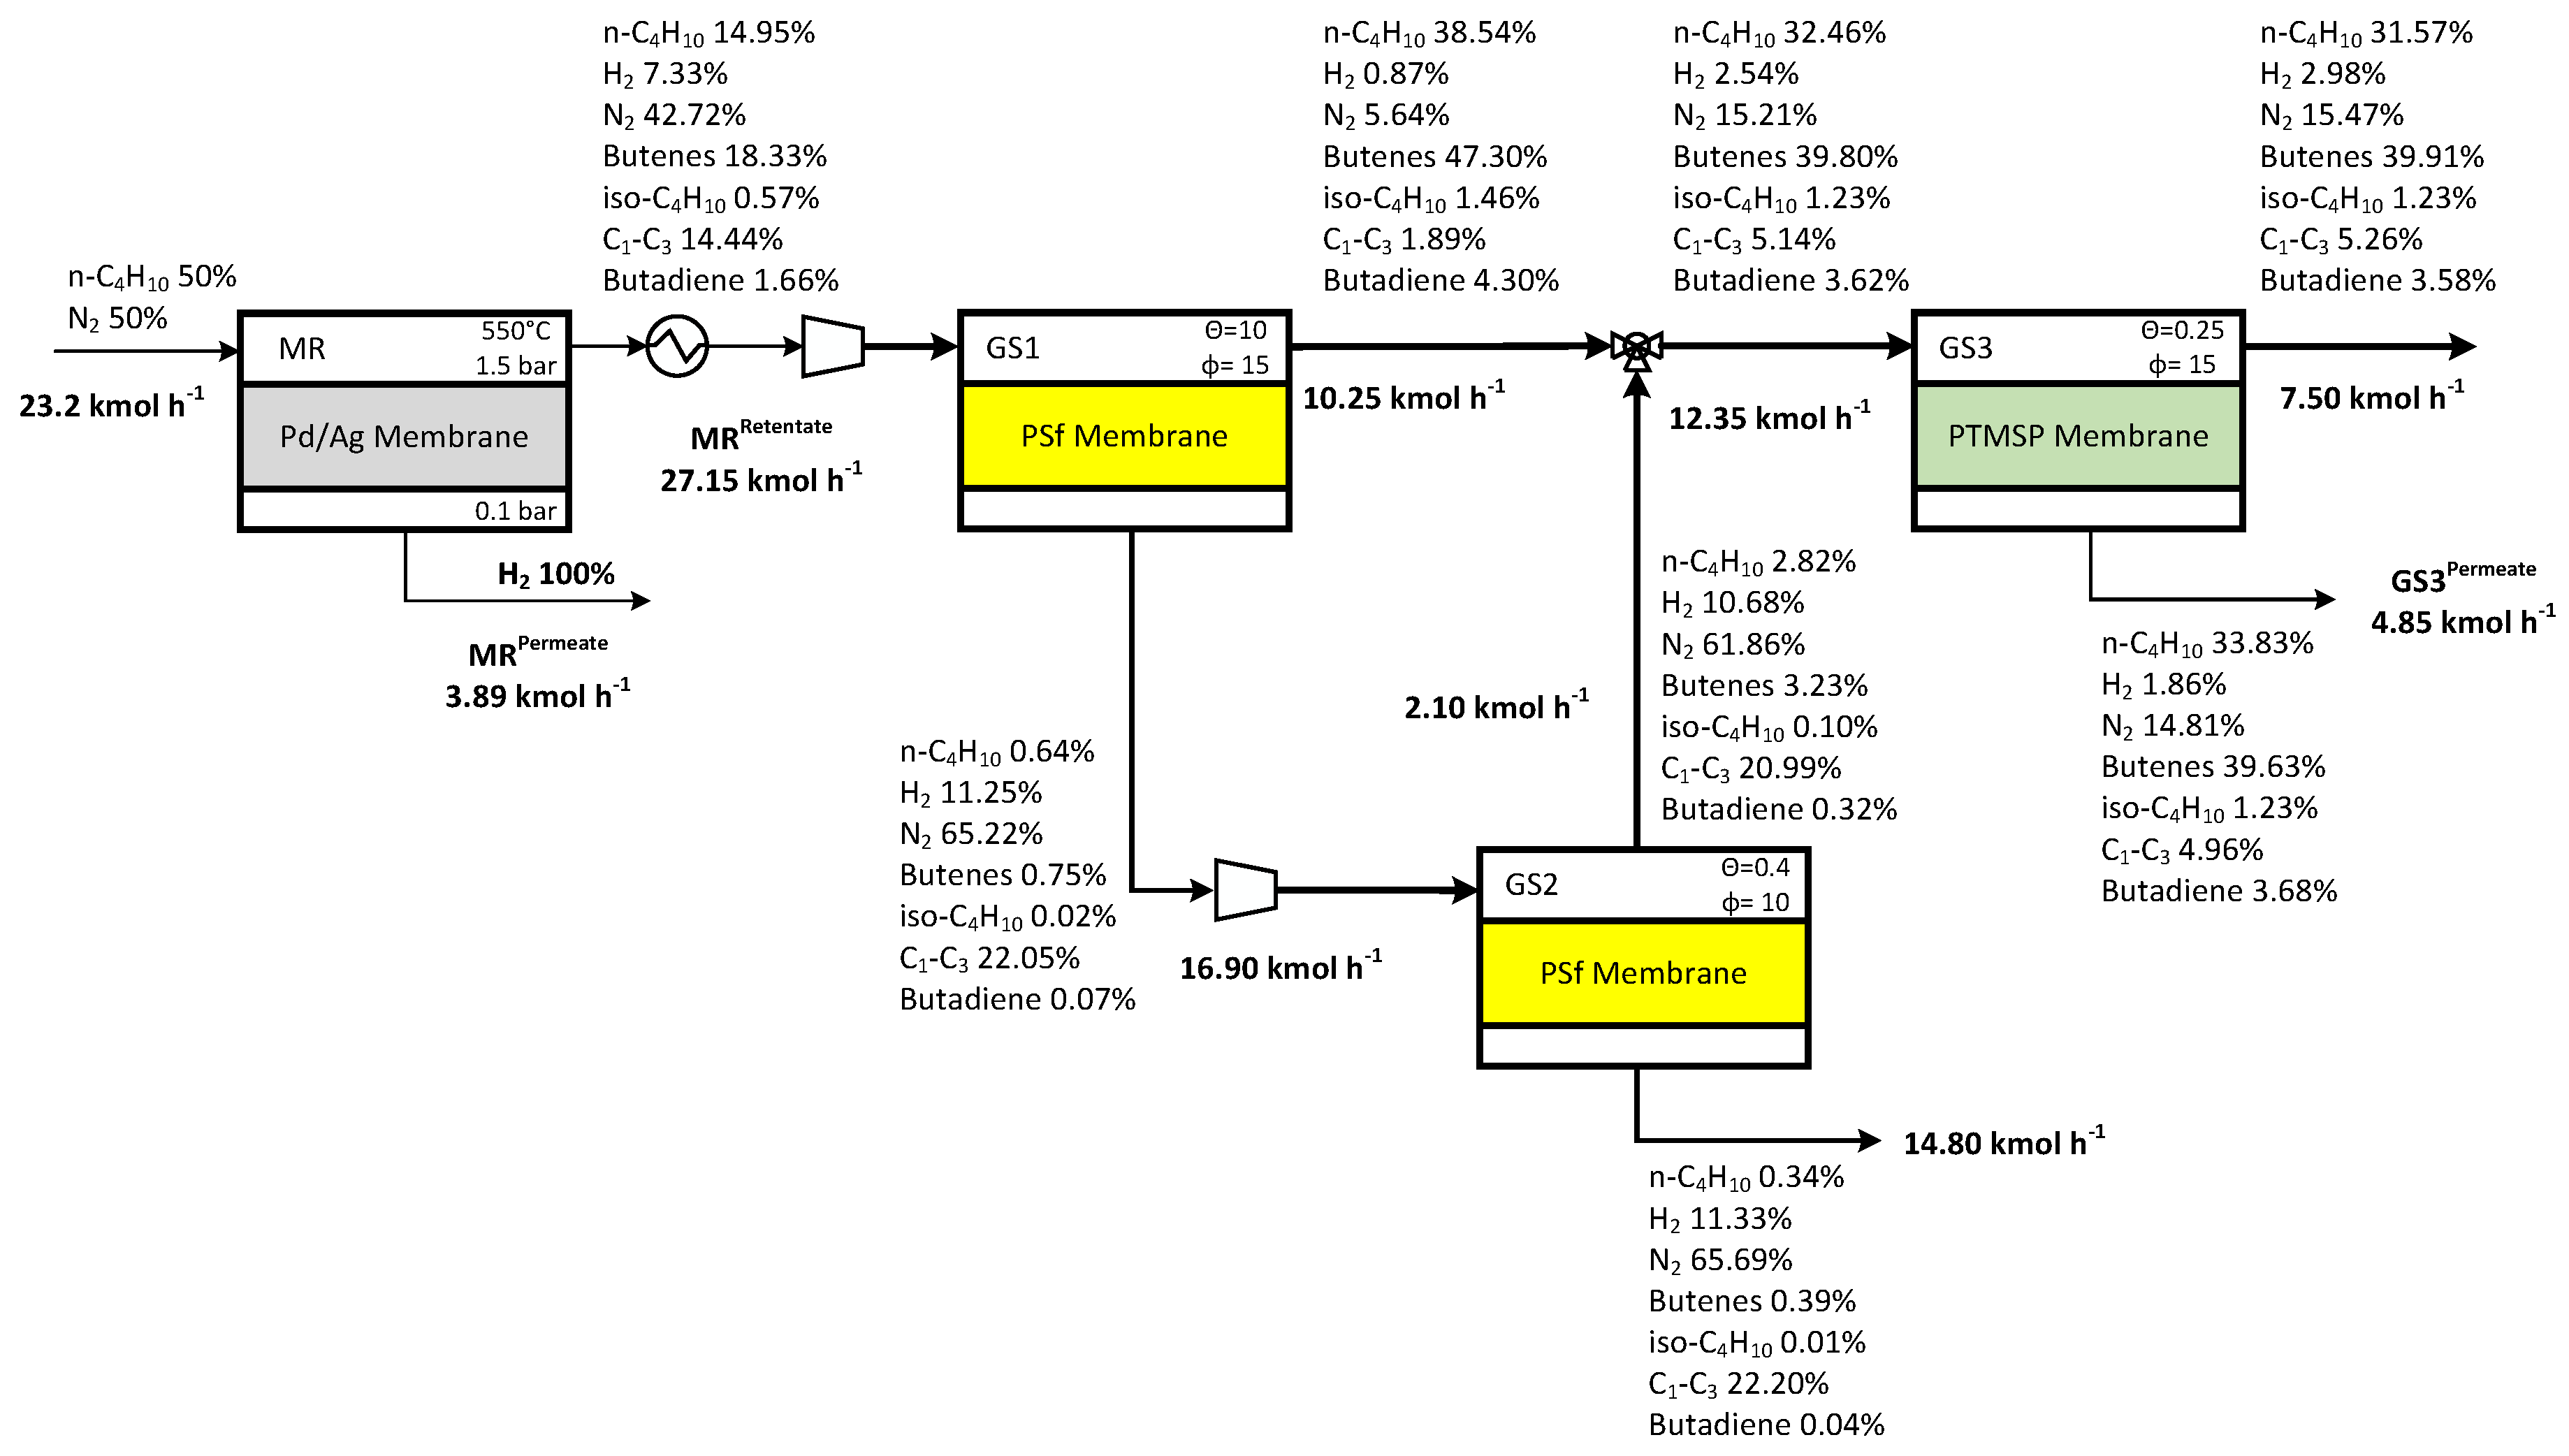
3.3 Case Study 1
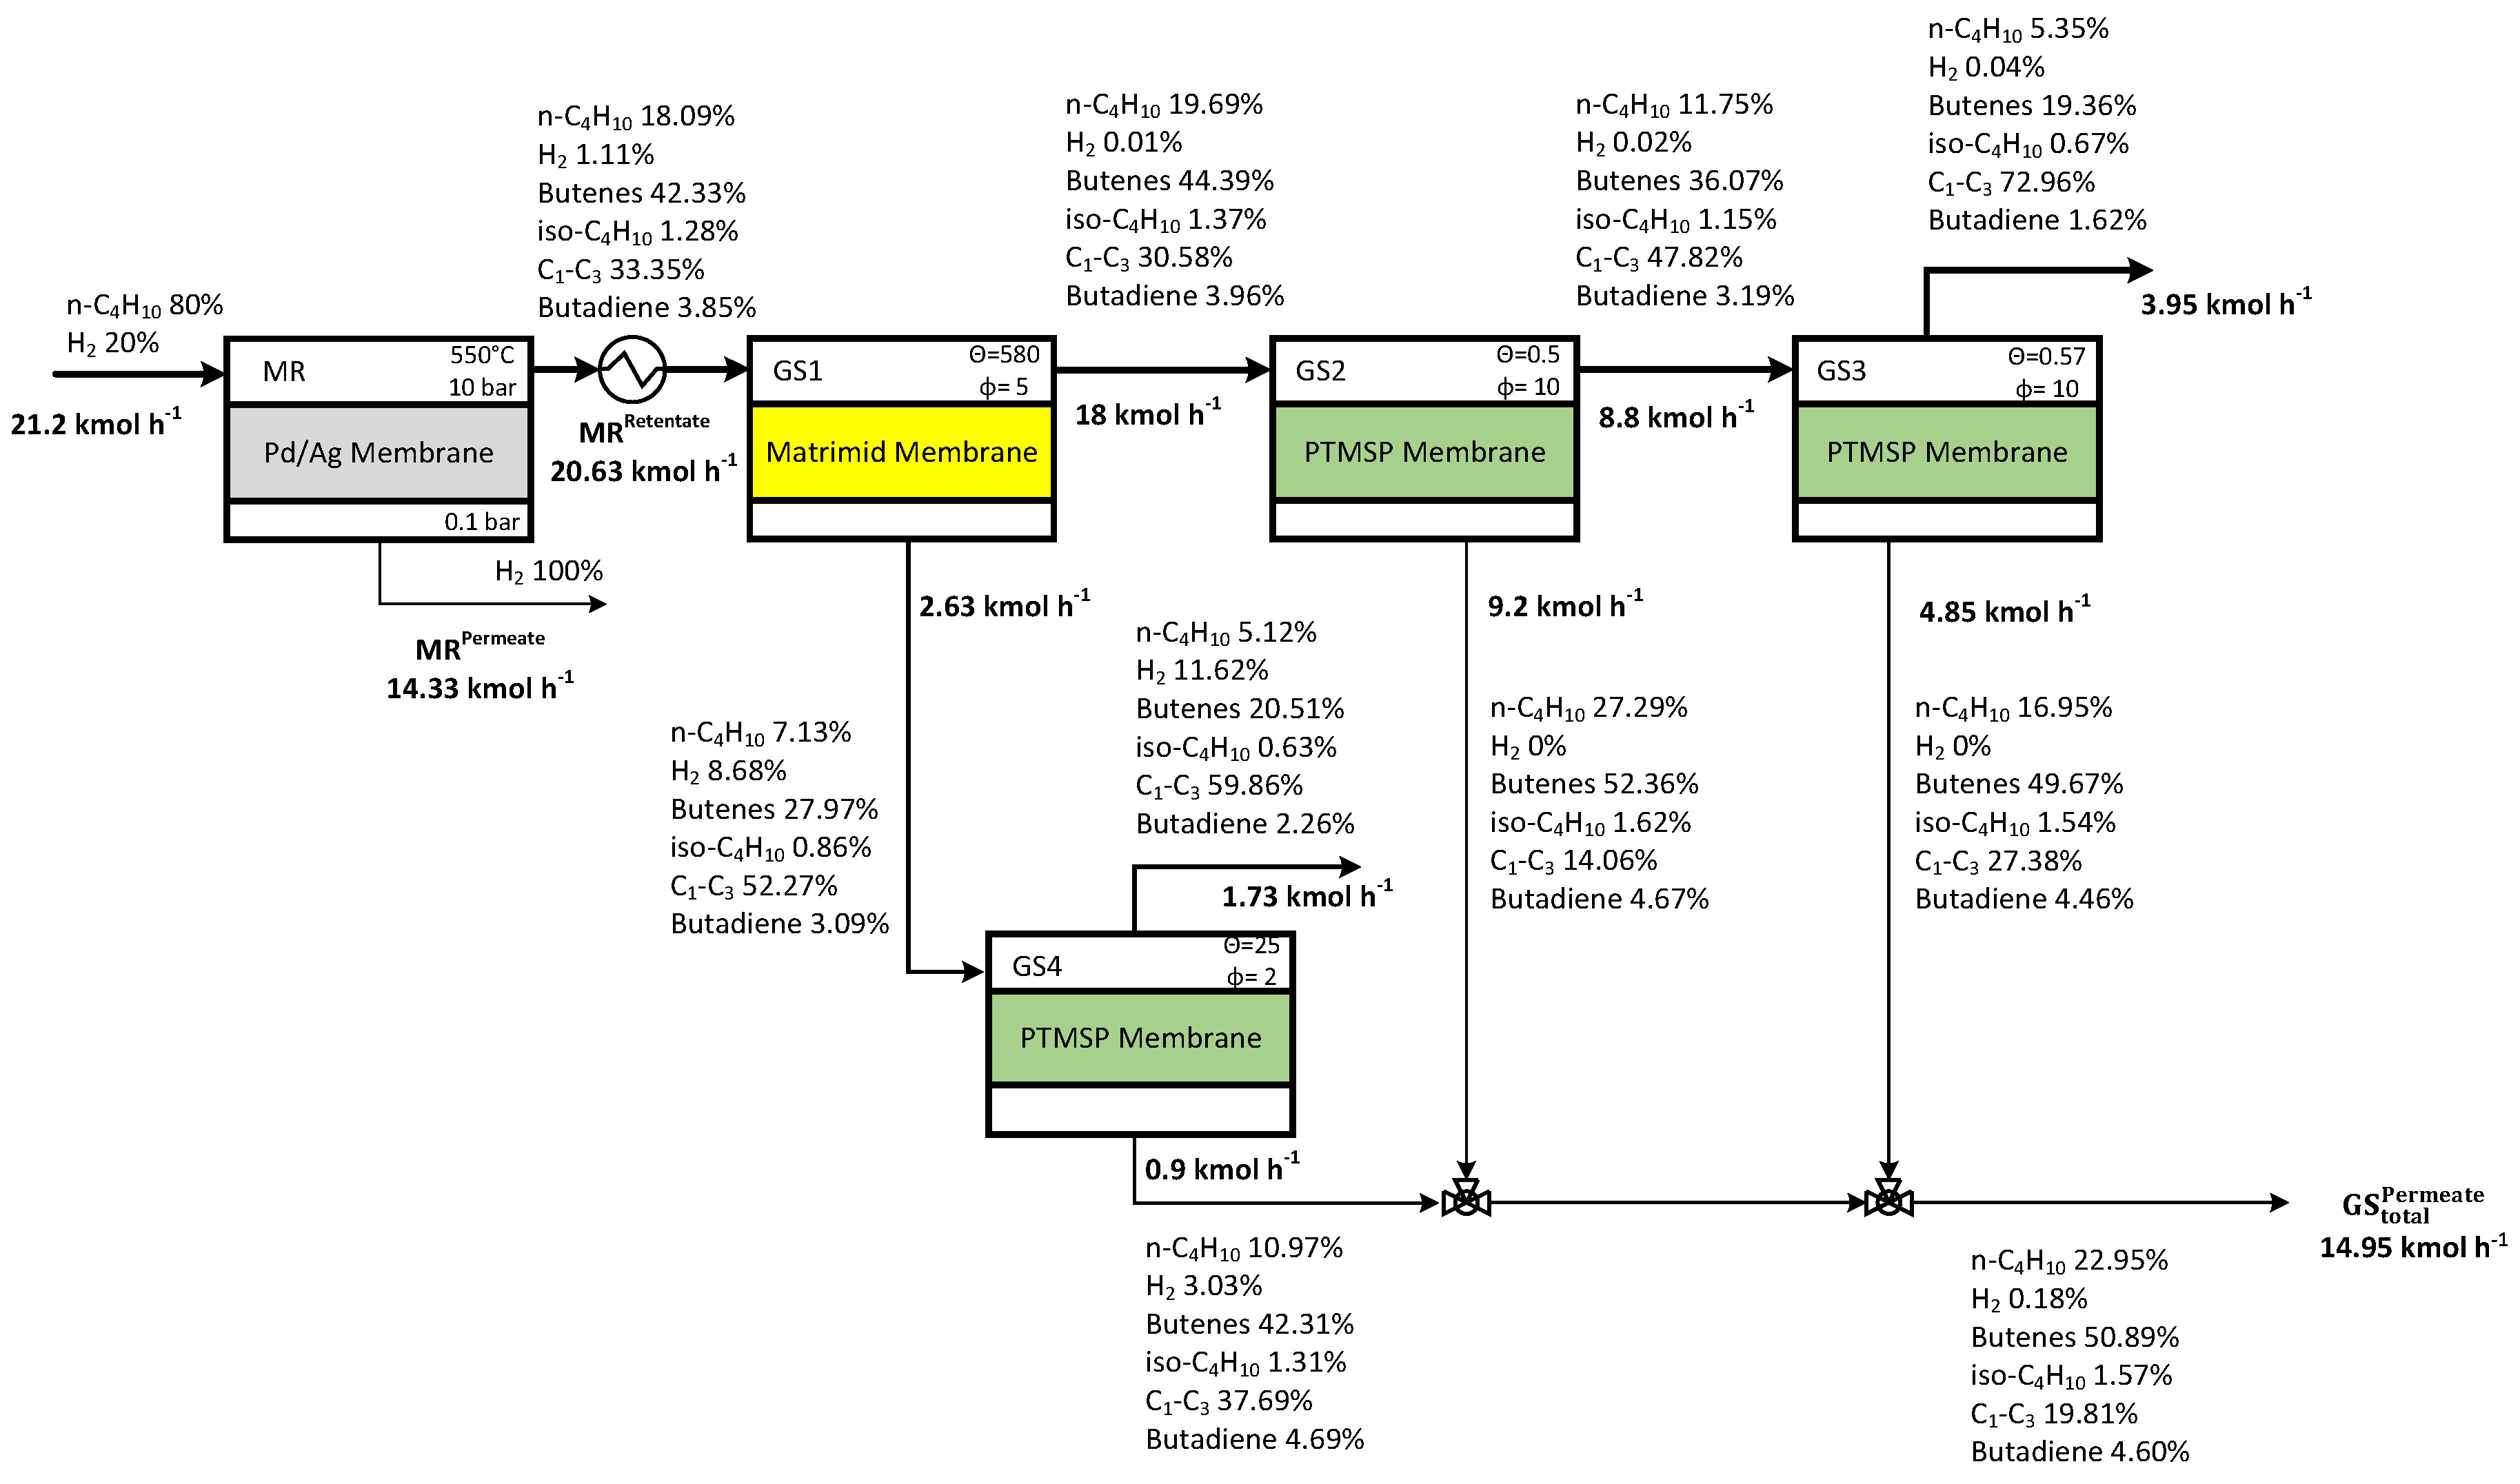
3.4 Case Study 2
3.5 Case Study 3
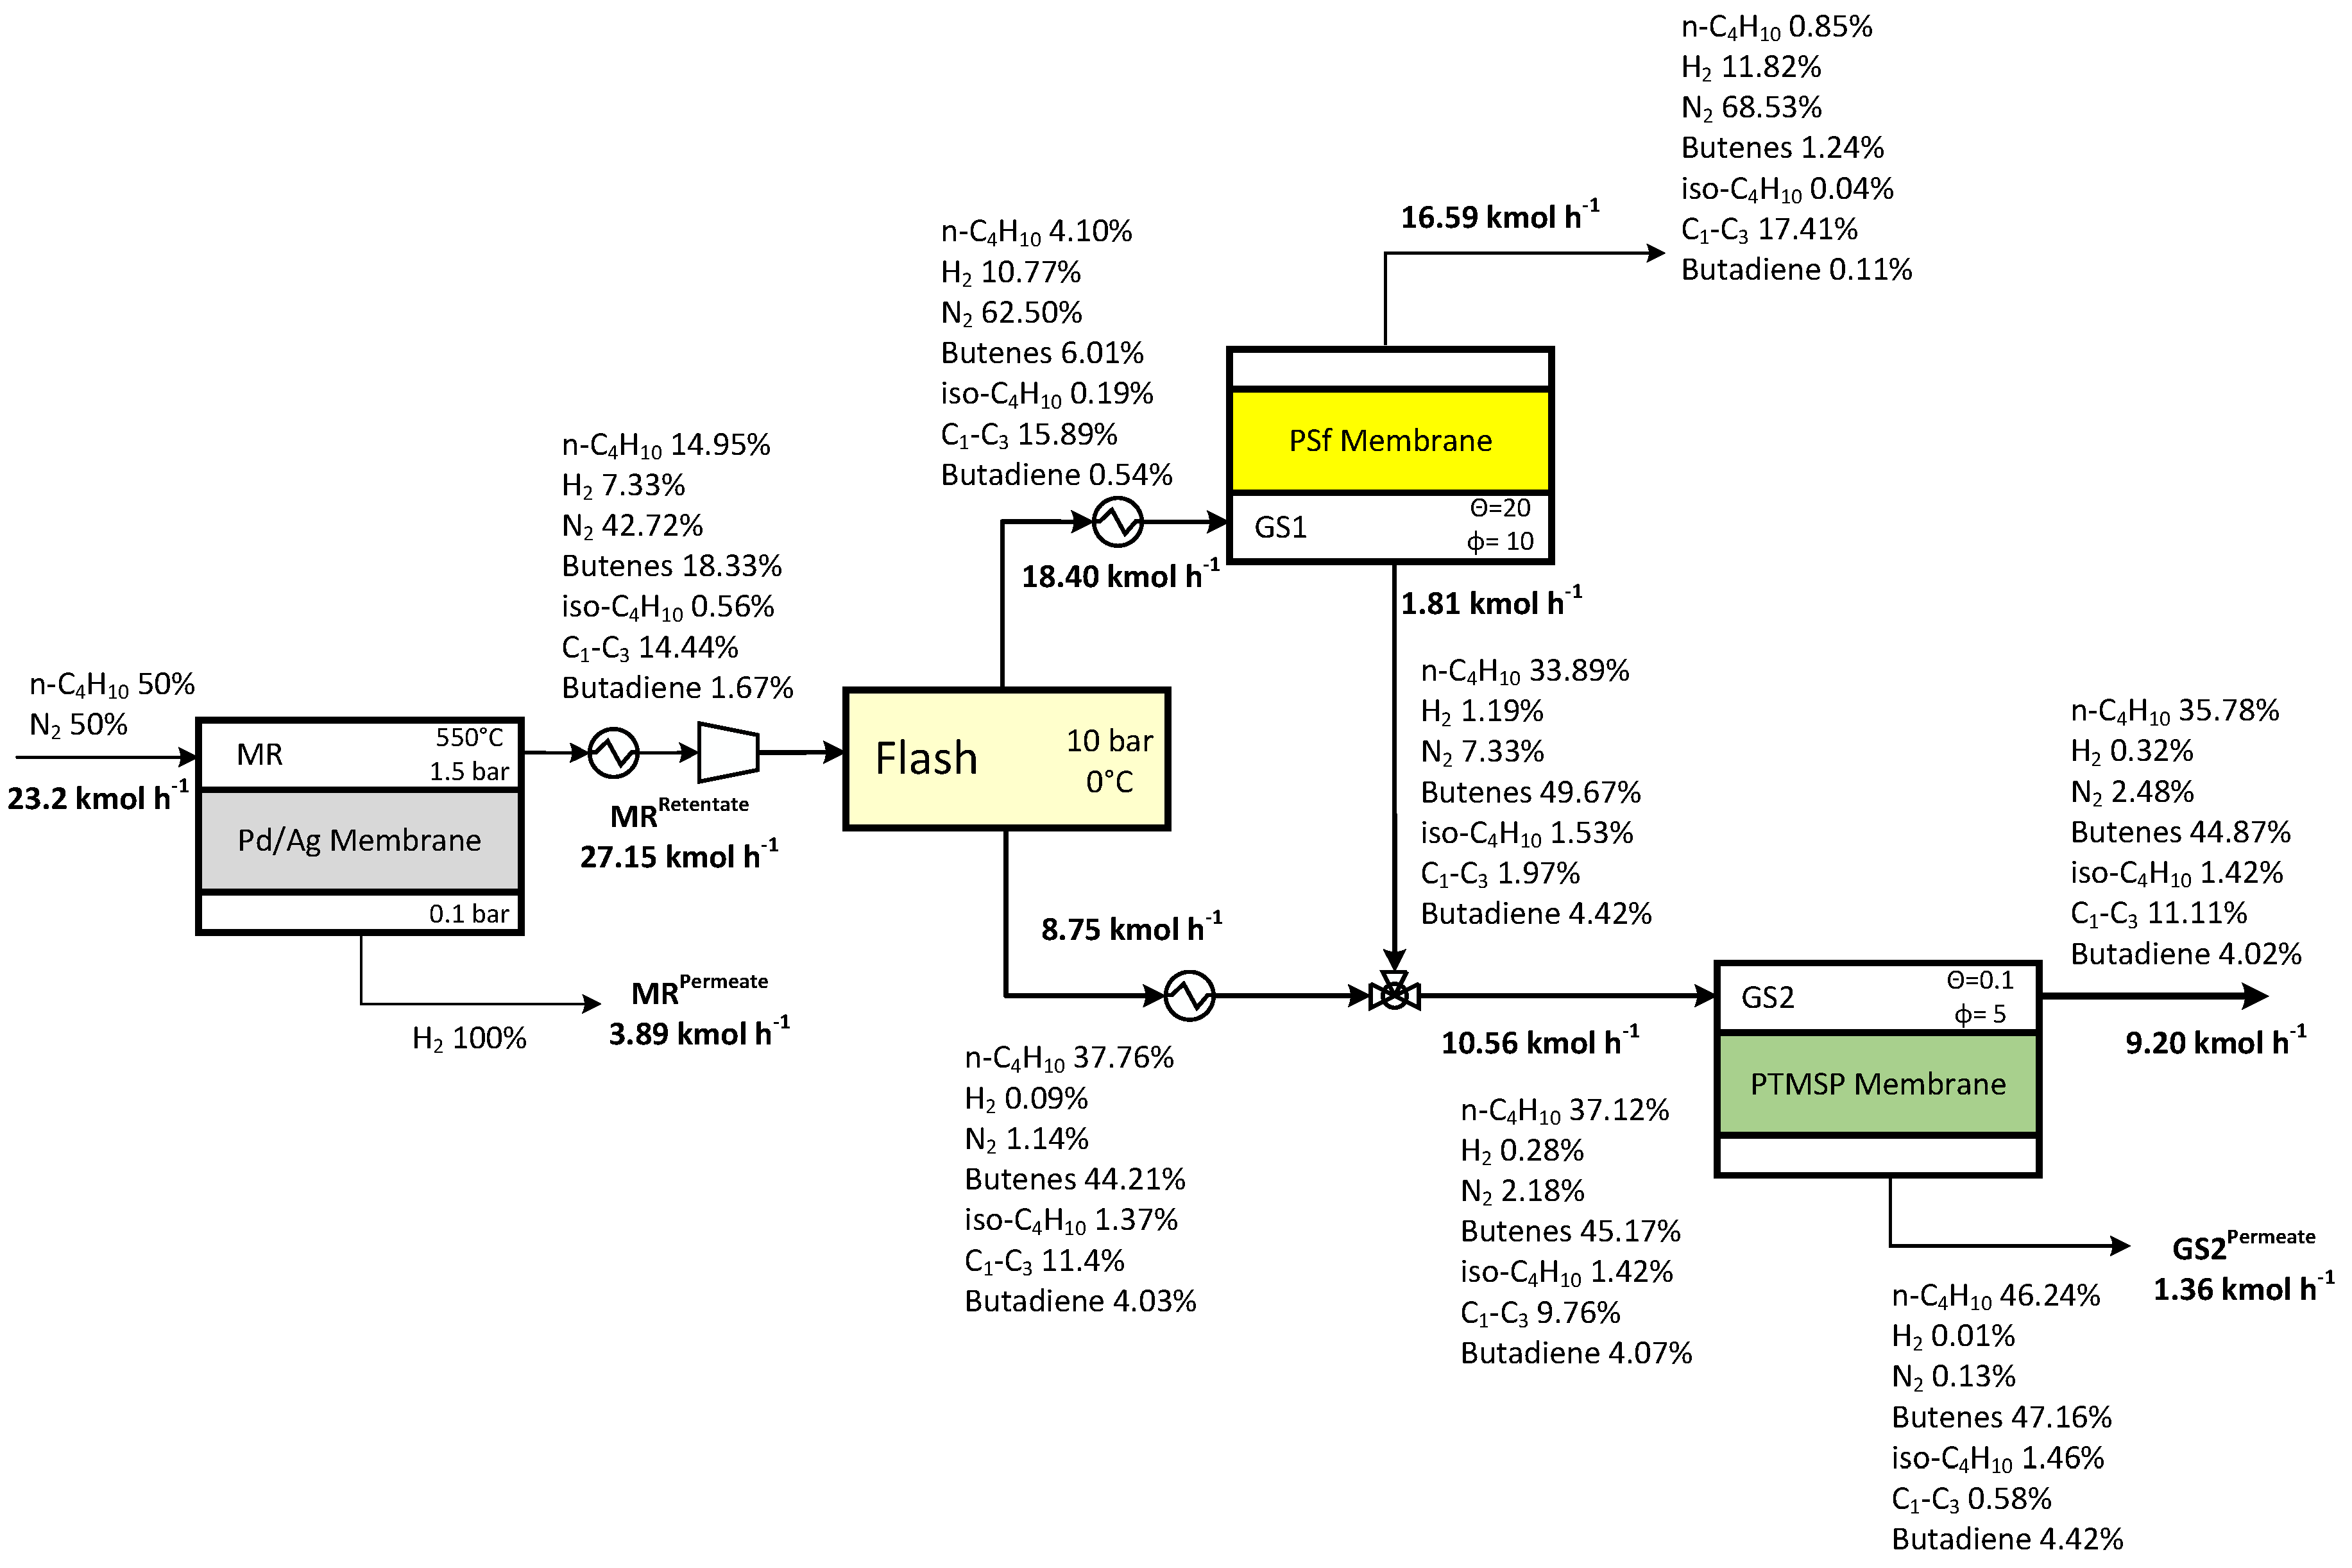
3.6 Case Study 4
3.7 Case Studies Summary
4. Conclusions
Author Contributions
Conflicts of Interest
Abbreviations
Acronyms
| FCC | Fluidized catalytic cracking |
| GS | Gas separator |
| MR | Membrane reactor |
| MREC | Membrane reactor equilibrium conversion |
| PI | Process intensification |
| TR | Traditional reactor |
| TREC | Traditional reactor equilibrium conversion |
Variables
| A | Surface area, m2 |
| H | Enthalpy, J mol−1 |
| K | Equilibrium constant, - |
| m | Mole ratio, - |
| n | Mole number, - |
| n0 | Initial total mole, - |
| P | Pressure, bar |
| Q | Volumetric flow rate, m3 h−1 |
| T | Temperature, °C |
| x | Molar fraction, - |
| x1 | Conversion dehydrogenation reaction, - |
| x2 | Conversion isomerization reaction, - |
| z | Fraction of hydrogen permeate, - |
Greek letters
| θ | Permeation number, - |
| φ | Feed/Permeate pressure ratio, - |
References
- Research Agenda for Process Intensification Towards a Sustainable World of 2050. Available online: http://www.3me.tudelft.nl/fileadmin/Faculteit/3mE/Actueel/Nieuws/2011/docs/DSD_Research_Agenda.pdf (accessed on 29 July 2016).
- Ramshaw, C. The intensive for process intensification. In Proceedings of the 1st International Conference for Process Intensification in the Chemical Industry, Antwerp, Belgium, 6–8 December 1995.
- Bender, M. An overview of industrial process for the production of olefins C4 hydrocarbons. ChemBioEng Rev. 2014, 1, 136–147. [Google Scholar]
- Pirngruber, G.D.; Seshan, K.; Lercher, J.A. Dehydroisomerization of n-butane over Pt-ZSM5: II. Kinetic and Thermodynamics Aspect. J. Catal. 2000, 190, 134–137. [Google Scholar] [CrossRef]
- Li, X.; Iglesia, E. Catalytic dehydroisomerization of n-alkanes to isoalkenes. J. Catal. 2008, 255, 134–137. [Google Scholar] [CrossRef]
- Scirè, S.; Burgio, G.; Crisafulli, C.; Minicò, S. Dehydroisomerization of n-butane over H-Y zeolite supported Pt and Pt, Sn catalyst. App. Catal. A 2004, 274, 151–157. [Google Scholar] [CrossRef]
- Pirngruber, G.D.; Seshan, K.; Lercher, J.A. Dehydroisomerization of n-butane over Pt-ZSM5 (I): Effect of the metal loading and acid site concentration. J. Catal. 1999, 186, 188–200. [Google Scholar] [CrossRef]
- Hamid, S.B.D.A.; Lambert, D.; Derouane Eric, G. Dehydroisomerisation of n-butane over (Pt, Cu)/H-TON catalysts. Catal. Today 2000, 63, 237–247. [Google Scholar] [CrossRef]
- Stankiewicz, A.; Moulijn, J. A Process intensification: Transforming chemical engineering. Chem. Eng. Prog. 2000, 96, 22–23. [Google Scholar] [CrossRef]
- Stankiewicz, A.; Moulijn, J.A. Process Intensification. Ind. Eng. Chem. Res. 2002, 41, 1920–1924. [Google Scholar] [CrossRef]
- Weyten, H.; Luyten, J.; Keizer, K.; Willems, L.; Leysen, R. Membrane performance: The key issues for dehydrogenation reactions in a catalytic membrane reactor. Catal. Today 2000, 56, 3–11. [Google Scholar] [CrossRef]
- Van der Bergh, J.; Gucuyener, C.; Gascon, J.; Kapteijn, F. Isobutane dehydroisomerization in a DDR3 zeolite membrane reactor. Chem. Eng. J. 2011, 166, 368–377. [Google Scholar] [CrossRef]
- Yanglong, G.; Guanzhong, L.; Yunsong, W.; Ren, W. Preparation and characterization of Pd-Ag/ceramic composite membrane and application to enhancement of catalytic dehydrogenation of isobutane. Sep. Purif. Technol. 2003, 32, 271–279. [Google Scholar]
- Babak, V.N.; Babak, T.B.; Zakiev, S.E.; Kholpanov, L.P. Theoretical study of hydrocarbon dehydrogenation at high temperatures. Theor. Found. Chem. Eng. 2009, 43, 74–87. [Google Scholar] [CrossRef]
- Sanchez, J.; Tsotsis, T.T. Catalytic Membranes and Membrane Reactors; Wiley-VCH: Weinheim, Germany, 2002. [Google Scholar]
- Casanave, D.; Giroir-Fendler, A.; Sanchez, J.; Loutaty, R.; Dalmon, J.A. Control of transport properties with a microporous membrane reactor to enhance yields in dehydrogenation reactions. Catal. Today 1995, 25, 309–314. [Google Scholar] [CrossRef]
- van Dyk, L.; Miachon, S.; Lorenzen, L.; Torres, M.; Fiaty, K.; Dalmon, J.-A. Comparison of microporous MFI and dense Pd membrane performances in an extractor-type CMR. Catal. Today 2003, 82, 167–177. [Google Scholar] [CrossRef]
- Liang, W.; Huges, R. The catalytic dehydroisomerization of isobutane to iso-butene in a palladium/silver composite membrane reactor. Catal. Today 2005, 104, 74–87. [Google Scholar] [CrossRef]
- Sznejer, G.; Sheintuch, M. Application of a carbon membrane reactor for dehydrogenation reactions. Chem. Eng. Sci. 2004, 59, 2013–2021. [Google Scholar] [CrossRef]
- Marigliano, G.; Barbieri, G.; Drioli, E. Equilibrium conversion for a Pd-based membrane reactor. Dependence on the temperature and pressure. Chem. Eng. Process. 2003, 42, 231–236. [Google Scholar] [CrossRef]
- Brunetti, A.; Caravella, A.; Drioli, E.; Barbieri, G. Process intensification by membrane reactors: High temperature water gas shift reaction as single stage for syngas upgrading. Chem. Eng. Technol. 2012, 35, 1–12. [Google Scholar] [CrossRef]
- Barbieri, G.; Marigliano, G.; Perri, G.; Drioli, E. Conversion-temperature diagram for a palladium membrane reactor. Analysis of an endothermic reaction: methane steam reforming. Ind. Eng. Chem. Res. 2001, 40, 2017–2026. [Google Scholar] [CrossRef]
- Al-Megren, H.A.; Barbieri, G.; Mirabelli, I.; Brunetti, A.; Drioli, E.; Al-Kinany, M.C. Direct conversion of n-butane to iso-butene in a membrane reactor: Thermodynamics Analysis. Ind. Eng. Chem. Res. 2013, 52, 10380–10386. [Google Scholar] [CrossRef]
- Barbieri, G.; Brunetti, A.; Caravella, A.; Drioli, E. Medium/high temperature water gas shift reaction in a Pd-Ag membrane reactor: An experimental investigation. RSC Adv. 2011, 1, 651–661. [Google Scholar] [CrossRef]
- Pinnau, I.; Toy, L.G. Transport of organic vapours through poly(1-trimethylsilyl-1-propyne). J. Membr. Sci. 1996, 116, 199–209. [Google Scholar] [CrossRef]
- Sakellaropoulos, G.P.; Plaggesis, H.; Koops, G.H.; Makhlouf, M. Membrane Separation of Olefins from FCC Naphtha and Gases for Production of Reformulated Gasoline. Contract JOE3-CT97-0052. Available online: http://cordis.europa.eu/documents/documentlibrary/50781711EN6.pdf (accessed on 29 July 2016).
- Yang, J.-S.; Hsiue, G.-H. C4 olefin/paraffin separation by poly[(1-trimethylsilyl-1-propyne]-graft-poly(acrylic acid)-Ag+ complex membranes. J. Membr. Sci. 1996, 111, 27–38. [Google Scholar] [CrossRef]
- Adachi, K.; Hu, W.; Matsumoto, H.; Ito, K.; Tanioka, A. Permeation of n-butane, 1-butane and 1,3-butadiene through anhydrated Ag+-doped perfluorocarbon-type ion-exchange membranes. Polymers 1998, 181, 2315–2323. [Google Scholar] [CrossRef]
- Wu, J.; Chen, V. Shell-side mass transfer performance of randomly packed hollow fiber modules. J. Membr. Sci. 2000, 172, 59–74. [Google Scholar]
- Adhikari, S.; Fernando, S. Hydrogen membrane separation techniques. Ind. Eng. Chem. Res. 2006, 45, 874–881. [Google Scholar] [CrossRef]
- Inaba, M.; Murata, K.; Saito, M.; Takahara, I.; Mimura, N.; Hamada, H.; Kurata, Y. Dehydrogenation and isomerization of n-butane or isobutane over Cr catalyst supported on zeolites. Catal. Letters 2002, 84, 273–279. [Google Scholar] [CrossRef]
- Brunetti, A.; Scura, F.; Barbieri, G.; Drioli, E. Membrane technologies for CO2 separation. J. Membr. Sci. 2010, 359, 115–125. [Google Scholar] [CrossRef]
- Falbo, F.; Tasselli, F.; Brunetti, A.; Drioli, E.; Barbieri, G. Polyimide hollow fibre membranes for CO2 separation from wet gas mixture. Braz. J. Chem. Eng. 2014, 31, 1023–1034. [Google Scholar] [CrossRef]
- Koros, W.J.; Wo, D.G. Elevated temperature application of polymer hollow-fibre membranes. J. Membr. Sci. 2001, 181, 157–166. [Google Scholar] [CrossRef]
- Yampolskii, Y.; Pinnau, I.; Freeman, B. Materials Science of Membrane for Gas and Vapour Separation; Jhon Wiley & sons: West Sussex, UK, 2006. [Google Scholar]
- Pirngruber, G.D.; Seshan, K.; Lercher, J.A. A direct conversion of n-butane to iso-butene over Pt-ZSM5: II. Kinetic and thermodynamic aspect. J. Catal. 2000, 192, 338–351. [Google Scholar] [CrossRef]


| Moles Number | |||||
|---|---|---|---|---|---|
| n-Butane | Hydrogen | n-Butene | iso-Butene | Inert | |
| Initial value | n0 | n0·m | - | - | nInert |
| Reaction I | −n0 x1 | n0 x1 | n0 x1 | - | - |
| Reaction II | - | - | - n0 x1 x2 | n0 x1 x2 | - |
| Permeation | - | -n0 (m + x1) z | - | - | - |
| Equilibrium state | n0 (1 − x1) | n0 (m + x1) (1 − z) | n0 x1 (1 − x2) | n0 x1 x2 | - |
| Total moles | n0 [1 + m + x1 − m z] + nInert | ||||
| Component | C1-C3 | C4 | |||||
| iso-Butane | 1-Butene | iso-Butene | trans-2-Butene | cis-2-Butene | 1,3-Butadiene | ||
| Selectivity | 0.26 | 0.02 | 0.11 | 0.24 | 0.2 | 0.11 | 0.06 |
| 0.74 | |||||||
| Operating Parameters | Case Study 1 | Case Study 2 | Case Study 3 | Case Study 4 | ||||
|---|---|---|---|---|---|---|---|---|
| Membrane reactor feed pressure | 10 bar | 1.5 bar | ||||||
| Membrane reactor feed molar composition | n-C4H10:N2=50:50 | n-C4H10:H2=80:20 | n-C4H10:N2=50:50 | n-C4H10:N2=50:50 | ||||
| Gas separation—Feed pressure to GS1 | 10 bar | 10 bar | 15 bar | 10 bar | ||||
| Separation stages | θ | φ | θ | φ | θ | φ | θ | φ |
| GS1 | 50 | 10 | 580 | 5 | 10 | 15 | 20 | 10 |
| GS2 | 2.5 | 10 | 0.5 | 10 | 10 | 10 | 0.1 | 5 |
| GS3 | 2.5 | 10 | 0.57 | 10 | 0.25 | 15 | - | - |
| GS4 | - | - | 25 | 2 | - | - | - | - |
| Species | Matrimid [26,33,34] | PTMSP [27] | PSf [35] | PSM-Ag+ [28] | ||||
|---|---|---|---|---|---|---|---|---|
| Permeance | Selectivity H2/i-Specie | Permeance | Selectivity n-C4H10/i-Specie | Permeance | Selectivity H2/i-Specie | Permeance | Selectivity butenes/i-Specie | |
| H2 | 51.7 | 1 | 725 | 38.8 | 3.34 | 1 | 5.6 | 5000 |
| N2 | 2.01 | 26 | 1020 | 27.5 | 0.83 | 4 | 5.6 | 5000 |
| CH4 | 2.01 | 26 | 1020 | 27.5 | 0.83 | 4 | 5.6 | 5000 |
| C2H6 | 0.20 | 258 | 3660 | 7.7 | 0.83 | 4 | 5.6 | 5000 |
| C2H4 | 2.01 | 26 | 3660 | 7.7 | 0.83 | 4 | 28,200 | 1 |
| C3H8 | 0.088 | 586 | 9240 | 3.1 | 0.016 | 200 | 5.6 | 5000 |
| C3H6 | 0.20 | 258 | 9240 | 3.1 | 0.016 | 200 | 28,200 | 1 |
| trans-2-C4H8 | 0.201 | 258 | 16,600 | 1.7 | 0.004 | 800 | 28,200 | 1 |
| cis-2-C4H8 | 0.201 | 258 | 31,300 | 0.9 | 0.004 | 800 | 28,200 | 1 |
| 1-C4H8 | 0.129 | 401 | 20,100 | 1.4 | 0.004 | 800 | 28,200 | 1 |
| iso-C4H8 | 0.129 | 401 | 20,100 | 1.4 | 0.004 | 800 | 28,200 | 1 |
| n-C4H10 | 0.088 | 586 | 28,200 | 1 | 0.004 | 800 | 5.6 | 5000 |
| iso-C4H10 | 0.027 | 1900 | 10,800 | 2.6 | 0.004 | 800 | 5.6 | 5000 |
| 1,3-C4H6 | 0.20 | 258 | 18,800 | 1.5 | 0.004 | 800 | 14,100 | 2 |
| Case Study 1 | Case Study 2 | Case Study 3 | Case Study 4 | |||||
|---|---|---|---|---|---|---|---|---|
| Feed molar ratio | n-C4H10:N2 = 50:50 | n-C4H10:H2 = 80:20 | n-C4H10:N2 = 50:50 | n-C4H10:N2 = 50:50 | ||||
| C4 recovery, % | 34.7% | 88.5% | 39.4% | 14% | ||||
| C4 molar concentration, % | 99.9% | 80% | 78.4% | 99.3% | ||||
| C4 olefins recovery, % | 61.4% | 87.1% | 38.7% | 12.9% | ||||
| C4 olefins molar concentration, % | 99.5% | 55.5% | 43.3% | 51.6% | ||||
| Production rate, % | 26.6% | 44.9% | 16.6% | 5.5% | ||||
© 2016 by the authors; licensee MDPI, Basel, Switzerland. This article is an open access article distributed under the terms and conditions of the Creative Commons Attribution (CC-BY) license (http://creativecommons.org/licenses/by/4.0/).
Share and Cite
Melone, L.; Brunetti, A.; Drioli, E.; Barbieri, G. An Integrated Membrane Process for Butenes Production. Processes 2016, 4, 42. https://doi.org/10.3390/pr4040042
Melone L, Brunetti A, Drioli E, Barbieri G. An Integrated Membrane Process for Butenes Production. Processes. 2016; 4(4):42. https://doi.org/10.3390/pr4040042
Chicago/Turabian StyleMelone, Leonardo, Adele Brunetti, Enrico Drioli, and Giuseppe Barbieri. 2016. "An Integrated Membrane Process for Butenes Production" Processes 4, no. 4: 42. https://doi.org/10.3390/pr4040042