Review

Optical Measuring Methods for the Investigation of High-Pressure Homogenisation

Institute of Process Engineering in Life Sciences, Section I: Food Process Engineering, Karlsruhe Institute of Technology, Kaiserstrasse 12, 76131 Karlsruhe, Germany
*
Author to whom correspondence should be addressed.
Processes 2016, 4(4), 41; https://doi.org/10.3390/pr4040041
Submission received: 22 September 2016 / Revised: 4 November 2016 / Accepted: 8 November 2016 / Published: 15 November 2016
(This article belongs to the Special Issue Emulsification Processes)

Abstract

:
High-pressure homogenisation is a commonly used technique to produce emulsions with droplets in the micro to nano scale. Due to the flow field in the homogenizer, stresses are transferred to the interface between droplets and continuous phase. Cohesive forces within droplets interact with external stresses. To exceed the cohesive forces, high process pressures are necessary, which might cause a complex flow pattern and large flow velocities. Additionally, the pressure drop can induce cavitation. Inline measurements are a challenge, but necessary to understand droplet break-up in a high-pressure homogenizer. Recently, different optical methods have been used to investigate the flow conditions as well as the droplet deformation and break-up in high-pressure homogenisation, such as high speed imaging, particle and micro particle image velocimetry. In this review, those optical measuring methods are considered critically in their applications and limitations, achievable results and further developments.

Graphical Abstract

1. Motivation

High-pressure homogenisation (HPH) is widely used in chemical, pharmaceutical and food industry to produce emulsions with desired properties. Properties of emulsions, like mouth feel, colour, flow behaviour, or stability, depend strongly on their microstructure and thus on the droplet size distribution of the emulsion [1]. However, tailor-made adjustments of the droplet size distribution in emulsions is still challenging due to complexity of interactions of the process conditions and the properties of the formulation. In order to decrease the droplet size distributions, the volume-related energy density Ev is increased, most often by increasing the pressure drop Δp in the disruption unit [2]. Unfortunately, this might also lead to cavitation and cavitation-induced wear at the devices. A change in the homogeniser disruption unit design may also improve droplet breakup. As an example, Microfluidics® offers so-called T- or Z-shaped disruption units which allow droplet size reduction well below <1 µm for specific formulations. Other manufacturers merchandise specific “energy-efficient” disruption units. Even when these disruption units work fine with some formulations, they do not with others. A deep understanding in the influence of disruption unit design and process parameters on flow patterns and resulting droplet sizes is still missing.
One possibility to describe the influence of process conditions, and/or product recipe on resulting droplet sizes is to measure the average droplet size or the droplet size distribution (DSD) of the emulsion after homogenisation. Thus, the influence of different parameters like pressure drop [2,3,4,5], geometry of the device [2,6,7,8,9], or formulation [10,11,12,13] can be related to homogenisation efficiency, which allows some mechanistic insight into the high-pressure homogenisation process. However, offline measurements always represent an integral result of superimposed effects and do not display intermediate steps of homogenisation. Despite the huge progress in understanding HPH processes, to date empirical approaches are often used to design HPH processes based on experience and intuition.
Only a detailed understanding of important intermediate steps on a mechanistic level will allow a more comprehension-based design of HPH equipment and processes. In order to understand and improve HPH processes, different optical methods were developed to measure local and time resolved flow fields in high-pressure disruption units as well as to visualize droplet deformation and break-up. Additionally, optical investigations on cavitation, which can occur during the HPH process and might influence the emulsification results, were performed. Innovative methods to analyse the intensity of cavitation were developed. This review describes and summarizes different optical measurement methods, which were used to improve our understanding of the HPH process. An overview of the reviewed papers and the methods used including the associated process conditions can be found in Table 1. Since flow pattern in high pressure homogenizers are often turbulent, studies on droplet break-up that were performed only in laminar, shear or elongation flow (e.g., [14,15,16]) are excluded from this paper. These studies are essential for gaining fundamental knowledge about deformation and breakup mechanisms but cannot be directly and entirely transferred to a complex flow field during HPH processes.
The structure of the paper is as follows: In Section 2, known information on droplet deformation and break-up in emulsification machines, especially HPH will be shortly summarised and the relevant optical measurement methods will be presented. In Section 3, the different measurement methods and their applications to investigate the HPH process will be presented and the results will be critically discussed regarding the gained insights into the HPH process. The study is concluded in Section 4.

2. Background

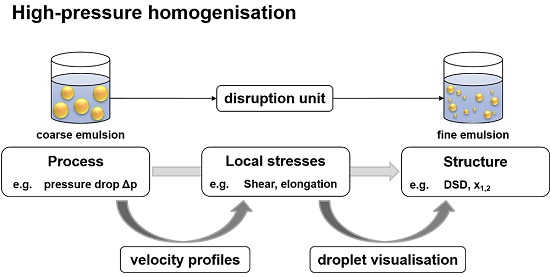
2.1. Why Do We Need Detailed Information on the HPH Process?

In general, during the HPH process pressures in the range of several 100 bar are applied to force the emulsion through a narrow gap of the disruption unit. The gap of a HPH disruption unit induces a radical change of the flow pattern: Before the gap, the flow pattern is mostly laminar. Approaching the smallest cross-section of the constriction, fluid elements are accelerated which induces mainly elongation stresses ε ˙ . Passing the constriction then adds shear stresses γ ˙ and turbulences [17,18,19,20].
With an abrupt diameter increase after the constriction outlet, restricted free jet conditions are created resulting in transitional and turbulent flow. Depending on local pressure drop cavitation might occur causing vapour nucleation in the gap, vapour bubbles and clouds at the downstream [19,21,22,23].
Though the effect of a complex flow pattern can be roughly described by mean values (such as the energy density Ev) [2], local values may dominate droplet deformation and breakup and thus have to be considered in the correct design of HPH processes. However, the measurement of these high local velocities is restricted by the capability of the commercially available equipment. The limitations depend strongly on the used equipment and geometrical scale of the disruption unit.
In addition to the velocity fields and stresses, respectively, droplet deformation and break-up are of great importance. The formation of a fine emulsion can be summarized in at least three intermediate steps, which can be superimposed [12,43,44,45]: Droplets are deformed and eventually break up into smaller droplets once deformation stresses and deformation time exceed critical values. Emulsifier molecules absorb and rearrange at the new interfaces. Emulsifier adsorption and resulting dynamic effects at the interfaces stabilize fine droplets. Droplets which are not stabilized in the moment of collision with others will coalesce if collision time exceeds critical values for film drainage between those droplets [46].
Investigating droplet deformation and break-up can be realized by minimizing the influence of stabilization effects and coalescence. This is possible by choosing emulsifiers with fast adsorption kinetics [47,48], increasing the amount of emulsifier [43,49], or reducing dramatically the concentration of the disperse phase fraction [2,50].
The deformation stresses, which lead to droplet break-up, depend on the local flow conditions. A distinction is usually made between laminar and turbulent flow conditions and their influence on droplet break-up.
In laminar flow, elongation and shear stresses act on the droplets. Several methods to investigate the droplet deformation and break-up under laminar conditions are established, experimentally e.g., in a four-roller mill [16,51,52,53,54,55,56,57] or by modelling and numerical simulation [56,58,59,60,61], respectively. Analysing the resulting DSD as a function of deforming stresses and material properties, especially viscosity ratio, allowed several authors to correlate the droplet break-up with the dimensionless Capillary number Ca. It is defined as the ratio between external shear or elongation stresses τ, respectively, and the surface stresses of the droplet (γ/r) [51,62], with r being the radius of the biggest surviving droplet and γ the interfacial tension:
Ca = (τ ∙ r)/γ
Turbulent flow after a disruption unit occurs due to the disturbances in the flow, which arise with increasing pressure drop. Droplet deformation and break-up in a fully-developed, non-disturbed turbulent flow is described by the Kolmogorov-Hinze theory [63,64]. They discriminate two regimes, the turbulent viscous (TV) regime and the turbulent inertia (TI) regime, depending on the ratio between droplet and eddy size. Theoretical models describing droplet break-up in turbulent flow conditions are reviewed by Liao and Lucas [65].
However, fluids passing through a HPH disruption unit exhibit a more complex flow pattern, where shear and elongation, as well as turbulence is superimposed. The investigations into defined laminar flow, as well as the models for turbulent flow do not represent the conditions found in a real HPH process. In addition, abrupt changes in flow within milliseconds do not allow for stationary conditions or fully developed flow fields. New approaches thus concentrate on applying optical measurement methods for the characterisation of flow fields and droplet break-up such as found in a HPH process.

2.2. Optical Measurment Methods for the Characterisation of the HPH Process

Different optical measurement methods are applied to study the HPH process. The first experiments were based on the visualization of the droplet deformation and break-up with high-speed imaging. Requiring detailed information on the flow pattern led to development of Particle Image Velocimetry (PIV). These experiments were conducted in scaled disruption units. However, the scale-up is still challenging—especially when the flow information required for scaling is not known—and therefore was avoided by using Micro-PIV in original disruption units. Cavitation was investigated with a variety of additional optical measurement methods. All methods are briefly outlined below.

2.2.1. High-Speed Image Processing (HSIP)

High-speed imaging is used to capture images of events with short time scales. A set-up consists of a high-speed camera, different objectives and a light source as well as a processing device (typically on a computer). For the visualization of droplet break-up, the minimum time between two frames as well as the exposure time are crucial to capture the event of droplet break-up with a minimum of motion blur.

2.2.2. Particle Image Velocimetry (PIV)

The PIV-technique is a relatively new measurement technique independently developed by Pickering and Halliwell [66] and Adrian [67]. Here, the flow is seeded with tracer particles small enough to faithfully follow the flow pattern. The particles are illuminated by a pulsed laser light sheet. A high-resolution, high-speed camera records two images at a defined time difference (also called double images) of the illuminated particles perpendicular to the light sheet. Afterwards, a velocity field is calculated from the displacement of the particles between the double images. Usually, autocorrelation or cross-correlation techniques are used for further processing [68,69,70]. This allows a two-dimensional, two-velocity component (2D2C) measurement of the flow field. For additional information about the PIV measurement technique as well as the limitations of the technique, see, e.g., [69,70,71,72,73,74].

2.2.3. Micro Particle Image Velocimetry (µPIV)

Microfluidic devices are used more and more often in various applications like micro-bioreactors or micro-mixers [75]. Therefore, the demand for a measurement technique, which is able to characterize the flow pattern in such devices, increased. The transfer of the macroscopic PIV technique on the microscale was achieved by Santiago et al. [76]. First results of flow pattern in a microfluidic channel were published by Meinhart et al. [77] and Koutsiaris et al. [78]. The main difference between PIV and µPIV is the illumination. While during PIV a laser light sheet is used, in µPIV the entire volume is illuminated. The seeding particles are fluorescent, absorb the laser light and emit light at different wavelength. Using special filters, which allows the emitted light to pass through the filter, increases the signal-to-noise-ratio. Afterwards, the analysis of the data is similar to PIV. Detailed information about µPIV method can be found in [79,80]. Limitations of µPIV measurements are discussed in, e.g., [81,82,83].

2.2.4. Visualisation of Cavitation

Different measurement methods, like shadow graphic imaging [39,40], sono-chemiluminescence [41] or µPIV [34], are applied for the visualization of cavitation pattern. A brief overview of the three measurement techniques is given below:
• Shadow graphic imaging
A light source is in-line with the camera. The gas formed by cavitation blocks and reflects the light, thus causing a shadow, which is recorded by the camera to describe the flow pattern [84].
• Sono-chemiluminescence (SCL)
In the region of cavitation bubble collapse light is emitted when Luminol is added to the fluid [85]. During the cavitation bubble collapse free OH radicals are formed, which oxidize Luminol. The intermediate product decomposes and emits light, which can be detected by a sensor or camera. The schematic reaction path of Luminol is shown at Rose and Waite [86].
• Micro-Particle Image Velocimetry
The fluorescent dye Rhodamine B is added to the fluid. In the cavitation bubbles the concentration of the dye is low compared to the concentration in the liquid phase. With a µPIV set-up the emitted light of the dye can be recorded. Concentration differences lead to a visualisation of the vapour and liquid phase [34].

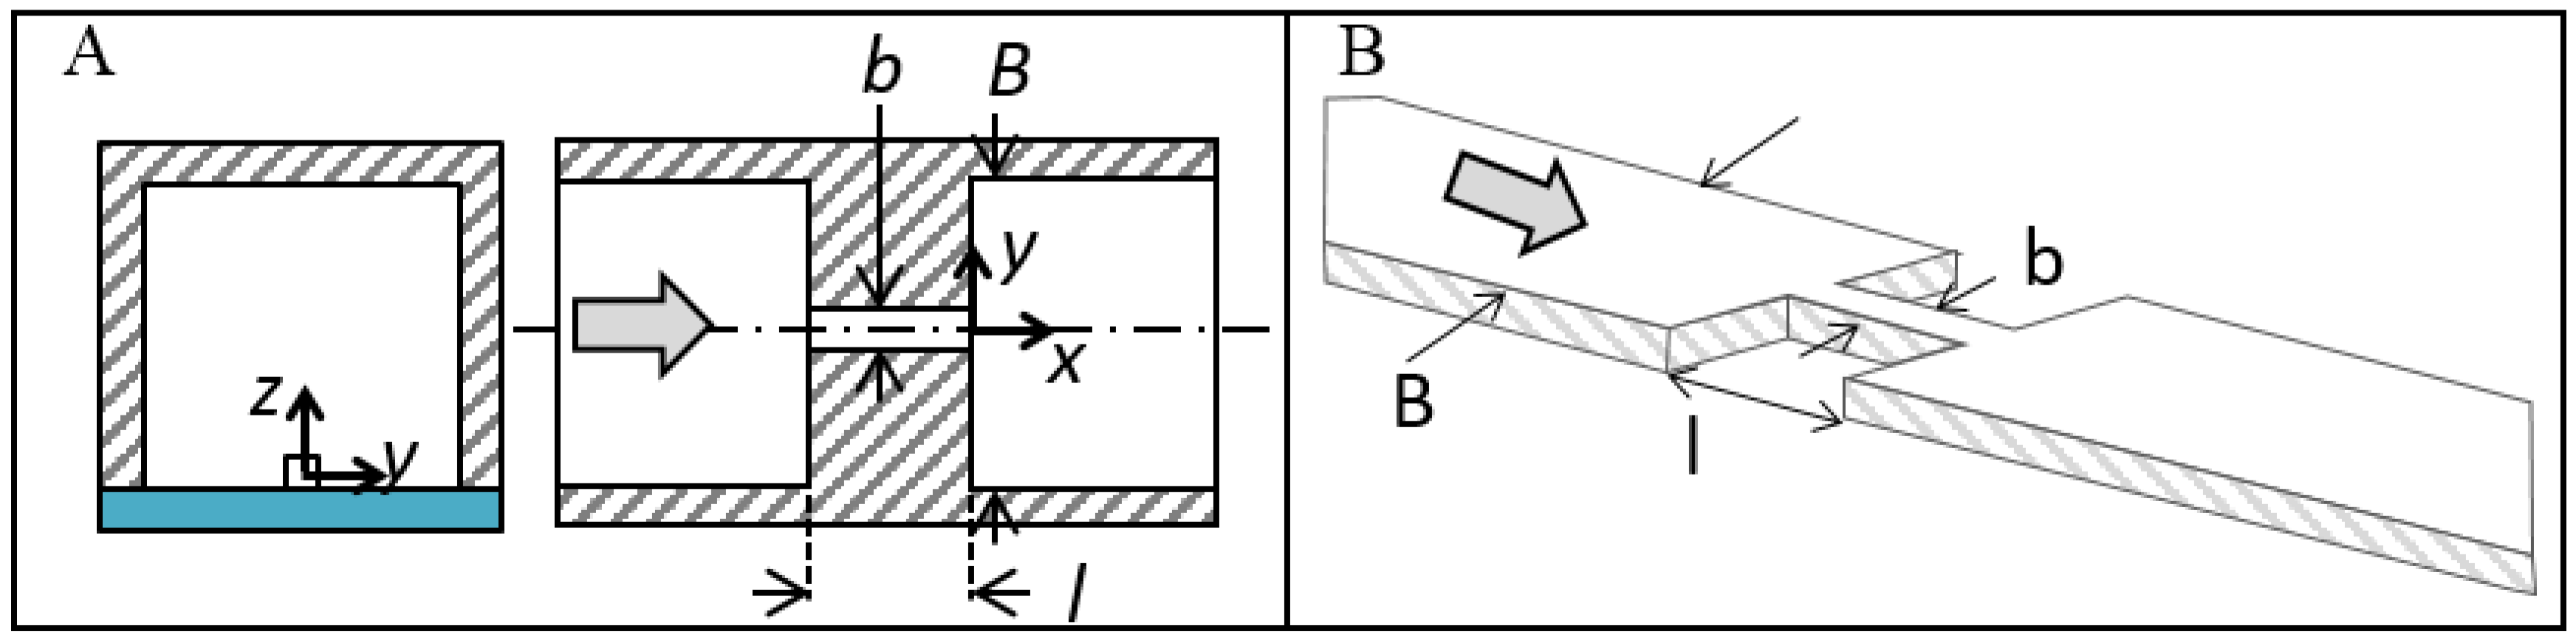
3. Optical Methods for Investigating High-Pressure Homogenisation

Optical measurement techniques, unlike the mentioned integral methods, provide detailed information about local velocity profiles and allow insights into droplet deformation of single droplets and droplet clusters. Therefore, they help to understand the break-up mechanisms of droplets during emulsification. Due to rapid improvements in imaging technology and computational performances, the possibilities to record and process images increased immensely. Those developments enabled studies that are able to resolve the emulsification process during high-pressure homogenisation with higher temporal and spatial resolution.
In this review, the results of various studies from simple camera images towards increasingly detailed studies with high temporal and spatial resolution are described and discussed below. An overview over the reviewed studies can be found in Table 1.

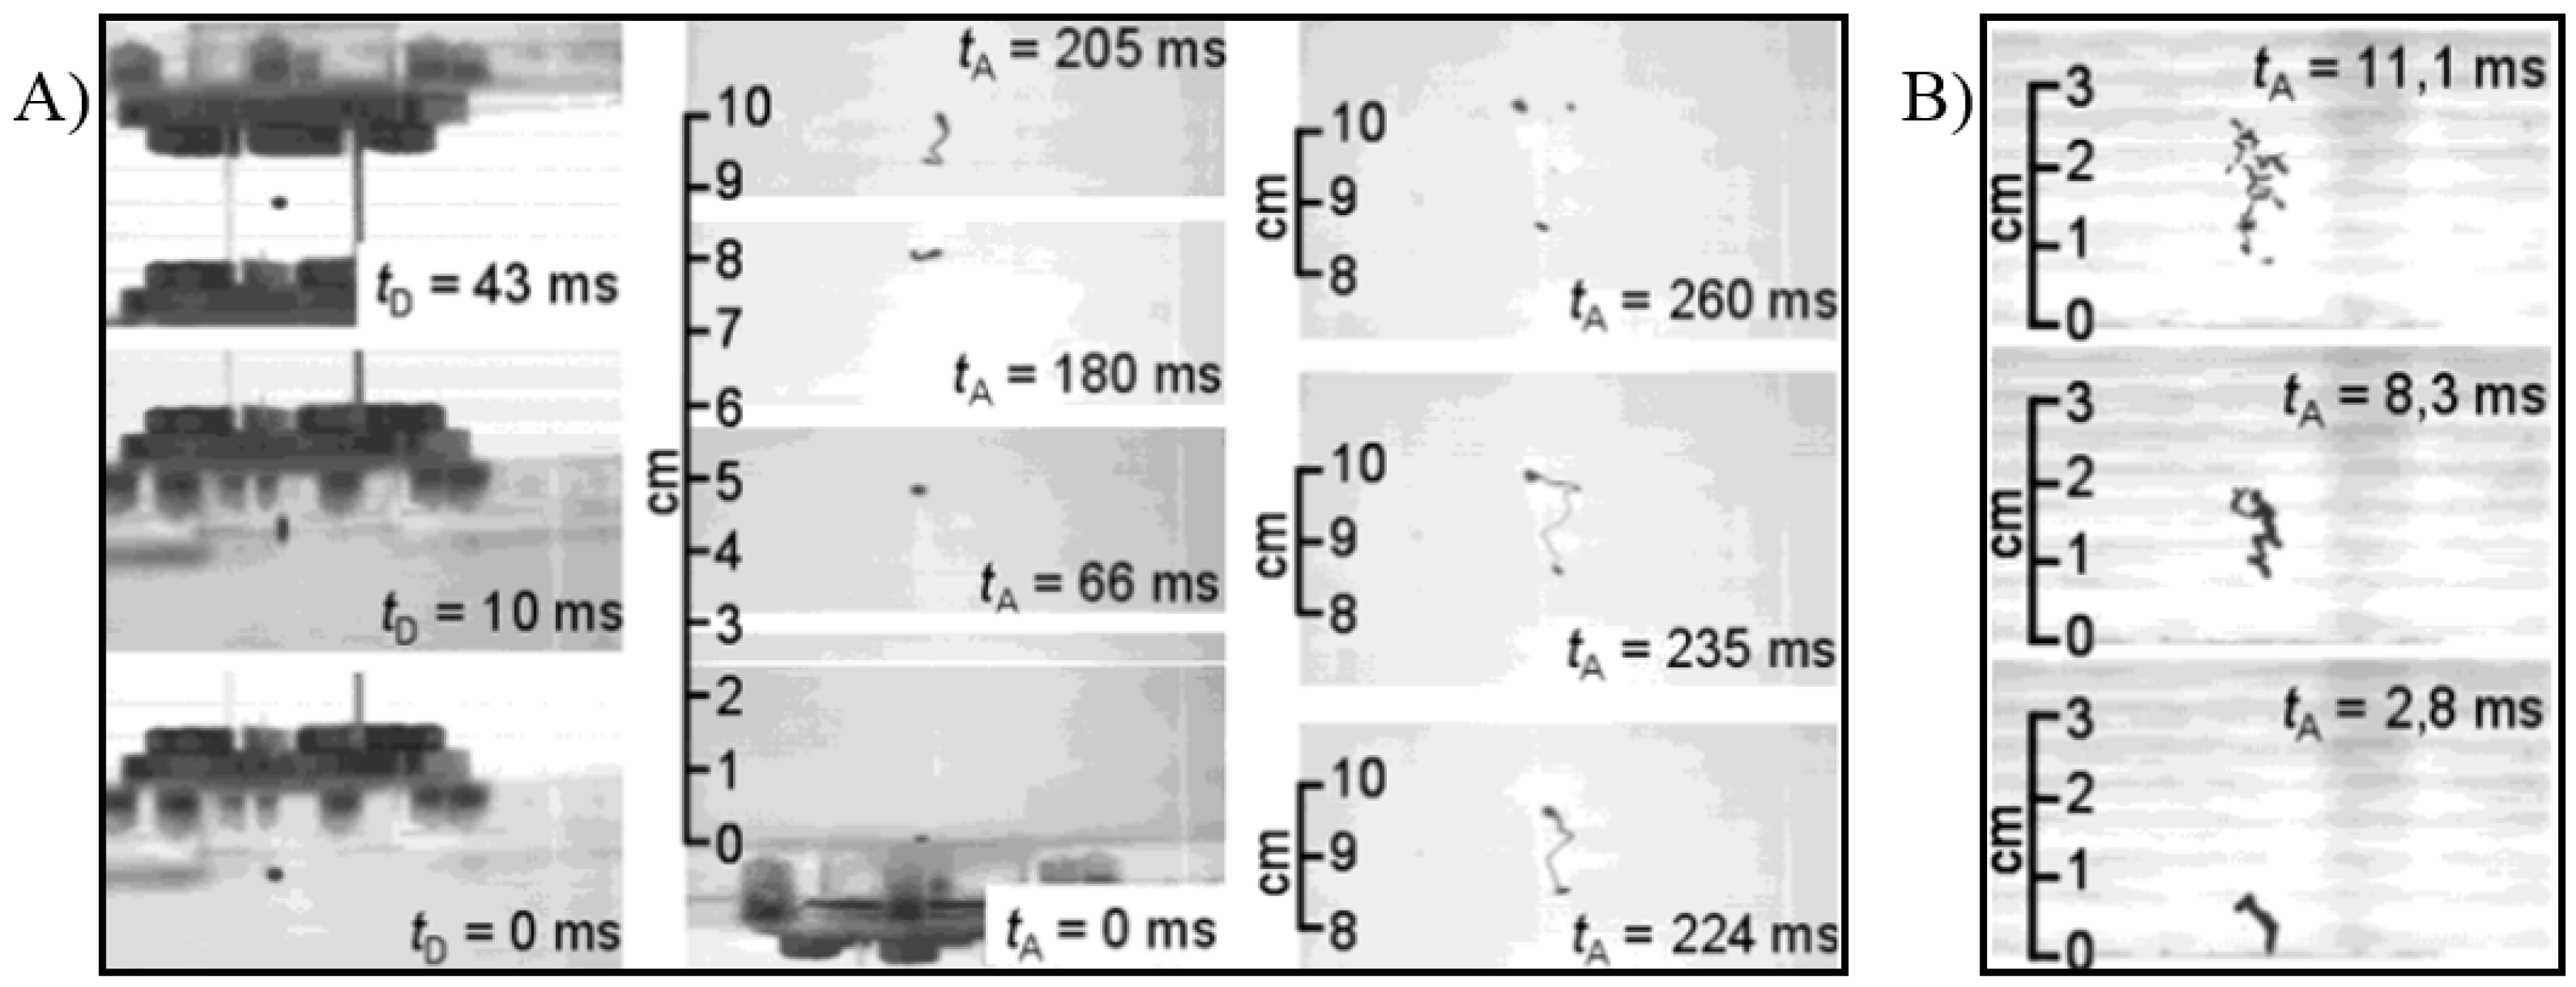
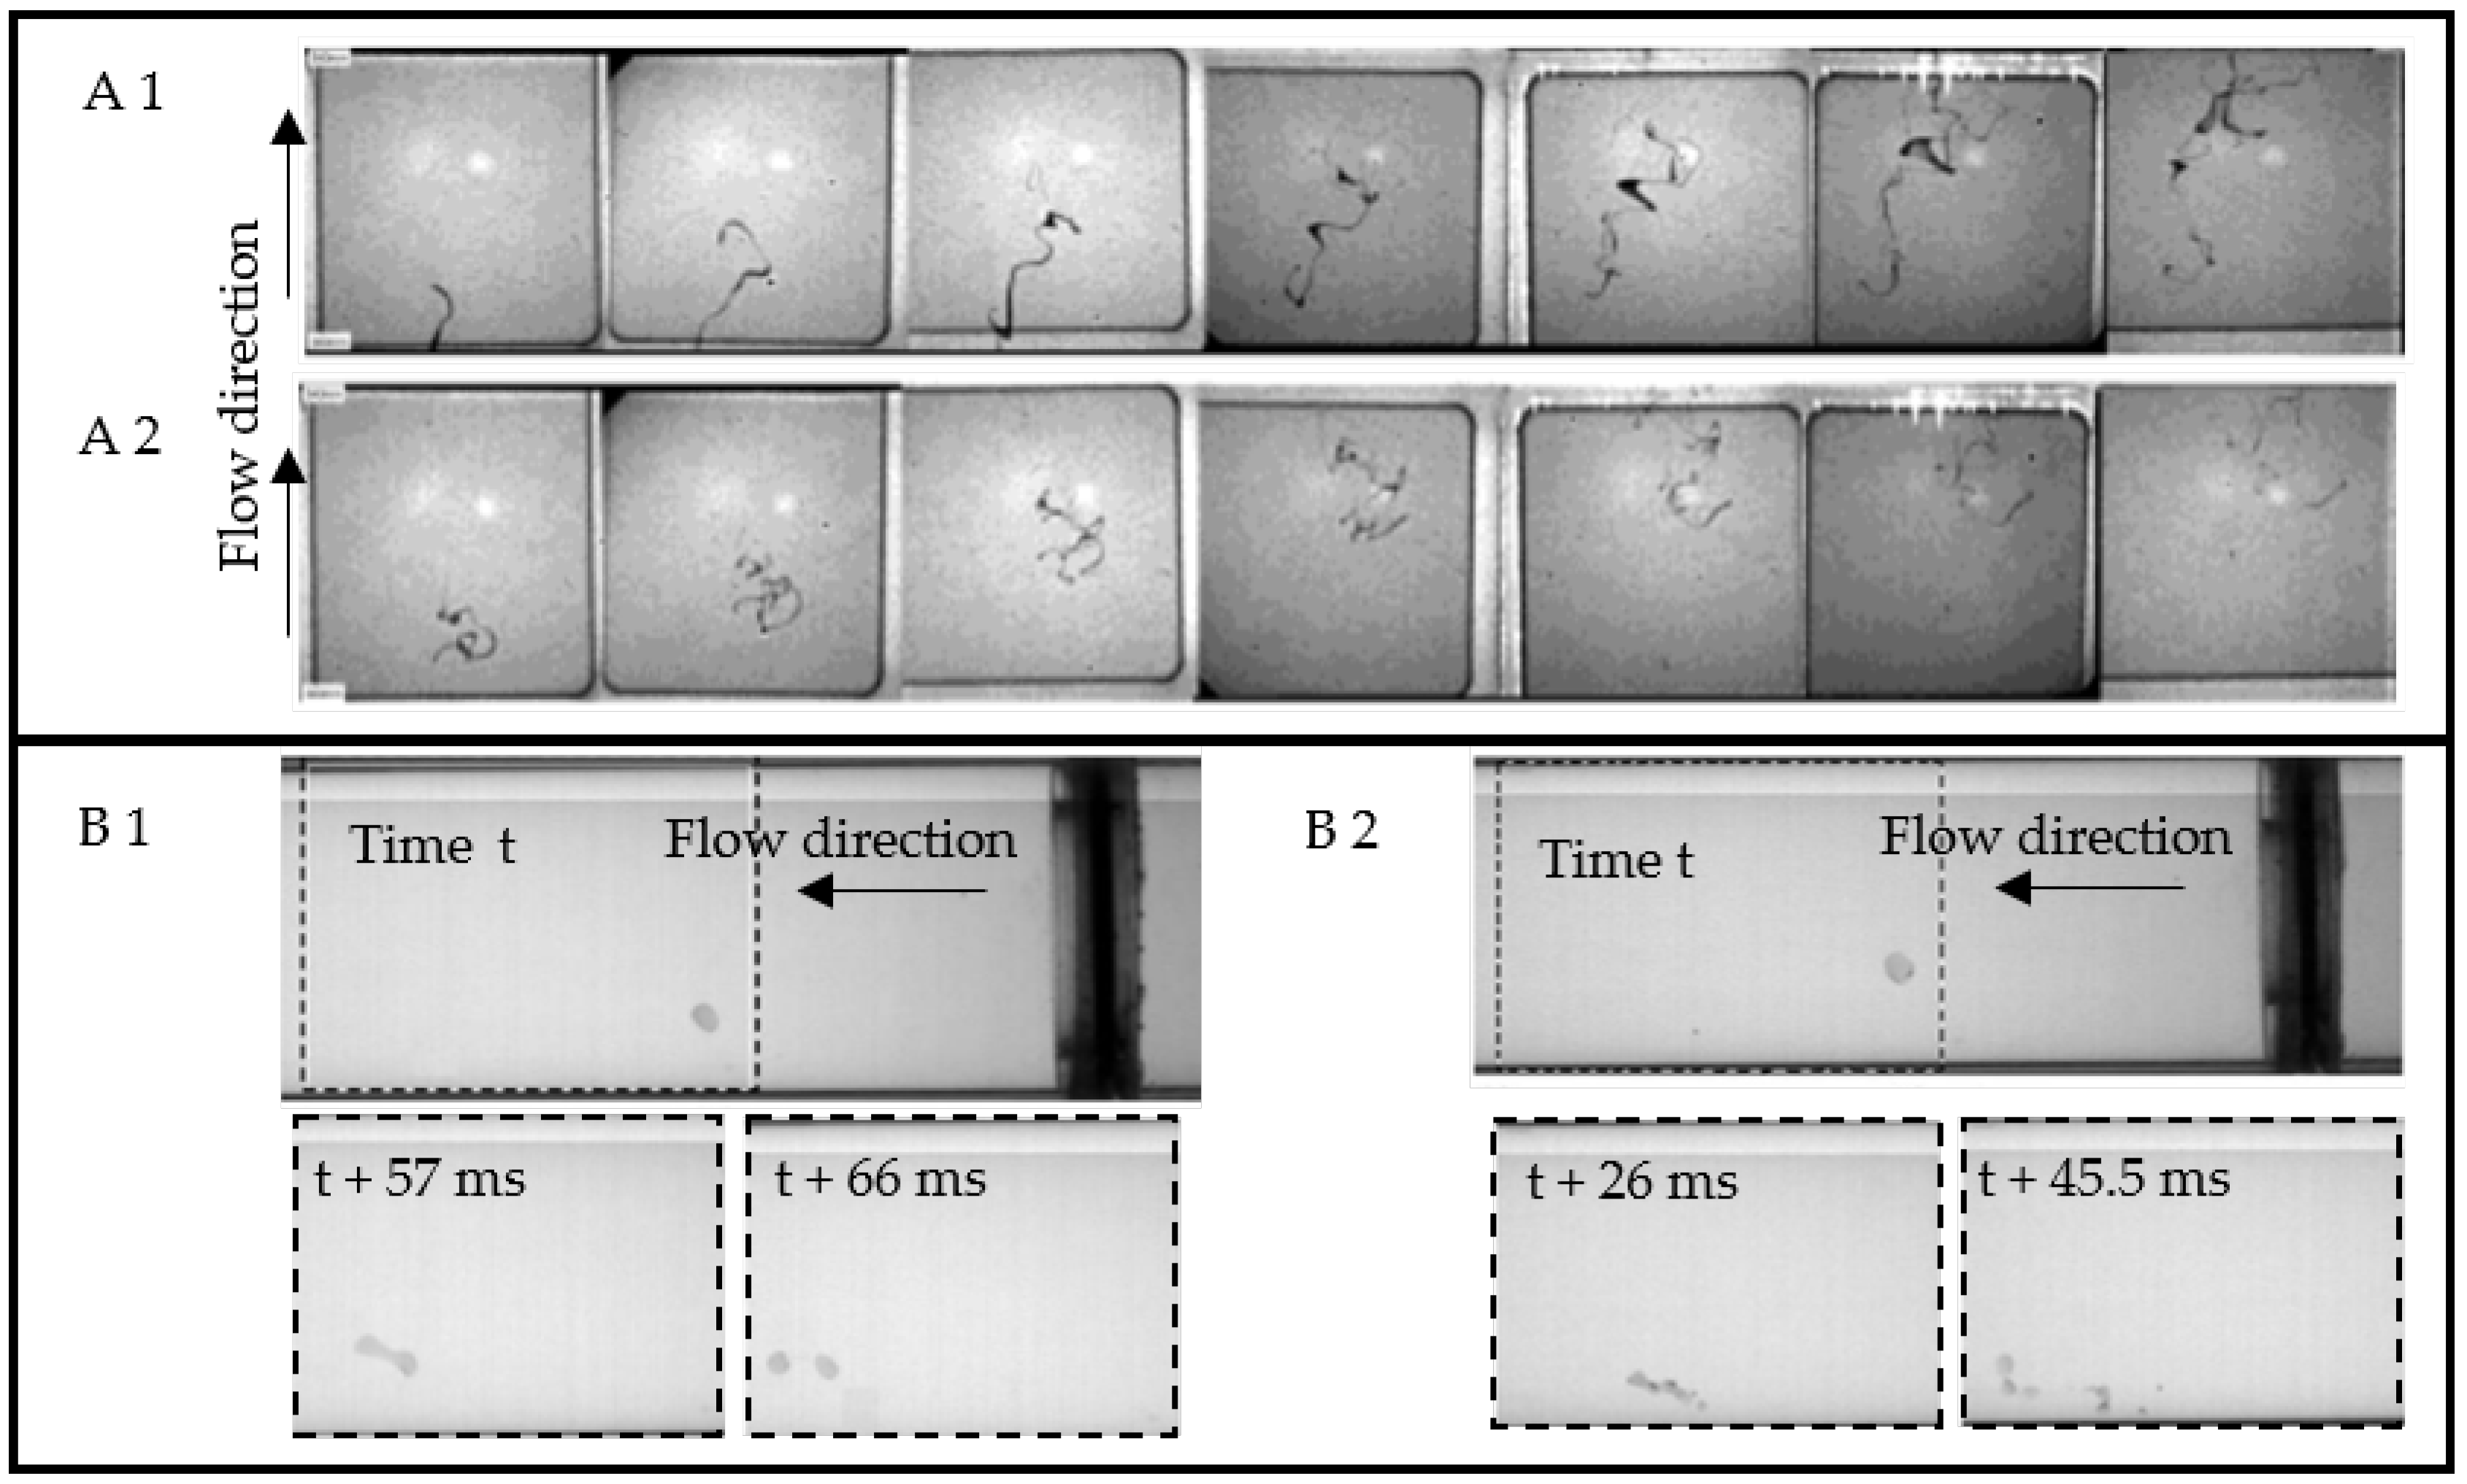
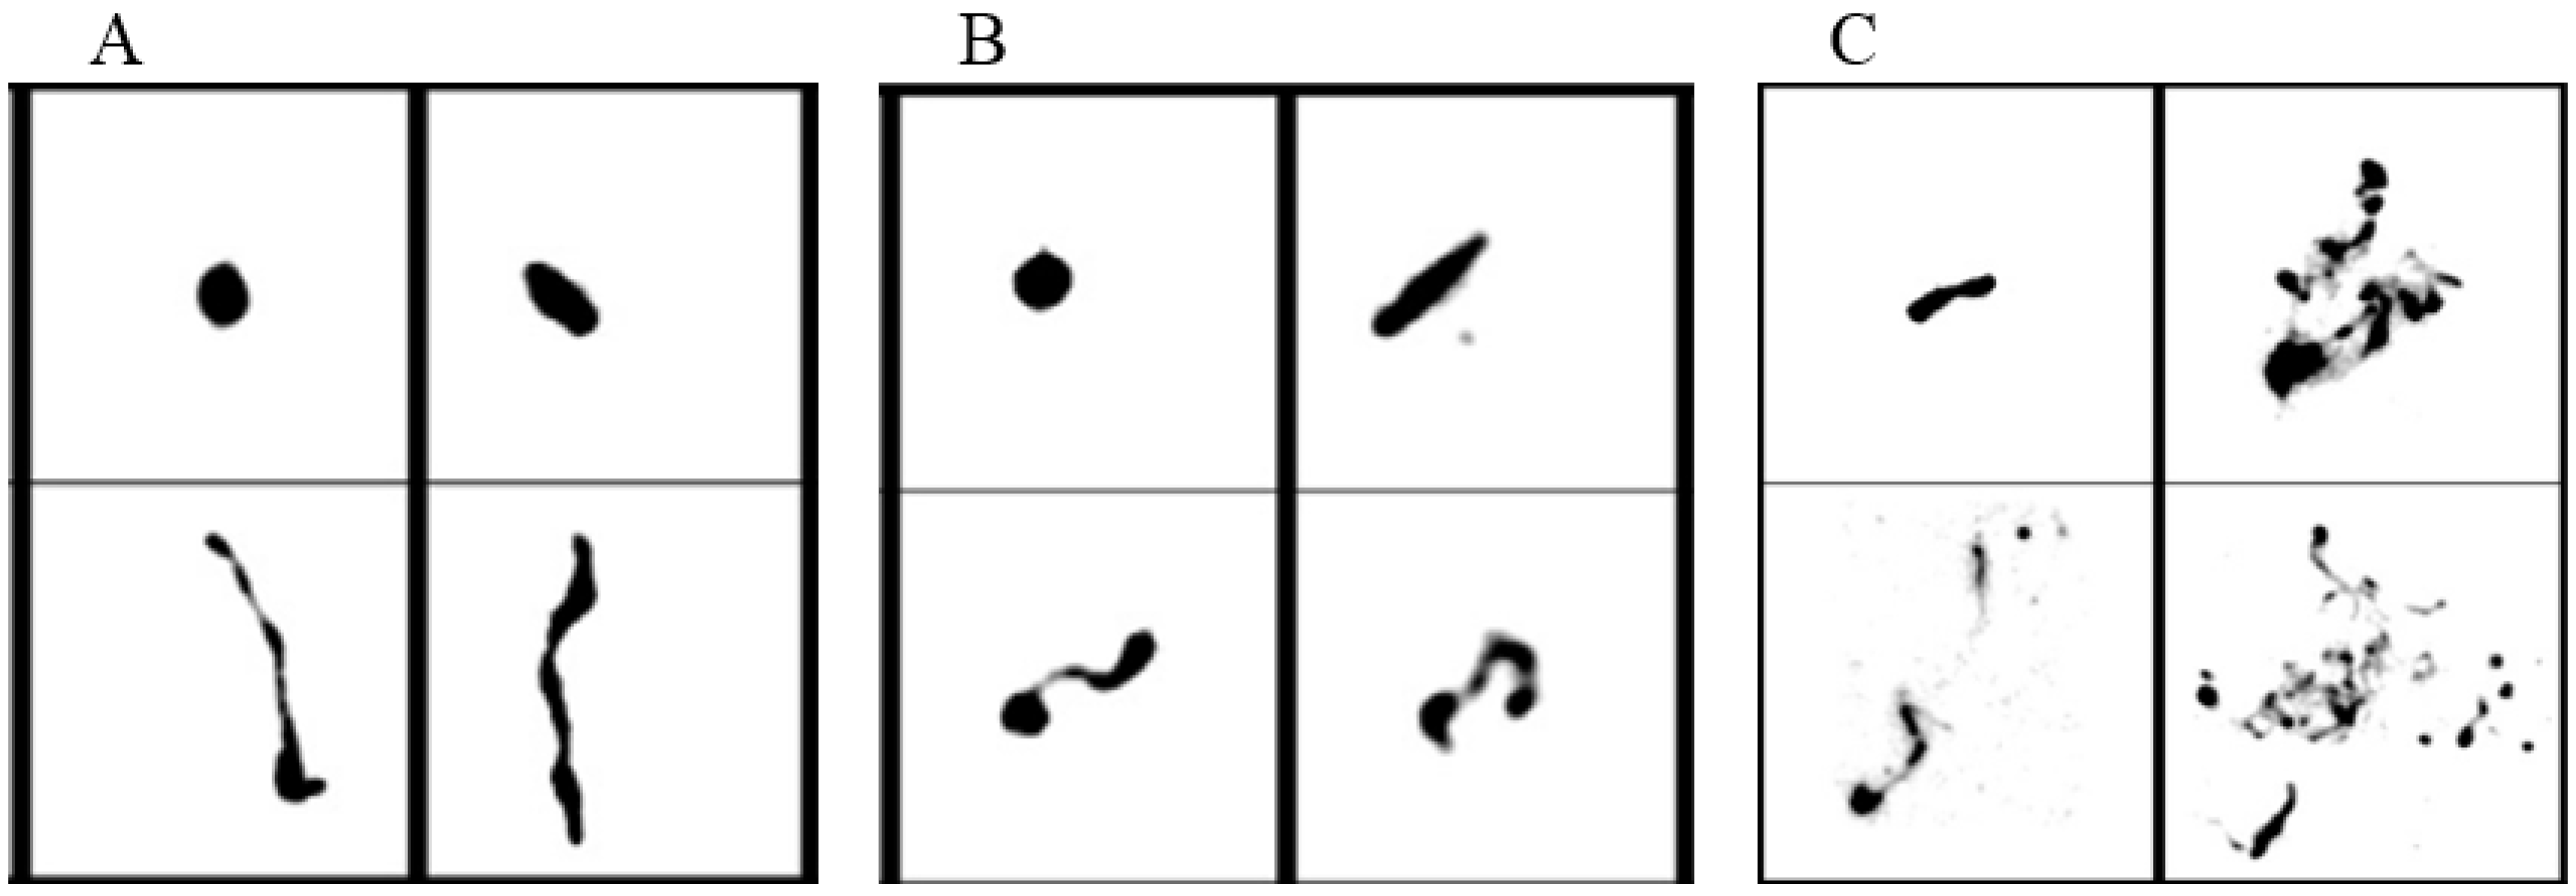
3.1. Visualisation of Droplet Deformation and Break-up Using High-Speed Image Processing (HSIP)

Unlike integral measurement methods, optical measurement methods provide a more detailed insight into droplet deformation and break-up in high-pressure homogenizers. The first optical investigations of high-pressure homogenisation focused on droplet deformation and droplet break-up of individual droplets. The measurements took place in simple orifices and were recorded by high-speed devices [24,25,27].
Due to the technological limitations, all experiments were conducted in scaled orifices. Scaled-up orifices led to an enlargement of the interesting areas in the disruption unit as well as to a reduction of the velocities. Nevertheless, this enabled the measurements with the available equipment/technology. The orifices were made of optical accessible materials, like acrylic glass. To improve the signal-to-noise-ratio, droplets were dyed black to increase the contrast between the fluid and the droplet [24,25]. A reproducible droplet size was achieved by using microfluidic capillary devices [25,27].
Exemplary results of visualized droplet deformation and break-up in a simple orifice from Kolb et al. [25] are shown in Figure 1. The droplets were injected centrically in the orifice and forced to follow the laminar flow before the orifice narrowing. They were slightly deformed before or in the orifice, however not broken-up. After the droplets passed the orifice, two forms of droplet break-up were observed as shown in Figure 1. The first is the elongation of the droplets into a thin filament and then a “separating” into two to three bigger daughter droplets (Figure 1A). The second form is an “explosive droplet disruption”, which means that the deformed droplets break-up into a multitude of small droplets (see Figure 1B). These two mechanisms of droplet break-up were found as a function of the turbulent Weber number Weturb and Reynolds number Re. An influence of the viscosity ratio on the mechanism was not observed. At low Weber and Reynolds numbers the “separating” predominated, which can also be seen as “Kelvin-Helmholtz Instabilities”. At turbulent Weber numbers Weturb > 40 and Reynolds numbers Re > 2000 the “explosive droplet disruption” was observed.
Partially similar droplet deformation and break-up mechanisms were described by Budde et al. [24] and Galinat et al. [27], as shown in Figure 2. At the outlet of the orifice, the droplet deformation varied from strongly elongated droplets, like it is shown in Figure 2A, to no visible deformation of the droplet (Figure 2B). The break-up into two to three smaller droplets, as was shown by Kolb et al. [25], was observed by both studies (see Figure 2A1,B1). The “explosive droplet disruption” described by Kolb et al. [25] seems to be similar to the droplet break-up visualized by Galinat et al. [27], as shown in Figure 2B2.
However, a comparison between the presented studies is difficult, since the studies were carried out at different geometrical parameters, process conditions and material properties.
In addition, the strategy of scaling the disruption unit varied between the studies. Kolb et al. [26] based their scaling on geometrical factors and the Reynolds number in the gap, whereas Budde et al. [24] took additionally the Weber number and the viscosity and density ratios between the phases into account. The motivation of Galinat et al. [27] was to investigate the droplet break-up induced by a restriction in a pipeline, for the petroleum recovery industry. Therefore, no scale-up was needed.
Additionally, the material properties, especially the viscosity ratio, differ between the studies, which lead to different break-up behaviour through elongation and shear stresses.
The process conditions were varied from close to laminar flow conditions (Reynolds numbers between 1000 and 2000) to turbulent flow conditions with high Reynolds numbers, which influence the droplet break-up after the orifice significantly. The local changes in flow conditions result in stresses which lead to droplet break-up. To explain the different droplet break-up mechanisms presented above, a deeper understanding of these stresses is essential. However, the used technique did not enable the measurement of local velocities, which are necessary to calculate the stresses.

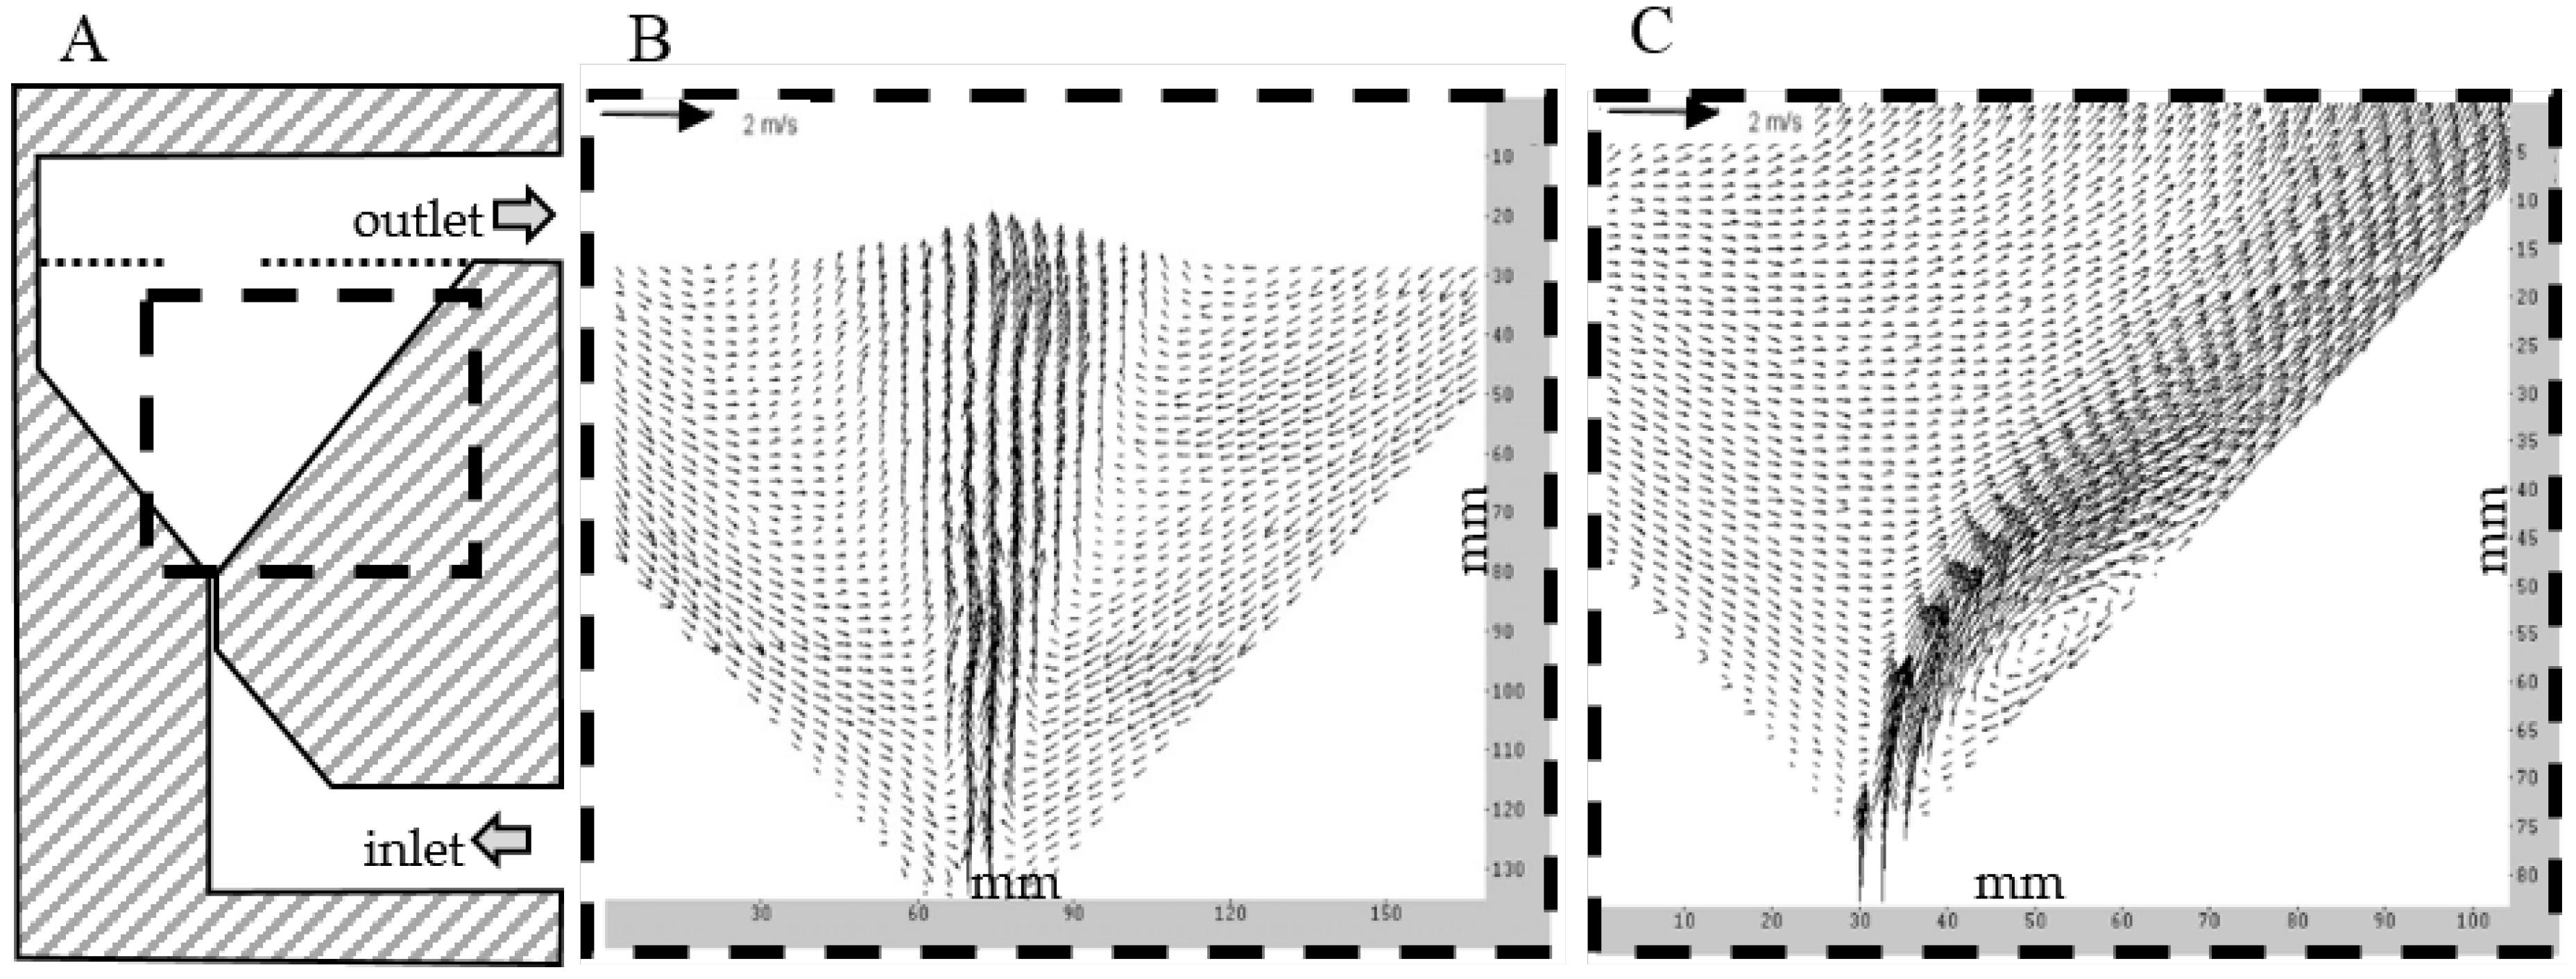
3.2. Particle Image Velocimetry (PIV) Mesurements to Investigate Velocity Profiles and Droplet Break-up

To gain deeper insights into the droplet break-up mechanisms the visualisation of the droplets alone is insufficient. In addition, the stress history a droplet undergoes during the break-up process needs to be known. Therefore, the research focused on PIV technique, which allows to measure local velocity fields as well as the visualisation of droplets.
The research group of Trägårdh and Bergenståhl used the PIV technique to investigate the flow field as well as droplet deformation and break-up in flat valves for the dairy industry [28,29,30,31,32,33]. Their research focused on the question, how the local flow field contributes to the droplet break-up and which mechanisms are responsible for it.
The scale-up model of the flat valve was built as a rectangular slice of the annular flat valve. An illustration of the model is shown in Figure 3A. Acrylic plastic was used to enable optical accessibility. Two models with scale-up factors of 2.7 [28] and 32 [29], which are based on a production homogenizer with a gap height of 150 µm, were built. However, velocity measurements in the smaller model were not possible, therefore most investigations were conducted in the larger model. The outlet of the large model could be varied from asymmetric to a symmetric outlet (see dotted line in Figure 3A) [29]. For the velocity measurements, fluorescence seeding particles were added. To increase the resolution of the PIV set-up, different lenses were used to enable required magnification [31,32,33].
A fluorescence dye was added to the dispersed phase to enable visualization with the PIV set-up. The dispersed phase was injected with a microfluidic device before the narrowing of the orifice which was disrupted into droplets or elongated to thin filaments depending on the flow conditions.
Velocity profiles before the narrowing of the gap and in the gap were measured. The asymmetrical inlet caused asymmetric velocities profiles as well, which also led to higher Reynolds stresses close to the right wall in the gap [31]. However, droplet break-up was only seen in the outlet [28] and therefore, the inlet and the gap itself were not further analysed.
Innings et al. [29] measured the velocity field at the outlet of the gap for different outlet geometries, as shown in Figure 3B,C. The position of the outlet influences the average velocity field after the gap immensely. The asymmetric outlet led to a jet which was attached to the wall (Figure 3C), whereas the symmetrical outlet leads to a straight jet which had a high fluctuation around the centreline of the jet (see Figure 3B). The jet itself fluctuated randomly and the turbulence was anisotropic. However, the eddies could not be measured with this set-up. Therefore, additional lenses were used to increase the resolution and the asymmetric outlet was investigated [31]. This allowed a detailed analysis of the flow and the distribution of the turbulent kinetic energy over the eddy length scale.
A method was developed to evaluate velocity fluctuations smaller than droplets and maximum velocity gradients of eddies larger than the droplets. In combination with the Kolmogorov-Hinze framework, they found areas were the TV and TI mechanisms influence the droplet break-up crucially. They concluded that large droplets experience high deformation stresses close to the gap while smaller droplets are more likely deformed further downstream by the TI mechanism. For all droplet sizes the TV mechanism was found most efficient in the same area were the TI mechanism deforms the large droplets. However, these findings were based only on a theoretical approach.
In Addition to the flow pattern, the droplet break-up was investigated [28,30]. First results in the smaller model showed that the droplets were only slightly deformed at the inlet and in the gap. Break-up of droplets occurred solely after the gap [28].
The droplets were also visualized in the larger model with a symmetric outlet. Exemplary images of the deformed droplets are shown in Figure 4. Influence of the flow structure was discussed on the basis of the visualized deformation of the droplets. Large flow structures deform the droplets evenly as it is shown in Figure 4A. Flow structures that have the same or a smaller scale than the droplet deform the droplet irregularly (see Figure 4B). When the droplet is already deformed, other eddies around deform it even further. This leads to thin filaments and coiled structures, which will finally break-up into small droplets as it is shown in Figure 4C.
In a homogenisation process, the dispersed phase concentration is usually higher than in the presented studies and therefore, a two-phase flow exists. Therefore, Håkansson et al. [32,33] added silica gel particles to the continuous phase to simulate a two-phase flow. The flow field was similar to the one-phase flow field. The only measurable effect was an increase of the jet width with increasing disperse phase fraction.
The comprehensive studies to the characterisation of the flow and droplet break-up in high-pressure homogenizer demonstrated the potential of PIV technique in this research area.
Nevertheless, some information about the droplet deformation and break-up is missing. For instance, the flow field of the asymmetrical outlet had been investigated in detail [31], however the droplet deformation and break-up was not recorded and analysed in this outlet geometry. Additionally, the process conditions like the Reynolds number were varied between the different studies, which allows only for a qualitative comparison.
However, the visualized droplet deformation [30] corresponds well with the droplet deformation recorded by Kolb [25], but it differs from the results observed by Budde [24]. The excessive droplet deformation in the orifice like it was observed by Budde was not seen by Innings [28,30]. They assumed that the scale-up of Budde had some issues [30]. However, a correct scale-up of the high-pressure homogenisation process, especially the relevant time scales, has not been accomplished yet. Therefore, it is not clarified yet if the results achieved in the scale-up model can be transferred the original scale.

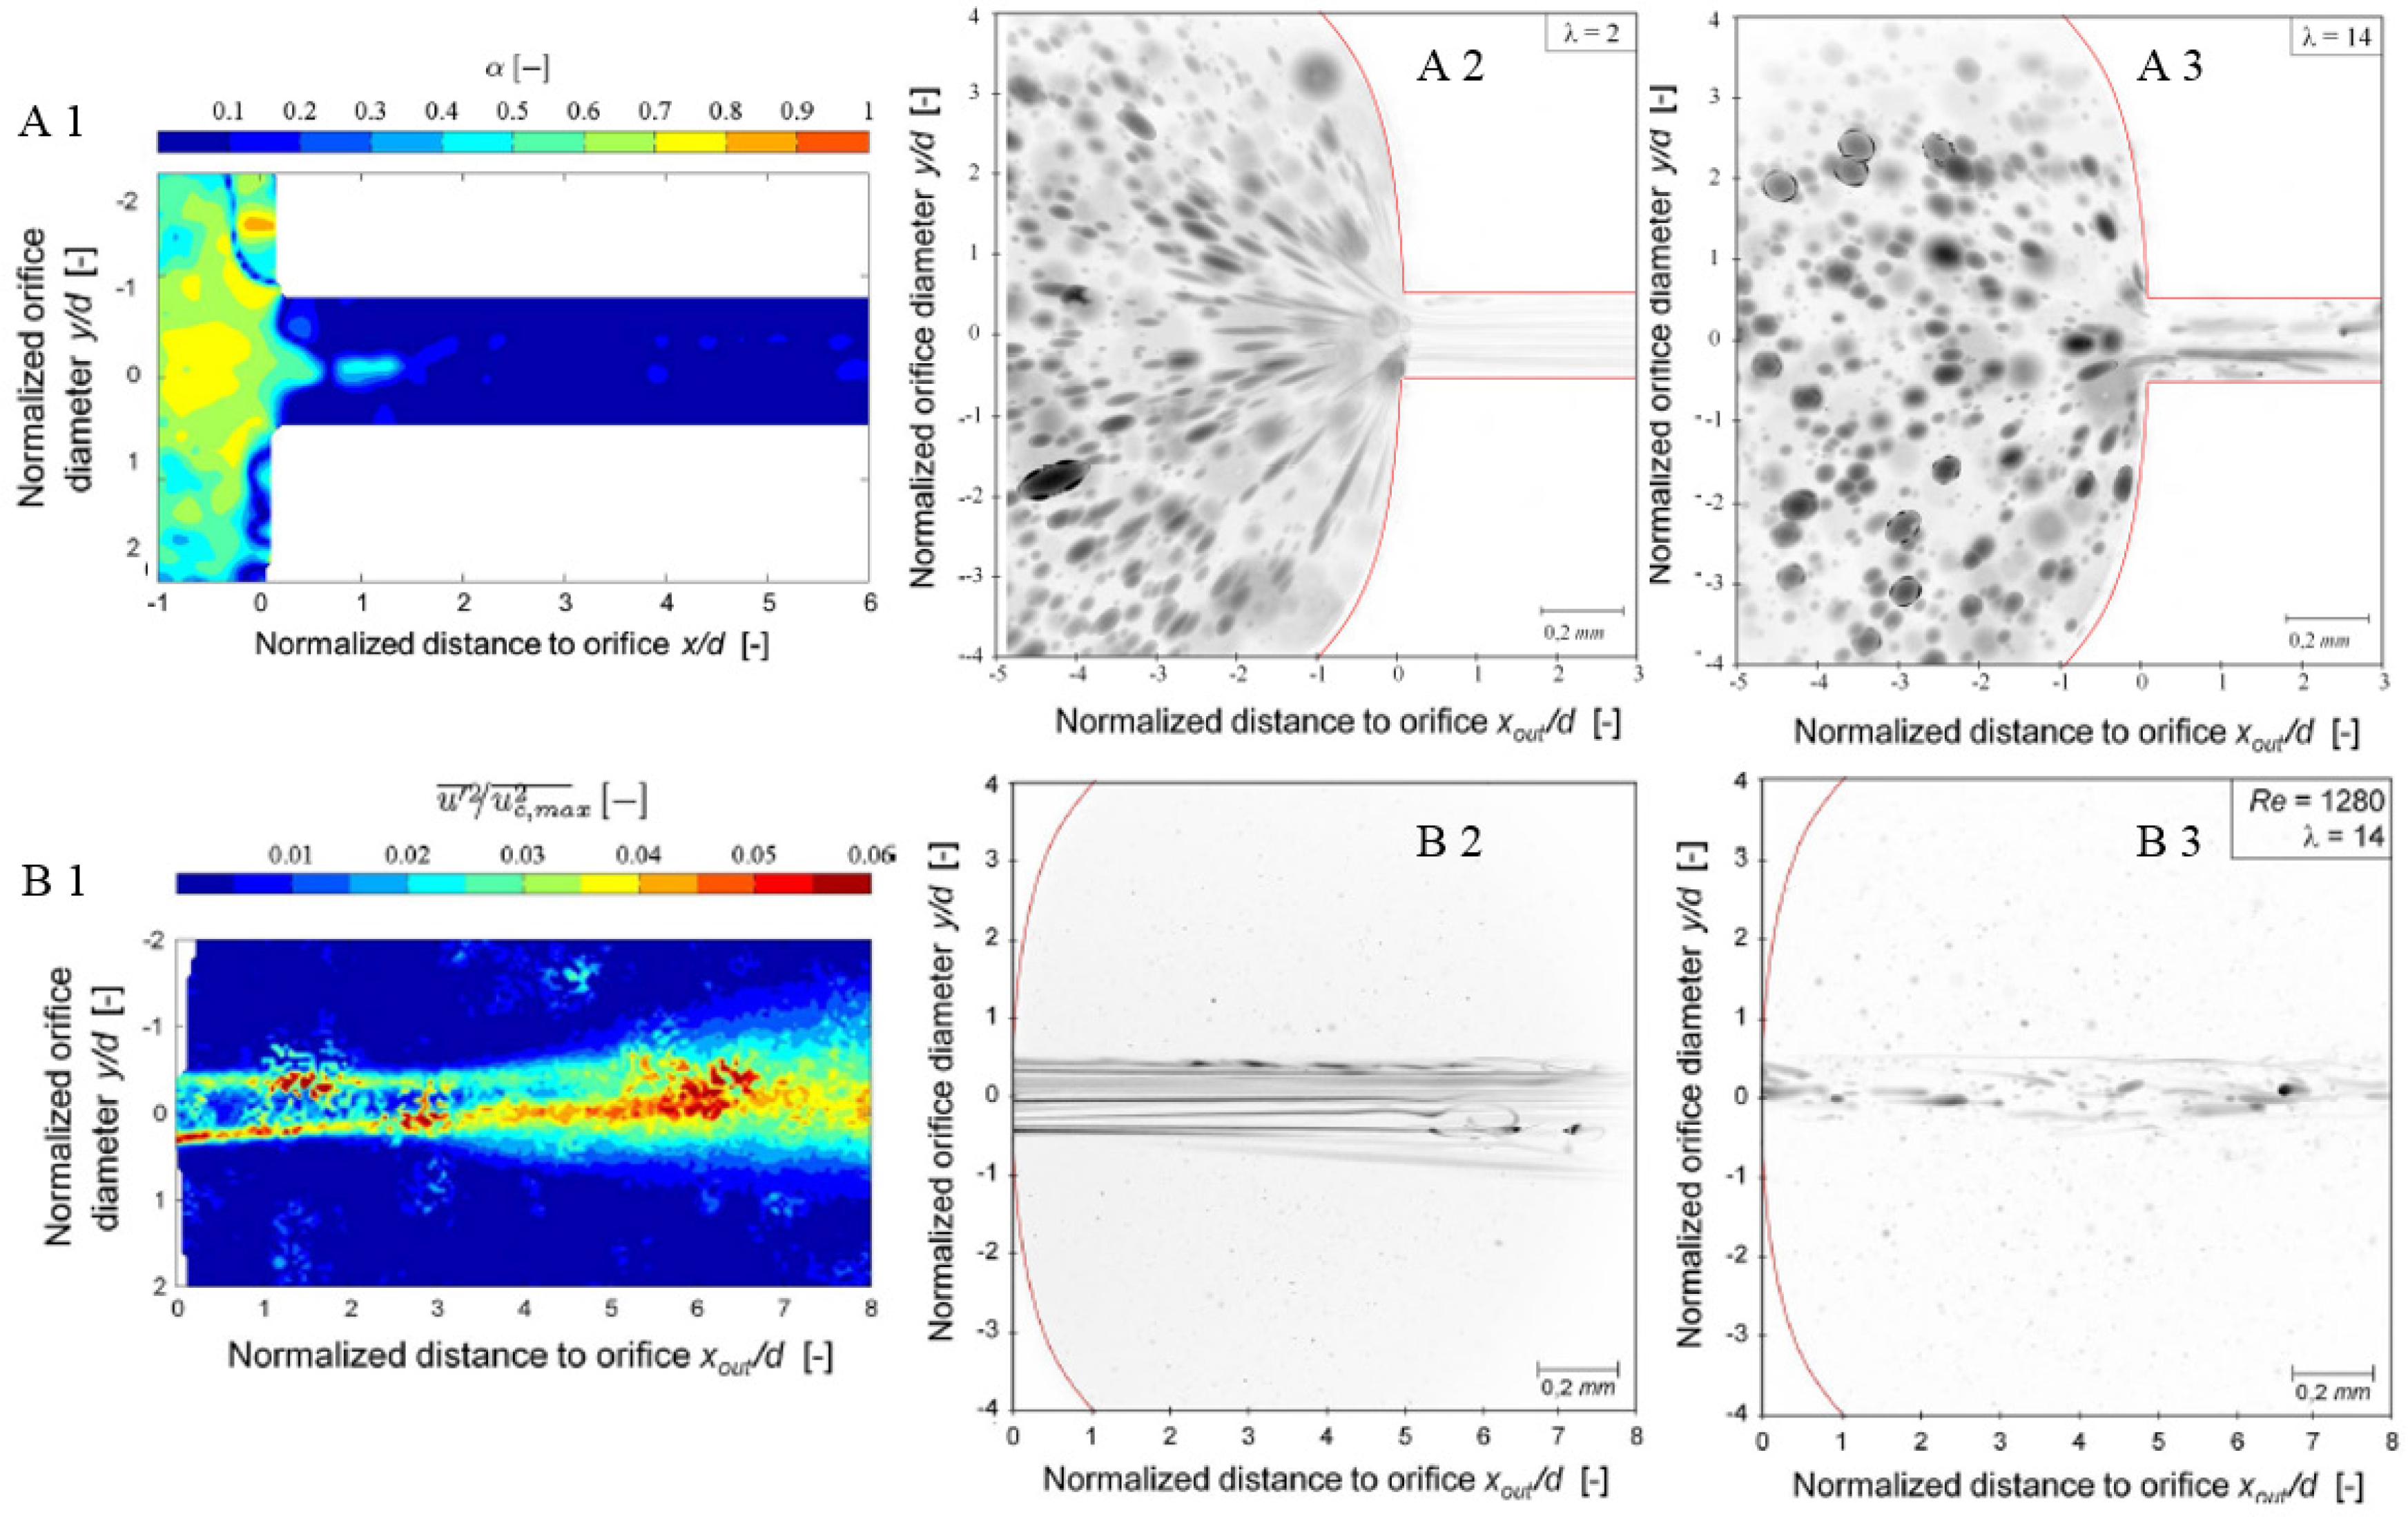
3.3. Micro-PIV Mesurements

To avoid the scale-up challenges and uncertainties described above, the main research moved to the investigation of the real HPH processes in micro-scale. The focus was on finding the possibilities and limitations of µPIV regarding the measurements of velocity fields and droplet break-up during the HPH process.
Similar to PIV, the orifices were optically accessible and pressure-resistant, as the pressures and velocities of the fluid are significantly higher in the original scale compared to the scale-ups during the PIV measurements. Schematic geometries of the orifices, which were investigated by Kelemen [35,36,37,88] and Gothsch [34], are shown in Figure 5. Fully turbulent flow was not analysed since the maximal velocity, which could still be analysed in good quality, was limited to 150 m/s [35] and 200 m/s [34], respectively. The velocity fields were used to calculate the shear and elongation stresses in the inlet and in the orifice itself [35]. To analyse the turbulent fluctuations of the shear layer of the jet after the orifice, the normalized velocity fluctuations were calculated [35].
The set-up in Kelemen et al. [35] was also used to visualize the droplet deformation and break-up [36]. The viscosity ratio between disperse and continuous phases was varied from λ = 2 (shear rates still have an influence on droplet break-up) to λ = 14 (shear rates have no influence on droplet break-up).
Exemplary results of the calculated stresses, as well as the droplet deformations, in Kelemen et al. [35,36,89] at a Reynolds number of Re ≈ 1200 are shown in Figure 6. In the upper row, the results in the entrance of the orifice are shown. The flow parameter α evaluates the amount of shear and elongation stress in the flow as shown in Figure 6A1. At the entrance of the orifice elongation dominates while inside the orifice shear prevails. Therefore, droplets close to the entrance to the orifice are stronger deformed than further away. At the lower viscosity ratio of λ = 2, the droplets are deformed into thin filaments in the orifice (see Figure 6A2), whereas the filaments inside the orifice are thicker at the higher viscosity ratio of λ = 14 as it is shown in Figure 6A3. In the lower row, the velocity fluctuations at the orifice-outlet are shown in Figure 6B1. Here, higher velocity fluctuations in boundary of the jet, where the jet is decelerated from the surrounding fluid, exist. These fluctuations, also known as “Kelvin–Helmholtz Instabilities”, lead to wavelike deformations of the thin filaments at the low viscosity ratio (see Figure 6B2). At the higher viscosity ratio, the droplets are slightly elongated and the velocity fluctuations do not affect the filaments much.
Velocity profiles were also investigated in Gothsch et al. [34] with a µPIV set-up in a high-pressure microfluidic system (HPMS). The geometry of the orifice is depicted in Figure 5B. During the experiments high pressures up to 500 bar, which result in Reynolds number up to 12.000, were used. At the outlet of the orifice the velocity profile of the jet attached randomly to a wall and remained there. This behaviour is opposed to the measurements in Kelemen et al. [36], where the jet did not attach to the wall. However, the geometries as well as the process conditions differ in the experiments, which makes it difficult to compare the experiments.
Drawing a comparison between the results from the HSIP, PIV as well as the µPIV measurements is difficult due to different process conditions, material properties, geometrical scales as well as investigated parameters. However, in general two different types of droplet deformation, independent from viscosity ratio and Reynolds numbers, were observed at the outlet of the orifice/gap. On the one hand, droplets, which are deformed into thin filaments are seen directly at the outlet of the orifices [24,36]. On the other hand, droplets are only slightly deformed after the orifices/gap [25,27,30,36]. Kelemen et al. found strongly elongated droplets at a low viscosity ratio and slightly deformed droplets at a higher one. This could partly explain the different types of droplet deformation, which were observed, but needs to be investigated further.
The influence of a higher disperse phase concentration was additionally investigated as in Håkansson et al. [33]. For this purpose, the same experimental set-up as in Kelemen et al. [36] was used but the disperse phase fraction was increased to 30%. Matching refractive index were applied to enable the measurements with the µPIV. Velocity measurements in front and in the orifice were conducted with and without disperse phase. No influence on the velocity field with increasing disperse phase fraction was detected. However, the differences from Håkansson et al. [33] were measured after the gap, so further experiments after the orifice are necessary to confirm the results from [33].

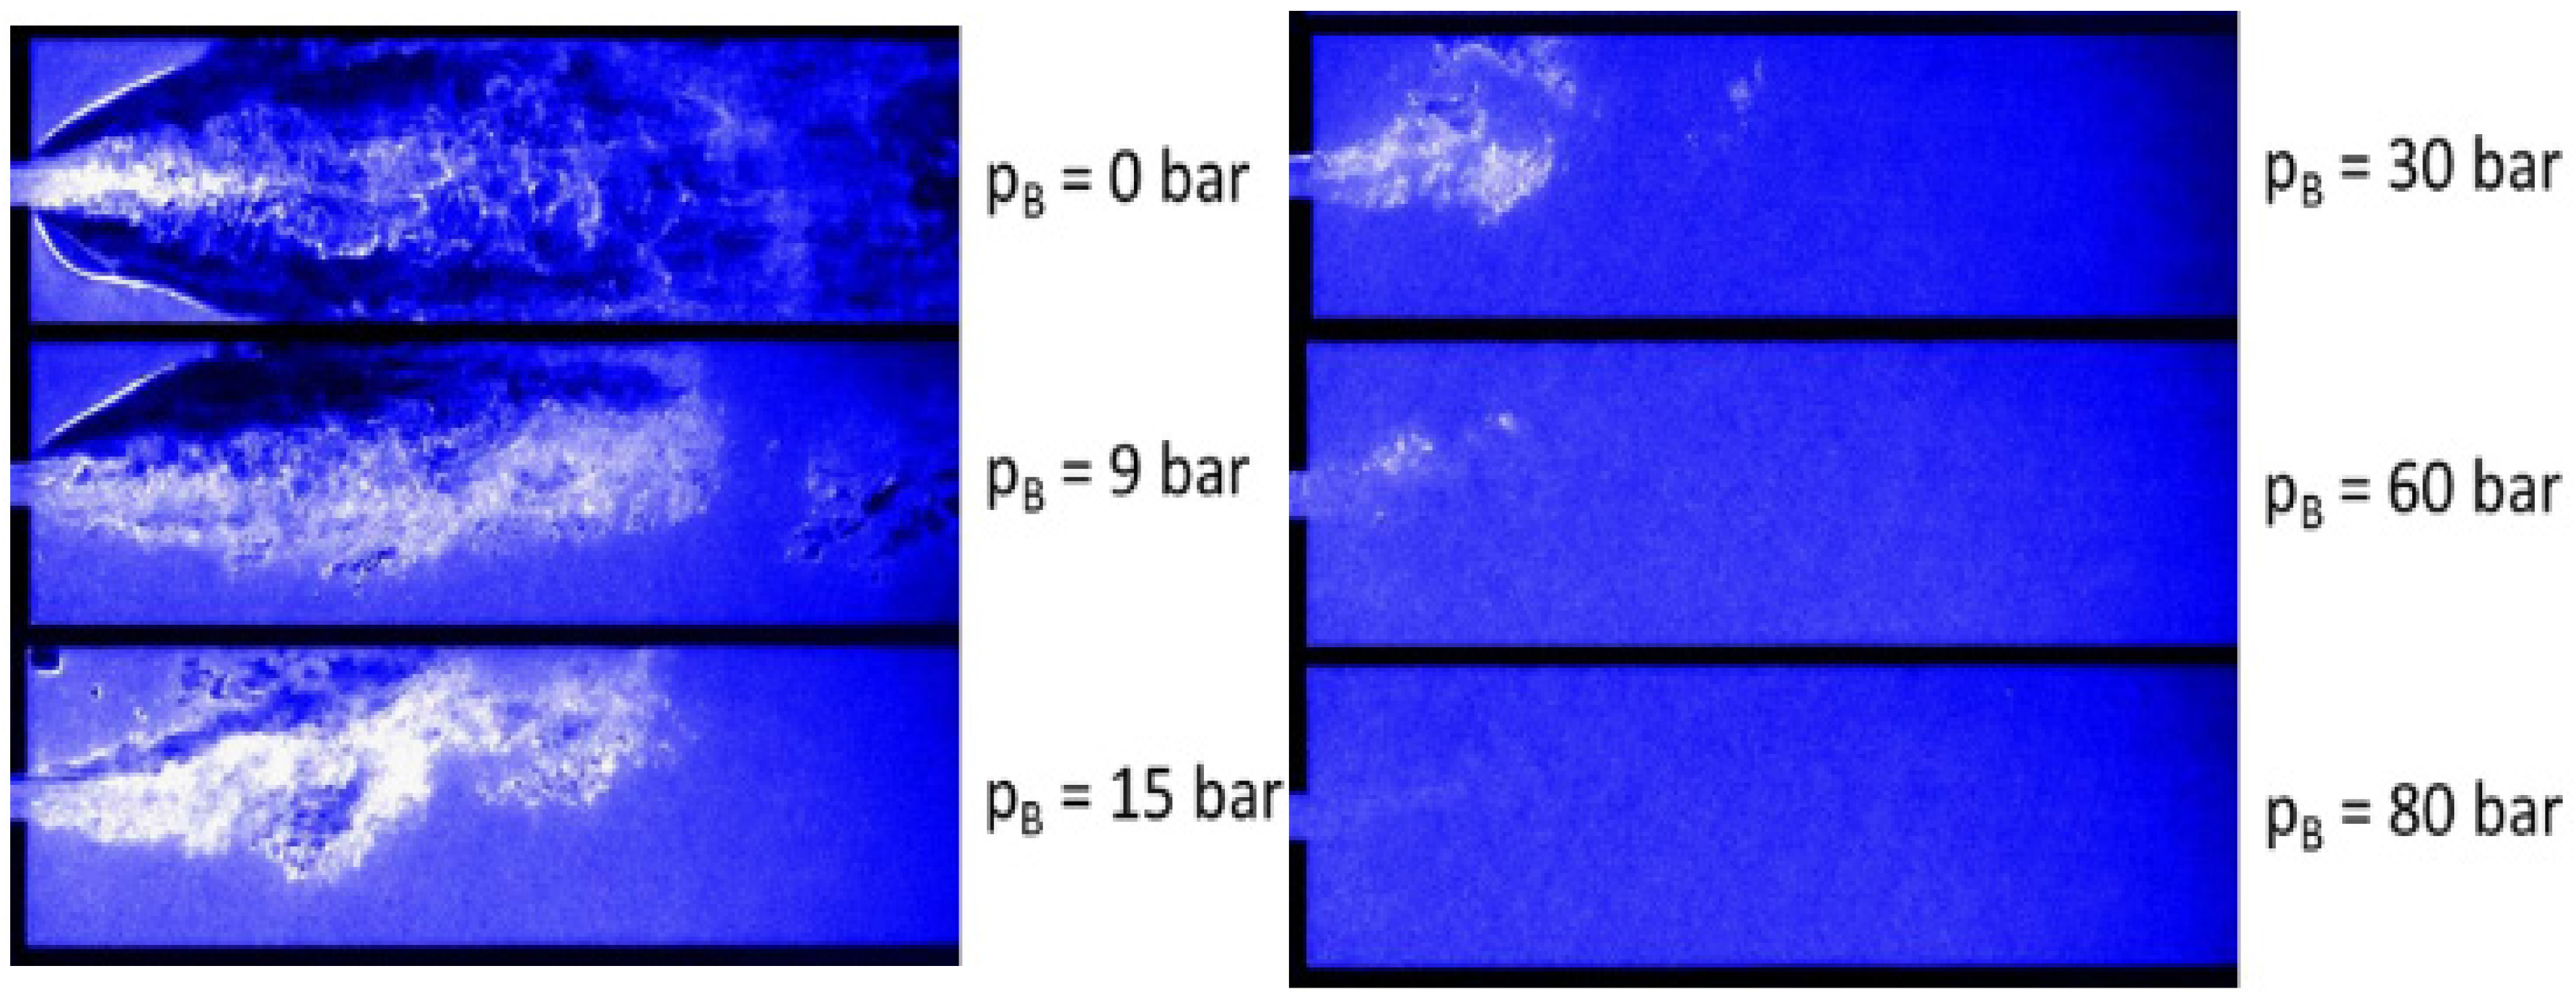
3.4. Visualisation of Cavitation during the HPH Process

At certain process conditions, like high pressure drops over the disruption unit, cavitation can occur. The measurements techniques described above suppressed cavitation through applying back-pressure. This was necessary, because cavitation would interfere with the optical measurements. As cavitation occurs in almost every high-pressure homogenisation process, the influence of cavitation on droplet deformation and break-up is a research topic of interest. Therefore, also optical measurement methods to characterize the cavitation during the HPH process are developed.
Schlender et al. [39,40,41] analysed cavitation behind a cylindrical orifice with different measurement methods. They used shadow graphic imaging, acoustic measurements [40] and sono-chemiluminescence (SCL) [41]. The measurements were conducted in the optical accessible outlet channel of the orifice. Dimensionless numbers, like the Thoma number, disperse phase concentration, and surfactant concentration were varied. The Thoma number Th describes the ratio between applied back-pressure pbp and inlet pressure pin.
A comparison between the results from SCL and shadow graphic images for different inlet pressures and no back-pressure is shown in Figure 7. On the left hand, the images from SCL have a higher luminosity at increasing inlet pressures. A region of high luminosity can mean either that more events happen in this region or that the intensity of the events is higher. On the right hand, the shadow graphic images show an increasing gas content with increasing inlet pressure. With both methods, the shape of a jet after the orifice can be seen at all three pressure drops. Similar behaviour for the shape of the cavitation can be seen in the SCL and shadow graphic images at the two upper images. However, at the highest pressure drop the shape of the jet is shorter and the background luminosity is higher, whereas the gas content on the right side increased considerably. This would mean, that the gas bubbles lead to a higher refraction of the light and therefore the background luminosity increases.
The SCL method was used to identify cavitation intensities and a dimensionless SCL intensity number was developed to compare the results. Without back-pressure the SCL intensity increased steadily with increasing inlet pressure. Applying back-pressure lead to a further increase of the SCL intensity until at a certain Thoma number a maximum was reached and the SCL intensity decreased afterwards significantly. This behaviour corresponds well with the shadow graphic images, where the visualized gas bubbles decrease with higher Thoma numbers, until they vanish at the highest SCL intensity.
With SCL the location of the collapse of cavitation bubbles could be determined. The collapse was concentrated in the region close to the orifice exit. There, according to current findings [26,36,90] the droplet break-up in high pressure devices takes place. Emulsification experiments were conducted at the same process conditions. The droplet size had a minimum where the highest cavitation intensity, not only with SCL but also with the acoustic method, was found. This confirms the assumption that the potential stresses, which result from the collapse of cavitation bubbles, influence droplet deformation. The measurement techniques, however, do not allow for a mechanistic study on the detailed influence of the collapse on droplet break-up.
A different method was applied by Håkansson et al. [38], using a model of a flat valve, similar to that described in Figure 4A. The scattering of laser light was used to indicate cavitation. It was implied that the increase of scattering originates from different reflection of liquid and vapour. Here, the scattering intensity increased inside of the gap with increasing pressures at constant back-pressure. In addition, at increasing back-pressure with constant pressure difference, the scattering decreased inside of the gap. The position of the measured cavitation corresponds well with static pressure profiles reported in the literature [4,22,91,92,93,94,95]. They also found a pressure minimum close to the inlet of the gap, which would lead to cavitation.
Analysing cavitation patterns using µPIV technique was described by Gothsch et al. [42]. The measurements were conducted in a high-pressure microsystem (HPMS) as it was presented above (see Figure 5B). There, laser induced fluorescence was used to investigate the local distribution of vapour and liquid. The results for increasing back-pressure at a constant pressure drop of Δp = 200 bar are shown in Figure 8. If no back-pressure is applied, a white jet (clouds of small vapour bubbles) leaves the orifice and enters into a vapour filled channel. This behaviour corresponds well with the jet of gas bubbles from the shadow graphic images from Schlender et al. [39]. Further increasing back-pressure led to a reduction of vapour until, at a back-pressure of pB = 80 bar, no vapour exists outside of the orifice. Inside of the orifice, vapour still exists until a back-pressure of pB = 175 bar. The authors also measured resulting droplet sizes. Contrary to the results of Schlender et al. [39,40], the DSD did not reach a minimum but stayed constant after a certain back-pressure. Cavitation is still visible when the constant droplet size is reached. Gothsch et al. concluded that the increase in droplet size, which was measured from other authors [21,40,90,96,97,98], came from the simultaneous decrease of energy input through the variation of the pressure difference.
Nevertheless, the most recent studies [40,41,42] concluded that cavitation leads to no improvement of the emulsification result. However, the explanations are contradictory and, therefore, cavitation during the HPH process is still a relevant research topic for further investigations.

4. Summary

Homogenisation is a widely-used process operation in industry to produce emulsions. However, the mechanisms that lead to droplet break-up are still not understood in detail. This hinders a targeted design of process units and impedes their scale-up. In addition, predicting droplet size distributions of homogenized emulsions is still a challenge and based on experiment-derived equations.
Therefore, recent research focused on optical measurement methods that allow for a detailed understanding of the flow pattern as well as the mechanisms of droplet break-up during the high-pressure homogenisation process. Recent developments in camera and computer techniques allowed for visualization of flow and droplet behaviour in high-pressure homogenisation units. Studies illuminated flow fields, droplet deformation and cavitation in different scaled disruption units. In Table 2, the advantages and limitations of the reviewed measurement methods, according to the author, are summarized.
High speed image processing was used to visualise the deformation and break-up of droplets in simple orifices. A more detailed understanding of the flow pattern and the resulting droplet deformation was achieved by using particle image velocimetry in scaled-up models of flat valve geometries. However, the inability to scale up time scales correctly leads to the investigation of the high-pressure homogenisation process in original scales. In these orifices, local stresses have been calculated and could be correlated to visualised droplet deformations. Additionally, cavitation patterns were investigated with different measurement methods, like shadowgraphy, sono-chemiluminescence and micro-particle image velocimetry. The results showed that cavitation hinders an effective droplet break-up and therefore needs to be suppressed during the high-pressure homogenisation.
Particle image velocimetry and micro-particle image velocimetry are optical measurement systems of high potential for investigating the high-pressure homogenisation processes in more detail. Even when process conditions applied to date were in the lower range of those used in industrial processes, the results lead to a better understanding of the high-pressure homogenisation process. However, they also showed some inconsistencies. Some of them may originate from the different disruption unit geometries and properties of the emulsions used in the experiments. To understand the origin of these inconsistencies a combination of particle image velocimetry and micro-particle image velocimetry measurements at geometrical similar geometries should be performed. Based on these results a deeper understanding of the scale up of the HDH process can be achieved, which is still a highly discussed topic in research [99]. Further investigations should therefore focus on high-quality measurements which are based on the same framework conditions to ensure comparability.

Acknowledgments

The work has been carried out with financial support of the German Research Foundation (DFG) within the research project SCHU 1417/11-1.

Author Contributions

A.B. and H.P.S. wrote the paper.

Conflicts of Interest

The authors declare no conflict of interest.

Abbreviations

The following abbreviations are used in this manuscript:
HPHHigh-pressure homogenisation
DSDDroplet size distribution
HSIPHigh-speed image processing
PIVParticle image velocimetry
TITurbulent inertial
TVTurbulent viscous
SCLSono-chemiluminescence
SGShadowgraphy
HPSMHigh-pressure microsystems

References

  1. Clausse, M.; Becher, P. Encyclopedia of Emulsion Technology, Volume 1; Becher, P., Ed.; Marcel Dekker Inc.: New York, NY, USA; Basel, Switzerland, 1983. [Google Scholar]
  2. Karbstein, H. Untersuchungen zum Herstellen und Stabilisieren von Öl-in-Wasser-Emulsionen. Ph.D. Thesis, Universität Karlsruhe (TH), Karlsruhe, Germany, 1994. [Google Scholar]
  3. Carter, C.; Robins, M.M. Homogenisation of oil-in-water emulsions: Effect of pressure and composition on droplet size distribution. Trans. IChemE 1991, 69, 127–133. [Google Scholar]
  4. Phipps, L.W. Homogenizing valve design and its influence on milk fat globule dispersion II. High rate of flow. J. Dairy Res. 1982, 49, 317–322. [Google Scholar] [CrossRef]
  5. Walstra, P.; Smulders, P.E.A. Emulsion Formation. In Modern Aspects of Emulsion Science; Binks, B.P., Ed.; Royal Society of Chemistry: London, UK, 1998; pp. 56–99. [Google Scholar]
  6. Cook, E.J. Method of Forming a Microemulsion; Biotechnology Development Corporation: Newton, MA, USA, 1990. [Google Scholar]
  7. Cook, E.J.; Lagace, A.P. Apparatus for Forming Emulsions; Biotechnology Development Corporation: Newton Upper Falls, MA, USA, 1985. [Google Scholar]
  8. Klinksiek, B.; Schleenstein, D.; Hovestadt, W.; Vom Felde, M. Verstellbarer Strahldispergator zur Herstellung Wässriger 2-Komponeten-Polyurethanloack-Emulsionen; Bayer Ag: Leverkusen, Germany, 1999. [Google Scholar]
  9. Aguilar, F.; Köhler, K.; Schubert, H.; Schuchmann, H.P. Herstellen von Emulsionen in einfachen und modifizierten Lochblenden: Einfluss der Geometrie auf die Effizienz der Zerkleinerung und Folgen für die Maßstabsvergrößerung. Chem. Ing. Tech. 2008, 80, 607–613. [Google Scholar] [CrossRef]
  10. Cavallo, J.L. Formulation Considerations in Emulsion Preparations and Stability. In Food Emulsions and Foams: Theory and Practice; Wan, P.J., Barfod, N.M., Eds.; American Institute of Chemical Engineers: New York, NY, USA, 1990; pp. 16–24. [Google Scholar]
  11. Chanana, G.D. Particle size reduction of emulsions by formulation design II: Effect of oil and surfactant concentration. PDA J. Pharm. Sci. Technol. 1995, 49, 71–76. [Google Scholar] [PubMed]
  12. Williams, P.A. Food Emulsions: Principles, Practice and Techniques; McClements, D.J., Ed.; CRC Press: Boca Raton, FL, USA; London, UK; New York, NY, USA; Washington, DC, USA, 2005. [Google Scholar]
  13. Tesch, S.; Freudig, B.; Schubert, H. Production of emulsions in high-pressure homogenizers—Part I: Disruption and stabilization of droplets. Chem. Eng. Technol. 2003, 26, 569–573. [Google Scholar] [CrossRef]
  14. Rumscheidt, F.D.; Mason, S.G. Particle motions in sheared suspensions. XII. Deformation and burst of fluid drops in shear and hyperbolic flow. J. Colloid Sci. 1961, 16, 238–261. [Google Scholar] [CrossRef]
  15. Tomotika, S. On the instability of a cylindrical thread of a viscous liquid surrounded by another viscous fluid. Proc. R. Soc. Lond. Ser. A 1935, 150, 322–337. [Google Scholar] [CrossRef]
  16. Bentley, B.J.; Leal, L.G. An experimental investigation of drop deformation and breakup in steady, two-dimensional linear flows. J. Fluid Mech. 1986, 167, 241. [Google Scholar] [CrossRef]
  17. Floury, J.; Bellettre, J.; Legrand, J.; Desrumaux, A. Analysis of a new type of high pressure homogeniser. A study of the flow pattern. Chem. Eng. Sci. 2004, 59, 843–853. [Google Scholar] [CrossRef]
  18. Tesch, S.; Schubert, H. Droplet deformation and disruption during the emulsification in a high-pressure homogenizer with an orifice valve. Chem. Ing. Tech. 2001, 73, 693. [Google Scholar] [CrossRef]
  19. Treiber, A.; Kiefer, P. Kavitation und Turbulenz als Zerkleinerungsmechanismen bei der Homogenisation von O/W-Emulsionen. Chem. Ing. Tech. 1976, 48, 259. [Google Scholar] [CrossRef]
  20. Mohr, K.H. High-pressure Homogenization. Part I. Liquid-liquid dispersion in turbulence fields of high energy density. J. Food Eng. 1987, 6, 177–186. [Google Scholar] [CrossRef]
  21. Freudig, B.; Tesch, S.; Schubert, H. Production of emulsions in high-pressure homogenizers—Part II: Influence of cavitation on droplet breakup. Eng. Life Sci. 2003, 6, 266–270. [Google Scholar] [CrossRef]
  22. Kurzhals, H.A.; Reuter, H. Untersuchungen über die physikalisch-technischen Vorgänge beim Homogenisieren von Milch in Hochdruck-Homogenisiermaschinen. Chem. Ing. Tech. 1979, 51, 325. [Google Scholar] [CrossRef]
  23. Grob, M. Homogenisation von Milch und Milchkonzentraten mit einer Lavaldüse. Ph.D. Thesis, ETH Zürich, Zürich, Switzerland, 1982. [Google Scholar]
  24. Budde, C.; Schaffner, D.; Walzel, P. Drop breakup in liquid-liquid dispersions at an orifice plate observed in a large-scale model. Chem. Eng. Technol. 2002, 25, 1164–1167. [Google Scholar] [CrossRef]
  25. Kolb, G.; Wagner, G.; Ulrich, J. Untersuchungen zum Aufbruch von Einzeltropfen in Dispergiereinheiten zur Emulsionsherstellung. Chem. Ing. Tech. 2001, 73, 80–83. [Google Scholar] [CrossRef]
  26. Kolb, G.E. Zur Emulsionsherstellung in Blendensystemen. Ph.D. Thesis, Universität Bremen, Bremen, Germany, 2001. [Google Scholar]
  27. Galinat, S.; Masbernat, O.; Guiraud, P.; Dalmazzone, C.; Noik, C. Drop break-up in turbulent pipe flow downstream of a restriction. Chem. Eng. Sci. 2005, 60, 6511–6528. [Google Scholar] [CrossRef]
  28. Innings, F.; Tragardh, C. Visualization of the drop deformation and break-up process in a high pressure homogenizer. Chem. Eng. Technol. 2005, 28, 882–891. [Google Scholar] [CrossRef]
  29. Innings, F.; Tragardh, C. Analysis of the flow field in a high-pressure homogenizer. Exp. Therm. Fluid Sci. 2007, 32, 345–354. [Google Scholar] [CrossRef]
  30. Innings, F.; Fuchs, L.; Tragardh, C. Theoretical and experimental analyses of drop deformation and break-up in a scale model of a high-pressure homogenizer. J. Food Eng. 2011, 103, 21–28. [Google Scholar] [CrossRef]
  31. Håkansson, A.; Fuchs, L.; Innings, F.; Revstedt, J.; Tragardh, C.; Bergenstahl, B. High resolution experimental measurement of turbulent flow field in a high pressure homogenizer model and its implications on turbulent drop fragmentation. Chem. Eng. Sci. 2011, 66, 1790–1801. [Google Scholar] [CrossRef]
  32. Håkansson, A.; Fuchs, L.; Innings, F.; Revstedt, J.; Trägårdh, C.; Bergenståhl, B. On flow-fields in a high pressure homogenizer and its implication on drop fragmentation. Procedia Food Sci. 2011, 1, 1353–1358. [Google Scholar] [CrossRef]
  33. Håkansson, A.; Fuchs, L.; Innings, F.; Revstedt, J.; Trägårdh, C.; Bergenståhl, B. Velocity measurements of turbulent two-phase flow in a high-pressure homogenizer model. Chem. Eng. Commun. 2013, 200, 93–114. [Google Scholar] [CrossRef]
  34. Gothsch, T.; Schilcher, C.; Richter, C.; Beinert, S.; Dietzel, A.; Büttgenbach, S.; Kwade, A. High-pressure microfluidic systems (HPMS): Flow and cavitation measurements in supported silicon microsystems. Microfluid. Nanofluid. 2014. [Google Scholar] [CrossRef]
  35. Kelemen, K.; Crowther, F.E.; Cierpka, C.; Hecht, L.L.; Kähler, C.J.; Schuchmann, H.P. Investigations on the characterization of laminar and transitional flow conditions after high pressure homogenization orifices. Microfluid. Nanofluid. 2014, 18, 599–612. [Google Scholar] [CrossRef]
  36. Kelemen, K.; Gepperth, S.; Koch, R.; Bauer, H.-J.; Schuchmann, H.P. On the visualization of droplet deformation and breakup during high-pressure homogenization. Microfluid. Nanofluid. 2015, 19, 1139–1158. [Google Scholar] [CrossRef]
  37. Kollhoff, R.T.; Kelemen, K.; Schuchmann, H.P. Local Multiphase Flow Characterization with Micro Particle Image Velocimetry Using Refractive Index Matching. Chem. Eng. Technol. 2015, 38, 1774–1782. [Google Scholar] [CrossRef]
  38. Håkansson, A.; Fuchs, L.; Innings, F.; Revstedt, J.; Bergenstahl, B.; Tragardh, C. Visual observations and acoustic measurements of cavitation in an experimental model of a high-pressure homogenizer. J. Food Eng. 2010, 100, 504–513. [Google Scholar] [CrossRef]
  39. Schlender, M.; Spengler, A.; Schuchmann, H.P. High-pressure emulsion formation in cylindrical coaxial orifices: Influence of cavitation induced pattern on oil drop size. Int. J. Multiph. Flow 2015, 74, 84–95. [Google Scholar] [CrossRef]
  40. Schlender, M.; Minke, K.; Spiegel, B.; Schuchmann, H.P. High-pressure double stage homogenization processes: Influences of plant setup on oil droplet size. Chem. Eng. Sci. 2015, 131, 162–171. [Google Scholar] [CrossRef]
  41. Schlender, M.; Minke, K.; Schuchmann, H.P. Sono-chemiluminescence (SCL) in a high-pressure double stage homogenization processes. Chem. Eng. Sci. 2016, 142, 1–11. [Google Scholar] [CrossRef]
  42. Gothsch, T.; Richter, C.; Beinert, S.; Schilcher, C.; Schilde, C.; Büttgenbach, S.; Kwade, A. Effect of cavitation on dispersion and emulsification process in high-pressure microsystems (HPMS). Chem. Eng. Sci. 2016, 144, 239–248. [Google Scholar] [CrossRef]
  43. Tcholakova, S.; Denkov, N.D.; Danner, T. Role of surfactant type and concentration for the mean drop size during emulsification in turbulent flow. Langmuir 2004, 20, 7444–7458. [Google Scholar] [CrossRef] [PubMed]
  44. Walstra, P. Emulsions. In Fundamentals of Interface and Colloid Science: Soft Colloids; Lyklema, J., Ed.; Academic Press: Cambridge, MA, USA, 2005. [Google Scholar]
  45. Lemenand, T.; Dupont, P.; Della Valle, D.; Peerhossaini, H. Comparative efficiency of shear, elongation and turbulent droplet breakup mechanisms: Review and application. Chem. Eng. Res. Des. 2013, 91, 2587–2600. [Google Scholar] [CrossRef] [Green Version]
  46. Håkansson, A. Experimental methods for measuring coalescence during emulsification—A critical review. J. Food Eng. 2016, 47–59. [Google Scholar] [CrossRef]
  47. Dickinson, E. Interfacial interactions and the stability of oil-in-water emulsions. Pure Appl. Chem. 1992, 64, 1721–1724. [Google Scholar] [CrossRef]
  48. Sjöblom, J. Emulsions and Emulsion Stability; Taylor & Francis: Boca Raton, FL, USA, 1996. [Google Scholar]
  49. Vankova, N.; Tcholakova, S.; Denkov, N.D.; Ivanov, I.B.; Vulchev, V.D.; Danner, T. Emulsification in turbulent flow, 1. Mean and maximum drop diameters in inertial and viscous regimes. J. Colloid Interface Sci. 2007, 312, 363–380. [Google Scholar] [CrossRef] [PubMed]
  50. Danner, T.; Schubert, H. Coalescence Processes in Emulsions. In Food Colloids: Fundamentals of Formulation; Dickinson, E., Miller, R., Eds.; The Royal Society of Chemistry: London, UK, 2001; pp. 116–124. [Google Scholar]
  51. Grace, H.P. Dispersion phenomena in high-viscosity immiscible fluid systems and application of static mixers as dispersion devices in such systems. Chem. Eng. Commun. 1982, 14, 225–277. [Google Scholar] [CrossRef]
  52. Rumscheidt, F.D.; Mason, S.G. Particle motions in sheared suspensions XI. Internal circulation in fluid droplets (experimental). J. Colloid Sci. 1961, 16, 210–237. [Google Scholar] [CrossRef]
  53. Windhab, E.J.; Dressler, M.; Feigl, K.; Fischer, P.; Megias-Alguacil, D. Emulsion processing-from single-drop deformation to design of complex processes and products. Chem. Eng. Sci. 2005, 60, 2101–2113. [Google Scholar] [CrossRef]
  54. Erni, P.; Fischer, P.; Windhab, E.J. Deformation of single emulsion drops covered with a viscoelastic adsorbed protein layer in simple shear flow. Appl. Phys. Lett. 2005, 87, 244104. [Google Scholar] [CrossRef]
  55. Kaufmann, S.F.M.; Feigl, K.; Fischer, P.; Windhab, E.J. Investigation and Visualization of Droplet Deformation and Breakup in Complex Laminar Flow Fields; International Symposium on Food Rheology & Structure: Montpellier, France, 2006. [Google Scholar]
  56. Megias-Alguacil, D.; Feigl, K.; Dressler, M.; Fischer, P.; Windhab, E.J. Droplet deformation under simple shear investigated by experiment, numerical simulation and modelling. J. Non-Newton. Fluid Mech. 2004, 153–161. [Google Scholar]
  57. Stone, H.A.; Bentley, B.J.; Leal, L.G. An experimental-study of transient effects in the breakup of viscous drops. J. Fluid Mech. 1986, 173, 131–158. [Google Scholar] [CrossRef]
  58. Innings, F.; Hamberg, L.; Tragardh, C. Dynamic modelling of the deformation of a drop in a four-roll mill. Chem. Eng. Sci. 2005, 60, 4771–4779. [Google Scholar] [CrossRef]
  59. Feigl, K.; Kaufmann, S.F.M.; Fischer, P.; Windhab, E.J. A numerical procedure for calculating droplet deformation in dispersing flows and experimental verification. Chem. Eng. Sci. 2002, 58, 2351–2363. [Google Scholar] [CrossRef]
  60. Feigl, K.; Megias-Alguacil, D.; Fischer, P.; Windhab, E.J. Simulation and experiments of droplet deformation and orientation in simple shear flow with surfactants. Chem. Eng. Sci. 2007, 62, 3242–3258. [Google Scholar] [CrossRef]
  61. Becker, P.J.; Puel, F.; Dubbelboer, A.; Janssen, J.; Sheibat-Othman, N. Coupled population balance–CFD simulation of droplet breakup in a high pressure homogenizer. Comput. Chem. Eng. 2014, 68, 140–150. [Google Scholar] [CrossRef]
  62. Taylor, G.I. The formation of emulsions in definable fields of flow. Proc. R. Soc. Lond. Ser. A 1934, 146, 501–523. [Google Scholar] [CrossRef]
  63. Kolmogorov, A.N. Über die Zerstäubung von Tropfen in einer turbulenten Strömung. In Sammelband zur Statistischen Theorie der Turbulenz: Übersetzt Abgedruckt; Goering, H., Ed.; Akademie-Verlag: Berlin, Germany, 1958; p. 825. [Google Scholar]
  64. Hinze, J.O. Fundamentals of the hydrodynamic mechanism of splitting in dispersion processes. AIChE J. 1955, 1, 289–295. [Google Scholar] [CrossRef]
  65. Liao, Y.X.; Lucas, D. A literature review of theoretical models for drop and bubble breakup in turbulent dispersions. Chem. Eng. Sci. 2009, 64, 3389–3406. [Google Scholar] [CrossRef]
  66. Pickering, C.J.D.; Halliwell, N.A. Laser speckle photography and particle image velocimetry: Photographic film noise. Appl. Opt. 1984, 23, 2961. [Google Scholar] [CrossRef] [PubMed]
  67. Adrian, R.J. Scattering particle characteristics and their effect on pulsed laser measurements of fluid flow: Speckle velocimetry vs particle image velocimetry. Appl. Opt. 1984, 23, 1690–1691. [Google Scholar] [CrossRef] [PubMed]
  68. Adrian, R.J.; Westerweel, J. Particle Image Velocimetry; Cambridge University Press: Cambridge, UK, 2011. [Google Scholar]
  69. Raffel, M.; Willert, C.E.; Wereley, S.T.; Kompenhans, J. Particle Image Velocimetry. A Practical Guide; Springer: Dordrecht, The Netherlands, 2007. [Google Scholar]
  70. Particle Image Velocimetry. New Developments and Recent Applications; Schröder, A.; Willert, C.E. (Eds.) Springer: Berlin, Germany, 2008.
  71. Adrian, R.J. Twenty years of particle image velocimetry. Exp. Fluids 2005, 39, 159–169. [Google Scholar] [CrossRef]
  72. Huang, H.T.; Fiedler, H.E.; Wang, J.J. Limitation and improvement of PIV. Exp. Fluids 1993, 15. [Google Scholar] [CrossRef]
  73. Kähler, C.J.; Scharnowski, S.; Cierpka, C. On the resolution limit of digital particle image velocimetry. Exp. Fluids 2012, 52, 1629–1639. [Google Scholar] [CrossRef]
  74. Kähler, C.J.; Scharnowski, S.; Cierpka, C. On the uncertainty of digital PIV and PTV near walls. Exp. Fluids 2012, 52, 1641–1656. [Google Scholar] [CrossRef]
  75. Yoshida, H. The wide variety of possible applications of micro-thermofluid control. Microfluid. Nanofluid. 2005, 1, 289–300. [Google Scholar] [CrossRef]
  76. Santiago, J.G.; Wereley, S.T.; Meinhart, C.D.; Beebe, D.J.; Adrian, R.J. A particle image velocimetry system for microfluidics. Exp. Fluids 1998, 25, 316–319. [Google Scholar] [CrossRef]
  77. Meinhart, C.D.; Wereley, S.T.; Santiago, J.G. PIV measurements of a microchannel flow. Exp. Fluids 1999, 27, 414–419. [Google Scholar] [CrossRef]
  78. Koutsiaris, A.G.; Mathioulakis, D.S.; Tsangaris, S. Microscope PIV for velocity-field measurement of particle suspensions flowing inside glass capillaries. Meas. Sci. Technol. 1999, 10, 1037–1046. [Google Scholar] [CrossRef]
  79. Mielnik, M.M.; Saetran, L.R. Micro Particle Image velocimetry—An overview. Turbulence 2004, 10, 83–90. [Google Scholar]
  80. Lindken, R.; Rossi, M.; Grosse, S.; Westerweel, J. Micro-Particle Image Velocimetry (microPIV): Recent developments, applications, and guidelines. Lab Chip 2009, 9, 2551–2567. [Google Scholar] [CrossRef] [PubMed]
  81. Cierpka, C.; Rossi, M.; Segura, R.; Mastrangelo, F.; Kähler, C.J. A comparative analysis of the uncertainty of astigmatism-mu PTV, stereo-mu PIV, and mu PIV. Exp. Fluids 2012, 52, 605–615. [Google Scholar] [CrossRef]
  82. Chaves, H.; Eberle, A.; Hofemeier, P. Micro-PIV for high velocity flows. In Proceedings of the 15th Int Symposium on Applications of Laser Techniques to Fluid Mechanics, Lissabon, Portugal, 5–8 July 2010.
  83. Wereley, S.T.; Meinhart, C.D. Recent advances in micro-particle image velocimetry. Annu. Rev. Fluid Mech. 2010, 42, 557–576. [Google Scholar] [CrossRef]
  84. Settles, G.S. Schlieren and Shadowgraph Techniques. Visualizing Phenomena in Transparent Media; Springer: Berlin, Germany, 2001. [Google Scholar]
  85. Thiemann, A. Charakterisierung von Kavitationsblasenpopulationen. Ph.D. Thesis, Georg-August-Universität Göttingen, Göttingen, Germany, 2011. [Google Scholar]
  86. Rose, A.L.; Waite, T.D. Chemiluminescence of luminol in the presence of iron (ii) and oxygen: Oxidation mechanism and implications for its analytical use. Anal. Chem. 2001, 73, 5909–5920. [Google Scholar] [CrossRef] [PubMed]
  87. Innings, F. Drop Break-Up in High-Pressure Homogenisers. Ph.D. Thesis, Lund University, Faculty of Engineering, Lund, Sweden, 2005. [Google Scholar]
  88. Wieth, L.; Kelemen, K.; Braun, S.; Koch, R.; Bauer, H.-J.; Schuchmann, H.P. Smoothed Particle Hydrodynamics (SPH) simulation of a high-pressure homogenization process. Microfluid. Nanofluid. 2016, 20. [Google Scholar] [CrossRef]
  89. Kelemen, K. Inline-Messung des Tropfenaufbruchs in Hochdruckblenden: Möglichkeiten und Limitierungen der µPIV. Ph.D. Thesis, Karlsruher Institut für Technologie (KIT), Karlsruhe, Germany, 2014. [Google Scholar]
  90. Finke, J.H.; Niemann, S.; Richter, C.; Gothsch, T.; Kwade, A.; Büttgenbach, S.; Müller-Goymann, C.C. Multiple orifices in customized microsystem high-pressure emulsification: The impact of design and counter pressure on homogenization efficiency. Chem. Eng. J. 2014, 248, 107–121. [Google Scholar] [CrossRef]
  91. Loo, C.C.; Slatter, W.L.; Powell, R.W. A Study of the Cavitation Effect in the homogenization of dairy products 1, 2. J. Dairy Sci. 1950, 33, 692–702. [Google Scholar] [CrossRef]
  92. Kleinig, A.R.; Middelberg, A.P. The correlation of cell disruption with homogenizer valve pressure gradient determined by computational fluid dynamics. Chem. Eng. Sci. 1996, 51, 5103–5110. [Google Scholar] [CrossRef]
  93. Stevenson, M.J.; Chen, X.D. Visualization of the flow patterns in a high-pressure homogenizing valve using a CFD package. J. Food Eng. 1997, 33, 151–165. [Google Scholar] [CrossRef]
  94. Phipps, L.W. Cavitation and separated flow in a simple homogenizing valve and their influence on the break-up of fat globules in milk. J. Dairy Res. 1974, 41, 1–8. [Google Scholar] [CrossRef]
  95. Phipps, L.W. Some operating characteristics of a simple homogenizing poppet valve; pressure profiles and separation: Zone of fat globule dispersion. J. Dairy Res. 1974, 41, 339. [Google Scholar] [CrossRef]
  96. Mohr, K.H. High-pressure homogenization. Part II. The influence of cavitation on liquid-liquid dispersion in turbulence fields of high energy density. J. Food Eng. 1987, 6, 311–324. [Google Scholar] [CrossRef]
  97. Tesch, S.; Freudig, B.; Schubert, H. Herstellen von Emulsionen in Hochdruckhomogenisatoren—Teil 1: Zerkleinern und Stabilisieren von Tropfen. Chem. Ing. Tech. 2002, 74, 875–880. [Google Scholar] [CrossRef]
  98. Finke, J.H.; Schur, J.; Richter, C.; Gothsch, T.; Kwade, A.; Buttgenbach, S.; Muller-Goymann, C.C. The influence of customized geometries and process parameters on nanoemulsion and solid lipid nanoparticle production in microsystems. Chem. Eng. J. 2012, 209, 126–137. [Google Scholar] [CrossRef]
  99. Håkansson, A. Scale-down failed—Dissimilarities between high-pressure homogenizers of different scales due to failed mechanistic matching. J. Food Eng. 2017, 195, 31–39. [Google Scholar] [CrossRef]
Figure 1. Droplet deformation and break-up in a simple orifice: (A) the droplet “separation” into three daugther droplets at a Reynolds number of Re ≈ 1300; and (B) the “explosive droplet disruption” at a Reynolds number of Re ≈ 4500. Reproduced with the permission from [25]; Wiley, 2001.
Processes 04 00041 g001
Figure 2. (A) A sequence of droplet break-up at a constant Reynolds number of Re = 1570 from [24]: (A1) the droplet break-up at a viscosity ratio of λ = 0.13; and (A2) the droplet break-up at a viscosity ratio of λ = 6.3. Reproduced with the permission from [24]; Wiley, 2002. (B) The droplet break-up in an orifice at a constant viscosity ratio of λ = 0.55: (B1) the droplet break-up into two daughter droplets at a Reynolds number of Re = 6400; and (B2) the droplet break-up into several daughter droplets at a Reynolds number of Re = 8600. Reproduced with the permission from [27]; Elsevier, 2005.
Processes 04 00041 g002
Figure 3. (A) the vertical cross-section of the scaled model with the symmetrical outlet in dotted lines adapted from [87]; (B) the average velocity field of the jet using a symmetric outlet (dotted line in (A)); and (C) the average velocity field of the wall-attached jet using the asymmetric outlet. Reproduced with the permission from [87]; Lund Inst. of Technology, 2005.
Processes 04 00041 g003
Figure 4. Visualized droplet deformation:(A) flow structures which are larger than the droplet; (B) deformed droplets by flow structures that have the same or smaller scale than the droplet; and (C) droplets that are completely broken up; all images in the lower row were taken 1 ms after the droplets in the upper row. Reproduced with the permission from [87]; Lund Inst. of Technology, 2005.
Processes 04 00041 g004
Figure 5. (A) A schematic figure of the optical accessible orifice investigated adapted from [35]; and (B) a schematic figure of the used micro channel adapted from [34].
Processes 04 00041 g005
Figure 6. (A1) The flow parameter α (shear dominates the flow if α = 0, while α = 1 means that elongation is dominant in this area) at the entrance of the orifice. Reproduced with the permission from [35]; Elsevier, 2014. (A2,A3) The droplet deformation in front of the orifice for an emulsion with a visosity ratio of: λ = 2 (A2); and λ = 14 (A3). Reproduced with the permission from [89]; Dr. Hut, 2014. (B1) The velocity fluctuations for the axial component after the orifices from [35]. Reproduced with the permission from [35]; Elsevier, 2014. (B2,B3) The droplet deformation after the orifice for an emulsion with a viscosity ratio of: λ = 2 (B2); and λ = 14 (B3). Reproduced with the permission from [36]; Elsevier, 2015. All experiments were conducted at a Reynolds number of Re ≈ 1200.
Processes 04 00041 g006
Figure 7. Comparison between SCL images and visualized cavitation pattern via shadow graphic imaging at different inlet pressures pinlet. Experiments were conducted without back-pressure (poutlet = 1 bar). Reproduced with the permission from [41]; Elsevier, 2016.
Processes 04 00041 g007
Figure 8. Hydrodynamic cavitation images downstream of the HPMS orifice. The pressure difference was constant at Δp = 200 bar while the backpressure was increased. Dark blue corresponds to low fluorescent intensity and high vapour concentration, whereas white corresponds to high fluorescent intensity and the boundary between vapour and liquid. Light blue corresponds to the liquid. Reproduced with the permission from [42]; Elsevier, 2016.
Processes 04 00041 g008
Table 1. Overview of the reviewed studies that eithther investigated velocity fields, droplet break-up or cavitation during the high-pressure homogenisation processes with optical measurement methods.
First AuthorMeasuring MethodDisruption UnitScale-Up FactorViscosity RatioReynolds NumberHomogenisation Pressure 1Primary Droplet DiameterInvestigation
Budde [24]HSIPorifice250 20.13; 6.315700.088–0.112 bar3 mmDroplet deformation
Kolb [25,26]HSIPorifice50 26; 11; 301000–8000-2–3 mmDroplet deformation
Galinat [27]HSIPorifice5–10 20.554000–13,00088–1120 Pa2–3 mmDroplet deformation
Innings [28]PIVflat valve0.6; 2.7 3703000–6000-5–50 µm; 300 -350 µmDroplet deformation
Innings [29]PIVflat valve32 2-94000.003 bar-Flow pattern
Innings [30]PIVflat valve32 35.450000.65 bar5 µmDroplet deformation
Håkansson [31]PIVflat valve32 3-27,000--Flow pattern
Håkansson [32]PIVflat valve32 3-?30–80 bar230 µm 4Flow pattern
Håkansson [33]PIVflat valve32 3-2600-230 µm 4Flow pattern
Gothsch [34]µPIVHPMS--≈12,000100–500 bar-Flow pattern
Kelemen [35]µPIVorifice1 2-330; 128010–80 bar-Flow pattern
Kelemen [36]µPIVorifice1 22; 14285; 113010–80 bar40 µmDroplet deformation
Kollhoff [37]µPIVorifice1 22650010–13 bar37 µmFlow pattern
Håkansson [38]PIVflat valve0.4 3-5500100 bar-Cavitation
Schlender [39]SGorifice≈1 26318,000–62,00050–550 bar≈30 µmCavitation
Schlender [40]SGorifice≈1 263>20,00050–250 bar20 µmCavitation
Schlender [41]SCLorifice1 263-50–250 bar20 µmCavitation
Gothsch [34,42]µPIVHPMS-79.35590100–500 bar396 nmCavitation, flow pattern
1 Homogenisation pressure Δp based on the pressure drop over the disruption unit. 2 Scale-up factor is based on an orifice diameter of 200 µm. 3 Scale-up factor is based on a production homogenizer with a gap height of 150 µm. 4 Sauter mean diameter of silica particles used in these experiments.
Table 2. Advantages and limitations of the presented measurement techniques.
Measurement TechniqueAdvantagesLimitations
HSIPDroplet deformations and break-ups can be investigated Velocity profiles cannot be measured, local stresses cannot be calculated
PIVSuitable for investigations in larger dimensions, spatial resolution of droplets Accessibility for the laser sheet and the camera, time scales cannot be scaled correctly
µPIVOptical accessibility only from one side necessary, dimensions are close to original disruption unitsSpatial and temporal resolution limitations, small droplets cannot be visualised
SGGas bubbles can be visualised, area where cavitation takes place can be determined Flow changes through gas bubbles cannot be resolved, impact of collapse of gas bubbles cannot be determined
SCLIntensity of collapse of gas bubbles can be measuredGas bubbles are not visualised, velocity measurements impossible

