
Optimal Design for Reactivity Ratio Estimation: A Comparison of Techniques for AMPS/Acrylamide and AMPS/Acrylic Acid Copolymerizations


Abstract
:
1. Introduction
1.1. Copolymerization Kinetics
1.2. Reactivity Ratio Estimation
1.3. Design of Experiments
2. Experimental
2.1. Reagent Purification
2.2. Polymer Synthesis
2.3. Polymer Characterization
3. AMPS/AAm Copolymer
3.1. Literature Background for AMPS/AAm

| Ref. | Experimental | Estimation Technique | rAMPS | rAAm |
|---|---|---|---|---|
| [16] | --Type: Aqueous solution crosslinking copolymerization --Initiator: KPS --Temperature: 40 °C --pH = 7 --Composition: IR and EA | Comparison of feed and copolymer compositions (no statistical estimation) | 1.00 | 1.00 |
| [23] | --Type: Aqueous solution copolymerization --Initiator: KPS --Temperature: 50 °C --Composition: EA | Billmeyer * [24] Billmeyer * [24] Kelen-Tudos Average | 0.76 0.70 0.62 0.70 ± 0.08 | 1.00 1.06 1.21 1.10 ± 0.10 |
| [25] | --Type: Aqueous solution copolymerization --Initiator: KPS --Temperature: 35 °C and 55 °C --Composition: H-NMR and vibrational Raman spectroscopy | Fineman-Ross | 1.00 | 1.00 |
| [26] | --Type: Aqueous solution copolymerization --Initiator: KPS --Temperature: 30 °C --pH = 9 --Composition: IR and EA | Fineman-Ross Kelen-Tudos Integrated Mayo-Lewis | 0.49 ± 0.02 0.52 ± 0.07 0.50 ± 0.01 | 0.98 ± 0.09 1.00 ± 0.08 1.02 ± 0.01 |
| [27] | --Type: Aqueous solution copolymerization --Initiator: APS --Temperature: 60 °C --Composition: EA and C-NMR | Fineman-Ross Kelen-Tudos | 0.37 ± 0.04 0.42 ± 0.03 | 1.01 ± 0.01 1.05 ± 0.06 |
| [27] | --Type: Aqueous solution redox copolymerization --Initiator: APS/NaHSO3 --Temperature: 25 °C --Composition: C-NMR | Fineman-Ross Kelen-Tudos | 0.54 ± 0.03 0.51 ± 0.03 | 1.07 ± 0.01 1.05 ± 0.06 |
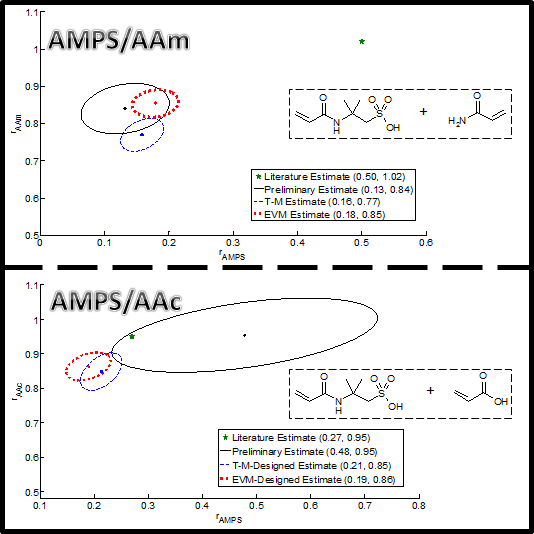
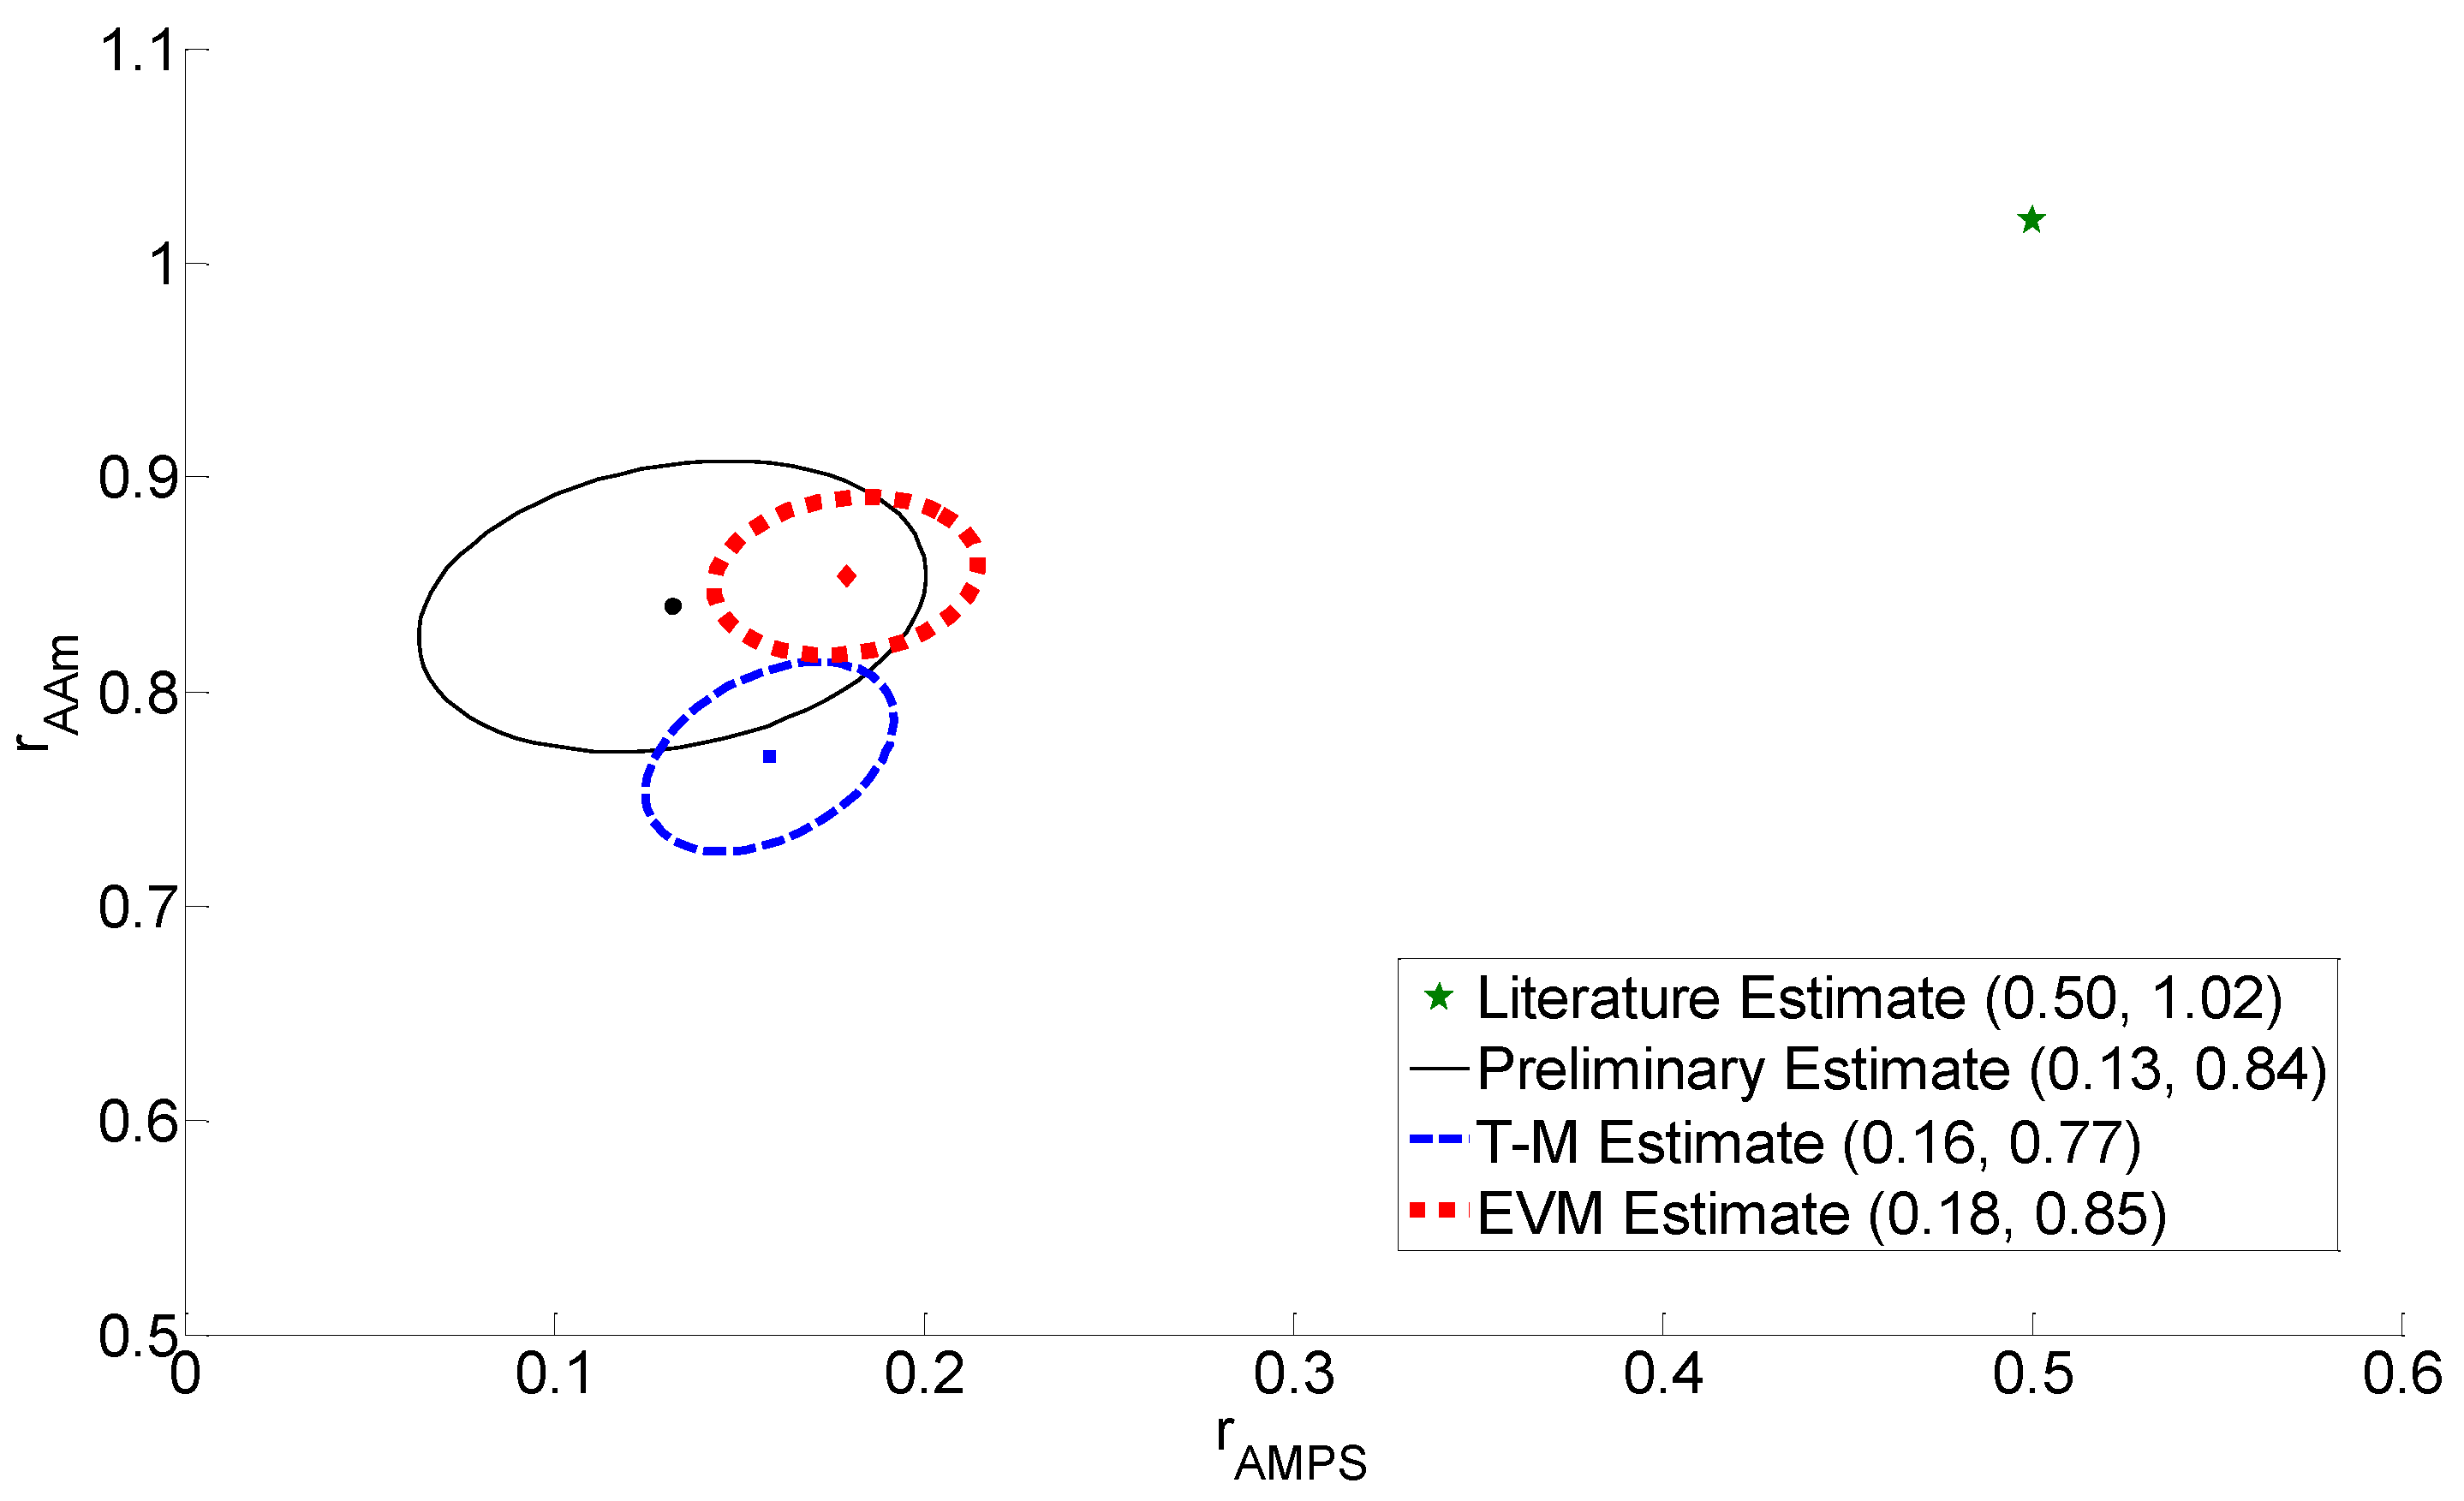
3.2. Design of Experiments for AMPS/AAm
| Approach | Reactivity Ratios for Design | Feed Compositions (Mole Fractions) | New Reactivity Ratio Estimates | |||
|---|---|---|---|---|---|---|
| rAMPS | rAAm | fAMPS,0,1 | fAMPS,0,2 | rAMPS | rAAm | |
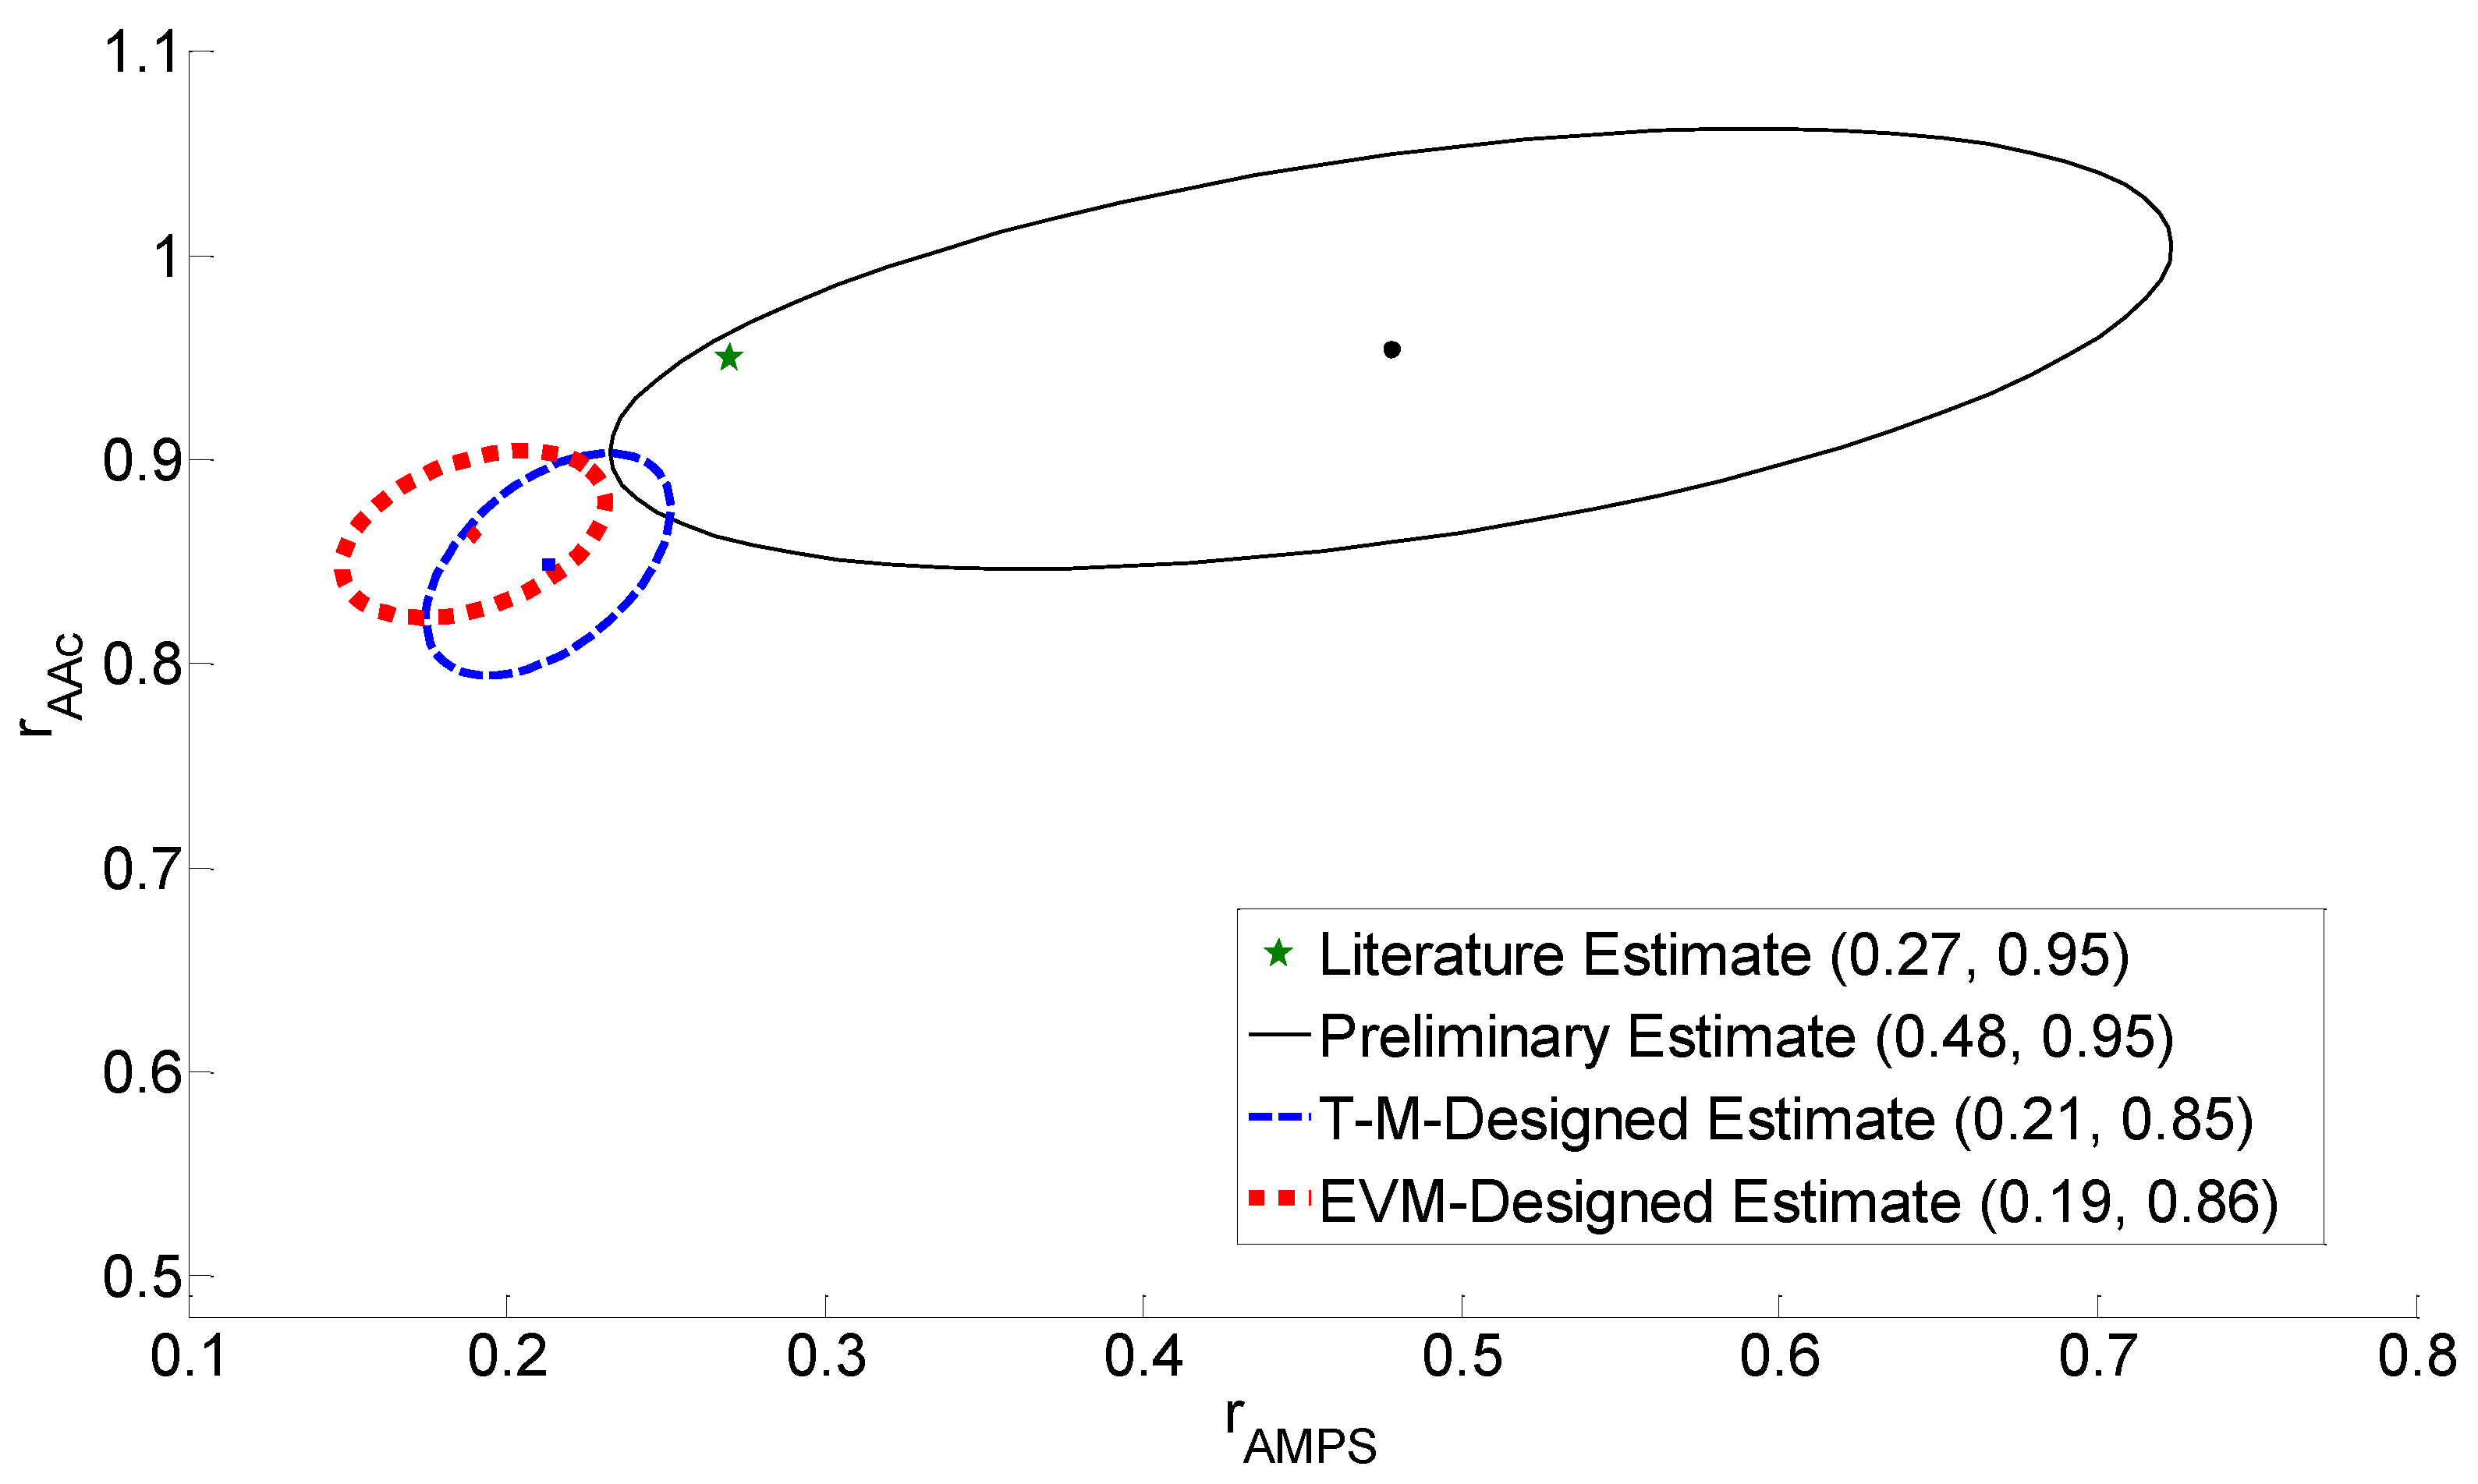
| Preliminary | 0.50 | 1.02 | 0.15 | 0.80 | 0.13 | 0.84 |
| T-M Design | 0.13 | 0.84 | 0.30 | 0.91 | 0.16 | 0.77 |
| EVM Design | 0.13 | 0.84 | 0.10 | 0.84 | 0.18 | 0.85 |
3.3. Reactivity Ratio Estimation
3.4. Discussion of Results
3.4.1. Cumulative Copolymer Composition
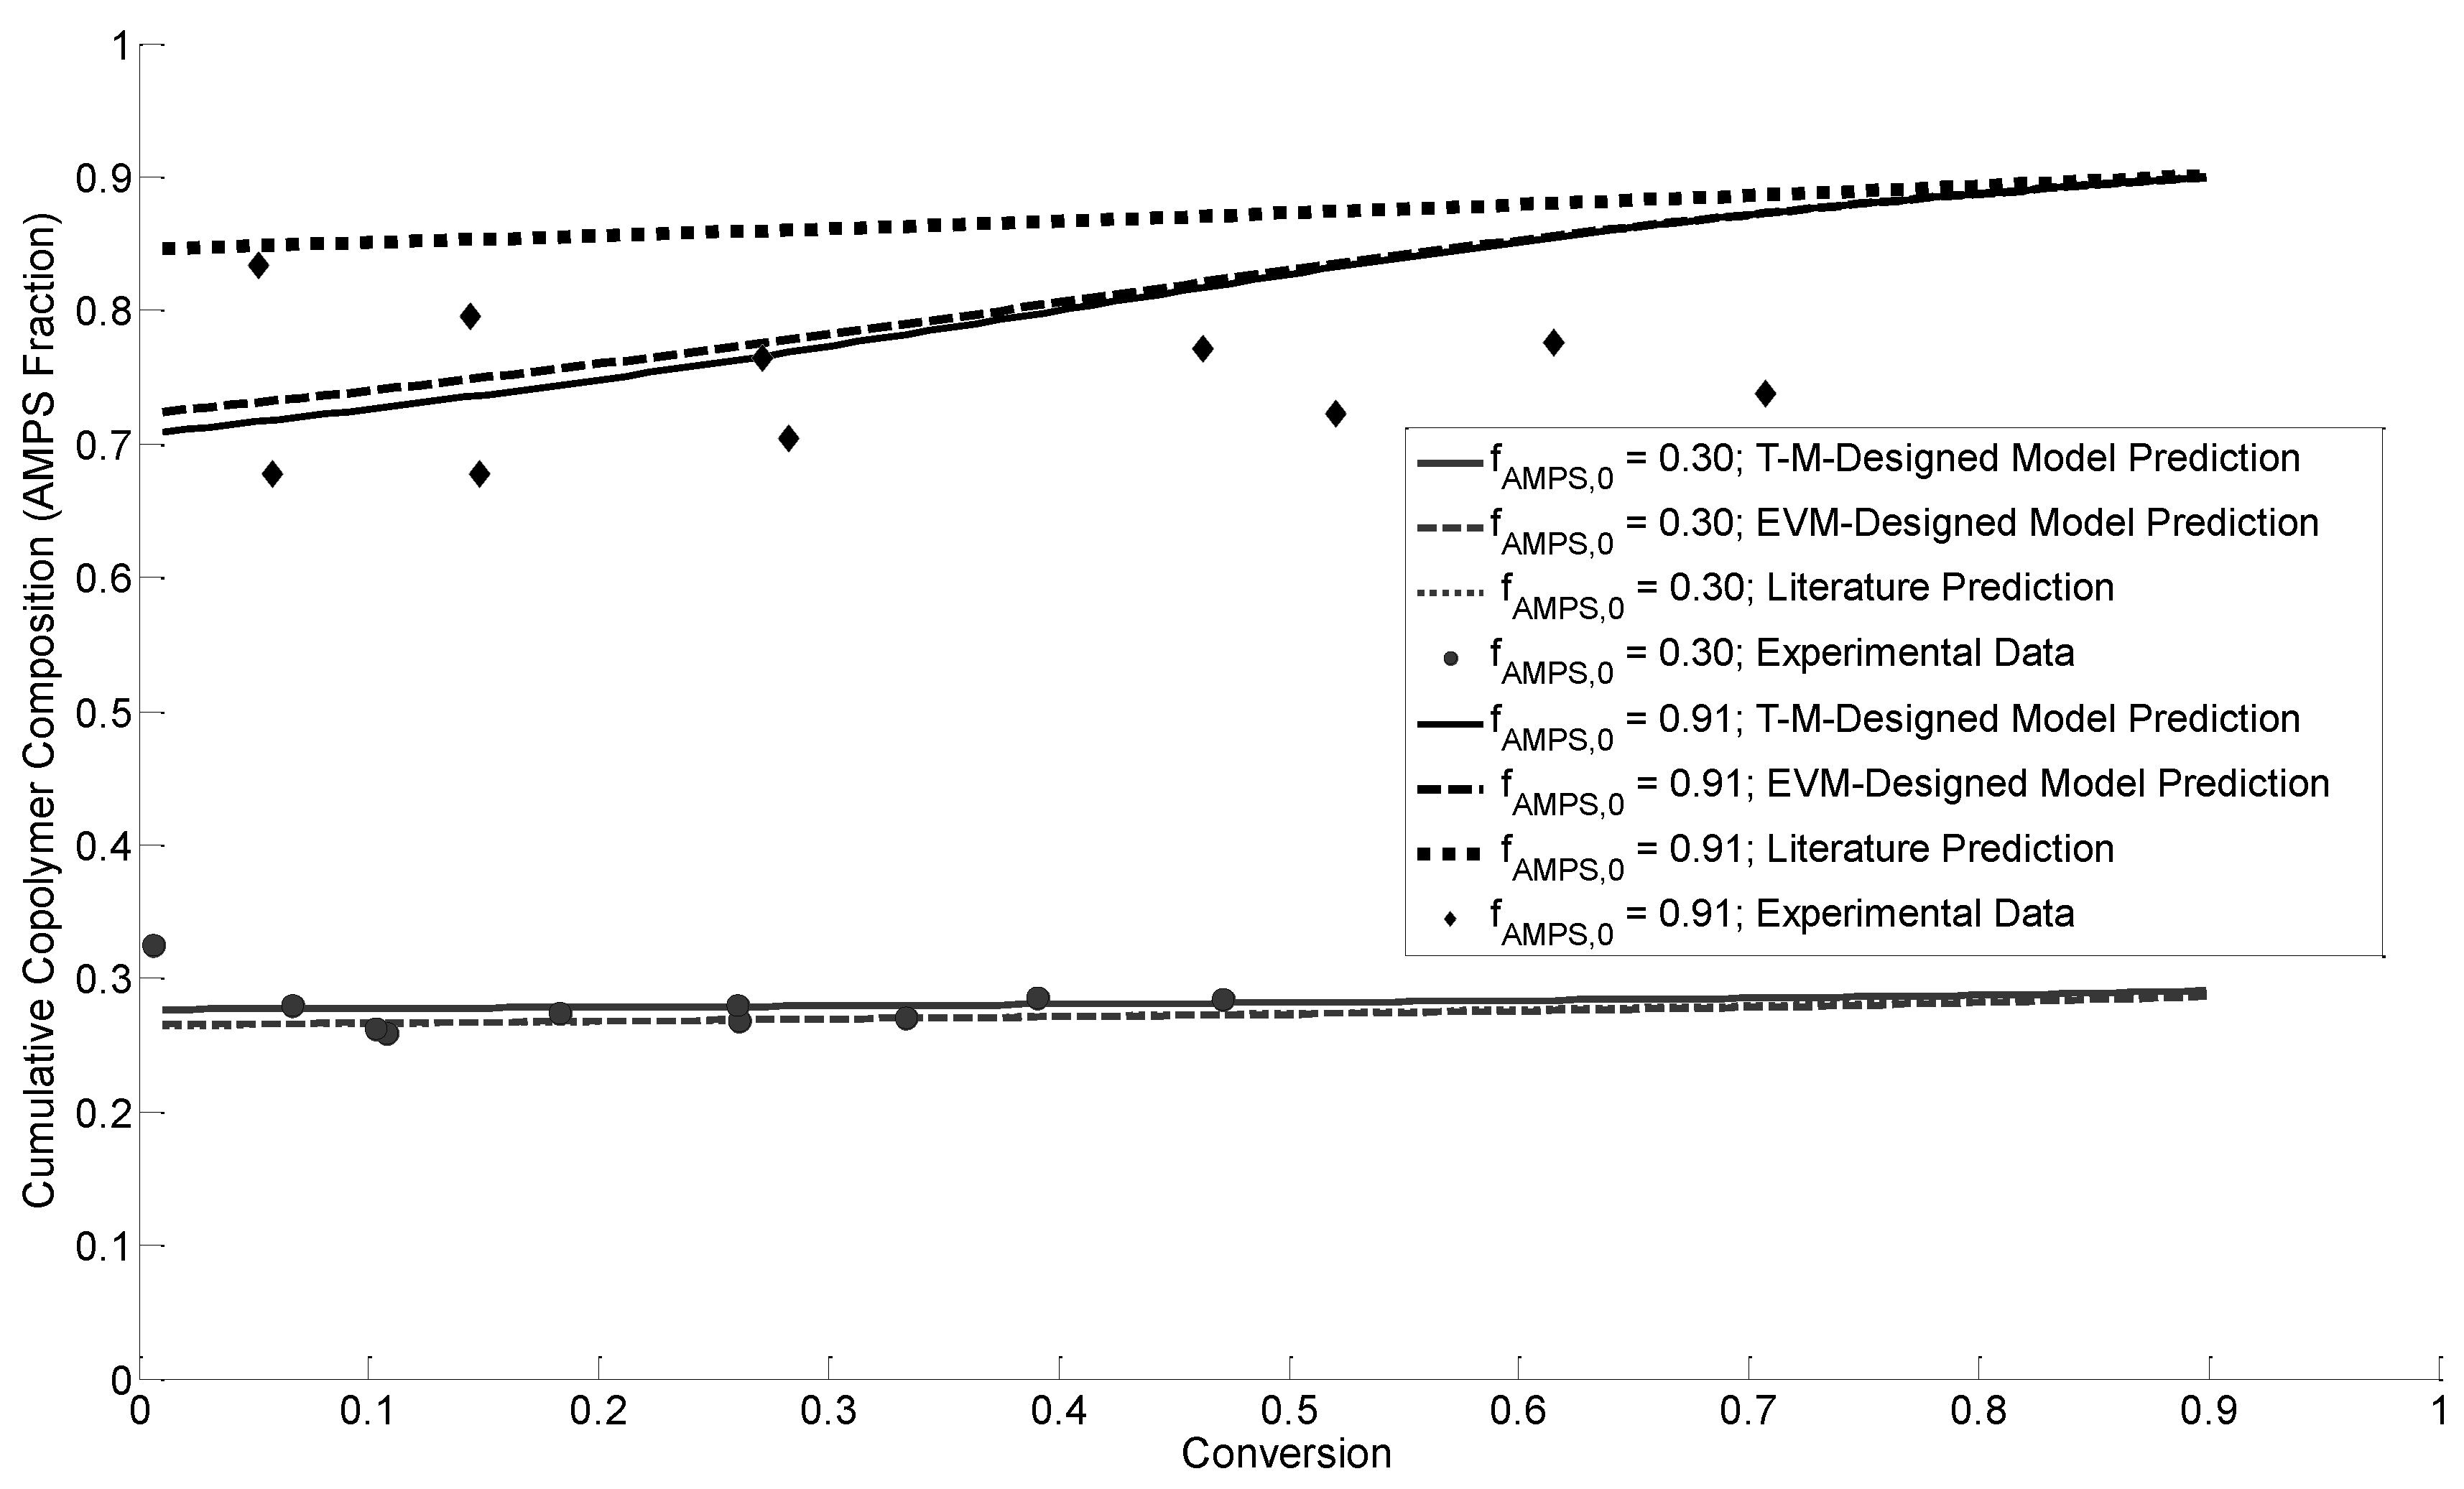
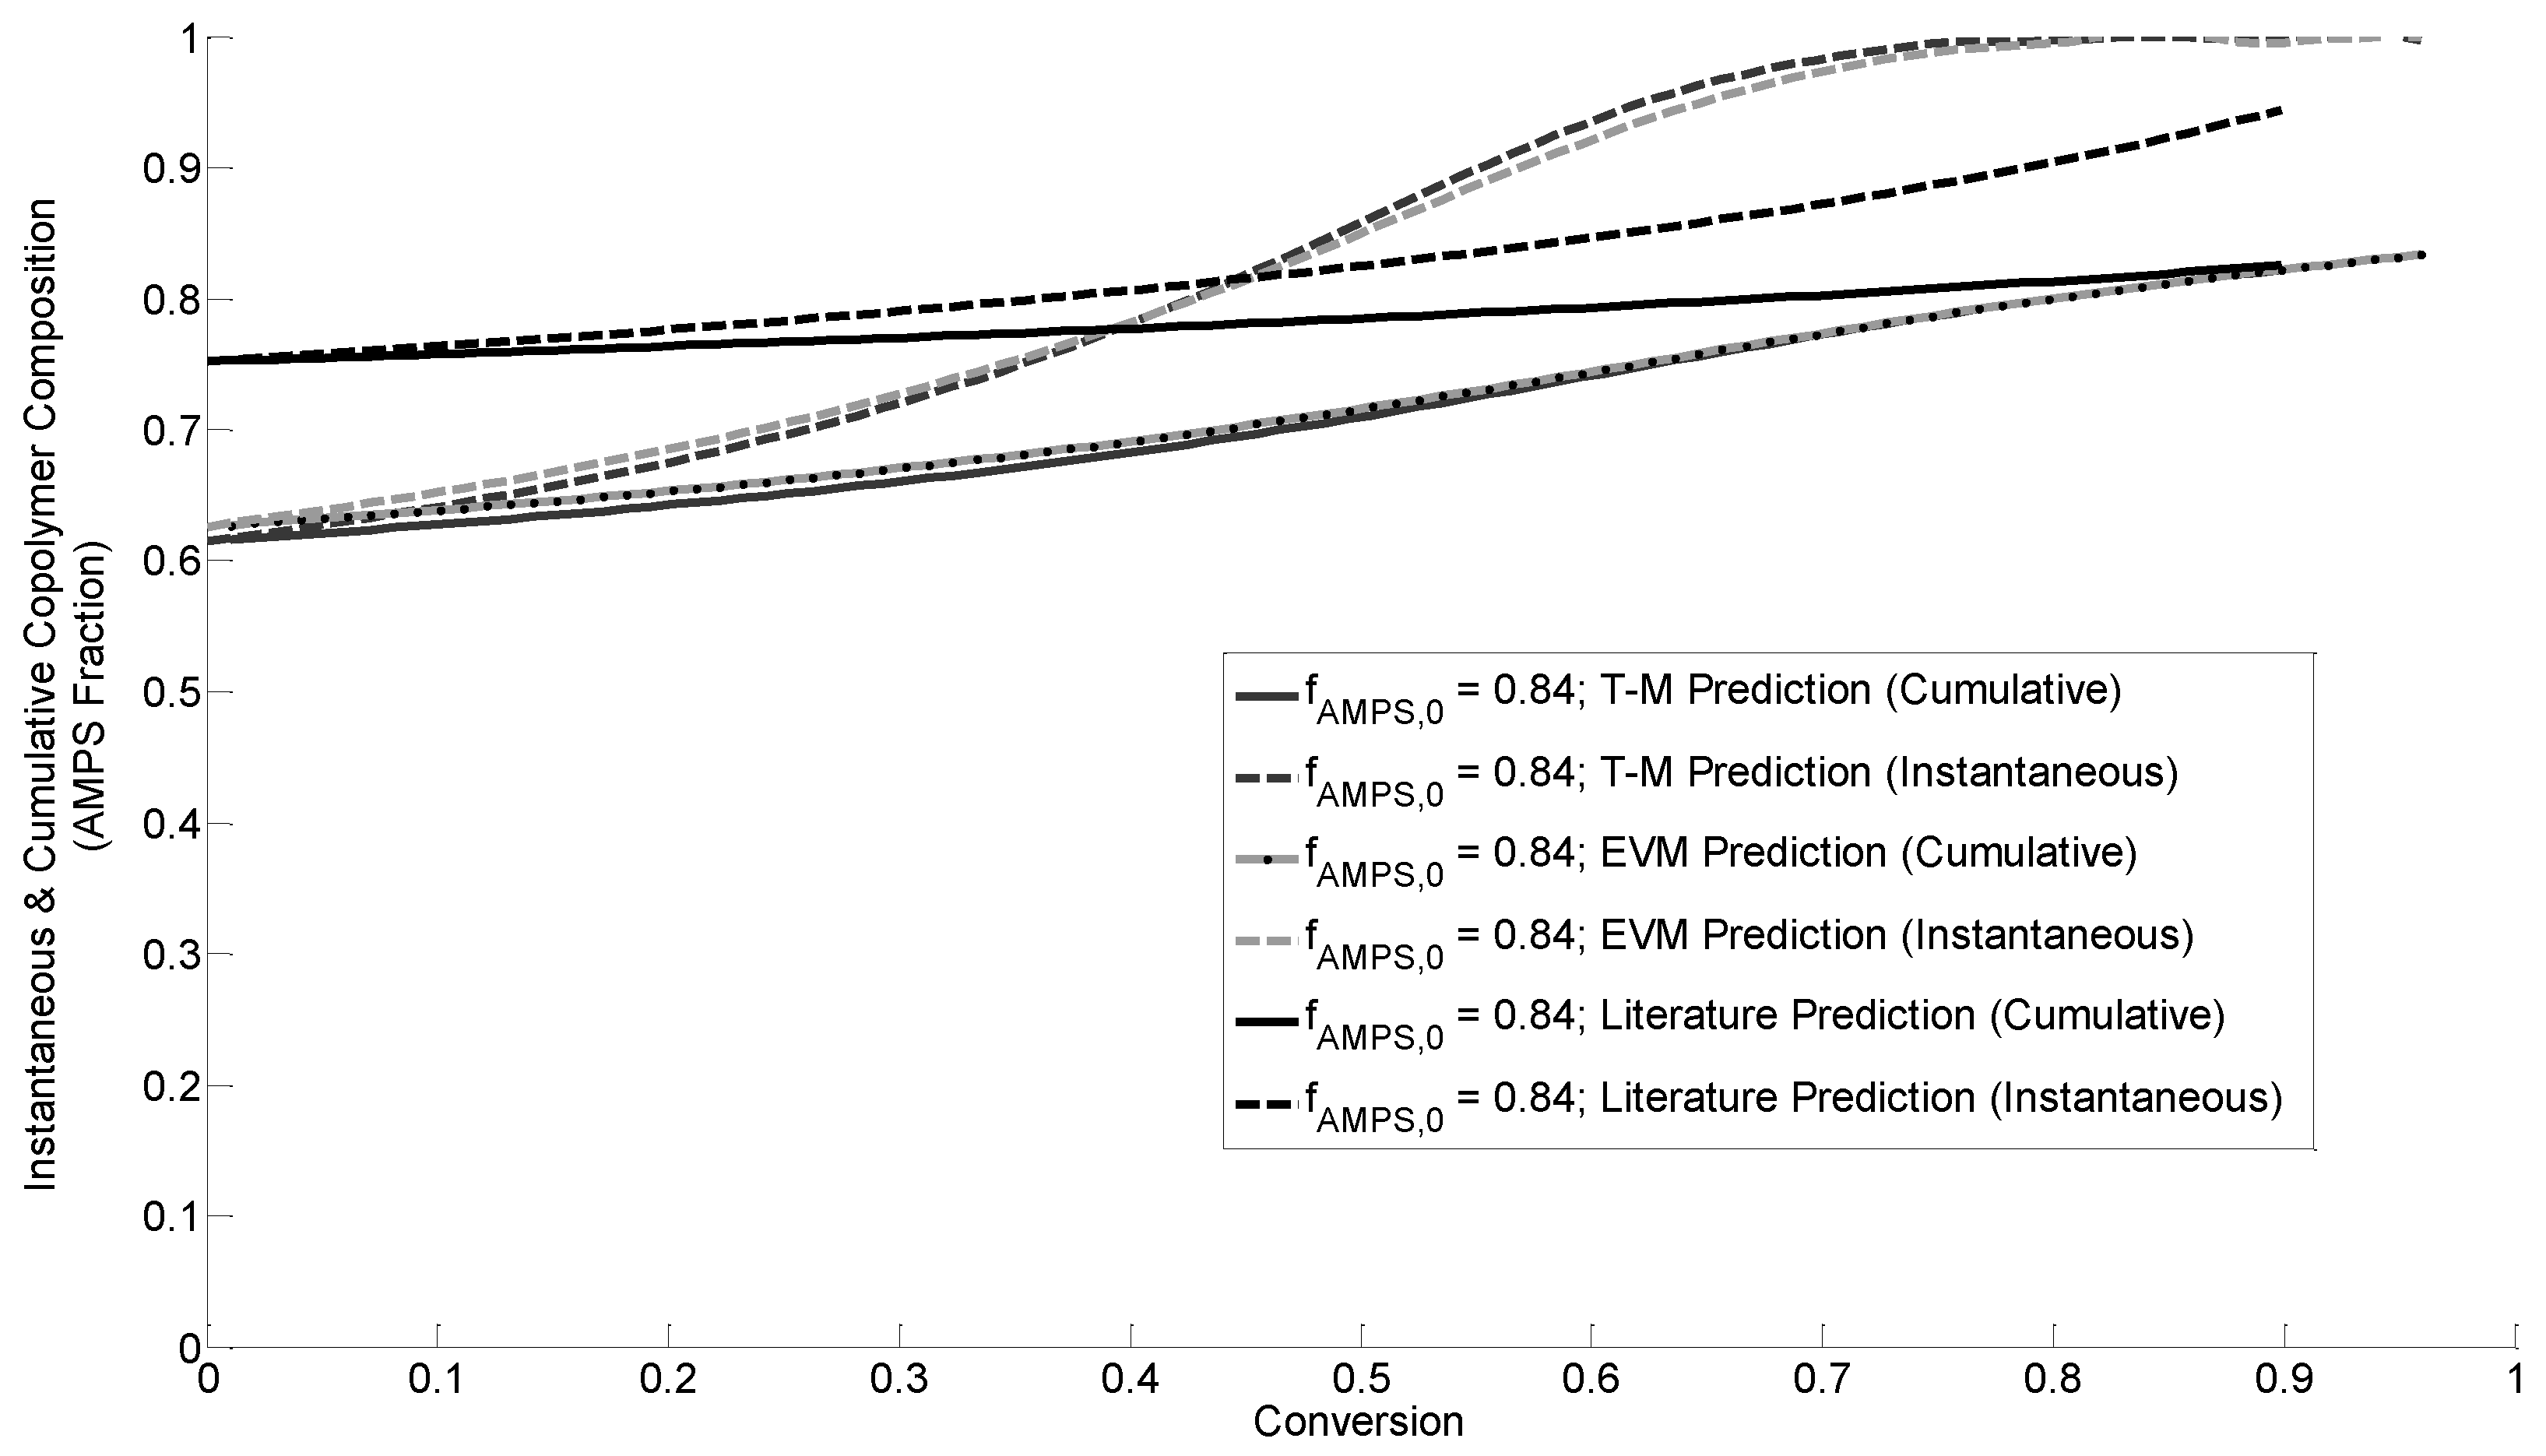
3.4.2. Instantaneous Copolymer Composition
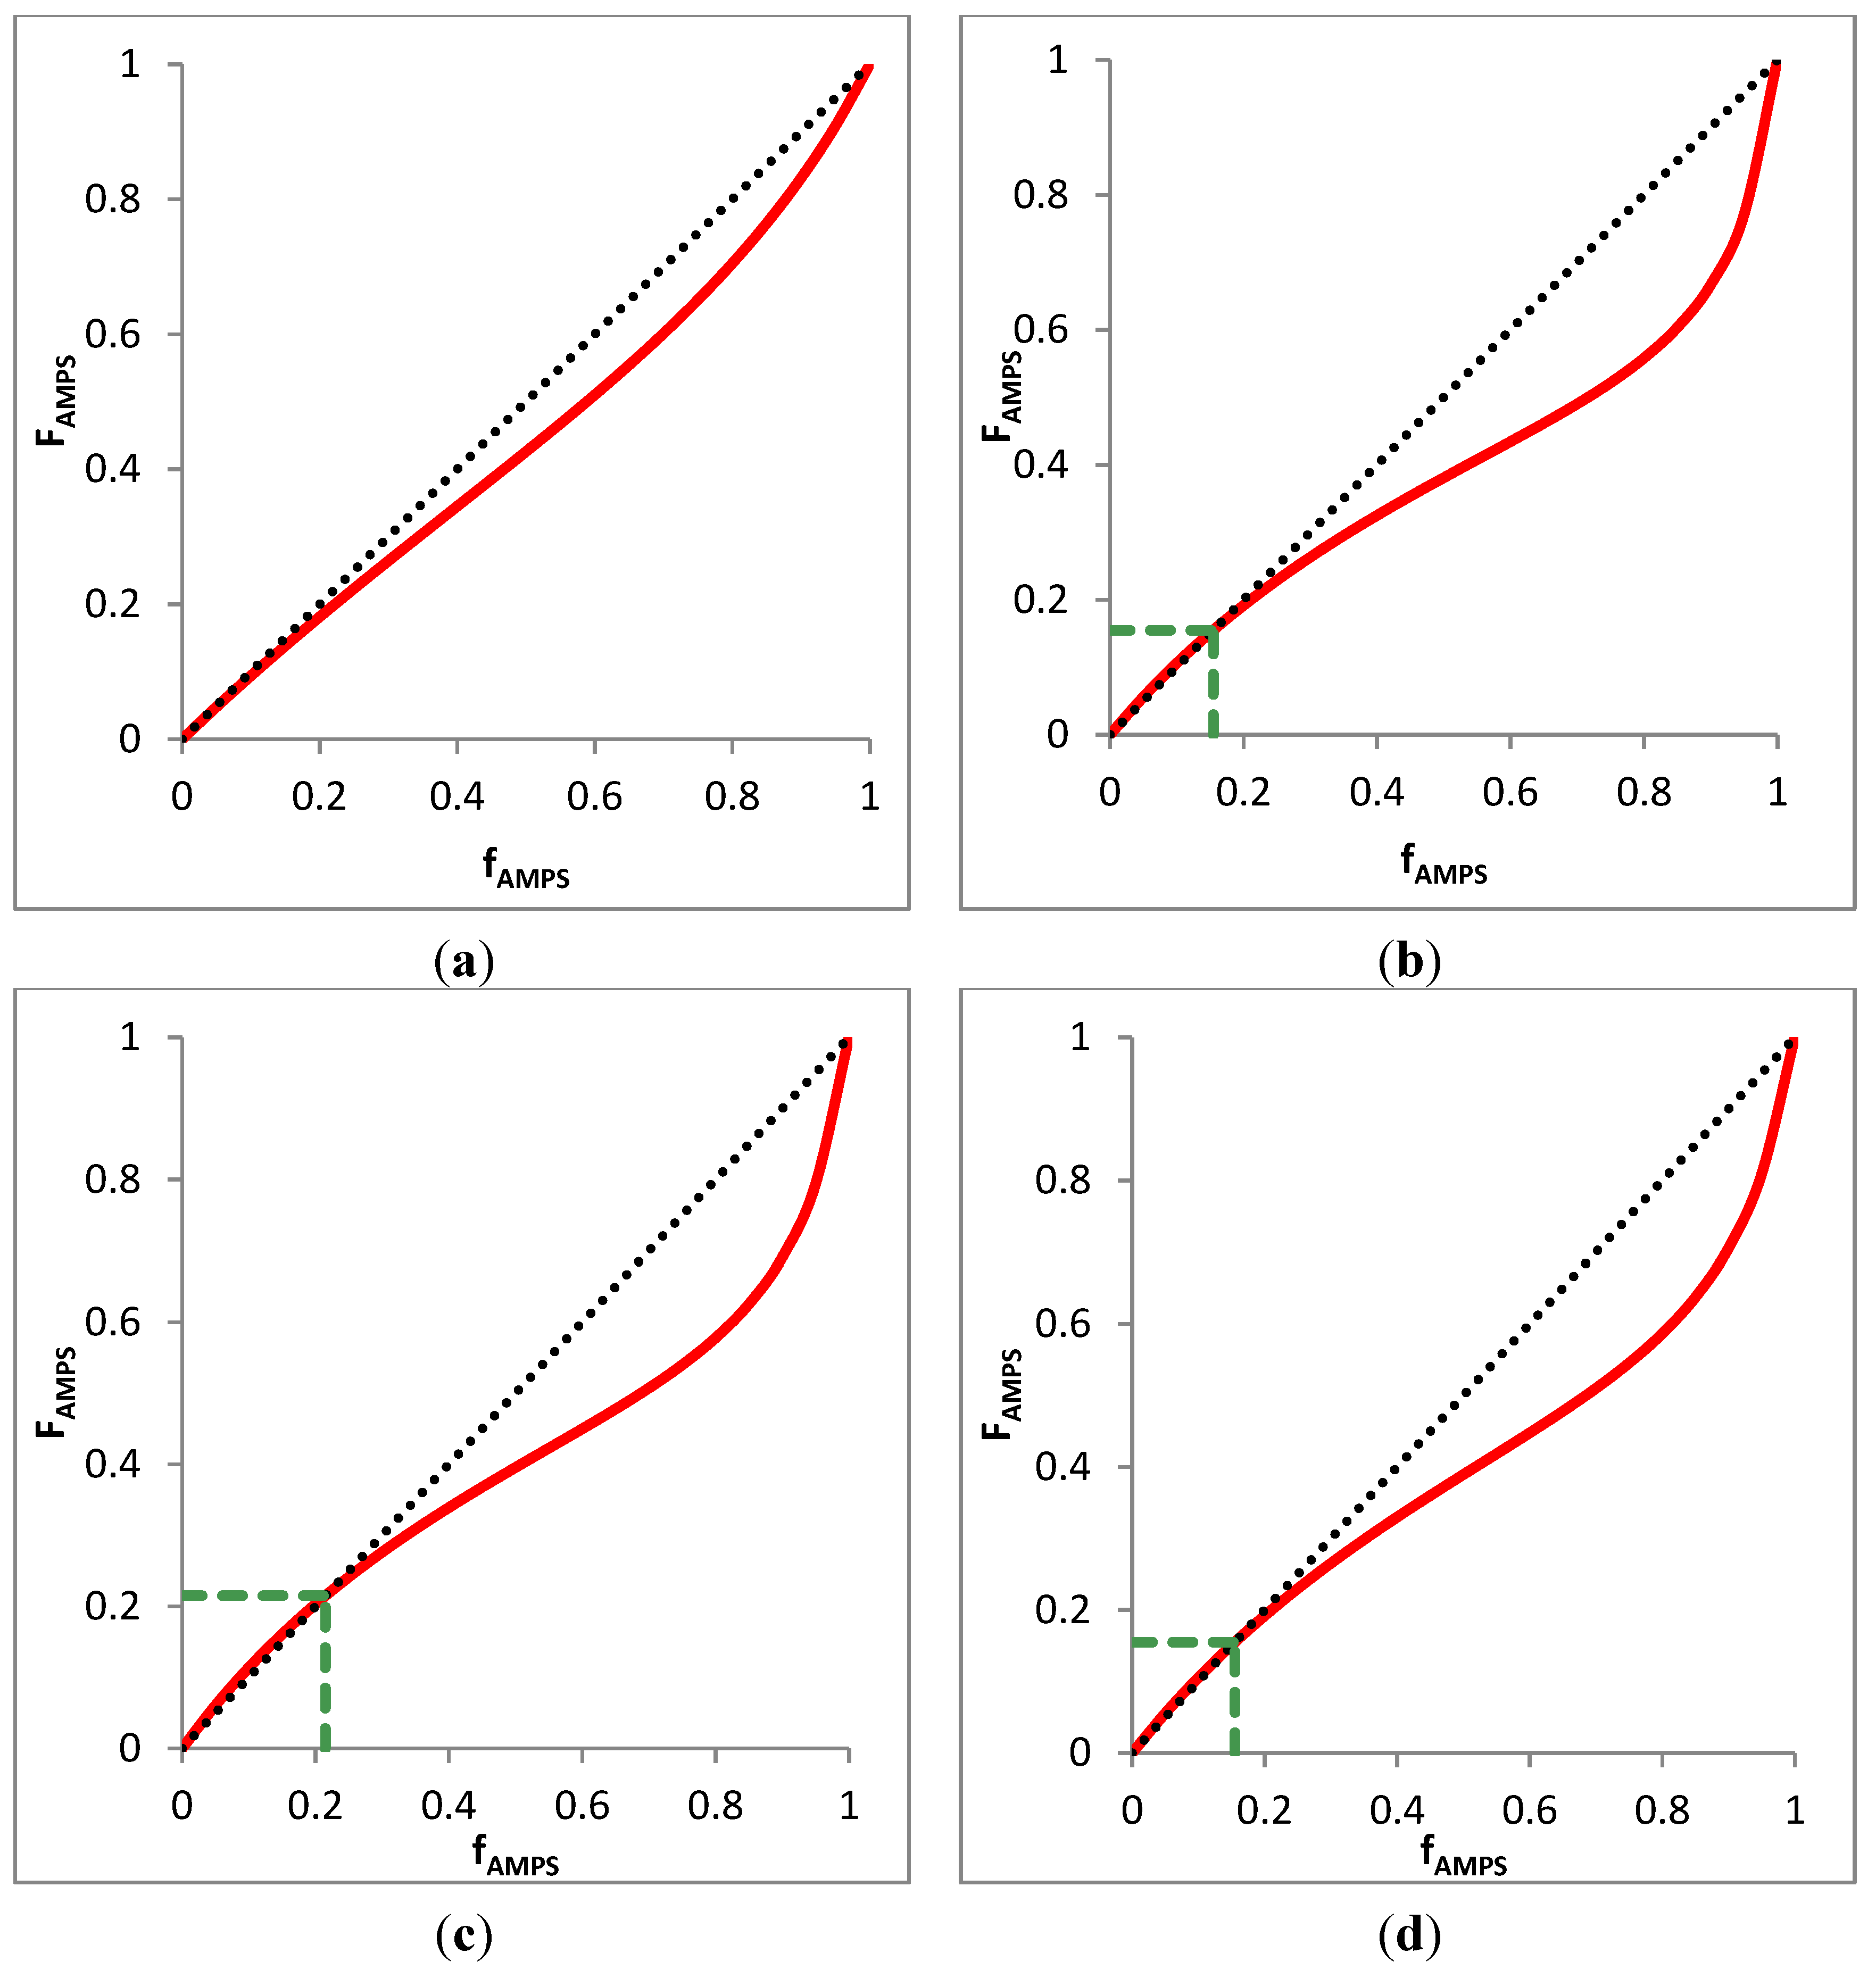
3.4.3. Azeotrope Analysis

4. AMPS/AAc Copolymer
4.1. Literature Background for AMPS/AAc
| Ref. | Experimental | Estimation Technique | rAMPS | rAAc |
|---|---|---|---|---|
| [28] | --Type: Aqueous solution copolymerization (<10% conversion) --Initiator: BPO --Temperature: 55 °C --Composition: IR | Fineman-Ross Kelen-Tudos Average | 0.304 0.15 0.27 | 0.915 0.98 0.95 |
| [33] | --Type: Aqueous solution copolymerization (<10% conversion) --pH = 7 --Composition: EA | Fineman-Ross Behnken’s NLR | 0.194 0.187 ± 0.09 | 0.700 0.740 ± 0.13 |
4.2. Design of Experiments for AMPS/AAc
| Approach | Reactivity Ratios for Design | Feed Compositions (Mole Fractions) | New Reactivity Ratio Estimates | |||
|---|---|---|---|---|---|---|
| rAMPS | rAAc | fAMPS,0,1 | fAMPS,0,2 | rAMPS | rAAc | |
| Preliminary | 0.27 | 0.95 | 0.15 | 0.80 | 0.48 | 0.95 |
| T-M Design | 0.48 | 0.95 | 0.32 | 0.81 | 0.21 | 0.85 |
| EVM Design | 0.48 | 0.95 | 0.20 | 0.73 | 0.19 | 0.86 |
4.3. Reactivity Ratio Estimation
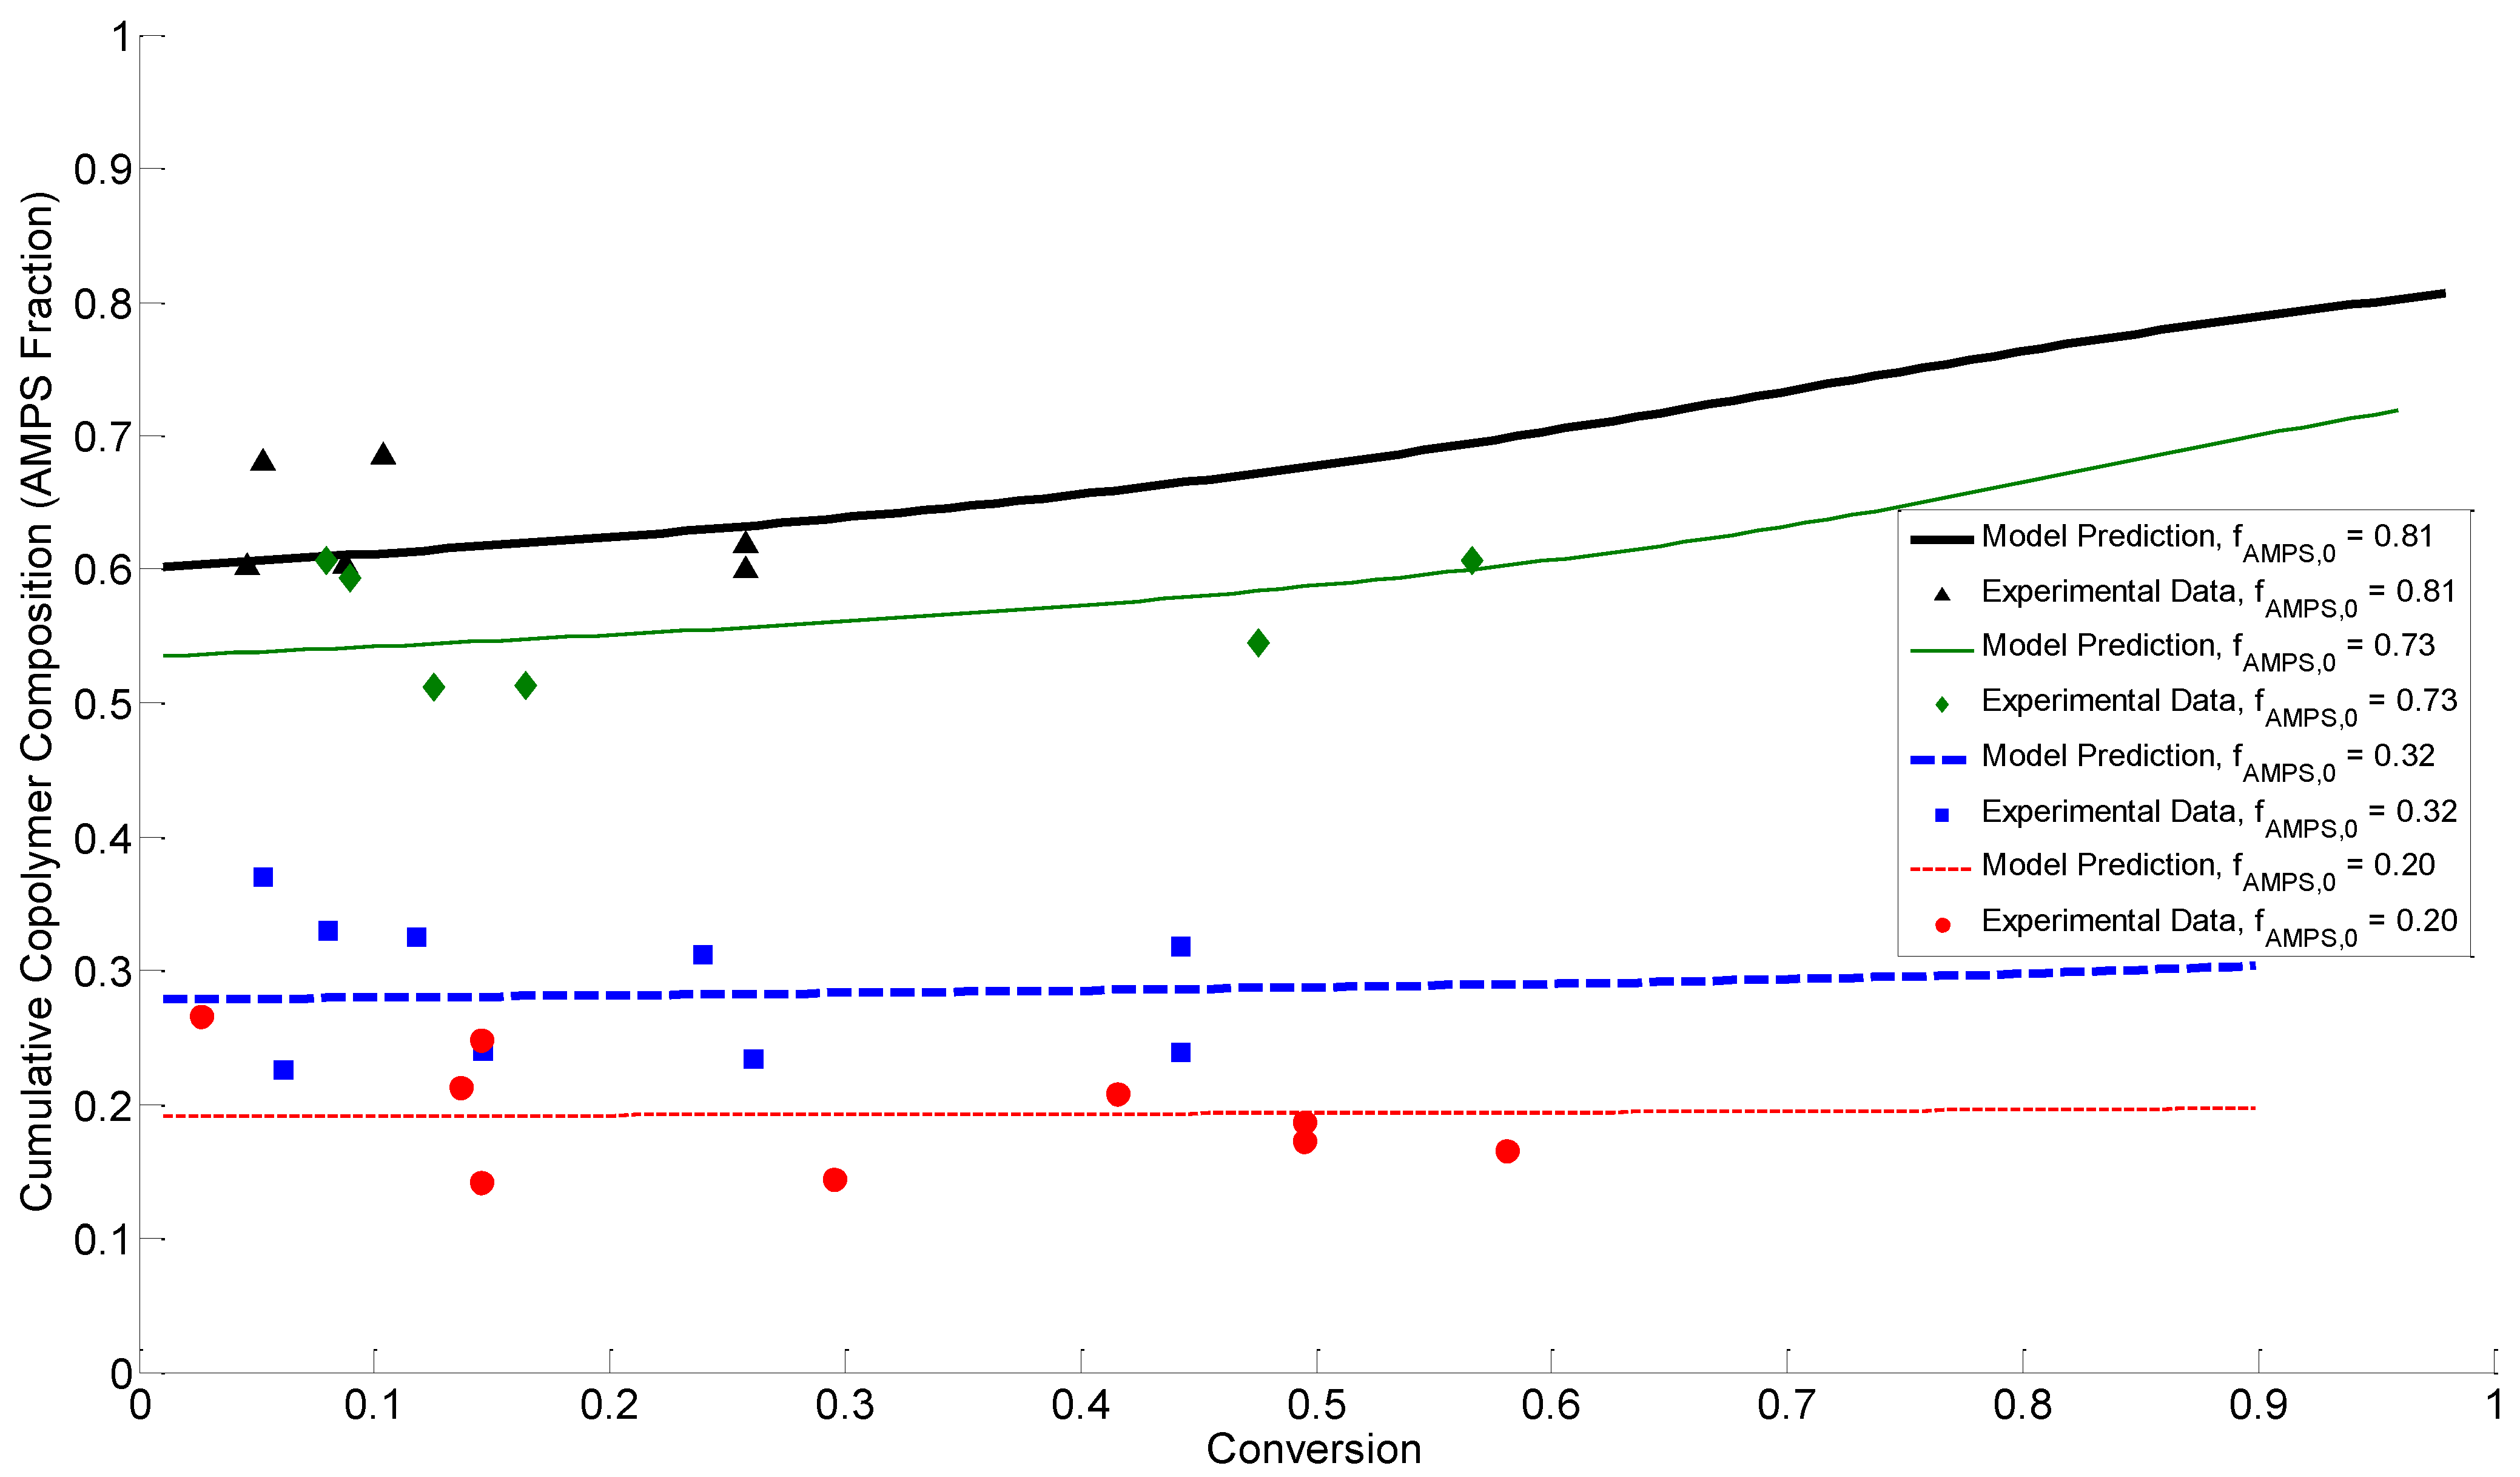
4.4. Discussion of Results
5. Conclusions
| Copolymer | r1 | r2 |
|---|---|---|
| AMPS1/AAm2 | 0.18 | 0.85 |
| AMPS1/AAc2 | 0.19 | 0.86 |
Acknowledgments
Author Contributions
Conflicts of Interest
Appendix A: Experimental Data
A.1. AMPS/AAm Copolymerization Data
| Run # | X | fAMPS,0 | fAAm, 0 | ||
|---|---|---|---|---|---|
| 1 | 0.0061 | 0.30 | 0.70 | 0.3243 | 0.6757 |
| 0.1078 | 0.30 | 0.70 | 0.2592 | 0.7408 | |
| 0.2614 | 0.30 | 0.70 | 0.2683 | 0.7317 | |
| 0.3335 | 0.30 | 0.70 | 0.2701 | 0.7299 | |
| 0.4717 | 0.30 | 0.70 | 0.2841 | 0.7159 | |
| 2 | 0.0583 | 0.91 | 0.09 | 0.6772 | 0.3228 |
| 0.1483 | 0.91 | 0.09 | 0.6779 | 0.3221 | |
| 0.2829 | 0.91 | 0.09 | 0.7043 | 0.2957 | |
| 0.5207 | 0.91 | 0.09 | 0.7223 | 0.2777 | |
| 0.7076 | 0.91 | 0.09 | 0.7374 | 0.2626 | |
| 3 | 0.0671 | 0.30 | 0.70 | 0.2794 | 0.7206 |
| 0.1035 | 0.30 | 0.70 | 0.2626 | 0.7374 | |
| 0.1830 | 0.30 | 0.70 | 0.2735 | 0.7265 | |
| 0.2604 | 0.30 | 0.70 | 0.2797 | 0.7203 | |
| 0.3910 | 0.30 | 0.70 | 0.2858 | 0.7142 | |
| 4 | 0.0519 | 0.91 | 0.09 | 0.8335 | 0.1665 |
| 0.1441 | 0.91 | 0.09 | 0.7955 | 0.2045 | |
| 0.2710 | 0.91 | 0.09 | 0.7648 | 0.2352 | |
| 0.4626 | 0.91 | 0.09 | 0.7715 | 0.2285 | |
| 0.6151 | 0.91 | 0.09 | 0.7762 | 0.2238 |
| Run # | X | fAMPS,0 | fAAm, 0 | ||
|---|---|---|---|---|---|
| 1 | 0.3408 | 0.10 | 0.90 | 0.1141 | 0.8859 |
| 0.3425 | 0.10 | 0.90 | 0.0937 | 0.9063 | |
| 0.7073 | 0.10 | 0.90 | 0.0801 | 0.9199 | |
| 2 | 0.0731 | 0.84 | 0.16 | 0.5977 | 0.4023 |
| 0.1412 | 0.84 | 0.16 | 0.6332 | 0.3668 | |
| 0.1923 | 0.84 | 0.16 | 0.7141 | 0.2859 | |
| 0.3348 | 0.84 | 0.16 | 0.6555 | 0.3445 | |
| 3 | 0.1064 | 0.10 | 0.90 | 0.1681 | 0.8319 |
| 0.1473 | 0.10 | 0.90 | 0.0911 | 0.9089 | |
| 0.3556 | 0.10 | 0.90 | 0.0898 | 0.9102 | |
| 0.6174 | 0.10 | 0.90 | 0.0922 | 0.9078 | |
| 4 | 0.2862 | 0.84 | 0.16 | 0.7030 | 0.2970 |
| 0.3589 | 0.84 | 0.16 | 0.6938 | 0.3062 |
A.2. AMPS/AAc Copolymerization Data
| Run # | X | fAMPS,0 | fAAc, 0 | ||
|---|---|---|---|---|---|
| 1 | 0.0617 | 0.32 | 0.68 | 0.2259 | 0.7741 |
| 0.1461 | 0.32 | 0.68 | 0.2397 | 0.7603 | |
| 0.2613 | 0.32 | 0.68 | 0.2333 | 0.7667 | |
| 0.4426 | 0.32 | 0.68 | 0.2386 | 0.7614 | |
| 0.4426 | 0.32 | 0.68 | 0.3182 | 0.6818 | |
| 2 | 0.0462 | 0.81 | 0.19 | 0.6014 | 0.3986 |
| 0.0874 | 0.81 | 0.19 | 0.6032 | 0.3968 | |
| 3 | 0.0528 | 0.32 | 0.68 | 0.3701 | 0.6299 |
| 0.0804 | 0.32 | 0.68 | 0.3298 | 0.6702 | |
| 0.1177 | 0.32 | 0.68 | 0.3253 | 0.6747 | |
| 0.2395 | 0.32 | 0.68 | 0.3120 | 0.6880 | |
| 4 | 0.0524 | 0.81 | 0.19 | 0.6802 | 0.3198 |
| 0.1038 | 0.81 | 0.19 | 0.6849 | 0.3151 | |
| 0.2576 | 0.81 | 0.19 | 0.6182 | 0.3818 | |
| 0.2576 | 0.81 | 0.19 | 0.5992 | 0.4008 |
| Run # | X | fAMPS,0 | fAAc, 0 | ||
|---|---|---|---|---|---|
| 1 | 0.0269 | 0.20 | 0.80 | 0.2652 | 0.7348 |
| 0.1369 | 0.20 | 0.80 | 0.2119 | 0.7881 | |
| 0.4156 | 0.20 | 0.80 | 0.2075 | 0.7925 | |
| 0.4950 | 0.20 | 0.80 | 0.1860 | 0.8140 | |
| 0.4950 | 0.20 | 0.80 | 0.1723 | 0.8277 | |
| 0.5813 | 0.20 | 0.80 | 0.1649 | 0.8351 | |
| 2 | 0.0895 | 0.73 | 0.27 | 0.5939 | 0.4061 |
| 0.1250 | 0.73 | 0.27 | 0.5115 | 0.4885 | |
| 0.1642 | 0.73 | 0.27 | 0.5131 | 0.4869 | |
| 3 | 0.1458 | 0.20 | 0.80 | 0.2474 | 0.7526 |
| 0.1458 | 0.20 | 0.80 | 0.1418 | 0.8582 | |
| 0.2951 | 0.20 | 0.80 | 0.1439 | 0.8561 | |
| 4 | 0.0798 | 0.73 | 0.27 | 0.6063 | 0.3937 |
| 0.4756 | 0.73 | 0.27 | 0.5455 | 0.4545 | |
| 0.5664 | 0.73 | 0.27 | 0.6069 | 0.3931 |
A.3. Design and Joint Confidence Region Comparison Calculations for AMPS/AAc
| T-M-Designed Data: | EVM-Designed Data: |
|---|---|
References
- Zaitoun, A.; Makakou, P.; Blin, N.; Al-Maamari, R.; Al-Hashmi, A.; Abdel-Goad, M.; Al-Sharji, H. Shear stability of EOR polymers. In Society of Petroleum Engineers International Symposium; Society of Petroleum Engineers: The Woodlands, TX, USA, 2011. [Google Scholar]
- Li, Q.; Pu, W.; Wang, Y.; Zhao, T. Synthesis and assessment of a novel AM-co-AMPS polymer for enhanced oil recovery (EOR). In Proceedings of the Fifth International Conference on Computational and Information Sciences, Shiyan, Hubei, China, 21–23 June 2013.
- Kamal, M.S.; Sultan, A.S.; Al-Mubaiyedh, U.A.; Hussien, I.A.; Pabon, M. Evaluation of rheological and thermal properties of a new fluorocarbon surfactant-polymer system for EOR applications in high-temperature and high-salinity oil reservoirs. J. Surfactants Deterg. 2014, 17, 985–993. [Google Scholar] [CrossRef]
- Seright, R.S.; Campbell, A.R.; Mozley, P.S.; Han, P. Stability of partially hydrolyzed polyacrylamides at elevated temperatures in the absence of divalent cations. SPE J. 2010, 15, 341–348. [Google Scholar] [CrossRef]
- Riahinezhad, M.; Kazemi, N.; McManus, N.; Penlidis, A. Optimal estimation of reactivity ratios for acrylamide/acrylic acid. J. Polym. Sci. Part A Polym. Chem. 2013, 51, 4819–4827. [Google Scholar] [CrossRef]
- Reilly, P.M.; Reilly, H.V.; Keeler, S.E. Parameter estimation in the error-in-variables model. J. Royal Stat. Soc. Ser. C Appl. Stat. 1993, 42, 693–701. [Google Scholar]
- Kazemi, N.; Duever, T.A.; Penlidis, A. A powerful estimation scheme with the error-in-variables model for nonlinear cases: Reactivity ratio estimation examples. Comput. Chem. Eng. 2013, 48, 200–208. [Google Scholar] [CrossRef]
- Kazemi, N.; Duever, T.A.; Penlidis, A. Reactivity ratio estimation from cumulative copolymer composition data. Macromol. React. Eng. 2011, 5, 385–403. [Google Scholar] [CrossRef]
- Brandrup, J.; Immergut, E.H.; Grulke, E.A. Polymer Handbook, 4th ed.; Wiley-Interscience: New York, NY, USA, 2003. [Google Scholar]
- Kazemi, N.; Duever, T.A.; Penlidis, A. Investigations on azeotropy in multicomponent polymerizations. Chem. Eng. Technol. 2010, 33, 1841–1849. [Google Scholar] [CrossRef]
- Riahinezhad, M.; McManus, N.T.; Penlidis, A. Effect of monomer concentration and pH on reaction kinetics and copolymer microstructure of acrylamide/acrylic acid copolymer. Macromol. React. Eng. 2015, 9, 100–113. [Google Scholar] [CrossRef]
- Odian, G. Principles of Polymerization; Wiley-Interscience: Hoboken, NJ, USA, 2004. [Google Scholar]
- Tidwell, P.W.; Mortimer, G.A. An improved method of calculating copolymerization reactivity ratios. J. Polym. Sci. Part A 1965, 3, 369–387. [Google Scholar] [CrossRef]
- Kazemi, N.; Duever, T.A.; Penlidis, A. Design of experiments for reactivity ratio estimation in multicomponent polymerizations using the error-in-variables approach. Macromol. Theory Simul. 2013, 22, 261–272. [Google Scholar] [CrossRef]
- Riahinezhad, M.; Kazemi, N.; McManus, N.; Penlidis, A. Effect of ionic strength on the reactivity ratios of acrylamide/acrylic acid (sodium acrylate) copolymerization. J. Appl. Polym. Sci. 2014, 131, 40949. [Google Scholar] [CrossRef]
- Durmaz, S.; Okay, O. Acrylamide/2-acrylamido-2-methylpropane sulfonic acid sodium salt-based hydrogels: Synthesis and characterization. Polymer 2000, 41, 3693–3704. [Google Scholar] [CrossRef]
- Liu, Y.; Xie, J.-J.; Zhu, M.-F.; Zhang, X.-Y. A study of the synthesis and properties of AM/AMPS copolymer as superabsorbent. Macromol. Mater. Eng. 2004, 289, 1074–1078. [Google Scholar] [CrossRef]
- Pourjavadi, A.; Salimi, H.; Kurdtabar, M. Hydrolyzed collagen-based hydrogel with salt and pH-responsiveness properties. J. Appl. Polym. Sci. 2007, 106, 2371–2379. [Google Scholar] [CrossRef]
- Rosa, F.; Casquilho, M. Effect of synthesis parameters and of temperature of swelling on water absorption by a superabsorbent polymer. Fuel Process. Technol. 2012, 103, 174–177. [Google Scholar] [CrossRef]
- Sabhapondit, A.; Borthakur, A.; Haque, I. Characterization of acrylamide polymers for enhanced oil recovery. J. Appl. Polym. Sci. 2003, 87, 1869–1878. [Google Scholar] [CrossRef]
- Sabhapondit, A.; Borthakur, A.; Haque, I. Water soluble acrylamidomethyl propane sulfonate. Energy Fuels 2003, 17, 683–688. [Google Scholar] [CrossRef]
- Jamshidi, H.; Rabiee, A. Synthesis and characterization of acrylamide-based anionic copolymer and investigation of solution properties. Adv. Mater. Sci. Eng. 2014, 2014, 1–6. [Google Scholar] [CrossRef]
- Aggour, Y.A. Thermal degradation of copolymers of 2-acrylamido-2-methylpropanesulphonic acid with acrylamide. Polym. Degrad. Stab. 1994, 44, 71–73. [Google Scholar] [CrossRef]
- Billmeyer, F.W. Textbook of Polymer Science; John Wiley & Sons, Inc.: New York, NY, USA, 1971. [Google Scholar]
- Bune, Y.V.; Barabanova, A.; Bogachev, Y.S.; Gromov, V. Copolymerization of acrylamide with various water-soluble monomers. Eur. Polym. J. 1996, 33, 1313–1323. [Google Scholar] [CrossRef]
- McCormick, C.L.; Chen, G.S. Water-soluble copolymers. IV. Random copolymers of acrylamide with sulfonated comonomers. J. Polym. Sci. Part A Polym. Chem. 1982, 20, 817–838. [Google Scholar] [CrossRef]
- Travas-Sejdic, J.; Easteal, A. Study of free-radical copolymerization of acrylamide with 2-acrylamido-2-methyl-1-propane sulphonic acid. J. Appl. Polym. Sci. 2000, 75, 619–628. [Google Scholar] [CrossRef]
- Abdel-Azim, A.-A.A.; Farahat, M.S.; Atta, A.M.; Abdel-Fattah, A.A. Preparation and properties of two-component hydrogels based on 2-acrylamido-2-methylpropane sulphonic acid. Polym. Adv. Technol. 1998, 9, 282–289. [Google Scholar] [CrossRef]
- Liao, L.; Yue, H.; Cui, Y. Crosslink polymerization kinetics and mechanism of hydrogels composed of acrylic acid and 2-acrylamido-2-methylpropane sulfonic acid. Chin. J. Chem. Eng. 2011, 19, 285–291. [Google Scholar] [CrossRef]
- Jie, Y.; Pan, Y.; Lu, Q.; Yang, W.; Gao, J.; Li, Y. Synthesis and swelling behaviors of P(AMPS-co-AAc) superabsorbent hydrogel produced by glow-discharge electrolysis plasma. Plasma Chem. Plasma Process. 2013, 33, 219–235. [Google Scholar]
- Pourjavadi, A.; Seidi, F.; Salimi, H.; Soleyman, R. Grafted CMC/Silica gel superabsorbent composite: Synthesis and investigation of swelling behavior in various media. J. Appl. Polym. Sci. 2008, 108, 3281–3290. [Google Scholar] [CrossRef]
- Wang, Y.; Shi, X.; Wang, W.; Wang, A. Synthesis, characterization, and swelling behaviors of a pH-responsive CMC-g-poly(AA-co-AMPS) superabsorbent hydrogel. Turk. J. Chem. 2013, 37, 149–159. [Google Scholar]
- Ryles, R.; Neff, R. Water-Soluble Polymers for Petroleum Recovery; Stahl, G., Schulz, D., Eds.; Springer: Anaheim, CA, USA, 1986. [Google Scholar]
- Kazemi, N. Reactivity Ratio Estimation in Multicomponent Polymerization Systems Using the Error-in-Variables-Model (EVM) Framework. Ph.D. Thesis, Department of Chemical Engineering, University of Waterloo, Waterloo, ON, Canada, 2014. [Google Scholar]
© 2015 by the authors; licensee MDPI, Basel, Switzerland. This article is an open access article distributed under the terms and conditions of the Creative Commons Attribution license (http://creativecommons.org/licenses/by/4.0/).
Share and Cite
Scott, A.J.; Riahinezhad, M.; Penlidis, A. Optimal Design for Reactivity Ratio Estimation: A Comparison of Techniques for AMPS/Acrylamide and AMPS/Acrylic Acid Copolymerizations. Processes 2015, 3, 749-768. https://doi.org/10.3390/pr3040749
Scott AJ, Riahinezhad M, Penlidis A. Optimal Design for Reactivity Ratio Estimation: A Comparison of Techniques for AMPS/Acrylamide and AMPS/Acrylic Acid Copolymerizations. Processes. 2015; 3(4):749-768. https://doi.org/10.3390/pr3040749
Chicago/Turabian StyleScott, Alison J., Marzieh Riahinezhad, and Alexander Penlidis. 2015. "Optimal Design for Reactivity Ratio Estimation: A Comparison of Techniques for AMPS/Acrylamide and AMPS/Acrylic Acid Copolymerizations" Processes 3, no. 4: 749-768. https://doi.org/10.3390/pr3040749