1. Introduction
Mammalian cells are commonly used to produce biopharmaceuticals as they are capable of correct glycosylation and other post-translational modifications of therapeutic proteins [
1,
2,
3,
4]. Though continuous cell lines such as Chinese Hamster Ovary (CHO) cells, adapted to suspension culture, are usually encountered in manufacturing processes, it is sometimes more advantageous to use immobilized systems [
2]. Cell immobilization not only offers a structure for the cells to grow upon and improve productivity, it also facilitates cell retention in perfusion culture systems.
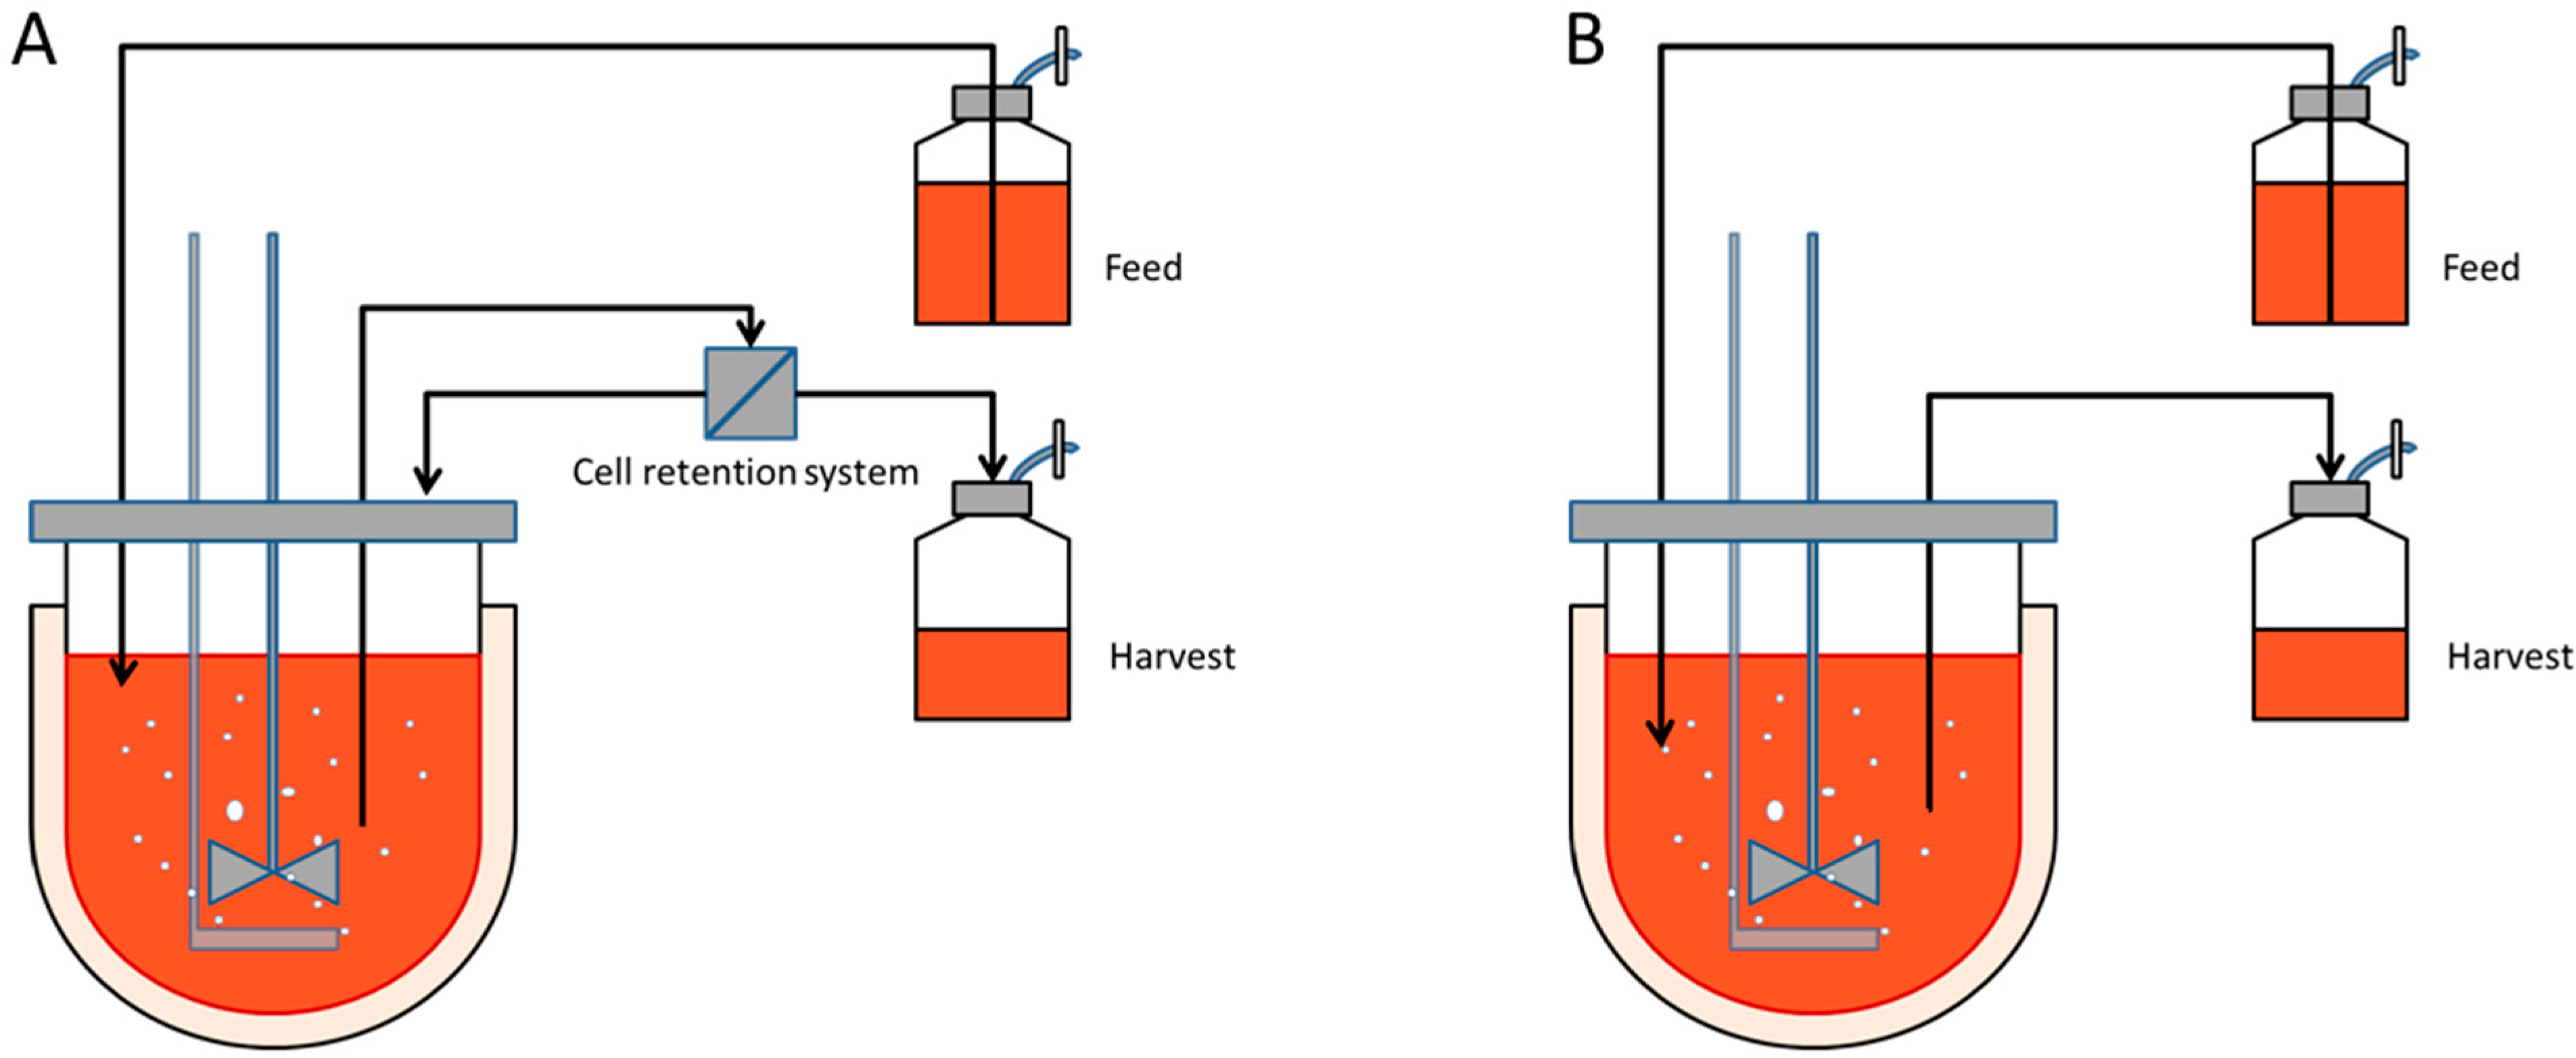
Perfusion cultures involve continuously supplying the culture with fresh culture media whilst continuously removing the spent media at an identical rate, ensuring the working volume remains constant. This culture type has the advantage to obtain high cell densities whilst continuously supplying the cells with all the essential nutrients and removing all the waste by-products. The cells are usually retained within the reactor by a cell separating device such as a spin filter, cross flow filter, hydrocyclone or acoustic cell settler,
Figure 1A. However, these cell separators represent an added cost, can gradually foul or are difficult to scale- up. On the other hand immobilized cultures do not require sophisticated equipment to retain the cells within the vessel. A simple mesh is sufficient to extract the spent media as represented in
Figure 1B [
5].
Figure 1.
Diagram of a perfusion culture setup. (A) Schematic representation of a perfusion culture for suspension cells in a stirred tank reactor. A cell retention system, such as a microfilter, is necessary to separate the cells from spent media; (B) Schematic representation of a perfusion culture for immobilized cells. The microcarriers or microcapsules, typically with a 240 µm radius, are sufficiently large to be retained within the vessel by a wire mesh.
Mammalian cell cultures are highly complex and may vary from one culture to another. To fully characterize a culture each process parameter must be continuously monitored. Biomass quantification and viability determination is a key aspect to any upstream bioprocess. Though cell immobilization offers many advantages, the cells are not readily accessible for culture analysis. Continuously removing a small sample of carriers or microcapsules would mean reducing the available space for the cells to colonize, thus reducing the total number of cells and diminishing the global productivity.
In addition, industrial bioprocesses are moving towards applying different process analytical technologies (PAT) to monitor, and potentially control processes. Since the FDA published the “Guidance for Industry PAT—A Framework for Innovative Pharmaceutical Development, Manufacturing, and Quality Assurance” initiative for Pharmaceutical cGMPs in September 2004, Process Analytical Tools have evolved dramatically [
6]. The FDA suggests that the adoption of PAT would help gain a better understanding of the process, which could therefore be better controlled.
These technologies analyse the chemical or physical proprieties of fluids or gases and should be used to improve the process design, development and control. The most commonly used sensors are pH, temperature and DO (dissolved oxygen) probes. However, they can only give limited information and control over complex systems such as cell. Many techniques exist which can potentially measure a wide range of different characteristics from biomass to metabolites and gases [
6].
This work seeks to fully colonise microcapsules using a perfusion feed, whilst monitoring the cell physiology using dielectric spectroscopy combined with monitoring the cell metabolic activity using calorimetry. First, based on the known growth kinetics, and microcapsule and cell measurements, the culture time and maximum viable cell density is predicted. The predicted cell density evolution can then be computed into both capacitance and heat flow rates. Subsequently, a feasibility study, to employ an eRC1 (Mettler Toldeo, Greifensee, Zürich, Switzerland), a bench-scale calorimeter to follow the cell metabolic activity was undertaken. After validating the monitoring method, a perfusion culture was undertaken in the eRC1 biocalorimetry.
It is the first time, to our knowledge, that CHO cell cultures have been monitored in a bench-scale calorimeter in combination with dielectric spectroscopy. Though this work was only done at bench scale, it also shows the monitoring method potential to be used at larger scale, such as in industrial production processes.
2. Biomass Monitoring Methods
Accurate biomass monitoring and control is essential to achieve robust bioprocesses and heterologous protein production. Direct and indirect techniques exist to monitor cell growth and viability. Direct methods measure a physical propriety of a cell and its components, whereas indirect methods measure factors related to the cells and their activity (respiration, electrochemical behaviour, and/or nutrient fluctuation) [
7,
8].
These technologies should not only have a linear dependence, but be robust, accurate, precise, and easy to calibrate, they must also have no biological interference and endure pressure and temperature conditions of a sterilization process [
9]. All of the methods mentioned in
Table 1 have certain advantages, but some are not suitable for monitoring encapsulated or other immobilized cell growth and viability. Indeed some methods such as turbidity or multi- wavelength fluorescence would require liberation of the cells from their protective shells or microcarriers. Direct methods are of course preferred as they do not rely on model-based predictions [
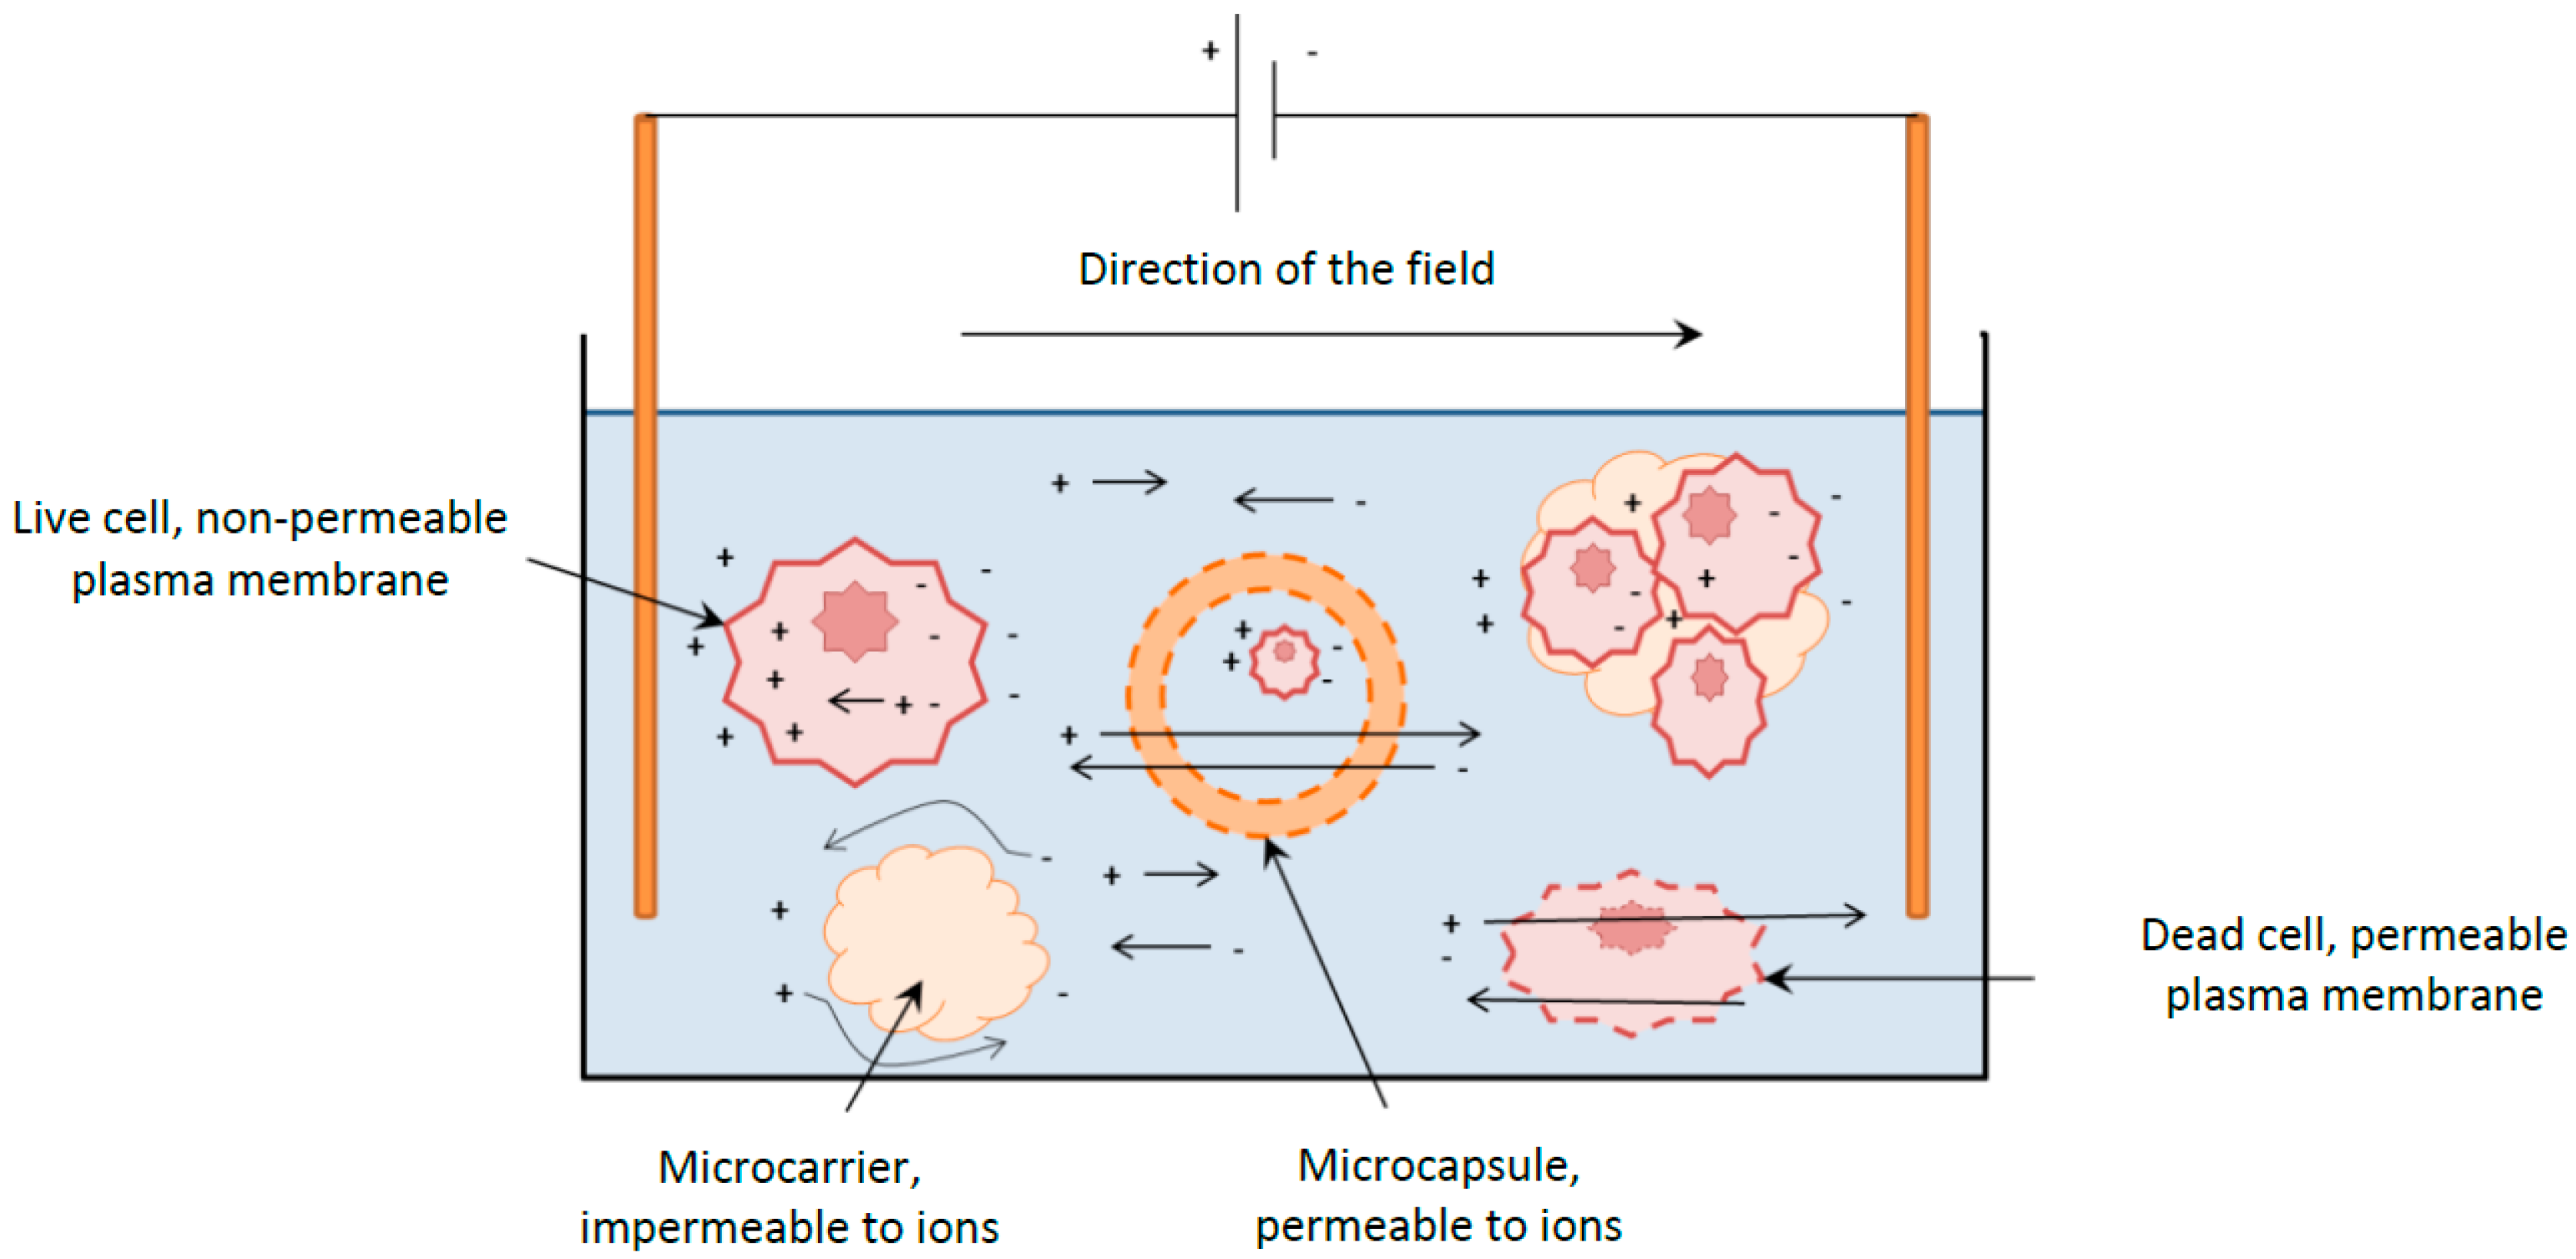
20], making dielectric spectroscopy a preferred method for monitoring cell encapsulation. This technique relies on the flow of ions, which can easily permeate the microcapsules membrane, in the case of microencapsulated cultures.
An insight into the cell metabolic activity may also offer a better understanding of the bioprocess. Since CO2 is usually used to control the mammalian cell culture pH, monitoring the carbon dioxide evolution rate (CER), is not an applicable technique. Nevertheless, biocalorimetry, or the online or at-line monitoring of bioreaction heat generation, may prove to be an easy but informative online monitoring method.
Table 1.
On-line direct and indirect methods for biomass estimation and applicability to immobilized cell cultures.
Table 1.
On-line direct and indirect methods for biomass estimation and applicability to immobilized cell cultures.
| PAT | Measured Bioprocess Variable | Direct/Indirect | Applicability to Immobilized Cell Cultures |
|---|
| Dielectric spectroscopy | Capacitance | Direct | Yes |
| Optical probing | Turbidimetry or nephelometry in VIS or NIR, MIR and FTIR | Direct | No |
| Multi-wavelength Fluorescence | Cellular fluorophores (NAD(P)H, flavins and aromatic amino acids | Indirect | No |
| Biocalorimetry | Heat production from metabolic activity | Indirect | Yes |
| Off-gas analysis | Oxygen Uptake Rate (OUR) and Carbon Dioxide Evolution Rate (CER) | Indirect | Yes |
| Infrared sensors | Metabolite concentrations | Indirect | Yes |
5. Materials and Methods
5.1. Cell Line and Culture Conditions
CHO-DP12, a Chinese Hamster Ovary cell line was used for all experiments. CHO-DP12 has been adapted to serum-free medium and secretes a recombinant human IgGl. The cells were cultivated in EX-CELL CHO DHFR− (SAFC Biosciences, St. Louis, MO, USA) supplemented with 4 mM L-glutamine, 10 mL∙L−1 Gibco penicillin-streptomycin (Life Technologies, Carlsbad, CA, USA). The inocula was prepared in 1 L shake flasks containing 300 mL of culture medium at 100 rpm and 37 °C.
The BioRC1 (Mettler Toldeo, Greifensee, Zürich, Switzerland) was inoculated with 25% (v/v) Ca2+-alginate-poly-L-lysine-alginate (APLLA) microcapsules containing 1 × 10⁶ cells·mL−1 alginate, equivalent to 300 mL of packed microcapsules containing a total of 3 × 10⁸ cells corresponding to an initial cell density of 0.3 × 10⁶ vcells·mL−1WV (viable cells per mL working volume) in a working volume of 1400 mL medium. The culture conditions were monitored and controlled to a set-point of 37 °C and pH 7.2. The pH was maintained at 7.2 by a continuous CO2 headspace enrichment initially set at 5%. As the culture pH stabilises and requires less acidification of the suspension, the enrichment was reduced manually, step-wise, and then switched off. The alkali addition to maintain the pH at 7.2, was executed by the pH controller (Bioengineering, Wald, Zürich, Switzerland). It was desired to have punctual base addition, to avoid calorimetric signal interference, consequently the controller was fixed at pH = 7.2 ± 0.2, TON/TOFF potentiometers, controlling opening or closing times are set to obtain punctual addition, that would translate to a spike in the signal. Agitation used a pitched- blade disc turbine impeller rotating at 100 rpm. Air was sparged into the culture media at 0.01 vvm and the headspace aerated at 0.1 vvm. The viable cell density was monitored using a Biomass monitor (ABER Instruments, Aberystwyth, Ceredigion, UK), and was set on dual frequency and polarisation correction, at 580 kHz and 10,085 kHz (3.64 × 10⁶ (rad·s−1) and 6.34 ×10⁹ (rad·s−1)). The capacitance readings as well as the reactor and jacket temperatures were collected and saved in a text file using an in-house designed LabVIEW program.
After inoculation, the cells were allowed to develop to 2 × 10⁶ vcells∙mL−1 in batch mode at which point the perfusion feed was initiated. The feed was set at a dilution rate D = 2∙µmax, to avoid early nutrient depletion, extracapsular cell wash-out as well as an important accumulation of waste metabolic by-products. This meant that over a 24 h period, 1.7 L of feed was supplied to the culture, and 1.7 L of spent media containing extracapsular cells and microcapsule debris was removed.
The EX-CELL CHO DHFR− medium contains approximately 6 g∙L−1 glucose and was supplemented with 4 mM
L-glutamine. The total daily glucose and
L-glutamine requirements for the following 24 h were calculated on a daily basis using Equation (9), where
S is the substrate,
the specific substrate uptake rate,
X the total number of viable cells in the culture and
the growth rate and
t time. If necessary, the feed was supplemented with additional glucose and
L-glutamine.
5.2. Cell Microencapsulation
The microcapsules were produced by extruding a cell suspension in 1.5% alginate solution through an Encapsulator Biotech (Inotech, Basel, Switzerland). Cells (3.4 × 10⁸) were centrifuged at 200 × g for 10 min and re-suspended in 340 mL of sterile filtered 1.5% (w/v) sodium alginate, 10 mM MOPS (Sigma Aldrich, St. Louis, MO, USA; Cat#: M3183) and 0.85% NaCl (Merck, Darmstadt, Hesse, Germany; Cat#: 106400) buffer, pH 7.2. The alginate-cell suspension was then extruded through a 200 μm diameter single nozzle into a stirred 1 L solution of 100 mM CaCl2 (Sigma, St. Louis, MO, USA; Cat#: C7902) in 10 mM MOPS buffer pH 7.2. After incubation for 10 min, the CaCl2 solution was removed and the alginate beads washed with 500 mL 10 mM MOPS containing 0.85% NaCl. After washing, the Ca2+-alginate beads were placed in a 0.05% (w/v) solution of 30,000–70,000 Dalton poly-L-lysine hydrobromide (Sigma Aldrich, St. Louis, MO, USA; Cat#: P2636) in 10 mM MOPS, 100 mM CaCl2, pH 7.2 for 30 min. After coating with PLL the beads were washed twice for five minutes with the MOPS-NaCl buffer pH 7.2, and coated with a second layer of Na-alginate by incubation in a 0.03% (w/v) sodium alginate, 10 mM MOPS, 0.85% NaCl, pH 7.2 for 10 min. The coated beads were once again washed twice with MOPS-NaCl buffer and the inner Ca2+-alginate core solubilised by addition of a 1 L solution containing 50 mM sodium citrate (Sigma Aldrich, St. Louis, MO, USA; Cat#: S1804), 10 mM MOPS, 0.85% NaCl, pH 7.4. The APLLA microcapsules were washed once with 500 mL MOPS-NaCl buffer, and once with 300 mL non-supplemented media. After removing the medium, 300 mL of supplemented medium was added to the microcapsules. The cell-containing microcapsules were then transferred into an inoculating bottle and aseptically connected to the bioreactor for inoculation.
5.3. Microcapsule Break-up Method
To determine the viable cell density off -line, the cells need to be liberated from the microcapsules. The microcapsule break-up method used must be rapid and gentle in order to not affect the cell viability. First, the microcapsules were separated from the medium using a cell strainer (100 μm nylon mesh) and washed with PBS. The microcapsules were then transferred to a graduated 1 mL syringe connected to a 30 gauge needle. A ratio of 1:1 volume PBS to microcapsules was added before extruding the microcapsules through the needle. The broken PBS/microcapsule suspension was extruded twice more to ensure complete microcapsule breakage and to avoid the presence of particles which might interfere with the cell counting. The liberated cells were counted microscopically using a Neubauer Haemocytometer after staining with 0.4% Trypan blue.
5.4. Off-Line Measurements
The concentration of glucose and lactate in culture samples was quantified using an HPLC (Agilent Instruments 1200, Agilent Technologies Ltd., Santa Clara, CA, USA) equipped with a refractive index detector, thermostat set to 30 °C with a Supelcogel™ C-610H column (Sigma Aldrich, St. Louis, MO, USA). A 0.01 M H2S04 solution was used as mobile phase at a constant rate of 0.5 mL·min−1 for 32 min.
L-Glutamine and ammonia concentrations were quantified using commercially available enzyme assay procedures (Megazyme, Bray, Wicklow, Ireland), in which the absorbance was measured using a Versamax microplate reader (Molecular Devices, Sunnyvale, CA, USA).
Recombinant IgG1 was quantified using protein A affinity HPLC. The HPLC (Agilent Instruments 1200, Agilent Technologies Ltd., Santa Clara, CA, USA) was equipped with a refrigerated autosampler and a thermostatted column compartment. The column, POROS® Prepacked Protein A Affinity Colum (Life Technologies, Thermo Fisher Scientific, Carlsbad, CA, USA) was connected and maintained at 25 °C. Two mobile phases were prepared: Mobile Phase A—20 mM sodium phosphate, 500 mM NaCl, pH 7.0; Mobile Phase B—50 mM sodium phosphate, 500 mM NaCl, pH 2.0.
Each analysis lasted 5 min. The flow rate of the two mobile phases was 2 mL∙min−1, and according to the program described in
Table 2. Culture samples 25 μL were injected in 100% of mobile phase A. The recombinant protein was detected using a UV/VIS detector set to 280
.
Table 2.
Elution program for the quantification of IgG1 by affinity HPLC.
Table 2.
Elution program for the quantification of IgG1 by affinity HPLC.
| Time | % Mobile Phase A | % Mobile Phase B |
|---|
| 0.0 → 2.5 min | 100 | 0 |
| 2.5 → 3.5 min | 0 | 100 |
| 3.5 → 5.0 min | 100 | 0 |
To ensure column efficiency, the protein column must be regenerated at the beginning and the end of the process, after the calibration curve samples, after every 20 samples and at the end of the sequence. This was done by injecting 3 × 100 μL of 2 M guanidine HCl and eluting using the mobile phase B at 2 mL∙min−1. The column regeneration was followed by 3 blank analysis, (3 injections of mobile phase A).
6. Results
6.1. Culture Predictions
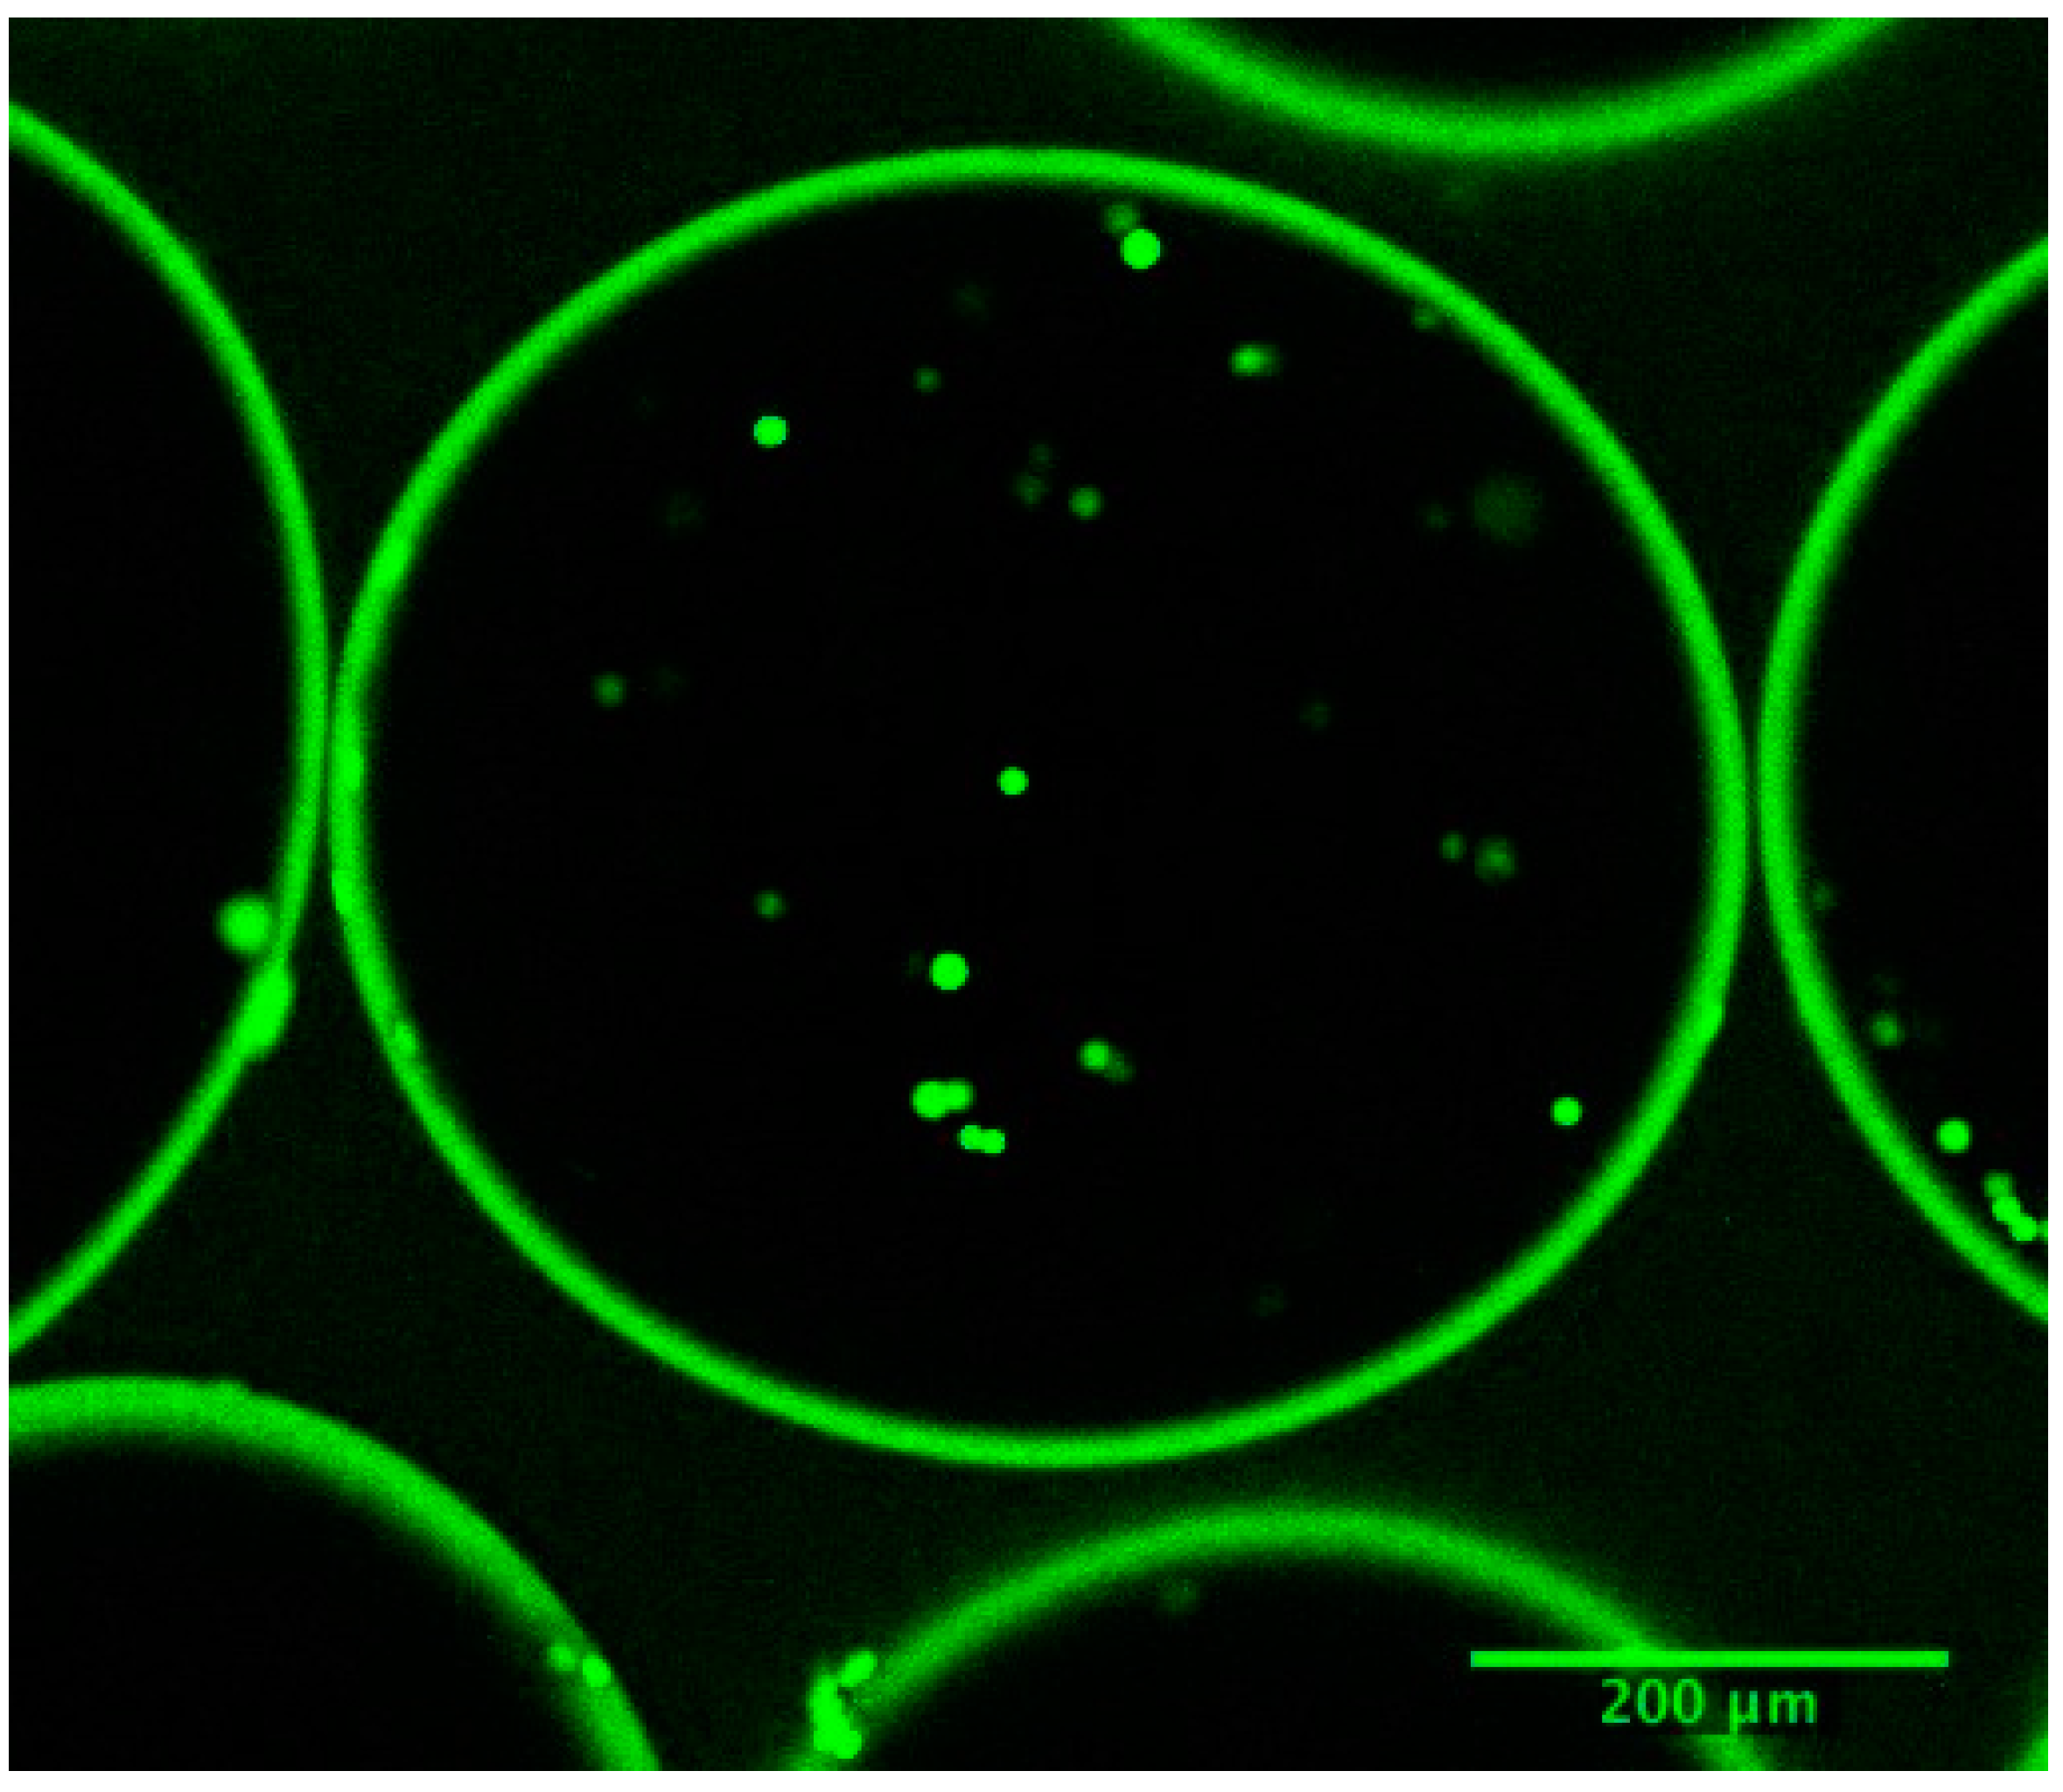
The average microcapsule radius was 260 μm. The membrane thickness of the microcapsule, was evaluated to be 18 μL by confocal microscopy, (
Figure 8) and thus the average internal volume and potential colonisation space represented 4.71 × 10
7 μm
3. The cell volume being 115 μm
3, (radius = 6.5 μm), would entail the microcapsules having a maximum colonisation potential of 6.40 × 10
4 cells·capsule
−1.
The work involved monitoring microencapsulated cell densities in approximately 25% (
v/
v) microcapsule cultures. Therefore, a culture, without any inhibitory factors, may generate cell densities up to 139 × 10
6 vcells∙mL
−1. Providing the cells grow constantly at 0.62 days
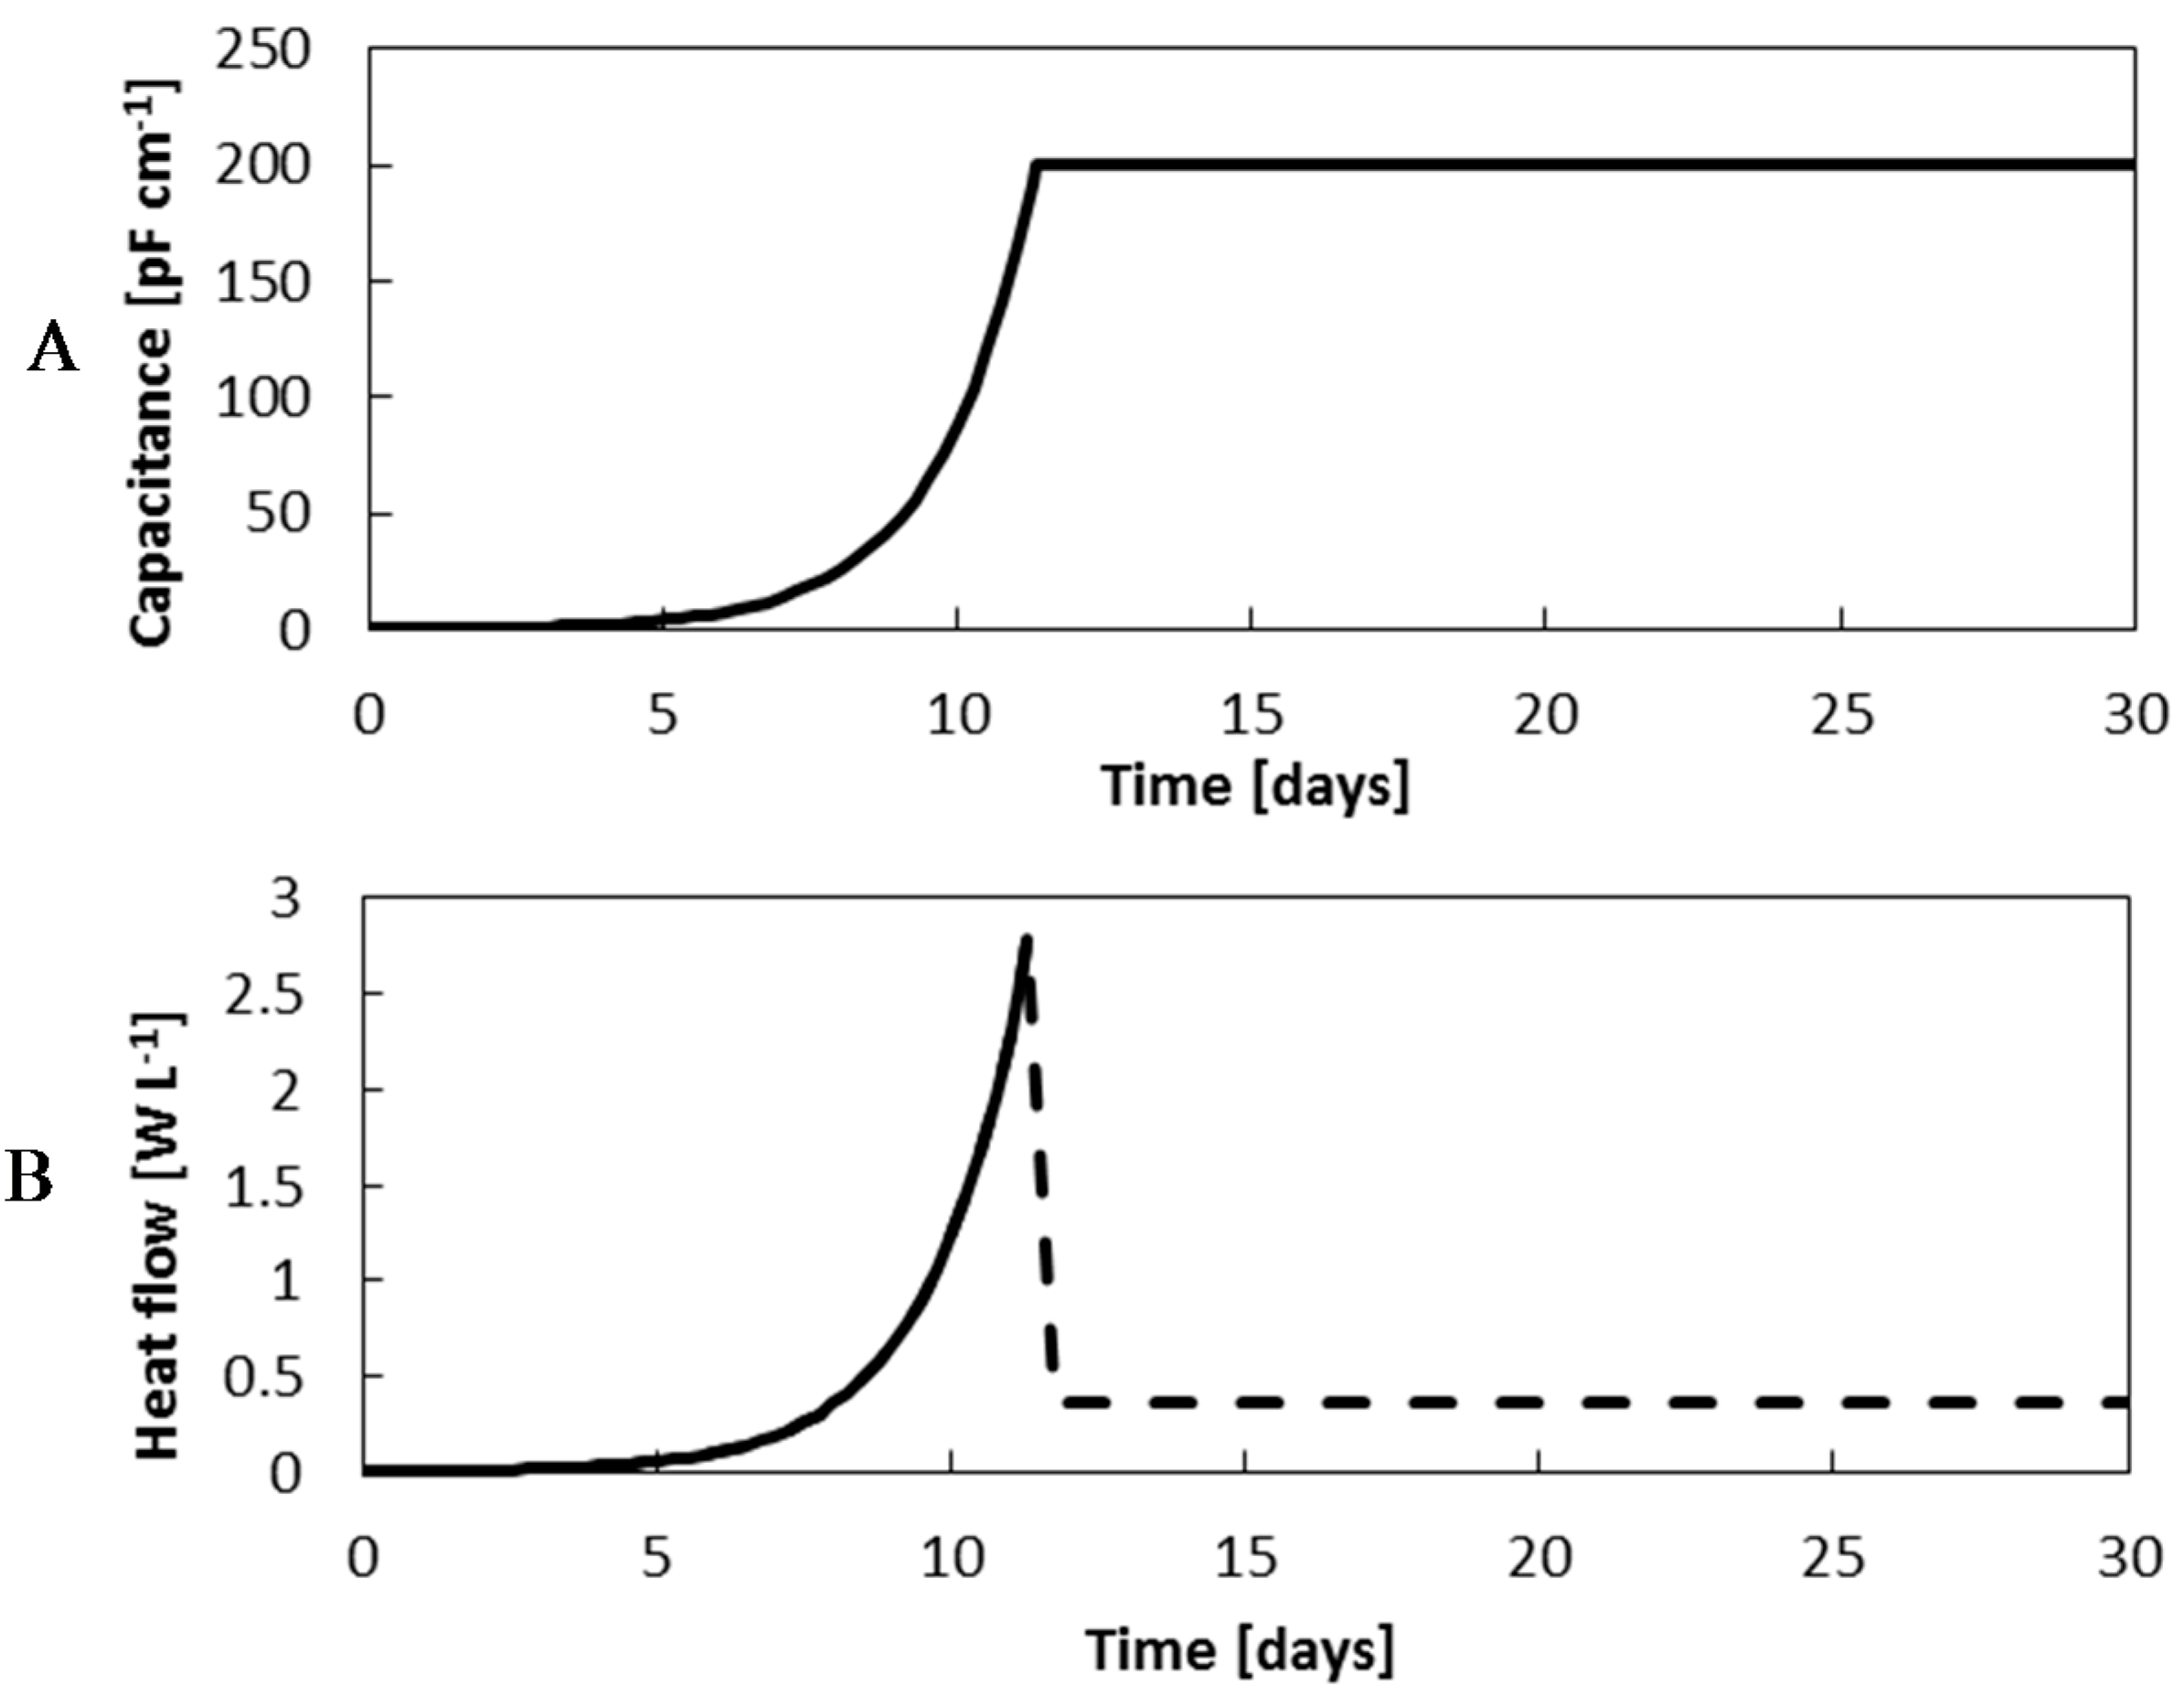
−1, without a lag phase, the full microcapsule core colonisation should be achieved after 11.3 days. Based on the CHO-DP 12 specific capacitance, 1.44 × 10
−6 pF∙mL∙cm
−1∙cell
−1, such densities would have a capacitance reading of 200.1 pF∙cm
−1, as illustrated in
Figure 9A. It is expected that once the maximum cell density is achieved, and the metabolites are present is the adequate concentrations, that the capacitance would remain stable [
23].
Figure 8.
Confocal image of calcium-alginate poly-L-lysine-alginate microcapsules, immediately after inoculation. The average microcapsule radius is 260 μm and the membrane thickness, 18 μm. The stained cells fluoresce green if viable, or red if dead.
Figure 8.
Confocal image of calcium-alginate poly-L-lysine-alginate microcapsules, immediately after inoculation. The average microcapsule radius is 260 μm and the membrane thickness, 18 μm. The stained cells fluoresce green if viable, or red if dead.
Figure 9.
Capacitance (A) and heat flow (B) predictions throughout the exponential phase, assuming the cells duplicate at the maximum growth rate μmax = 0.64 day−1, and the stationary phase, when the full microcapsule colonisation potential has been achieved.
Figure 9.
Capacitance (A) and heat flow (B) predictions throughout the exponential phase, assuming the cells duplicate at the maximum growth rate μmax = 0.64 day−1, and the stationary phase, when the full microcapsule colonisation potential has been achieved.
In addition to the continuous capacitance readings, the heat produced by the cells will be monitored by the eRC1 calorimeter. In the literature, it has been reported that mammalian cells produce very little heat in contrast to microbial cells [
30,
40]. More specifically, the specific heat flow rate of the CHO 320 cell line was evaluated at its peak at 20 pW cell
−1 [
23]. Consequently, it is expected for the heat flow rate to increase at the same rate as the cells and capacitance up to2.8 W∙L
−1. Once the cells have no longer any free space to replicate, the cell growth should become inhibited. As the heat flow rate is dependent upon the metabolic rate, it is forecast for the heat signal to fall and stabilise at an inferior heat flow rate,
Figure 9B, [
36,
37].
The eRC1 calorimeter resolution has a reported resolution of to be 50 mW∙L−1. This means for a 1.4 L CHO culture, the Limit of blank (LOB), or the maximum cell density that can still be considered as a blank sample, should not exceed 3.5 × 10⁶ vcells∙mL−1WV. The lowest measurable cell density, or the Limit of Detection (LOD) was estimated at approximately 11.6 × 10⁶ vcells∙mL−1WV. Therefore, the calorimetric method is not sufficiently sensitive to monitor batch cell cultures. However, biocalorimetry has a promising potential to monitor the biomass development stage of microencapsulated CHO cell perfusion cultures that are projected to exceed these densities.
6.2. Biocalorimetry Monitoring Method Validation for CHO Cell Cultures
The heat signal plotted against the cell density display a linear trend, which was modelled by linear regression. The data points were found to be linearly correlated with a coefficient
R = 0.99. The slope of the linear regression, corresponding to the specific cellular heat flow is estimated at 74.77 ± 5.66 pW∙cell
−1,
Figure 10.
Figure 10.
Heat flow rate and viable cell density linear model. The linear regression is constructed with a slope a = 74.77 × 10⁻¹¹ W∙cell−1 and a correlation coefficient of R = 0.99.
Figure 10.
Heat flow rate and viable cell density linear model. The linear regression is constructed with a slope a = 74.77 × 10⁻¹¹ W∙cell−1 and a correlation coefficient of R = 0.99.
From the linear regression analysis, the LOB, LOD and LOQ were established,
Table 3. The LOB, LOD and Limit of Quantification (LOQ) were calculated following the ICH Harmonised Tripartite Guideline’s “Validation of Analytical Procedures: Text and Methodology Q2(R1)” published in November 2005. From the linear regression, the limit of the blank is evaluated at 1.33 × 10
6 vcells∙mL
−1WV and the lowest possible cell density to be properly detected was evaluated at 8.87 × 10
6 vcells∙mL
−1WV. Cell densities above 26.88 × 10
6 vcells∙mL
−1WV, according to the ICH method, should be reliably quantified.
These findings are comparable to the predicted method limits presented in sub-section 6.1. Both the predicted limit of detection, evaluated at 11.55 × 10⁶ vcells∙mL−1WV, and the one based on the calibration model 8.87 × 10⁶ vcells∙mL−1WV are of the same magnitude. Nevertheless, this confirms the conclusion that bench scale calorimetry using the eRC1 is not a sensitive enough method to monitor 1.4 L CHO-DP12 suspension cultures, but has a strong potential to monitor microencapsulated perfusion cultures. Microencapsulated cultures, with a 25% (v/v) microcapsules to medium working volume ratio are expected to reach densities above 108vcells∙mL−1WV and according to the specific heat flow rate, should generate heat flows above 2.5 W∙L−1.
Table 3.
Monitoring encapsulated CHO-DP12 cell cultures method validation.
Table 3.
Monitoring encapsulated CHO-DP12 cell cultures method validation.
| Method Validation Characteristics | Values |
|---|
| Specific cellular heat flow rate | 74.77 ± 5.66 pW∙cell−1 |
| Standard deviation of the ordinate | 0.201 W |
| Limit of blank | 1.33 × 10⁶vcells∙mL−1WV |
| Limit of detection | 8.87 × 10⁶vcells∙mL−1WV |
| Limit of quantification | 26.88 × 10⁶vcells∙mL−1WV |
6.3. Perfusion Cultures Cell Density and Metabolite Analysis
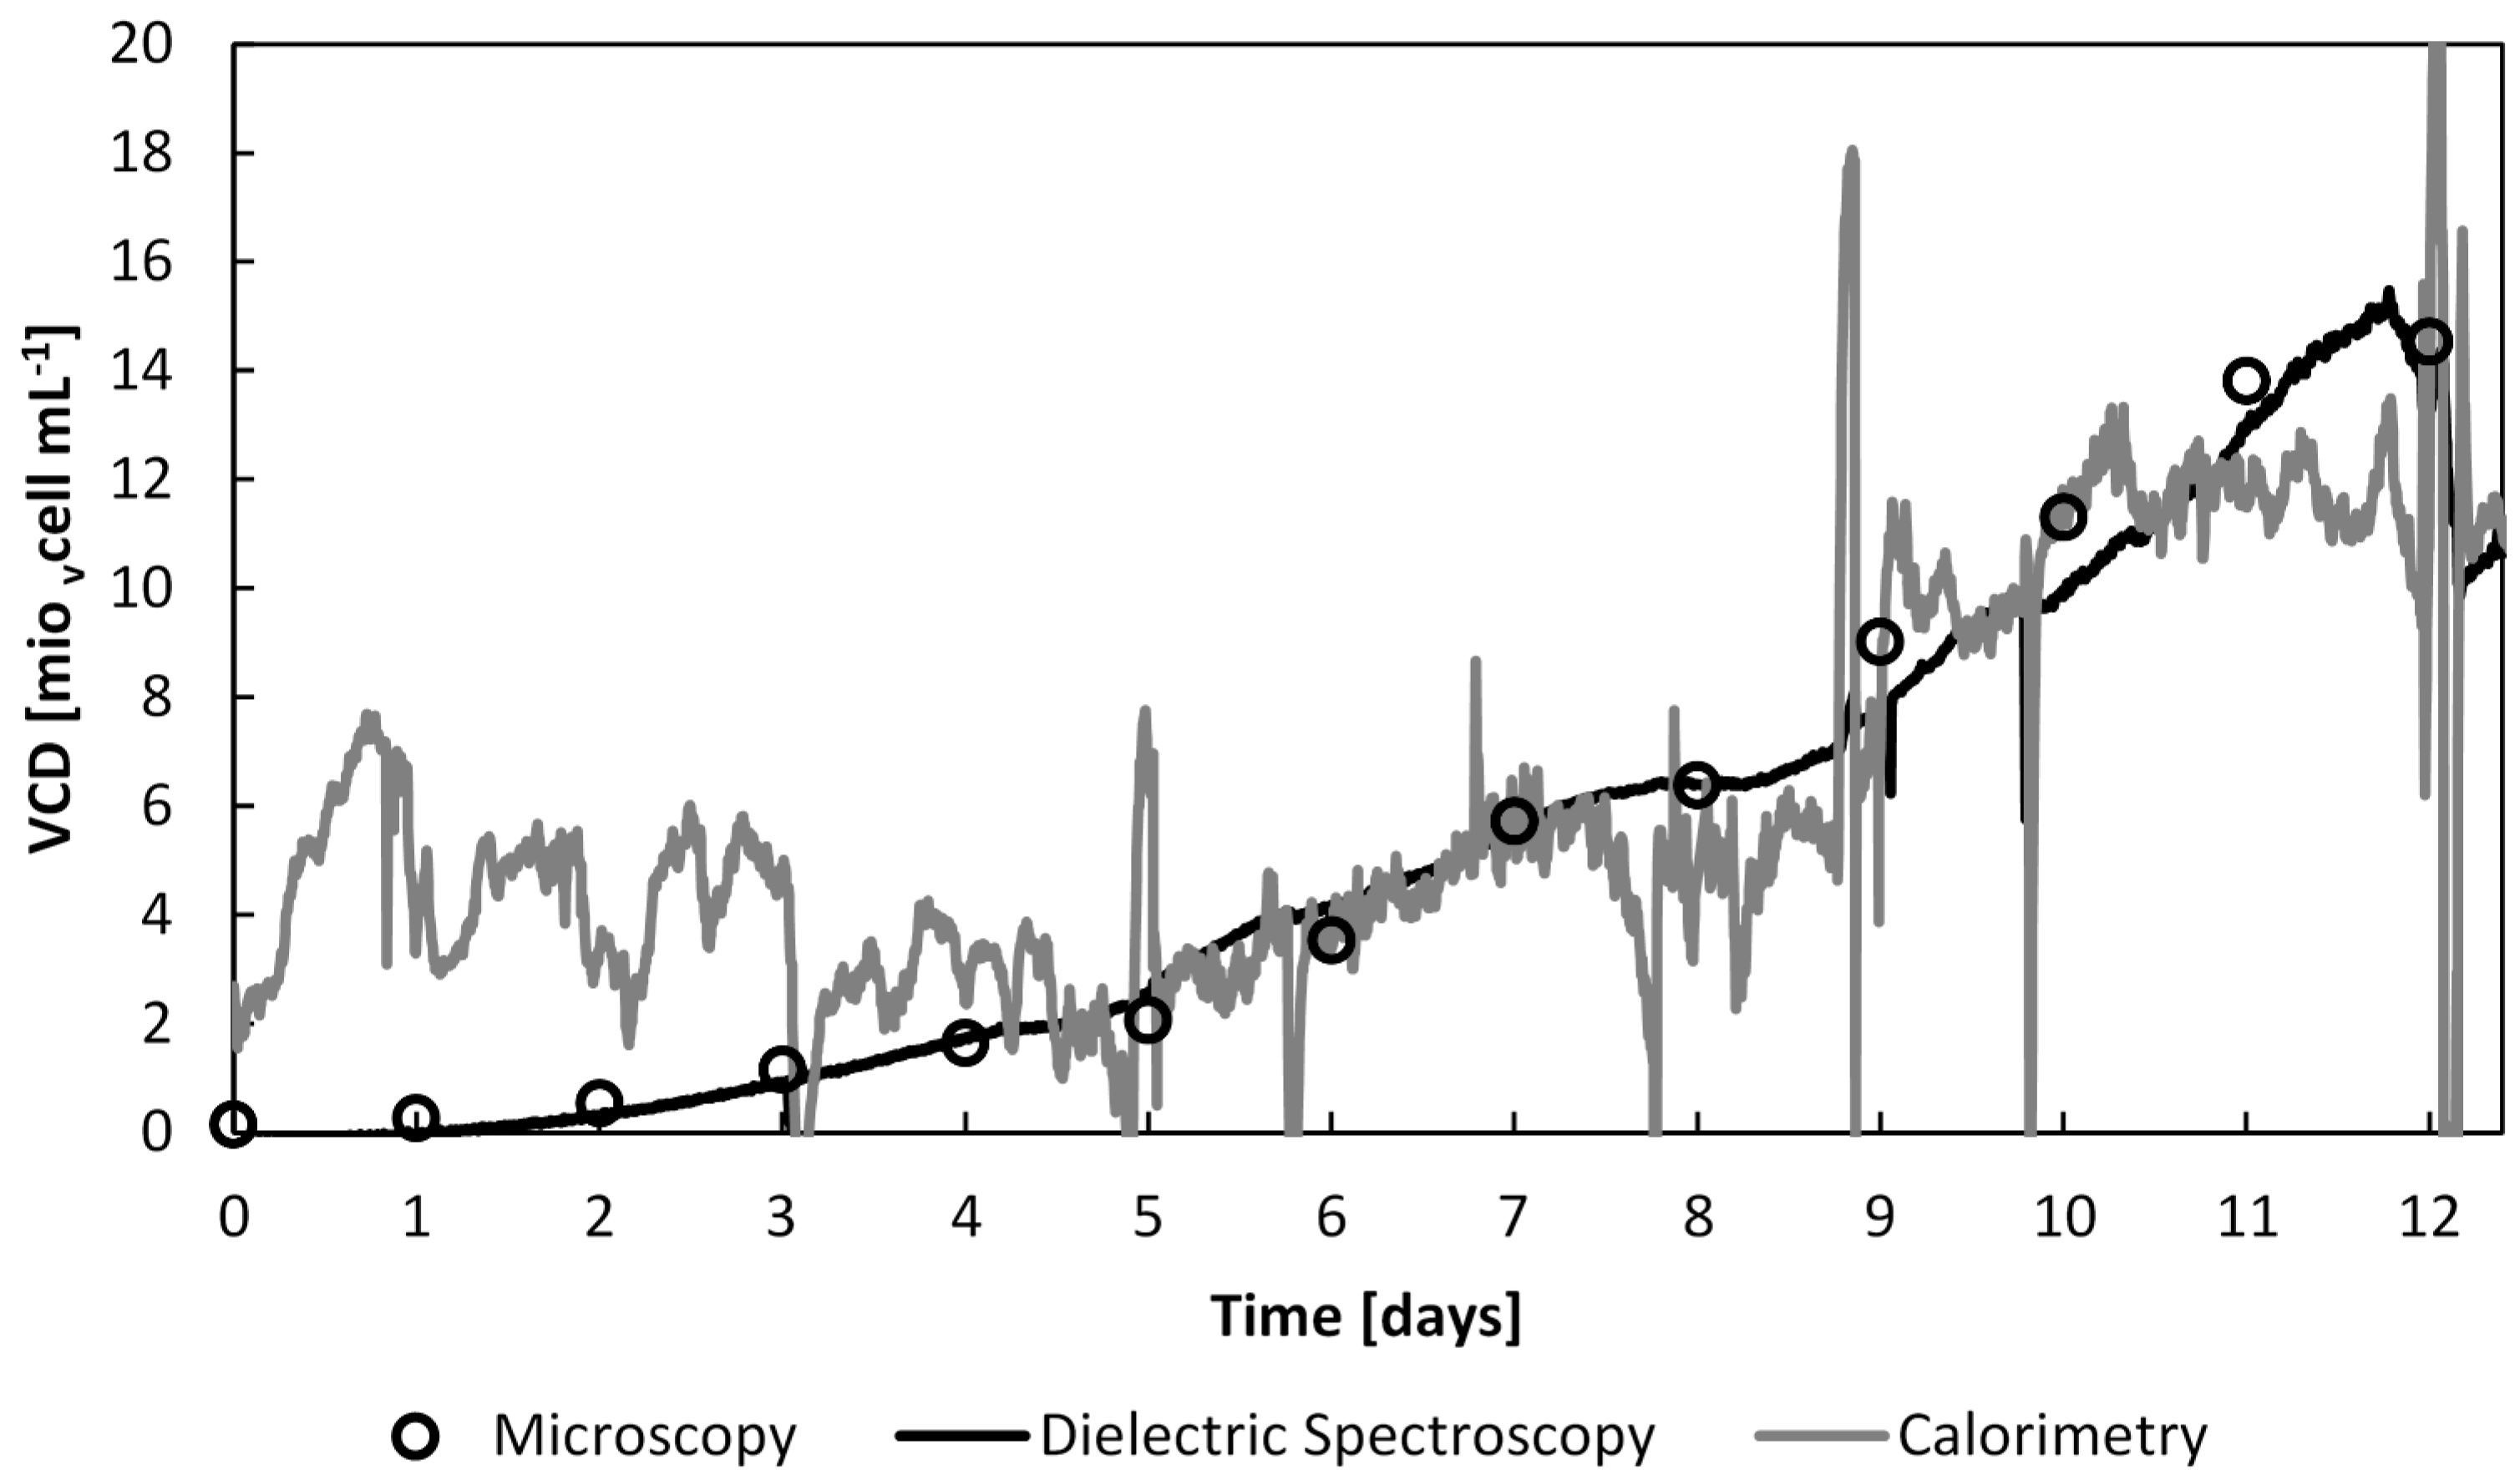
The perfusion cultures were operated in two distinct phases: batch and perfusion phase. The batch phase lasted 4 days, until the viable cell density reached 1.7 × 10⁶ vcells∙mL−1WV. The feed was then supplied at 1.7 L∙day−1 for a duration of 8 days, and ended 12 days after inoculation. A maximum cell density of 15 × 106 vcells∙mL−1WV was achieved; a 5-fold augmentation of the viable cell density compared to batch cultures (3 ×10⁶ vcells∙mL−1WV). The viability remained above 80% throughout, yet the fall in the viable cell density on day 12 was caused by loss of microcapsule stability. The released cells from the ruptured microcapsules were then washed out with the media outflow.
The viable cell density was estimated using three different methods: offline by counting cells under the microscope, by continuous real-time dielectric measurements and the continuous real-time calorimetry measurements. The continuous capacitance measurements were computed into viable cell number by dividing the capacitance with the CHO-DP 12 specific capacitance, 1.44 × 10
−6 pF∙mL∙cm
−1∙cell
−1, and the heat flow rate using the calibration model proposed in
Section 6.2. The viable cell density, assessed by the three monitoring methods throughout the full culture time, is displayed in
Figure 11.
Figure 11.
The viable cell density evolution throughout the whole culture time estimated by off-line cell counts, dielectric spectroscopy and calorimetry.
Figure 11.
The viable cell density evolution throughout the whole culture time estimated by off-line cell counts, dielectric spectroscopy and calorimetry.
As expected, and previously demonstrated, the cell density determined by dielectric spectroscopy and microscopy are highly correlated, from the beginning of the culture. On the other hand, the heat flow rate measurements did not provide accurate information before day 6, after which the cell density was above 4 × 10⁶ vcells∙mL−1WV.
The headspace of the culture was enriched with initially 5% CO
2 to stabilise the pH between 7.2 and 7.4. With the progression of the culture and the accumulation of lactate,
Figure 12, the CO
2 enrichment is punctually diminished, once a day, when sampling, to avoid the pH dropping below 7. This was undertaken to avoid unnecessary NaOH addition to the culture and calorimetric signal interference. The step-wise reduction off CO
2 has subsequently an effect on the heat signal. Indeed, the dissolution of CO
2 into water has an enthalpy of −375 kJ∙kg
−1 or −16.5 kJ∙kg
−1 [
41].
Moreover, a shift of metabolism occurred after day 10. The heat flow rate evolved in a similar manner to the offline cell counts and online capacitance data. However, after day 10, the heat flow rate stabilises at 0.8 W, the equivalent of at 11 × 106 vcells∙mL−1WV. This stabilisation of the heat flow rate signal may be explained by the observed reduction of the microencapsulated cell growth rate by 50% from 0.62 day−1 to 0.29 day−1.
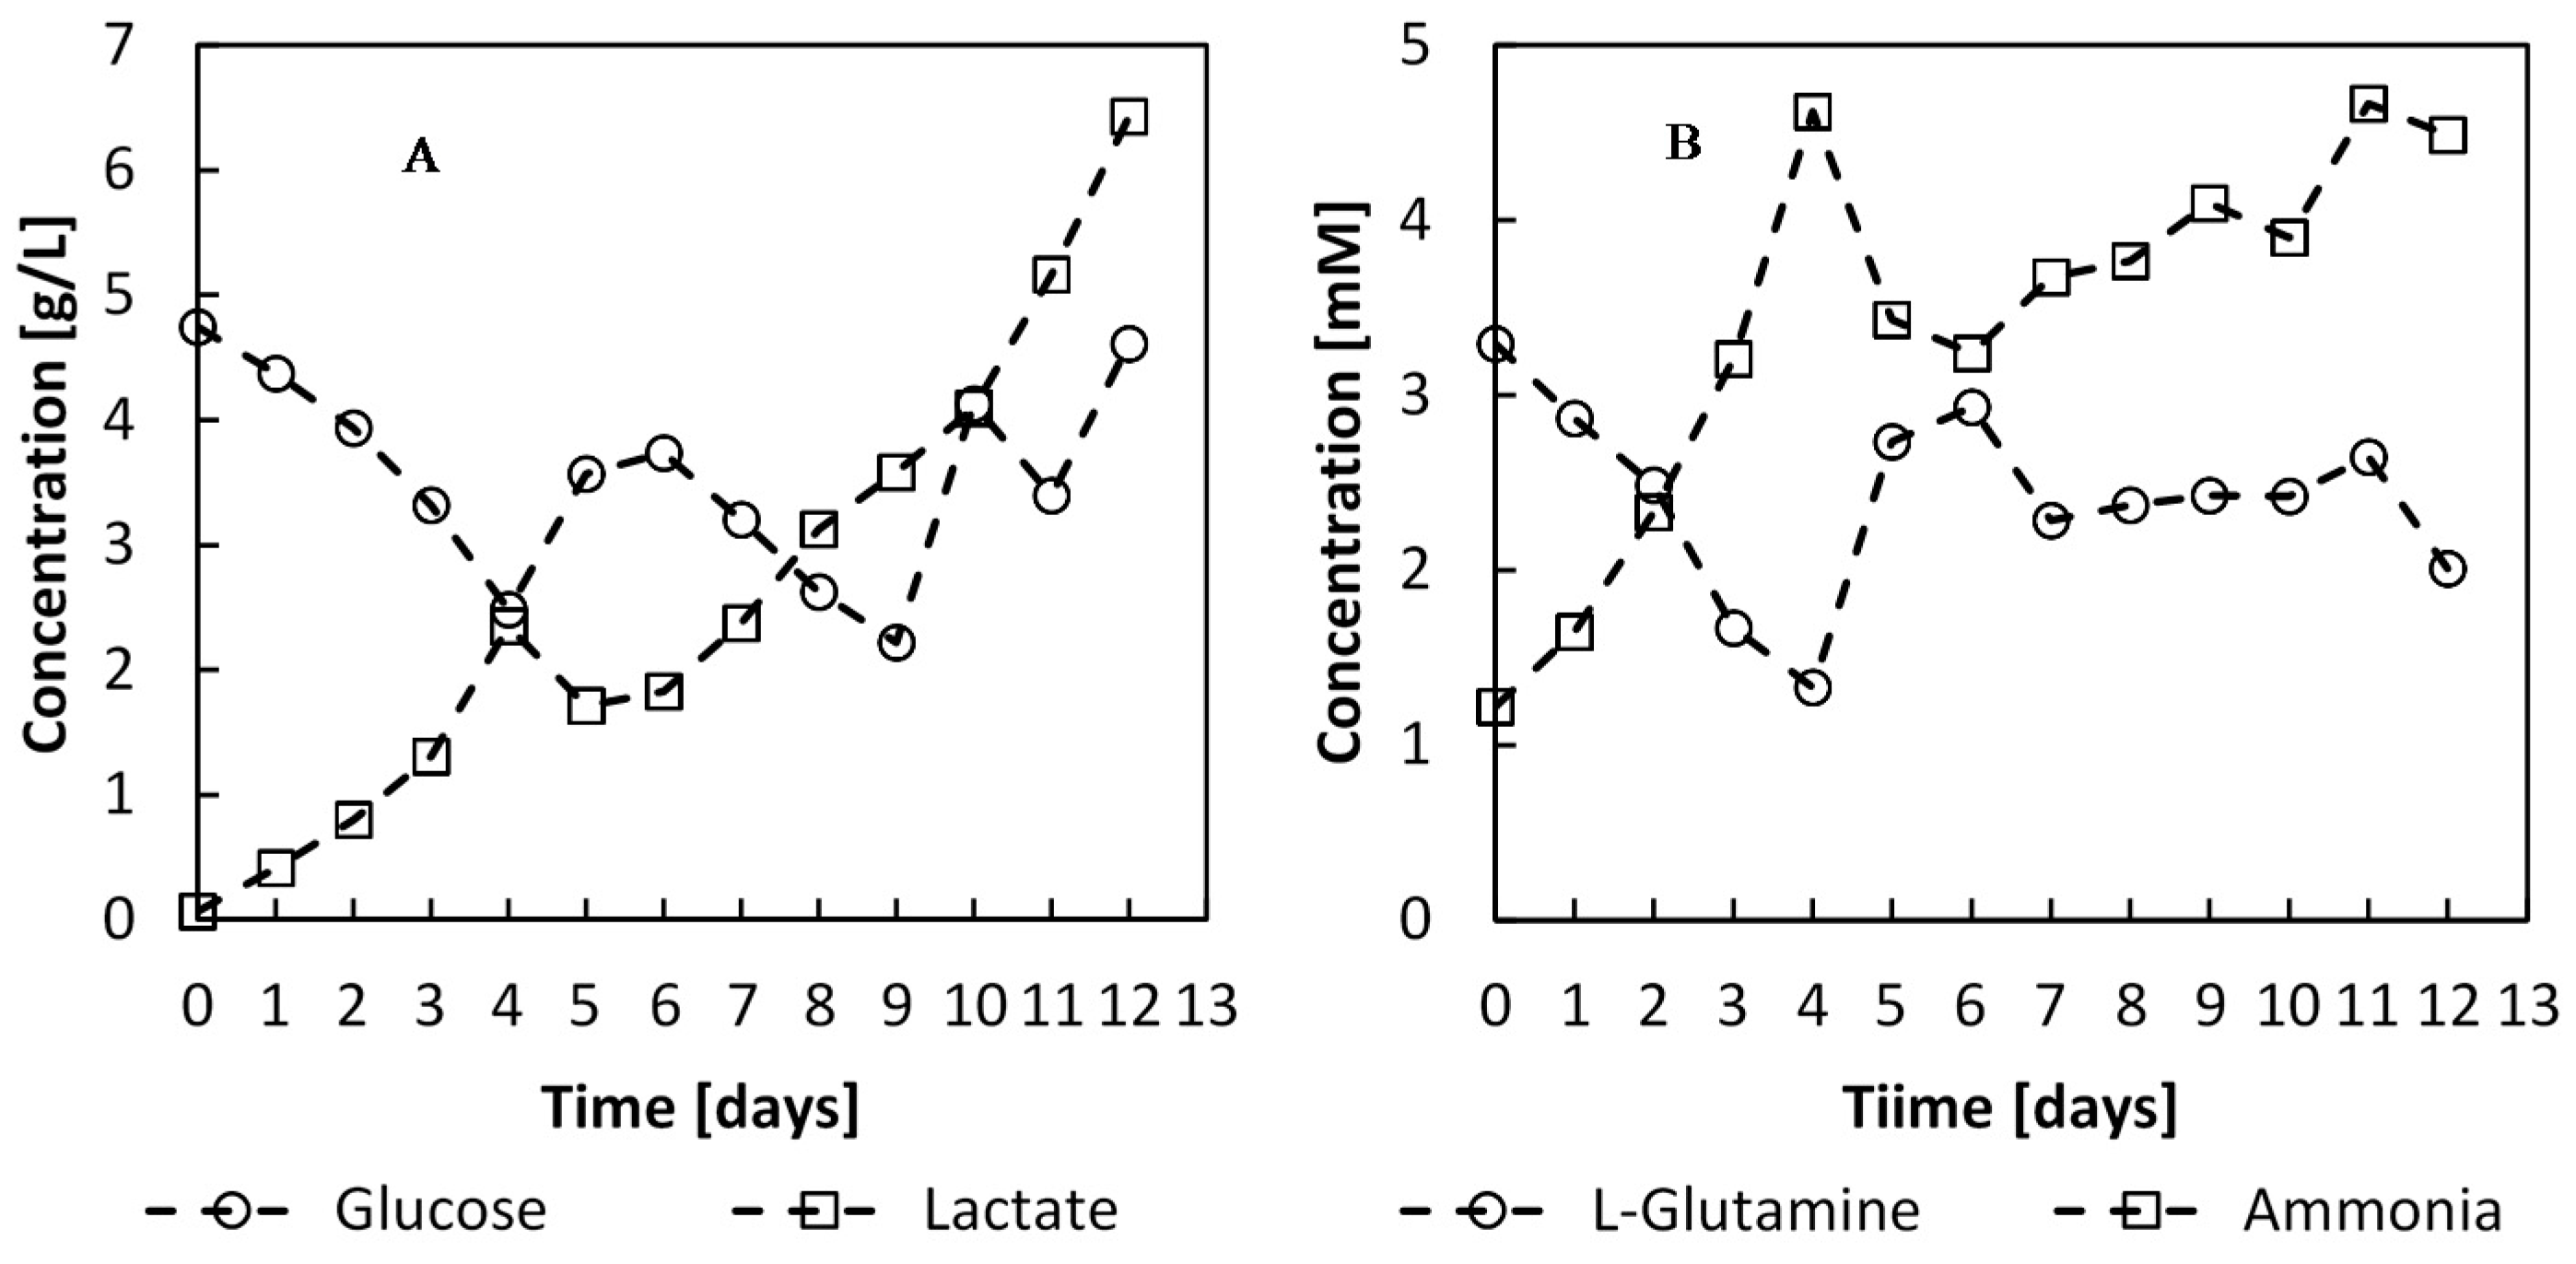
Figure 12.
Metabolite concentrations during the batch and perfusion phases of the culture. The perfusion phase was initiated on day 4 with a feed rate of 1.7 L·day−1.
Figure 12.
Metabolite concentrations during the batch and perfusion phases of the culture. The perfusion phase was initiated on day 4 with a feed rate of 1.7 L·day−1.
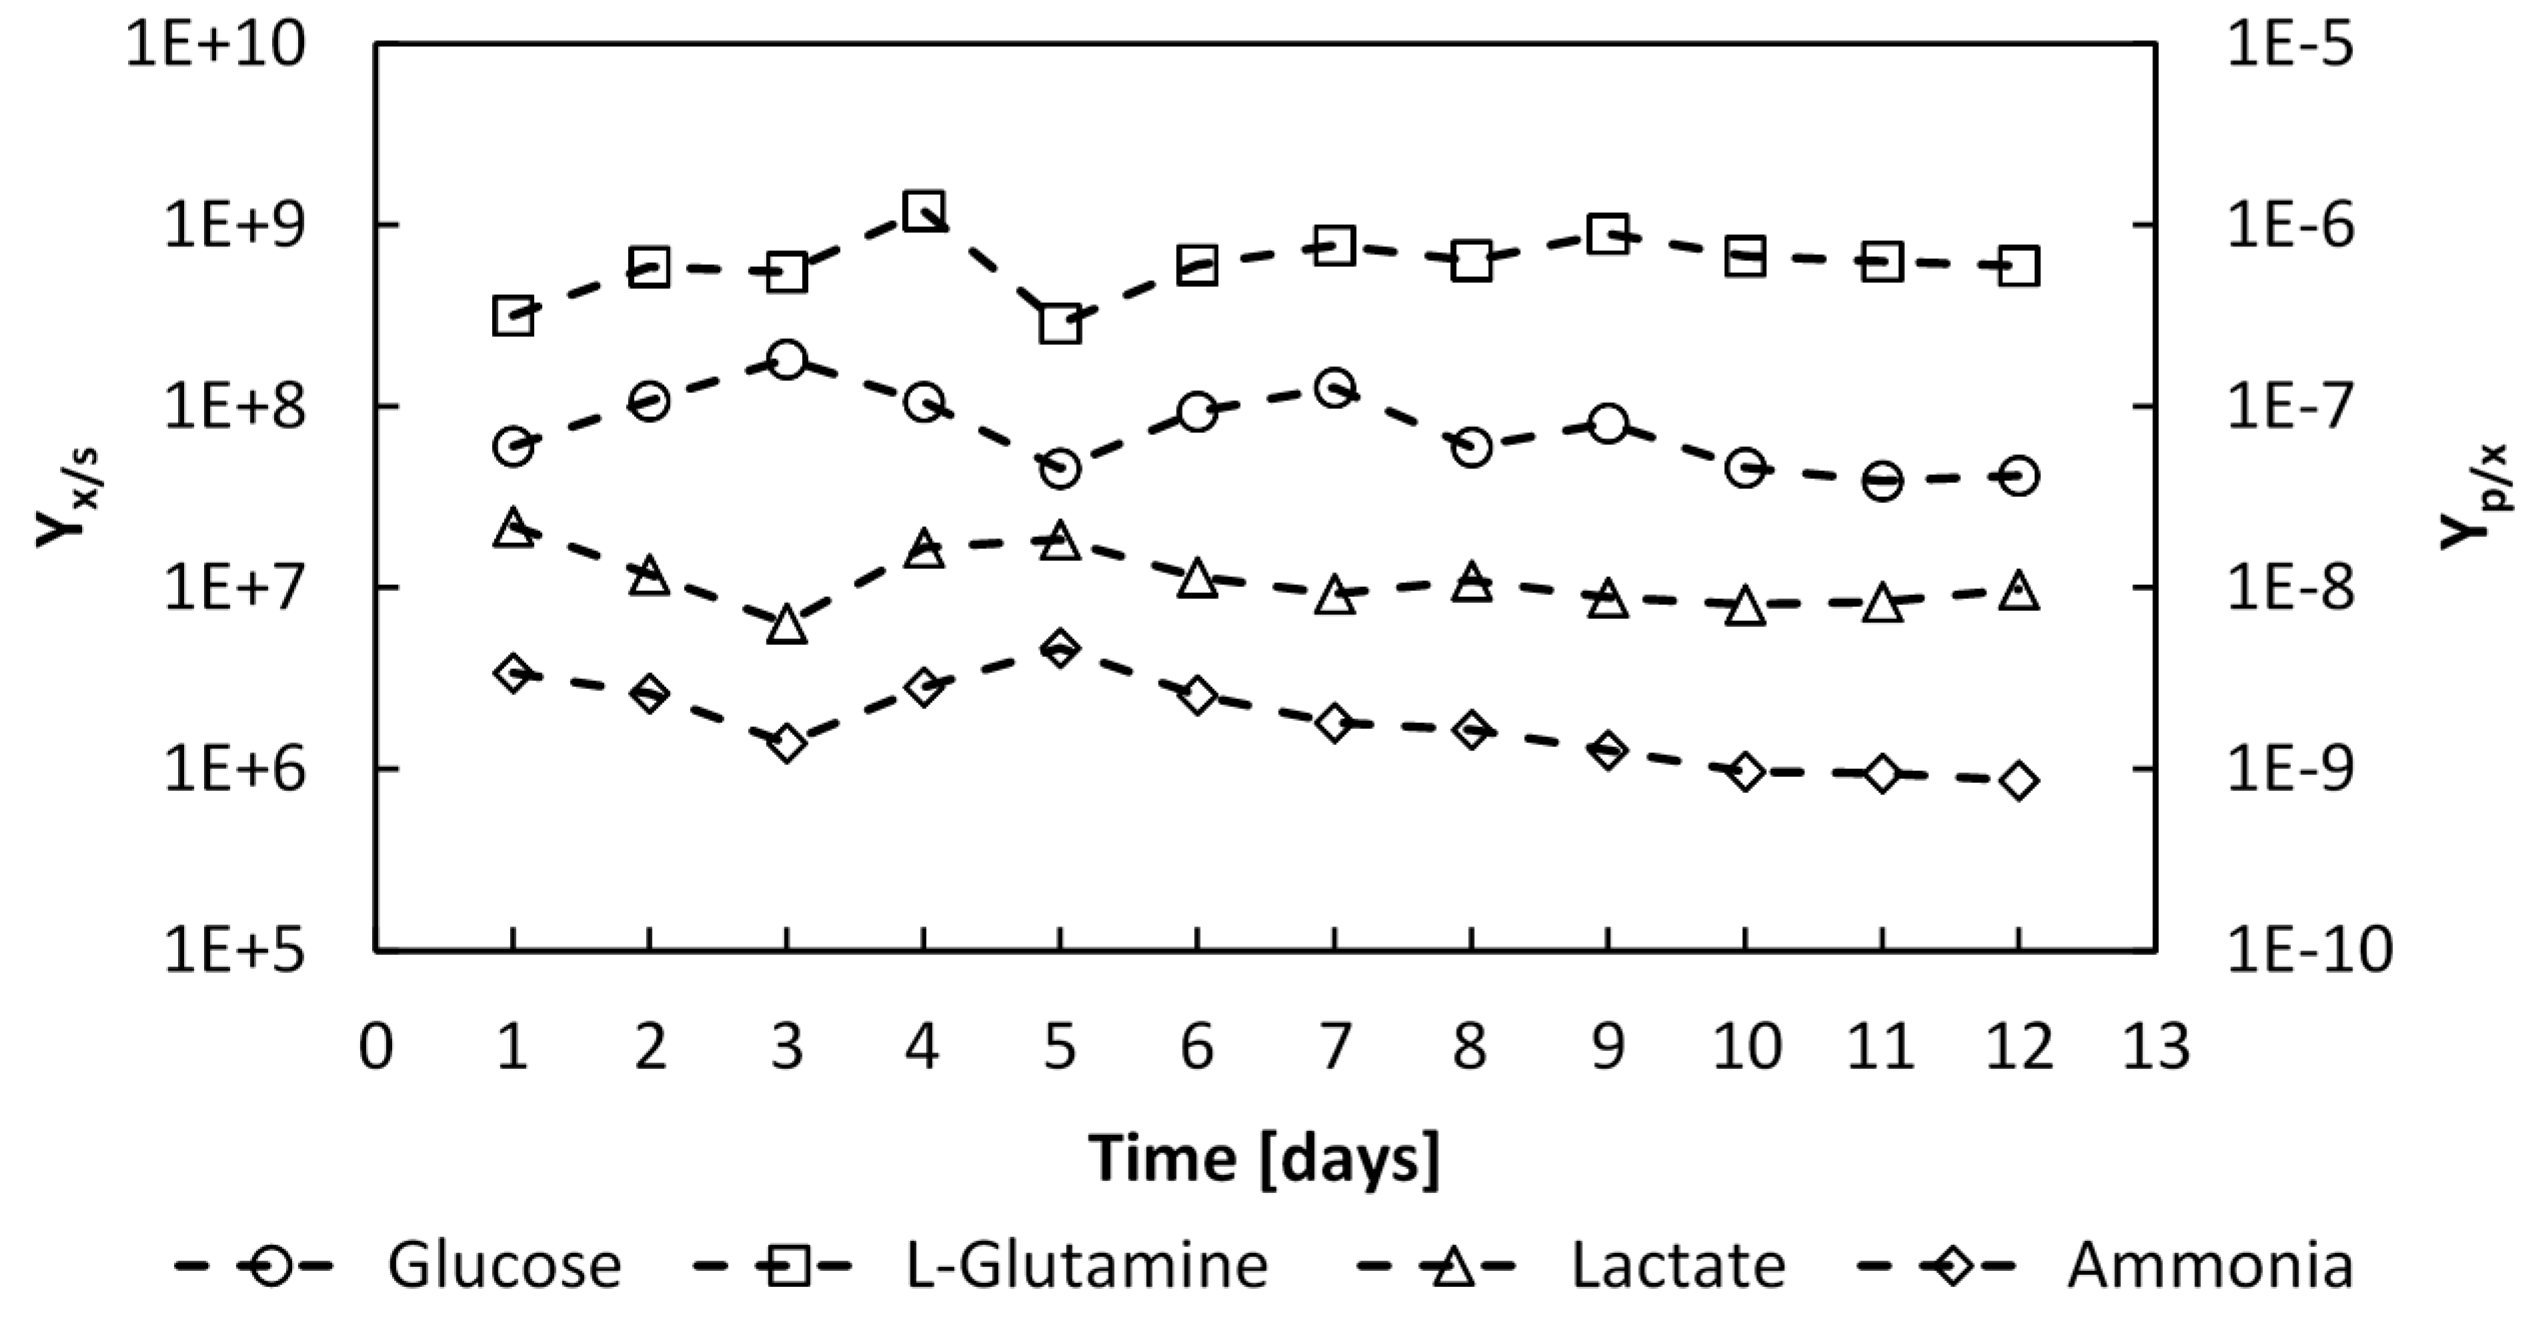
Figure 13.
Evolution of the glucose and L-glutamine to number of cells yields YX⁄S, and the produced lactate and ammonia to cells yields, YP⁄X, over the whole culture period, expressed in (cells∙mmol−1) and (mmol∙cell−1) respectively.
Figure 13.
Evolution of the glucose and L-glutamine to number of cells yields YX⁄S, and the produced lactate and ammonia to cells yields, YP⁄X, over the whole culture period, expressed in (cells∙mmol−1) and (mmol∙cell−1) respectively.
The substrate to biomass yields were determined during the batch phase to be
YX⁄glc = 1.28 × 10
8 cells∙mmol
−1 and
YX⁄gln = 8.66 × 10
8 cells∙mmol
−1, and remained constant throughout the perfusion phase,
Figure 13. The product to biomass yields also remained constant with values of
YLac⁄X =1.18 × 10
−8 mmol∙cell
−1 and
YNH3⁄X =2.09 × 10
−9 mmol∙cell
−1. Thus, since the substrate to biomass yield and product to biomass yields remained constant throughout the culture, this would indicate that no shift in the catabolic pathways occurred.
The perfusion feed, initiated on day 4, provided the cells with sufficient glucose and
L-glutamine for optimal growth, and these nutrients did not become limiting (
Figure 12). The perfusion feed and continuous removal of medium reduced the accumulation of metabolic by-products, which may have important undesirable cell growth inhibition effects and change the protein glycosylation profile [
42,
43,
44]. After day 10, the lactate concentration was found to be upto 4 g∙L
−1, and accumulated upto 6.4 g∙L
−1, and the cell growth rate dropped to 0.29 day
−1.
Finally, the CHO-DP12 12 cells produced a recombinant IgG
1 protein at the rate of 25.52 pg∙cell
−1∙day
−1. The perfusion culture generated a total of 2.4 g of IgG
1,
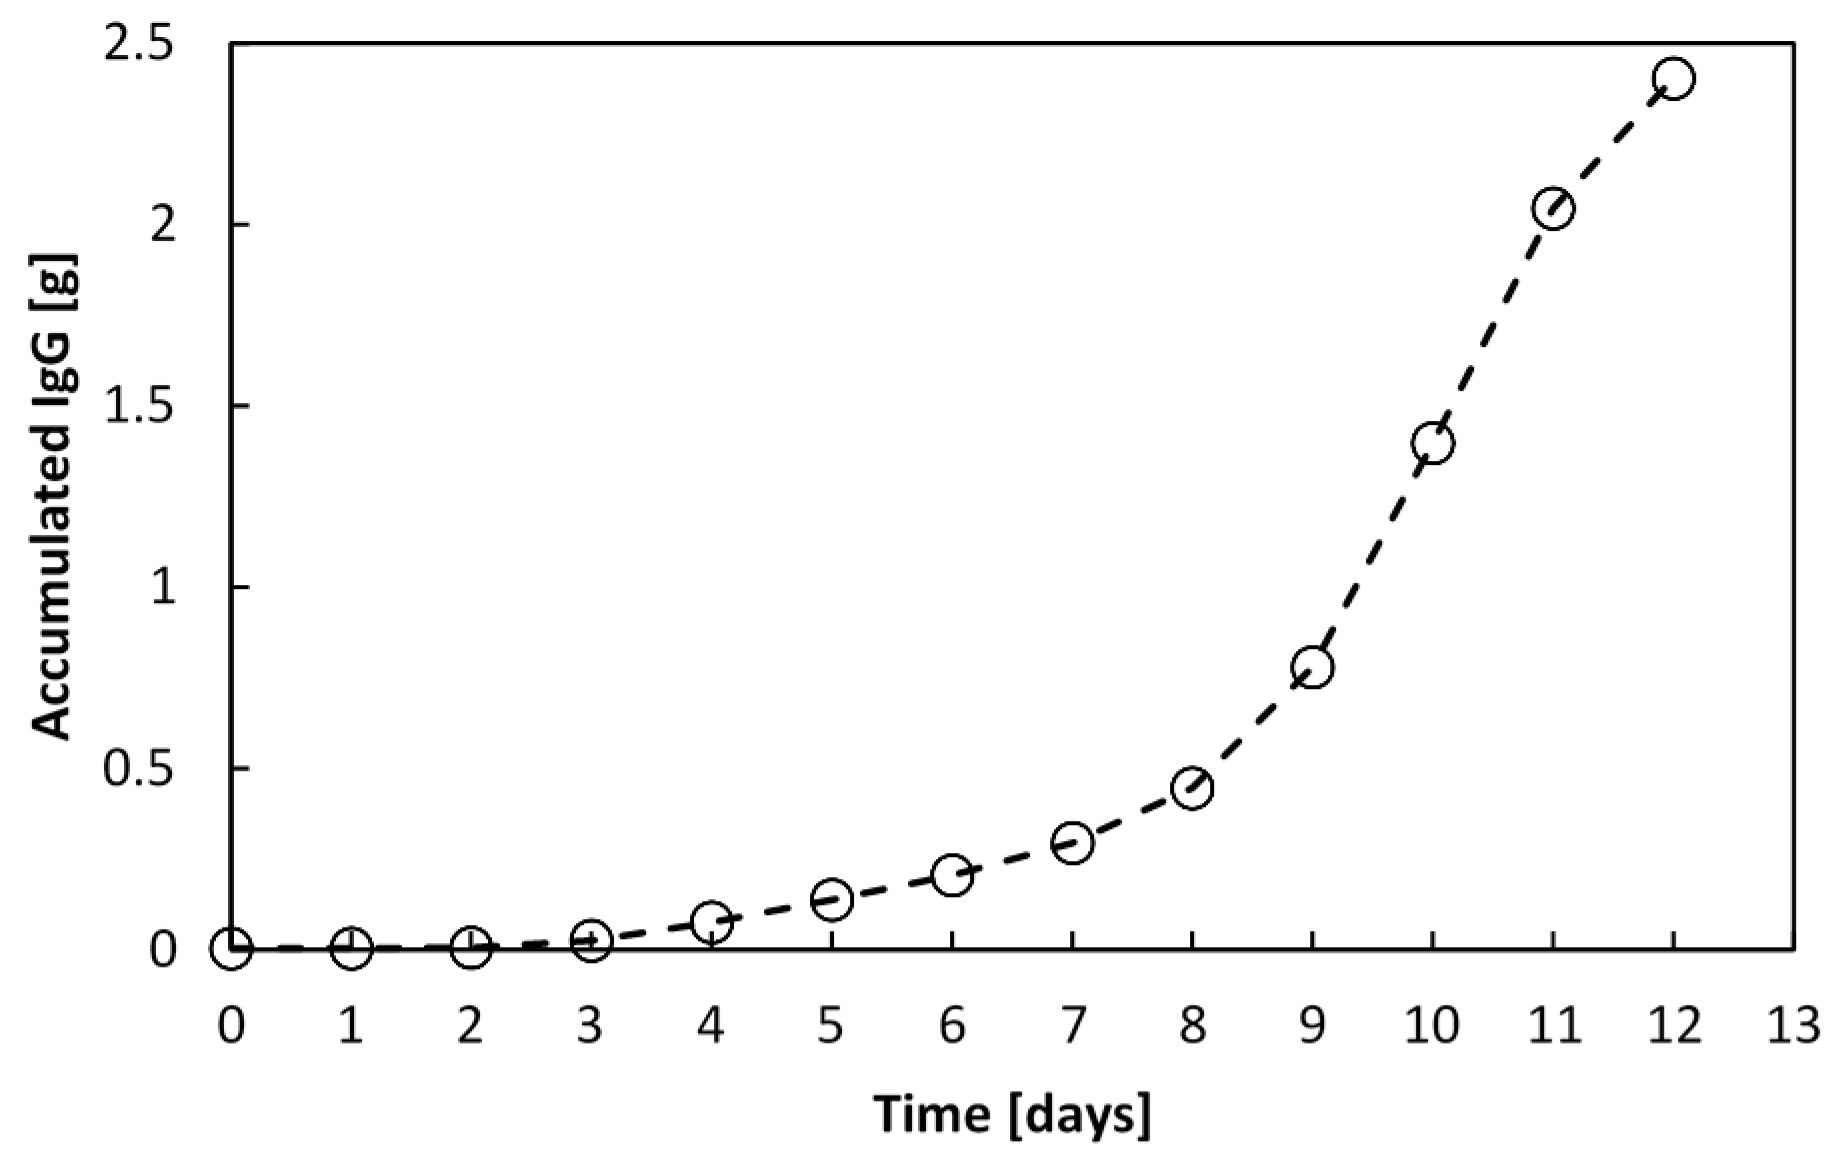
Figure 14, which is 39.7-fold the amount synthesised in a batch culture.
Figure 14.
Accumulated recombinant IgG1 manufactured by an encapsulated cell perfusion culture. After 12 days, 2.4 g of IgG1 was produced by 14.5 × 10⁶ vcells∙mL−1WV in a 1.4 L culture.
Figure 14.
Accumulated recombinant IgG1 manufactured by an encapsulated cell perfusion culture. After 12 days, 2.4 g of IgG1 was produced by 14.5 × 10⁶ vcells∙mL−1WV in a 1.4 L culture.
7. Conclusions
Mammalian cell cultures are complex processes and can have important batch- to- batch variations therefore, monitoring mammalian cells is critical. Immobilised cell cultures have an additional barrier to real-time monitoring as the cells are not directly available for analysis. Nevertheless, both dielectric spectroscopy and biocalorimetry were shown to have potential at all scales of operation. Dielectric spectroscopy offers direct viable cell number monitoring in different types of immobilized mammalian cell culture. Though a calibration may be necessary, the signal is not influenced by the presence of the microcarriers (or microcapsules). Biocalorimetry is readily applicable at large- scale through simple heat balancing methods, but necessitates more sophisticated equipment at bench- sale. Though no studies have investigated the potential use of laboratory scale calorimeters, the RC1 calorimeter has a resolution comparable to microcalorimeters which have previously been used to monitor CHO suspension cells.
The perfusion culture yielded viable cell density of 15 × 106 vcells∙mL−1WV, a 5-fold higher density in comparison to batch cultures. The microcapsules contained an average of 1.34 × 10⁴ cells∙capsule−1, representing 43.6% of the microcapsule internal volume. The cell development was monitored on-line by dielectric spectroscopy and biocalorimetry. Both capacitance and heat flow rate measurements correlated with viable cell density using the calibration models and compared to the viable cell density determined off-line microscopically, counted under the microscope. The capacitance signal followed cell growth reliably, from inoculation through to the decline phase. The heat signal also provided accurate information upon the culture development from day 6 onwards, from 4 × 10⁶ vcells∙mL−1WV. Between day 6 and day 10, the cells grew at a rate of 0.62 day−1. Although no apparent change in the analysed substrates and products to biomass yields was observed, after day 10, the growth rate fell to 0.29 day−1.
Reaction calorimetry can follow cellular activity of high cell densities but can precisely quantify the number of cells per unit volume only above 26.88 × 10⁶ vcells∙mL−1WV. Higher cell densities are theoretically achievable, but further microcapsule stabilisation studies must be undertaken to avoid capsule breakage and associated cell loss.
Additionally, this study is a stepping stone towards using continuous heat flow rate measurements to evaluate in real-time cell activity at industrial scale. This work involved growing cells in a working volume of 1.4 L. At this scale, the surface area to volume ratio is high, consequently, the heat losses to the environment are significantly [
31,
45]. However, large reactors e.g., 12.5 m
3 have a much lower surface area to volume ratio, meaning that the heat loss is much smaller. Therefore, a larger difference between
Tr and
Tj is necessary to maintain the CHO culture at the set reactor temperature, [
32,
33] and accurate heat flow measurements can be made.


