Article

Dynamic Modeling of Cell-Free Biochemical Networks Using Effective Kinetic Models

School of Chemical and Biomolecular Engineering, Cornell University, Ithaca, NY 14853, USA
*
Author to whom correspondence should be addressed.
Processes 2015, 3(1), 138-160; https://doi.org/10.3390/pr3010138
Submission received: 8 September 2014 / Revised: 16 February 2015 / Accepted: 17 February 2015 / Published: 3 March 2015
(This article belongs to the Special Issue Dynamic Approaches to Metabolic Modeling and Metabolic Engineering)

Abstract

:
Cell-free systems offer many advantages for the study, manipulation and modeling of metabolism compared to in vivo processes. Many of the challenges confronting genome-scale kinetic modeling can potentially be overcome in a cell-free system. For example, there is no complex transcriptional regulation to consider, transient metabolic measurements are easier to obtain, and we no longer have to consider cell growth. Thus, cell-free operation holds several significant advantages for model development, identification and validation. Theoretically, genome-scale cell-free kinetic models may be possible for industrially important organisms, such as E. coli, if a simple, tractable framework for integrating allosteric regulation with enzyme kinetics can be formulated. Toward this unmet need, we present an effective biochemical network modeling framework for building dynamic cell-free metabolic models. The key innovation of our approach is the integration of simple effective rules encoding complex allosteric regulation with traditional kinetic pathway modeling. We tested our approach by modeling the time evolution of several hypothetical cell-free metabolic networks. We found that simple effective rules, when integrated with traditional enzyme kinetic expressions, captured complex allosteric patterns such as ultrasensitivity or non-competitive inhibition in the absence of mechanistic information. Second, when integrated into network models, these rules captured classic regulatory patterns such as product-induced feedback inhibition. Lastly, we showed, at least for the network architectures considered here, that we could simultaneously estimate kinetic parameters and allosteric connectivity from synthetic data starting from an unbiased collection of possible allosteric structures using particle swarm optimization. However, when starting with an initial population that was heavily enriched with incorrect structures, our particle swarm approach could converge to an incorrect structure. While only an initial proof-of-concept, the framework presented here could be an important first step toward genome-scale cell-free kinetic modeling of the biosynthetic capacity of industrially important organisms.

1. Introduction

Mathematical modeling has long contributed to our understanding of metabolism. Decades before the genomics revolution, mechanistically, structured metabolic models arose from the desire to predict microbial phenotypes resulting from changes in intracellular or extracellular states [1]. The single cell E. coli models of Shuler and coworkers pioneered the construction of large-scale, dynamic metabolic models that incorporated multiple, regulated catabolic and anabolic pathways constrained by experimentally determined kinetic parameters [2]. Shuler and coworkers generated many single cell kinetic models, including single cell models of eukaryotes [3,4], minimal cell architectures [5], as well as DNA sequence based whole-cell models of E. coli [6]. Conversely, highly abstracted kinetic frameworks, such as the cybernetic framework, represented a paradigm shift, viewing cells as growth-optimizing strategists [7]. Cybernetic models have been highly successful at predicting metabolic choice behavior, e.g., diauxie behavior [8], steady-state multiplicity [9], as well as the cellular response to metabolic engineering modifications [10]. Unfortunately, traditional, fully structured cybernetic models also suffer from an identifiability challenge, as both the kinetic parameters and an abstracted model of cellular objectives must be estimated simultaneously. However, recent cybernetic formulations from Ramkrishna and colleagues have successfully treated this identifiability challenge through elementary mode reduction [11,12].
In the post genomics world, large-scale stoichiometric reconstructions of microbial metabolism popularized by static, constraint-based modeling techniques such as flux balance analysis (FBA) have become standard tools [13]. Since the first genome-scale stoichiometric model of E. coli, developed by Edwards and Palsson [14], well over 100 organisms, including industrially important prokaryotes such as E. coli [15] or B. subtilis [16], are now available [17]. Stoichiometric models rely on a pseudo-steady-state assumption to reduce unidentifiable genome-scale kinetic models to an underdetermined linear algebraic system, which can be solved efficiently even for large systems. Traditionally, stoichiometric models have also neglected explicit descriptions of metabolic regulation and control mechanisms, instead opting to describe the choice of pathways by prescribing an objective function on metabolism. Interestingly, similar to early cybernetic models, the most common metabolic objective function has been the optimization of biomass formation [18], although other metabolic objectives have also been estimated [19]. Recent advances in constraint-based modeling have overcome the early shortcomings of the platform, including capturing metabolic regulation and control [20]. Thus, modern constraint-based approaches have proven extremely useful in the discovery of metabolic engineering strategies and represent the state of the art in metabolic modeling [21,22]. However, genome-scale kinetic models of industrial important organisms such as E. coli have yet to be constructed.
Cell-free systems offer many advantages for the study, manipulation and modeling of metabolism compared to in vivo processes. Central amongst these advantages is direct access to metabolites and the microbial biosynthetic machinery without the interference of a cell wall. This allows us to control as well as interrogate the chemical environment while the biosynthetic machinery is operating, potentially at a fine time resolution. Second, cell-free systems also allow us to study biological processes without the complications associated with cell growth. Cell-free protein synthesis (CFPS) systems are arguably the most prominent examples of cell-free systems used today [23]. However, CFPS is not new; CFPS in crude E. coli extracts has been used since the 1960s to explore fundamentally important biological mechanisms [24,25]. Today, cell-free systems are used in a variety of applications ranging from therapeutic protein production [26] to synthetic biology [27]. Interestingly, many of the challenges confronting genome-scale kinetic modeling can potentially be overcome in a cell-free system. For example, there is no complex transcriptional regulation to consider, transient metabolic measurements are easier to obtain, and we no longer have to consider cell growth. Thus, cell-free operation holds several significant advantages for model development, identification and validation. Theoretically, genome-scale cell-free kinetic models may be possible for industrially important organisms, such as E. coli or B. subtilis, if a simple, tractable framework for integrating allosteric regulation with enzyme kinetics can be formulated.
In this study, we present an effective biochemical network modeling framework for building dynamic cell-free metabolic models. The key innovation of our approach is the seamless integration of simple effective rules encoding complex regulation with traditional kinetic pathway modeling. This integration allows the description of complex regulatory interactions, such as time-dependent allosteric regulation of enzyme activity, in the absence of specific mechanistic information. The regulatory rules are easy to understand, easy to formulate and do not rely on overarching theoretical abstractions or restrictive assumptions. We tested our approach by modeling the time evolution of several hypothetical cell-free metabolic networks. In particular, we tested whether our effective modeling approach could describe classically expected enzyme kinetic behavior, and second whether we could simultaneously estimate kinetic parameters and regulatory connectivity, in the absence of specific mechanistic knowledge, from synthetic experimental data. Toward these questions, we explored five hypothetical cell-free networks. Each network shared the same enzymatic connectivity, but had different allosteric regulatory connectivity. We found that simple effective rules, when integrated with traditional enzyme kinetic expressions, captured complex allosteric patterns such as ultrasensitivity or non-competitive inhibition in the absence of mechanistic information. Second, when integrated into network models, these rules captured classical regulatory patterns such as product-induced feedback inhibition. Lastly, we showed, at least for the network architectures considered here, that we could simultaneously estimate kinetic parameters and allosteric connectivity from synthetic data starting from an unbiased collection of possible allosteric structures using particle swarm optimization. However, when starting with an initial population that was heavily enriched with incorrect structures, our particle swarm approach could converge to an incorrect structure. While only an initial proof-of-concept, the framework presented here could be an important first step toward genome-scale cell-free kinetic modeling of the biosynthetic capacity of industrially important organisms.

2. Results

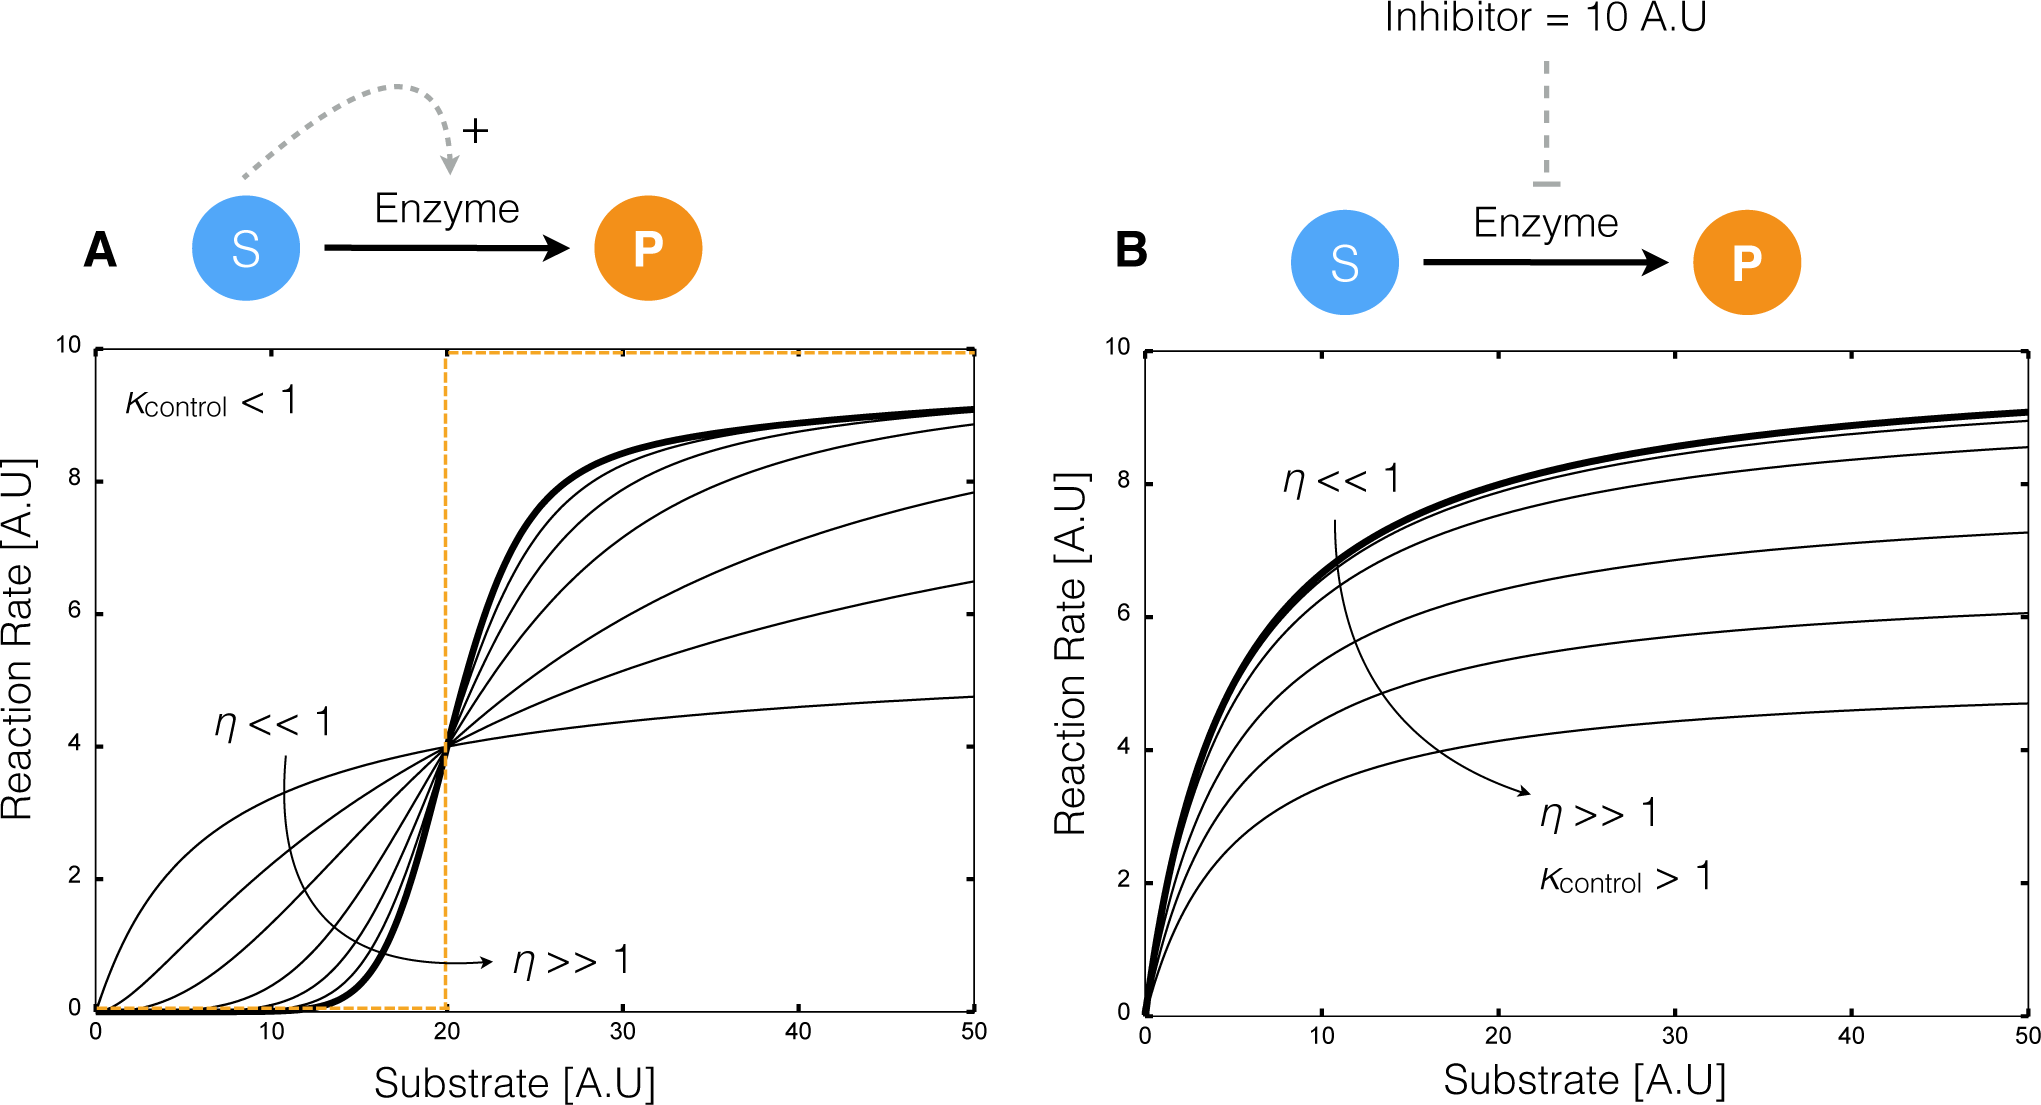
2.1. Formulation and Properties of Effective Cell-Free Metabolic Models

We developed two proof-of-concept metabolic networks to investigate the features of our effective biochemical network modeling approach (Figure 1). In both examples, substrate S was converted to the end products P1 and P2 through a series of enzymatically catalyzed reactions, including a branch point at hypothetical metabolite M2. Several of these reactions involved cofactor dependence (AH or A), and various allosteric regulatory mechanisms modified the activity of pathway enzymes. Network A included feedback inhibition of the initial pathway enzyme (E1) by pathway end products P1 and P2 (Figure 1A). On the other hand, network B involved feedback inhibition of E1 by P2 and E6 by P1 (Figure 1B). In both networks, branch point enzymes E3 and E6 were subject to feed-forward activation by reduced cofactor AH. Lastly, it is known experimentally that cell-free systems have a finite operational lifespan. Loss of biosynthetic capability could be a function of many factors, e.g., cofactor or metabolite limitations. We modeled the loss of biosynthetic capability as a non-specific first-order decay of enzyme activity.
Allosteric regulation of enzyme activity was modeled by combining individual regulatory contributions to the activity of pathway enzymes into a control coefficient using an integration rule (Figure 2). This strategy is similar in spirit to the Constrained Fuzzy Logic (cFL) approach of Lauffenburger and coworkers which has been used to effectively model signal transduction pathways important in human health [28]. In our formulation, Hill-like transfer functions 0 ≤ f (Ƶ) ≤ 1 were used to calculate the influence of factor abundance upon target enzyme activity. In this context, factors can be individual metabolite levels or some function, e.g., the product of metabolite levels. However, more generally, factors can also correspond to non-modeled influences, categorial variables or other abstract quantities. In the current study, we simply let Ƶ correspond to the abundance of individual metabolites, however in general this can be a complex function of both modeled and unmodeled factors. When an enzyme was potentially sensitive to more than one regulatory input, logical integration rules were used to select which regulatory transfer function influenced enzyme activity at any given time. Thus, our test networks involved important features such as cofactor recycling, enzyme activity and metabolite dynamics, as well as multiple overlapping allosteric regulatory mechanisms.
The rule-based regulatory strategy approximated the behavior of classical allosteric activation and inhibition mechanisms (Figure 3). We considered the enzyme catalyzed conversion of substrate S to a product P, where the overall reaction rate was modeled as the product of a Michaelis-Menten term and an effective allosteric control variable reflecting the particular regulatory interaction. We first explored feed-forward substrate activation of enzyme activity (for both positive and negative cooperativity). Consistent with classical data, the rule-based strategy predicted a sigmoidal relationship between substrate abundance and reaction rate as a function of the cooperativity parameter (Figure 3A). For cooperativity parameters less than unity, increased substrate abundance decreased the maximum reaction rate. This was consistent with the idea that substrate binding decreased at regulatory sites, which negatively impacted substrate binding at the active site. On the other hand, as the cooperativity parameter increased past unity, the rate of conversion of substrate S to product P by enzyme E approached a step function. In the presence of an inhibitor, the rule-based strategy predicted non-competitive like behavior as a function of the cooperativity parameter (Figure 3B). When the control gain parameter, κij in Equaion (10), was greater than unity, the inhibitory force was directly proportional to the cooperativity parameter, η in Equation (10). Thus, as the cooperativity parameter increased, the maximum reaction rate decreased (Figure 3B). Interestingly, our rule-based approach was unable to directly simulate competitive inhibition of enzyme activity. Taken together, the rule-based strategy captured classical regulatory patterns for both enzyme activation and inhibition. Thus, we are able to model complex kinetic phenomena such as ultrasensitivity, despite an effective description of reaction kinetics.
End product yield was controlled by feedback inhibition, while product selectivity was controlled by branch point enzyme inhibition (Figure 4). A critical test of our modeling approach was to simulate networks with known behavior. If we cannot reproduce the expected behavior of simple networks, then our effective modeling strategy, and particularly the rule-based approximation of allosteric regulation, will not be feasible for genome-scale cell-free problems. We considered two cases, control ON/OFF, for each network configuration. Each of these cases had identical kinetic parameters and initial conditions; the only differences between the cases were the allosteric regulation rules and the control parameters associated with these rules. As expected, end product accumulation was larger for network A when the control was OFF (no feedback inhibition of E1 by P1 and P2), as compared to the ON case (Figure 4A). We found this behavior was robust to the choice of underlying kinetic parameters, as we observed that same qualitative response across an ensemble of 100 randomized parameter sets, for fixed control parameters. The control ON/OFF response of network B was more subtle. In the OFF case, the behavior was qualitatively similar to network A. However, for the ON case, flux was diverted away from P2 formation by feedback inhibition of E6 activity at the M2 branch point by P1 (Figure 4B). Lower E6 activity at the M2 branch point allowed more flux toward P1 formation, hence the yield of P1 also increased (Figure 4C). Again, the control ON/OFF behavior of network B was robust to changes in kinetic parameters, as the same qualitative trend was conserved across an ensemble of 100 randomized parameters, for fixed control parameters. Taken together, these simulations suggested that the rule-based allosteric control concept could robustly capture expected feedback behavior for networks with uncertain kinetic parameters.

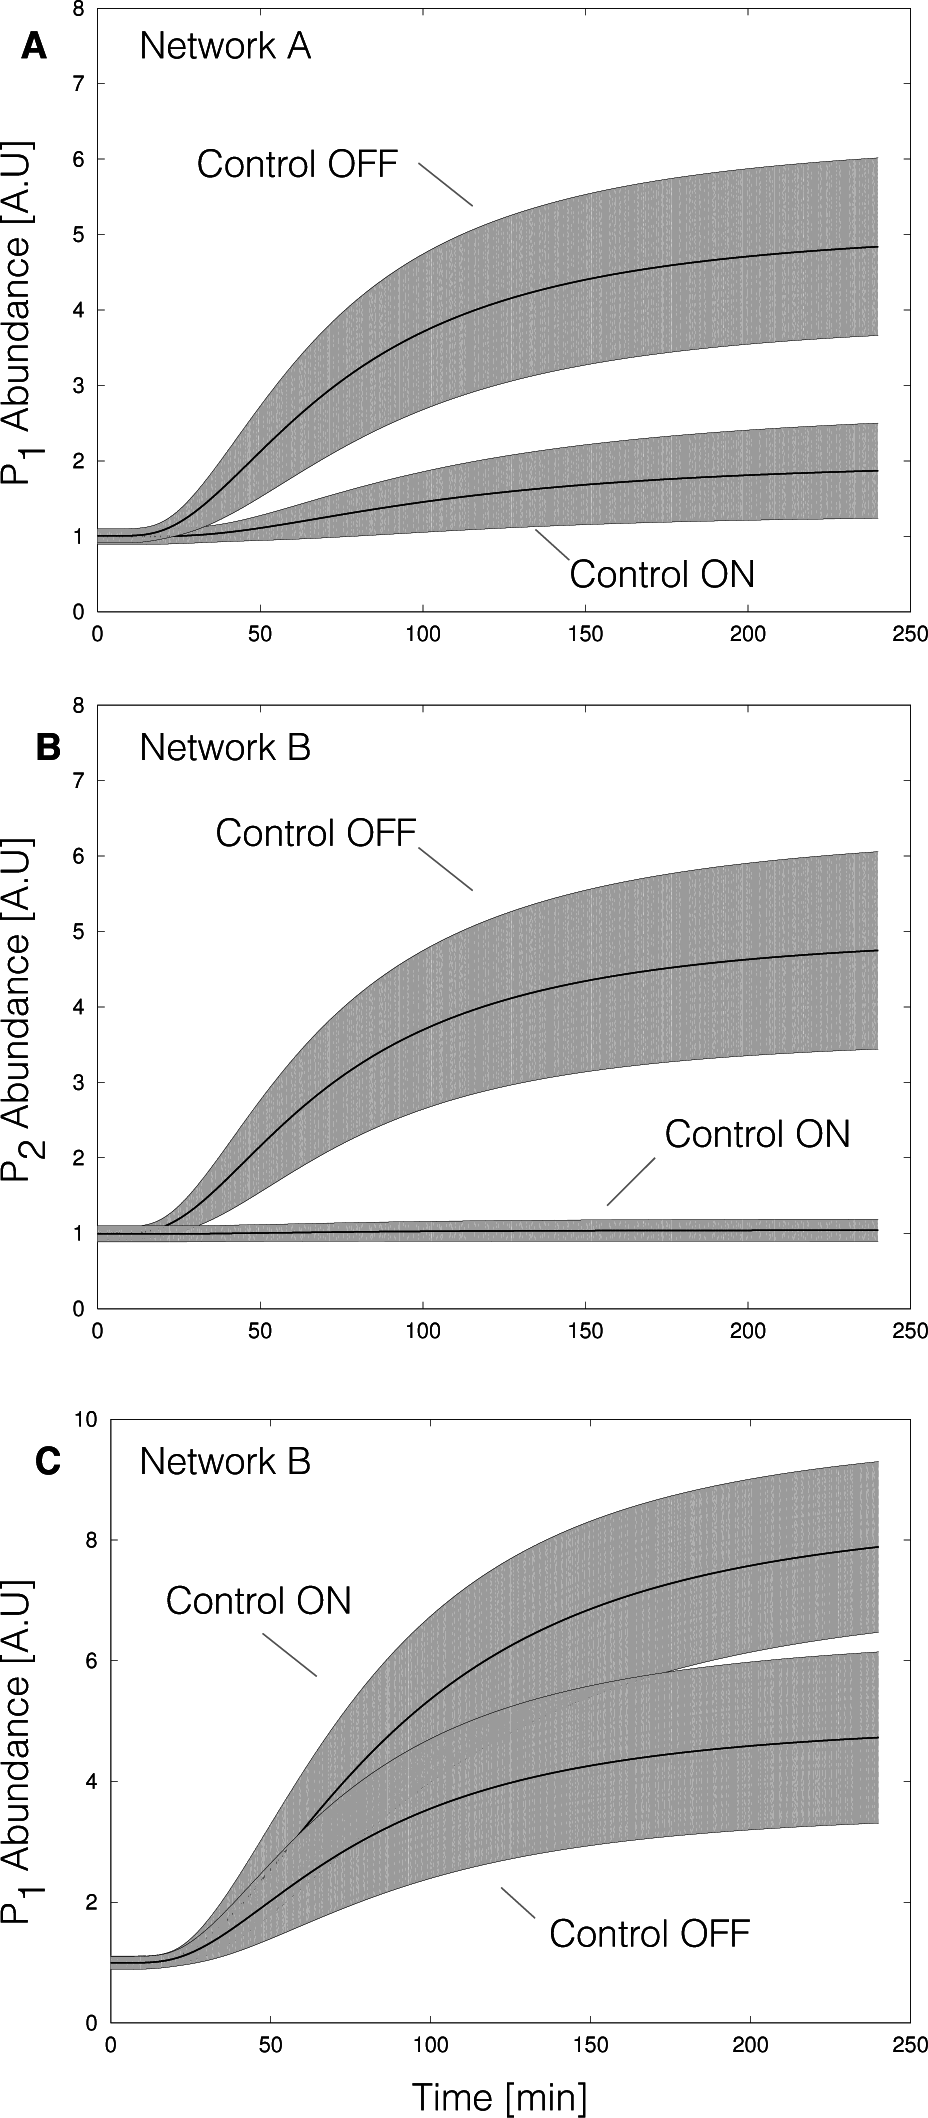
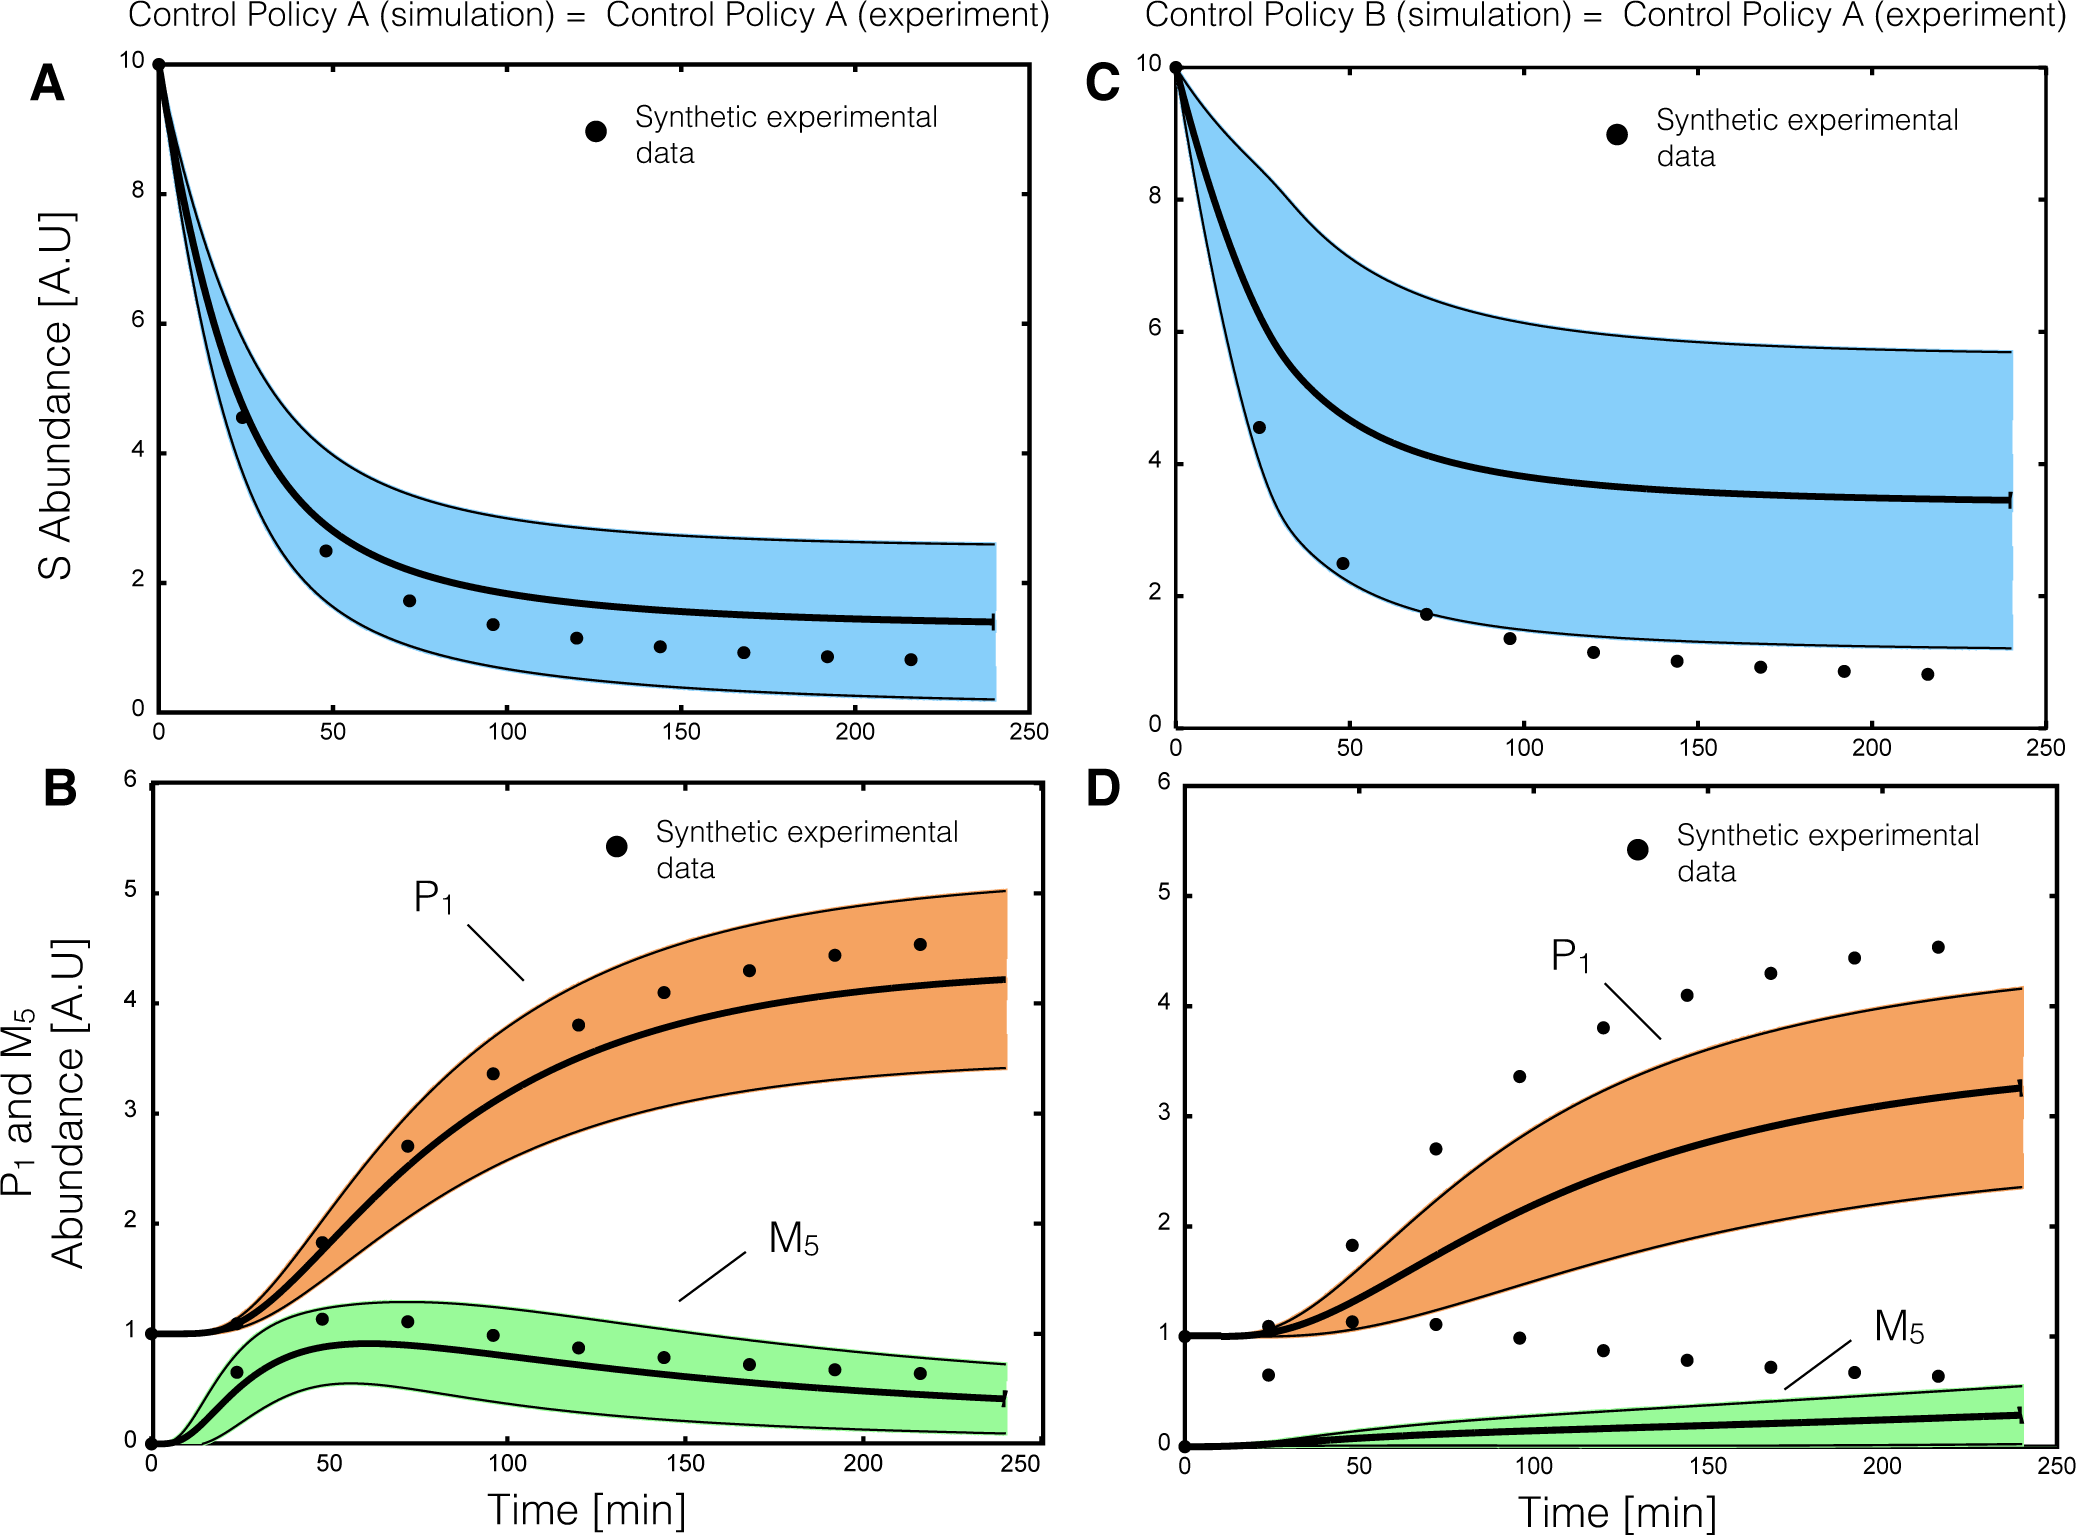
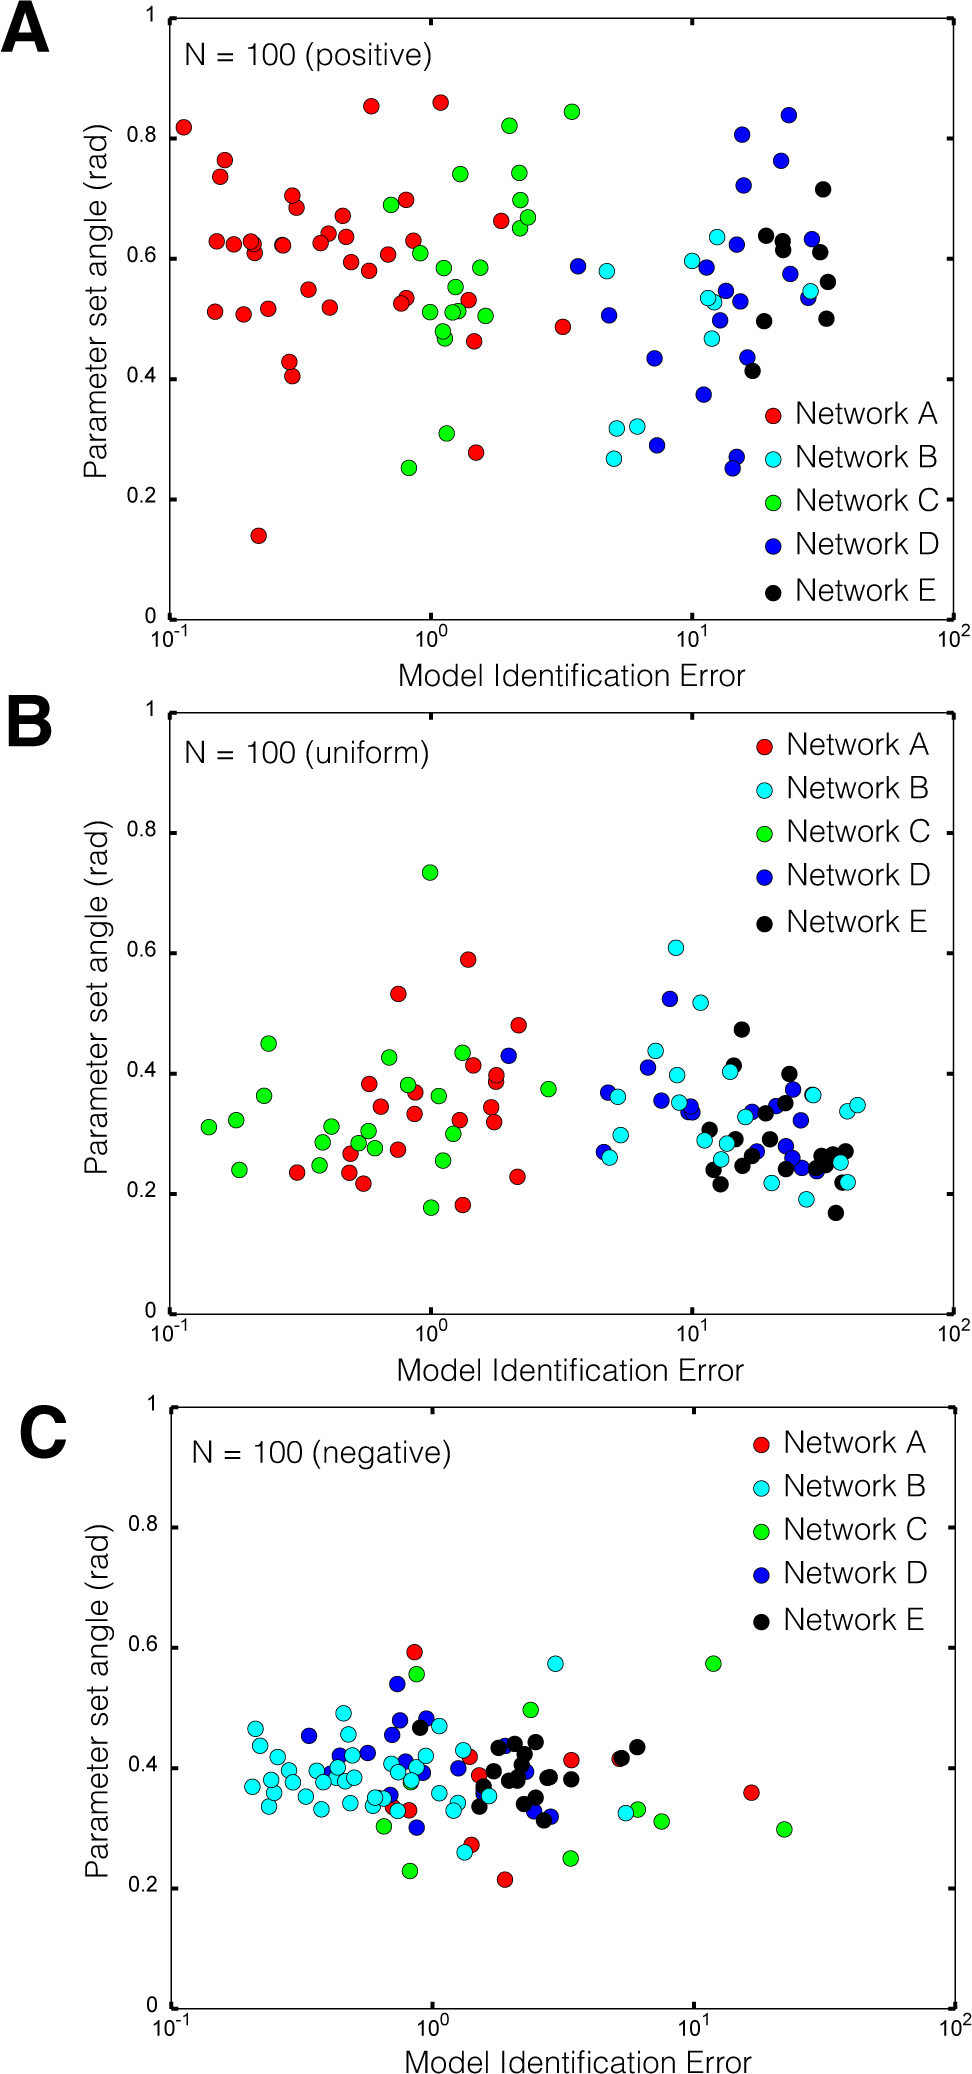
2.2. Estimating Parameters and Effective Allosteric Regulatory Structures

A critical challenge for any dynamic model is the estimation of kinetic parameters. For metabolic processes, there is also the added challenge of identifying the regulation and control structures that manage metabolism. Of course, these issues are not independent; any description of enzyme activity regulation will be a function of system state, which in turn depends upon the kinetic parameters. For cell-free systems, regulated gene expression has been removed, however, enzyme activity regulation is still operational. We explored this linkage by estimating model parameters from synthetic data using both network structures. We generated synthetic measurements of the substrate S, intermediate M5 and end product P1 approximately every 20 min using network A. This data set is similar to published cell-free studies, both in terms of network coverage and sampling frequency [23]. We then generated an ensemble of model parameter estimates by minimizing the difference between model simulations and the synthetic data using particle swarm optimization (PSO), starting from random initial parameter guesses. The estimation of kinetic parameters was sensitive to the choice of regulatory structure (Figure 5). PSO identified an ensemble of parameters that bracketed the mean of the synthetic measurements in less than 1000 iterations when the control structure was correct (Figure 5A,B). However, with control mismatch (network B simulated with network A parameters), model simulations were not consistent with the synthetic data (Figure 5C,D). Taken together, these results suggested that we could perhaps simultaneously estimate both parameters and network control architectures, as incorrect control structures would be manifest as poor model fits.
We modified our particle swarm identification strategy to simultaneously search over both kinetic parameters and putative control structures. In addition to our initial networks, we constructed three additional presumptive network models, each with the same enzymatic connectivity but different allosteric regulation of the pathway enzymes (Figure 6). We then initialized a population of particles, each with one of the five potential regulatory programs and randomized kinetic parameters. Thus, we generated an initial population of particles that had both different kinetic parameters as well as different control structures. We biased the distribution of the particle population according to our a prior belief of the correct regulatory program. To this end, we considered three different priors, a uniform distribution where each putative regulatory structure represented 20% of the population and two mixed distributions that were either positively or negatively biased towards the correct structure (network A). In both the positively biased and uniform cases the PSO clearly differentiated between the true or closely related structures and those that were materially different (Figure 7). As expected, the positively biased population (40% of the initial particle population seeded with network A) gave the best results, where the correct structure was preferentially identified (Figure 7A). On the other hand, when given a uniform distribution, the PSO approach identified a combination of network A and network C as the most likely control structures (Figure 7B). Network A and C differ by the regulatory connection between the end product P2 and enzyme E1; in network A, end product P2 was assumed to inhibit E1, while in network C, end product P2 activated E1. Lastly, when the initial population was heavily biased towards incorrect structures (initial population seeded with 90% incorrect structures), the particle swarm misidentified the correct allosteric structure (Figure 7C). Interestingly, while each particle swarm identified parameter sets that minimized the simulation error, the estimated parameter values were not necessarily similar to the true parameters. The angle between the estimated and true parameters was not consistently small across the swarms (identical parameters would give an angle of zero). This suggested that our particle swarm approach identified a sloppy ensemble, i.e., parameter estimates that were individually incorrect but collectively exhibited the correct model behavior.
We calculated control program output and scaled metabolic flux for the positively, uniformly and negatively biased particle swarms (Figure 8). Network A and network C models from the positively (Figure 8A) and uniformly (Figure 8B) biased particle swarms showed similar operational patterns, despite differences in kinetic parameters and control structures. While models from the negatively biased population had error values similar to the correct structures in the previous swarms, they have different flux and control profiles (Figure 8C). In all cases, regardless of network configuration or parameter values, the rate of enzyme decay was small compared to the other fluxes, and all networks had qualitatively similar trends for E3 and E6 control. Moreover, consistent with the correct model structure, production of end product P1 was the preferred branch for all model configurations. However, there was variability in P2 production flux across the population of models, especially for the uniform swarm when compared with the other cases. High P1 branch flux resulted in end product inhibition of E1 in both network A and network C, however in network D and E, high P1 flux induced E1 activation. These trends were manifested in different flux profiles, where the negatively biased population appeared more uniform across the population compared with the other swarms, and had higher E1 specific activity. Interestingly, the behavior of network A and network C highlighted an artifact of our integration rule; both a positive or negative feedback connection from P2 to E1 were ignored because the P1 inhibition of E1 dominated. Thus, while theoretically distinct, network A and network C appeared operationally to the PSO algorithm to be the same network. On the other hand, networks B, D and E showed distinct behavior that was not consistent with the true network. These architectures exhibited either limited inhibition (network B) or activation (network D and E) of E1 activity, resulting in significantly different metabolic flux profiles. However, the PSO was able to find low error parameter solutions, despite the mismatch in the control structures (error values similar, but not better than the best network A and network C estimates). Taken together, these results suggested that a uniform sampling approach could potentially yield an unbiassed estimate of both kinetic parameters and control structures. However, the negatively biased particle swarm results illustrated a potential shortcoming of the approach, namely convergence to a local error minimum despite a significantly incorrect control structure. This suggested that estimated model structures will need to be further evaluated, for example by generating falsifiable experimental designs which could distinguish between low error solutions.

3. Discussion

In this study, we presented an effective kinetic modeling strategy to dynamically simulate cell-free biochemical networks. Our proposed strategy integrated traditional kinetic modeling with an effective rules based approach to dynamically describe metabolic regulation and control. We tested this approach by developing kinetic models of hypothetical cell-free metabolic networks. In particular, we tested whether our effective modeling approach could describe classically expected behavior, and second whether we could simultaneously estimate kinetic parameters and regulatory connectivity, in the absence of specific mechanistic knowledge, from synthetic experimental data. Toward these questions, we explored five hypothetical cell-free networks. In each network, a substrate S was converted to the end products P1 and P2 through a series of enzymatically catalyzed reactions, including a branch point at a hypothetical metabolite M2. Each network also included the same cofactors and cofactor recycle architecture. However, while all five networks shared the same enzymatic connectivity, each had different allosteric regulatory connectivity. We found that simple effective rules, when integrated with traditional enzyme kinetic expressions, could capture complex allosteric patterns such as ultrasensitivity, or non-competitive inhibition in the absence of specific mechanistic information. Moreover, when integrated into network models, these rules captured classical regulatory patterns such as product-induced feedback inhibition. Lastly, we simultaneously estimated kinetic parameters and discriminated between competing regulatory structures, using synthetic data in combination with a modified particle swarm approach. If we considered all putative regulatory architectures to be equally likely, we were able to estimate a sloppy ensemble of models with the correct architecture and kinetic parameters. Thus, we identified parameter values that were different from their true values, but nonetheless produced reasonable model performance (low error). This suggested that we captured important parameter combinations (stiff combinations), while simultaneously missing other parameter combinations (sloppy combinations). This was similar to the earlier study of Brown and Sethna [29], which showed that reasonable model predictions were possible, despite sometimes only order of magnitude parameter estimates, if the stiff parameter combinations were well constrained.
The proposed modeling strategy shares features with other popular techniques, but also has several key differences. At its core, our effective modeling approach is similar to regulatory constraint-based methods, and to the cybernetic modeling paradigm developed by Ramkrishna and colleagues. Covert, Palsson and coworkers drastically improved the predictability of constraint-based approaches by integrating Boolean rules into the calculation of metabolic fluxes [30]. If the regulated intracellular flux problem is coupled with time-dependent extracellular balances, these models can predict complex behavior such as diauxie growth or the switch between aerobic and anaerobic metabolism. Another important feature of this approach is that it scales with biological complexity. For example, Covert et al. showed that a genome-scale model of E. coli augmented with a Boolean rule layer, correctly predicted approximately 80% of the outcomes of a high-throughput growth phenotyping experiment in E. coli. Further, they showed that they could learn new biology by iteratively refining the model and its associated rules [31]. However, while regulated flux balance analysis is a powerful technique, it does not easily allow the calculation of time-resolved metabolite abundance. Additionally, the Boolean rules which populate the regulatory layer are limited to ON/OFF decisions; for qualitative predictions of gene expression this is a reasonable limitation. However, Boolean rules will likely be less effective at capturing dynamic allosteric regulation in a cell-free metabolic system. On the other hand, the strength of cybernetic models is the integration of optimal metabolic control strategies with traditional kinetic pathway modeling. Cybernetic models are highly predictive; they have successfully predicted mutant behavior from limited wild-type data [10,32,33], steady-state multiplicity [9], strain specific metabolic function [12] and have been used in bioprocess control applications [34]. However, cybernetic control strategies are not mechanistic, instead they are the output of an optimal decision with respect to a set of hypothetical physiological objectives. Thus, they are abstractions which are difficult to translate into a specific biological mechanism. Our approach addresses the shortcomings of both regulatory constraint-based models and cybernetic models. First, similar to cybernetic models, the core of our approach is a kinetic model. Thus, we are able to directly calculate the time evolution of metabolism, for example the dynamic abundance of network metabolites. Second, similar to regulatory flux balance analysis, our control laws describe specific mechanistic motifs, such as activation or inhibition of enzyme activity. However, our rules are continuous, thus they potentially allow a finer grained description of metabolic regulation and control mechanisms. Lastly, we can naturally incorporate unmodeled factors and categorical factors or combinations thereof into our control law formulations. Though requiring a more complex description of cellular metabolism, our approach may even be extended to simulate cell-based systems by incorporating the same control laws into transcription factor activation and gene expression regulation.
The proposed modeling framework also differs appreciably from previously established kinetic approximations of complex biochemical network behavior. Such frameworks replace parameter dense mechanistic kinetic expressions with heuristics quantifying the relationship between metabolic rate and metabolite effectors. A review of approximative kinetic formats can be found in [35]. These approaches arose in response to uncertainties associated with obtaining correct mechanistic kinetic expressions and parameters of in vivo systems. Similarly, available kinetic parameters measured in vitro may differ in a specialized cell-free in vitro environments. Factors affecting kinetics, such as enzyme channeling, macromolecular crowding, and pH, are likely dramatically different in cell-free environments than in both in vivo systems as well as typical in vitro conditions used for parameter measurements. Thus, a more generalized, approximate biochemical reaction network formulation may be desirable in the case of cell-free systems. Our approach is similar to generalized mass action-based power law formulations of Savageau and colleagues [36] and linlog kinetics of Visser et al. [37] in that metabolic rates are proportional to corresponding enzyme levels modified by metabolite effectors. Power law and linlog approaches suffer from several limitations [35]. Power law reaction rates do not capture saturation effects and become infinite for small concentrations of inhibitory regulators. Linlog kinetics also become ill-defined when effector concentrations go to zero. Also, models employing linlog kinetics typically rely on an experimentally determined reference state to describe dynamics taking place after a perturbation to a steady-state. Our framework does not suffer from such drawbacks. Moreover, cell-free systems are unlikely to satisfy such a steady-state approximation after extract preparation and prior to culture initiation. Our framework is similar to the generic kinetic formulation from Hadlich et al. [38], but differs in its inclusion of cooperative effects as well as proposes a simplified integration of competition amongst allosteric effectors using max/min rules. In summary, our proposed framework offers an effective kinetic approximation that captures saturation effects and allosteric competition within cell-free systems that may also be extensible to in vivo metabolic and gene regulatory networks.
There are several critical questions that should be explored following this proof-of-concept study. It is unclear how parameter identification will scale to genome-scale networks, and second it is unclear how we will identify allosteric connectivity at a genome-scale. The enzymatic connectivity for genome-scale cell-free networks can easily be established by stripping away the growth and cell wall machinery from whole cell genome reconstructions. Then metabolic fluxes can be transformed into kinetic expressions using heuristics such multiple saturation kinetics, which are then modified by our rule-based control variables. This leaves a large number of unknown kinetic constants that must be estimated from time-resolved metabolite measurements. Ensemble modeling is a well-established approach for parameter identification in large-scale deterministic models. Liao and coworkers developed a method that generates an ensemble of kinetic models that all approach the same steady-state, one determined by fluxomics measurements [39]. The best subpopulation of candidate models were selected based on their agreement with further measurements of genetically perturbed systems. Our work relies on heuristic search optimization to identify kinetic models consistent with steady-state and dynamic time-series measurements of cellular species [4045]. Instead of estimating a single yet highly uncertain parameter set, both approaches estimate an ensemble of parameter sets whose model behavior recapitulates experimental measurements. Here, we showed that particle swarm optimization quickly identified an ensemble of model parameters, at least for proof-of-concept metabolic networks using synthetic data. This suggested that we can expect reasonable model predictions, despite only partial parameter knowledge, as network size grows if we have properly designed experiments. Though we expect computational complexity will scale poorly with network size, we are optimistic that large-scale, predictive models of metabolism are possible. There is evidence to suggest that achieving a quantitative understanding of complex biological systems should not require complete parametric knowledge. Brown and Sethna showed in a model of signal transduction that good predictions were possible despite only order of magnitude estimates of parameter values [29]. Sethna and coworkers later showed that model performance is often controlled by only a few parameter combinations, a characteristic seemingly universal to multi-parameter models referred to as sloppiness [46]. We have also demonstrated sloppy behavior in a wide variety of signal transduction processes [4045]. Thus, given our previous experience with models containing hundreds of unknown parameters, we expect parameter estimation to be a manageable challenge assuming we have good quality experimental data.
A second critical challenge will be the estimation of allosteric connectivity at a genome scale. The regulation of glycolytic enzymes, such as phosphofructokinase I, has been studied for many years [47,48]. The allosteric regulation of metabolic enzymes can also be established from organism specific databases, such as EcoCyc [49], or more general allosteric databases, such as the AlloSteric Database [50]. However, for those enzymes that have not been well studied, we will need to infer allosteric interactions from experimental data. In general, the reverse engineering of regulatory network structure from data is a difficult problem. Recently, Sauer and colleagues have developed a systematic, model-based approach for the identification of allosteric regulation in vivo [51]. They tested the effects of many putative allosteric protein-metabolite interactions on the performance of a kinetic model of glycolysis against dynamic metabolomic and fluxomic measurements. A method similar to this may be easily applied to cell-free systems in order to identify relevant in vitro allosteric interactions. Because omics measurements of cell-free environments are easy to obtain, identification of large-scale allosteric control structures may be possible. Also, there are many different approaches from the reverse engineering of gene regulatory networks that perhaps could be adopted to this problem, however this remains an open question. For example, one could imagine designing pulse chase experiments which maximally distinguish between competing allosteric models, similar to the earlier work of Kremling et al. [52], or iteratively estimating model structures similar to Doyle and coworkers [53]. Lastly, the choice of max/min integration rules or the particular form of the transfer functions could be generalized to include other rule types and functions. Theoretically, an integration rule is a function whose domain is a set of transfer function inputs, and whose range is v ϵ [0, 1]. Thus, integration rules other than max/min could be used, such as the mean or the product, assuming the range of the transfer functions is always f ϵ [0, 1]. Alternative integration rules such as the mean might have different properties which could influence model identification or performance. For example, a mean integration rule would be differentiable, which allows derivative-based optimization approaches to be used. The particular form of the transfer function could also be explored. We choose a Hill-like function because of its prominence in the systems and synthetic biology community. However, the only mathematical requirement for a transfer function is that it map a non-negative continuous or categorical variable into the range f ϵ [0,1]. Thus, many types of transfer functions are possible.

4. Materials and Methods

4.1. Formulation and Solution of the Model Equations

We used ordinary differential equations (ODEs) to model the time evolution of metabolite (xi) and scaled enzyme abundance (ϵi) in hypothetical cell-free metabolic networks:
d x i d t = j = 1 σ i j r j ( x , ϵ , k ) i = 1 , 2 , ,
d ϵ i d t = λ i ϵ i i = 1 , 2 , ,
where denotes the number of reactions, denotes the number of metabolites and denotes the number of enzymes in the model. The quantity rj (x, ϵ, k) denotes the rate of reaction j. Typically, reaction j is a non-linear function of metabolite and enzyme abundance, as well as unknown kinetic parameters r ( K × 1 ). The quantity σij denotes the stoichiometric coefficient for species i in reaction j. If σij > 0, metabolite i is produced by reaction j. Conversely, if σij < 0, metabolite i is consumed by reaction j, while σij = 0 indicates metabolite i is not connected with reaction j. Lastly, λi denotes the scaled enzyme degradation constant. The system material balances were subject to the initial conditions x (to) = xo and ϵ (to) = 1 (initially we have 100% cell-free enzyme abundance).
Each reaction rate was written as the product of two terms, a kinetic term ( r ¯ j) and a regulatory term (vj):
r j ( x , ϵ , k ) = r ¯ j v j
We used multiple saturation kinetics to model the reaction term r ¯ j:
r ¯ j = k j max ϵ i ( s m j x s K j s + x s )
where k j max denotes the maximum rate for reaction j, ϵi denotes the scaled enzyme activity which catalyzes reaction j, and KjS denotes the saturation constant for species s in reaction j. The product in Equaion (4) was carried out over the set of reactants for reaction j (denoted as m j ).
The allosteric regulation term vj depended upon the combination of factors which influenced the activity of enzyme i. For each enzyme, we used a rule-based approach to select from competing control factors (Figure 2). If an enzyme was activated by m metabolites, we modeled this activation as:
v j = max ( f 1 j ( Z ) , , f m j ( Z ) )
where 0 ≤ fij (Ƶ) ≤ 1 was a regulatory transfer function that calculated the influence of metabolite i on the activity of enzyme j. Conversely, if enzyme activity was inhibited by a m metabolites, we modeling this inhibition as:
v j = 1 max ( f 1 j ( Z ) , , f m j ( Z ) )
Lastly, if an enzyme had both m activating and n inhibitory factors, we modeled the regulatory term as:
v j = min ( u j , d j )
where:
u j = max j + ( f 1 j ( Z ) , , f m j ( Z ) )
d j = 1 max j ( f 1 j ( Z ) , , f n j ( Z ) )
The quantities j+ and j denoted the sets of activating and inhibitory factors for enzyme j. If an enzyme had no allosteric factors, we set vj = 1. There are many possible functional forms for 0 ≤ fij (Ƶ) 1. However, in this study, each individual transfer function took the form:
f i ( x ) = κ i j η Z j η 1 + κ i j η Z j η
where Ƶj denotes the abundance of the j factor (e.g., metabolite abundance), and κij and η are control parameters. The κij parameter represents a species gain parameter, while η is a cooperativity parameter (similar to a Hill coefficient). In the case η > 1, the allosteric interaction displays positive cooperativity. For η < 1, the interaction is negatively cooperative. Finally, if η = 1, the interaction displays no cooperativity. The effect of different values of η on reaction rate can be seen in Figure 3. The model equations were encoded using the Octave programming language and solved using the LSODE routine in Octave [54]. In some cases, metabolic fluxes (or other quantities) were scaled according to:
r ^ j ( t = τ ) = ( r j min r max r min r ) | t = τ
where 0 r ^ j ( t = τ ) 1 denotes the scaled value for flux j evaluated at time τ. We have used this scaling in a variety of other contexts [45,55].

Estimation of model parameters and structures from synthetic experimental data

Model parameters were estimated by minimizing the difference between simulations and synthetic experimental data (squared residual):
min k τ = 1 T j = 1 S ( x ^ j ( τ ) x j ( τ , k ) ω j ( τ ) ) 2
where x ^ j ( τ ) denotes the measured value of species j at time τ, xj (τ, k) denotes the simulated value for species j at time τ, and j (τ) denotes the experimental measurement variance for species j at time τ. The outer summation is respect to time, while the inner summation is with respect to state. We approximated a realistic model identification scenario, assuming noisy experimental data, limited sampling resolution (approximately 20 min per sample) and a limited number of measurable metabolites. We assumed a constant coefficient of variation of 10% for the synthetic data set.
We minimized the model residual using particle swarm optimization (PSO) [56]. PSO uses a swarming metaheuristic to explore parameter spaces. A strength of PSO is its ability to find the global minimum, even in the presence of potentially many local minima, by communicating the local error landscape experienced by each particle collectively to the swarm. Thus, PSO acts both as a local and a global search algorithm. For each iteration, particles in the swarm compute their local error by evaluating the model equations using their specific parameter vector realization. From each of these local points, a globally best error is identified. Both the local and global error are then used to update the parameter estimates of each particle using the rules:
Δ i = θ 1 Δ i + θ 2 r 1 ( i k i ) + θ 3 r 2 ( G k i )
k i = k i + Δ i
where ∆i denotes the perturbation to the vector of parameters ki for particle i. (θ123) are adjustable parameters, Li denotes the best local solution found by particle i, and G denotes the best solution found over the entire population of particles. The quantities r1 and r2 denote uniform random vectors with the same dimension as the number of unknown model parameters (K × 1). In this study, we used (θ123) = (1.0,0.05564,0.02886). The quality of parameter estimates was measured using two criteria, goodness of fit (model residual) and angle between the estimated parameter vector kj and the true parameter set k*:
α j = cos 1 ( k j k * k j k * )
If the candidate parameter set kj were perfect, the residual between the model and synthetic data and the angle between kj and the true parameter set k* would be equal to zero.
We modified our PSO implementation to simultaneously search over kinetic parameters and putative model control structures. In the combined case, each particle potentially carried a different model realization in addition to a different kinetic parameter vector. We kept the update rules the same (along with the update parameters). Thus, each particle competed on the basis of goodness of fit, which allowed different model structures to contribute to the overall behavior of the swarm. We considered five possible model structures (A through E), where network A was the correct formulation (used to generate the synthetic data). We considered a population of 100 particles, where each particle in the swarm was assigned a model structure, and a random parameter vector. The optimization simulations shown in Figure 7 required several hours to complete on a single CPU Apple workstation (Apple, Cupertino, CA, USA; OS X v10.10). The PSO algorithm, model equations, and the objective function were encoded and solved in the Octave programming language [54].

Acknowledgments

This study was supported by an award from the National Science Foundation (MCB #1411715) and the Army Research Office (ARO #59155-LS).

Author Contributions

J.D.V. and J.A.W. conceived and designed the modeling framework; J.A.W. and A.S. performed the simulations; J.A.W. and A.S. analyzed the data; J.A.W. and J.D.V. wrote the paper.

Conflicts of Interest

The authors declare no conflict of interest.

References

  1. Fredrickson, A.G. Formulation of structured growth models. Biotechnol. Bioeng. 1976, 18, 1481–1486. [Google Scholar]
  2. Domach, M.M.; Leung, S.K.; Cahn, R.E.; Cocks, G.G.; Shuler, M.L. Computer model for glucose-limited growth of a single cell of Escherichia coli B/r-A. Biotechnol. Bioeng. 1984, 26, 203–216. [Google Scholar]
  3. Steinmeyer, D.; Shuler, M. Structured model for Saccharomyces cerevisiae. Chem. Eng. Sci. 1989, 44, 2017–2030. [Google Scholar]
  4. Wu, P.; Ray, N.G.; Shuler, M.L. A single-cell model for CHO cells. Ann. N. Y. Acad. Sci. 1992, 665, 152–187. [Google Scholar]
  5. Castellanos, M.; Wilson, D.B.; Shuler, M.L. A modular minimal cell model: Purine and pyrimidine transport and metabolism. Proc. Natl. Acad. Sci. USA 2004, 101, 6681–6686. [Google Scholar]
  6. Atlas, J.C.; Nikolaev, E.V.; Browning, S.T.; Shuler, M.L. Incorporating genome-wide DNA sequence information into a dynamic whole-cell model of Escherichia coli: Application to DNA replication. IET Syst. Biol. 2008, 2, 369–382. [Google Scholar]
  7. Dhurjati, P.; Ramkrishna, D.; Flickinger, M.C.; Tsao, G.T. A cybernetic view of microbial growth: Modeling of cells as optimal strategists. Biotechnol. Bioeng. 1985, 27, 1–9. [Google Scholar]
  8. Kompala, D.S.; Ramkrishna, D.; Jansen, N.B.; Tsao, G.T. Investigation of bacterial growth on mixed substrates: Experimental evaluation of cybernetic models. Biotechnol. Bioeng. 1986, 28, 1044–1055. [Google Scholar]
  9. Kim, J.I.; Song, H.S.; Sunkara, S.R.; Lali, A.; Ramkrishna, D. Exacting predictions by cybernetic model confirmed experimentally: Steady state multiplicity in the chemostat. Biotechnol. Prog. 2012, 28, 1160–1166. [Google Scholar]
  10. Varner, J.; Ramkrishna, D. Metabolic engineering from a cybernetic perspective: Aspartate family of amino acids. Metab. Eng. 1999, 1, 88–116. [Google Scholar]
  11. Song, H.S.; Morgan, J.A.; Ramkrishna, D. Systematic development of hybrid cybernetic models: Application to recombinant yeast co-consuming glucose and xylose. Biotechnol. Bioeng. 2009, 103, 984–1002. [Google Scholar]
  12. Song, H.S.; Ramkrishna, D. Cybernetic models based on lumped elementary modes accurately predict strain-specific metabolic function. Biotechnol. Bioeng. 2011, 108, 127–140. [Google Scholar]
  13. Lewis, N.E.; Nagarajan, H.; Palsson, B.O. Constraining the metabolic genotype-phenotype relationship using a phylogeny of in silico methods. Nat. Rev. Microbiol. 2012, 10, 291–305. [Google Scholar]
  14. Edwards, J.S.; Palsson, B.O. The Escherichia coli MG1655 in silico metabolic genotype: Its definition, characteristics, and capabilities. Proc. Natl. Acad. Sci. USA 2000, 97, 5528–5533. [Google Scholar]
  15. Feist, A.M.; Henry, C.S.; Reed, J.L.; Krummenacker, M.; Joyce, A.R.; Karp, P.D.; Broadbelt, L.J.; Hatzimanikatis, V.; Palsson, B.Ø. A genome-scale metabolic reconstruction for Escherichia coli K-12 MG1655 that accounts for 1260 ORFs and thermodynamic information. Mol. Syst. Biol. 2007, 3(3), 121. [Google Scholar]
  16. Oh, Y.K.; Palsson, B.O.; Park, S.M.; Schilling, C.H.; Mahadevan, R. Genome-scale reconstruction of metabolic network in Bacillus subtilis based on high-throughput phenotyping and gene essentiality data. J. Biol. Chem. 2007, 282, 28791–28799. [Google Scholar]
  17. Feist, A.M.; Herrgård, M.J.; Thiele, I.; Reed, J.L.; Palsson, B.Ø. Reconstruction of biochemical networks in microorganisms. Nat. Rev. Microbiol. 2009, 7, 129–143. [Google Scholar]
  18. Ibarra, R.U.; Edwards, J.S.; Palsson, B.O. Escherichia coli K-12 undergoes adaptive evolution to achieve in silico predicted optimal growth. Nature 2002, 420, 186–189. [Google Scholar]
  19. Schuetz, R.; Kuepfer, L.; Sauer, U. Systematic evaluation of objective functions for predicting intracellular fluxes in Escherichia coli. Mol. Syst. Biol. 2007, 3(3), 119. [Google Scholar]
  20. Hyduke, D.R.; Lewis, N.E.; Palsson, B.Ø. Analysis of omics data with genome-scale models of metabolism. Mol. Biosyst. 2013, 9, 167–174. [Google Scholar]
  21. McCloskey, D.; Palsson, B.Ø.; Feist, A.M. Basic and applied uses of genome-scale metabolic network reconstructions of Escherichia coli. Mol. Syst. Biol. 2013, 9, 661. [Google Scholar]
  22. Zomorrodi, A.R.; Suthers, P.F.; Ranganathan, S.; Maranas, C.D. Mathematical optimization applications in metabolic networks. Metab. Eng. 2012, 14, 672–686. [Google Scholar]
  23. Jewett, M.C.; Calhoun, K.A.; Voloshin, A.; Wuu, J.J.; Swartz, J.R. An integrated cell-free metabolic platform for protein production and synthetic biology. Mol. Syst. Biol. 2008, 4, 220. [Google Scholar]
  24. Matthaei, J.H.; Nirenberg, M.W. Characteristics and stabilization of DNAase-sensitive protein synthesis in E. coli extracts. Proc. Natl. Acad. Sci. USA 1961, 47, 1580–1588. [Google Scholar]
  25. Nirenberg, M.W.; Matthaei, J.H. The dependence of cell-free protein synthesis in E. coli upon naturally occurring or synthetic polyribonucleotides. Proc. Natl. Acad. Sci. USA 1961, 47, 1588–1602. [Google Scholar]
  26. Lu, Y.; Welsh, J.P.; Swartz, J.R. Production and stabilization of the trimeric influenza hemagglutinin stem domain for potentially broadly protective influenza vaccines. Proc. Natl. Acad. Sci. USA 2014, 111, 125–130. [Google Scholar]
  27. Hodgman, C.E.; Jewett, M.C. Cell-free synthetic biology: Thinking outside the cell. Metab. Eng. 2012, 14, 261–269. [Google Scholar]
  28. Morris, M.K.; Saez-Rodriguez, J.; Clarke, D.C.; Sorger, P.K.; Lauffenburger, D.A. Training signaling pathway maps to biochemical data with constrained fuzzy logic: Quantitative analysis of liver cell responses to inflammatory stimuli. PLoS Comput. Biol. 2011, 7, e1001099. [Google Scholar]
  29. Brown, K.S.; Sethna, J.P. Statistical mechanical approaches to models with many poorly known parameters. Phys. Rev. E 2003, 68, 021904. [Google Scholar]
  30. Covert, M.W.; Schilling, C.H.; Palsson, B. Regulation of gene expression in flux balance models of metabolism. J. Theor. Biol. 2001, 213, 73–88. [Google Scholar]
  31. Covert, M.W.; Knight, E.M.; Reed, J.L.; Herrgard, M.J.; Palsson, B.O. Integrating high-throughput and computational data elucidates bacterial networks. Nature 2004, 429, 92–96. [Google Scholar]
  32. Varner, J.D. Large-scale prediction of phenotype: Concept. Biotechnol. Bioeng. 2000, 69, 664–678. [Google Scholar]
  33. Song, H.S.; Ramkrishna, D. Prediction of dynamic behavior of mutant strains from limited wild-type data. Metab. Eng. 2012, 14, 69–80. [Google Scholar]
  34. Gadkar, K.G.; Doyle, F.J., 3rd; Crowley, T.J.; Varner, J.D. Cybernetic model predictive control of a continuous bioreactor with cell recycle. Biotechnol. Prog. 2003, 19, 1487–1497. [Google Scholar]
  35. Heijnen, J.J. Approximative kinetic formats used in metabolic network modeling. Biotechnol. Bioeng. 2005, 91, 534–545. [Google Scholar]
  36. Savageau, M.A. Biochemical systems theory: Operational differences among variant representations and their significance. J. Theor. Biol. 1991, 151, 509–530. [Google Scholar]
  37. Visser, D.; Heijnen, J.J. Dynamic simulation and metabolic re-design of a branched pathway using linlog kinetics. Metab. Eng. 2003, 5, 164–176. [Google Scholar]
  38. Hadlich, F.; Noack, S.; Wiechert, W. Translating biochemical network models between different kinetic formats. Metab. Eng. 2009, 11, 87–100. [Google Scholar]
  39. Tran, L.M.; Rizk, M.L.; Liao, J.C. Ensemble modeling of metabolic networks. Biophys. J 2008, 95, 5606–5617. [Google Scholar]
  40. Luan, D.; Zai, M.; Varner, J.D. Computationally derived points of fragility of a human cascade are consistent with current therapeutic strategies. PLoS Comput. Biol. 2007, 3(3), e142. [Google Scholar]
  41. Song, S.O.; Varner, J. Modeling and analysis of the molecular basis of pain in sensory neurons. PLoS One 2009, 4, e6758. [Google Scholar]
  42. Tasseff, R.; Nayak, S.; Salim, S.; Kaushik, P.; Rizvi, N.; Varner, J.D. Analysis of the molecular networks in androgen dependent and independent prostate cancer revealed fragile and robust subsystems. PLoS One 2010, 5, e8864. [Google Scholar]
  43. Tasseff, R.; Nayak, S.; Song, S.O.; Yen, A.; Varner, J.D. Modeling and analysis of retinoic acid induced differentiation of uncommitted precursor cells. Integr. Biol. 2011, 3(3), 578–591. [Google Scholar]
  44. Nayak, S.; Siddiqui, J.K.; Varner, J.D. Modelling and analysis of an ensemble of eukaryotic translation initiation models. IET Syst. Biol. 2011, 5, 2. [Google Scholar]
  45. Lequieu, J.; Chakrabarti, A.; Nayak, S.; Varner, J.D. Computational modeling and analysis of insulin induced eukaryotic translation initiation. PLoS Comput. Biol 2011, 7, e1002263. [Google Scholar]
  46. Machta, B.B.; Chachra, R.; Transtrum, M.K.; Sethna, J.P. Parameter space compression underlies emergent theories and predictive models. Science 2013, 342, 604–607. [Google Scholar]
  47. Berg, J.M.; Tymoczko, J.L.; Stryer, L. Biochemistry; W.H. Freeman: New York, NY, USA, 2002. [Google Scholar]
  48. Peskov, K.; Goryanin, I.; Demin, O. Kinetic model of phosphofructokinase-1 from Escherichia coli. J. Bioinform. Comput. Biol. 2008, 6, 843–867. [Google Scholar]
  49. Keseler, I.M.; Mackie, A.; Peralta-Gil, M.; Santos-Zavaleta, A.; Gama-Castro, S.; Bonavides-Martínez, C.; Fulcher, C.; Huerta, A.M.; Kothari, A.; Krummenacker, M.; et al. EcoCyc: Fusing model organism databases with systems biology. Nucleic Acids Res 2013, 41, D605–D612. [Google Scholar]
  50. Huang, Z.; Mou, L.; Shen, Q.; Lu, S.; Li, C.; Liu, X.; Wang, G.; Li, S.; Geng, L.; Liu, Y.; et al. ASD v2.0: Updated content and novel features focusing on allosteric regulation. Nucleic Acids. Res. 2014, 42, D510–D516. [Google Scholar]
  51. Link, H.; Kochanowski, K.; Sauer, U. Systematic identification of allosteric protein-metabolite interactions that control enzyme activity in vivo. Nat. Biotechnol. 2013, 31, 357–361. [Google Scholar]
  52. Kremling, A.; Fischer, S.; Gadkar, K.; Doyle, F.J.; Sauter, T.; Bullinger, E.; Allgöwer, F.; Gilles, E.D. A benchmark for methods in reverse engineering and model discrimination: Problem formulation and solutions. Genome Res 2004, 14, 1773–1785. [Google Scholar]
  53. Gadkar, K.G.; Gunawan, R.; Doyle, F.J., III. Iterative approach to model identification of biological networks. BMC Bioinform 2005, 6, 155. [Google Scholar]
  54. Eaton, J.W.; Bateman, D.; Hauberg, S. GNU Octave Version 3.0.1 Manual: A High-Level Interactive Language for Numerical Computations; CreateSpace Independent Publishing Platform: North Charleston, SC, USA, 2009. [Google Scholar]
  55. Song, S.O.; Chakrabarti, A.; Varner, J.D. Ensembles of signal transduction models using Pareto Optimal Ensemble Techniques (POETs). Biotechnol. J 2010, 5, 768–780. [Google Scholar]
  56. Kennedy, J.; Eberhart, R. Particle swarm optimization, Proceedings of the International Conference on Neural Networks, Perth, Western Australia, Australia, 27 November 1995; pp. 1942–1948.
Figure 1. Proof-of-concept cell-free metabolic networks considered in this study. Substrate S is converted to products P1 and P2 through a series of chemical conversions catalyzed by enzyme(s) Ej. The activity of the pathway enzymes is subject to both positive and negative allosteric regulation.
Processes 03 00138f1
Figure 2. Schematic of rule-based allosteric enzyme activity control laws. Traditional enzyme kinetic expressions, e.g., Michaelis-Menten or multiple saturation kinetics, are multiplied by an enzyme activity control variable 0 ≤ vj ≤ 1. Control variables are functions of many possible regulatory factors encoded by arbitrary functions of the form 0 ≤ fj (Ƶ) ≤ 1. At each simulation time step, the vj variables are calculated by evaluating integration rules such as the max or min of the set of factors f1,… influencing the activity of enzyme Ej.
Processes 03 00138f2
Figure 3. Kinetics of simple transformations in the presence of activation and inhibition. (A) The conversion of substrate S to product P by enzyme E was activated by S. For a fixed control gain parameter κcontrol, the reaction rate approached a step for increasing cooperativity control parameter η. For activation simulations κcontrol = 0.05 and η = {0.01,0.1,1,2,4,6,8,10}; (B) The conversion of substrate S to product P by enzyme E with inhibitor I. For a fixed control gain parameter κcontrol, the reaction rate approximated non-competitive inhibition for increasing cooperativity control parameter η. For the inhibition simulations κcontrol = 1.5 and η = {0.01, 0.1,1, 2, 4, 6, 8,10}.
Processes 03 00138f3
Figure 4. ON/OFF control simulations for Network A and Network B for an ensemble of 100 kinetic parameter sets versus time. For each case, simulations were conducted using kinetic and initial conditions generated randomly from a hypothetical true parameter set. The gray area represents ± one standard deviation surrounding the mean. Control parameters were fixed during the ensemble calculations. (A) End product P1 abundance versus time for Network A. The abundance of P1 decreased with end product inhibition of E1 activity (Control-ON) versus the no inhibition case (Control-OFF); (B) End product P2 abundance versus time for Network B. Inhibition of branch point E6 by end product P1 decreased P2 abundance (Control-ON) versus the no inhibition case (Control-OFF); (C) End product P1 abundance versus time for Network A. Inhibition of branch point E6 by end product P1 decreased P1 abundance (Control-ON) versus the no inhibition case (Control-OFF).
Processes 03 00138f4
Figure 5. Parameter estimation from synthetic data for the same and mismatched allosteric control logic using particle swarm optimization (PSO). Synthetic experimental data was generated from a hypothetical parameter set using Network A, where substrate S, end product P1 and intermediate M5 were sampled approximately every 20 min. For cases (A,B) 20 particles were initialized with randomized parameters and allowed to search for 300 iterations. (A,B) PSO estimated an ensemble of 20 parameters sets consistent with the synthetic experimental data assuming the correct enzymatic and control connectivity starting from randomized initial parameters; (C,D) In the presence of control mismatch (Network B control policy simulated with Network A kinetic parameters) the ensemble of models did not describe the synthetic data. The synthetic data plotted here was unperturbed by noise. However, we assumed a constant coefficient of variation of 10% for the synthetic data during parameter estimation.
Processes 03 00138f5
Figure 6. Schematic of the alternative allosteric control programs used in the structural particle swarm computation. Each network had the same enzymatic connectivity, initial conditions and kinetic parameters, but alternative feedback control structures for the first enzyme in the pathway.
Processes 03 00138f6
Figure 7. Combined control and kinetic parameter search using modified particle swarm optimization (PSO). A population of 100 particles was initialized with randomized kinetic parameters and one of five possible control configurations (Network A–E). Simulation error was minimized for a synthetic data set (S, end product P1 and intermediate M5 sampled approximately every 20 min) generated using Network A. (A) Simulation error versus parameter set angle for 100 particles biased toward the correct regulatory program (A,B,C,D,E) = (40%, 10%, 20%, 20% and 10%); (B) Simulation error versus parameter set angle for 100 uniformly distributed particles (A,B,C,D,E) = (20%, 20%, 20%, 20% and 20%); (C) Simulation error versus parameter set angle for 100 negatively biased particles (A,B,C,D,E) = (10%, 40%, 10%, 20% and 20%). Network A (the correct structure) was preferentially identified for positively and uniform biased particle distributions, but misidentified in the presence of a large incorrect bias.
Processes 03 00138f7
Figure 8. Metabolic flux and control variables as a function of network type and particle index at t = 100 min. The particle error, the control variables governing E1, E3 and E6 activity (v1, v3 and v3) and the scaled metabolic flux were calculated for the positively (top), uniformly (middle) and negatively (bottom) biased particle swarms (N = 100). Blue denotes a low value, while red denotes a high value for the respective quantity being plotted. The particles from each swarm were sorted based upon simulation error (low to high error). (A) Model performance for the positively biased particle swarm as a function of particle index; (B) Model performance for the uniformly biased particle swarm as a function of particle index; (C) Model performance for the negatively biased particle swarm as a function of particle index. Models with significant control mismatch showed distinct control and flux patterns versus those models with the correct or closely related control policies. In particular, models with the correct control policy showed stronger inhibition of E1 activity, leading to decreased flux from S→P1. Conversely, models with significant mismatch had increased E1 activity, leading to an altered flux distribution. This is especially apparent in the negatively biased particle swarm.
Processes 03 00138f8

