
Mathematical Modeling of Pro- and Anti-Inflammatory Signaling in Macrophages


Abstract
:
1. Introduction
2. Materials and Methods
2.1. Model Formulation


| 1. |
| 2. |
| 3. |
| 4. |
| 5. |
| 6. |
| 7. |
| 8. |
| 9. where, kin = max [] |
| 10. |
| 11. |
| 12. |
| 13. |
| 14. |
| 15. |
| 16. |
| 17. |
| 18. |
| 19. |
| 20. |
| 21. |
| 22. |
| 23. |
| 24. |
| 25. |
| 26. |
| 27. |
| 28. |
| 29. |
| Sr. No. | Parameter | Description | Value | Units | Comment |
|---|---|---|---|---|---|
| 1. | kv | Nuclear: Cytoplasmic (Volume) | 1.17 | NA | Estimated |
| 2. | kf1 | LPS binding to receptor | 2.64 × 10⁻¹ | (µM−s)−1 | Estimated |
| 3. | kr1 | Dissociation of LPS + receptor complex | 1.25 × 10⁻³ | (µM−s)−1 | Huang et al. (2008) [25] |
| 4. | kf2 | IL-10 binding to receptor | 2.50 × 10⁻⁴ | (µM−s)−1 | Assumed |
| 5. | kr2 | Dissociation of IL-10 + receptor complex | 6.11 × 10⁻⁴ | (µM−s)−1 | Assumed |
| 6. | kf3 | TNF-α binding to receptor | 2.50 × 10⁻³ | (µM−s)−1 | Gray et al. [30] |
| 7. | kr3 | Dissociation of TNF-α + receptor complex | 1.25 × 10⁻³ | (µM−s)−1 | Rangamani et al. (2007) [27] |
| 8. | kf4 | IκBa and NF-κB association | 2.5 × 10⁻³ | (µM−s)−1 | Assumed |
| 9. | kfi | IKK activation | 1.62 × 10⁻³ | s−1 | Estimated |
| 10. | kk1 | Inactivation of IKK by A20 | 2.5 × 10⁻⁴ | (µM-s)−1 | Assumed |
| 11. | kk3 | Association of IKK with IκBα-NFκB | 1.0 | (µM−s)−1 | Lipniacki et al. (2004) [26] |
| 12. | ti3 | Catalytic breakdown of IKK-IκBα-NFκB | 1.72 × 10⁻⁴ | s−1 | Estimated |
| 13. | iln | NF-κB nuclear import | 1.52 × 10⁻³ | s−1 | Estimated |
| 14. | a20trans | A20 translation | 5.00 × 10⁻¹ | s−1 | Lipniacki et al. (2004) [26] |
| 15. | kdegA20 | Degradation of A20 protein | 3.00 × 10⁻⁴ | s−1 | Lipniacki et al. (2004) [26] |
| 16. | iκbαtrans | IκBα translation | 5.00 × 10⁻¹ | s−1 | Lipniacki et al. (2004) [26] |
| 17. | kdegIκBα | Degradation of phosphorylated IκBα | 1.28 × 10⁻⁴ | s−1 | Assumed half-life of 90 min |
| 18. | il10trans | IL-10 translation | 5.00 × 10⁻¹ | s−1 | Lipniacki et al. (2004) [26] |
| 19. | ksecIL10 | Secretion of IL-10 from cytoplasm to supernatant | 2.03 × 10⁻⁵ | s−1 | Assumed |
| 20. | kdegIL10sup | Degradation of IL-10 in supernatant | 7.40 × 10⁻⁵ | s−1 | Half-life of 2.6 h in supernatant. Fedorak et al. [31] |
| 21. | tnfαtrans | TNF-α translation | 5.00 × 10⁻¹ | s−1 | Lipniacki et al. (2004) [26] |
| 22. | ksecTNFα | Secretion of TNF-α from cytoplasm to supernatant | 5.16 × 10⁻⁵ | s−1 | Estimated |
| 23. | kdegTNFαsup | Degradation of TNF-α in supernatant | 7.46 × 10⁻⁵ | s−1 | Estimated |
| 24. | Dn | Degradation of intracellular cytokine | 1.04 × 10⁻² | s−1 | Huang et al. (2008) [25] |
| 25. | iki | IκBα nuclear import | 1.00 × 10⁻³ | s−1 | Lipniacki et al. (2004) [26] |
| 26. | eki | IκBα nuclear export | 5.00 × 10⁻⁴ | s−1 | Lipniacki et al. (2004) [26] |
| 27. | eni | IκBα -NFκB nuclear export | 1.00 × 10⁻² | s−1 | Lipniacki et al. (2004) [26] |
| 28. | k1 | STAT3 activation and dimerization | 1.54 × 10⁻² | (µM−s)−1 | Assumed |
| 29. | k2 | Dissociation of STAT3 dimer | 3.3 × 10⁻⁵ | s−1 | Assumed |
| 30. | istat3 | STAT3 dimer nuclear import | 3.56 × 10⁻⁵ | s−1 | Estimated |
| 31. | Sm | Transcription due to NF-κB | 1.00 × 10⁻¹ | s−1 | Huang et al. (2008) [25] |
| 32. | Sm_il10 | IL-10 Translation due to STAT3 | 1.5 | s−1 | Assumed |
| 33. | p | Transcription parameter | 5.00 × 10⁻³ | µM | Huang et al. (2008) [25] |
| 34. | Dm | Degradation of mRNA | 1.04 × 10⁻² | s−1 | Huang et al. (2008) [25] |
| 35. | C | Maximum NF-κB concentration in nucleus | 1.08 × 10⁻¹ | µM | Huang et al. (2008) [25] |
| 36. | CSTAT3 | Maximum STAT3 concentration in nucleus | 5.00 × 10⁻² | µM | Assumed |
| 37. | IL10-IL10Rmax | IL10-IL10R maximum concentration | 2.56 × 10⁻⁶ | µM | Assumed |
| Sr. No. | State variables | Initial values, µM |
|---|---|---|
| 1. | TLR4 | 1.0 × 10⁻¹ |
| 2. | LPS-TLR4 | 0 |
| 3. | IL-10supernatant | 4.6 × 10⁻⁶ |
| 4. | IL-10R | 1.0 × 10⁻¹ |
| 5. | IL10-IL10R | 0 |
| 6. | TNF-αsupernatant | 0 |
| 7. | TNF-αR | 1.0 × 10⁻¹ |
| 8. | TNFα-TNFαR | 0 |
| 9. | IKKneutral | 2.0 × 10⁻¹ |
| 10. | IKKactive | 0 |
| 11. | IKKinactive | 0 |
| 12. | IκBα-NFκBcyto | 2.5 × 10⁻¹ |
| 13. | IKK- IκBαNFκB | 0 |
| 14. | NFκBcyto | 3.0 × 10⁻³ |
| 15. | NFκBnuclear | 0 |
| 16. | IκBαphopsho | 0 |
| 17. | A20mRNA | 0 |
| 18. | A20cyto | 4.8 × 10⁻³ |
| 19. | IκBαmRNA | 0 |
| 20. | IκBαcyto | 2.5 × 10⁻³ |
| 21. | IκBαnuclear | 0 |
| 22. | IκBα-NFκBnuclear | 0 |
| 23. | IL-10mRNA | 0 |
| 24. | IL-10cyto | 0 |
| 25. | TNF-αmRNA | 0 |
| 26. | TNF-αcyto | 0 |
| 27. | STAT3cyto | 5.92 × 10⁻¹ |
| 28. | STAT3-STAT3cyto | 0 |
| 29. | STAT3-STAT3nuclear | 0 |
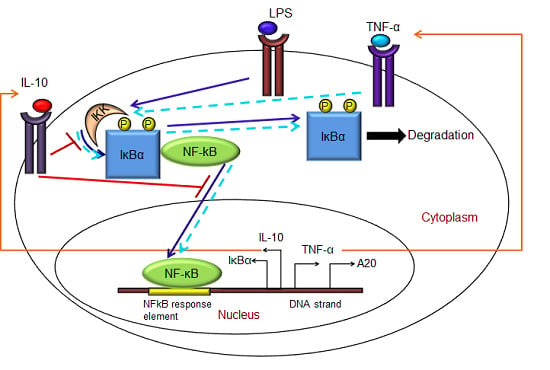
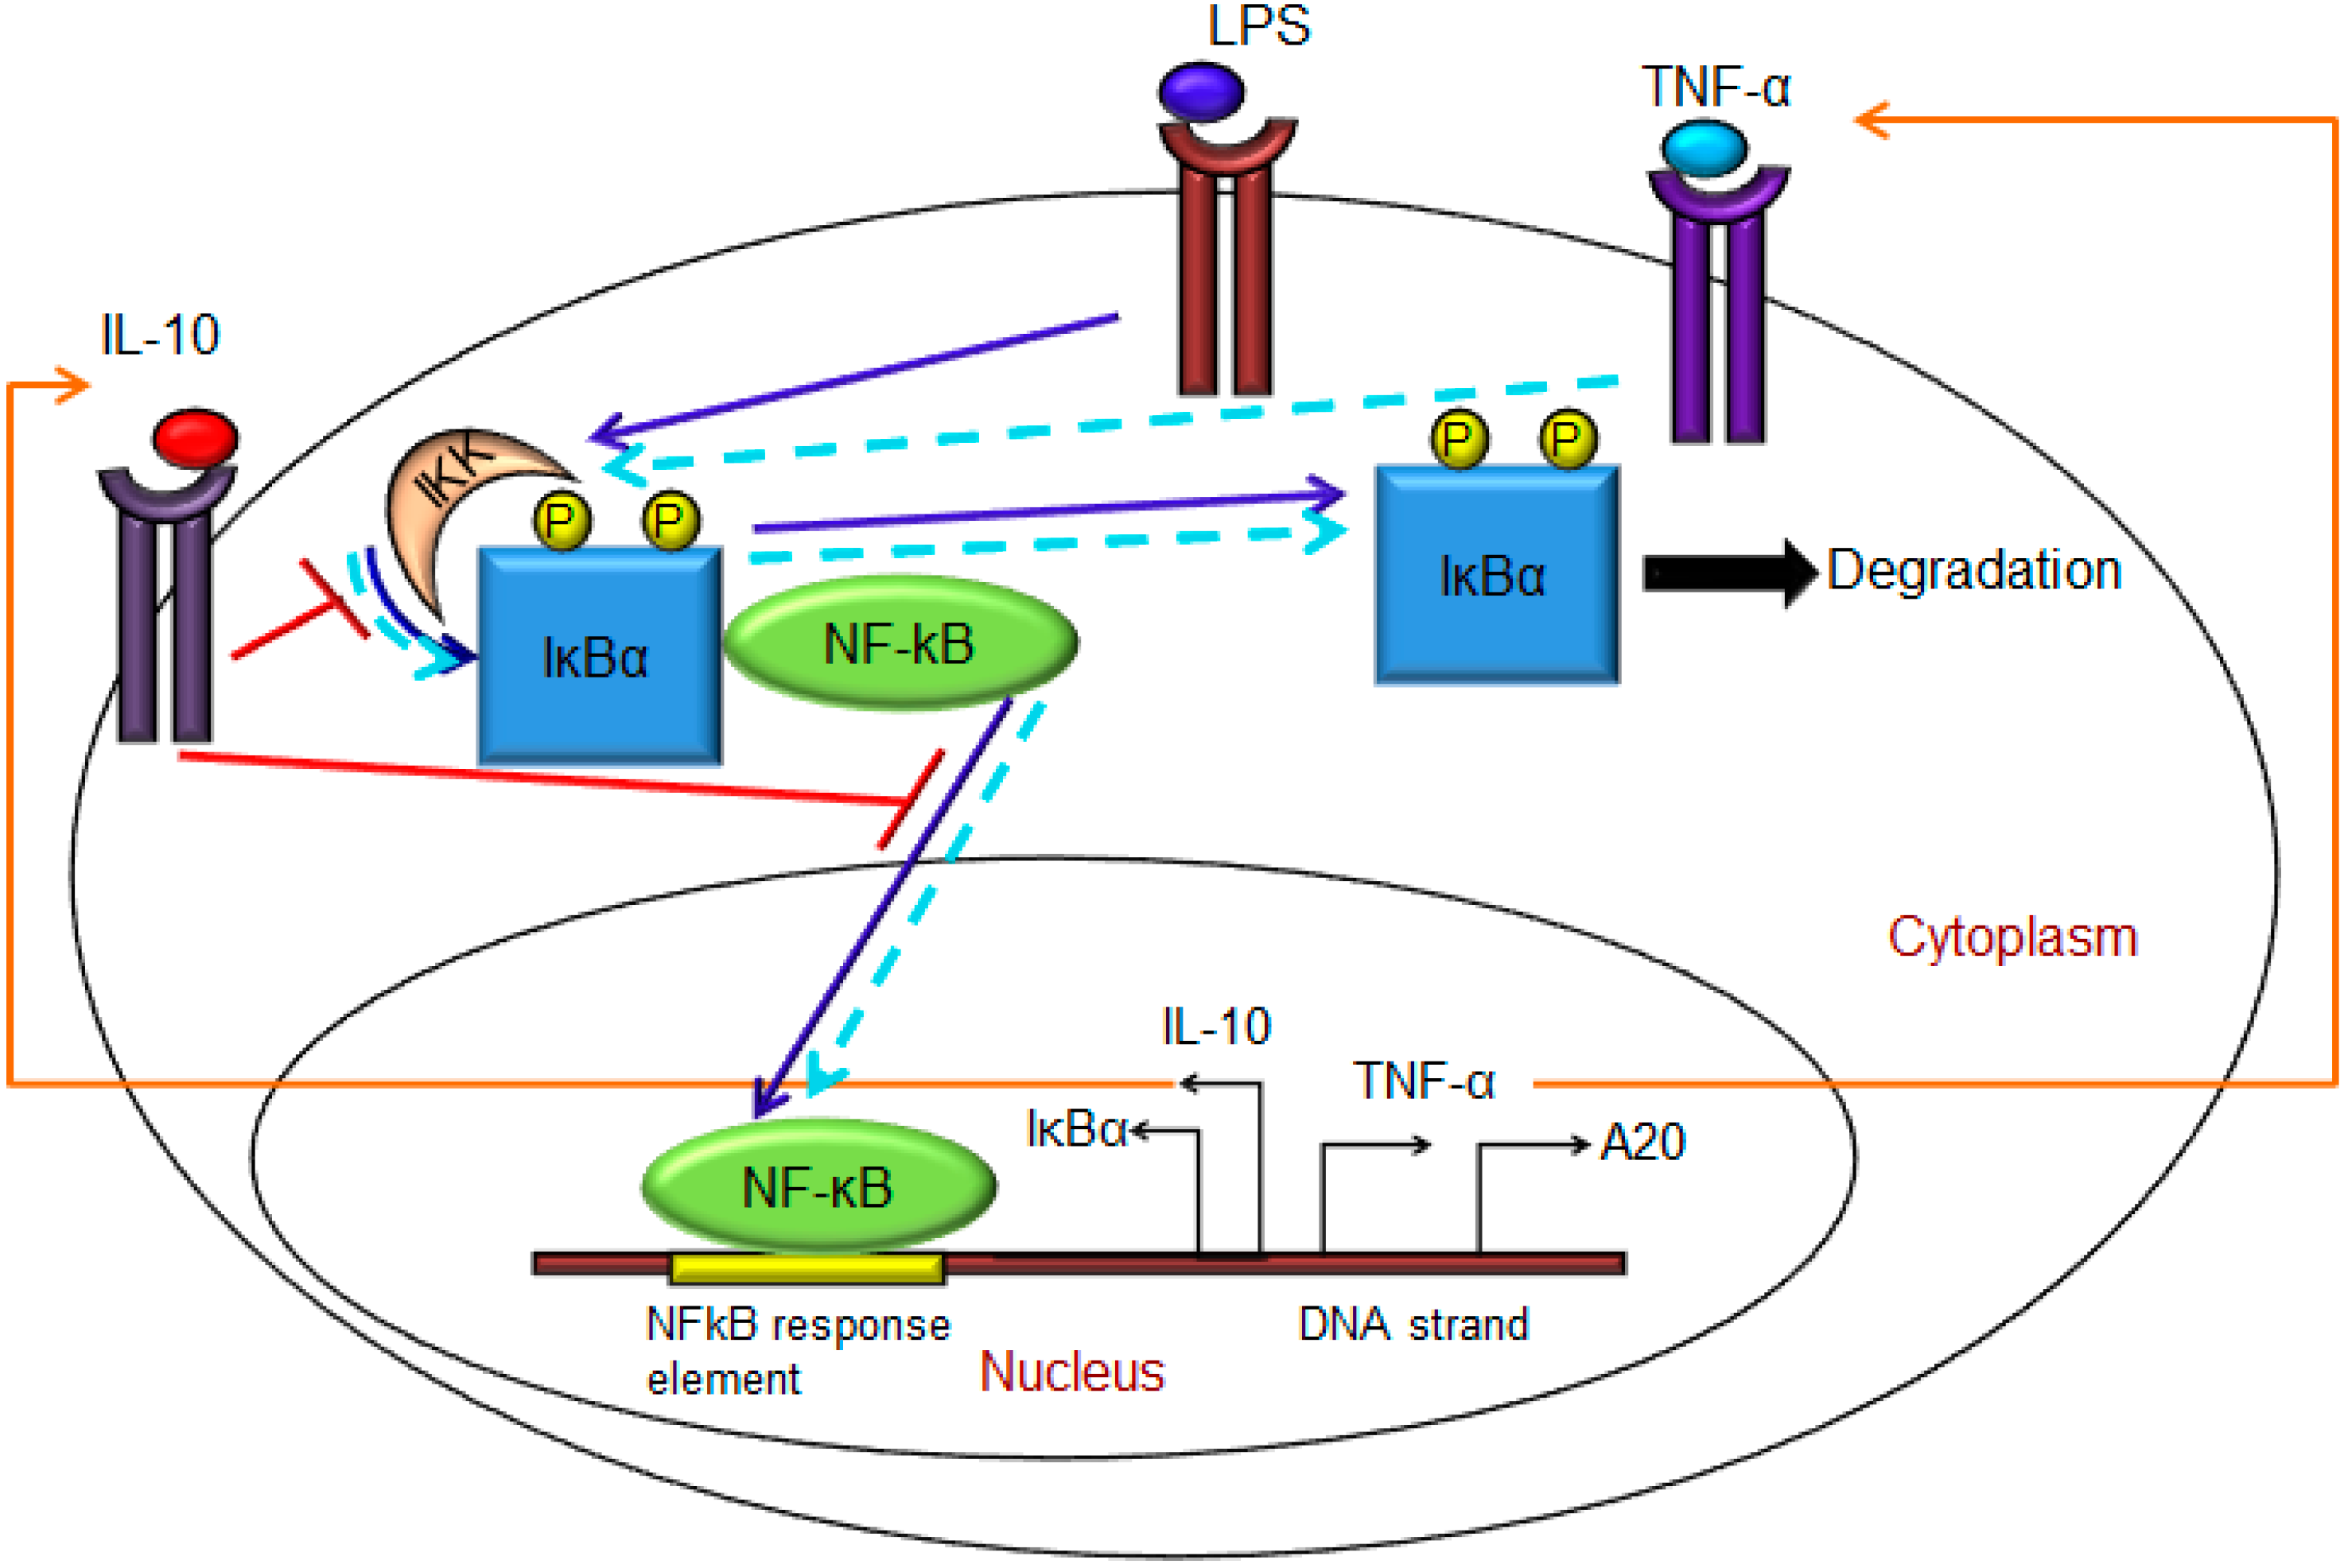
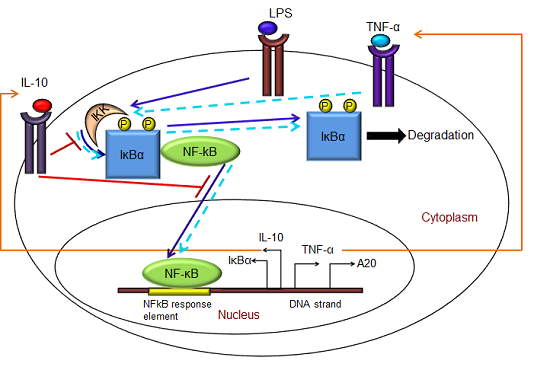
- (1)
- Exogenous LPS binds to the cell surface receptor (TLR4);
- (2)
- LPS-TLR4 complex initiates activation of IKKneutral to IKKactive;
- (3)
- IKKactive phosphorylates IκBα-NFκB and initiates dissociation of the inactive IκBα-NFκB complex into phosphorylated IκBα and NF-κB species;
- (4)
- Free phosphorylated IκBα undergoes ubiquitination and degradation, whereas free cytoplasmic NF-κB translocates into nucleus;
- (5)
- Nuclear NF-κB binds to response elements in the promoter regions of TNF-α, IκBα and A20 genes and leads to transcription and translation of the corresponding proteins and subsequent secretion of TNF-α into the supernatant. de novo intracellular IκBα sequesters both free cytoplasmic and nuclear NF-κB by binding to them, and A20 catalyzes the change of IKKactive to the IKKinactive form;
- (6)
- Secreted TNF-α in the cell culture supernatant binds to its cell surface receptor to form a complex that initiates similar pathways as LPS, resulting in the production of more TNF-α through a positive feedback regulation on NF-κB.
- (1)
- Nuclear NF-κB binds to the IL-10 gene promoter and initiates transcription of IL-10 mRNA and subsequent translation into IL-10 protein in the cytoplasm, which gets secreted into the supernatant;
- (2)
- IL-10 secreted into the supernatant binds to its cell surface receptor, forming a ligand-receptor complex that inhibits activation of IKKneutral to IKKactive and translocation of activated free cytoplasmic NF-κB into the nucleus, as well;
- (3)
- The IL-10 + receptor complex activates a second transcription factor, presumably STAT3, which, in turn, regulates transcription of the IL-10 gene in a feed-forward manner.
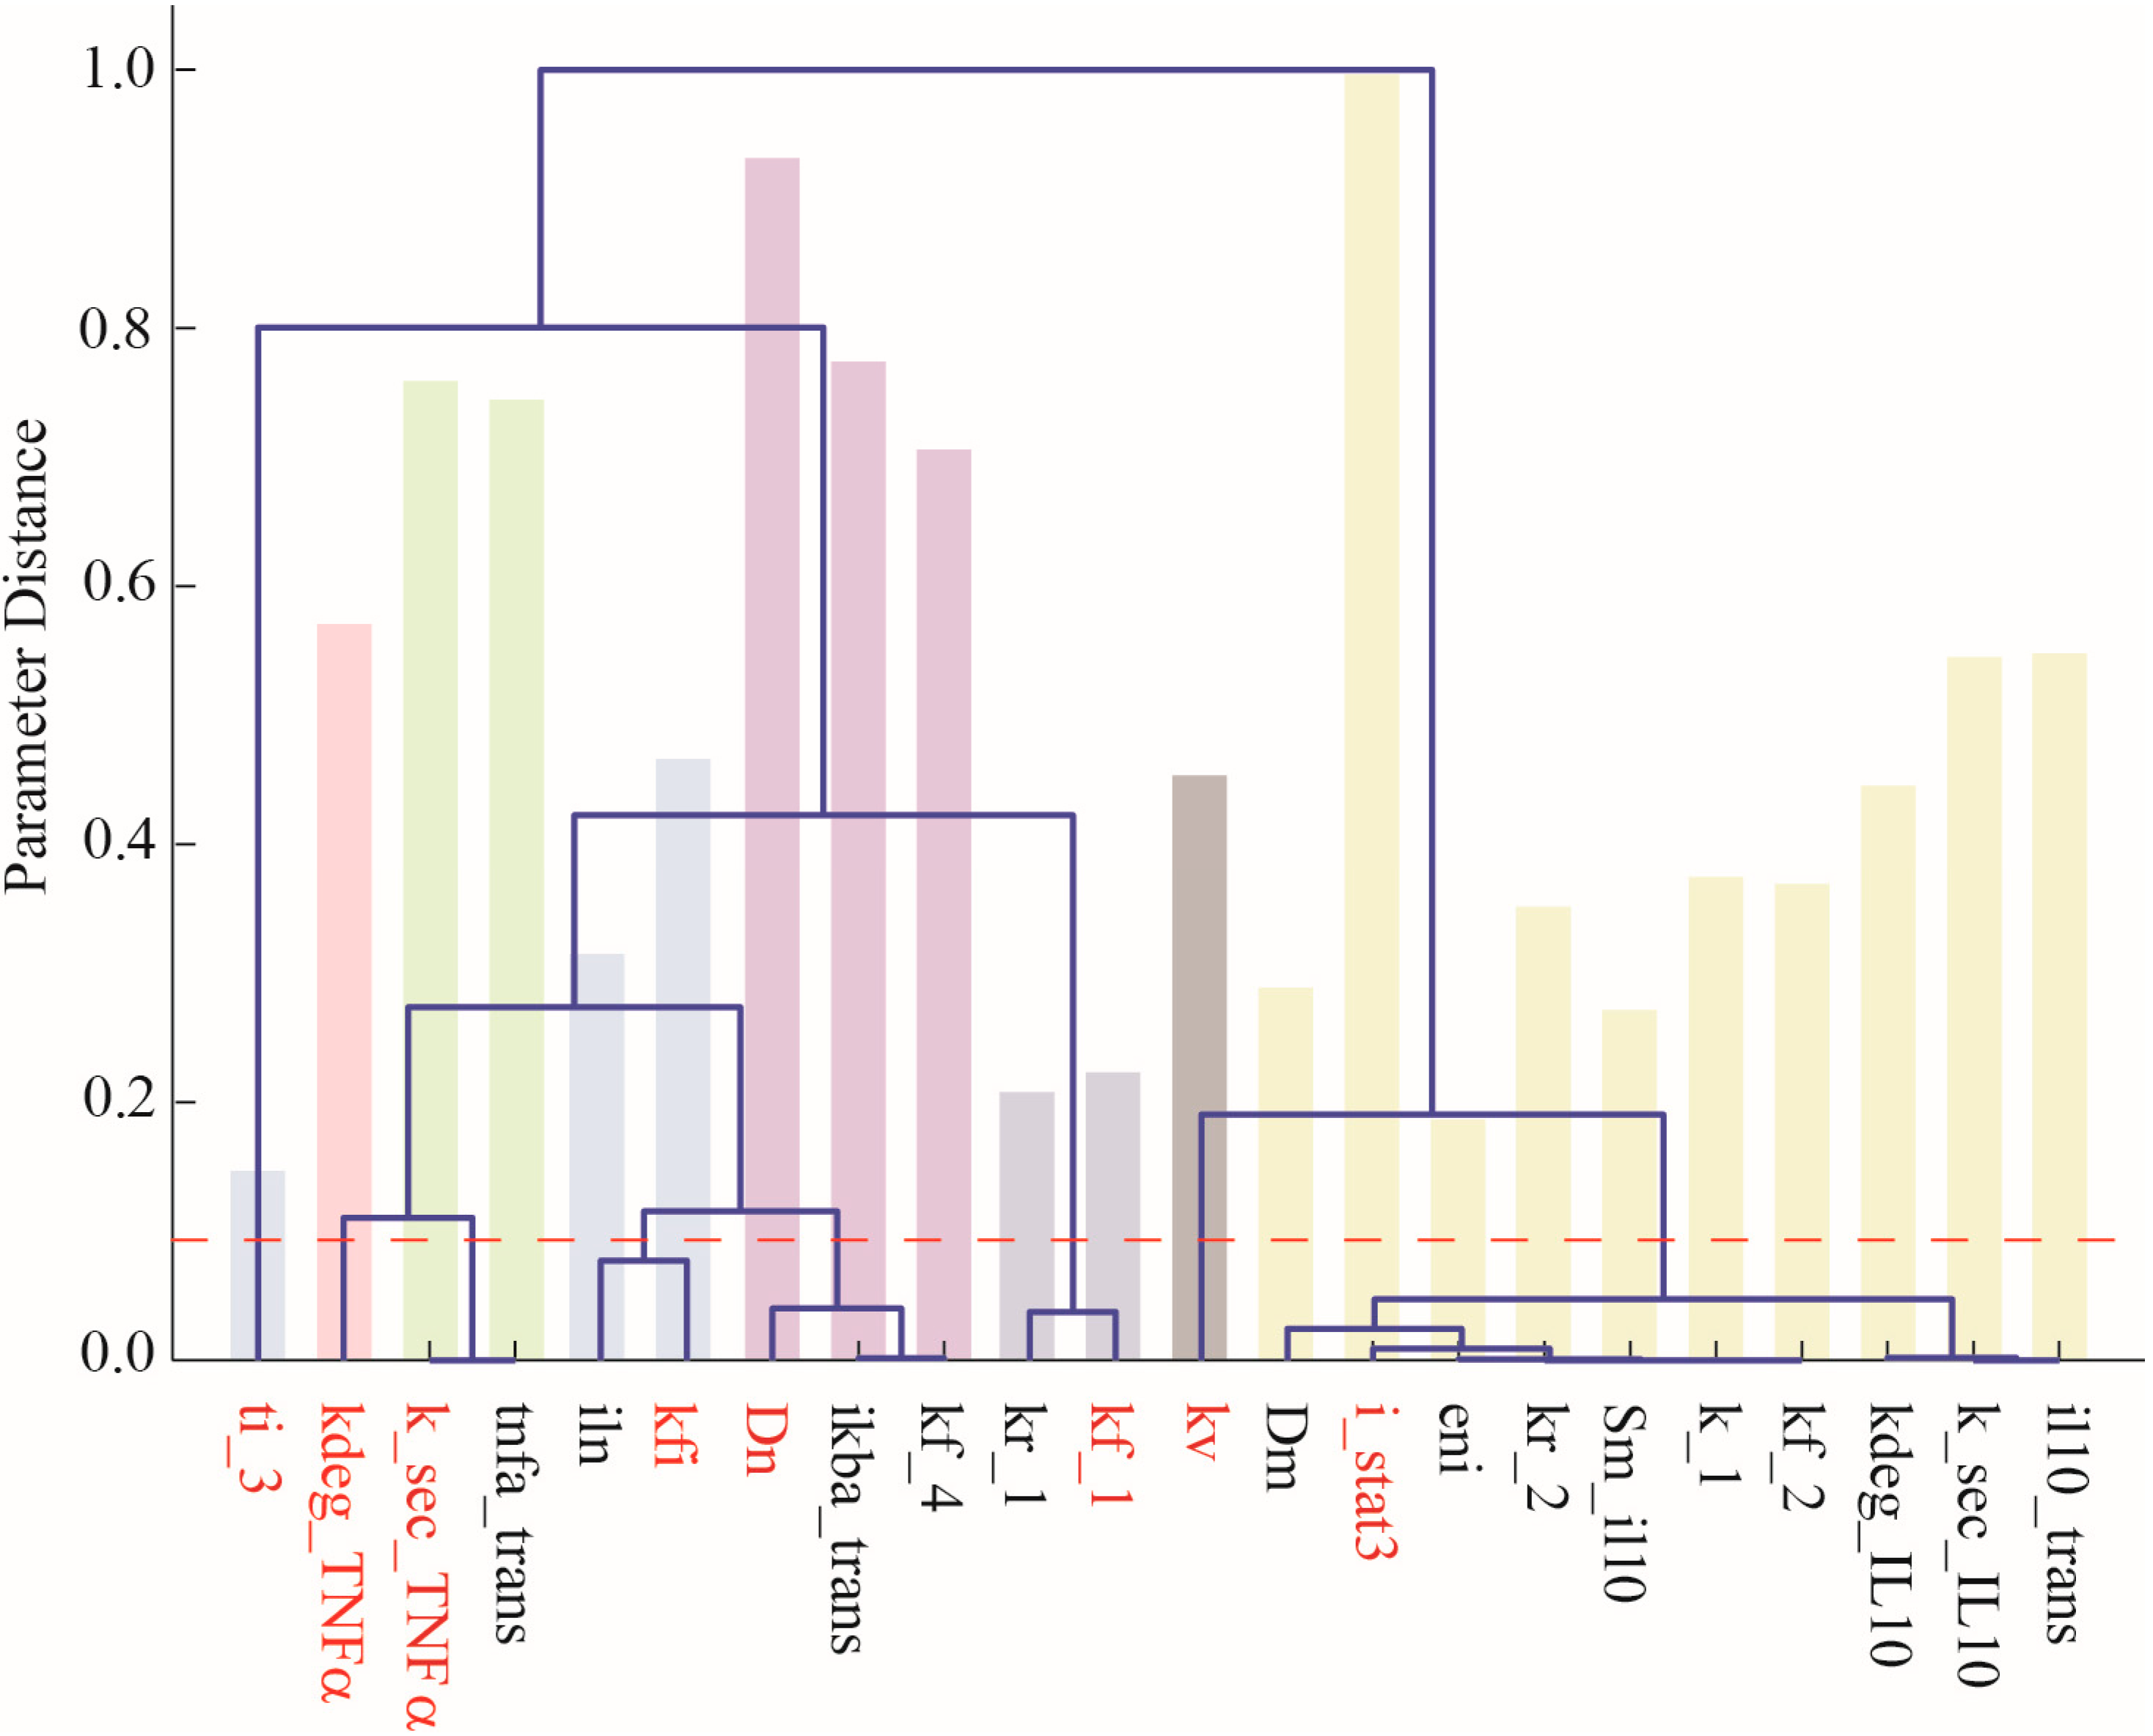
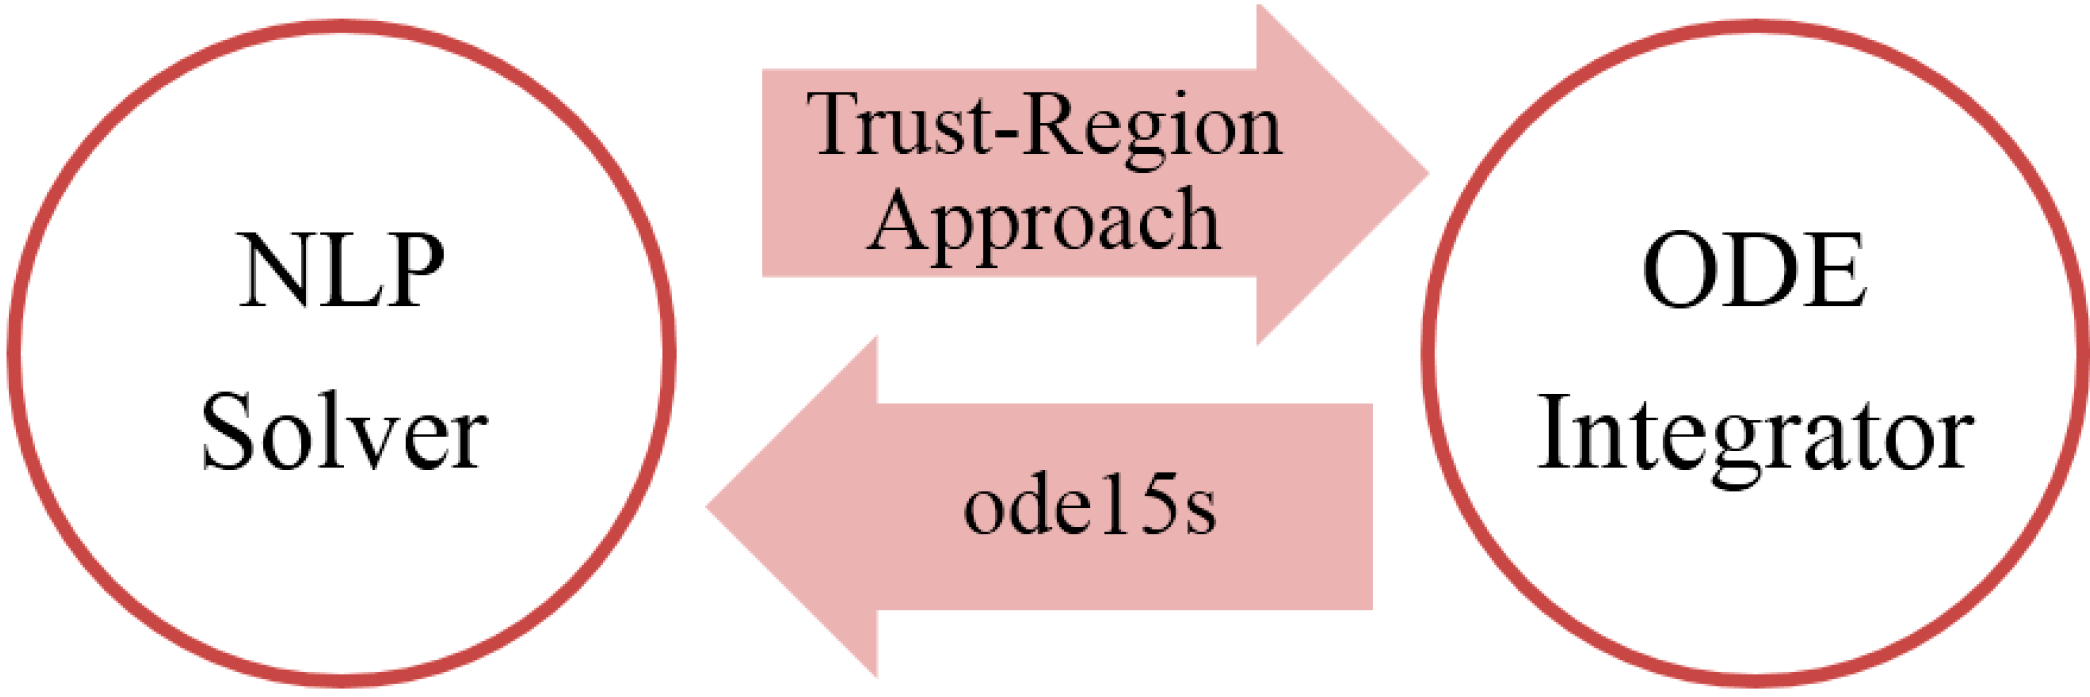
2.2. Parameter Selection and Estimation
2.3. Cell Culture and Experimental Set-Up
2.3.1. LPS Stimulation of Macrophages
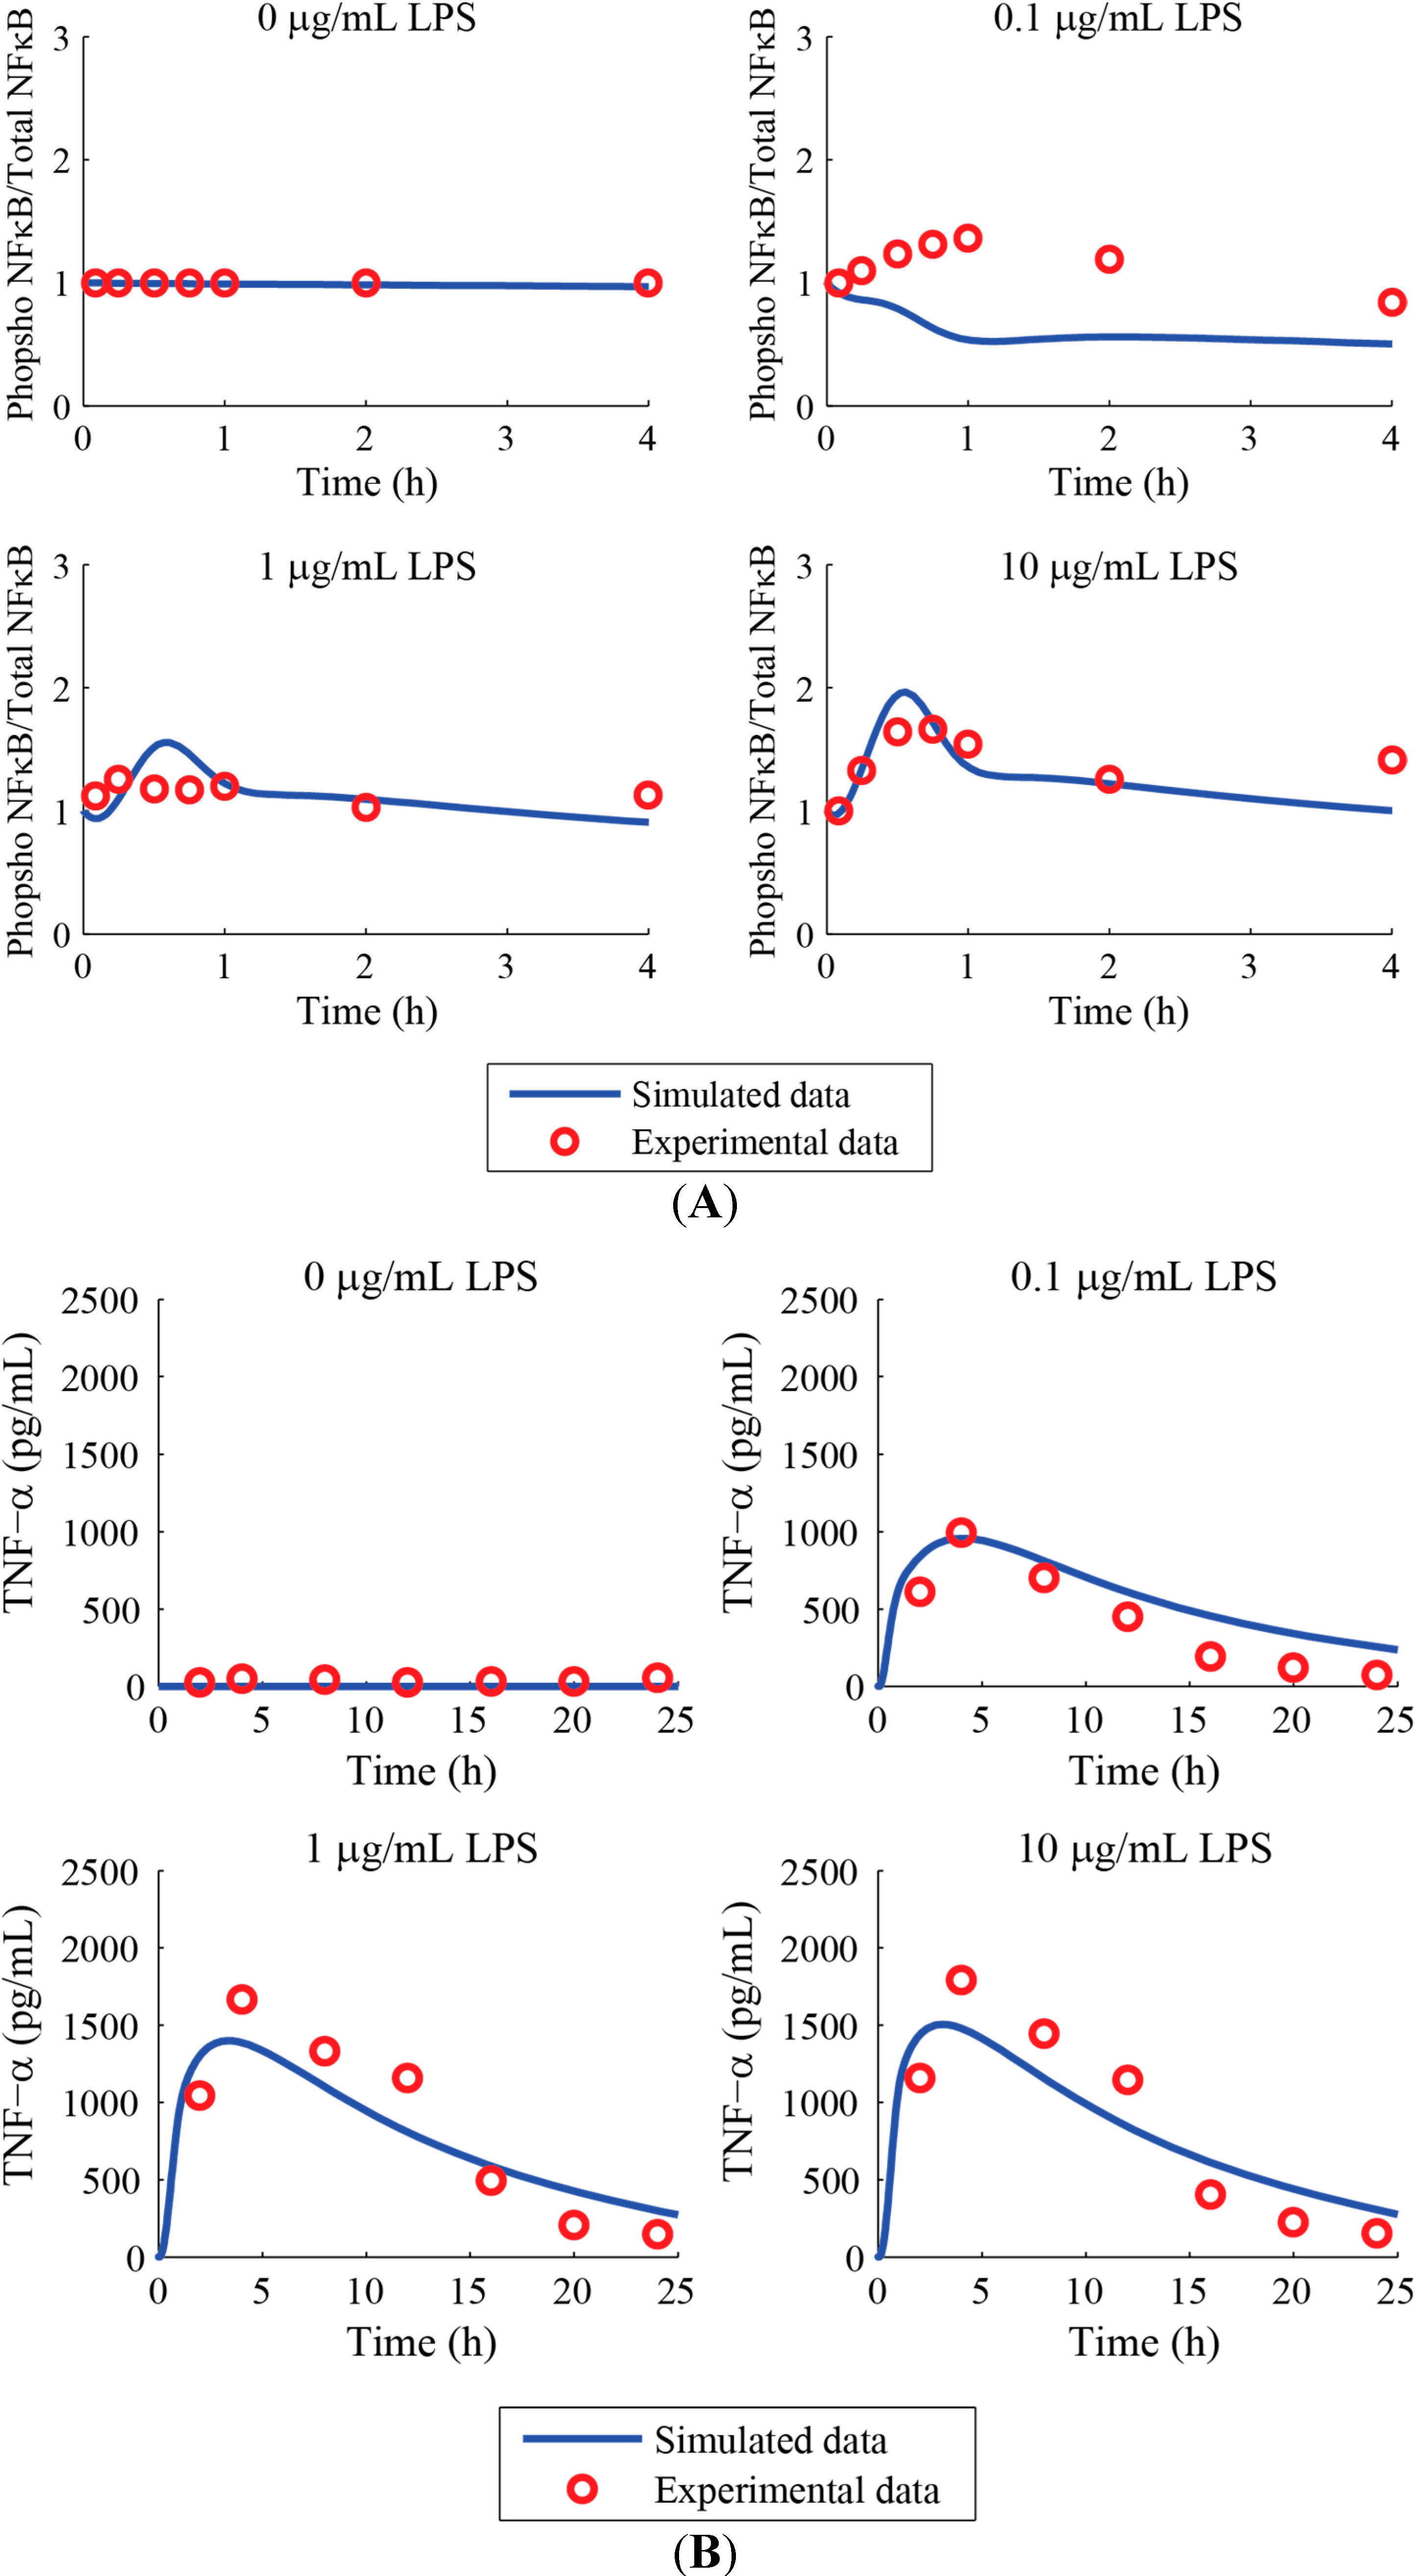
2.3.2. Transcription Factor NF-κB Quantification by ELISA
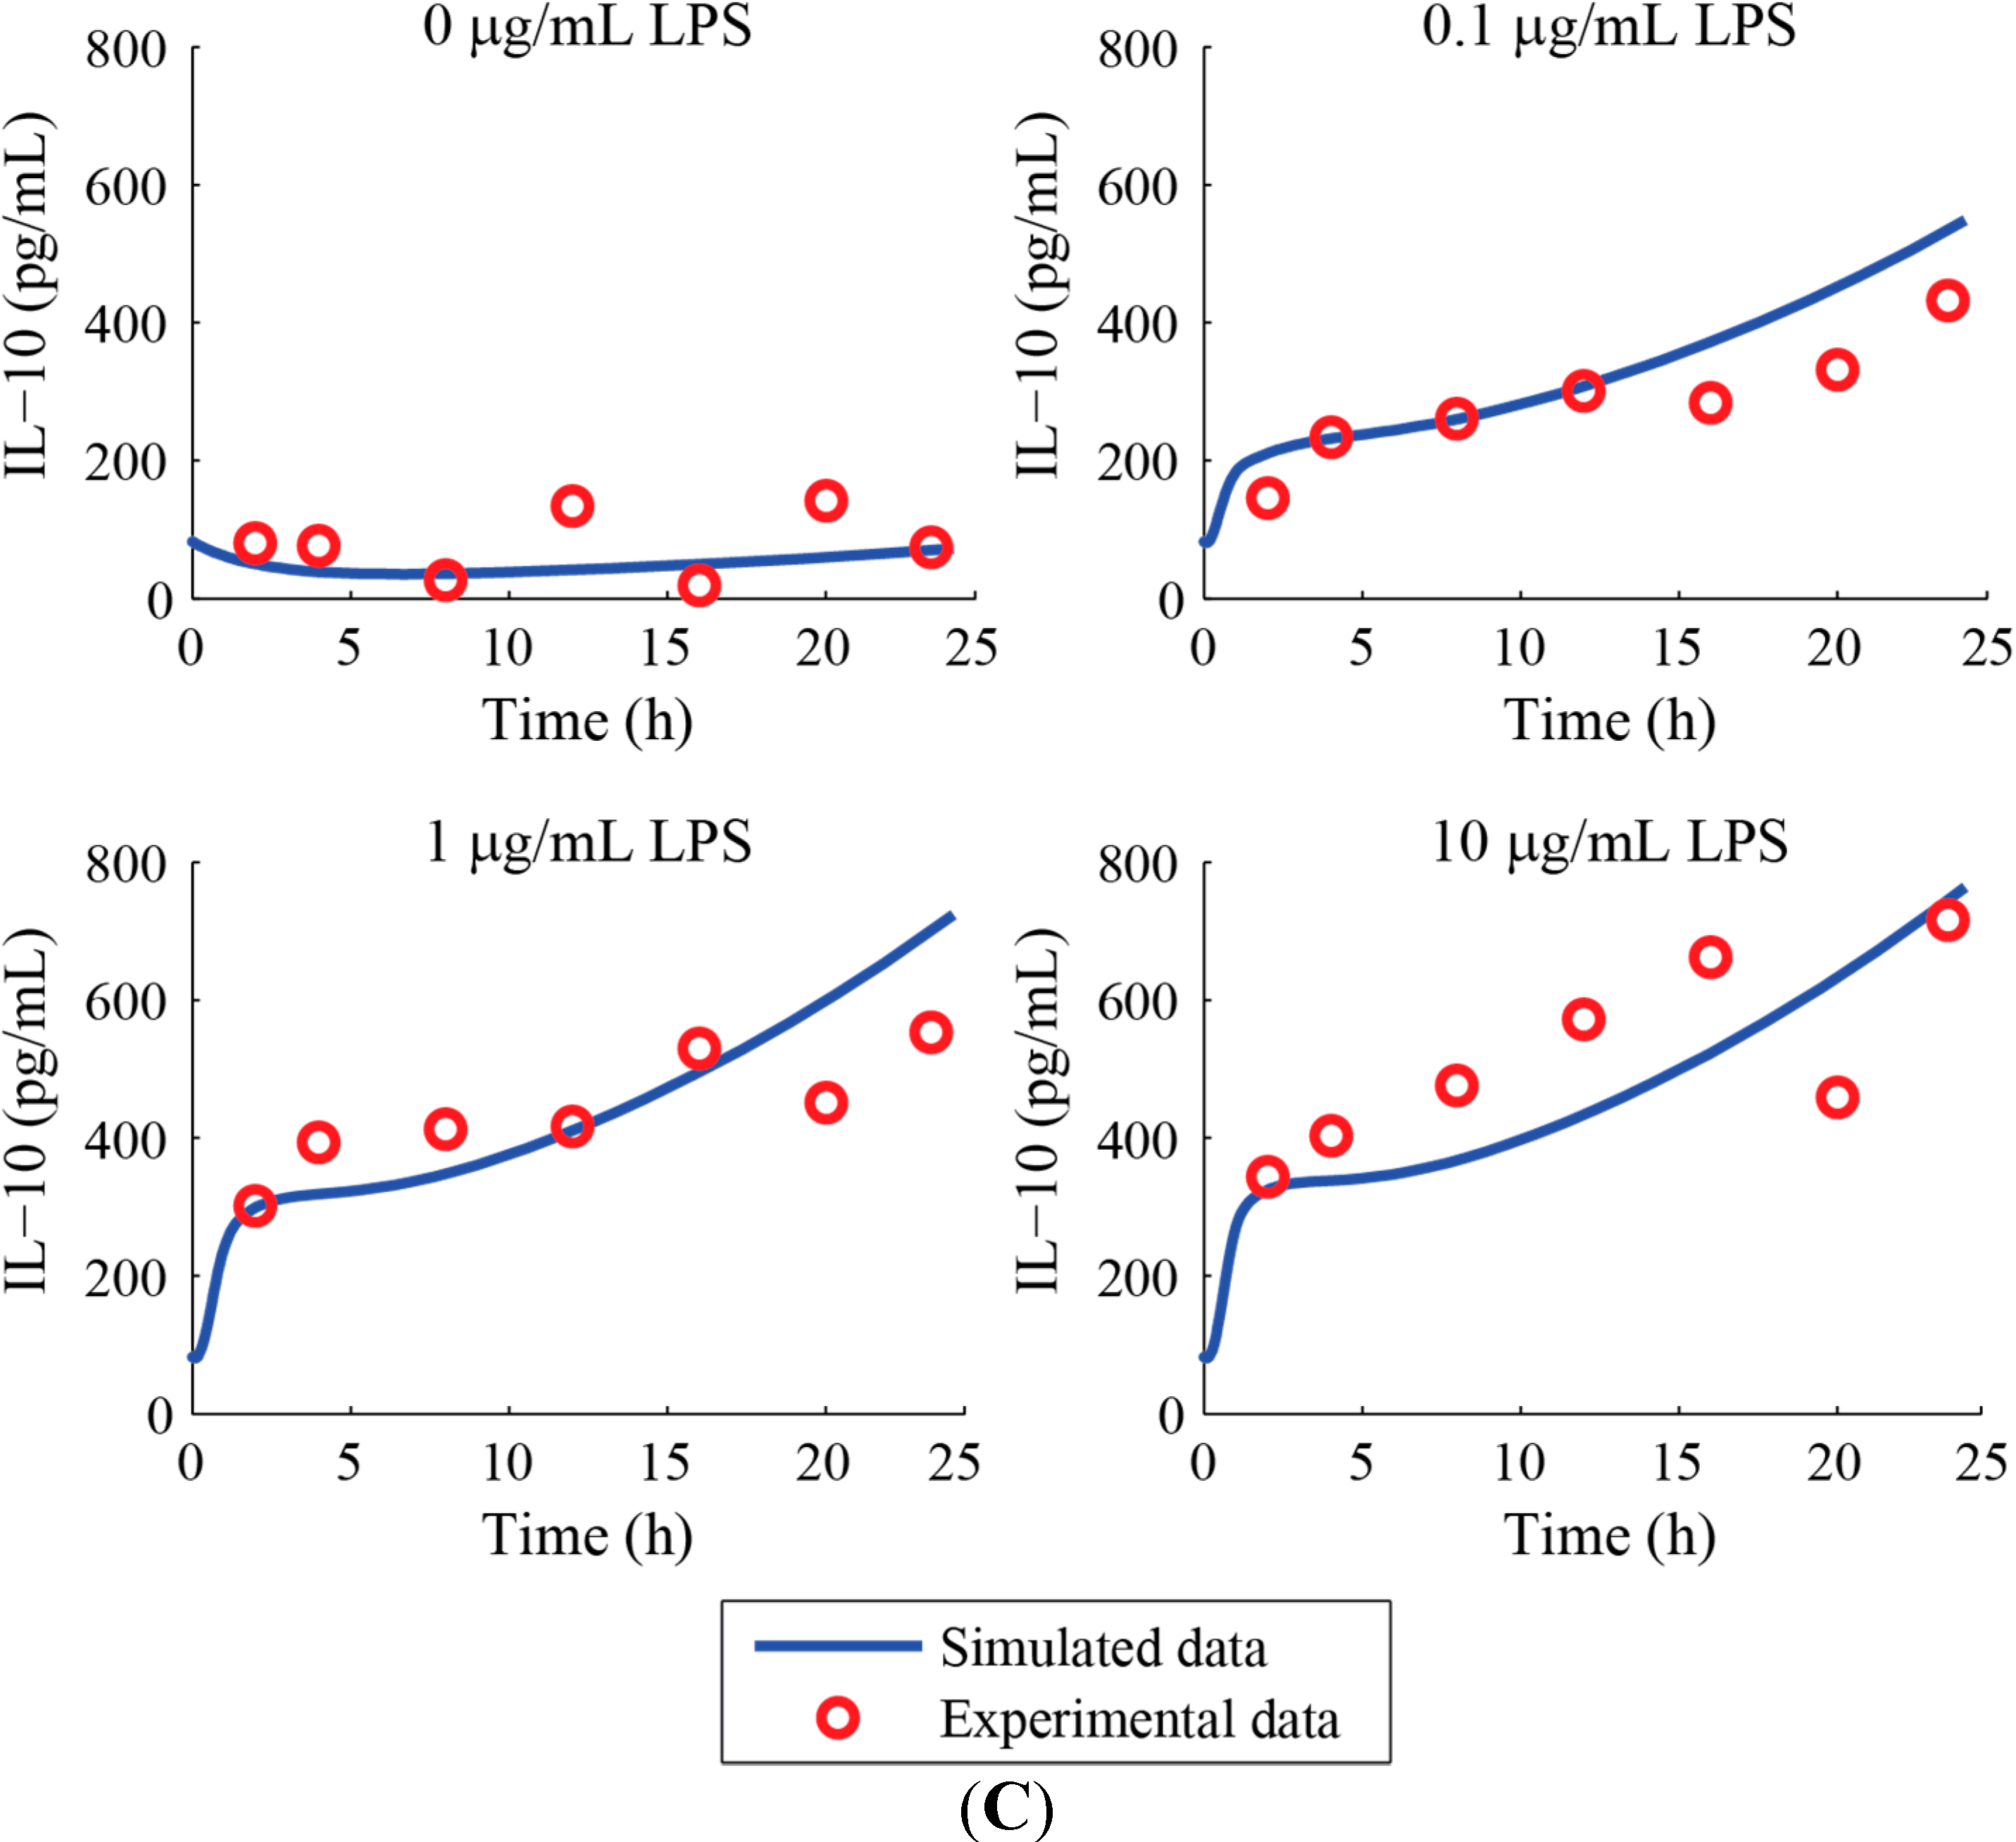
2.3.3. Cytokines TNF-α and IL-10 Quantification by ELISA
3. Results and Discussion


Acknowledgments
Author Contributions
Conflicts of Interest
References
- Nathan, C. Points of control in inflammation. Nature 2002, 420, 846–852. [Google Scholar]
- Hansson, G.K.; Libby, P.; Schönbeck, U.; Yan, Z.Q. Innate and adaptive immunity in the pathogenesis of atherosclerosis. Circ. Res. 2002, 91, 281–291. [Google Scholar] [CrossRef] [PubMed]
- Andersen-Nissen, E.; Smith, K.D.; Bonneau, R.; Strong, R.K.; Aderem, A. A conserved surface on Toll-like receptor 5 recognizes bacterial flagellin. J. Exp. Med. 2007, 204, 393–403. [Google Scholar] [CrossRef] [PubMed]
- Medzhitov, R.; Janeway, C. Innate immune recognition: mechanisms and pathways. Immunol. Rev. 2000, 173, 89–97. [Google Scholar] [CrossRef] [PubMed]
- Mantovani, A.; Cassatella, M.A.; Costantini, C.; Jaillon, S. Neutrophils in the activation and regulation of innate and adaptive immunity. Nat. Rev. Immunol. 2011, 11, 519–531. [Google Scholar] [CrossRef] [PubMed]
- Lodes, M.J.; Cong, Y.; Elson, C.O.; Mohamath, R.; Landers, C.J.; Targan, S.R.; Fort, M.; Hershberg, R.M. Bacterial flagellin is a dominant antigen in Crohn disease. J. Clin. Invest. 2004, 113, 1296–1306. [Google Scholar] [CrossRef] [PubMed]
- Montuschi, P. Pharmacotheraphy of patients with mild persistent asthma: strategies and unresolved issues. Front. Pharmacol. 2011, 2. [Google Scholar] [CrossRef]
- Trivedi, P.J.; Adams, D.H. Mucosal immunity in liver autoimmunity: A comprehensive review. J. Autoimmun. 2013, 46, 97–111. [Google Scholar] [CrossRef] [PubMed]
- Ghosh, G.; Wang, V.Y.F.; Huang, D.B.; Fusco, A. NF-κB regulation: Lessons from structures. Immunol. Rev. 2012, 246, 36–58. [Google Scholar] [CrossRef] [PubMed]
- Baeuerle, P.A.; Baltimore, D. A 65-kappaD subunit of active NF-kappaB is required for inhibition of NF-kappaB by I kappaB. Genes Dev. 1989, 3, 1689–1698. [Google Scholar] [CrossRef] [PubMed]
- Hayden, M.S.; Ghosh, S. Shared principles in NF-κB signaling. Cell 2008, 132, 344–362. [Google Scholar] [CrossRef] [PubMed]
- Bogdan, C.; Vodovotz, Y.; Nathan, C. Macrophage deactivation by interleukin 10. J. Exp. Med. 1991, 174, 1549–1555. [Google Scholar] [CrossRef] [PubMed]
- Collart, M.A.; Baeuerle, P.; Vassalli, P. Regulation of tumor necrosis factor alpha transcription in macrophages: Involvement of four kappa B-like motifs and of constitutive and inducible forms of NF-kappa B. Mol. Cell. Biol. 1990, 10, 1498–1506. [Google Scholar] [PubMed]
- Saraiva, M.; Christensen, J.R.; Tsytsykova, A.V.; Goldfeld, A.E.; Ley, S.C.; Kioussis, D.; O’Garra, A. Identification of a macrophage-specific chromatin signature in the IL-10 locus. J. Immunol. 2005, 175, 1041–1046. [Google Scholar] [CrossRef] [PubMed]
- Scott, M.L.; Fujita, T.; Liou, H.C.; Nolan, G.P.; Baltimore, D. The p65 subunit of NF-kappa B regulates I kappa B by two distinct mechanisms. Genes Dev. 1993, 7, 1266–1276. [Google Scholar] [CrossRef] [PubMed]
- Zhang, S.Q.; Kovalenko, A.; Cantarella, G.; Wallach, D. Recruitment of the IKK signalosome to the p55 TNF receptor: RIP and A20 bind to NEMO (IKKγ) upon receptor stimulation. Immunity 2000, 12, 301–311. [Google Scholar] [CrossRef] [PubMed]
- Benkhart, E.M.; Siedlar, M.; Wedel, A.; Werner, T.; Ziegler-Heitbrock, H.W.L. Role of Stat3 in lipopolysaccharide-induced IL-10 gene expression. J. Immunol. 2000, 165, 1612–1617. [Google Scholar] [CrossRef] [PubMed]
- Lang, R.; Patel, D.; Morris, J.J.; Rutschman, R.L.; Murray, P.J. Shaping gene expression in activated and resting primary macrophages by IL-10. J. Immunol. 2002, 169, 2253–2263. [Google Scholar] [CrossRef] [PubMed]
- Niemand, C.; Nimmesgern, A.; Haan, S.; Fischer, P.; Schaper, F.; Rossaint, R.; Heinrich, P.C.; Müller-Newen, G. Activation of STAT3 by IL-6 and IL-10 in primary human macrophages is differentially modulated by suppressor of cytokine signaling 3. J. Immunol. 2003, 170, 3263–3272. [Google Scholar] [CrossRef] [PubMed]
- Lee, K.C.; Chang, H.H.; Chung, Y.H.; Lee, T.Y. Andrographolide acts as an anti-inflammatory agent in LPS-stimulated RAW264.7 macrophages by inhibiting STAT3-mediated suppression of the NF-κB pathway. J. Ethnopharmacol. 2011, 135, 678–684. [Google Scholar] [CrossRef] [PubMed]
- Bhattacharyya, S.; Sen, P.; Wallet, M.; Long, B.; Baldwin, A.S.; Tisch, R. Immunoregulation of dendritic cells by IL-10 is mediated through suppression of the PI3K/Akt pathway and of IκB kinase activity. Blood 2004, 104, 1100–1109. [Google Scholar] [CrossRef] [PubMed]
- Driessler, F.; Venstrom, K.; Sabat, R.; Asadullah, K.; Schottelius, A.J. Molecular mechanisms of interleukin-10-mediated inhibition of NF-κB activity: A role for p50. Clin. Exp. Immunol. 2004, 135, 64–73. [Google Scholar] [CrossRef] [PubMed]
- Schottelius, A.J.; Mayo, M.W.; Sartor, R.B.; Baldwin, A.S. Interleukin-10 signaling blocks inhibitor of κB kinase activity and nuclear factor κB DNA binding. J. Biol. Chem. 1999, 274, 31868–31874. [Google Scholar] [CrossRef] [PubMed]
- Singh, A.; Jayaraman, A.; Hahn, J. Modeling regulatory mechanisms in IL-6 signal transduction in hepatocytes. Biotechnol. Bioeng. 2006, 95, 850–862. [Google Scholar] [CrossRef] [PubMed]
- Huang, Z.; Senocak, F.; Jayaraman, A.; Hahn, J. Integrated modeling and experimental approach for determining transcription factor profiles from fluorescent reporter data. BMC Syst. Biol. 2008, 2. [Google Scholar] [CrossRef]
- Lipniacki, T.; Paszek, P.; Brasier, A.R.; Luxon, B.; Kimmel, M. Mathematical model of NF-κB regulatory module. J. Theor. Biol. 2004, 228, 195–215. [Google Scholar] [CrossRef] [PubMed]
- Rangamani, P.; Sirovich, L. Survival and apoptotic pathways initiated by TNF-α: Modeling and predictions. Biotechnol. Bioeng. 2007, 97, 1216–1229. [Google Scholar] [CrossRef] [PubMed]
- Hoffmann, A.; Levchenko, A.; Scott, M.L.; Baltimore, D. The IκB-NF-κB signaling module: Temporal control and selective gene activation. Science 2002, 298, 1241–1245. [Google Scholar] [CrossRef] [PubMed]
- Moya, C.; Huang, Z.; Cheng, P.; Jayaraman, A.; Hahn, J. Investigation of IL-6 and IL-10 signalling via mathematical modelling. IET Syst. Biol. 2011, 5, 15–26. [Google Scholar] [CrossRef] [PubMed]
- Gray, P.W.; Barrett, K.; Chantry, D.; Turner, M.; Feldmann, M. Cloning of human tumor necrosis factor (TNF) receptor cDNA and expression of recombinant soluble TNF-binding protein. Proc. Natl. Acad. Sci. USA 1990, 87, 7380–7384. [Google Scholar] [CrossRef] [PubMed]
- Fedorak, R.N.; Gangl, A.; Elson, C.O.; Rutgeerts, P.; Schreiber, S.; Wild, G.; Hanauer, S.B.; Kilian, A.; Cohard, M.; LeBeaut, A.; et al. Recombinant human interleukin 10 in the treatment of patients with mild to moderately active Crohn’s disease. Gastroenterology 2000, 119, 1473–1482. [Google Scholar] [CrossRef]
- Tjoa, I.B.; Biegler, L.T. Simultaneous solution and optimization strategies for parameter estimation of differential-algebraic equation systems. Ind. Eng. Chem. Res. 1991, 30, 376–385. [Google Scholar] [CrossRef]
- Kravaris, C.; Hahn, J.; Chu, Y. Advances and selected recent developments in state and parameter estimation. Comput. Chem. Eng. 2013, 51, 111–123. [Google Scholar] [CrossRef]
- Riley, J.K.; Takeda, K.; Akira, S.; Schreiber, R.D. Interleukin-10 receptor signaling through the JAK-STAT pathway: Requirement for two distinct receptor-derived signals for anti-inflammatory action. J. Biol. Chem. 1999, 274, 16513–16521. [Google Scholar] [CrossRef] [PubMed]
- Rahim, S.S.; Khan, N.; Boddupalli, C.S.; Hasnain, S.E.; Mukhopadhyay, S. Interleukin-10 (IL-10) mediated suppression of IL-12 production in RAW 264.7 cells also involves c-rel transcription factor. Immunology 2005, 114, 313–321. [Google Scholar] [CrossRef] [PubMed]
- Chu, Y.; Hahn, J. Parameter set selection via clustering of parameters into pairwise indistinguishable groups of parameters. Ind. Eng. Chem. Res. 2008, 48, 6000–6009. [Google Scholar] [CrossRef]
- Dai, W.; Bansal, L.; Hahn, J.; Word, D. Parameter set selection for dynamic systems under uncertainty via dynamic optimization and hierarchical clustering. AIChE J. 2014, 60, 181–192. [Google Scholar] [CrossRef]
- Murray, P.J. The primary mechanism of the IL-10-regulated anti-inflammatory response is to selectively inhibit transcription. Proc. Natl. Acad. Sci. USA 2005, 102, 8686–8691. [Google Scholar] [CrossRef] [PubMed]
- Carl, V.S.; Gautam, J.K.; Comeau, L.D.; Smith, M.F. Role of endogenous IL-10 in LPS-induced STAT3 activation and IL-1 receptor antagonist gene expression. J. Leukoc. Biol. 2004, 76, 735–742. [Google Scholar] [CrossRef] [PubMed]
- Tian, X.J.; Zhang, X.P.; Liu, F.; Wang, W. Interlinking positive and negative feedback loops creates a tunable motif in gene regulatory networks. Phys. Rev. E 2009, 80. [Google Scholar] [CrossRef]
- Bansal, T.; Alaniz, R.C.; Wood, T.K.; Jayaraman, A. The bacterial signal indole increases epithelial-cell tight-junction resistance and attenuates indicators of inflammation. Proc. Natl. Acad. Sci. USA 2010, 107, 228–233. [Google Scholar] [CrossRef] [PubMed]
© 2014 by the authors; licensee MDPI, Basel, Switzerland. This article is an open access article distributed under the terms and conditions of the Creative Commons Attribution license (http://creativecommons.org/licenses/by/4.0/).
Share and Cite
Maiti, S.; Dai, W.; Alaniz, R.C.; Hahn, J.; Jayaraman, A. Mathematical Modeling of Pro- and Anti-Inflammatory Signaling in Macrophages. Processes 2015, 3, 1-18. https://doi.org/10.3390/pr3010001
Maiti S, Dai W, Alaniz RC, Hahn J, Jayaraman A. Mathematical Modeling of Pro- and Anti-Inflammatory Signaling in Macrophages. Processes. 2015; 3(1):1-18. https://doi.org/10.3390/pr3010001
Chicago/Turabian StyleMaiti, Shreya, Wei Dai, Robert C. Alaniz, Juergen Hahn, and Arul Jayaraman. 2015. "Mathematical Modeling of Pro- and Anti-Inflammatory Signaling in Macrophages" Processes 3, no. 1: 1-18. https://doi.org/10.3390/pr3010001