Article

Stability Analysis of Reactive Multiphase Slug Flows in Microchannels

Laboratory of Chemical Reaction Engineering, Department of Biochemical and Chemical Engineering, Technical University of Dortmund, Dortmund 44227, Germany
*
Author to whom correspondence should be addressed.
Processes 2014, 2(2), 371-391; https://doi.org/10.3390/pr2020371
Submission received: 5 December 2013 / Revised: 21 March 2014 / Accepted: 22 April 2014 / Published: 6 May 2014

Abstract

:
Conducting multiphase reactions in micro-reactors is a promising strategy for intensifying chemical and biochemical processes. A major unresolved challenge is to exploit the considerable benefits offered by micro-scale operation for industrial scale throughputs by numbering-up whilst retaining the underlying advantageous flow characteristics of the single channel system in multiple parallel channels. Fabrication and installation tolerances in the individual micro-channels result in different pressure losses and, thus, a fluid maldistribution. In this work, an additional source of maldistribution, namely the flow multiplicities, which can arise in a multiphase reactive or extractive flow in otherwise identical micro-channels, was investigated. A detailed experimental and theoretical analysis of the flow stability with and without reaction for both gas-liquid and liquid-liquid slug flow has been developed. The model has been validated using the extraction of acetic acid from n-heptane with the ionic liquid 1-Ethyl-3-methylimidazolium ethyl sulfate. The results clearly demonstrate that the coupling between flow structure, the extent of reaction/extraction and pressure drop can result in multiple operating states, thus, necessitating an active measurement and control concept to ensure uniform behavior and optimal performance.

1. Introduction

An effective exploitation of the advantages of microscale operation for industrial production processes requires a reliable and robust numbering-up procedure. For multiphase systems, one must not only ensure uniform flow rates of each phase but also similar flow structures [1] and residence time distributions [2,3] in the individual microchannels, if the optimal performance is to be achieved [4]. Furthermore, in reactive systems, multiplicities can arise, leading to drastic differences in the behavior between otherwise identical microchannels [5]. The problem is compounded by the greater significance of fabrication tolerances at the microscale, since even slight discrepancies can give rise to considerable changes in volumetric flow rates, which scale with the fourth power of the channel diameter [6,7].
Passive distribution strategies thus necessitate high-precision machining, usually entail large upstream pressure drops and are unable to adapt to changing operating conditions, such as fouling [8]. An active approach, in which the flow in each microchannel is monitored and regulated using simple non-invasive probes and actuators overcome these shortcomings [9].
Even so, the multiplicities in reactive flows still represent a particularly severe challenge, since they can not only diminish performance but may also lead to hazardous runaway situations or reactor failure. In polymerizations, for instance, the reaction and hydrodynamics are strongly coupled through the viscosity of the reaction medium. Should, for whatever reason, the flow in one channel be less than that in the others, the resulting increase in the residence time will yield higher conversion and thus viscosities, increasing the resistance to flow and lowering the flow rate still further. If no remedial action is taken, this self-reinforcing mechanism amplifies any flow divergence and can ultimately cause the channel concerned to plug.
Of course, such multiplicities are by no means confined to microscale systems. In multiphase flow in microchannels, on the other hand, certain reactive hydrodynamic multiplicities can arise which are unlikely or even impossible in macroscale equipment, due to the intensified interaction in the biphasic flow. In an alternating gas-liquid slug flow with absorption, for example, the gas uptake reduces the size of the gas slugs, thus, changing the pressure drop characteristics of the flow, raising the channel residence time and thus enhancing the absorption still further. Conversely, reactions that generate gas or decrease viscosity exert a stabilizing influence on the uniformity of the flow distribution over parallel microchannels.
The objective of the work presented here was to elucidate the relevance of such microscale-specific phenomena in the parallelization of multiphase flows in microchannels and to establish if it might be feasible to utilize self-regulating behavior in order to ameliorate irregularities in flow distribution.

2. Experimental Extraction

A liquid-liquid extraction was used to validate the results obtained after adapting the gas-liquid model presented in Section 3. The chemical, analytics and the experimental set up are described in the following sections.

2.1. Chemicals and Analytics

The chemicals n-heptane and acetic acid were supplied from VWR prolab with a purity of 99.7% w/w and 99% w/w. The ionic liquid 1-ethyl-3-methylimidazolium ethylsulfate [EMIM] [EtSO4] was obtained from Io-Li-Tec (Ionic Liquids Technology, Tuscsaloosa, AL, USA) with a purity of 99% w/w. The most significant properties of the chemicals used are shown in Table 1. The viscosities were measured by means of a capillary viscosimeter (KPG Ubbelohde capillary viscosimeter, Schott AG, Mainz, Germany) and the concentration of acetic acid in n-heptane was analyzed by an Agilent 7890A gas chromatograph using an autosampler Agilent 7693 and a flame-ionization detector (FID) from Agilent Technologies (Agilent Technologies, Böblingen, Germany). A capillary column HP-05 (Agilent Technologies, Böblingen, Germany) with a length of 30 m and an inner diameter of 320 µm was employed and helium used as carrier gas with a flow rate of 1.22 mL/min at a temperature of 250 °C.
Table 1. Physical properties of extractive system at 25 °C and 1 atm.
PropertyUnitn-Heptane [10]Acetic acid [10] [EMIM][EtSO4] [11]
Molecular weightg/mol100.2160.05236.29
Surface tensionN/m--------0.004879
Densityg/cm30.67871.0431.2423
Dynamic viscositymPa.s0.431.2295 [11]/69 (measured)

2.2. Experimental Setup

The experimental set-up is shown in Figure 1. n-Heptane containing 10% w/w acetic acid and EMIM EtSO4 were introduced by two syringe pumps (LA-100 Landgraf Laborsysteme HLL GmbH, Langenhagen, Germany) into a “Mixer-Valve” where the slug flow of the immiscible phases was generated. This special valve enables the slug length to be manipulated whilst keeping all other parameters, for example flow rates and the physical properties of components, constant. The outlet of the mixer was connected to a Polytetrafluoroethylene-capillary (PTFE-capillary) with an inner diameter of 800 µm. To achieve well-defined extraction times a union T-separator was installed downstream of the contacting section to implement an instantaneous liquid-liquid phase separation by virtue of their different wetting properties. One of the separator outlets consists of a steel capillary, with an inner diameter of 750 µm, and the other comprises a PTFE-capillary with an inner diameter of 800 µm. The dispersed EMIM EtSO4 phase, which does not wet the PTFE capillary wall, leaves via the steel outlet while the continuous n-heptane phase exits through the PTFE branch.
Figure 1. (a) Flowsheet schematic of the experimental setup; (b) Pressure drop measurement technique.
Processes 02 00371 g001
The pressure drop measurement technique is depicted in Figure 1b. The pressure drop of interest is that in the reaction capillary denoted ΔPslugflow. To avoid the pressure sensor influencing the multiphase flow structure, the pressure sensors are placed upstream of the mixing point. The pressure drop ΔP2 was measured without the separator and ΔP1 following removal of the capillary from the mixer. The pressure drop of the mass transfer contacting section is then calculated as:
ΔPslugflow = ΔP1 − ΔP2
In order to describe the mass transfer for a liquid-liquid system, the extraction efficiency was used:
Processes 02 00371 i001
where CEq is the equilibrium concentration at a phase ratio EMIM EtSO4:n-heptane of 0.2. This concentration was measured at room temperature in a 20 mL batch reactor. Cin and Cout are the inlet and outlet concentrations of acetic acid in the extract phase, i.e., EMIM EtSO4, respectively.
The phase ratio (α) was defined via a snapshot with a camera and an optical sensor. For this case, the volume fraction of the film was considered negligible. The phase ratio can then be defined as:
Processes 02 00371 i002
Observed flow structures and unit cells under different conditions are presented in Figure 2.
Figure 2. Observed flow structure and unit cell for a superficial velocity of 0.044 m/s and (a) phase ratio 1; (b) phase ratio 2.
Processes 02 00371 g002

3. Gas-Liquid Model Equations

As shown in previous work, bubble length and bubble velocity play an important role for hydrodynamics and the mass transfer in the slug-flow regime. Even though some studies have focused on the possibility of the expansion of the bubble due to the inherent pressure drop [12,13], and in more recent studies [14,
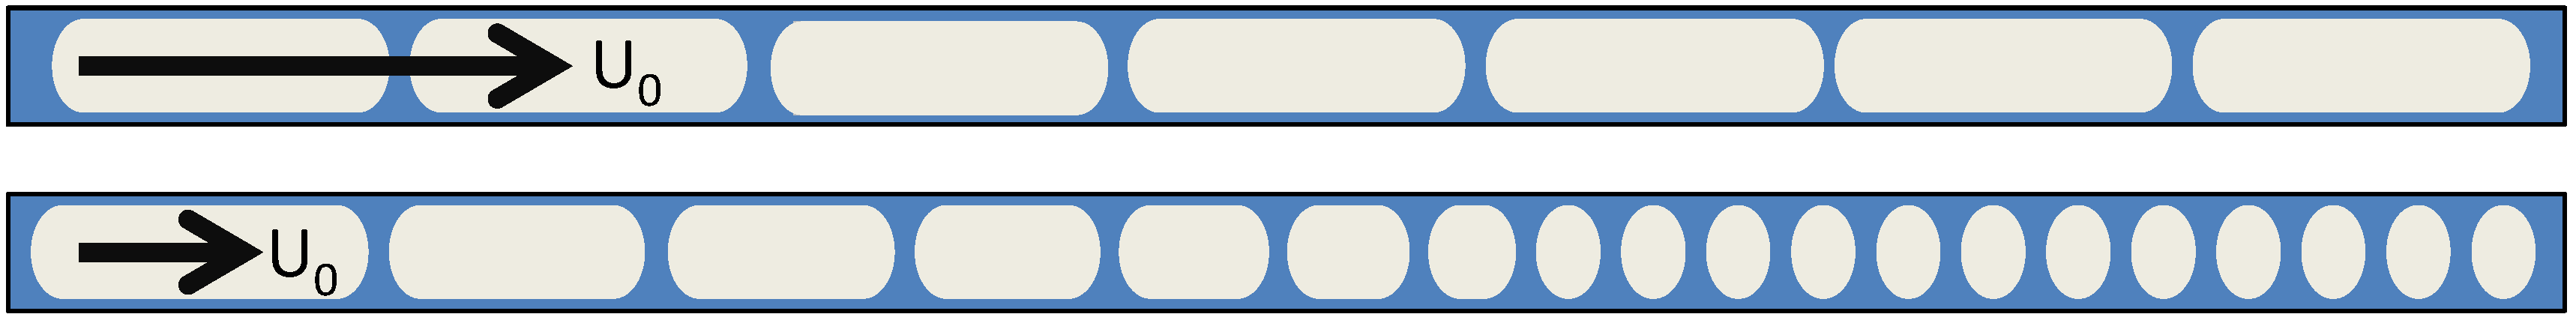
15] due to mass transfer from the liquid into the gas phase, none of them has considered the fact that, for very reactive systems, the effect of the consumption may well exceed that of the expansion of the bubble or the case where the mass transfer occurs from the gas to the liquid phase. The model presented in this work couples hydrodynamics with mass transfer and thus accounts for the change in the size of the bubble as a result of chemical absorption.
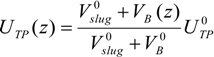
When the length of the bubble alters, several parameters are affected, starting with the superficial velocity. Since the volume of the unit cell comprising a single bubble and the associated slug is changing along the channel length, the two-phase superficial velocity will be a function of the position as given in Equation (4). This entails that all parameters that are velocity-dependent are also location-dependent, i.e., capillary and Reynolds numbers, film thickness and mass transfer coefficients.
Processes 02 00371 i003
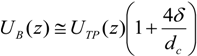
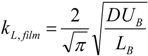
In slug flow, it is known that bubbles travel faster than the nominal superficial velocity due to the presence of a thin liquid wall film surrounding the bubble. The true velocity can be approximated by a simple mass balance in round capillaries, as expressed in Equation (5) (a deviation of no more than 5% was reported by [
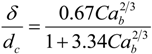
3]). In this equation, δ represents the film thickness and can be obtained by the expression found by Aussillous and Quéré [16], describing the extent of significant films in micro-channels (Equation (6)).
Processes 02 00371 i004
Processes 02 00371 i005
As can be seen, the film thickness is a function of the capillary number, Ca = μU/πσ which in turn is a function of the velocity and therefore also of the location as stated earlier.
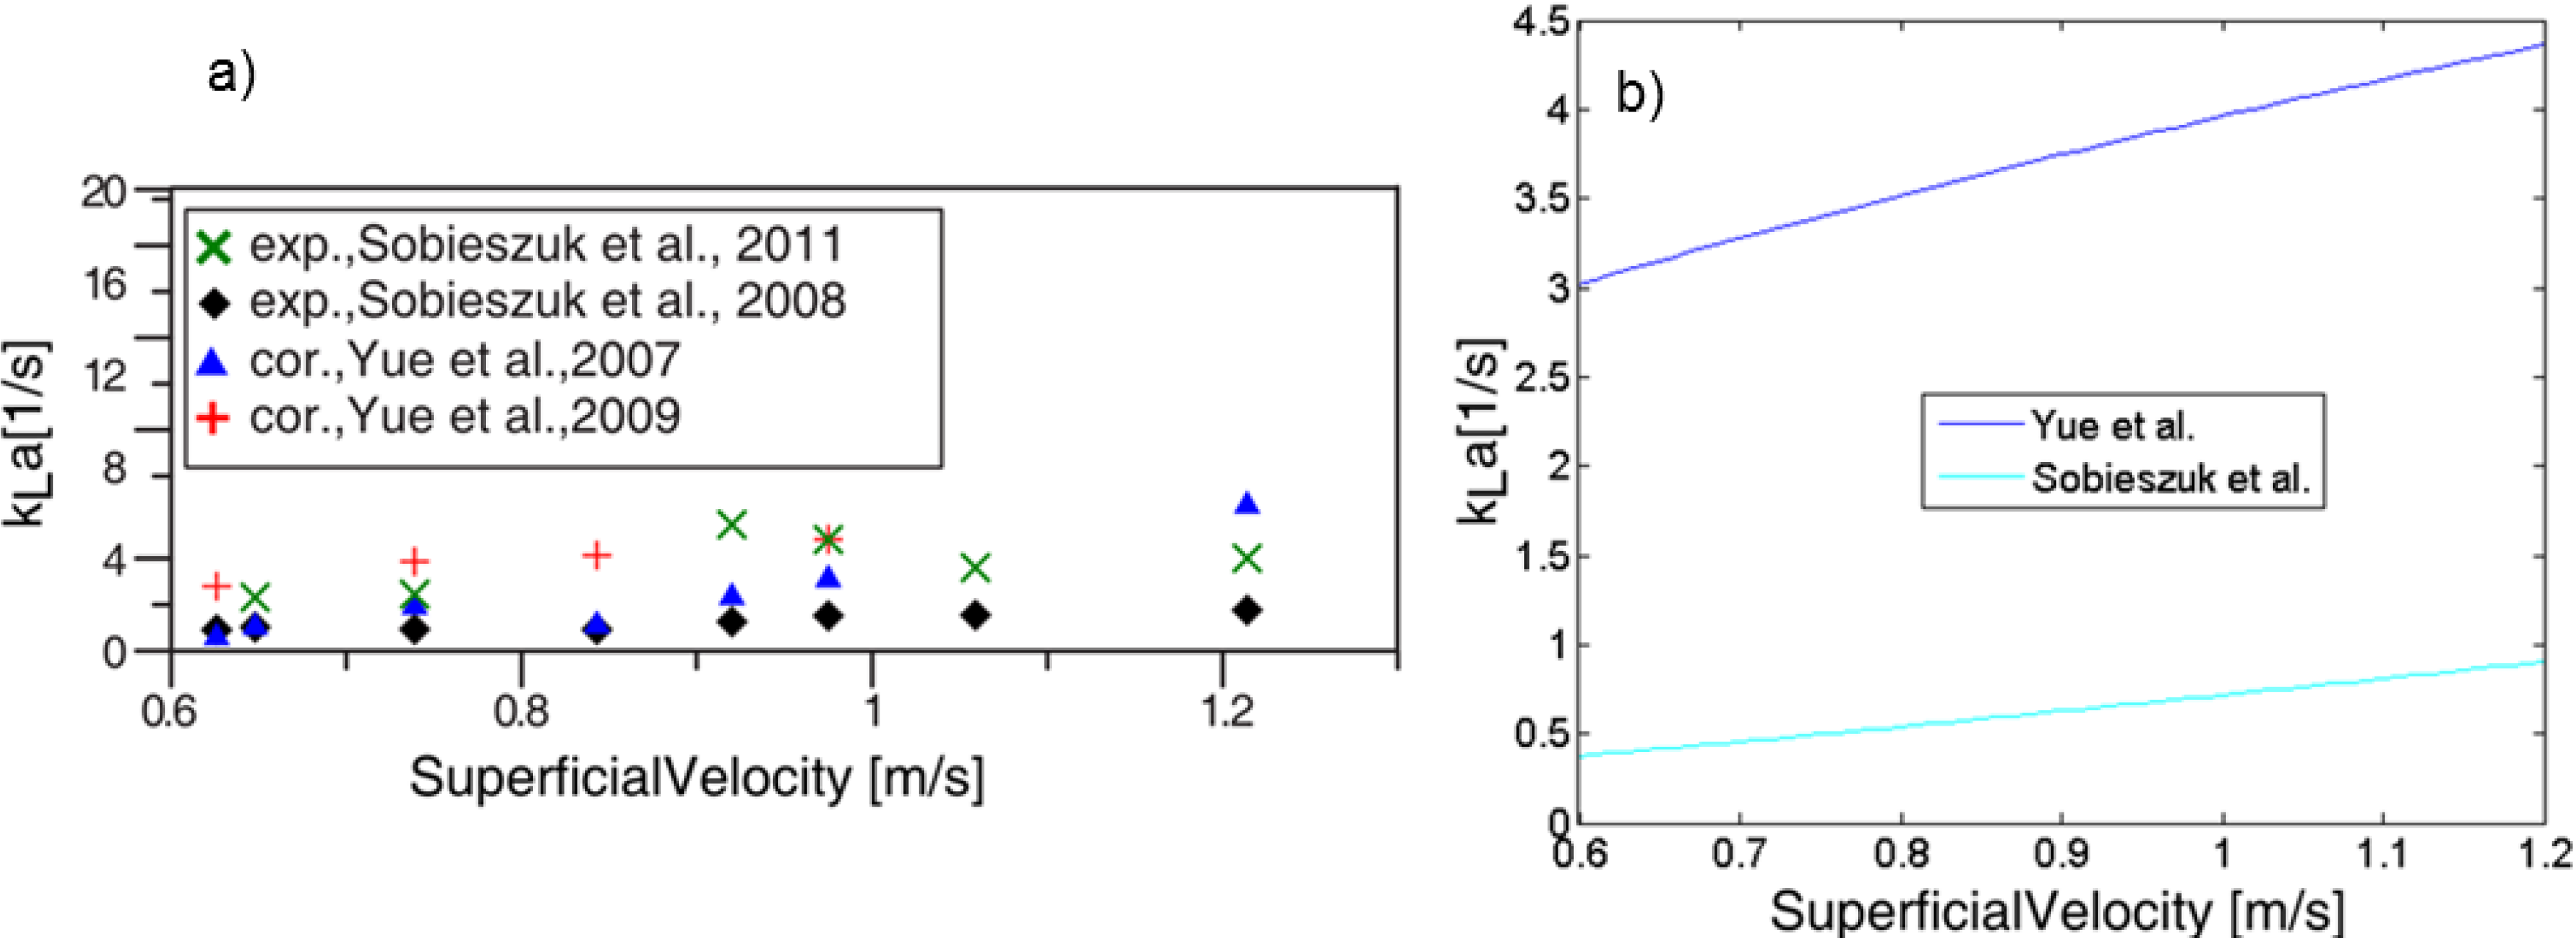
To describe the hydrodynamics, the pressure drop must be defined. In this work, the pressure drop is taken according to the unit cell based model presented by Warnier et al. [13]. In this model the pressure drop across a unit cell (presented in Figure 3) is defined by the individual contributions of the liquid slug and the pressure drop generated by the presence of the bubble.
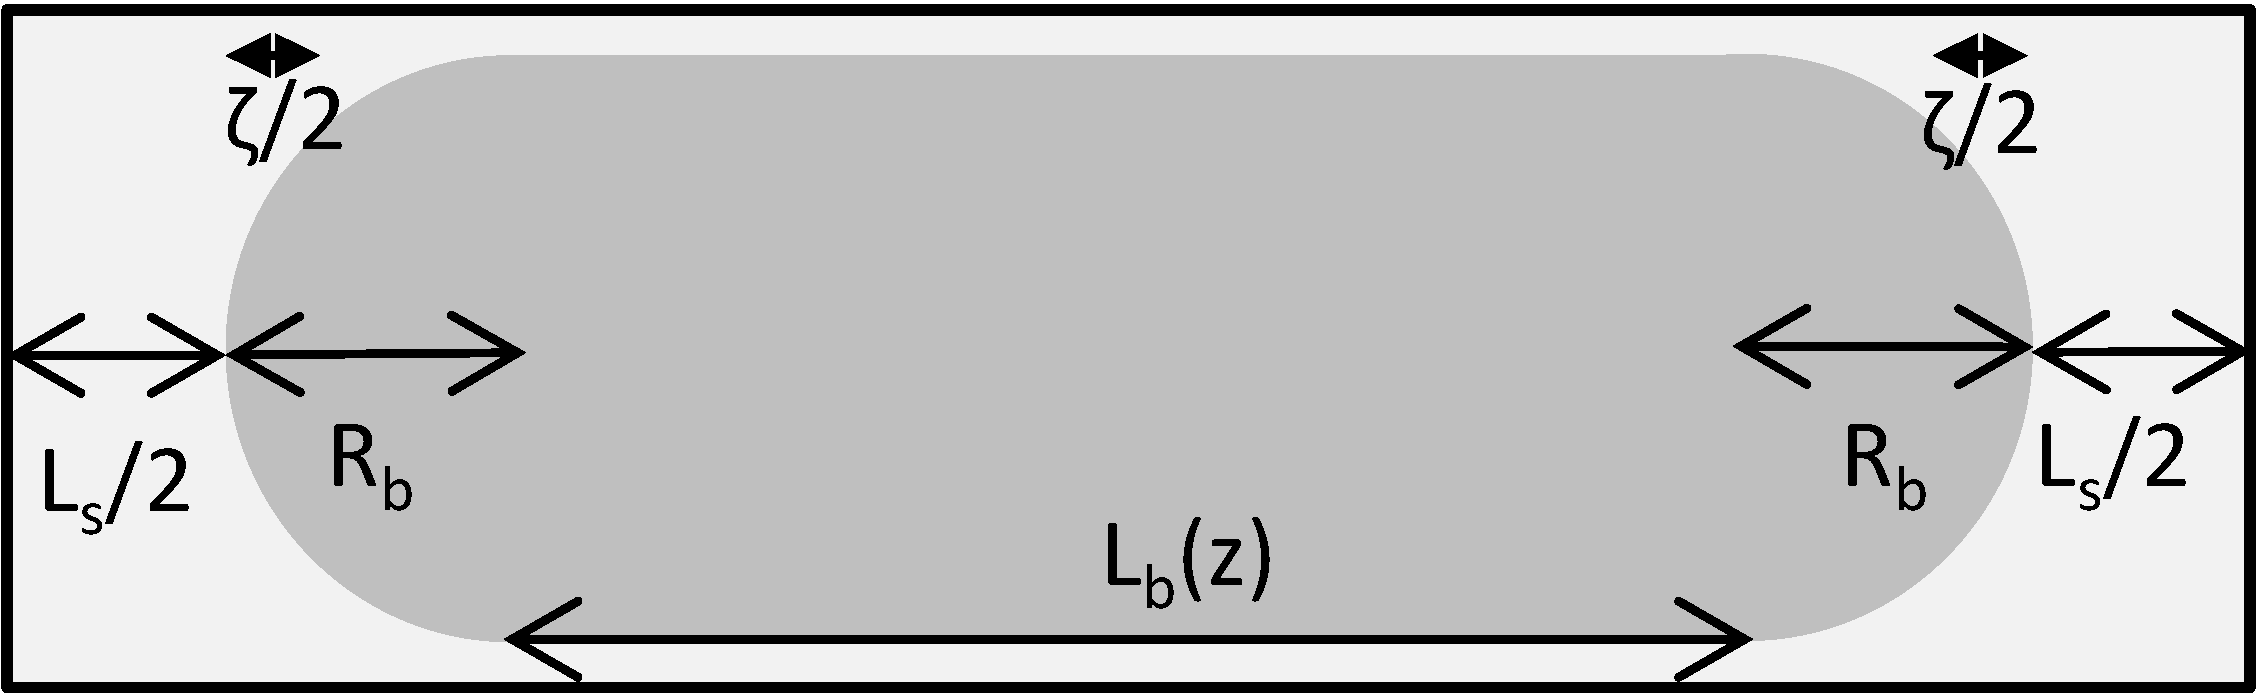
ΔPUC = ΔPLs + ΔPB
Figure 3. Unit cell representation. Lb represents the length of the bubble, Ls represents the slug length Rb is the bubble diameter and ζ accounts for the liquid in the cap region.
Processes 02 00371 g003
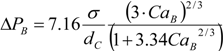
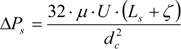
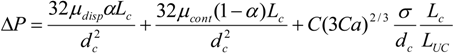
The individual bubble pressure is described by the corrected Bretherton’s approximation, and the liquid slug pressure drop is described by the fully developed Hagen-Poiseuille with a correction for the amount of liquid in the domed bubble cap region (ζ).
Processes 02 00371 i006
Processes 02 00371 i007
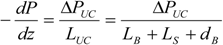
The differential pressure drop can then be obtained as:
Processes 02 00371 i008
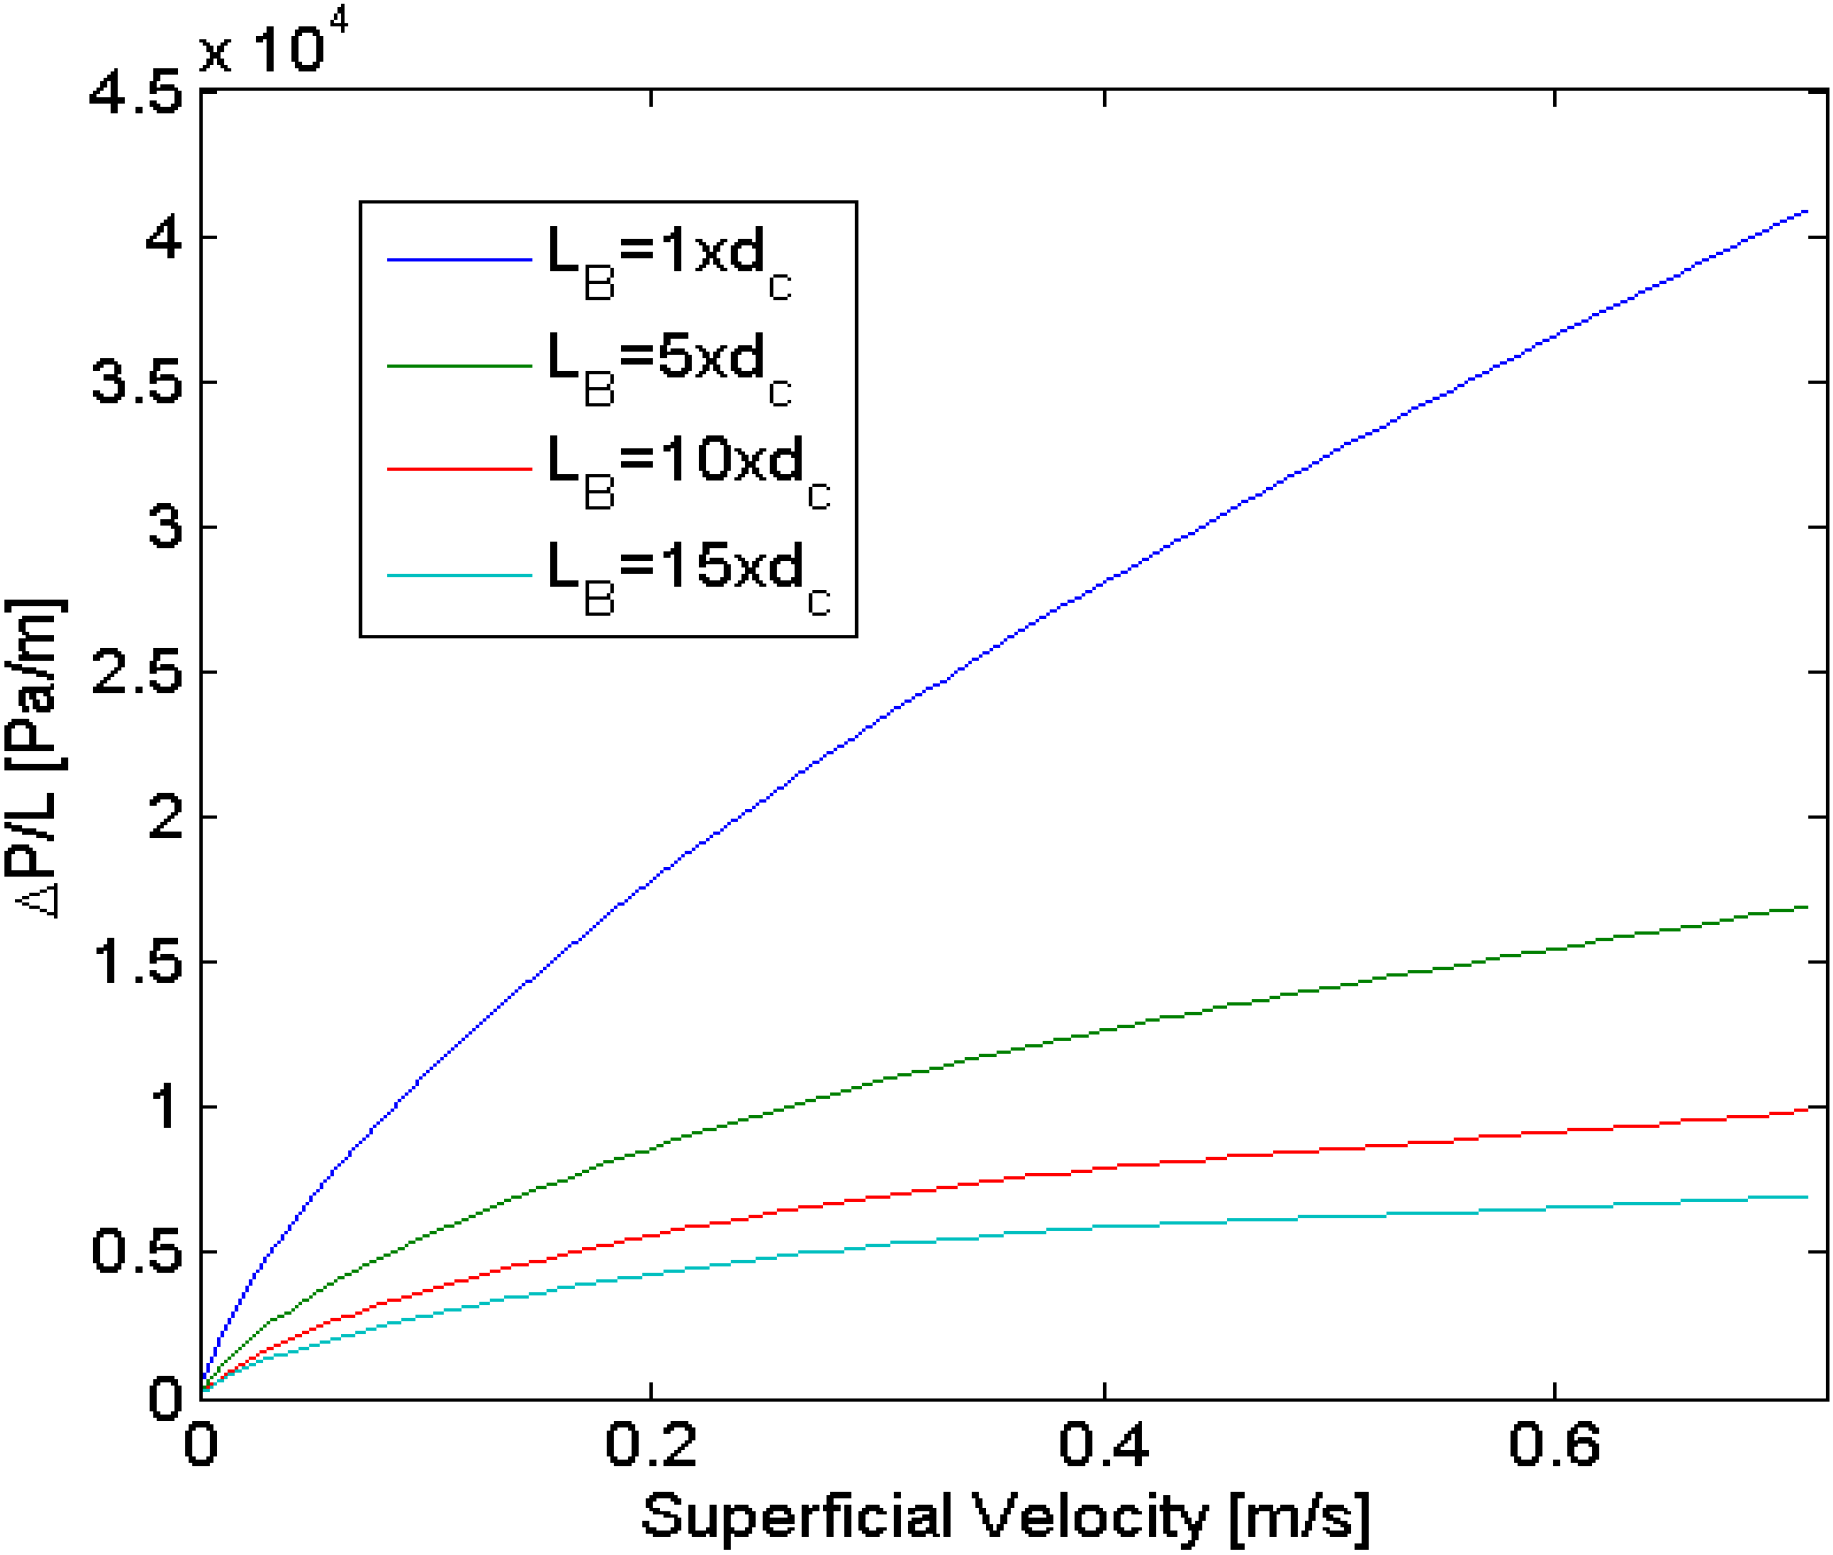
However, the length of the bubble is not constant along the channel length. In the case of gas absorption into the liquid phase, for instance, it is necessary to couple the mass transfer with the pressure drop in order to determine how the bubble contracts along the channel length.
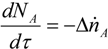
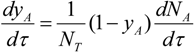
The change in the number of moles for the absorbed component with respect to the residence time can be given by:
Processes 02 00371 i009
Processes 02 00371 i010
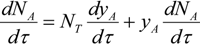
since the number of moles of the inert is not changing with time Equation (12) becomes:
Processes 02 00371 i011
yielding:
Processes 02 00371 i012
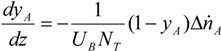
The residence time for the bubble is given by the bubble velocity yielding:
Processes 02 00371 i013
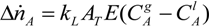
The chemical system used for this study was the widely studied chemical absorption of CO2 in NaOH [17]. First a pseudo 1st order reaction was assumed, but since the reaction was found to be fast enough, the chemical absorption was then simply accounted for by the inclusion of the enhancement factor. Finally, the change in the molar flow due to chemical absorption can be given by:
Processes 02 00371 i014
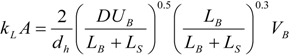
As for determining the mass transfer coefficient, several studies conducted on mass transfer in gas-liquid slug flow [18,19,20,21] were considered. In this work most of the available models were examined, with particular emphasis on the models of Vandu et al. [18] and Yue et al. [
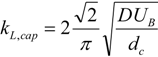
19], as they allow the introduction of changes in the parameters along the length of the channel. Vandu’s model treats the cap and wall film contributions separately according to:
Processes 02 00371 i015
Processes 02 00371 i016
Processes 02 00371 i017
Afilm = πdBLB
kLA = kL, capAcap + kL,filmAfilm
Yue’s model, on the other hand, considers the overall mass transfer across the entire interface:
Processes 02 00371 i018
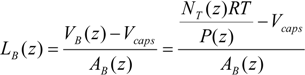
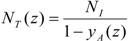
Finally, the link between the mass transfer and the pressure drop is given by the bubble length, since a relationship between bubble length and the total number of moles can be expressed as:
Processes 02 00371 i019
the total number of moles is linked to the molar fraction by the relationship:
Processes 02 00371 i020
yielding the influence of all parameters on the bubble length:
Processes 02 00371 i021
It is important to notice that the expansion due to the pressure drop presented in previous works is included in this model as well, since the volume of the bubble is calculated by using the pressure at each location.

4. Results and Discussion

4.1. Simulations

For the simulations, as mentioned before, the absorption of carbon dioxide (CO2) into sodium hydroxide (NaOH) was studied. For the modeling the resistance to mass transfer in the gas phase was neglected. The diffusion and Henry coefficients as well as the surface tension were taken for the system H2O/CO2. The system was considered to be isothermal at room temperature (298 K). The parameter values are summarized in Table 2.
Table 2. Parameter values for simulations.
ParameterValueUnits
σ0.072N/m
µ1mPa.s
ρ1000kg/m3
H3.85 × 10−4mol/m3/Pa
T298K
P101,325Pa
D2 × 10−9m2/s

4.1.1. Gas-Liquid Model Validation

In order to validate the model, the results obtained were compared with those obtained by previous simulation and experimental studies. First of all, the effect of the mass transfer model on the hydrodynamics was evaluated. The parameters used in this study are presented in Table 3 and the results given in Figure 4.
Table 3. Parameters for mass transfer validation.
ParameterValueUnits
dc400µm
LB,0dcµm
LS,0dcµm
kOH8.5m3/mol/s
COH0.1M
yCO20.4-----
LR0.1m
Figure 4. Pressure drop for different mass transfer models.
Processes 02 00371 g004
The results show that the choice of mass transfer model shows little or no influence on the hydrodynamics, only Vandu’s Model yields slightly different behavior, due to the overestimation of the mass transfer coefficients and hence a faster contraction of the bubble. It can also be seen that the range of pressure drop per unit length is of the same order of magnitude as in previous studies.
The model was also used to calculate the mass transfer coefficients and good agreement was obtained between the simulations and the experimental values presented by Yue et al. [19] and Sobieszuk et al. [20] (Figure 5). Since this model allows for the change in velocity, a more realistic residence time is calculated for the bubble and hence the expansion behavior present in the experiments is also captured.
Figure 5. Mass transfer coefficients (a) Theoretical (Adapted from [20]) (b) Obtained from our simulations (using both Yue et al. model [19] and Sobieszuk et al. model [20]).
Processes 02 00371 g005
For the final validation, the pressure drop model considered was compared to those previously presented in the literature (Figure 6). It can be seen that the unit cell based pressure drop model yields lower values for the pressure drop in comparison to Kreutzer’s model [22]. However, the results are in agreement with the values presented by Warnier et al. [13].
Figure 6. Pressure drop models comparison. The unit cell model is based in Warnier et al. [13] and the Kreutzer model is used as presented in [22].
Processes 02 00371 g006

4.1.2. Hydrodynamic Multiplicity

A hydrodynamic multiplicity has already been found in vertically operated monoliths by Kreutzer et al. [3]. However, it was due to the hydrostatic pressure in comparison to the coupling of parameters presented in this study.
Once the model had been validated, the stability of the system was studied. Since the contribution to the pressure drop in the gas phase is small for long slugs, a short slug was taken as the basis for this study. The pressure drop was then calculated by varying the bubble length; the length of the reactor was taken as 10 cm and its diameter as 800 µm. For simplicity the calculations were first performed neglecting the film.
For short bubbles (Figure 7) the pressure rises as expected at a higher velocity. However, upon increasing the bubble length, this effect tends to become smaller indicating to the hydrodynamic instability sought.
Figure 7. Pressure drop for small bubbles.
Processes 02 00371 g007
When bubble size was increased further, the multiplicity effect due to the increased pressure of the number of interfaces generated for higher conversions was found as illustrated in Figure 8.
Figure 8. Pressure drop for long bubbles.
Processes 02 00371 g008
This effect can be explained as follows: at a low velocity, the bubble will spend more time inside the channel therefore the conversion will be high, resulting in an increase of the number of interfaces and the average viscosity of the unit cells. At a higher velocity, conversion will be lower leading to a system with a lower average viscosity a lower number of interfaces and hence an equal pressure drop to the case with lower initial velocity. This effect is depicted in Figure 9.
Figure 9. Two cases for hydrodynamic multiplicity.
Processes 02 00371 g009

4.1.3. Film Effect

Since the results were obtained for the model without film, the next step was to calculate the complete model to check whether the discrepancy due to this simplification was significant. The results are presented in Figure 10. It can be seen that the inclusion of the film has a slight influence on the behavior, especially in the regions of higher superficial velocity. This can be explained by the wall film being thicker at higher velocities film since it depends on the capillary number. However, this effect was considered to be not large enough to affect the results qualitatively and therefore the subsequent calculations were performed without considering the film, since the computational effort was considerably smaller (with the film an iteration is required for each single step in order to establish the bubble velocity).
Figure 10. Film effect on pressure drop.
Processes 02 00371 g010

4.1.4. Interfacial Geometry

It has been found in some studies that the interfacial curvature factor used to calculate the interfacial pressure drop can change as a function of the velocity [23]. The value of 7.16 normally used (as in Equation (6) was proposed initially by Bretherton for hemispherical caps. Jovanovic et al. found that these values can actually range between 3 and 10. Since the instabilities arise from the bubble pressure drop, as shown previously, this effect also had to be considered. To account for this phenomenon, the values from Jovanovic et al. were correlated using a simple linear regression (Equation (26)). The results are presented in Figure 11.
C = −4.17 · UTP + 10.04
Figure 11. Effect of the curvature.
Processes 02 00371 g011
It can be seen that the effect of the curvature exerts a noticeable effect on the pressure drop characteristics, making the region of the multiplicity more pronounced. The higher curvature for lower velocities increases the influence of the remaining caps at the end of the channel where the lowest velocities are found, and as explained earlier, the effect of these extra interfaces is the source of the multiplicity.

4.1.5. Effect of Viscosity Changes

In the Section 4.1.2, a hydrodynamic multiplicity was identified, albeit for systems with unrealistic bubble lengths. A factor playing a major role in this phenomenon was the average viscosity in the unit cell. It is, thus, intuitively obvious to imagine that if the average viscosity changes along the channel length, the hydrodynamic multiplicity could be present in a wider range of systems in comparison with the case presented in Section 4.1.2. One possible case where this behavior can occur is in the case where viscosity changes with the progress of a reaction/extraction/absorption. For such systems, a general formula for the viscosity as a function of the conversion could be represented as:
μ(x) = 0xb + μ0
where a would represent the net increase in viscosity, and b the mechanism.
Using this behavior, multiplicities can be found even for systems with short bubbles. Figure 12 depicts the results for an initial bubble five times larger than the channel diameter and a value for a of 4 for various values of b.
Figure 13 presents the results for an initial bubble five times larger than the channel diameter and a value for b of 3 for different values of a.
As can be seen in both figures, any change increase viscosity leads to major changes in the pressure drop characteristics of the system and yielding instances of hydrodynamic multiplicity.
This leads to the question as to whether for systems with decreasing viscosity, the behavior would be the opposite, i.e., result in more stable systems with more uniform distribution. These results are presented in the same fashion as for increasing viscosity: first a fixed value of b of 3, and then for a fixed value of a of −0.5 in Figure 14.
Figure 12. Pressure drop for system with viscosity changes (Lb,0 = 5dc).
Processes 02 00371 g012
Figure 13. Pressure drop for systems with viscosity changes (Lb,0 = 5dc).
Processes 02 00371 g013
Figure 14. Pressure drop for systems with decreasing viscosity (a) Fixed a value (b) Fixed b value.
Processes 02 00371 g014
As it can be seen, no signs of instability were detected for this system, which exhibits self-regulating behavior. Experiments with a liquid-liquid extraction system in which the solvent viscosity diminishes with solute concentration were performed in an attempt to try and validate these results.

4.1.6. Model Adaptation to the Liquid-Liquid Case

Experiments were performed with a liquid-liquid system due to its relative simplicity in comparison to the gas-liquid case. The gas-liquid model was therefore adapted to an extractive aqueous-ionic liquid system. Conceptually the modifications were:
  • The pressure drop model was changed to that of a stagnant film model as presented by Jovanovic et al. [23].
    Processes 02 00371 i022
  • The extraction phenomenon (extraction of acetic acid from n-heptane into an ionic liquid) replaces the chemical absorption (absorption of CO2 in NaOH). The equation representing the concentration change along the channel is the following:
    Processes 02 00371 i023
With this adaptation, it is implied that the unit cell length will remain unchanged for both of the two phases and therefore no change in velocity will occur. However, the coupling of the mass transfer presented in the gas-liquid system is still present. Additionally, the viscosity change presented in Section 4.1.5 will be supplied by the change in viscosity of the ionic liquid. The experimental results are presented in the following section.
The hydrodynamic parameters for this system can be found in Table 1.

4.2. Experimental Validation: Liquid-Liquid System

The adapted model describing the coupling between fluid dynamics and the change in viscosity through mass transfer or reaction via the pressure drop and the residence time was validated through the extraction of acetic acid from n-heptane into the ionic liquid EMIM EtSO4. In this system, the viscosity of the ionic liquid changes considerably as a result of mass transfer, although the underlying behavior dictating the pressure drop interactions are the same whether mass transfer, reaction or gas slug contraction is involved. Two sets of experiments were carried out: one at a constant micro-channel length whilst varying the velocity and the other at constant velocity, varying the channel length. The pressure drop, the viscosity and the extraction efficiency were measured at each operating point as described in Section 2.2 and the results illustrated in Figure 15.
Figure 15. (a) Pressure drop, extraction efficiency and dynamic viscosity for different superficial velocities in slug flow regime. The capillary length was 100 cm, the phase ratio 0.2 and the number of unit cells 80; (b) Pressure drop, extraction efficiency and dynamic viscosity for different capillary lengths in slug flow regime. The superficial velocity was 0.022 m/s, the phase ratio 0.2 and the number of unit cells 80.
Processes 02 00371 g015
The viscosity of EMIM EtSO4 falls with increasing acetic acid concentration and thus causes a decrease in the pressure drop. In both cases, the pressure drop is mainly influenced by the change in viscosity due to extraction. The pressure drop increases with increasing capillary length, while the dynamic viscosity decreases because of the extraction. With increasing velocity, the pressure drop increases because of the hydrodynamic pressure loss. The extraction efficiency and the viscosity at the outlet of the capillary were constant but the average values along the capillary vary.

4.2.1. Validation

In order to validate the model for the liquid-liquid system, simulations were carried out for different configurations. The parameters used are listed in Table 4.
Table 4. Parameter values for liquid-liquid simulations.
ParameterValueUnits
dc800µm
Lcont,03.75·dcµm
Ldisp,01.25·dcµm
Lc0.2–1m
σ0.0048N/m
µdisp,00.069Pa.s
U0.005–0.035m/s
C2.385-
CEMIM,01171mol/m3
CEMIM, eq521mol/m3
Additionally, Equation (27) was modified to replace the conversion with the extraction efficiency h (defined in Equation (2)). The viscosity can now be described as:
μ(h) = 0hb + μ0
The model parameter a = −0.67 and b = 0.3 of the viscosity equation (Equation (30)) were taken from experimental results by fitting the dynamic viscosity of the ionic liquid at different levels of extraction efficiency (as presented in Figure 15) and performing a regression minimizing the least squares error (LSE), these parameter yielded a LSE of 0.001. The results from this procedure are presented in Figure 16.
Figure 16. Measured values for the dynamic viscosity as a function of extraction efficiency and the fitting based on Equation (30).
Processes 02 00371 g016
A comparison between experimental and model results shown in Figure 17 indicates the coupling between pressure drop, change in viscosity due to reaction or mass transfer and hydrodynamics is described in a correct way. It also can be seen that the pressure drop of the experiments fitted well with the prediction of the model.
Figure 17. Comparison between pressure drop calculated by the model and the experimental values obtained for different velocities and capillary lengths. (a) Pressure drop as a function of velocity (fixed capillary length 1 m); (b) Pressure drop as a function of capillary length (fixed superficial velocity 0.022 m/s).
Processes 02 00371 g017
The mean relative error between model and experiment for various flow rates is about 13% and for changing capillary length 11% and therefore simulations results can also be taken as valid.

5. Conclusions

In this paper, a model has been developed to describe the behavior of a multiphase slug flow in circular microchannels. The model couples the hydrodynamics, reaction and mass transfer phenomena, and for gas-liquid systems, it accounts for both the contraction of the gas phase due to reactive absorption and the inherent change in volume linked to the pressure drop.
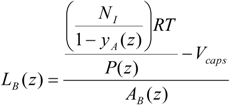
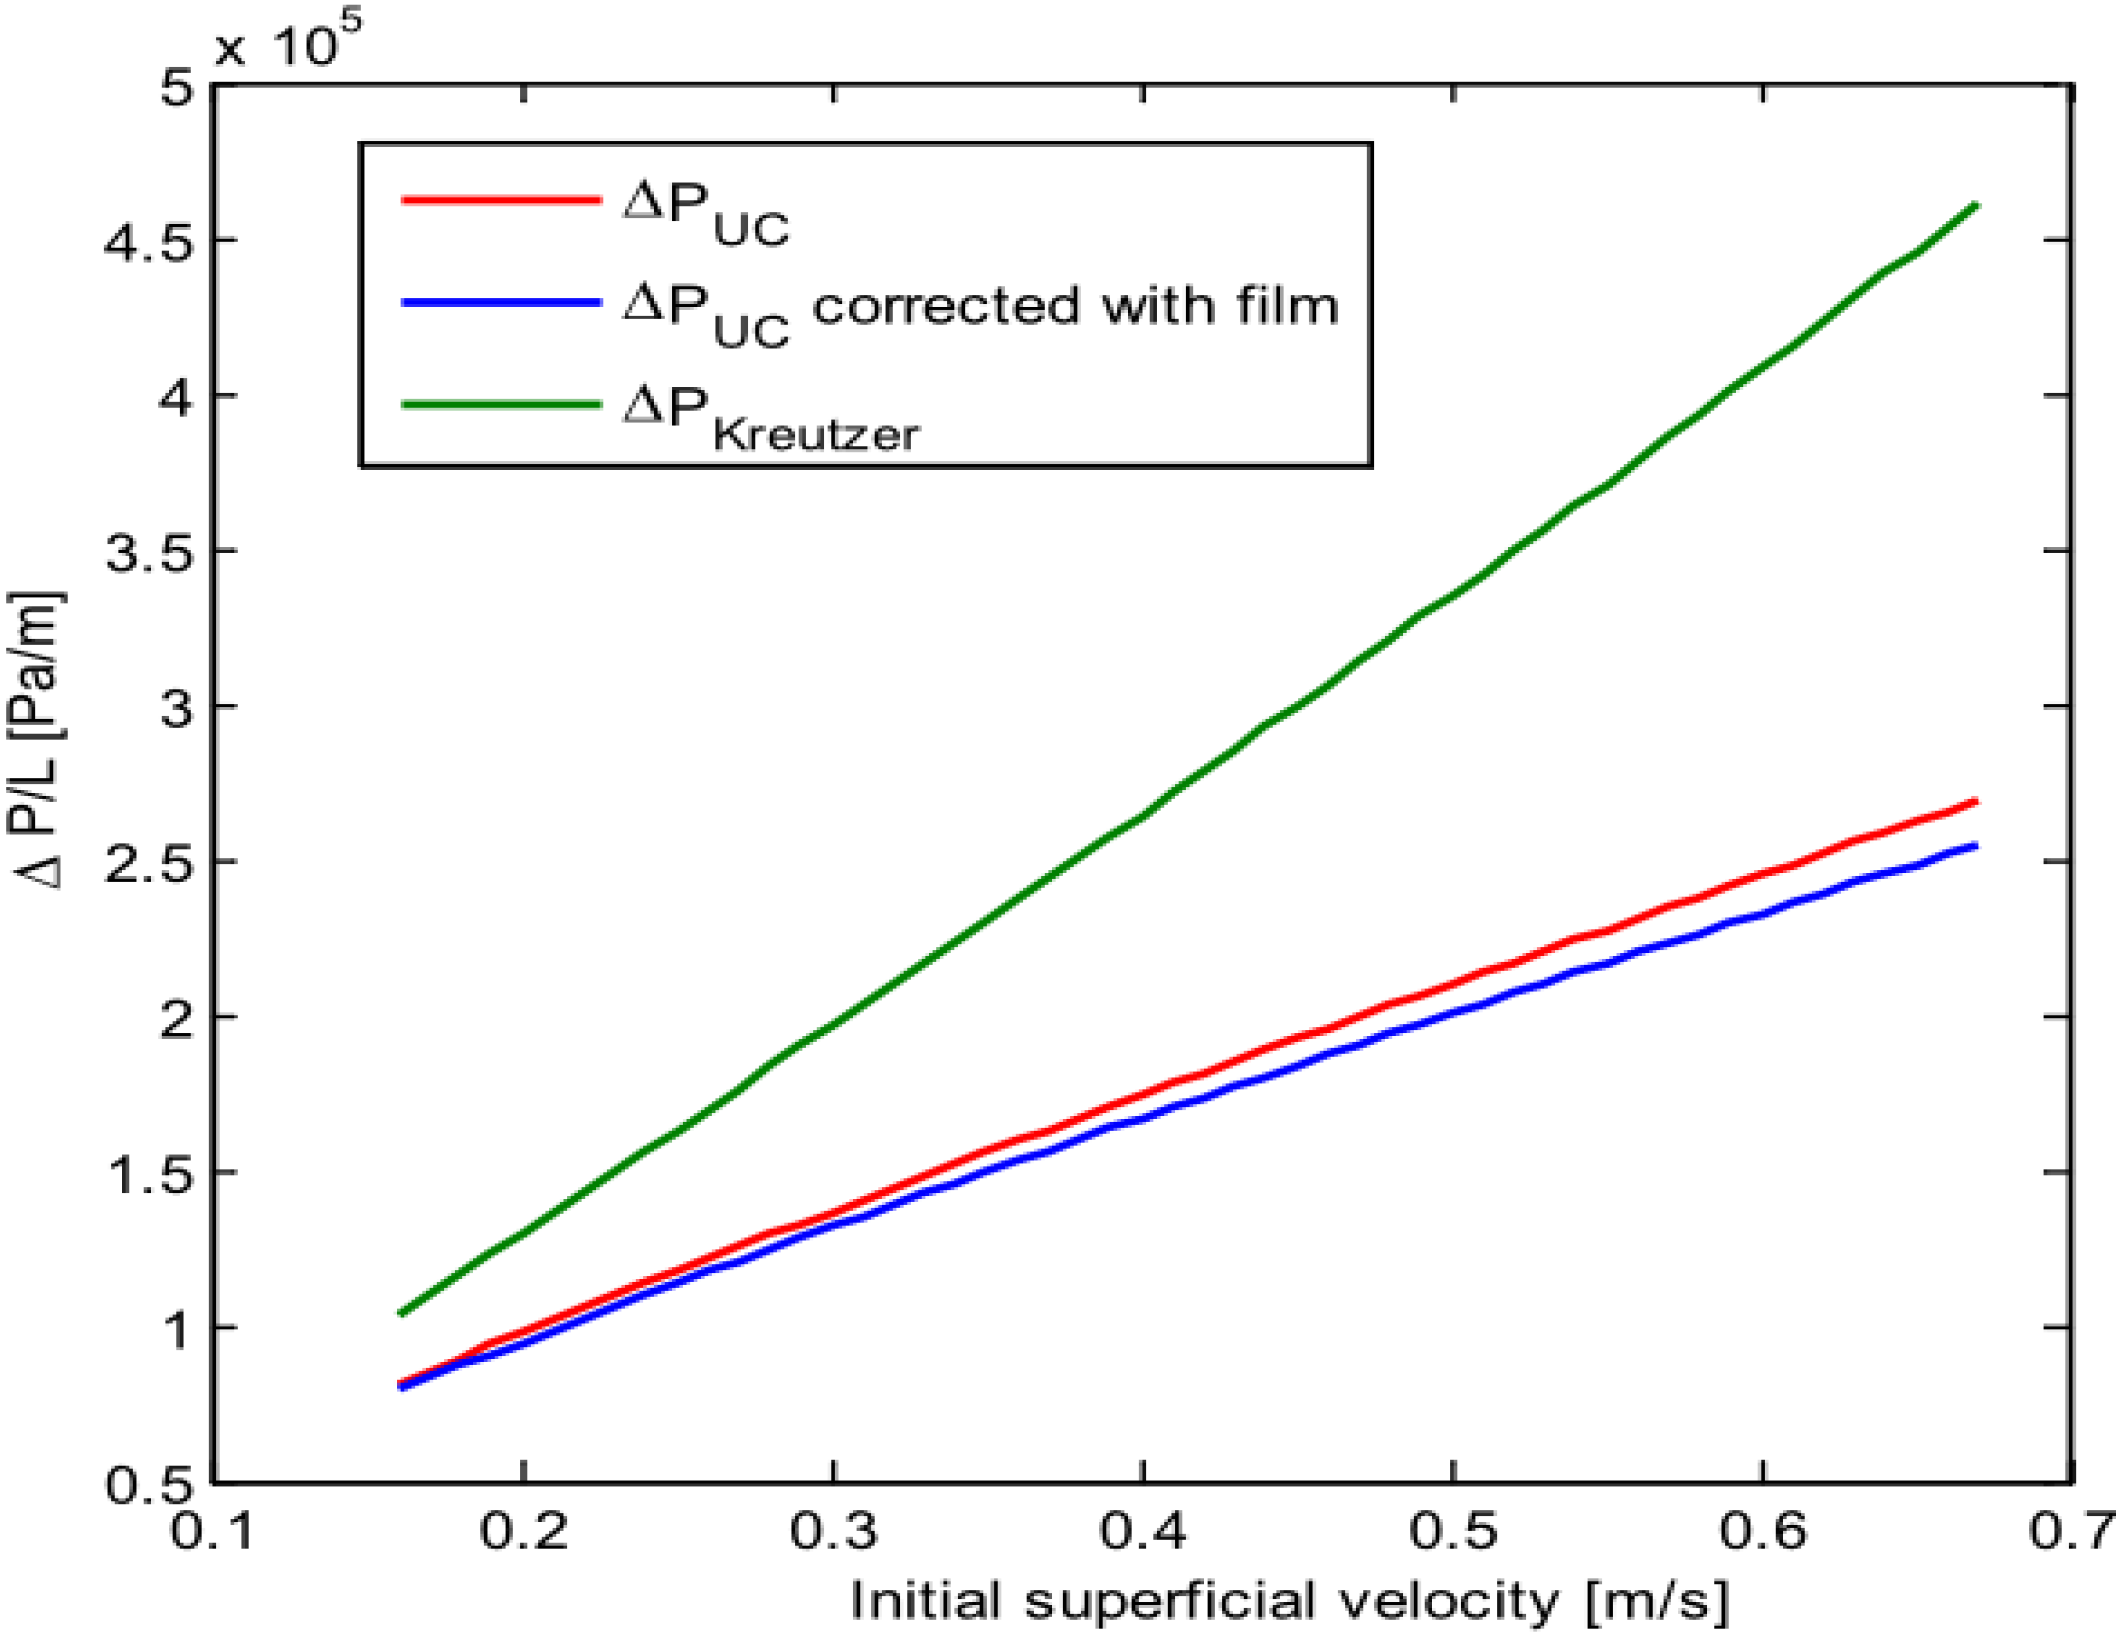
The model was first validated by comparing the results obtained with results from other researchers yielding results of the same order of magnitude. For the pressure drop it gave results consistent with those obtained by Warnier et al. [13], and to a lesser extent, Kreutzer et al. [
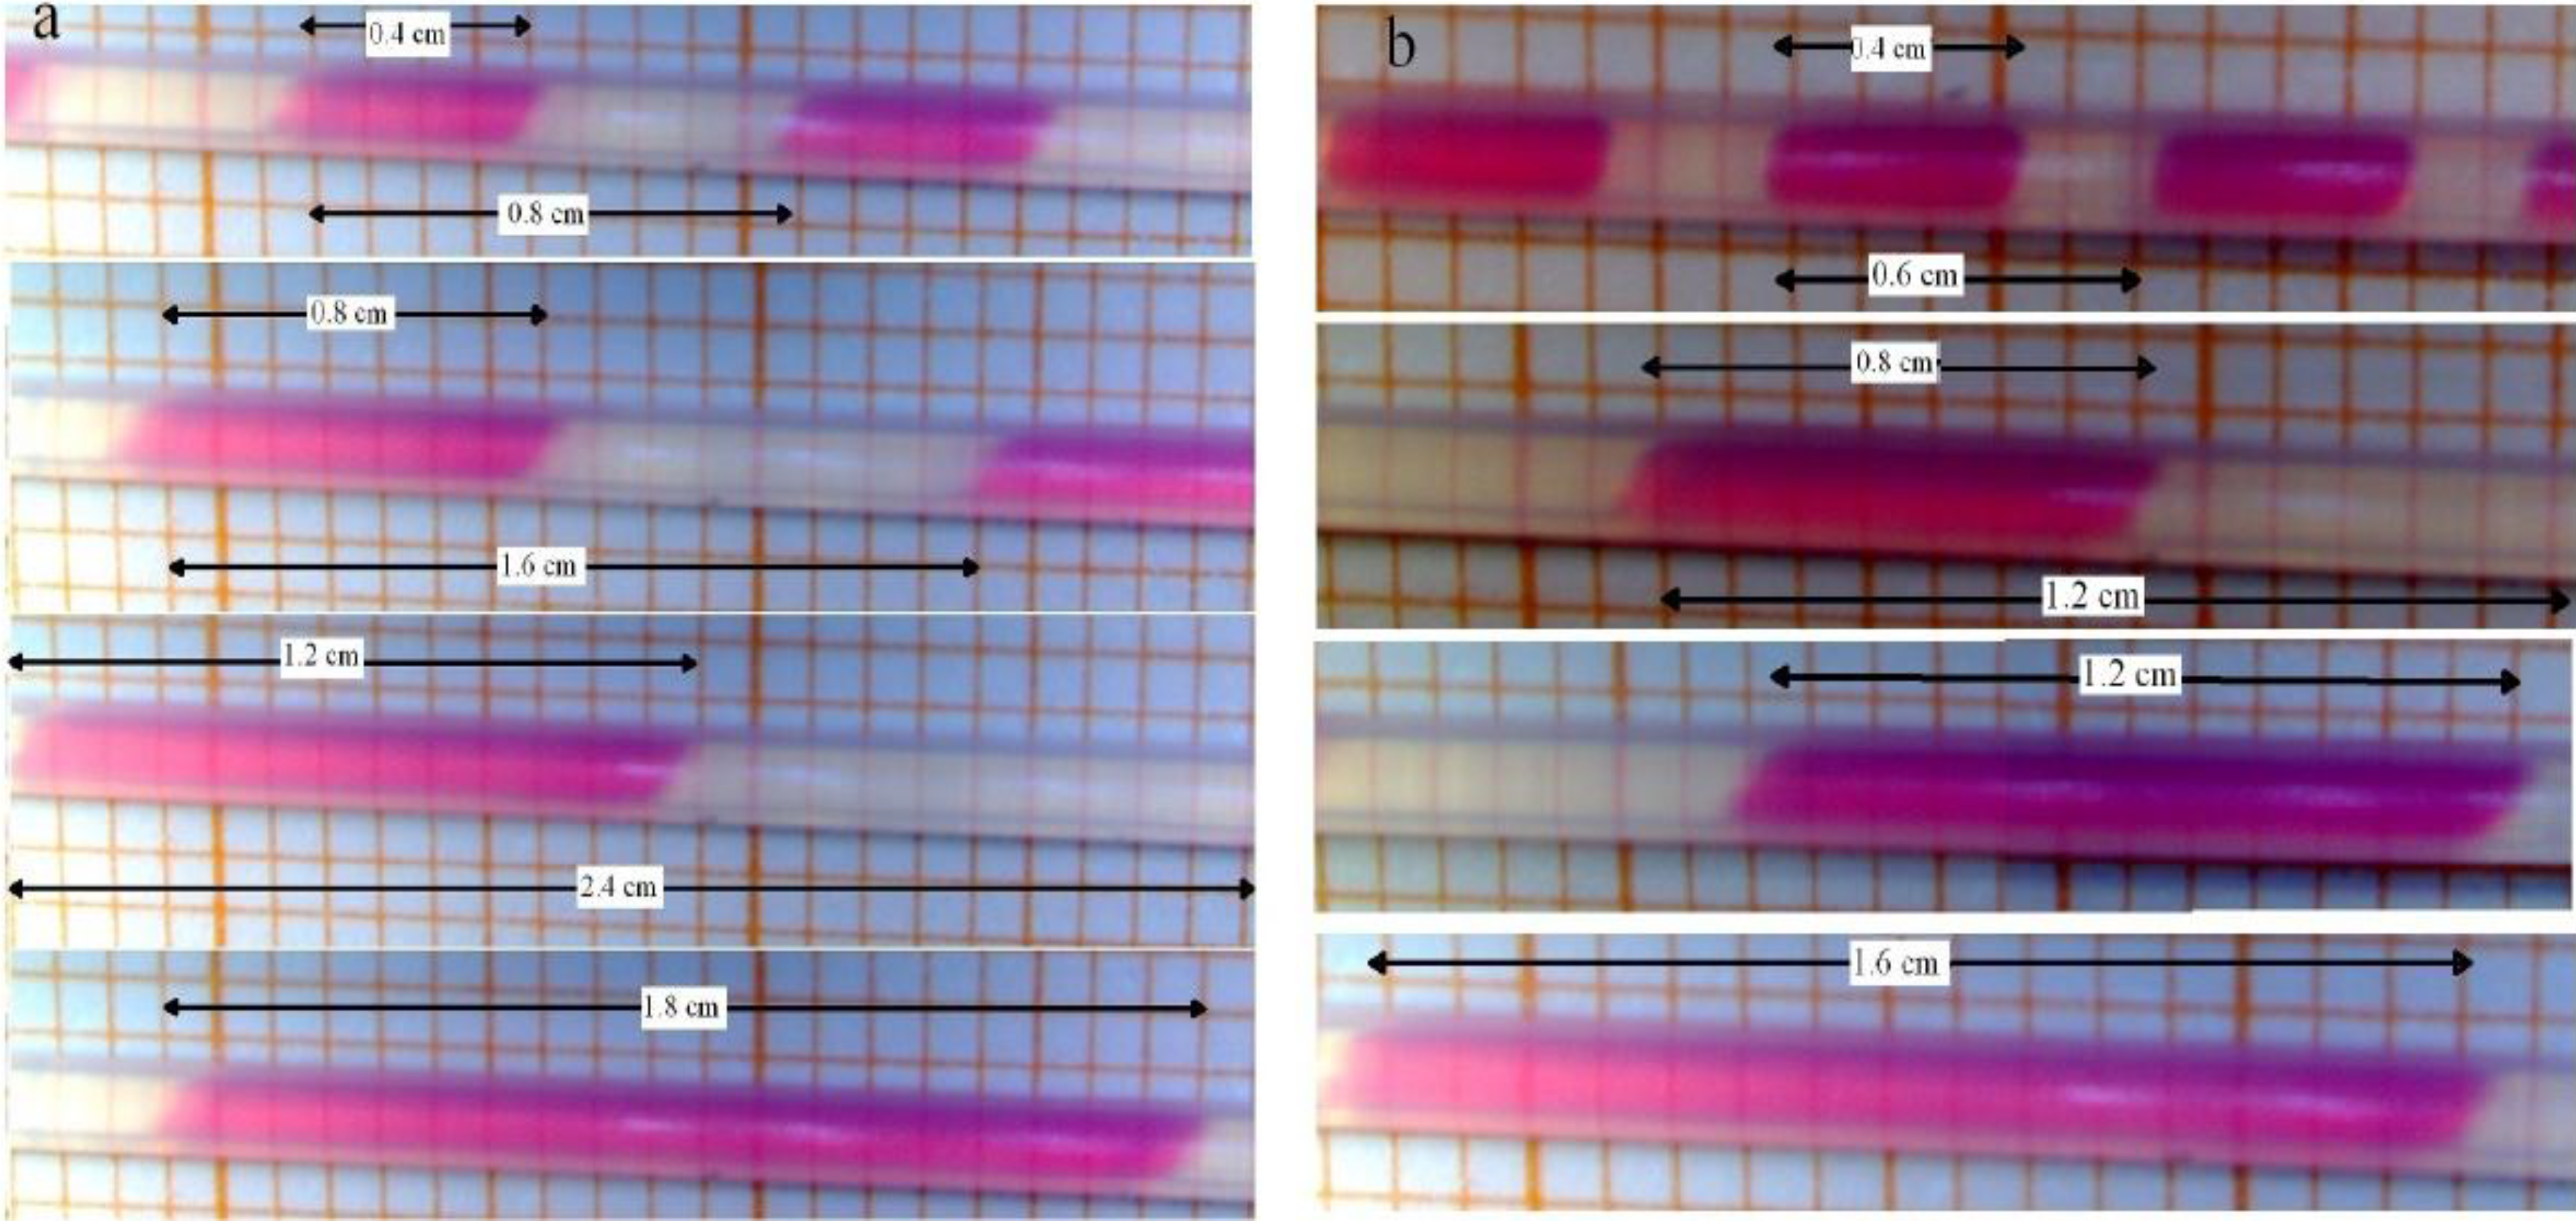
22]. For the mass transfer characteristics, the model predicted mass transfer coefficient values in close agreement with those from the most recent publications, like the experimental results of Sobieszuk et al. [20] and Yue et al. [
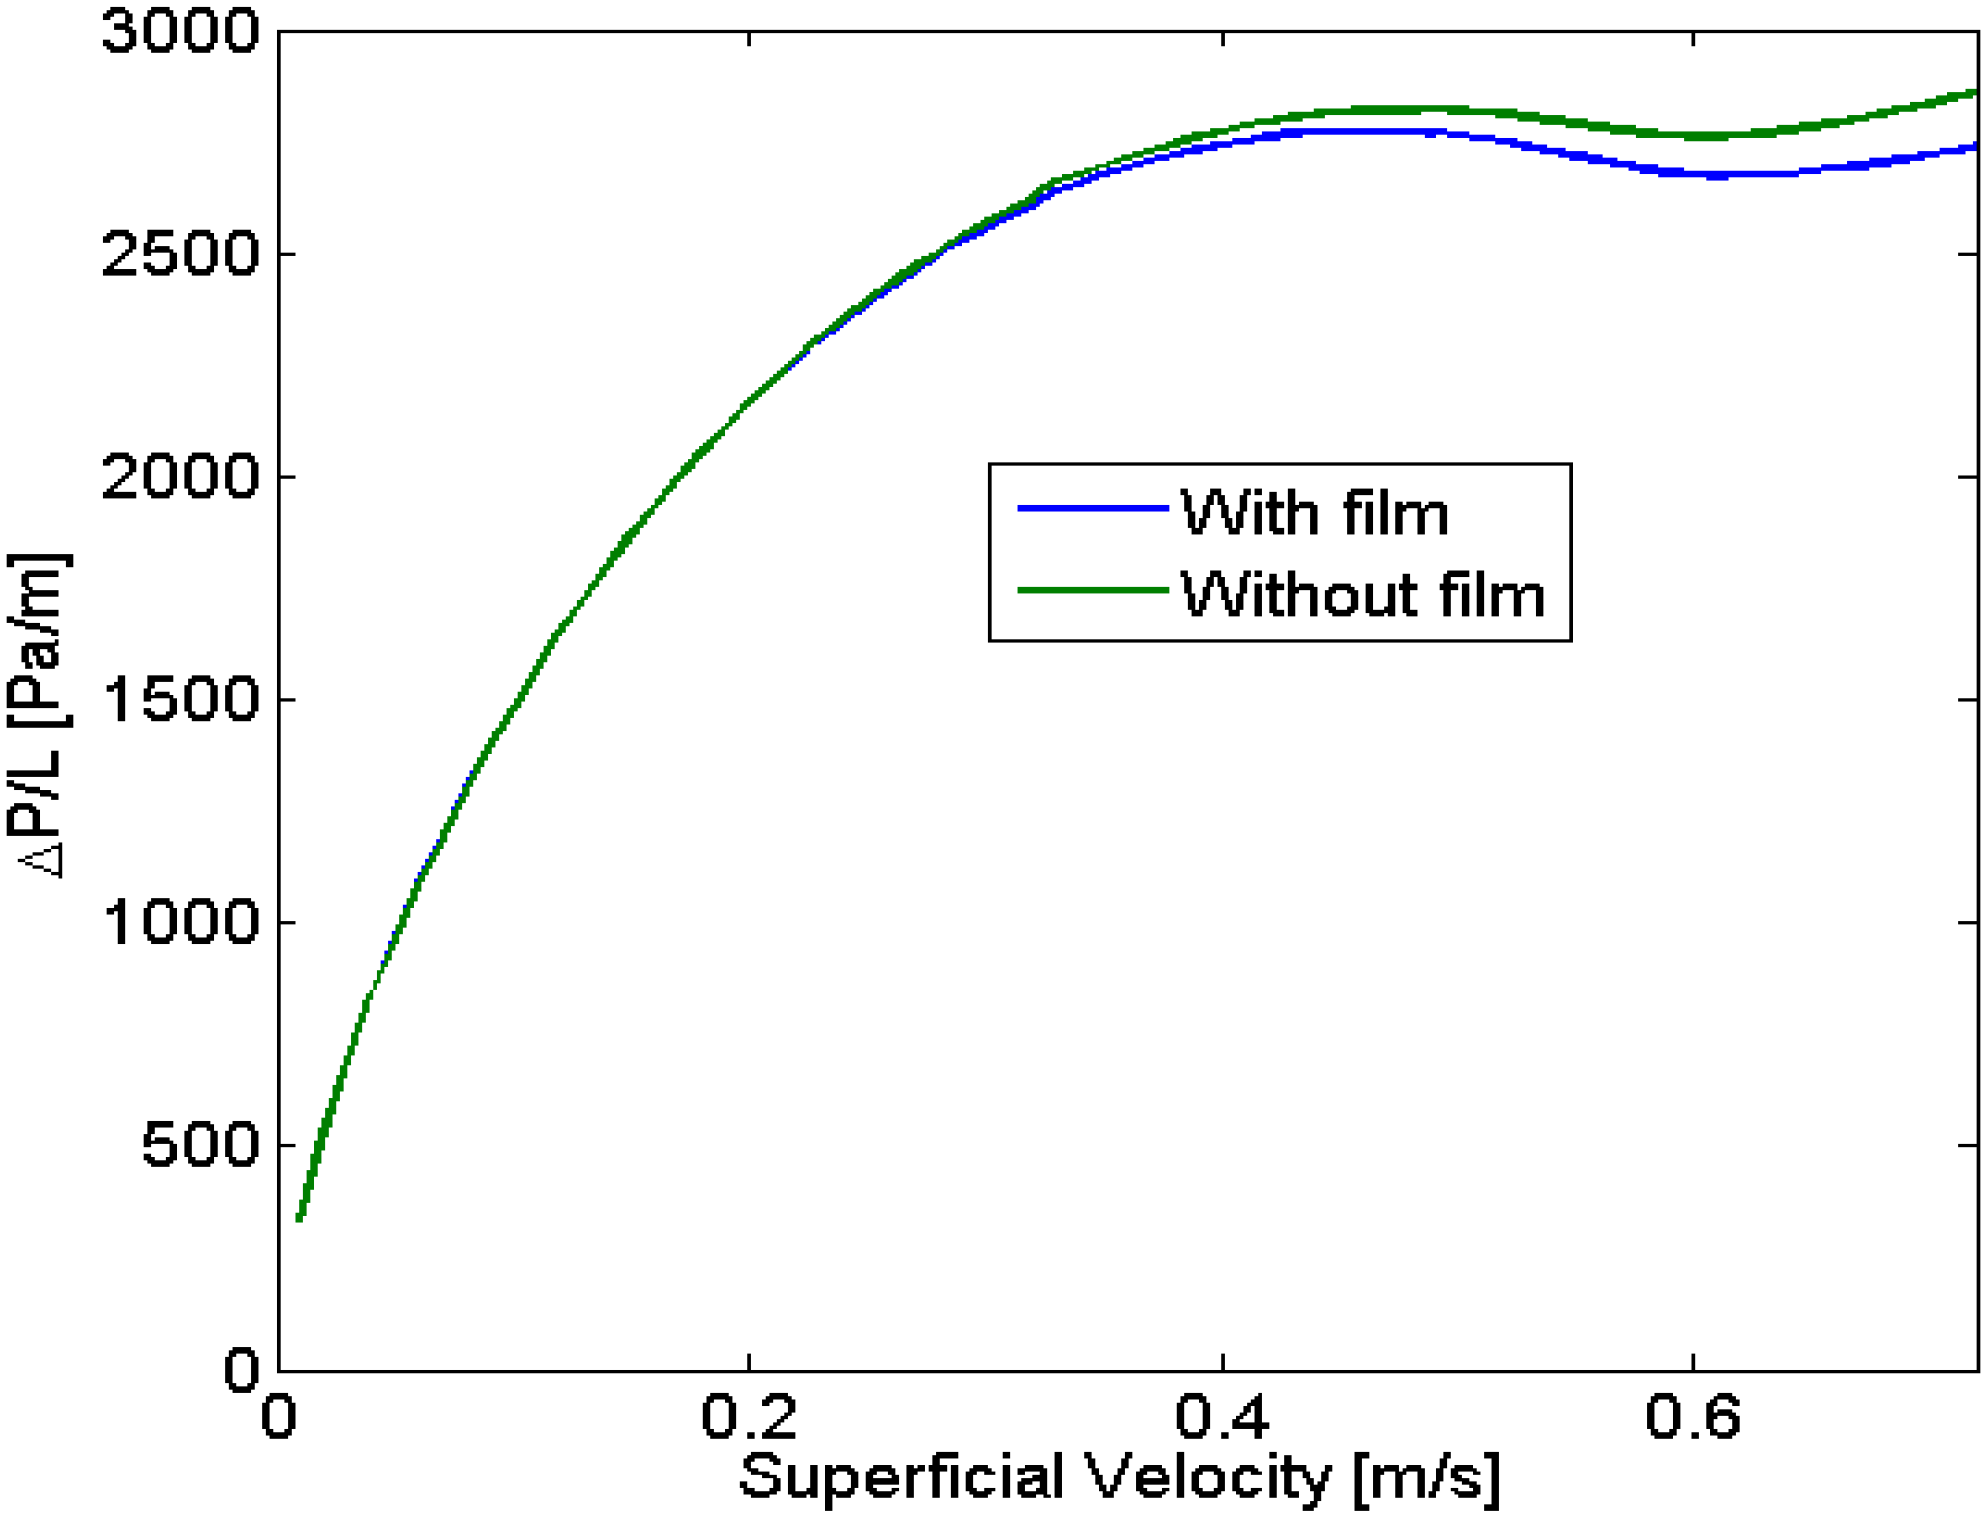
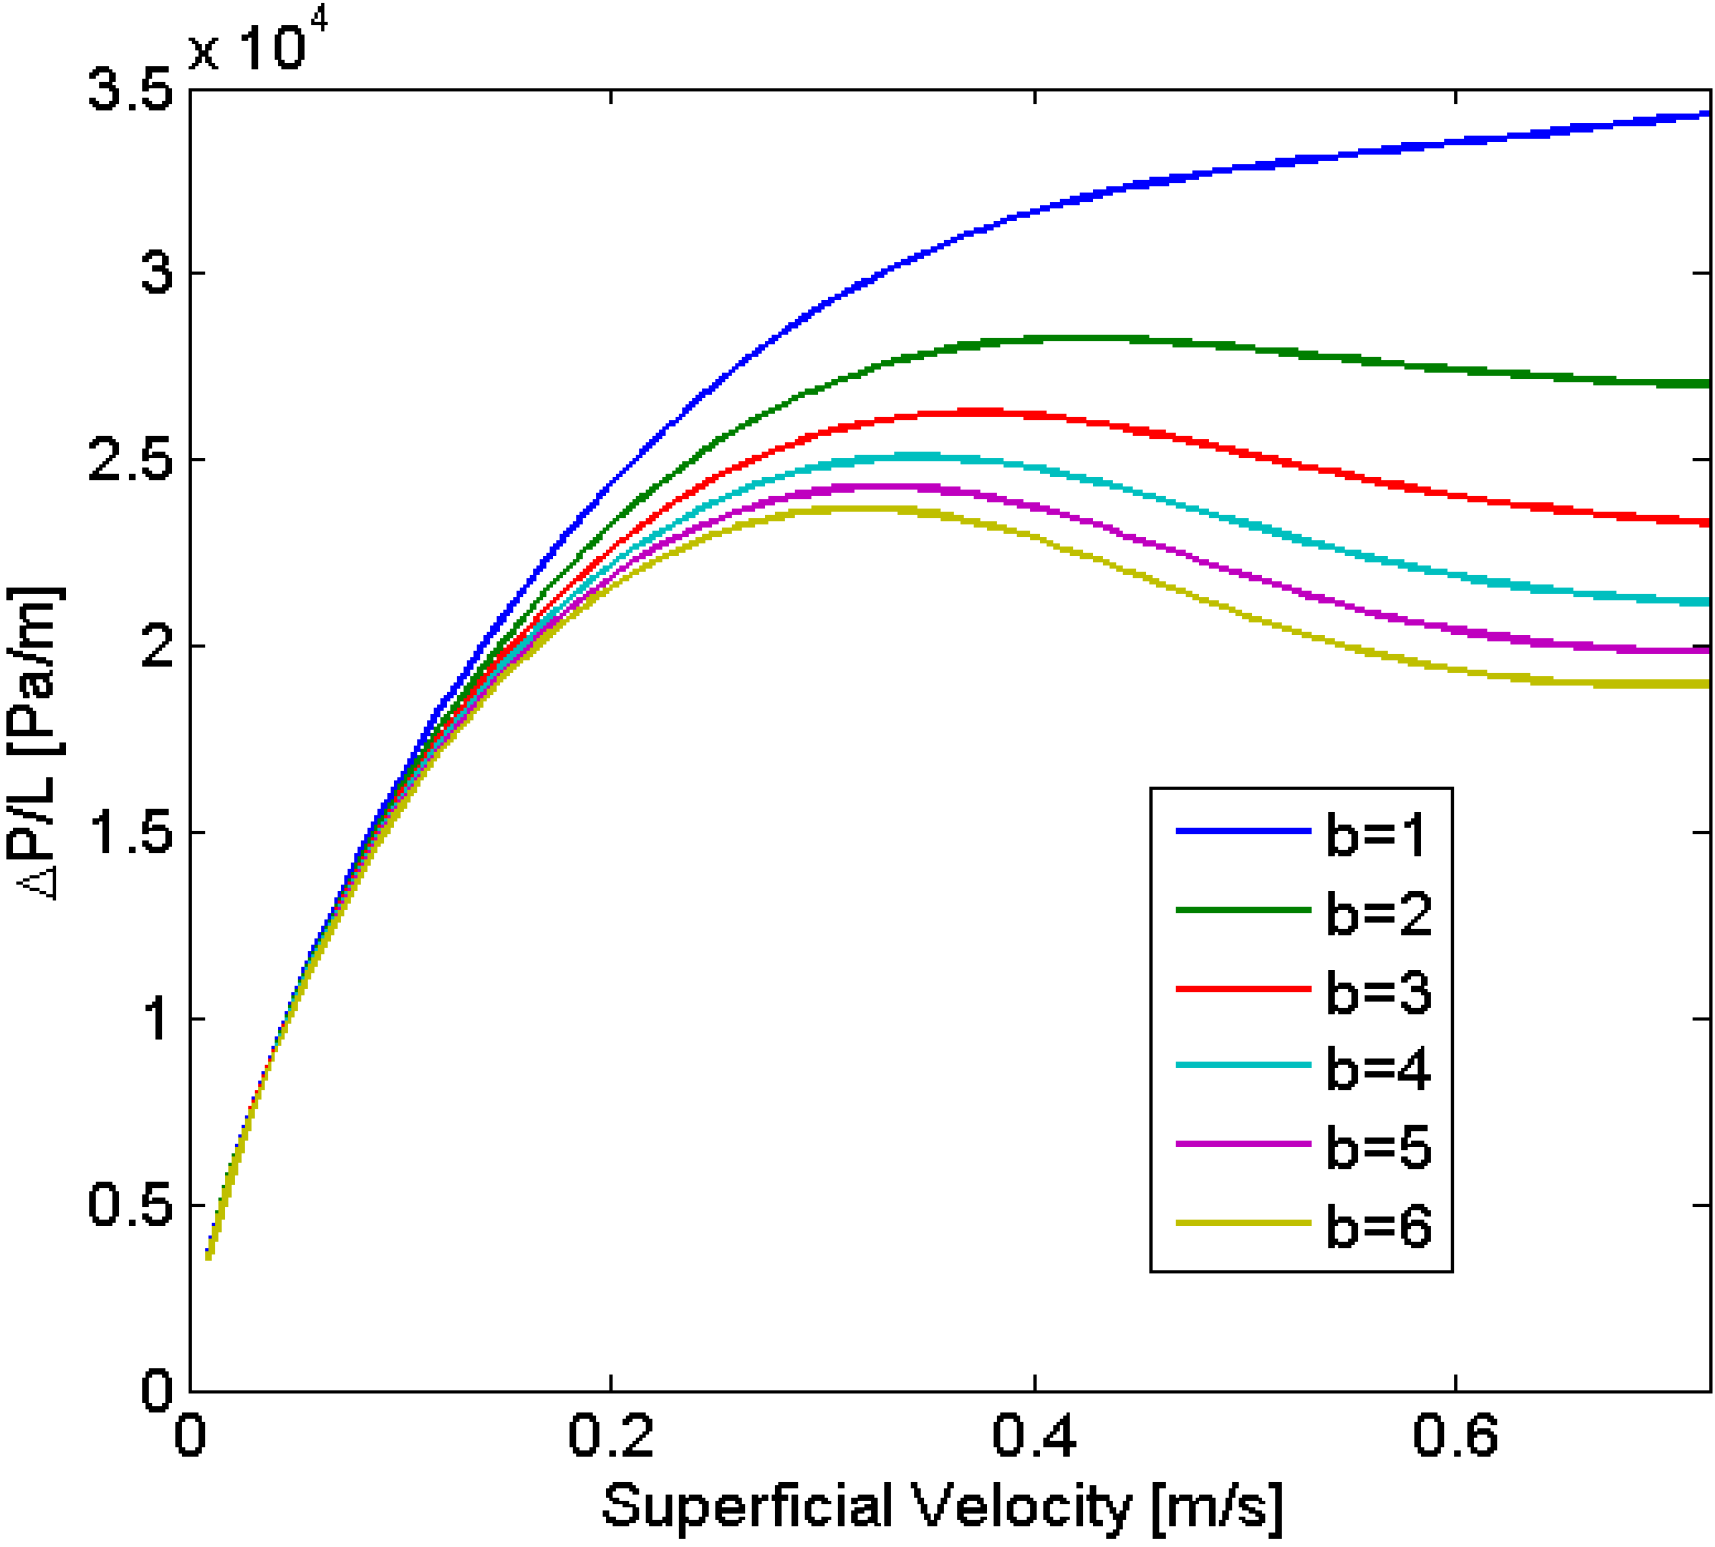
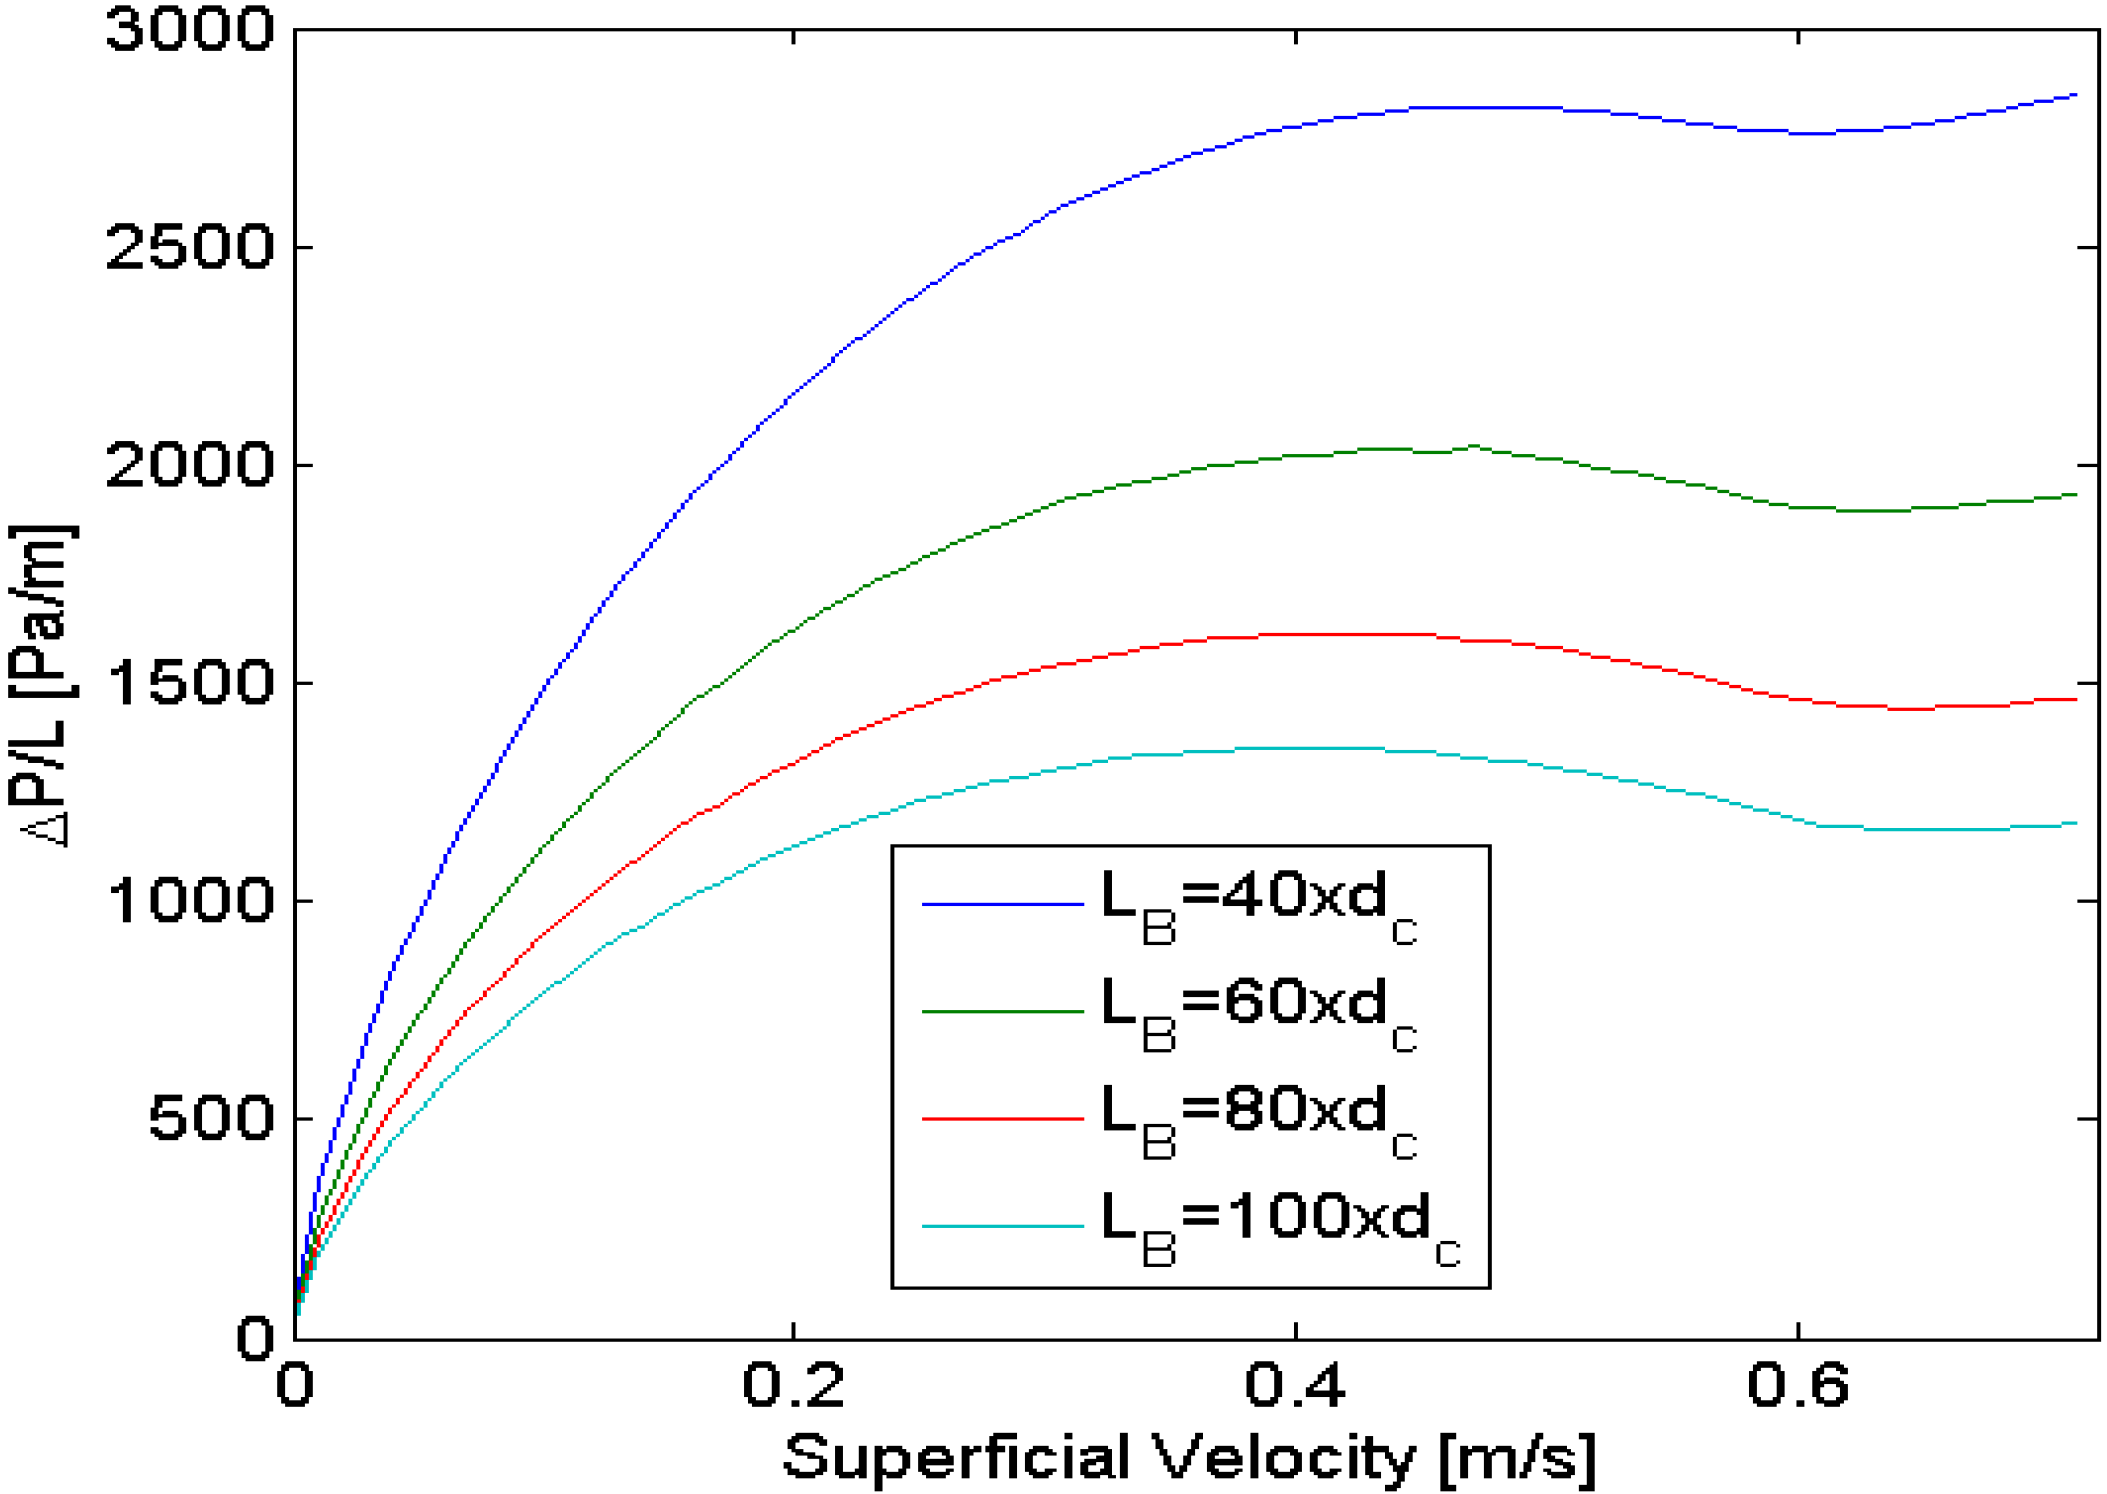
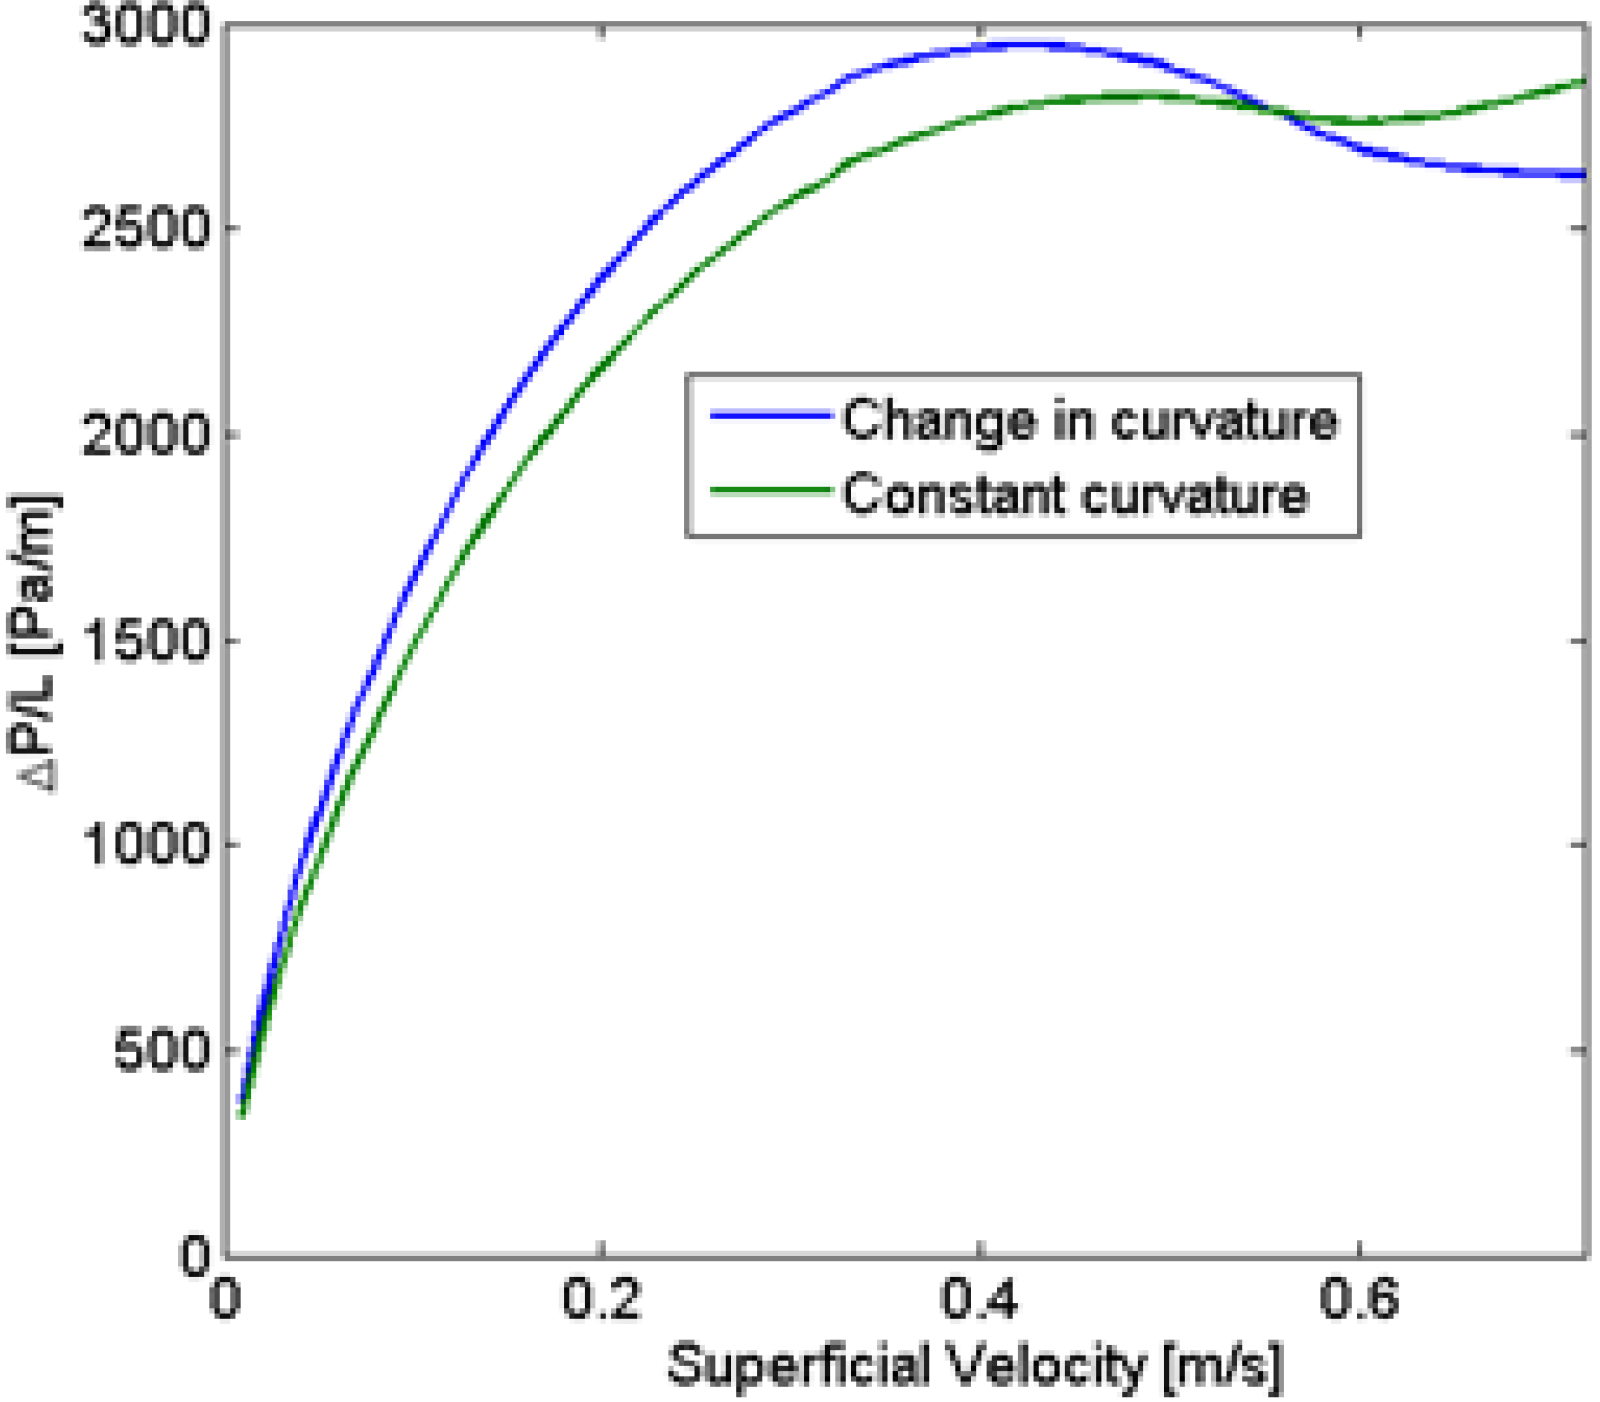
19]. Furthermore, the model was tested to get an idea of how large the effect of the film surrounding the bubble is on the hydrodynamics, showing only a slight deviation from the case without film. Finally, the effect of the slug geometry was studied, as it was found that this could play an important role for instabilities, and the work of Jovanovic et al. [23] has shown that it was not constant but a function of the velocity.
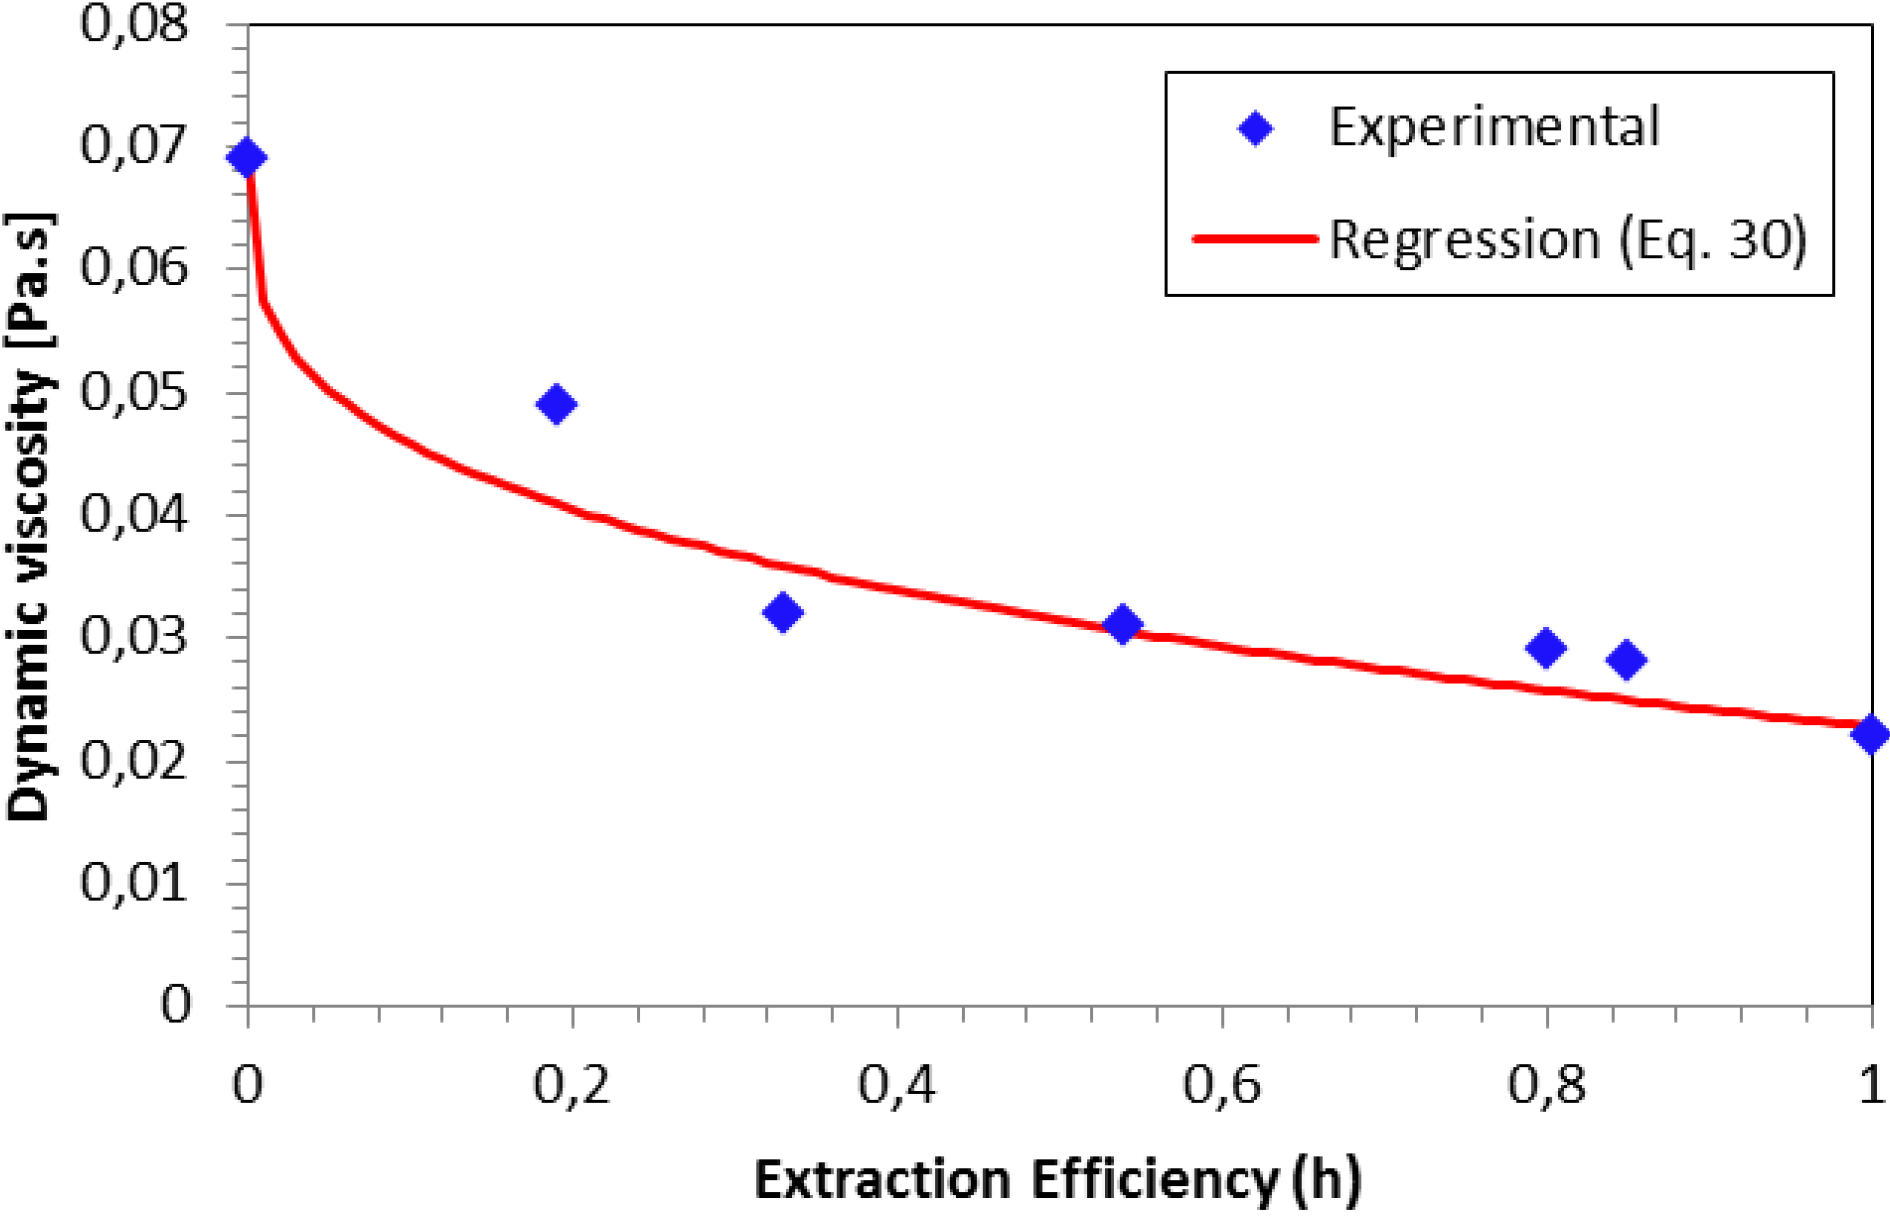
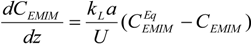
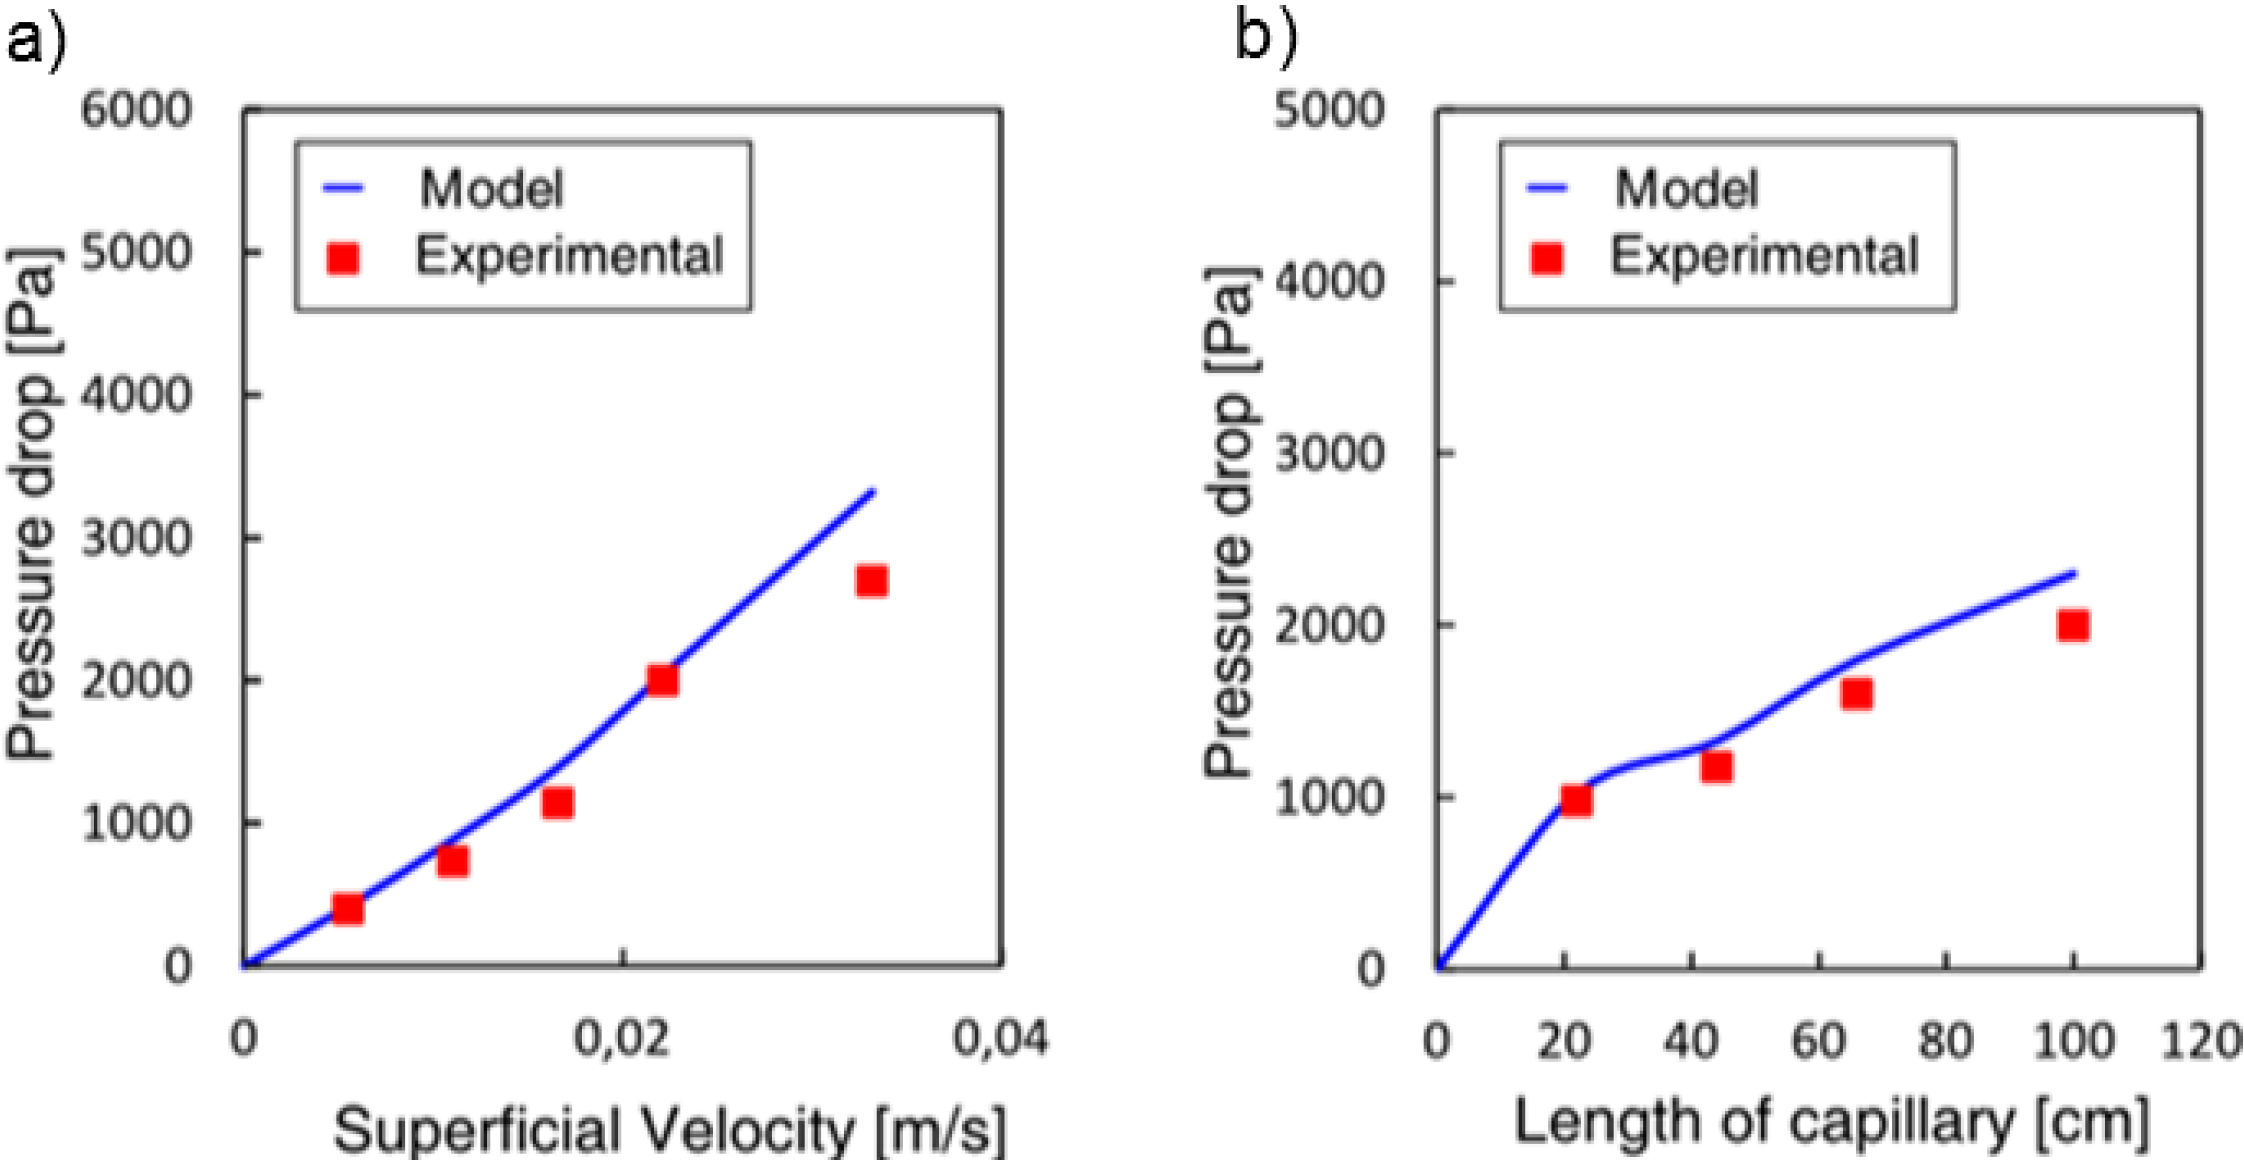
The model was used to analyze the stability of the flow for a gas-liquid system establishing that multiplicities can arise in particular cases, such as long bubbles, or for systems with changes in viscosity. These results led to the study of systems with decreasing viscosity, since this can enable one to achieve a better distribution in parallelized microchannels. Experimental results obtained for an aqueous-ionic liquid-system found a good agreement between the experimental and predicted values (11% and 13% error, depending on the parameter varied).
The results demonstrate that the coupling between flow structure, the extent of reaction/extraction and pressure drop can result in multiple operating states, thus, making an active measurement and control strategy to ensure uniform behavior and optimal performance essential.

Nomenclature

SymbolDescriptionUnits
AAream2
aInterfacial aream2/m3
a, bViscosity fitting factors
CConcentrationmol/m3
CCurvature factor
dDiameterμm
DDiffusion coefficient
EEnhancement factor-
hExtraction efficiency-
kMass transfer coefficientm/s
LLengthμm
NNumber of molmol
Processes 02 00371 i024Molar flowmol/s
PPressurePa
RIdeal gas constant
TTemperatureK
UVelocity-
VVolume
xConversion-
yMolar fractionmol/mol
zAxial coordinatem

Greek symbols

SymbolDescriptionUnits
αLiquid phase ratio
μViscosityPa.s
ΔDifference
δFilm Thicknessμm
ζCorrection factor for liquid volume in the bubble cap zoneμm
ρDensitykg/m3
σSurface tensionN/m
τMean residence times

Indexes

SymbolDescription
0Initial
ARelated to component A
BBubble
CChannel
CapCap of the bubble
ContContinuous phase
DispDispersed phase
EMIMRelated to EMIM-EtSO4
EqEquilibrium
FilmLiquid film
GGas
IInert
InInlet
LLiquid
OutOutlet
SSlug
TTotal
TPTwo phase
UCUnit cell

Conflicts of Interest

The authors declare no conflict of interest.

References

  1. Leclerc, A.; Philippe, R.; Houzelot, V.; Schweich, D.; de Bellefon, C. Gas-liquid Taylor flow in square micro-channels: New inlet geometries and interfacial area tuning. Chem. Eng. J. 2010, 165, 290–300. [Google Scholar] [CrossRef]
  2. Wibel, W.; Wenka, A.; Brandner, J.J.; Dittmeyer, R. Reprint of: Measuring and modeling the residence time distribution of gas flows in multichannel microreactors. Chem. Eng. J. 2013, 227, 203–214. [Google Scholar] [CrossRef]
  3. Kreutzer, M.T.; Bakker, J.J.W.; Kapteijn, F.; Moulijn, J.A.; Verheijen, P.J.T. Scaling-up multiphase monolith reactors: Linking residence time distribution and feed maldistribution. Ind. Eng. Chem. Res. 2005, 44, 4898–4913. [Google Scholar] [CrossRef]
  4. Berčič, G.; Pintar, A. The role of gas bubbles and liquid slug lengths on mass transport in the Taylor flow through capillaries. Chem. Eng. Sci. 1997, 52, 3709–3719. [Google Scholar] [CrossRef]
  5. Mendorf, M.; Moenter, A.; Moll, T.; Agar, D.; Tiller, J. Polymerisation of butyl acrylate in the two phase slug flow regime of parallel microcapillary reactors. Macromol. Symp. 2011, 302, 245–256. [Google Scholar] [CrossRef]
  6. Amador, C.; Gavriilidis, A.; Angeli, P. Flow distribution in different microreactor scale-out geometries and the effect of manufacturing tolerances and channel blockage. Chem. Eng. J. 2004, 101, 379–390. [Google Scholar] [CrossRef]
  7. Yue, J.; Boichot, R.; Luo, L.; Gonthier, Y.; Chen, G.; Yuan, Q. Flow distribution and mass transfer in a parallel microchannel contactor integrated with constructal distributors. AIChE J. 2010, 56, 298–317. [Google Scholar]
  8. Al-Rawashdeh, M.; Fluitsma, L.; Nijhuis, T.; Rebrov, E.; Hessel, V.; Schouten, J. Design criteria for a barrier-based gas–liquid flow distributor for parallel microchannels. Chem. Eng. J. 2012, 181–182, 549–556. [Google Scholar] [CrossRef]
  9. Mendorf, M.; Nachtrodt, H.; Mescher, A.; Ghaini, A.; Agar, D.W. Design and control techniques for the numbering-up of capillary microreactors with uniform multiphase flow distribution. Ind. Eng. Chem. Res. 2010, 49, 10908–10916. [Google Scholar]
  10. Perry, R.H.; Green, D.W.; Maloney, J.O. Perry’s Chemical Engineers’ Handbook: Physical and Chemical Data, 8th ed.; McGraw-Hill: New York, NY, USA, 2008; pp. 1–517. [Google Scholar]
  11. Yang, J.-Z.; Lu, X.-M.; Gui, J.-S.; Xu, W.-G. A new theory for ionic liquids? The interstice model: Part 1. The density and surface tension of ionic liquid EMISE. Green Chem. 2004, 6, 541. [Google Scholar] [CrossRef]
  12. Molla, S.; Eskin, D.; Mostowfi, F. Pressure drop of slug flow in microchannels with increasing void fraction: Experiment and modeling. Lab Chip 2011, 11, 1968. [Google Scholar] [CrossRef]
  13. Warnier, M.J.F.; Croon, M.H.J.M.; Rebrov, E.V.; Schouten, J.C. Pressure drop of gas–liquid Taylor flow in round micro-capillaries for low to intermediate Reynolds numbers. Microfluid Nanofluid 2010, 8, 33–45. [Google Scholar]
  14. Eskin, D.; Mostowfi, F. A model of a bubble train flow accompanied with mass transfer through a long microchannel. Int. J. Heat Fluid Flow 2012, 33, 147–155. [Google Scholar] [CrossRef]
  15. Molla, S.; Eskin, D.; Mostowfi, F. Two-phase flow in microchannels: The case of binary mixtures. Ind. Eng. Chem. Res. 2013, 52, 941–953. [Google Scholar] [CrossRef]
  16. Aussillous, P.; Quéré, D. Quick deposition of a fluid on the wall of a tube. Phys. Fluids 2000, 12, 2367. [Google Scholar] [CrossRef]
  17. Zanfir, M.; Gavriilidis, A.; Wille, C.; Hessel, V. Carbon dioxide absorption in a falling film microstructured reactor: Experiments and modeling. Ind. Eng. Chem. Res. 2005, 44, 1742–1751. [Google Scholar] [CrossRef]
  18. Vandu, C.; Liu, H.; Krishna, R. Mass transfer from Taylor bubbles rising in single capillaries. Chem. Eng. Sci. 2005, 60, 6430–6437. [Google Scholar] [CrossRef]
  19. Yue, J.; Chen, G.; Yuan, Q.; Luo, L.; Gonthier, Y. Hydrodynamics and mass transfer characteristics in gas–liquid flow through a rectangular microchannel. Chem. Eng. Sci. 2007, 62, 2096–2108. [Google Scholar] [CrossRef]
  20. Sobieszuk, P.; Pohorecki, R.; Cygański, P.; Grzelka, J. Determination of the interfacial area and mass transfer coefficients in the Taylor gas–liquid flow in a microchannel. Chem. Eng. Sci. 2011, 66, 6048–6056. [Google Scholar] [CrossRef]
  21. Shao, N.; Gavriilidis, A.; Angeli, P. Mass transfer during Taylor flow in microchannels with and without chemical reaction. Chem. Eng. J. 2010, 160, 873–881. [Google Scholar] [CrossRef]
  22. Kreutzer, M.T.; Kapteijn, F.; Moulijn, J.A.; Kleijn, C.R.; Heiszwolf, J.J. Inertial and interfacial effects on pressure drop of Taylor flow in capillaries. AIChE J. 2005, 51, 2428–2440. [Google Scholar] [CrossRef]
  23. Jovanović, J.; Zhou, W.; Rebrov, E.V.; Nijhuis, T.; Hessel, V.; Schouten, J.C. Liquid-liquid slug flow: Hydrodynamics and pressure drop. Chem. Eng. Sci. 2011, 66, 42–54. [Google Scholar] [CrossRef]

