Credit Risk Meets Random Matrices: Coping with Non-Stationary Asset Correlations

Fakultät für Physik, Universität Duisburg-Essen, Lotharstraße 1, 47048 Duisburg, Germany
*
Author to whom correspondence should be addressed.
Risks 2018, 6(2), 42; https://doi.org/10.3390/risks6020042
Submission received: 28 February 2018
/
Revised: 17 April 2018
/
Accepted: 19 April 2018
/
Published: 23 April 2018
(This article belongs to the Special Issue Computational Methods for Risk Management in Economics and Finance)
Abstract
:We review recent progress in modeling credit risk for correlated assets. We employ a new interpretation of the Wishart model for random correlation matrices to model non-stationary effects. We then use the Merton model in which default events and losses are derived from the asset values at maturity. To estimate the time development of the asset values, the stock prices are used, the correlations of which have a strong impact on the loss distribution, particularly on its tails. These correlations are non-stationary, which also influences the tails. We account for the asset fluctuations by averaging over an ensemble of random matrices that models the truly existing set of measured correlation matrices. As a most welcome side effect, this approach drastically reduces the parameter dependence of the loss distribution, allowing us to obtain very explicit results, which show quantitatively that the heavy tails prevail over diversification benefits even for small correlations. We calibrate our random matrix model with market data and show how it is capable of grasping different market situations. Furthermore, we present numerical simulations for concurrent portfolio risks, i.e., for the joint probability densities of losses for two portfolios. For the convenience of the reader, we give an introduction to the Wishart random matrix model.
1. Introduction
To assess the impact of credit risk on the systemic stability of the financial markets and the economy as a whole is of considerable importance as the subprime crisis of 2007–2009 and the events following the collapse of Lehman Brothers drastically demonstrated (Hull 2009). Better credit risk estimation is urgently called for. A variety of different approaches exists, see (Bielecki and Rutkowski 2013; Bluhm et al. 2016; Crouhy et al. 2000; Duffie and Singleton 1999; Glasserman and Ruiz-Mata 2006; Heitfield et al. 2006; Ibragimov and Walden 2007; Lando 2009; Mainik and Embrechts 2013; McNeil et al. 2005) for an overview. Most of them fall into the reduced-form (Chava et al. 2011; Duffie and Singleton 1999; Schönbucher 2003) or structural-approach class (Elizalde 2005; Merton 1974); a comprehensive review is given in (Giesecke 2004). The problem to be addressed becomes ultimately a statistical one, as loss distributions for large portfolios of credit contracts have to be estimated. Typically, they have a very heavy right tail, which is due to either unusually large single events such as the Enron bankruptcy or the simultaneous occurrence of many small events as seen during the subprime crisis. Reducing this tail would increase the stability of the financial system as a whole. Unfortunately, the claim that diversification can lower the risk of a portfolio is questionable or even wrong, because often, the correlations between the asset values are ignored. They are very important in a portfolio of credit contracts, e.g., in the form of collateralized debt obligations (CDOs). In detailed studies, it was shown that the presence of even weak positive correlation diversification fails to reduce the portfolio risk (Glasserman 2004; Schönbucher 2001) for first passage models and for the Merton model (Koivusalo and Schäfer 2012; Schäfer et al. 2007; Schmitt et al. 2014).
Recently, progress has been made to analytically solve the Merton model (Merton 1974) in a most general setting of a correlated market and even in the realistic case of fluctuating correlations between the assets. The covariance and correlation matrix of asset values changes in time (Münnix et al. 2012; Sandoval and Franca 2012; Song et al. 2011; Zhang et al. 2011), exhibiting an important example of the non-stationarity, which is always present in financial markets. The approach we review here (Schmitt et al. 2013, 2014, 2015; Sicking et al. 2018) uses the fact that the set of different correlation matrices measured in a smaller time window that slides through a longer dataset can be modeled by an ensemble of random correlation matrices. The asset values are found to be distributed according to a correlation averaged multivariate distribution (Chetalova et al. 2015; Schmitt et al. 2013, 2014, 2015). This assumption is confirmed by detailed empirical studies. Applied to the Merton model, this ensemble approach drastically reduces, as a most welcome side effect, the number of relevant parameters. We are left with only two, an average correlation between asset values and a measure for the strength of the fluctuations. The special case of zero average correlation has been previously considered (Münnix et al. 2014). The limiting distribution for a portfolio containing an infinite number of assets is also given, providing a quantitative estimate for the limits of diversification benefits. We also report the results of Monte Carlo simulations for the general case of empirical correlation matrices that yield the value at risk (VaR) and expected tail loss (ETL).
Another important aspect is comprised of concurrent losses of different portfolios. Concurrent extreme losses might impact the solvencies of major market participants, considerably enlarging the systemic risks. From an investor’s point of view, buying CDOs allows on to hold a “slice” of each contract within a given portfolio (Benmelech and Dlugosz 2009; Duffie and Garleanu 2001; Longstaff and Rajan 2008). Such an investor might be severely affected by significant concurrent credit portfolio losses. It is thus crucial to assess in which way and how strongly the losses of different portfolios are coupled. In the framework of the Merton model and the ensemble average, losses of two credit portfolios are studied, which are composed of statistically-dependent credit contracts. Since correlation coefficients only give full information in the case of Gaussian distributions, the statistical dependence of these portfolio losses is investigated by means of copulas (Nelsen 2007). The approach discussed here differs from the one given in (Li 2000), as Monte Carlo simulations of credit portfolio losses with empirical input from S&P 500 and Nikkei 225 are run and the resulting empirical copulas are analyzed in detail. There are many other aspects causing systemic risk such as fire sales spillover (Di Gangi et al. 2018).
We review our own work on how to take into account the non-stationarity of asset correlations into credit risk (Schmitt et al. 2013, 2014, 2015; Sicking et al. 2018). To make the paper self-contained, this review is preceded by a brief sketch of the Wishart model and a discussion of its re-interpretation to model non-stationary correlations.
This review paper is organized as follows: In Section 2, we introduce random matrix theory for non-stationary asset correlations, including a sketch of the Wishart model for readers not familiar with random matrices. This approach is used in Section 3 to account for fluctuating asset correlations in credit risk. In Section 4, concurrent credit portfolio losses are discussed. Conclusions are given in Section 5.
2. Random Matrix Theory for Non-Stationary Asset Correlations
We sketch the salient features of the Wishart model for correlation and covariance matrices in Section 2.1. In Section 2.2, we discuss a new interpretation of the Wishart model as a model to describe the non-stationarity of the correlations.
2.1. Wishart Model for Correlation and Covariance Matrices
Financial markets are highly correlated systems, and risk assessment always requires knowledge of correlations or, more generally, mutual dependencies. We begin with briefly summarizing some of the facts needed in the sequel. To be specific, we consider stock prices and returns, but correlations can be measured in the same way for all observables that are given as time series. We are interested in, say, K companies with stock prices as functions of time t. The relative price changes over a fixed time interval , i.e., the returns:
are well known to have distributions with heavy tails; the smaller the , the heavier. The sampled Pearson correlation coefficients are defined as:
between the two companies k and l in the time window of length T. The time series are obtained from the return time series by normalizing (in some communities referred to as standardizing) to zero mean and to unit variance, where the sample standard deviation is evaluated in the above-mentioned time window. We define the rectangular data matrix M whose k-th row is the time series . The correlation matrix with entries is the given by:
where indicates the transpose. By definition, C is real symmetric and has non-negative eigenvalues. We will also use the covariance matrix where the diagonal matrix contains the standard deviations . Setting , we may write:
for the covariance matrix. We have to keep in mind that correlations or covariances only fully grasp the mutual dependencies if the multivariate distributions are Gaussian, which is not the case for returns if is too small. We come back to this point.
Correlation or covariance matrices can be measured for arbitrary systems in which the observables are time series. About ninety years ago, Wishart (Muirhead 2005; Wishart 1928) put forward a random matrix model to assess the statistical features of the correlation or covariance matrices by comparing to a Gaussian null hypothesis. Consider the K values at a fixed time t, which form the K component data vector . Now, suppose that we draw the entries of this vector from a multivariate Gaussian distribution with some covariance matrix , say, meaning that:
is the probability density function. We now make the important assumptions that, first, the data vectors are statistically independent for different times t and, second, the distribution (5) has exactly the same form for all times with the same covariance matrix . Put differently, we assume that the data are from a statistical viewpoint, Markovian and stationary in time. The probability density function for the entire model data matrix A is then simply the product:
This is the celebrated Wishart distribution for the data matrix A, which predicts the statistical features of random covariance matrices. By construction, we find for the average of the model covariance matrix :
where the angular brackets indicate the average over the Wishart random matrix ensemble (6) and where stands for the flat measure, i.e., for the product of the differentials of all independent variables:
We notice that in the random matrix model, each is one single random variable; both the index k and the argument t are discrete. Hence, the is not the differential of a function, rather it is simply the differential of the random variable . The Wishart ensemble is based on the assumptions of statistical independence for different times, stationarity and a multivariate Gaussian functional form. The covariance matrix is the input for the mean value of the Wishart ensemble about which the individual random covariance matrices fluctuate in a Gaussian fashion. The strength of the fluctuations is intimately connected with the length T of the model time series. Taking the formal limit reduces the fluctuations to zero, and all random covariance matrices are fixed to . It is worth mentioning that the Wishart model for random correlation matrices has the same form. If we replace A with M and with , we find the Wishart distribution that yields the statistical properties of random correlation matrices.
The Wishart model serves as a benchmark and a standard tool in statistical inference (Muirhead 2005) by means of an ergodicity argument: the statistical properties of individual covariance or correlation matrices may be estimated by an ensemble of such matrices, provided their dimension K is large. Admittedly, this ergodicity argument does not necessarily imply that the probability density functions are multivariate Gaussians. Nevertheless, arguments similar to those that lead to the central limit theorem corroborate the Gaussian assumption, and empirically, it was seen to be justified in a huge variety of applications. A particularly interesting application of the Wishart model for correlations in the simplified form with was put forward by the Paris and Boston econophysics groups (Laloux et al. 1999; Plerou et al. 1999) who compared the eigenvalue distributions (marginal eigenvalue probability density functions) of empirical financial correlation matrices with the theoretical prediction. They found good agreement in the bulk of the distributions, which indicates a disturbing amount of noise-dressing in the data due to the relatively short lengths of the empirical time series with considerable consequences for portfolio optimization methods (Bouchaud and Potters 2003; Giada and Marsili 2002; Guhr and Kälber 2003; Pafka and Kondor 2004; Plerou et al. 2002; Tumminello et al. 2005).
2.2. New Interpretation and Application of the Wishart Model
Financial markets are well known to be non-stationary, i.e., the assumption of stationarity is only meaningful on short time scales and is bound to fail on longer ones. Non-stationary complex systems pose fundamental challenges (Bernaola-Galván et al. 2001; Gao 1999; Hegger et al. 2000; Rieke et al. 2002) for empirical analysis and for mathematical modeling (Zia and Rikvold 2004; Zia and Schmittmann 2006). An example from finance is comprised of the strong fluctuations of the sample standard deviations , measured in different time windows of the same length T (Black 1976; Schwert 1989), as shown in Figure 1. Financial markets demonstrated their non-stationarity in a rather drastic way during the recent years of crisis. Here, we focus on the non-stationarity of the correlations. Their fluctuations in time occur, e.g., because the market expectations of the traders change, the business relations between the companies change, particularly in a state of crisis, and so on. To illustrate how strongly the correlation matrix C as a whole changes in time, we show it for subsequent time windows in Figure 2. The dataset used here consists of continuously-traded companies in the S&P 500 index between 1992 and 2012 (Yahoo n.d.). Each point represents a correlation coefficient between two companies. The darker the color, the larger the correlation. The companies are sorted according to industrial sectors. The inter-sector correlation is visible in the off-diagonal blocks, whereas the intra-sector correlation is visible in the blocks on the diagonal. For later discussion, we emphasize that the stripes in these correlation matrices indicate the structuring of the market in industrial sectors; see, e.g., (Münnix et al. 2012).
Clearly, the non-stationary fluctuations of the correlations influence all deduced economic observables, and it is quite plausible that this effect will be strong for the statistics of rare, correlated events. In the sequel, we will show that the tails of the loss distributions in credit risks will be particularly sensitive to the non-stationarity of the correlations. We will also extend the Merton model (Merton 1974) of credit risk to account for the non-stationarity. To this end, we will now put forward a re-interpretation of the Wishart random matrix model for correlation matrices (Schmitt et al. 2013). As mentioned in Section 2.1, the Wishart model in its original and widely-used form is based on the assumption of stationarity. Using ergodicity, it predicts statistical properties of large individual correlation and covariance matrices with the help of a fictitious ensemble of random matrices. Ergodicity means that averages of one single system over a very long time can be replaced by an average over an ensemble of matrices or other mathematical structures, which represent all possible systems of the same kind. We now argue that the Wishart model may be viewed as an ensemble of random matrices that models a truly existing ensemble of non-stationary covariance matrices. The elements of this ensemble model are in a statistical sense a set of covariance matrices, which result from a measurement. In the re-interpretation of the Wishart model the issue of ergodicity does not arise. Two elements in this latter ensemble are shown in Figure 2; the whole ensemble consists of all correlation matrices measured with a window of length T sliding through a set of much longer time series of length . The size of the truly existing ensemble is thus if the windows do not overlap. The average correlation or covariance matrices or are simply the sample averages over the whole time series of length . We have K time series divided into pieces of length T that yield the truly existing ensemble. To model it with an ensemble of random matrices, we have to employ data matrices A with K rows, representing the model time series, but we are free to choose their length N. As argued above, the length of the time series controls the strength of the fluctuations around the mean. Thus, we use random data matrices A and write:
for the probability density function. The mean covariance matrix is the input and given by the sample mean using the whole time series of length . This is our re-interpreted Wishart model to describe fluctuating, non-stationary covariance or correlation matrices. Importantly, ergodicity reasoning is not evoked here, and it would actually be wrong. It is also worth mentioning that we are not restricted to large matrix dimensions.
Next, we demonstrate that the non-stationarity in the correlations induces generic, i.e., universal features in financial time series of correlated markets. We begin with showing that the returns are to a good approximation multivariate Gaussian distributed, if the covariance matrix is fixed. We begin with assuming that the distribution of the K dimensional vectors for a fixed return interval while t is running through the dataset is given by:
where we suppress the argument t of r in our notation. We test this assumption with the daily S&P 500 data. We divide the time series in windows of length trading days, which is short enough to ensure that the sampled covariances can be viewed as constant within these windows. We aggregate the data, i.e., we rotate the return vector into the eigenbasis of and normalize with the corresponding eigenvalues. As seen in Figure 3, there is good agreement with a Gaussian over at least four orders of magnitude; details of the analysis can be found in (Schmitt et al. 2013). To account for the non-stationarity of the covariance matrices, we replace them with random matrices:
drawn form the distribution (9). We emphasize that the random matrices A have dimension . The larger the N, the more terms contribute to the individual matrix elements of , eventually fixing them for to the mean . The fluctuating covariances alter the multivariate Gaussian (10). We model this by the ensemble averaged return distribution:
which parametrically depends on the fixed empirical covariance matrix , as well as on N. The ensemble average can be done analytically (Schmitt et al. 2013) and results in:
where is the modified Bessel function of the second kind of order . In the data analysis below, we will find . Since the empirical covariance matrix is fixed, N is the only free parameter in the distribution (13). For large N, it approaches a Gaussian. The smaller N, the heavier the tails, for the distribution is exponential. Importantly, the returns enter only via the bilinear form .
To test our model, we again have to aggregate the data, but now for the entire S&P 500 dataset from 1992–2012, i.e., days; see Figure 4. We find for daily returns, i.e., trading day and for trading days. Furthermore, a more detailed comparison with larger datasets for monthly returns is provided in Figure 5. Here, stocks taken from the S&P 500 index and stocks taken from NASDAQ are used. In the top left corner, the dataset consists of 307 stocks taken from the S&P 500 index, which are continuously traded in the period 1992–2012. The other datasets following clockwise are: 439 stocks from S&P 500 index in the time period 2002–2012, 2667 stocks from NASDAQ in the time period 2002–2012 and 708 stocks from NASDAQ in the time period 1992–2012. We find values around for monthly returns. Both datasets are available at (Yahoo n.d.). There is a good agreement between the model and data. Importantly, the distributions have heavy tails, which result from the fluctuations of the covariances; the smaller the N, the heavier. For small N, there are deviations between theory and data in the tails. Three remarks are in order. First, one should clearly distinguish this multivariate analysis from the stylized facts of individual stocks, which are well known to have heavy-tailed distributions. This is to some extent accounted for in our model, as seen in the bottom part of Figure 4. In the top part, the tails are heavier because the time interval is much shorter. To further account for this, we need to modify the Wishart model by using a distribution different from a Gaussian one (Meudt et al. 2015). Second, Figure 2 clearly shows that the empirical ensemble of correlation matrices has inner structures, which are also contained in our model, because the mean enters. Third, an important issue for portfolio management is that the random matrix approach reduces the effect of fluctuating correlations to one single parameter characterizing its strength. Hence, the fluctuation strength of correlations in a given time interval can directly be estimated from the empirical return distribution without having to estimate the correlations on shorter time intervals (Chetalova et al. 2015).
In the mathematics and economics literature, dynamic models based on Wishart processes were introduced, involving multivariate stochastic volatilities (Gouriéroux and Sufana 2004; Gouriéroux et al. 2009). Various quantities such as leverage, risk premia, prices of options and Wishart autoregressive processes are calculated and discussed. These studies are related to ours, although our focus is not on the processes, rather on the resulting distributions, because we wish to directly model multivariate return distributions in a non-stationary setting.
3. Modeling Fluctuating Asset Correlations in Credit Risk
Structural credit risk models employ the asset value at maturity to derive default events and their ensuing losses. Thus, the distribution that describes the asset values has to be chosen carefully. One major requirement is that the distribution is in good accordance with empirical data. This goal can be achieved by using the random matrix approach for the asset correlations, discussed in Section 2. Based on (Schmitt et al. 2014, 2015), we discuss the Merton model together with the random matrix approach in Section 3.1. In Section 3.2, we reveal the results for the average loss distribution of a credit portfolio. The adjustability of the model is shown in Section 3.3. In Section 3.4, we discuss the impact of the random matrix approach on VaR and ETL.
3.1. Random Matrix Approach
We start out from the Merton model (Merton 1974) and extend it considering a portfolio of K credit contracts. Each obligor in the portfolio is assumed to be a publicly-traded company. The basic idea is that the asset value of company k is the sum of time-independent liabilities and equity , i.e., . The stochastic process represents the unobservable asset (firm) value. This is indeed a weakness of the Merton model, which has often been discussed (Duan 1994; Elizalde 2005). Here, we proceed by assuming that can be estimated by the observable equity values (Eom et al. 2004) . In the spirit of the Merton model, is modeled by a geometric Brownian motion. Therefore, one can trace back the changes in asset values to stock price returns and estimate the parameters of the stochastic process like volatility and drift by empirical stock price data. The liabilities mature after some time , and the obligor has to fulfill his/her obligations and make a required payment. Thus, he/she has to pay back the face value without any coupon payments in between. This is related to a zero coupon bond, and the equity of the company can be viewed as an European call option on its asset value with strike price . A default occurs only if at maturity, the asset value is below the face value . The corresponding normalized loss is:
The Heaviside step function guarantees that a loss is always larger than zero. This is necessary, because in the case , the company is able to make the promised payment, and no loss occurs. In other words, the default criterion can be affiliated with the leverage at maturity . If the leverage is larger than one, a default occurs, and if the leverage is below one, no default occurs. The total portfolio loss L is a sum over the individual losses weighted by their fractions in the portfolio:
The aim is to describe the average portfolio loss distribution , which can be expressed by means of a filter integral:
where is the multivariate distribution of all asset values at maturity time and is the covariance matrix, and the measure is the product of all differentials:
This is equivalent to a -fold convolution, which is expressed in terms of a filter integral by means of the Dirac delta function . We notice the complexity of the integral (16) as the losses (14) involve Heaviside functions. The distribution is obtained by the more easily accessible distribution where r is the return vector consisting of the returns:
defined analogously to (1). Here, is the return horizon, which corresponds to the maturity time, i.e.,
because we are interested in changes of the asset values over the time period .
The crucial problem is that the asset values show fluctuating correlations in the course of time. This non-stationarity has to be taken into account by the distribution when larger time scales like one year or more are considered. As described in Section 2, the random matrix approach can be used to cope with the non-stationary asset correlations. The average asset value distribution is obtained by averaging a multivariate normal distribution over an ensemble of Wishart distributed correlation matrices. Thus, we calculate the loss distribution as an ensemble average. From (16), we find:
Again, we emphasize that the ensemble truly exists as a consequence of the non-stationarity. As a side effect of the random matrix approach, the resulting distribution depends only on two parameters: the average covariance matrix and the free parameter N, which controls the strength of the fluctuations around the average covariance matrix. N behaves like an inverse variance of the fluctuations; the smaller the N, the larger the fluctuations become. Both parameters have to be determined by historical stock price data.
The average asset value distribution depends on the mean covariance matrix . To circumvent the ensuing complexity and to make analytical progress, we assume an effective average correlation matrix:
where all off-diagonal elements are equal to c. The average correlation is calculated over all assets for the selected time horizon. We emphasize that only the effective average correlation matrix is fixed; the correlations in the random matrix approach fluctuate around this mean value. In the sequel, whenever we mention a covariance matrix with an effective correlation matrix, we denote it as an effective covariance matrix, and whenever we mention a fully-empirical covariance matrix where all off-diagonal elements differ from another, we denote it as an empirical covariance matrix or a covariance matrix with a heterogeneous correlation structure. Using the assumption (21), analytical tractability is achieved, but it also raises the question whether the data can still be described well. To compare the result with the data, one has to rotate and scale the returns again, but instead of using the empirical covariance matrix the covariance matrix with the effective average correlation structure has to be applied. The results for monthly returns, using the same dataset as in Figure 5, are shown in Figure 6. Still, there is a good agreement between the average asset value distribution with the assumption (21) and the data. This leads to the conclusion that the approximation is reasonable. Considering the parameter , which is needed to describe the fluctuations around the effective average correlation matrix, values around are found. In contrast to the larger values around , which describe the distributions best in the case of an empirical correlation matrix, the lower values in the case of an effective correlation matrix with average correlation c are needed to describe the larger fluctuations around this average. This result corroborates the interpretation of N as an inverse variance of the fluctuations. Now, the correlation structure of a financial market is captured solely by two parameters: the average correlation coefficient c and parameter N, which indicates the strength of the fluctuations around this average.
3.2. Average Loss Distribution
Having shown the quality of the random matrix approach, we may now proceed in calculating the average portfolio loss distribution (20). We deduce the average distribution for the asset values from the result (13) for the returns. In the Merton model, it is assumed that the asset values follow a geometric Brownian motion with drift and volatility constants and , respectively. This leads to a multivariate Gaussian of the form (10) for the returns, which is consistent with the random matrix approach. Therefore, according to Itô’s Lemma (Itô 1944), we perform a change of variables:
with and the volatilities:
where is the standard deviation in connection with (2). Furthermore, we assume a large portfolio in which all face values are of the same order and carry out an expansion for large K. The analytical result is:
for the average loss distribution with:
and:
The j-th moments are:
see (Schmitt et al. 2014). The changed variable is with the upper bound for the integral (27):
The integrals in (24) have to be evaluated numerically.
To further illustrate the results, we assume homogeneous credit portfolios. A portfolio is said to be homogeneous when all contracts have the same face value and start value and the same parameters for the underlying stochastic processes like volatility and drift . Of course, this does not mean that all asset values follow the same path from to maturity because underlying processes are stochastic.
It is often argued that diversification significantly reduces the risk in a credit portfolio. In the context mentioned here, diversification solely means the increase of the number K of credit contracts in the credit portfolio on the same market. The limit distribution for an infinitely large portfolio provides information about whether this argument is right or wrong. We thus consider a portfolio of size and find the limiting distribution:
where is the implicit solution of the equation:
We drop the second argument of the first moment from (27), since we consider a homogeneous portfolio. To arrive at the result (29), we use standard methods of the theory of generalized functions and distributions (Lighthill 1958). We now display the average loss distribution for different K. The model depends on four parameters, which can be calibrated by empirical data. Three of them, the average drift , the average volatility and the average correlation coefficient c, can be directly calculated from the data. The fourth parameter N, controlling the strength of the fluctuations, has to be determined by fitting the average asset value distribution onto the data. The resulting average portfolio loss distribution for correlation averaged asset values is shown in Figure 7. Different portfolio sizes and and two different maturity times trading days and trading days are shown. For the estimation of the empirical parameters, the S&P 500 dataset in the time period 1992–2012 is used. The parameters for trading days are , month, month and an average correlation coefficient of , shown on the top, and for a maturity time of year , year, year and an average correlation coefficient of , shown on the bottom. Moreover, a face value of and an initial asset value of are used. There is always a slowly decreasing heavy-tail. A significant decrease of the risk of large losses cannot be achieved by increasing the size of the credit portfolio. Instead, the distribution quickly converges to the limiting distribution . This drastically reduces the effect of diversification. In a quantitative manner, it is thus shown that diversification does not work for credit portfolios with correlated asset values. Speaking pictorially, the correlations glue the obligors together and let them act to some extent like just one obligor.
The values of the average correlation coefficient c and the parameter N also influence the average loss distribution. The larger the average correlation c and the smaller the parameter N, the heavier are the tails of the distribution and the more likely is the risk of large losses.
3.3. Adjusting to Different Market Situations
The non-stationarity of financial markets implies that there are calm periods where the markets are stable, as well as periods of crisis as in the period 2008–2010; see, e.g., for the volatility in Figure 1. Observables describing the market behavior in different periods vary significantly. Consequently, the loss distribution, particularly its tail, strongly changes in different market situations. Our model fully grasps this effect. The parameters, i.e., drift, volatility, average correlation coefficient and parameter N, can be adjusted to different periods. To demonstrate the adjustability of our model based on the random matrix approach, we consider the two periods 2002–2004 and 2008–2010. The first period is rather calm, whereas the second includes the global financial crisis. We determine the average parameters for monthly returns of continuously-traded S&P 500 stocks, shown in Table 1. For each period, we take the corresponding parameters and calculate the average portfolio loss distribution; see Figure 8. As expected, we find a much more pronounced tail risk in times of crisis. This is mainly due to the enlarged average correlation coefficient in times of crisis. Consequently, we are able to adjust the model to various periods. It even is possible to adjust the parameters and hence the tail behavior dynamically.
The setting discussed here includes avalanche or contagion effects only indirectly when calibrated to a market situation in the state of crisis. Direct modeling of contagion is provided in (Hatchett and Kühn 2009; Heise and Kühn 2012).
3.4. Value at Risk and Expected Tail Loss
The approximation of an effective correlation matrix facilitated analytical progress, but importantly, the average asset return distribution still fits empirical data well when using this approximation. We now show that this approximation is also capable of estimating the value at risk (VaR) and the expected tail loss (ETL), also referred to as expected shortfall. We compare the results obtained in this approximation with the results obtained for an empirical covariance matrix. This is also interesting from the risk management perspective because it is common to estimate the covariance matrix over a long period of time and use it as an input for various risk estimation methods. Put differently, we are interested in the quality of risk estimation using an effective correlation matrix and taking fluctuating correlations into account.
The comparison of the effective correlation matrix with the empirical covariance matrix cannot be done analytically. Hence, Monte Carlo simulations to calculate the VaR and ETL are carried out. For each asset, its value at maturity time is simulated and the portfolio loss according to (15) is calculated. All assets have the same fraction in the portfolio. For different time horizons, the empirical covariance matrix, volatilities and drifts for monthly returns of the S&P 500 stocks are calculated. In addition, the parameter N is determined as described above. In the calm period 2002–2004, we find for the empirical covariance matrix a rather large parameter value of , whereas during the financial crisis in 2008–2010, we find . This once more illustrates the meaning of N as an inverted variance of the fluctuations.
The relative deviations of the VaR and ETL for different quantiles of the effective covariance matrix from the empirical covariance matrix are calculated. This is done in two different ways. First, one may assume a fully-homogeneous portfolio where the average values for volatility and drift for each stock are used. Second, one may use the empirically-obtained values for each stock. It turns out that in most cases, the effective covariance matrix together with homogeneous volatility and drift underestimates the risk. In contrast, if one uses heterogeneous volatilities and drifts and the effective covariance matrix, one finds a satisfactory agreement compared to the full empirical covariance matrix; see (Schmitt et al. 2015). In the latter case, the effective covariance matrix slightly overestimates the VaR and ETL in most cases. Hence, the structure of the correlation matrix does not play a decisive role in the risk estimation. This is so because the loss distribution is always a multiply-averaged quantity. A good estimation of the volatilities, however, is crucial.
The benefit of the random matrix approach is shown by comparing the VaR calculated for and for different values of N. The case does not allow fluctuations of the covariance matrix. This means that we use stationary correlations, which turn the distribution of the asset values at maturity into a multivariate log-normal distribution. Thus, for , the benefits of the random matrix approach are disabled. The underestimation of the VaR by using stationary correlations, i.e., , is measured in terms of the relative deviation from the VaR calculated for empirical values of N. The empirical covariance matrix and the empirical, i.e., heterogeneous, volatilities and drifts calculated in the period 2006–2010 are used. The results are shown in Figure 9. Here, different quantiles are used. For the empirically-observed parameter , the VaR is underestimated between 30% and 40%. Hence, to avoid a massive underestimation of risk, the fluctuations of the asset correlations must be accounted for.
4. Concurrent Credit Portfolio Losses
In the previous section, solely one single portfolio on a financial market was considered. Here, based on (Sicking et al. 2018), we consider the problem of concurrent portfolio losses where two non-overlapping credit portfolios are taken into account. In Section 4.1, we discuss copulas of homogeneous portfolios. The dependence of empirical S&P 500- and Nikkei-based credit portfolios is discussed in Section 4.2.
4.1. Simulation Setup
We consider two non-overlapping credit portfolios, which are set up according to Figure 10, in which the financial market is illustrated by means of its correlation matrix. The color indicates the strength of the correlation of two companies in the market. Hence, the diagonal is red as the diagonal of a correlation matrix is one by definition. The two portfolios are marked in Figure 10 as black rimmed squares. Both portfolios include K contracts, which means they are of equal size and no credit contract is contained in either portfolio. Despite the fact that the portfolios are non-overlapping, they are correlated due to non-zero correlations in the off-diagonal squares.
The joint bivariate distribution of the losses and of two credit portfolios:
is defined analogously to (16). Here, the upper index indicates the corresponding portfolio. The normalized losses and portfolio losses , as well as the fractions for are defined analogously to (14) and (15), respectively. The total face value is the sum over the face values for both portfolios. We remark that for two non-overlapping portfolios, one of the addends is always zero.
With this simulation setup, the correlated asset values for each contract are simulated several thousand times to calculate the portfolio losses and out of them the empirical portfolio loss copula. A copula is the joint distribution of a bivariate random variable expressed as a function of the quantiles for the two marginal distributions. The basic idea of copulas is to separate the mutual dependence of a bivariate random variable from the two marginal distributions to analyze the statistical dependencies. In particular, we will analyze the copula density, which is illustrated by means of a normalized two-dimensional histogram. Hence, when speaking of a copula, we rather mean its density. To obtain a better understanding of the mutual dependencies, which are expressed by the empirical copula, it is compared to a Gaussian copula. This Gaussian copula is fully determined by the correlation coefficient of the portfolio losses.
To systematically study the influence of different parameters on the portfolio loss copula, it is helpful to analyze homogeneous portfolios first. The most generic features can be found by focusing on asset correlations and drifts. The simulation is run in two different ways. First, we consider Gaussian dynamics for the stock price returns. This means that the asset values at maturity time are distributed according to a multivariate log-normal distribution. We notice that in the case of Gaussian dynamics, the fluctuations of the random correlations around the average correlation coefficient are zero. This corresponds to the case . Second, we use fluctuating asset correlations, employing a parameter value of in accordance with the findings of (Schmitt et al. 2015) for an effective correlation matrix; see Table 1. For the simulation, the parameters , and leverages are chosen. The portfolios are of size ; the maturity time is ; and a market with vanishing asset correlation, i.e., , is considered. The resulting copulas are shown in Figure 11. For , the loss copula is constant. This result is quite obvious. Due to the Gaussian dynamics and , the asset values are uncorrelated and statistically independent. Therefore, the portfolio losses, which are derived from those independent quantities, do not show mutual dependencies either. The resulting copula is an independence copula, which agrees with a Gaussian loss copula for a portfolio loss correlation of . In the color code, only white appears. The difference of the empirical copula and the Gaussian copula within each bin is illustrated by means of a color code. The color bar on the right-hand side indicates the difference between the two copulas. The colors yellow to red imply a stronger dependence by the empirical copula in the given -interval than predicted by the Gaussian copula. The colors turquoise to blue imply a weaker dependence of the empirical copula than by a Gaussian copula. White implies that the local dependence is equal. The empirical average loss correlation calculated from the simulation outcomes is zero and corroborates this result.
In the bottom panel of Figure 11, the combination of and is shown. The deviations from the independence copula are striking. They emerge because we included according to the random matrix approach fluctuating asset correlations around the average correlation . In that way, positive. as well as negative correlations are equally likely. Having a look at the copula histograms, we find a significant deviation from a Gaussian copula. A Gaussian copula is always symmetric regarding the line spanning from to . Nevertheless, the portfolio loss correlation is . The deviations from the Gaussian copula, which is determined by the calculated correlation coefficient, can be seen in Figure 11. Especially in the corner, which is related to concurrent extreme losses, we see that the empirical copula shows a weaker dependence than the Gaussian copula. We still have to answer the question why the portfolio losses exhibit such a strong positive correlation, although the average asset correlation is set to zero in the simulation. First, as explained above, credit risk is highly asymmetric. For example, if in a credit portfolio, one single contract generates a loss, it is already sufficient enough that the whole portfolio generates a loss. The company defaulting may just cause a small portfolio loss, but still, it dominates all other non-defaulting and maybe prospering companies. In other words, there is no positive impact of non-defaulting companies on the portfolio losses. All those non-defaults are projected onto zero. Second, the fluctuating asset correlations imply a division of the companies into two blocks. The companies show positive correlations within the blocks and negative correlations across them. Due to the aforementioned fact that non-defaulting companies have no positive impact on the loss distribution, the anti-correlations contribute to the portfolio loss correlation in a limited fashion. They would act as a risk reduction, which is limited according to the asymmetry of credit risk. On the other side, positive correlations within the blocks imply a high risk of concurrent defaults.
We now investigate the impact of the drift. All non-defaulting companies are projected onto a portfolio loss equal to zero. The influence of these projections onto zero and therefore the default-non-default ratio can be analyzed in greater detail by varying the drift of the asset values. For example, if a strong negative drift is chosen, it is highly likely that all companies will default at maturity.
We consider Gaussian dynamics with an average asset correlation of and a volatility of and different values of . Figure 12 shows the resulting copulas for three different drift parameters. In the top panel, a drift of was chosen, which leads to a non-default ratio of and an estimated portfolio loss correlation of . One finds a significant deviation from a symmetric Gaussian copula. In the middle and bottom panel, a drift of and was chosen, which leads to non-default ratios of and zero, respectively. The estimated portfolio loss correlations increase as the non-default ratios decrease, and one finds a correlation of and , respectively. Moreover, we see that the empirical copula turns ever more Gaussian if the percentage of non-defaults decreases. Finally, at a default probability of , the empirical loss copula is a Gaussian copula. This is seen in the bottom panel where no color except for white appears. In the middle and top panel, we see deviations from the Gaussian copula. Especially in the corner, we see that the empirical copula exhibits a stronger dependence than predicted by the corresponding Gaussian copula. In both cases, the statistical dependence of large concurrent portfolio losses is underestimated by the Gaussian copula.
We infer that an increase in default probability yields an increase in portfolio loss correlation. In addition, we conclude that the loss of information, which is caused by the projections onto zero, is responsible for the observed deviations of the statistical dependencies from Gaussian copulas.
4.2. Empirical Credit Portfolios
Now, more realistic portfolios with heterogeneous parameters are considered. To systematically study the influence of heterogeneity only, the volatility is initially chosen to be heterogeneous. Afterwards, we will proceed with the analysis of fully-heterogeneous portfolios. The empirical parameters like asset correlation, drift and volatility are determined by historical datasets from S&P 500 and Nikkei 225.
In order to avoid any effect due to a specific parameter choice, the average over thousands of simulations run with different parameter values is calculated.
We begin with investigating the heterogeneity of single parameters. Gaussian dynamics with an average asset correlation and a homogeneous large negative drift of is considered. Due to the large negative drift, we have seen that in the case of an additional homogeneous volatility, the resulting dependence structure is a Gaussian copula. A rather simple heterogeneous portfolio is constructed when only the daily volatilities are considered random. For each contract, the volatility is drawn from a uniform distribution in the open interval . The resulting average portfolio loss copula is shown in Figure 13. We again compare the average copula calculated by the simulation outcomes with the average over the corresponding Gaussian copulas determined by the portfolio loss correlation. Surprisingly, the single parameter heterogeneity is sufficient to cause deviations from the Gaussian copula. The coloring shows deviations of the empirical copula from the Gaussian copula especially in the vicinity of the and corners. We come to the conclusion that a choice of one or more heterogeneous parameters, i.e., a large variety in different parameters for each portfolio, alters the dependence structure from an ideal Gaussian copula. The more heterogeneous the portfolios become, the larger the deviations from the symmetric Gaussian copula.
So far, there are two causes for non-Gaussian empirical copulas: the loss of information, induced by the projections of non-defaults onto zero, as well as parameter heterogeneity.
We now turn to empirical portfolios. Before starting the simulation, the empirical parameters have to be defined. The dataset consists of stock return data from 272 companies listed on the S&P 500 index and from 179 companies listed on the Nikkei 225 index. It is sampled in a 21-year interval, which covers the period January 1993–April 2014. To set up a realistic, fully-homogeneous portfolio, drifts, volatilities and correlations are calculated from this empirical dataset. Moreover, in (Schmitt et al. 2013), it was shown that annual returns behave normally for empirical asset values. To match these findings, the Gaussian dynamics for the stock price returns is applied. To obtain an average empirical portfolio loss copula, one first averages over different pairs of portfolios and then averages over randomly chosen annual time intervals taken out of the 21-year period. By averaging over different pairs of portfolios, results that are due to specific features of two particular portfolios are avoided. We consider three different cases, which are shown in Figure 14. In the first case, which is shown in the top panel, one portfolio is drawn from S&P 500 and the other is drawn from Nikkei 225. In the second case (middle panel), both portfolios are drawn from S&P 500, and in the third case (bottom panel) both are drawn from Nikkei 225.
In all three cases, we find deviations of the empirical copula from the Gaussian copula. Especially the dependence of the extreme events is much more pronounced than by the prediction of a Gaussian copula. This can be seen in the corner, where the colors indicate that the tails are much more narrow and pointed compared to the Gaussian copula. On the other side, the tails in the corner are flatter compared to a Gaussian copula. The asymmetry regarding the line spanned by and leads to the conclusion that extreme portfolio losses occur more often simultaneously than in the case of small portfolio losses. Hence, an extreme loss of one portfolio is very likely to also yield an extreme loss of the other portfolio. This dependence is much stronger than predicted by a Gaussian copula. Thus, modeling portfolio loss dependencies by means of Gaussian copulas is deeply flawed and might cause severe underestimations of the actual credit risk.
Another important aspect of credit risk can be analyzed by considering different portfolio sizes. So far, only rather small portfolios of size were chosen. Increasing the size of the portfolios leads to a rise in portfolio loss correlation. This behavior can be explained by the decrease of the idiosyncrasies of large portfolios. Moreover, it explains why the empirical loss copulas in Figure 14 are almost perfectly symmetric regarding the line spanned by and . Portfolios based on the S&P 500 dataset with a size of each reveal an significant average loss correlation of . Even if we decrease the size to companies, an average portfolio loss correlation of is found. This reveals that high dependencies among banks are not only limited to “big players”, which hold portfolios of several thousand contracts. Furthermore, small institutions show noticeable dependencies even though their portfolios are non-overlapping.
5. Discussion
The motivation for the studies that we reviewed here was two-fold. First, the massive perturbations that shook the financial markets starting with the subprime crisis of 2007–2009 sharpened the understanding of how crucial the role of credits is for the stability of the economy as a whole in view of the strong interdependencies. Better credit risk estimation is urgently called for, particularly for rare, but drastic events, i.e., for the tails of the loss distributions. Particularly, the often claimed benefit of diversification has to be critically investigated. Second, the ubiquitous non-stationarity in financial markets has to be properly accounted for in the models. The financial crisis illustrates in a painful way that decisive economic quantities strongly fluctuate in time, ruling out elegant, but too simplistic equilibrium approaches, which fail to grasp the empirical situation.
This two-fold motivation prompted a random matrix approach to tackle and eventually solve the Merton model of credit risk for fully-correlated assets. A proper asset value distribution can be calculated by an ensemble average of random correlation matrices. The main ingredient is a new interpretation of the Wishart model for correlation or covariance matrices. While it was originally meant to describe generic statistical features resulting from stationary time series, i.e., eigenvalue densities and other quantities for large correlation matrices, the new interpretation grasps non-stationary correlation matrices by modeling a truly existing, measured set of such correlation matrices with an ensemble of random correlation matrices. Contrary to the original interpretation of the Wishart model, ergodicity reasoning is not applied, and a restriction to large matrices is not needed, either.
According to the Merton model, stock price data instead of data on asset values can be used to calibrate the required parameters. This is quite valuable because empirical data on asset values are not easy to obtain, whereas stock price data are commonly available. Considering long time horizons, the sample statistics of returns can be described by a multivariate mixture of distributions. The resulting distribution is the average of a multivariate normal distribution over an ensemble of Wishart-distributed covariance matrices. This random matrix approach takes the fluctuating asset correlations into account. As a very nice side effect, the random matrix approach reduces the number of parameters that describe the correlation structure of the financial market to two. Both of them can be considered as macroscopic. One parameter is a mean correlation coefficient of the asset values, and the other parameter describes the strength of the fluctuations around this average. Furthermore, the random matrix approach yields analytical tractability, which allows one to derive an analytical expression for the loss distribution of a portfolio of credit contracts, taking fluctuating asset correlations into account. In a quantitative manner, it is shown that in the presence of asset correlations, diversification fails to reduce the risk of large losses. This is substantial quantitative support and corroboration for qualitative reasoning in the economic literature. Furthermore, it is demonstrated that the random matrix approach can describe very different market situations. For example, in a crisis, the mean correlation coefficient is higher, and the parameter governing the strength of the fluctuations is smaller than in a quite period, with considerable impact on the loss distribution.
In addition, Monte Carlo simulations were run to calculate VaR and ETL. The results support the approximation of an effective average correlation matrix if heterogeneous average volatilities are taken into account. Moreover, the simulations show the benefit of the random matrix approach. If the fluctuations between the asset correlations are neglected, the VaR is underestimated by up to 40%. This underestimation could yield dramatic consequences. Therefore, the results strongly support a conservative approach to capital reserve requirements.
Light is shed on intrinsic instabilities of the financial sector. Sizable systemic risks are present in the financial system. These were revealed in the financial crisis of 2007–2009. Up to that point, tail-dependencies between credit contracts were underestimated, which emerged as a big problem in credit risk assessment. This is another motivation for models like ours that take asset fluctuations into account.
The dependence structure of credit portfolio losses was analyzed within the framework of the Merton model. Importantly, the two credit portfolios operate on the same correlated market, no matter if they belong to a single creditor or bank or to different banks. The instruments to analyze the joint risk are correlations and copulas. Correlations break down the dependence structure into one parameter and represent only a rough approximation for the coupling of portfolio losses. In contrast, copulas reveal the full dependence structure. For two non-overlapping credit portfolios, we found concurrent large portfolio losses to be more likely than concurrent small ones. This observation is in contrast to a symmetric Gaussian behavior as described by correlation coefficients. Risk estimation by solely using standard correlation coefficients yields a clear underestimation of concurrent large portfolio losses. Hence, from a systemic viewpoint, it is really necessary to incorporate the full dependence structure of joint risks.
Acknowledgments
Andreas Mühlbacher acknowledges support from Studienstiftung des deutschen Volkes.
Conflicts of Interest
The authors declare no conflict of interest.
References
- Benmelech, Efraim, and Jennifer Dlugosz. 2009. The alchemy of CDO credit ratings. Journal of Monetary Economics 56: 617–34. [Google Scholar] [CrossRef]
- Bernaola-Galván, Pedro, Plamen Ch. Ivanov, Luís A. Nunes Amaral, and H. Eugene Stanley. 2001. Scale invariance in the nonstationarity of human heart rate. Physical Review Letters 87: 168105. [Google Scholar] [CrossRef] [PubMed]
- Bielecki, Tomasz R., and Marek Rutkowski. 2013. Credit Risk: Modeling, Valuation and Hedging. Berlin: Springer Science & Business Media. [Google Scholar]
- Black, Fisher. 1976. Studies of stock price volatility changes. In Proceedings of the 1976 Meetings of the American Statistical Association, Business and Economics Statistics Section. Alexandria: American Statistical Association, pp. 177–81. [Google Scholar]
- Bluhm, Christian, Ludger Overbeck, and Christoph Wagner. 2016. Introduction to Credit Risk Modeling. Boca Raton: CRC Press. [Google Scholar]
- Bouchaud, Jean-Philippe, and Marc Potters. 2003. Theory of Financial Risk and Derivative Pricing: From Statistical Physics to Risk Management. Cambridge: Cambridge University Press. [Google Scholar]
- Chava, Sudheer, Catalina Stefanescu, and Stuart Turnbull. 2011. Modeling the loss distribution. Management Science 57: 1267–87. [Google Scholar] [CrossRef]
- Chetalova, Desislava, Thilo A. Schmitt, Rudi Schäfer, and Thomas Guhr. 2015. Portfolio return distributions: Sample statistics with stochastic correlations. International Journal of Theoretical and Applied Finance 18: 1550012. [Google Scholar] [CrossRef]
- Crouhy, Michel, Dan Galai, and Robert Mark. 2000. A comparative analysis of current credit risk models. Journal of Bank. & Finance 24: 59–117. [Google Scholar]
- Di Gangi, Domenico, Fabrizio Lillo, and Davide Pirino. 2018. Assessing Systemic Risk due to Fire Sales Spillover through Maximum Entropy Network Reconstruction. Available online: https://ssrn.com/abstract=2639178 (accessed on 27 February 2018).
- Duan, Jin-Chuan. 1994. Maximum likelihood estimation using price data of the derivative contract. Mathematical Finance 4: 155–67. [Google Scholar] [CrossRef]
- Duffie, Darrell, and Nicolae Garleanu. 2001. Risk and valuation of collateralized debt obligations. Financial Analysts Journal 57: 41–59. [Google Scholar] [CrossRef]
- Duffie, Darrell, and Kenneth J. Singleton. 1999. Modeling term structures of defaultable bonds. The Review of Financial Studies 12: 687–720. [Google Scholar] [CrossRef]
- Elizalde, Abel. 2005. Credit Risk Models II: Structural Models. Documentos de Trabajo CEMFI. Madrid: CEMFI. [Google Scholar]
- Eom, Young H., Jean Helwege, and Jing-zhi Huang. 2004. Structural models of corporate bond pricing: An empirical analysis. The Review of Financial Studies 17: 499–544. [Google Scholar] [CrossRef]
- Gao, Jinbao. 1999. Recurrence time statistics for chaotic systems and their applications. Physical Review Letters 83: 3178. [Google Scholar] [CrossRef]
- Giada, Lorenzo, and Matteo Marsili. 2002. Algorithms of maximum likelihood data clustering with applications. Physica A 315: 650–64. [Google Scholar] [CrossRef]
- Giesecke, Kay. 2004. Credit risk modeling and valuation: An introduction. In Credit Risk: Models and Management, 2nd ed. Edited by David Shimko. London: RISK Books, pp. 487–526. [Google Scholar]
- Glasserman, Paul. 2004. Tail approximations for portfolio credit risk. The Journal of Derivatives 12: 24–42. [Google Scholar] [CrossRef]
- Glasserman, Paul, and Jesus Ruiz-Mata. 2006. Computing the credit loss distribution in the Gaussian copula model: A comparison of methods. Journal of Credit Risk 2: 33–66. [Google Scholar] [CrossRef]
- Gouriéroux, Christian, and Razvan Sufana. 2004. Derivative Pricing with Multivariate Stochastic Volatility: Application to Credit Risk. Working Papers 2004-31. Palaiseau, France: Center for Research in Economics and Statistics. [Google Scholar]
- Gouriéroux, Christian, Joann Jasiak, and Razvan Sufana. 2009. The Wishart autoregressive process of multivariate stochastic volatility. Journal of Econometrics 150: 167–81. [Google Scholar] [CrossRef]
- Guhr, Thomas, and Bernd Kälber. 2003. A new method to estimate the noise in financial correlation matrices. Journal of Physics A 36: 3009. [Google Scholar] [CrossRef]
- Hatchett, Jon P. L., and Reimer Kühn. 2009. Credit contagion and credit risk. Quantitative Finance 9: 373–82. [Google Scholar] [CrossRef]
- Hegger, Rainer, Holger Kantz, Lorenzo Matassini, and Thomas Schreiber. 2000. Coping with nonstationarity by overembedding. Physical Review Letters 84: 4092. [Google Scholar] [CrossRef] [PubMed]
- Heitfield, Eric, Steve Burton, and Souphala Chomsisengphet. 2006. Systematic and idiosyncratic risk in syndicated loan portfolios. Journal of Credit Risk 2: 3–31. [Google Scholar] [CrossRef]
- Heise, Sebastian, and Reimer Kühn. 2012. Derivatives and credit contagion in interconnected networks. The European Physical Journal B 85: 115. [Google Scholar] [CrossRef]
- Hull, John C. 2009. The credit crunch of 2007: What went wrong? Why? What lessons can be learned? Journal of Credit Risk 5: 3–18. [Google Scholar] [CrossRef]
- Ibragimov, Rustam, and Johan Walden. 2007. The limits of diversification when losses may be large. Journal of Bank. & Finance 31: 2551–69. [Google Scholar]
- Itô, Kiyosi. 1944. Stochastic integral. Proceedings of the Imperial Academy 20: 519–24. [Google Scholar] [CrossRef]
- Koivusalo, Alexander F. R., and Rudi Schäfer. 2012. Calibration of structural and reduced-form recovery models. Journal of Credit Risk 8: 31–51. [Google Scholar] [CrossRef]
- Laloux, Laurent, Pierre Cizeau, Jean-Philippe Bouchaud, and Marc Potters. 1999. Noise dressing of financial correlation matrices. Physical Review Letters 83: 1467. [Google Scholar] [CrossRef]
- Lando, David. 2009. Credit Risk Modeling: Theory and Applications. Princeton: Princeton University Press. [Google Scholar]
- Li, David X. 2000. On default correlation: A copula function approach. The Journal of Fixed Income 9: 43–54. [Google Scholar] [CrossRef]
- Lighthill, Michael J. 1958. An introduction to Fourier Analysis and Generalised Functions. Cambridge: Cambridge University Press. [Google Scholar]
- Longstaff, Francis A., and Arvind Rajan. 2008. An empirical analysis of the pricing of collateralized debt obligations. The Journal of Finance 63: 529–63. [Google Scholar] [CrossRef]
- Mainik, Georg, and Paul Embrechts. 2013. Diversification in heavy-tailed portfolios: Properties and pitfalls. Annals of Actuarial Science 7: 26–45. [Google Scholar] [CrossRef]
- McNeil, Alexander J., Rüdiger Frey, and Paul Embrechts. 2005. Quantitative Risk Management: Concepts, Techniques and Tools. Princeton: Princeton University Press. [Google Scholar]
- Merton, Robert C. 1974. On the pricing of corporate debt: The risk structure of interest rates. The Journal of finance 29: 449–70. [Google Scholar]
- Meudt, Frederik, Martin Theissen, Rudi Schäfer, and Thomas Guhr. 2015. Constructing analytically tractable ensembles of stochastic covariances with an application to financial data. Journal of Statistical Mechanics 2015: P11025. [Google Scholar] [CrossRef]
- Muirhead, Robb J. 2005. Aspects of Multivariate Statistical Theory, 2nd ed. John Wiley & Sons: Hoboken. [Google Scholar]
- Münnix, Michael C., Rudi Schäfer, and Thomas Guhr. 2014. A random matrix approach to credit risk. PLoS ONE 9: e98030. [Google Scholar] [CrossRef] [PubMed]
- Münnix, Michael C., Takashi Shimada, Rudi Schäfer, Francois Leyvraz, Thomas H. Seligman, Thomas Guhr, and H. Eugene Stanley. 2012. Identifying states of a financial market. Scientific Reports 2: 644. [Google Scholar] [CrossRef] [PubMed]
- Nelsen, Roger B. 2007. An Introduction to Copulas. New York: Springer Science & Business Media. [Google Scholar]
- Pafka, Szilard, and Imre Kondor. 2004. Estimated correlation matrices and portfolio optimization. Physica A 343: 623–34. [Google Scholar] [CrossRef]
- Plerou, Vasiliki, Parameswaran Gopikrishnan, Bernd Rosenow, Luís A. Nunes Amaral, and H. Eugene Stanley. 1999. Universal and nonuniversal properties of cross correlations in financial time series. Physical Review Letters 83: 1471. [Google Scholar] [CrossRef]
- Plerou, Vasiliki, Parameswaran Gopikrishnan, Bernd Rosenow, Luís A. Nunes Amaral, Thomas Guhr, and H. Eugene Stanley. 2002. Random matrix approach to cross correlations in financial data. Physical Review E 65: 066126. [Google Scholar] [CrossRef] [PubMed]
- Rieke, Christoph, Karsten Sternickel, Ralph G. Andrzejak, Christian E. Elger, Peter David, and Klaus Lehnertz. 2002. Measuring nonstationarity by analyzing the loss of recurrence in dynamical systems. Physical Review Letters 88: 244102. [Google Scholar] [CrossRef] [PubMed]
- Sandoval, Leonidas, and Italo De Paula Franca. 2012. Correlation of financial markets in times of crisis. Physica A 391: 187–208. [Google Scholar] [CrossRef]
- Schäfer, Rudi, Markus Sjölin, Andreas Sundin, Michal Wolanski, and Thomas Guhr. 2007. Credit risk—A structural model with jumps and correlations. Physica A 383: 533–69. [Google Scholar] [CrossRef]
- Schmitt, Thilo A., Desislava Chetalova, Rudi Schäfer, and Thomas Guhr. 2013. Non-stationarity in financial time series: Generic features and tail behavior. Europhysics Letters 103: 58003. [Google Scholar] [CrossRef]
- Schmitt, Thilo A., Desislava Chetalova, Rudi Schäfer, and Thomas Guhr. 2014. Credit risk and the instability of the financial system: An ensemble approach. Europhysics Letters 105: 38004. [Google Scholar] [CrossRef]
- Schmitt, Thilo A., Desislava Chetalova, Rudi Schäfer, and Thomas Guhr. 2015. Credit risk: Taking fluctuating asset correlations into account. Journal of Credit Risk 11: 73–94. [Google Scholar] [CrossRef]
- Schönbucher, Philipp J. 2001. Factor models: Portfolio credit risks when defaults are correlated. The Journal of Risk Finance 3: 45–56. [Google Scholar] [CrossRef]
- Schönbucher, Philipp J. 2003. Credit Derivatives Pricing Models: Models, Pricing and Implementation. Hoboken: John Wiley & Sons. [Google Scholar]
- Schwert, G. William. 1989. Why does stock market volatility change over time? The Journal of Finance 44: 1115–53. [Google Scholar] [CrossRef]
- Sicking, Joachim, Thomas Guhr, and Rudi Schäfer. 2018. Concurrent credit portfolio losses. PLoS ONE 13: e0190263. [Google Scholar] [CrossRef] [PubMed]
- Song, Dong-Ming, Michele Tumminello, Wei-Xing Zhou, and Rosario N. Mantegna. 2011. Evolution of worldwide stock markets, correlation structure, and correlation-based graphs. Physical Review E 84: 026108. [Google Scholar] [CrossRef] [PubMed]
- Tumminello, Michele, Tomaso Aste, Tiziana Di Matteo, and Rosario N. Mantegna. 2005. A tool for filtering information in complex systems. Proceedings of the National Academy of Sciences USA 102: 10421–26. [Google Scholar] [CrossRef] [PubMed]
- Wishart, John. 1928. The generalised product moment distribution in samples from a normal multivariate population. Biometrika 20A: 32–52. [Google Scholar] [CrossRef]
- Yahoo! n.d. Finance. Available online: http://finance.yahoo.com (accessed on 9 February 2018).
- Zhang, Yiting, Gladys Hui Ting Lee, Jian Cheng Wong, Jun Liang Kok, Manamohan Prusty, and Siew Ann Cheong. 2011. Will the US economy recover in 2010? A minimal spanning tree study. Physica A 390: 2020–50. [Google Scholar] [CrossRef]
- Zia, Royce K. P., and Per Arne Rikvold. 2004. Fluctuations and correlations in an individual-based model of biological coevolution. Journal of Physics A 37: 5135. [Google Scholar] [CrossRef]
- Zia, Royce K. P., and Beate Schmittmann. 2006. A possible classification of nonequilibrium steady states. Journal of Physics A 39: L407. [Google Scholar] [CrossRef]
Figure 1.
Standard deviation time series for Goodyear from 1992–2018. The return interval is trading day, and the time window has a length of trading days.
Figure 1.
Standard deviation time series for Goodyear from 1992–2018. The return interval is trading day, and the time window has a length of trading days.

Figure 2.
Correlation matrices of companies for the fourth quarter of 2005 and the first quarter of 2006; the darker, the stronger the correlation. The companies are sorted according to industrial sectors. Reproduced with permission from (Schmitt et al. 2013), EPLA.
Figure 2.
Correlation matrices of companies for the fourth quarter of 2005 and the first quarter of 2006; the darker, the stronger the correlation. The companies are sorted according to industrial sectors. Reproduced with permission from (Schmitt et al. 2013), EPLA.
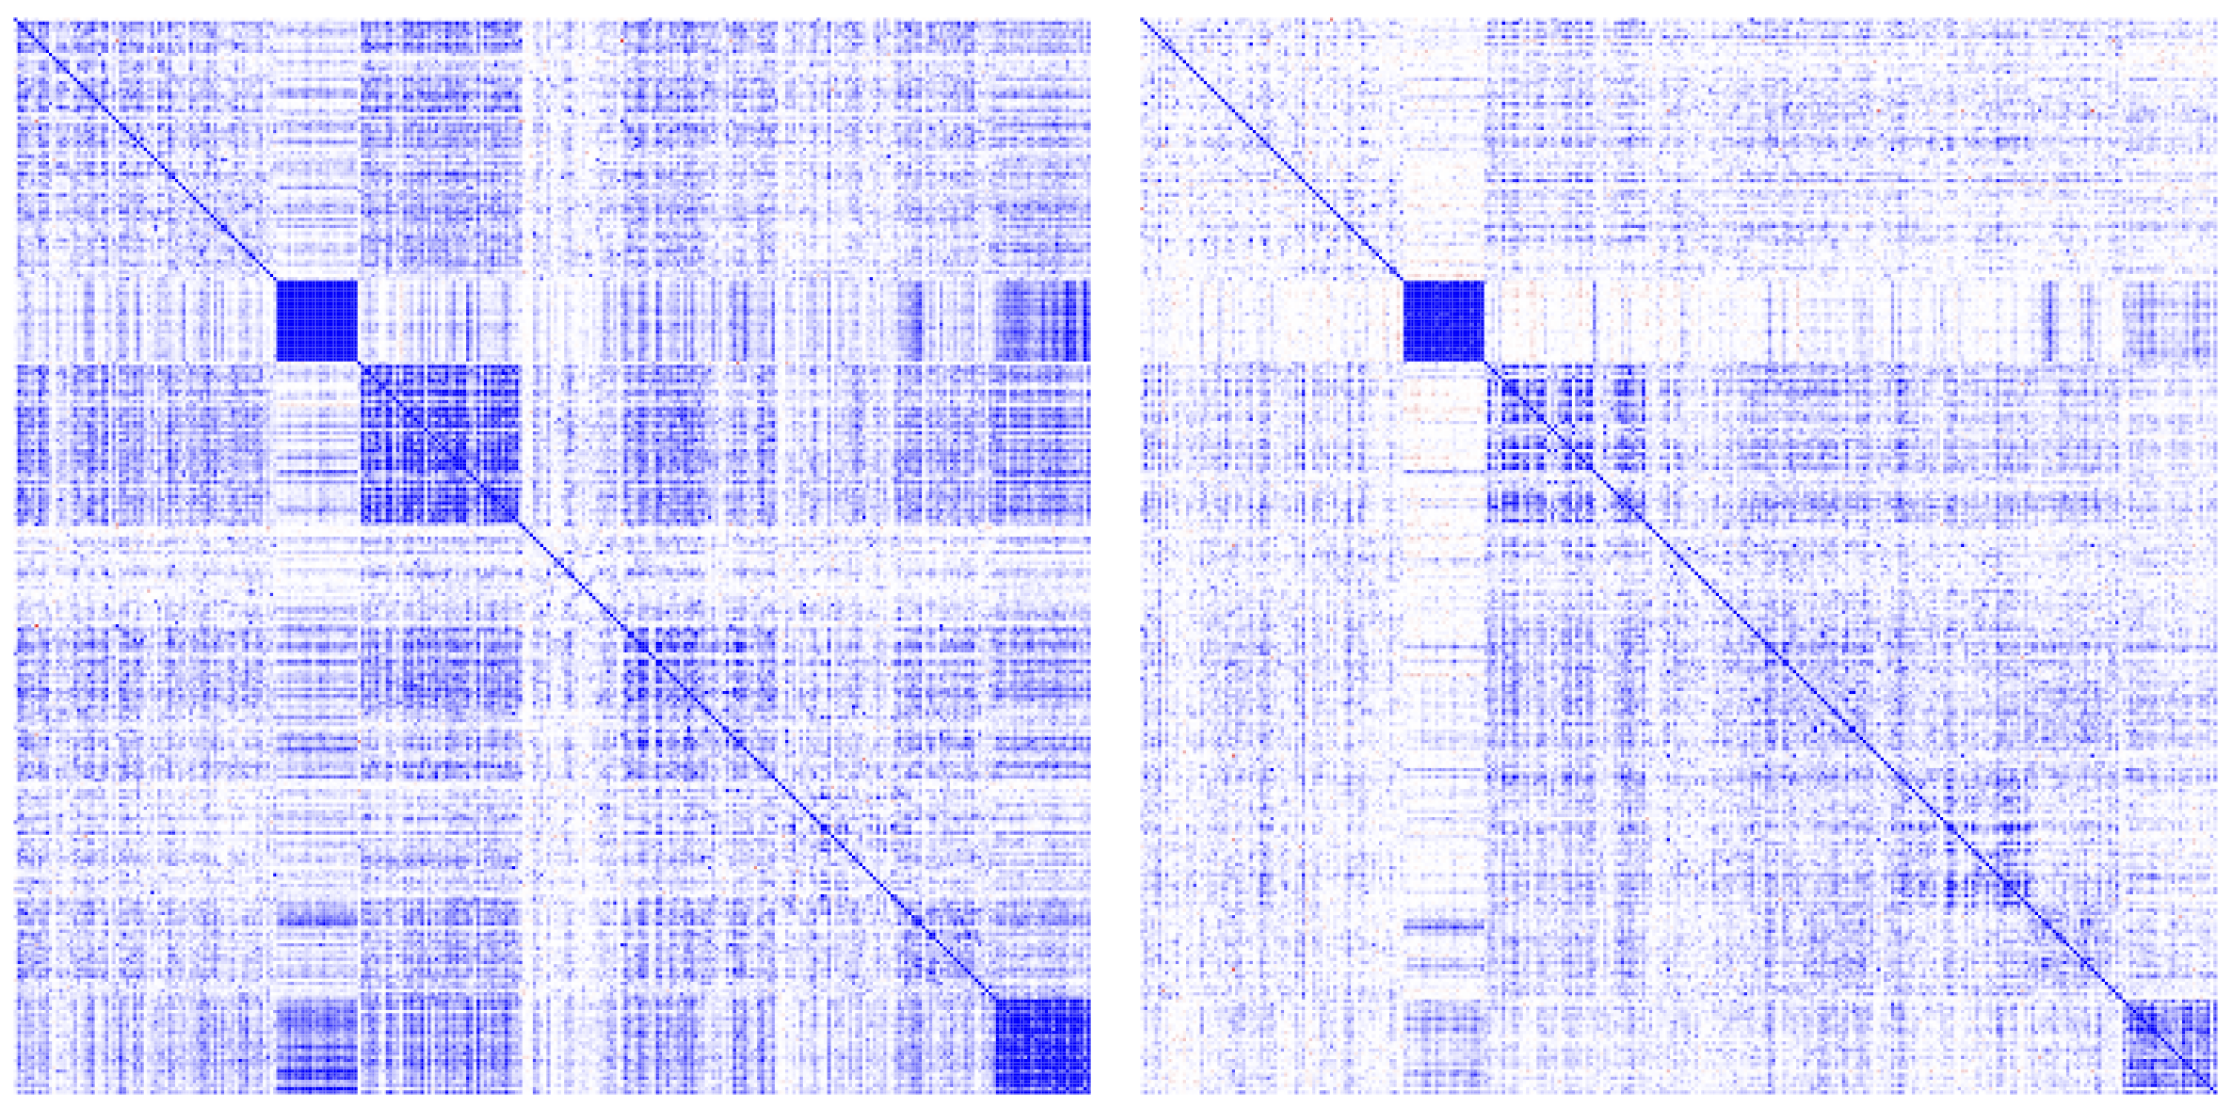
Figure 3.
Aggregated distribution of normalized returns for fixed covariances from the S&P 500 dataset, trading day and window length trading days. The circles show a normal distribution. Reproduced with permission from (Schmitt et al. 2013), EPLA.
Figure 3.
Aggregated distribution of normalized returns for fixed covariances from the S&P 500 dataset, trading day and window length trading days. The circles show a normal distribution. Reproduced with permission from (Schmitt et al. 2013), EPLA.

Figure 4.
Aggregated distribution of the rotated and scaled returns for (top) and (bottom) trading days. The circles correspond to the aggregation of the distribution (13). Reproduced with permission from (Schmitt et al. 2013), EPLA.
Figure 4.
Aggregated distribution of the rotated and scaled returns for (top) and (bottom) trading days. The circles correspond to the aggregation of the distribution (13). Reproduced with permission from (Schmitt et al. 2013), EPLA.
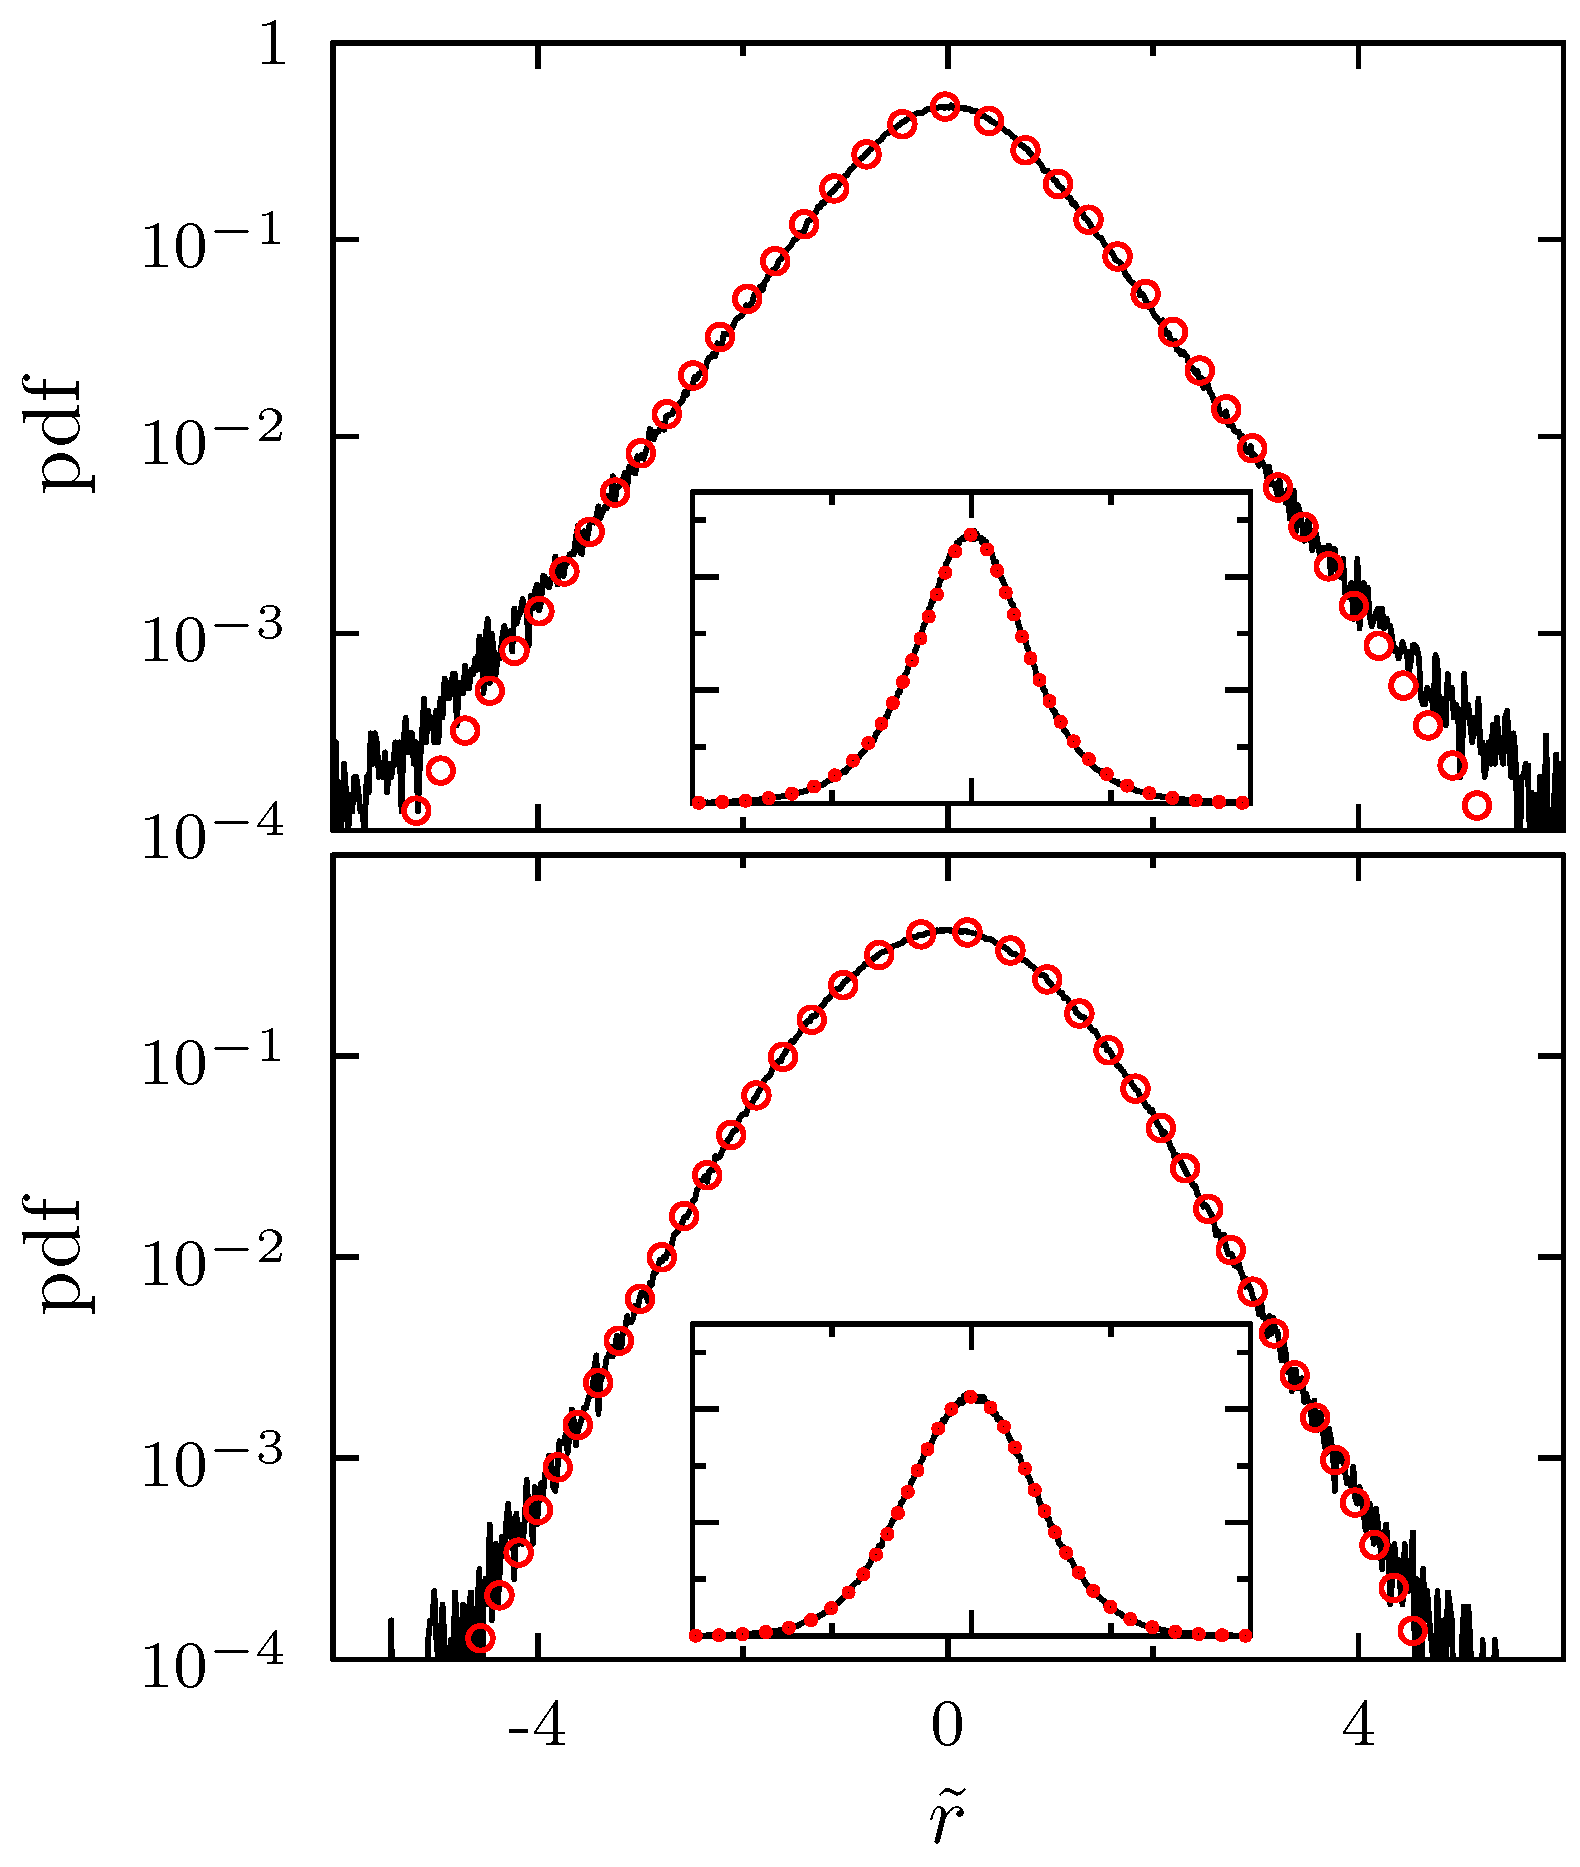
Figure 5.
Aggregated distribution for the normalized monthly returns with the empirical covariance matrix on a logarithmic scale. The black line shows the empirical distribution; the red dotted line shows the theoretical results. The insets show the corresponding linear plots. Top left/right: S&P 500 (1992–2012)/(2002–2012); bottom left/right: NASDAQ (1992–2012)/(2002–2012). Reproduced with permission from (Schmitt et al. 2015), Infopro Digital.
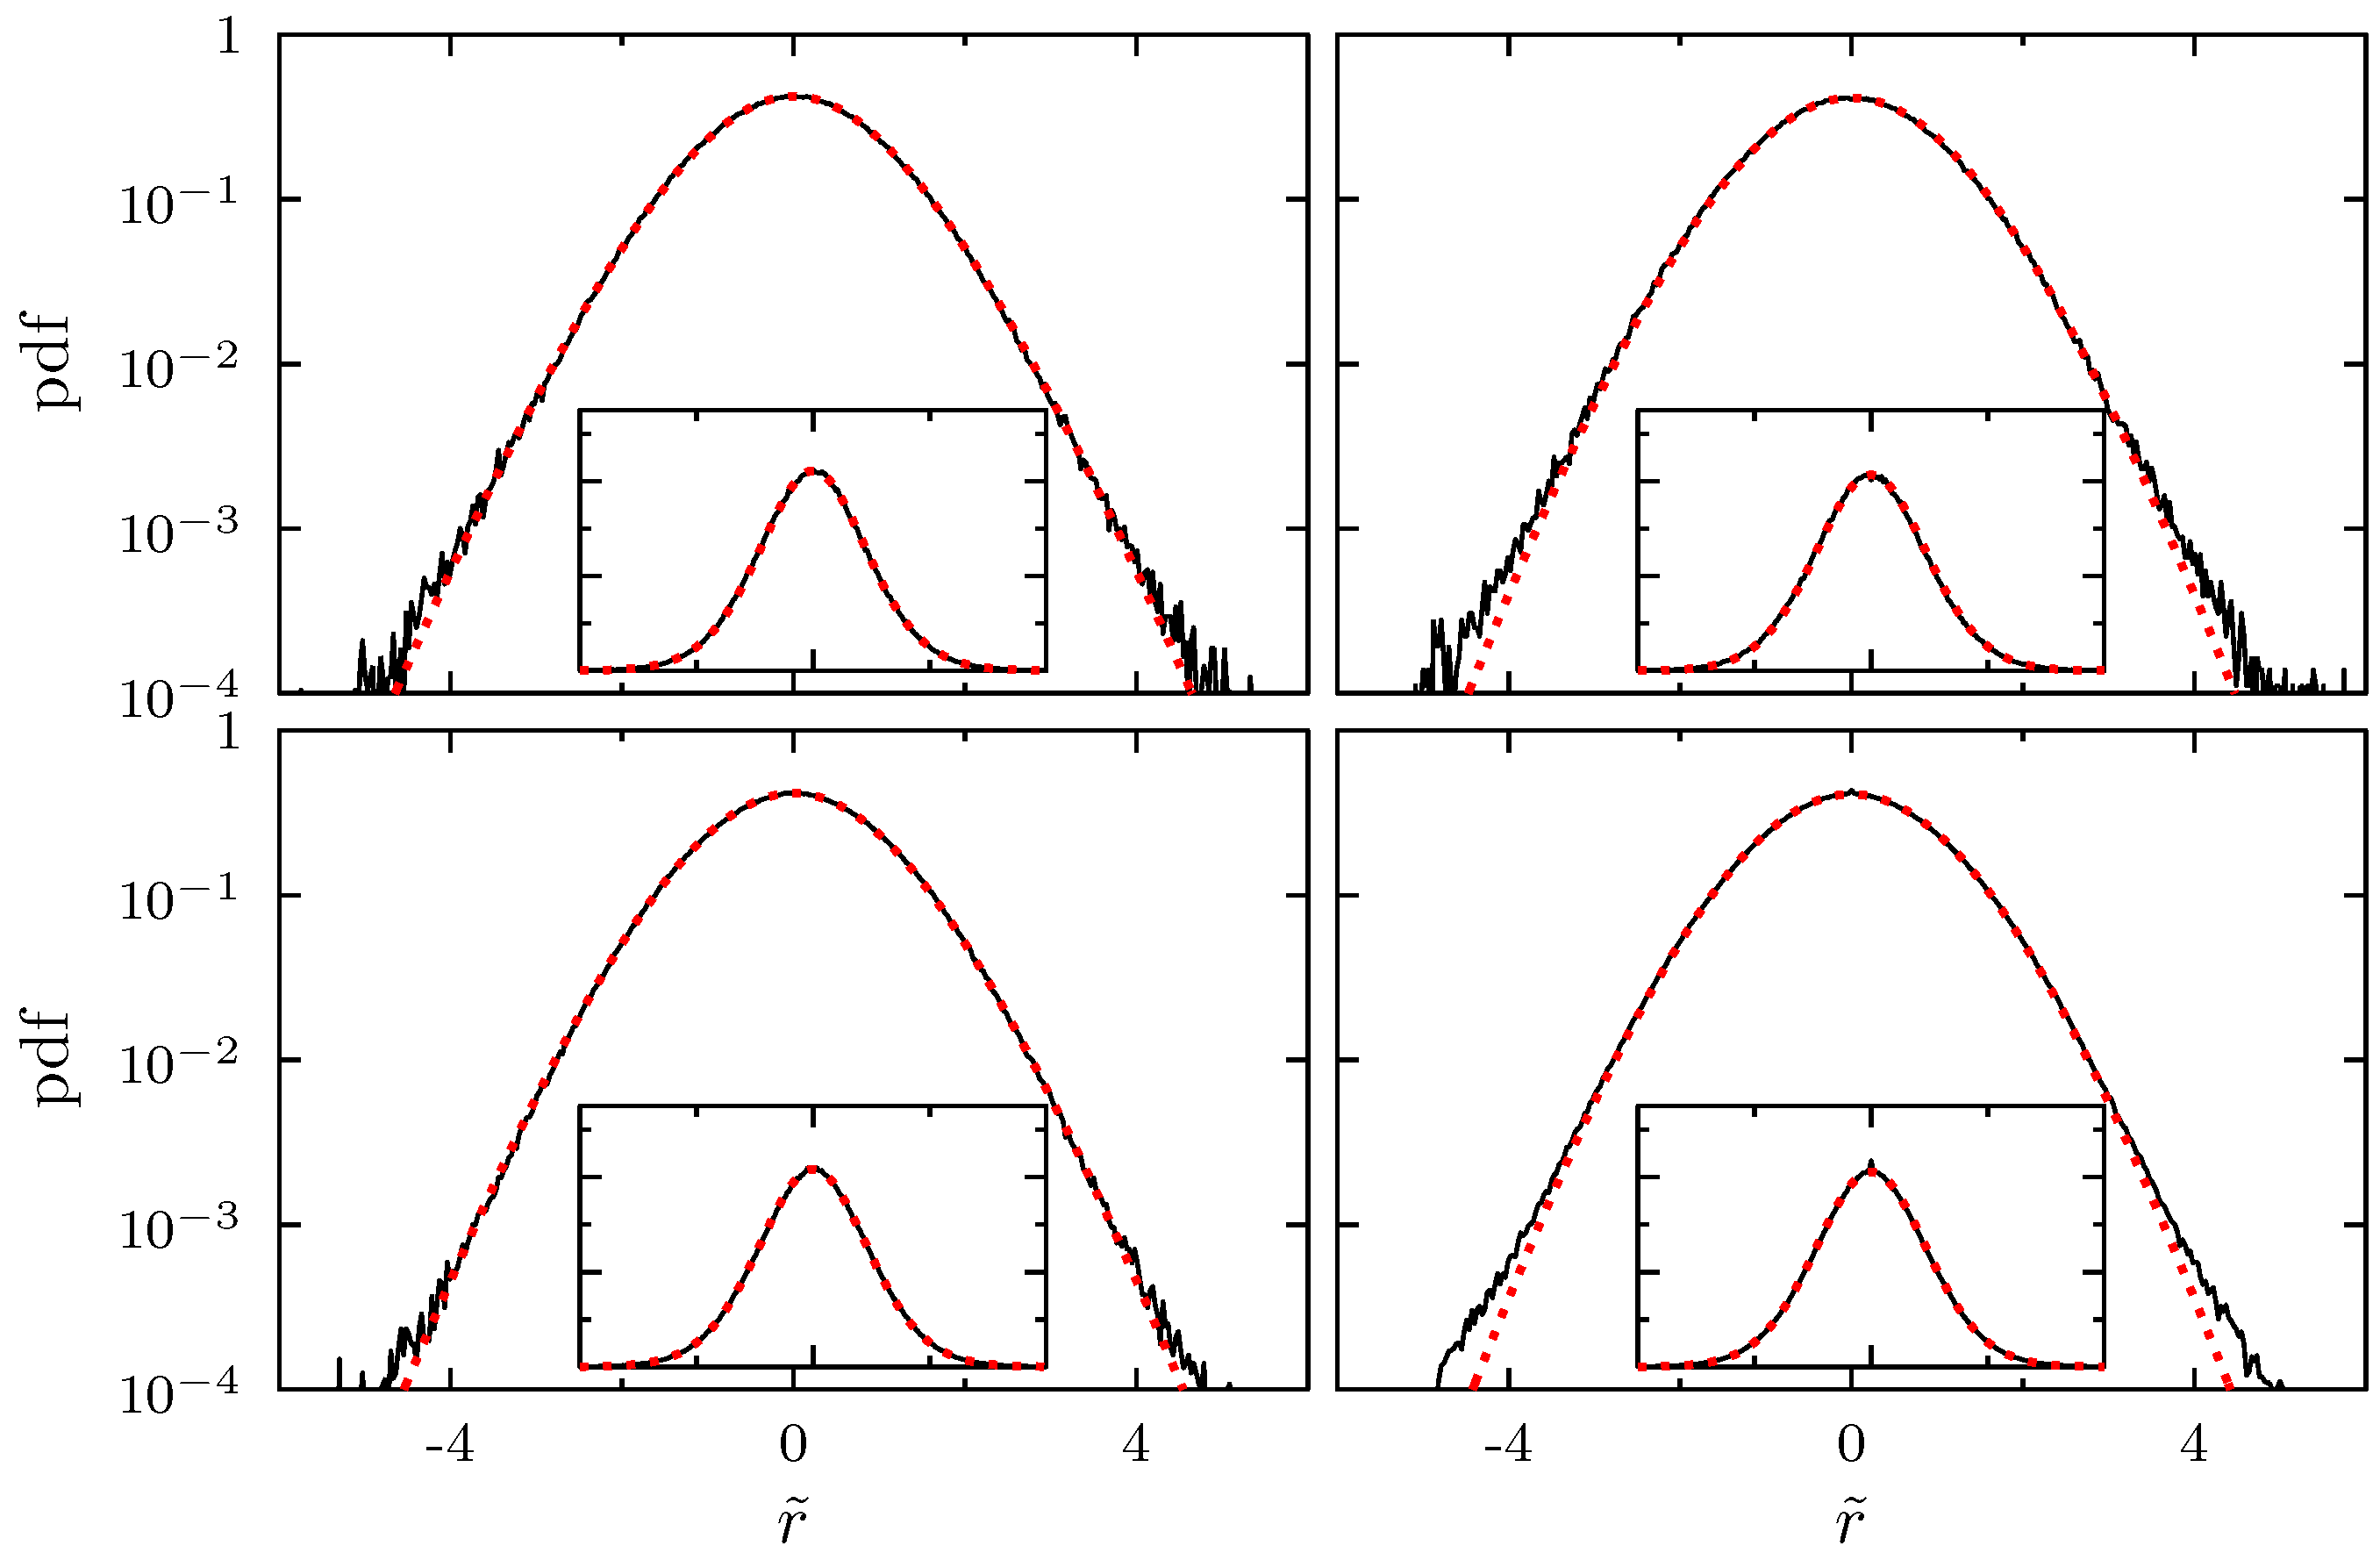
Figure 6.
Aggregated distribution for the normalized monthly returns with the effective correlation matrix on a logarithmic scale. The black line shows the empirical distribution; the red dotted line shows the theoretical results. The insets show the corresponding linear plots. Top left/right: S&P 500 (1992–2012)/(2002–2012); bottom left/right: NASDAQ (1992–2012)/(2002–2012). The average correlation coefficients are , 0.35, 0.21 and , respectively. Reproduced with permission from (Schmitt et al. 2015), Infopro Digital.

Figure 7.
Average portfolio loss distribution for different portfolio sizes of , and the limiting case . At the top, the maturity time is one month; at the bottom, it is one year. Reproduced with permission from (Schmitt et al. 2015), Infopro Digital.
Figure 7.
Average portfolio loss distribution for different portfolio sizes of , and the limiting case . At the top, the maturity time is one month; at the bottom, it is one year. Reproduced with permission from (Schmitt et al. 2015), Infopro Digital.

Figure 8.
Average loss distribution for different parameters taken from Table 1. The dashed line corresponds to the calm period 2002–2004; the solid line corresponds to the global financial crisis 2008–2010.
Figure 8.
Average loss distribution for different parameters taken from Table 1. The dashed line corresponds to the calm period 2002–2004; the solid line corresponds to the global financial crisis 2008–2010.
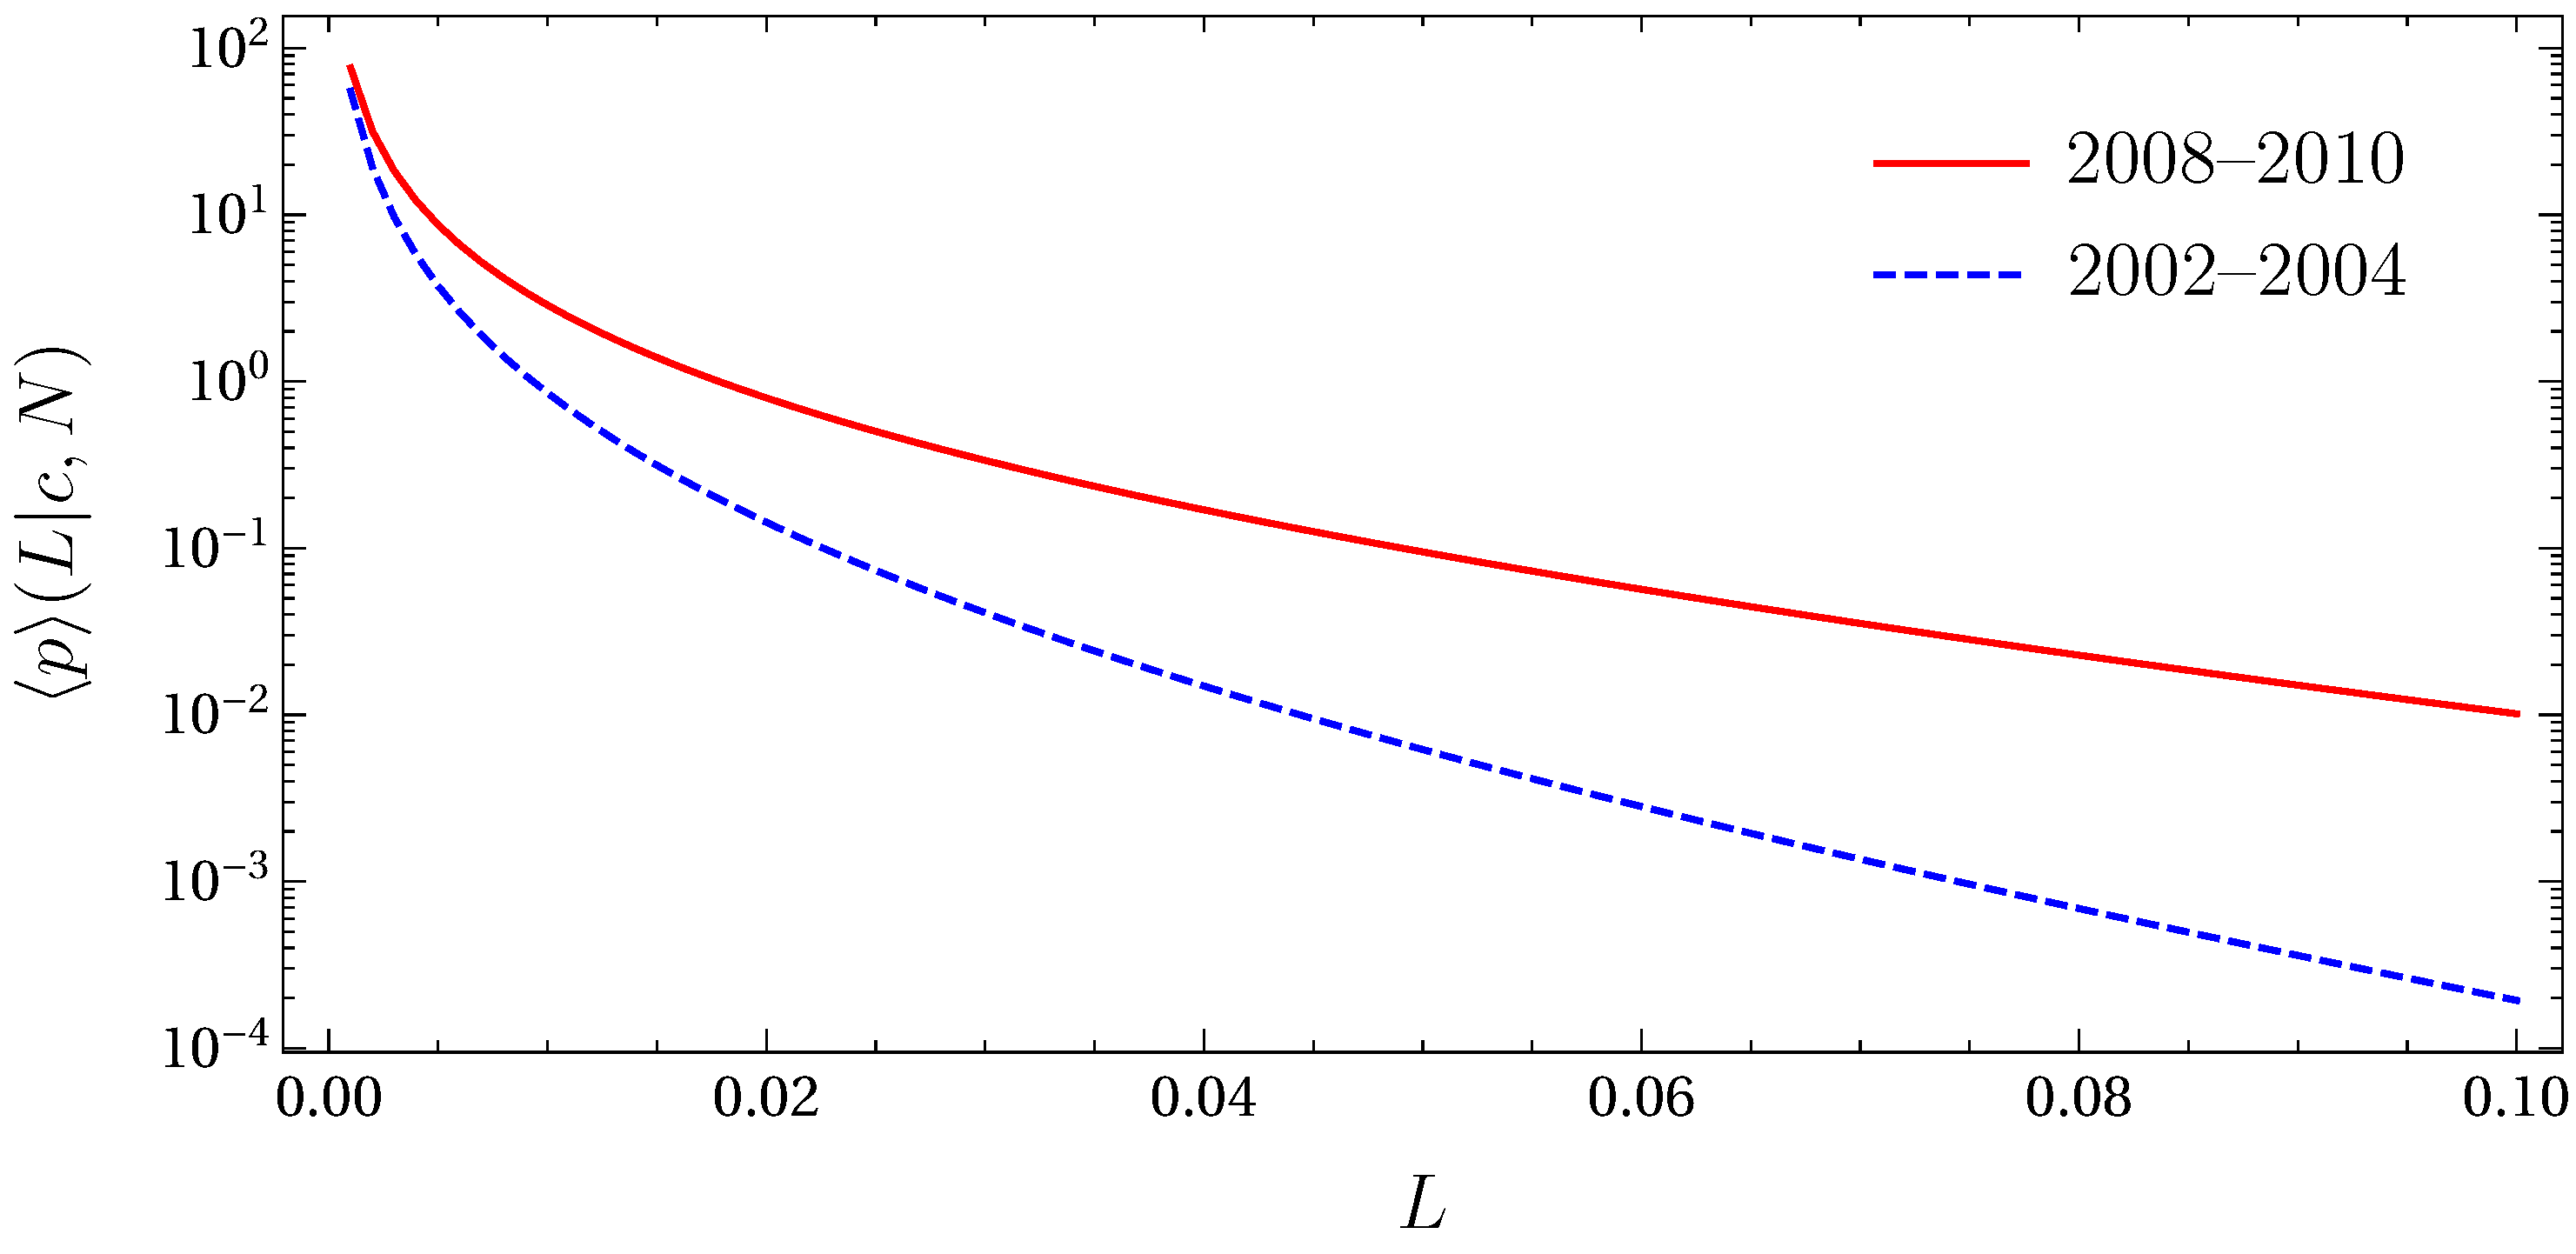
Figure 9.
Underestimation of the VaR if fluctuating asset correlations are not taken into account. The empirical covariance matrix is used and compared for different values of N. Reproduced with permission from (Schmitt et al. 2015), Infopro Digital.
Figure 9.
Underestimation of the VaR if fluctuating asset correlations are not taken into account. The empirical covariance matrix is used and compared for different values of N. Reproduced with permission from (Schmitt et al. 2015), Infopro Digital.
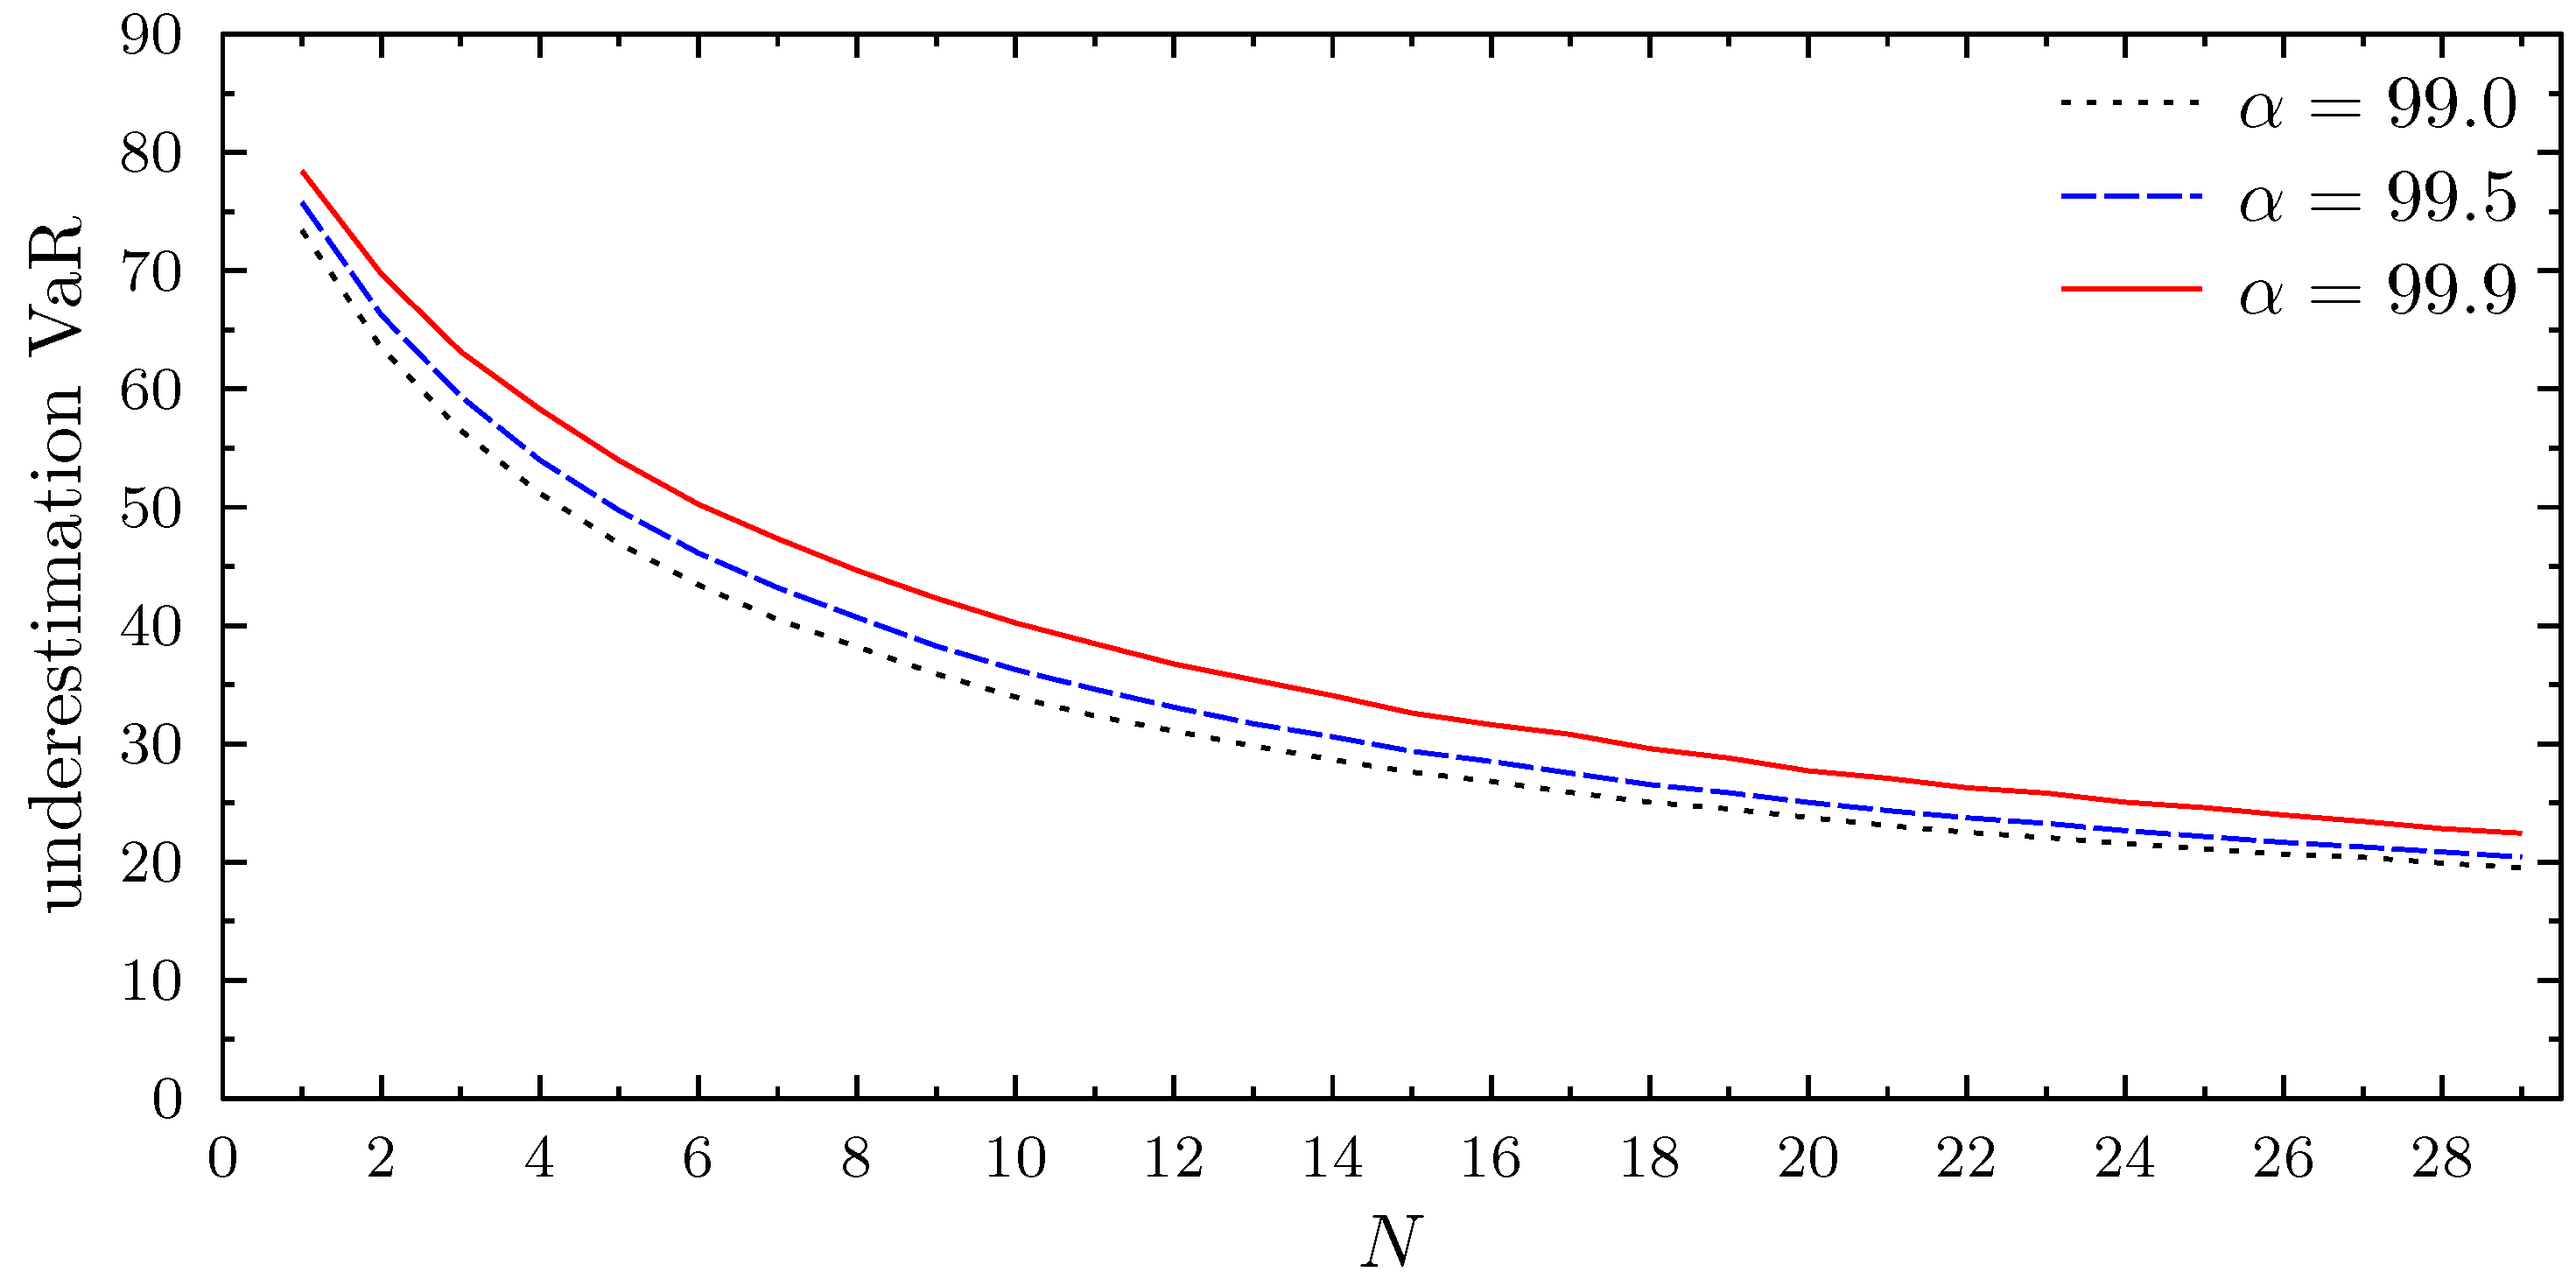
Figure 10.
Heterogeneous correlation matrix illustrating a financial market. The two rimmed squares correspond to two non-overlapping credit portfolios. Taken from (Sicking et al. 2018).
Figure 10.
Heterogeneous correlation matrix illustrating a financial market. The two rimmed squares correspond to two non-overlapping credit portfolios. Taken from (Sicking et al. 2018).
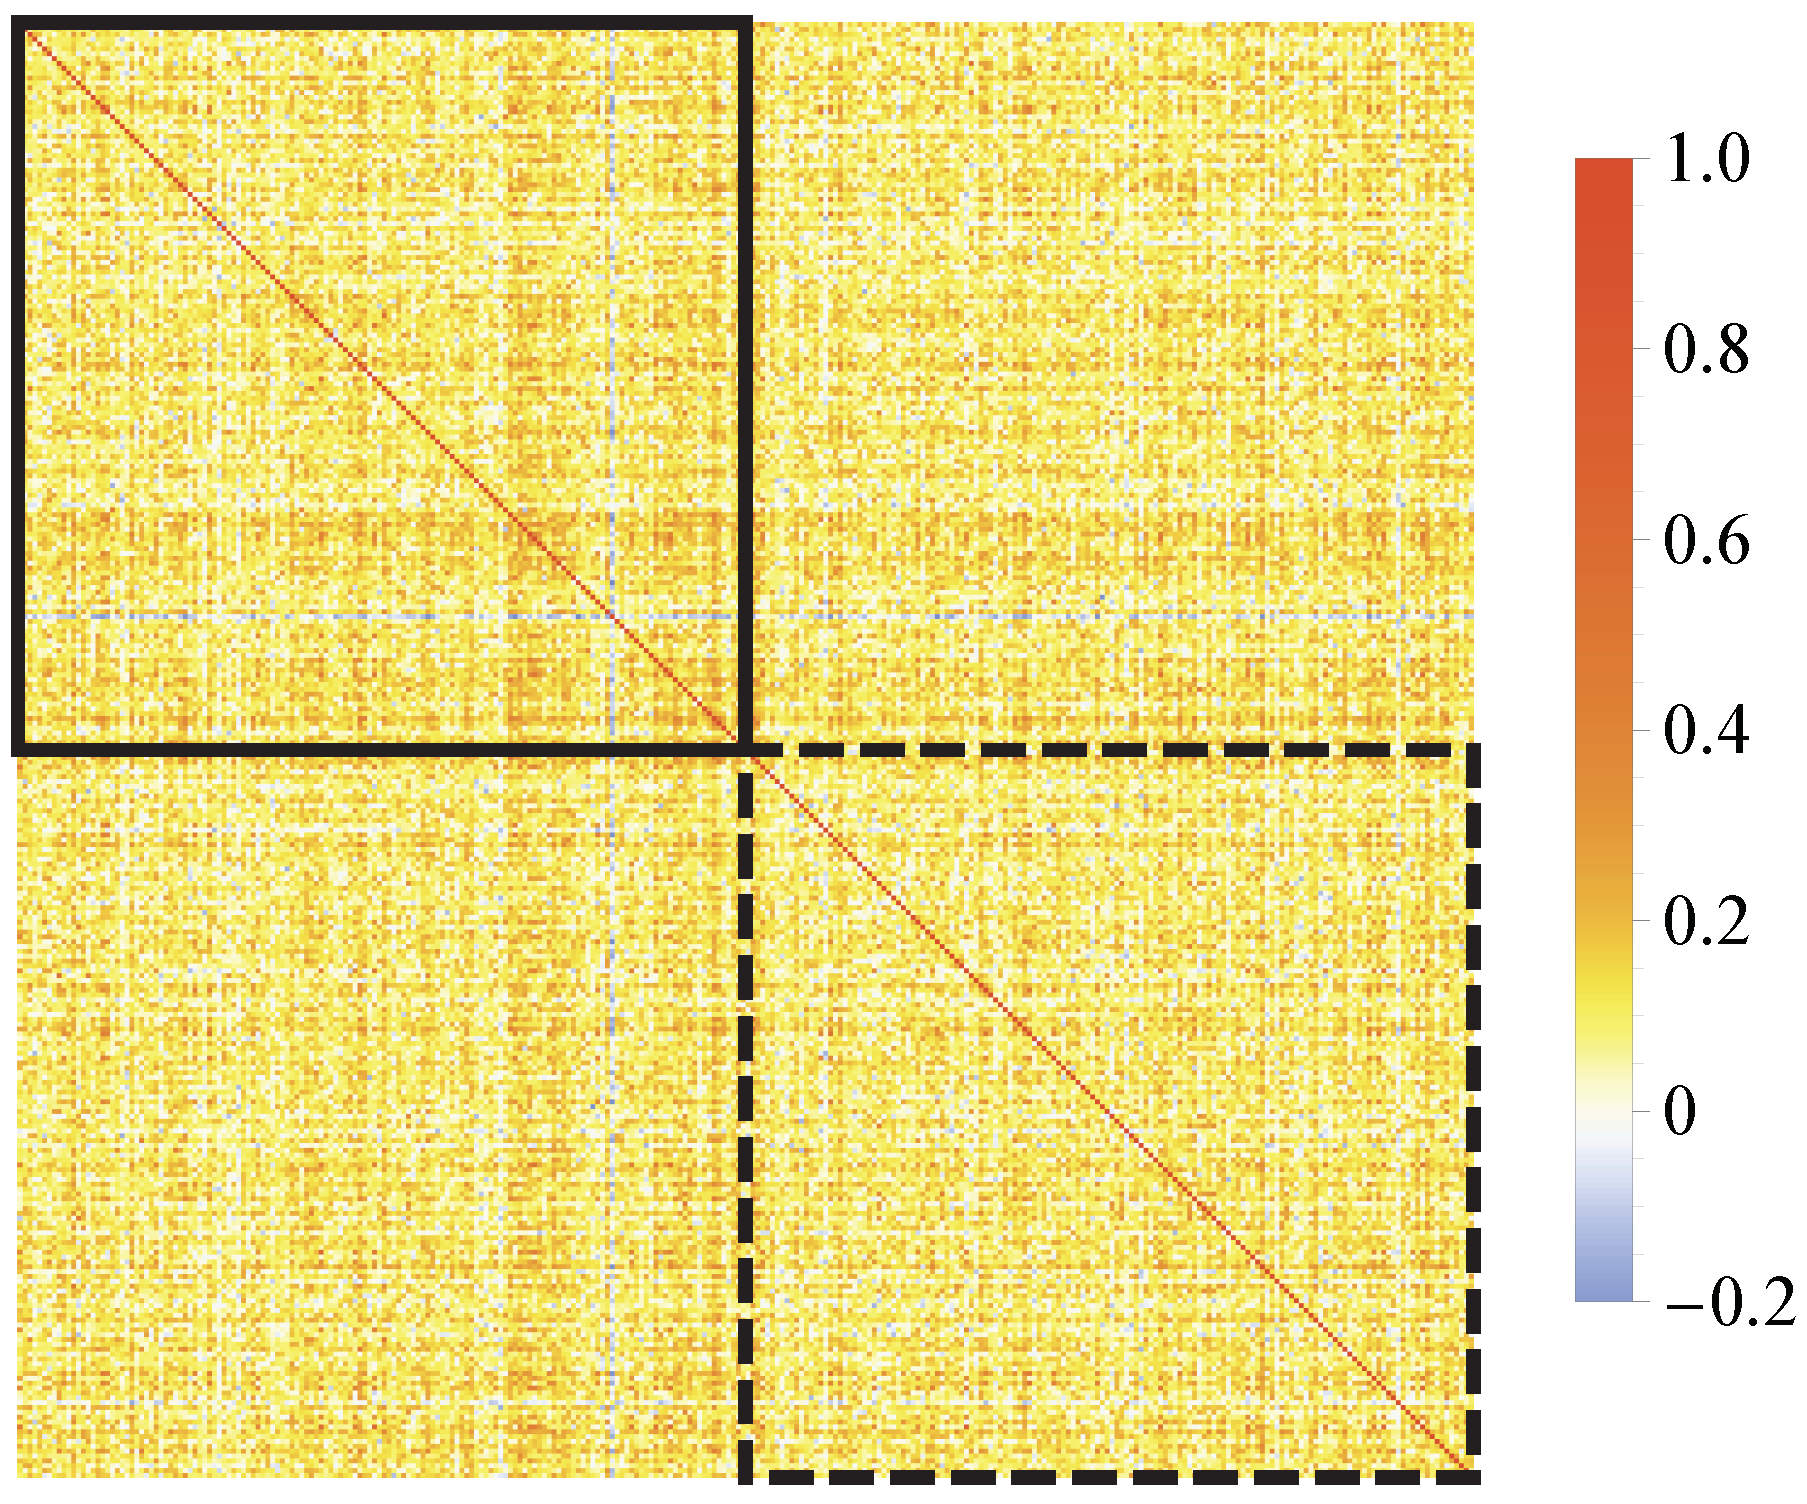
Figure 11.
Average loss copula histograms for homogeneous portfolios with vanishing average asset correlations . The asset values are multivariate log-normal () in the top figure and multivariate heavy-tailed () in the bottom figure. The color bar indicates the local deviations from the corresponding Gaussian copula. Taken from (Sicking et al. 2018).
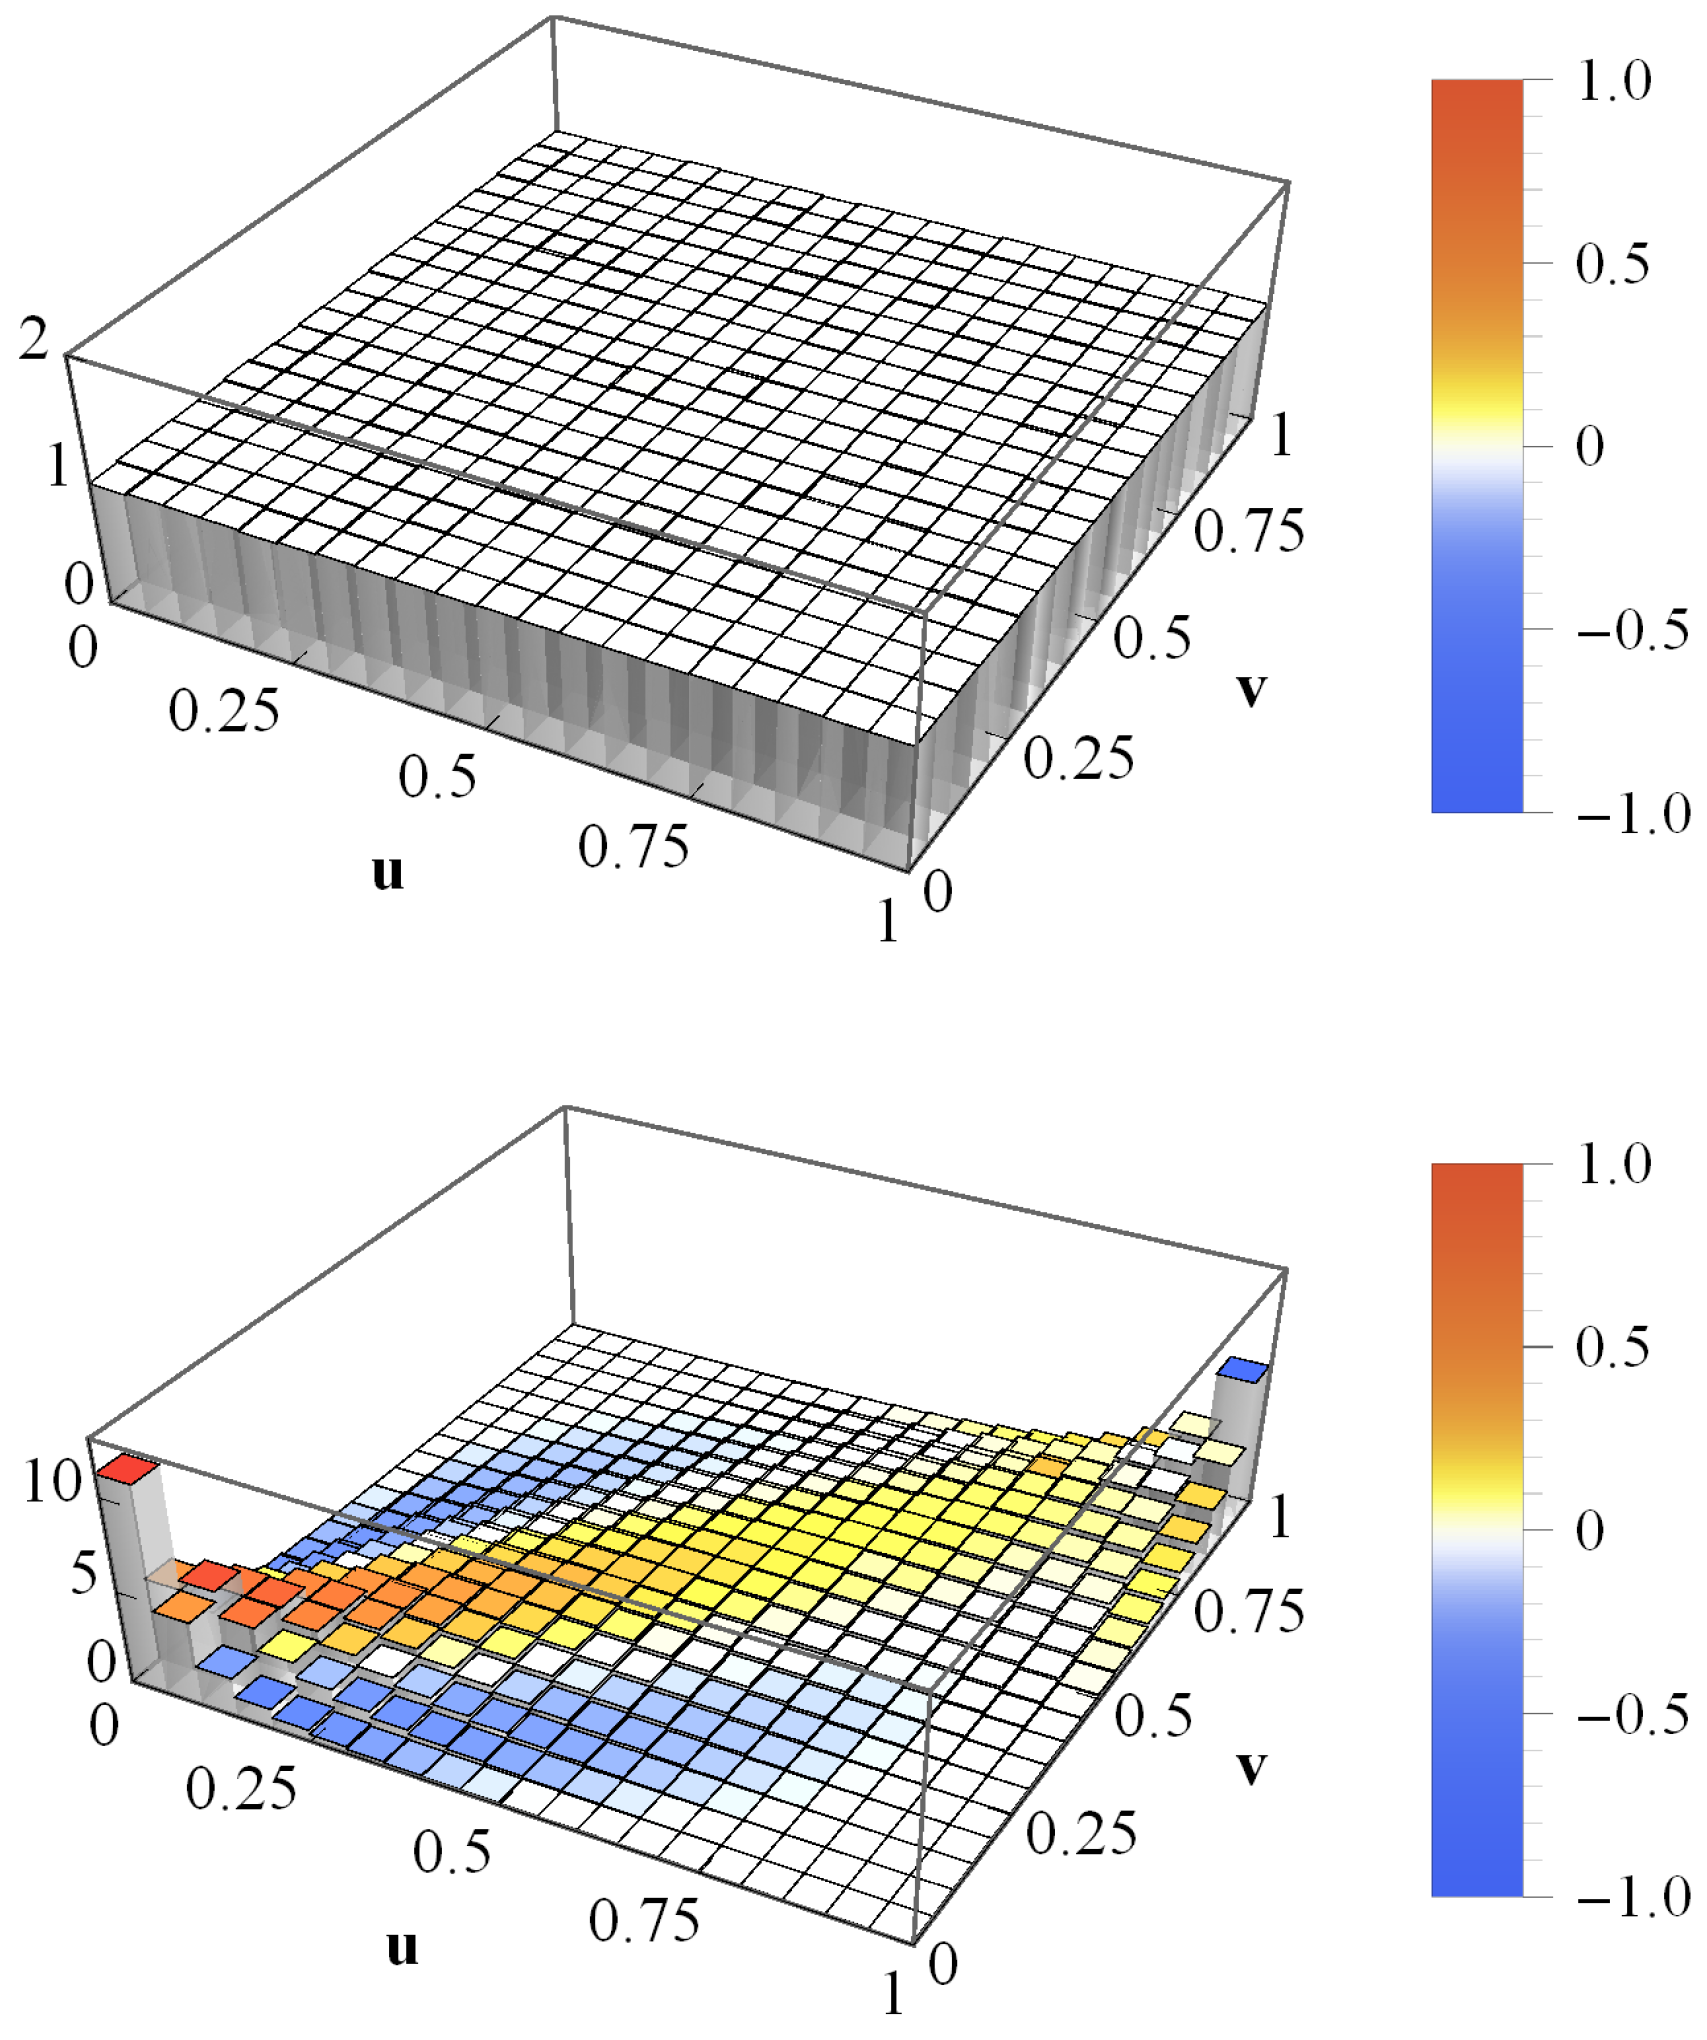
Figure 12.
Average loss copula histograms for homogeneous portfolios with asset correlations . The asset values are multivariate log-normal (). The drifts are (top), (middle) and (bottom). The color bar indicates the local deviations from the corresponding Gaussian copula. Taken from (Sicking et al. 2018).
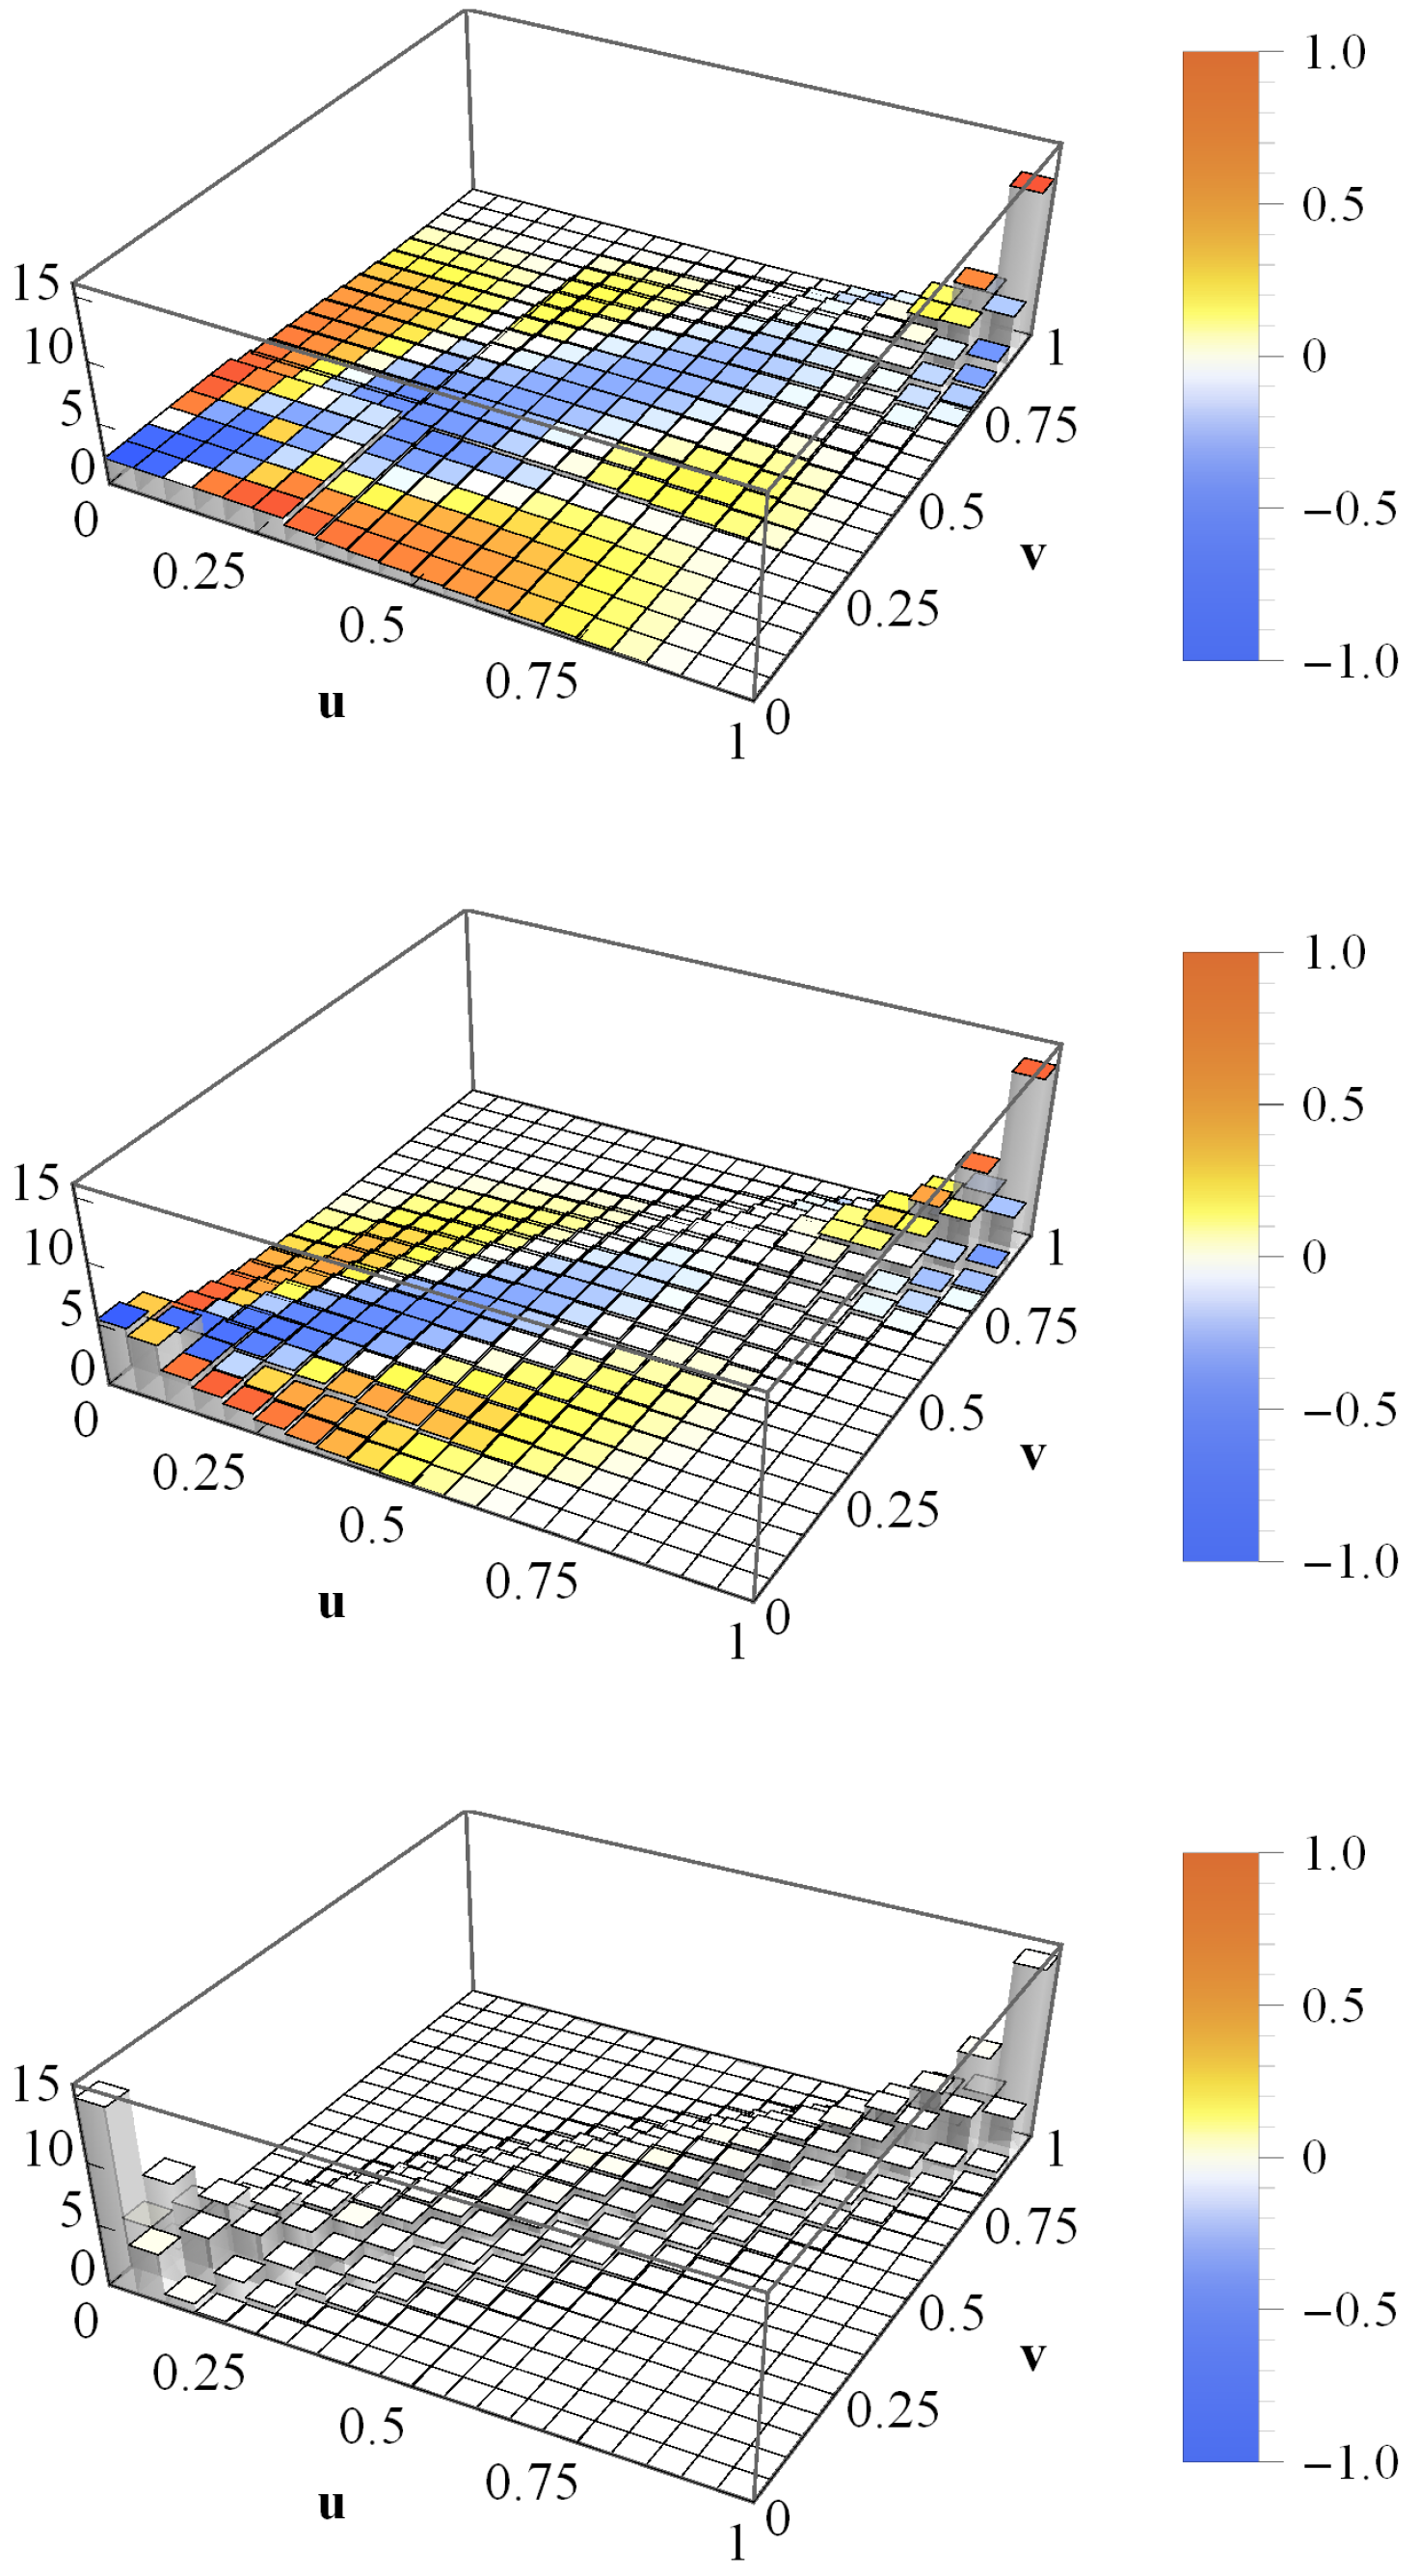
Figure 13.
Average loss copula histograms for two portfolios with heterogeneous volatilities drawn from a uniform distribution in the interval . The color bar indicates the local deviations from the corresponding Gaussian copula. Taken from (Sicking et al. 2018).
Figure 13.
Average loss copula histograms for two portfolios with heterogeneous volatilities drawn from a uniform distribution in the interval . The color bar indicates the local deviations from the corresponding Gaussian copula. Taken from (Sicking et al. 2018).

Figure 14.
Time averaged loss copula histograms for two empirical copulas of size . The asset values are multivariate log-normal (). Top: Portfolio 1 is always drawn from S&P 500 and Portfolio 2 from Nikkei 225; middle: both portfolios are drawn from S&P 500; bottom: both portfolios are drawn from Nikkei 225. The color bar indicates the local deviations from the corresponding Gaussian copula. Taken from (Sicking et al. 2018).
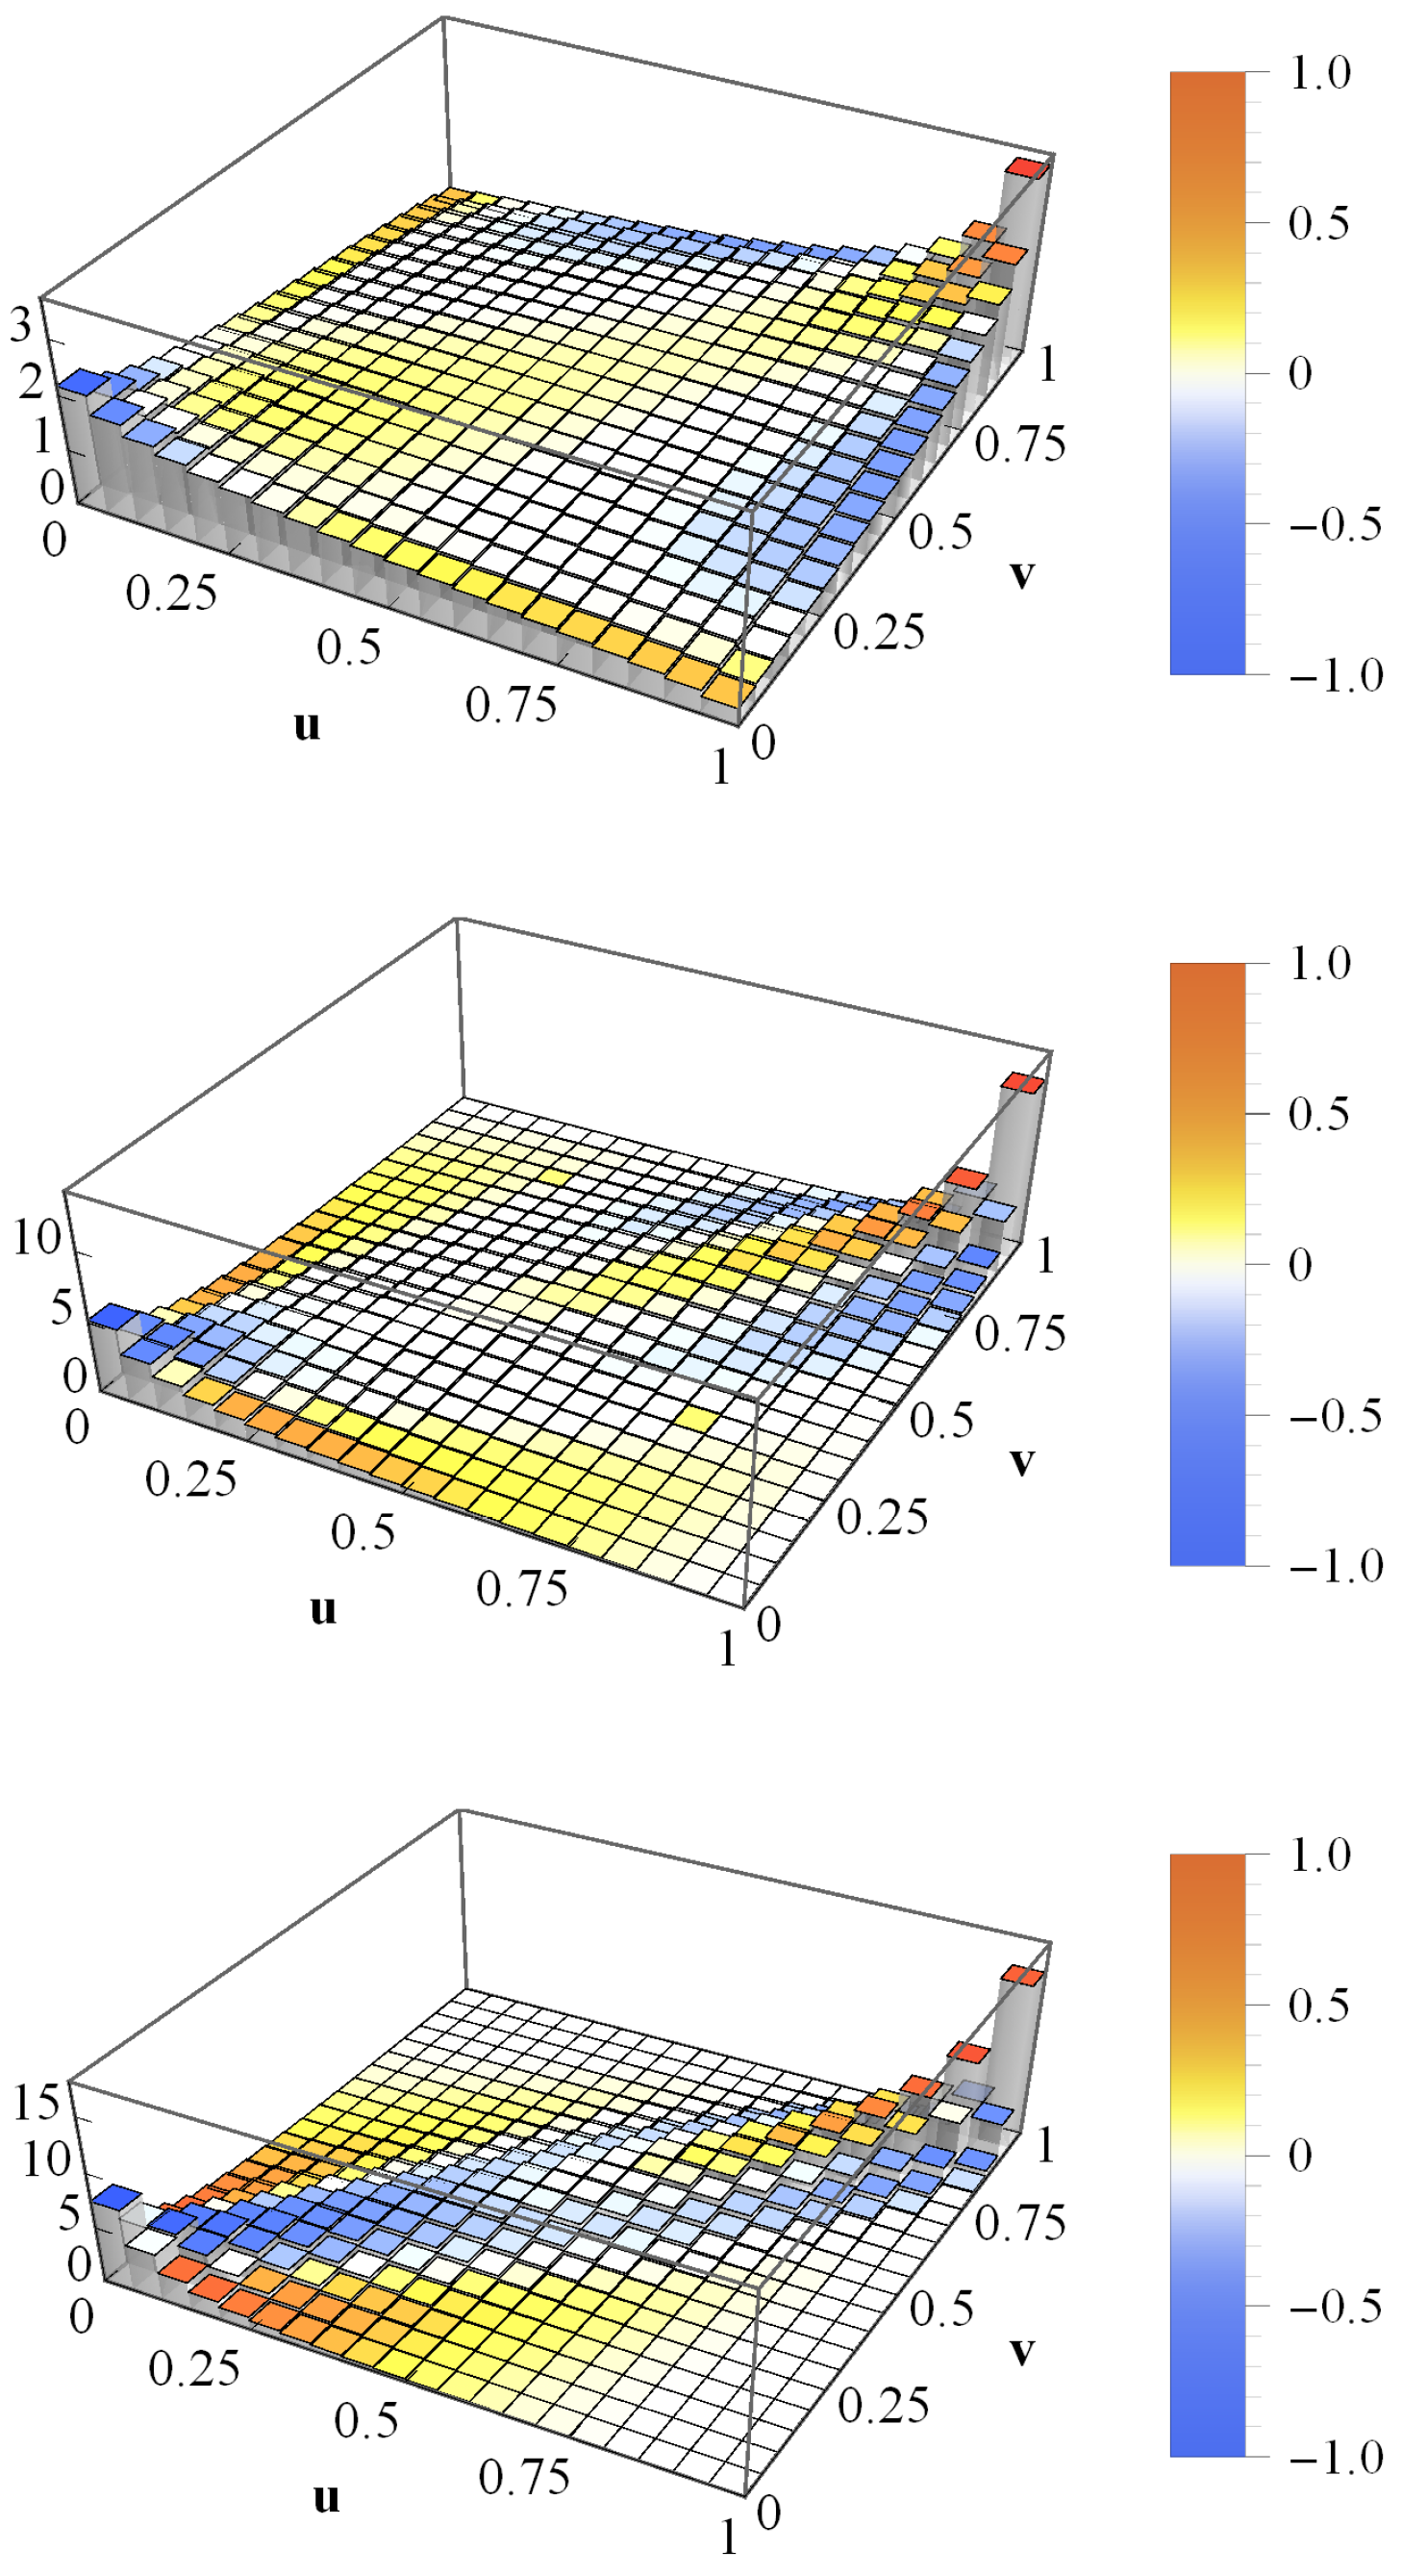

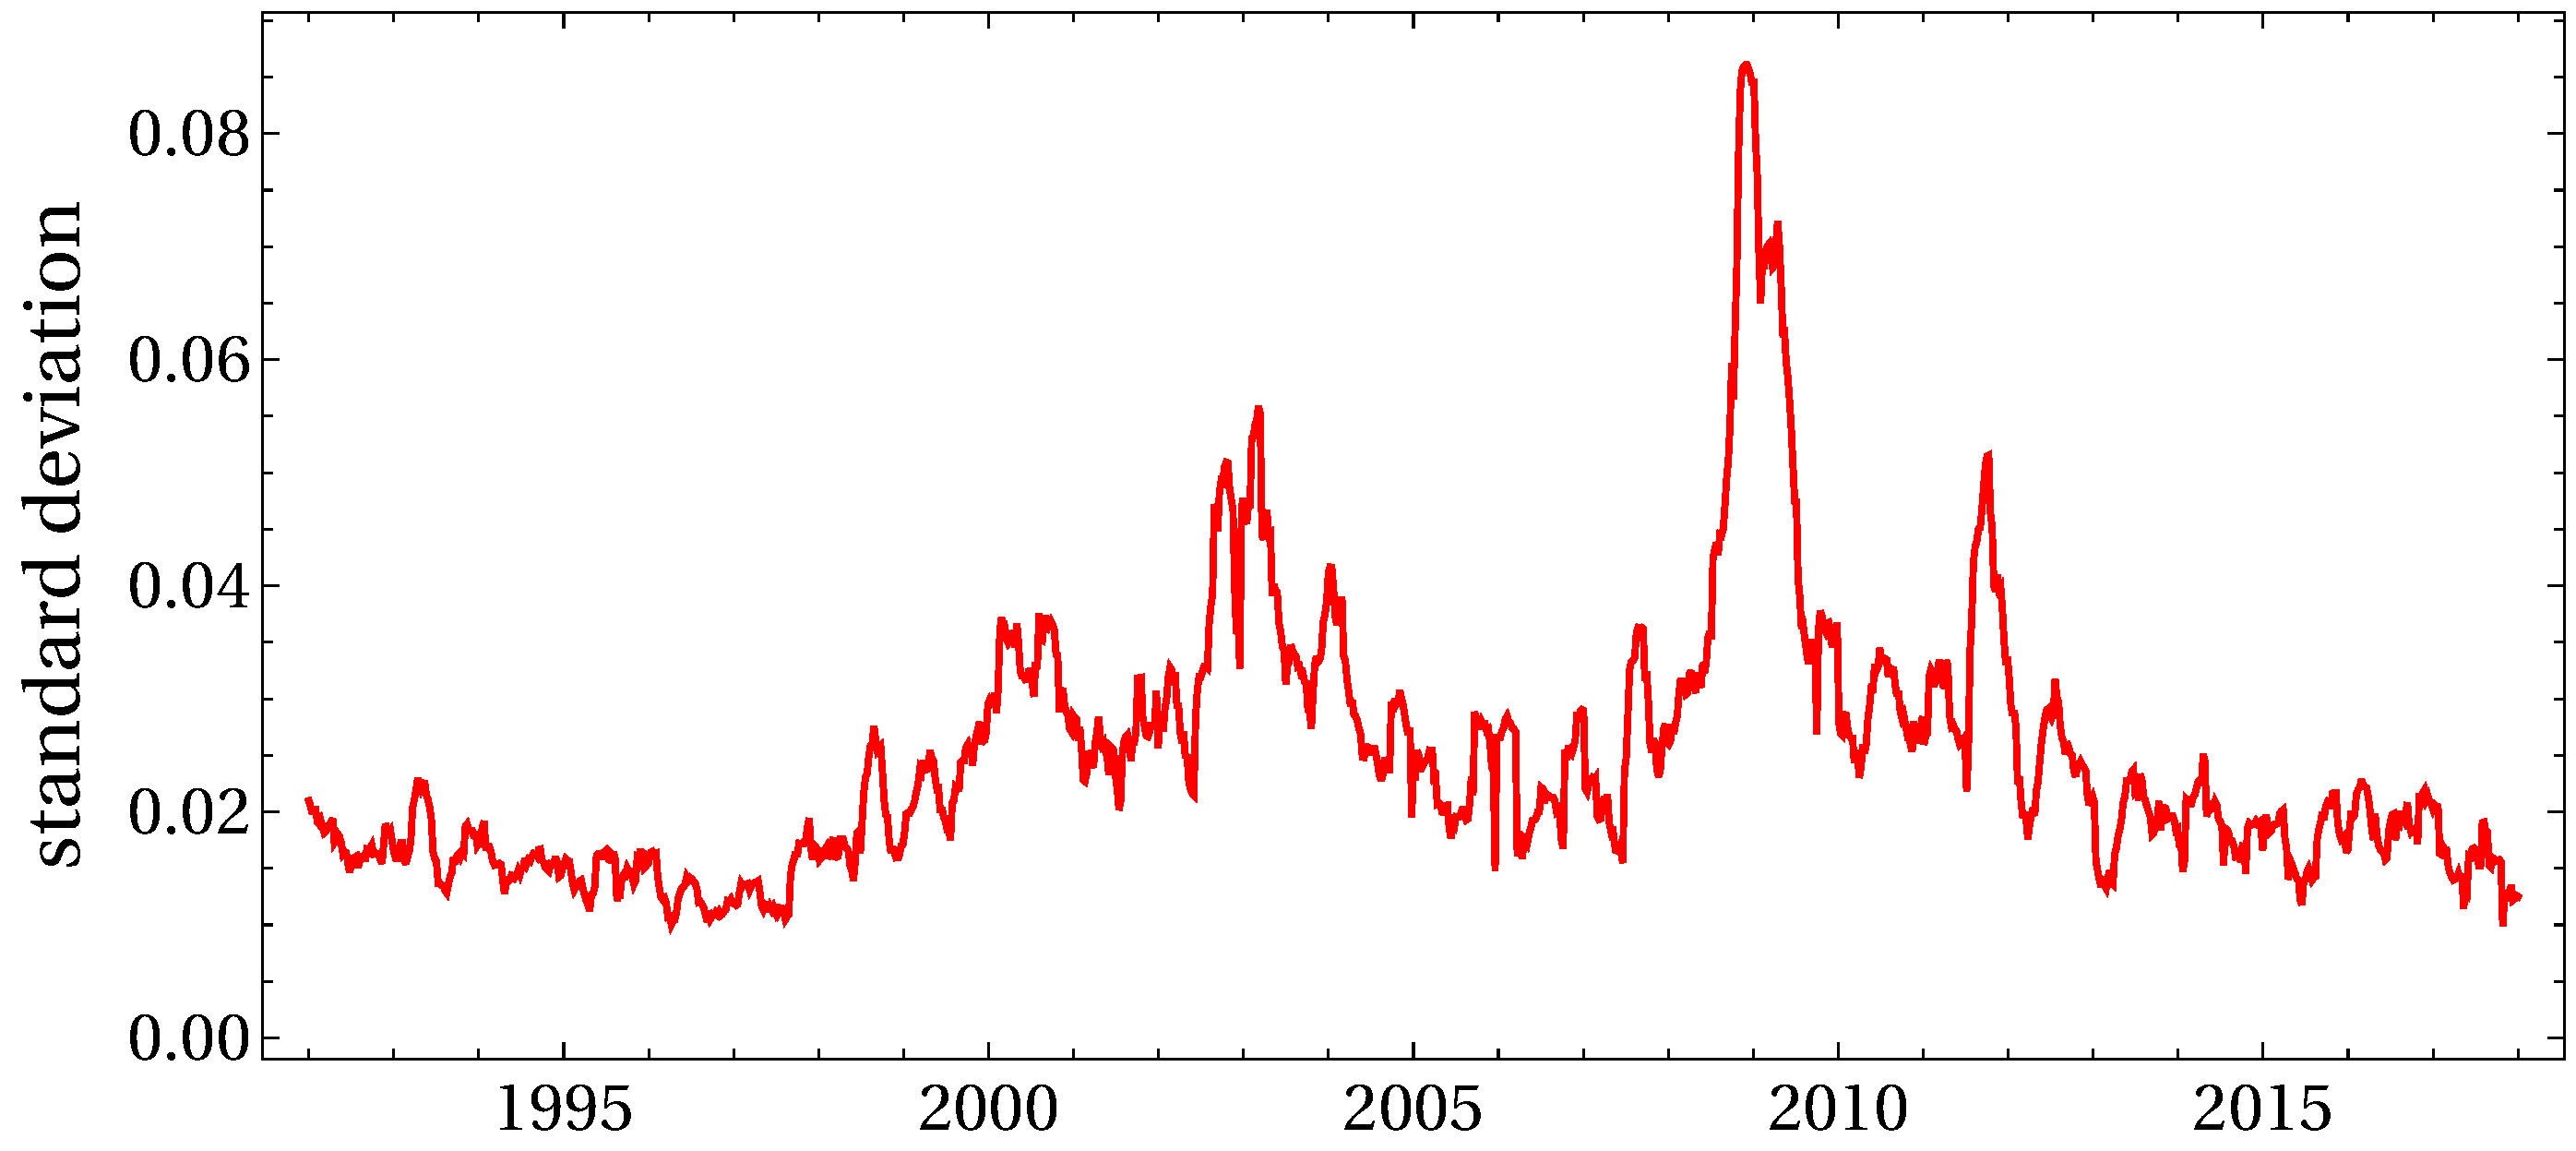
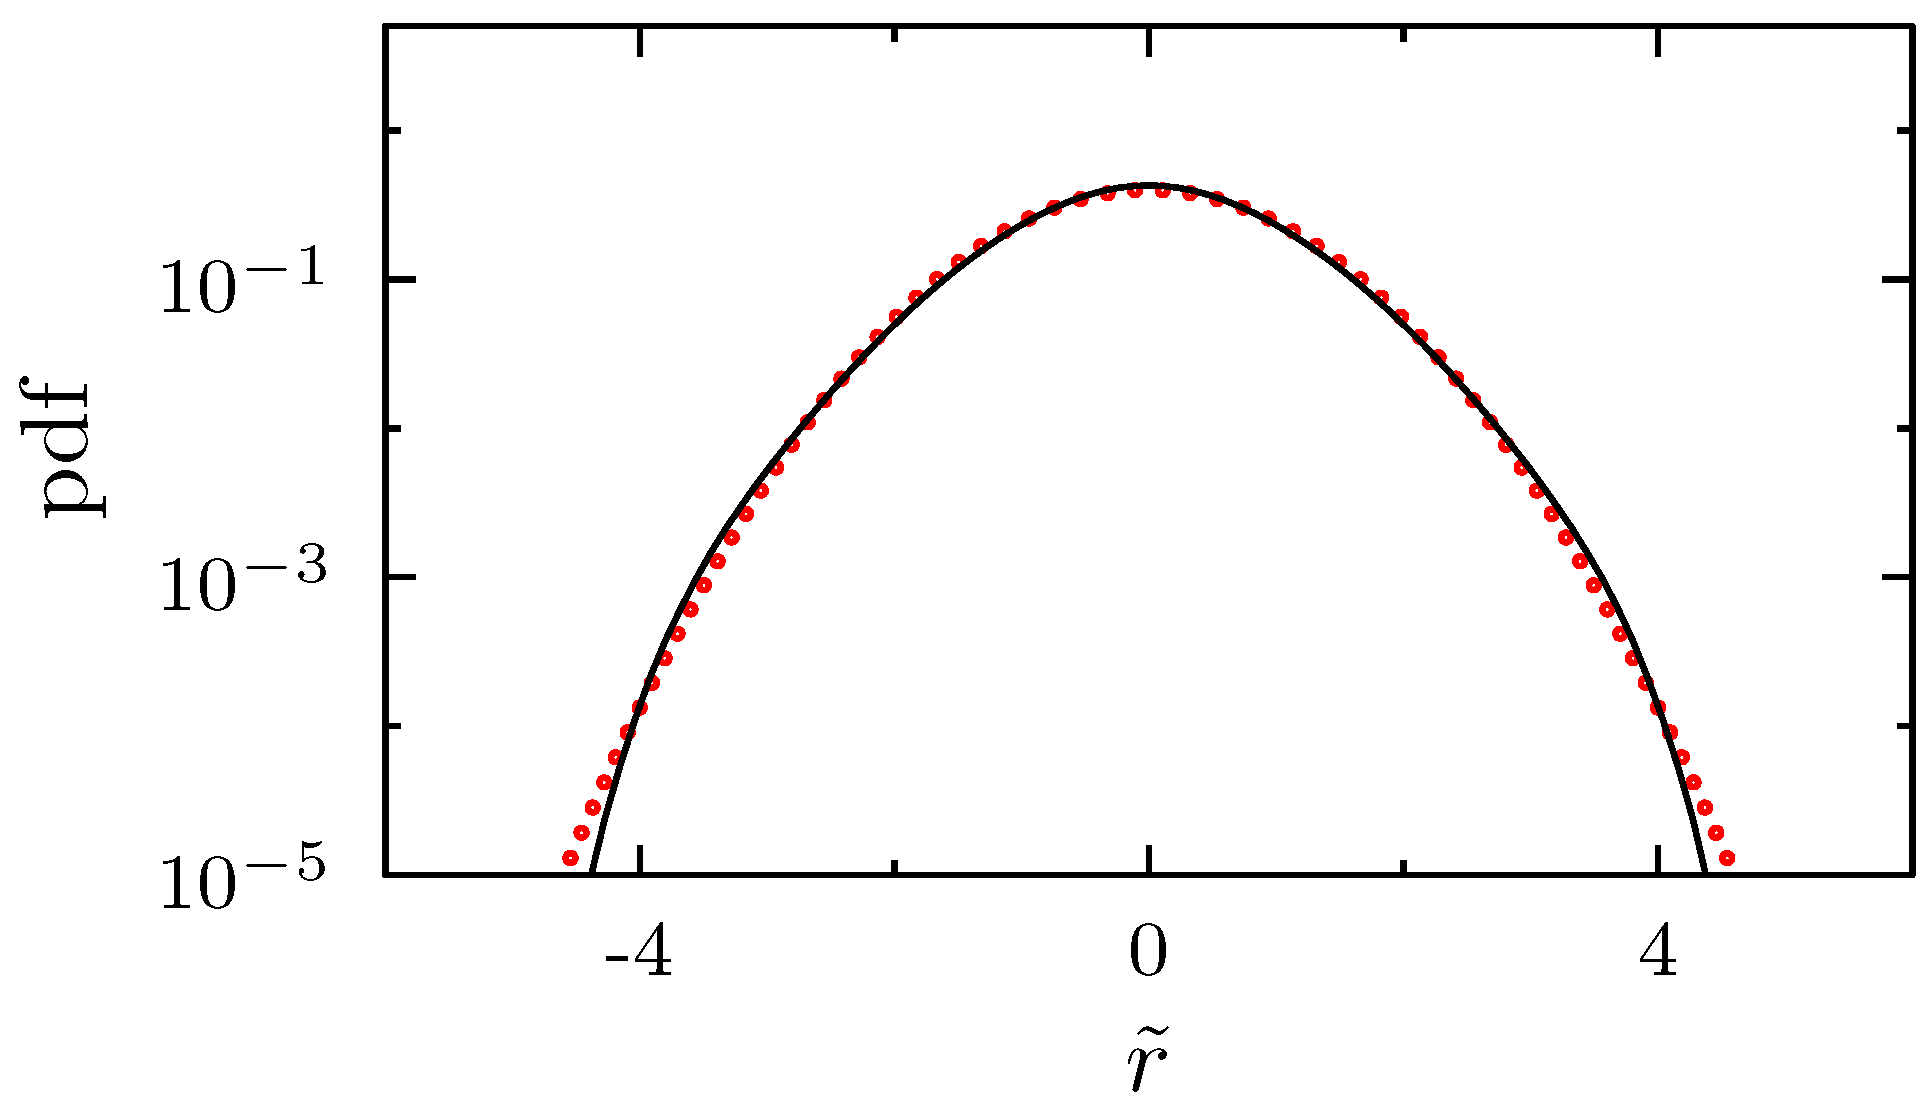
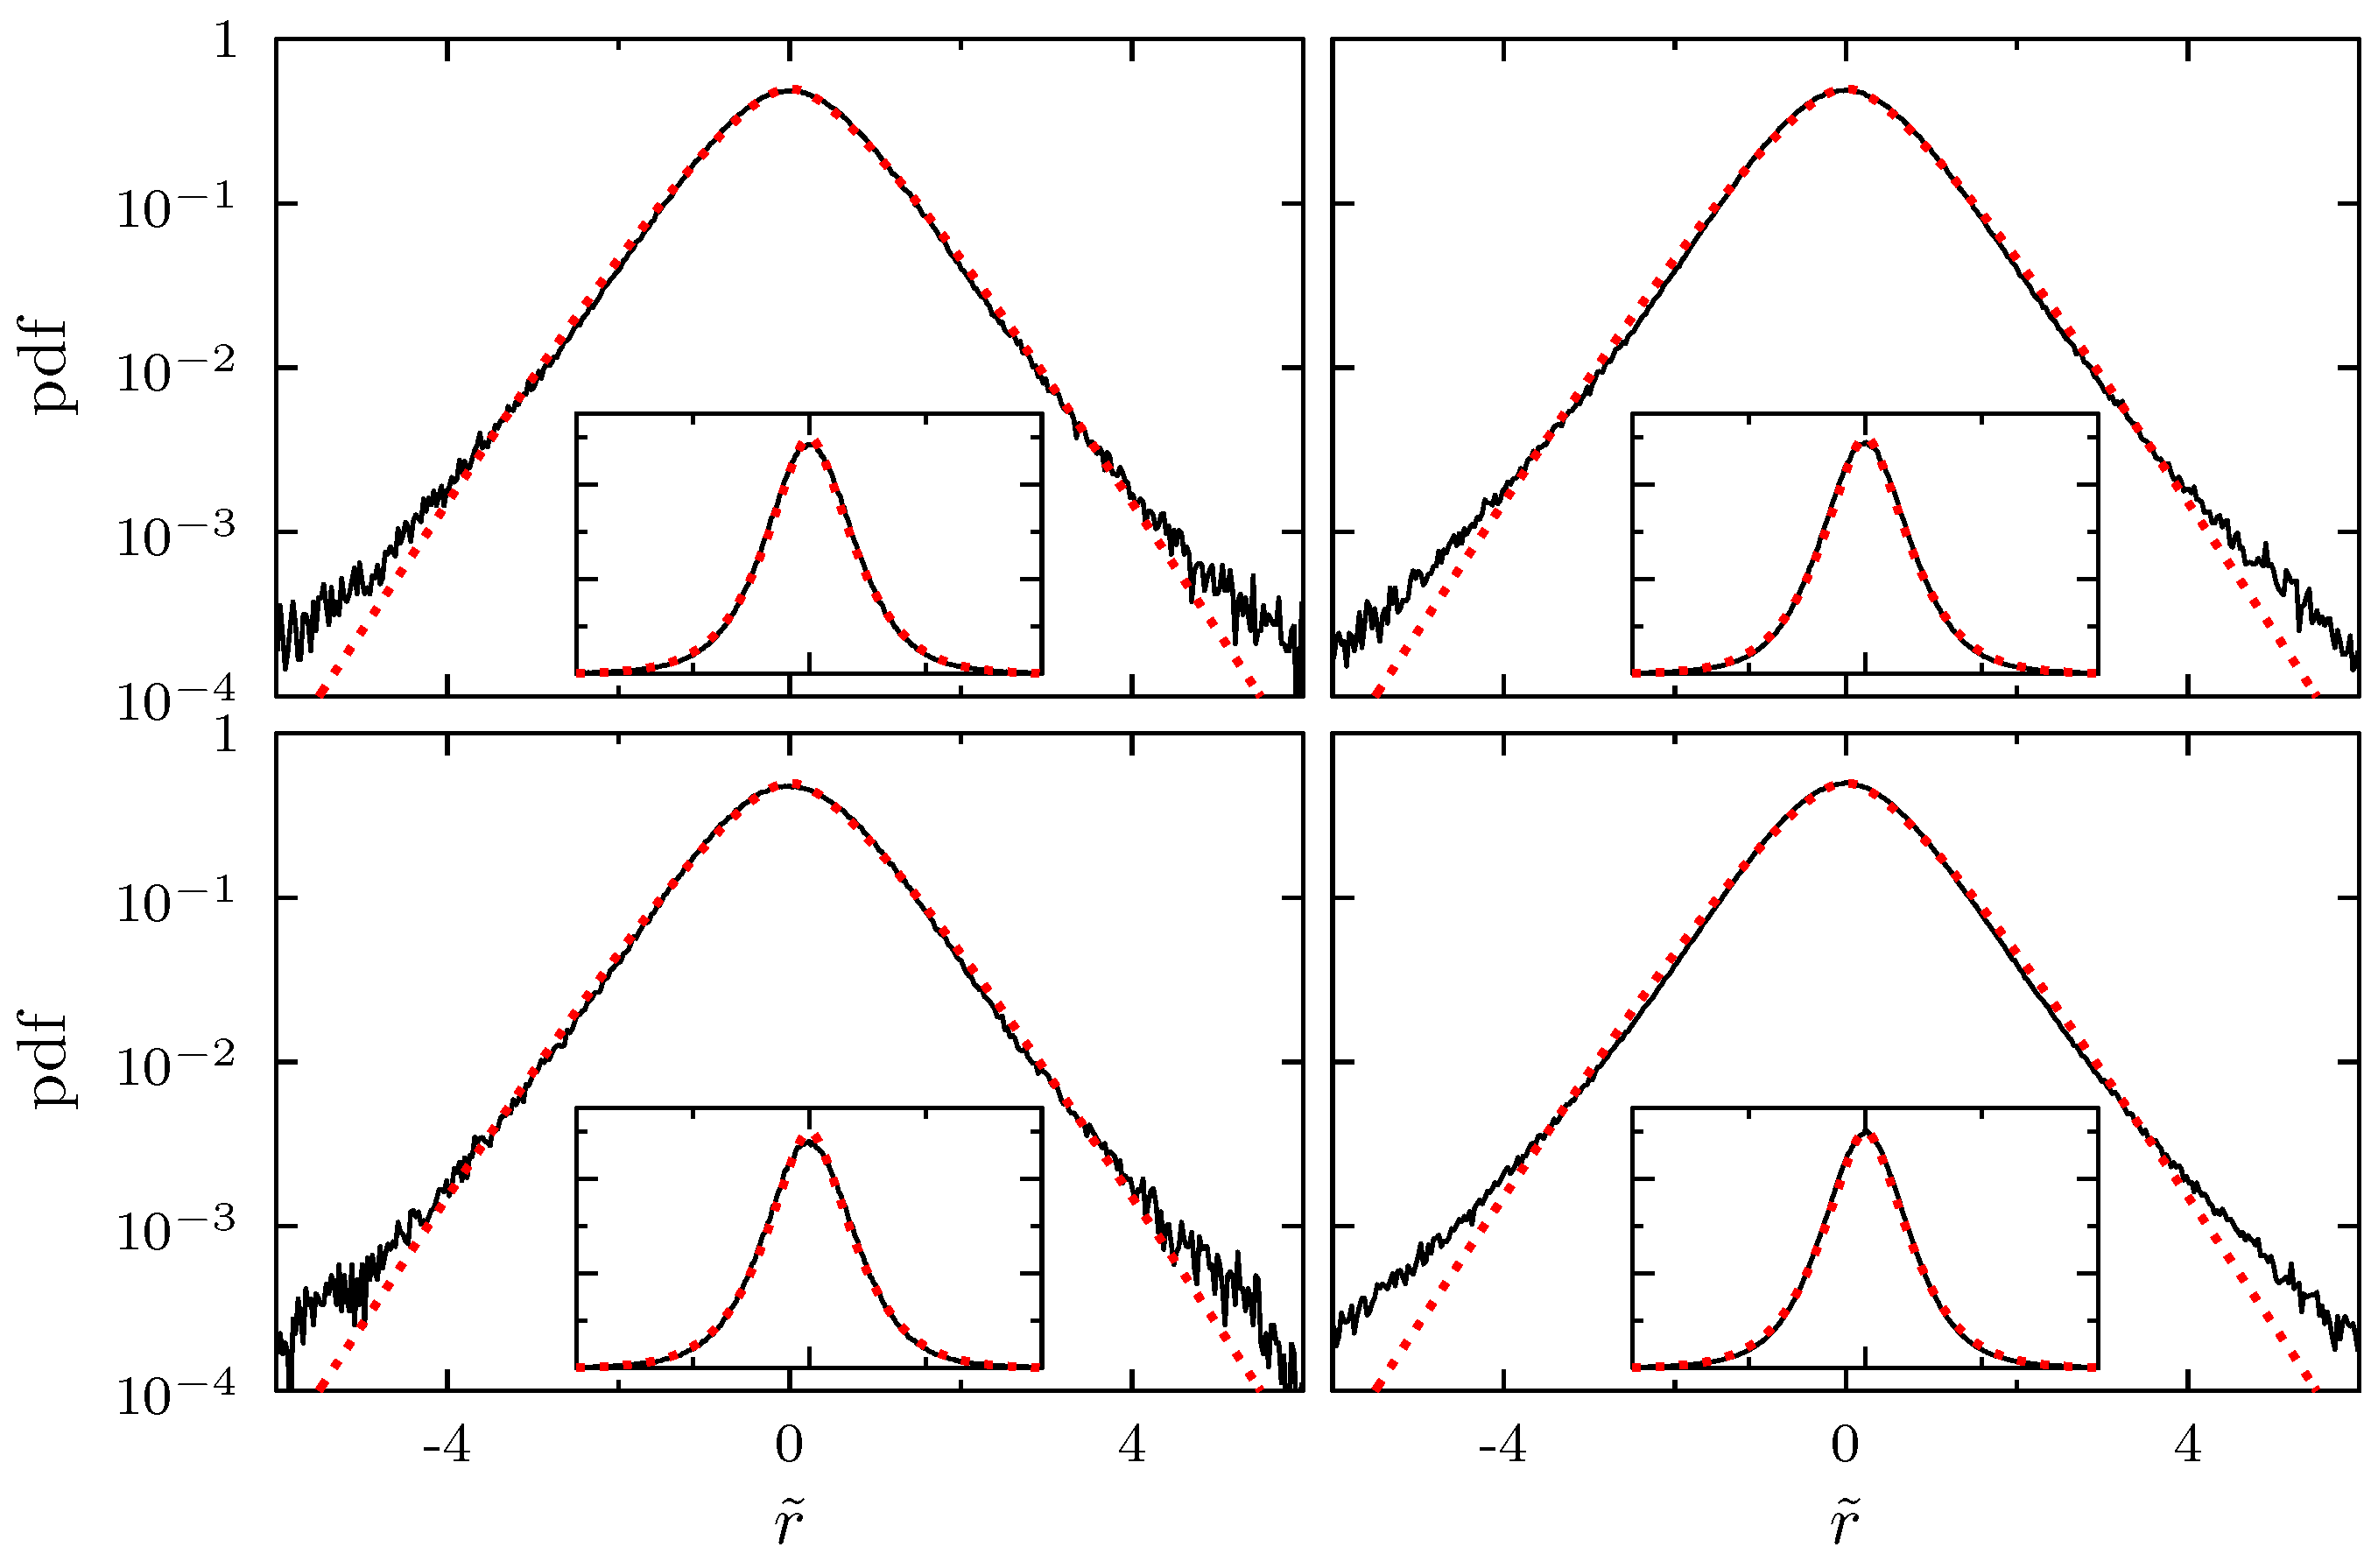
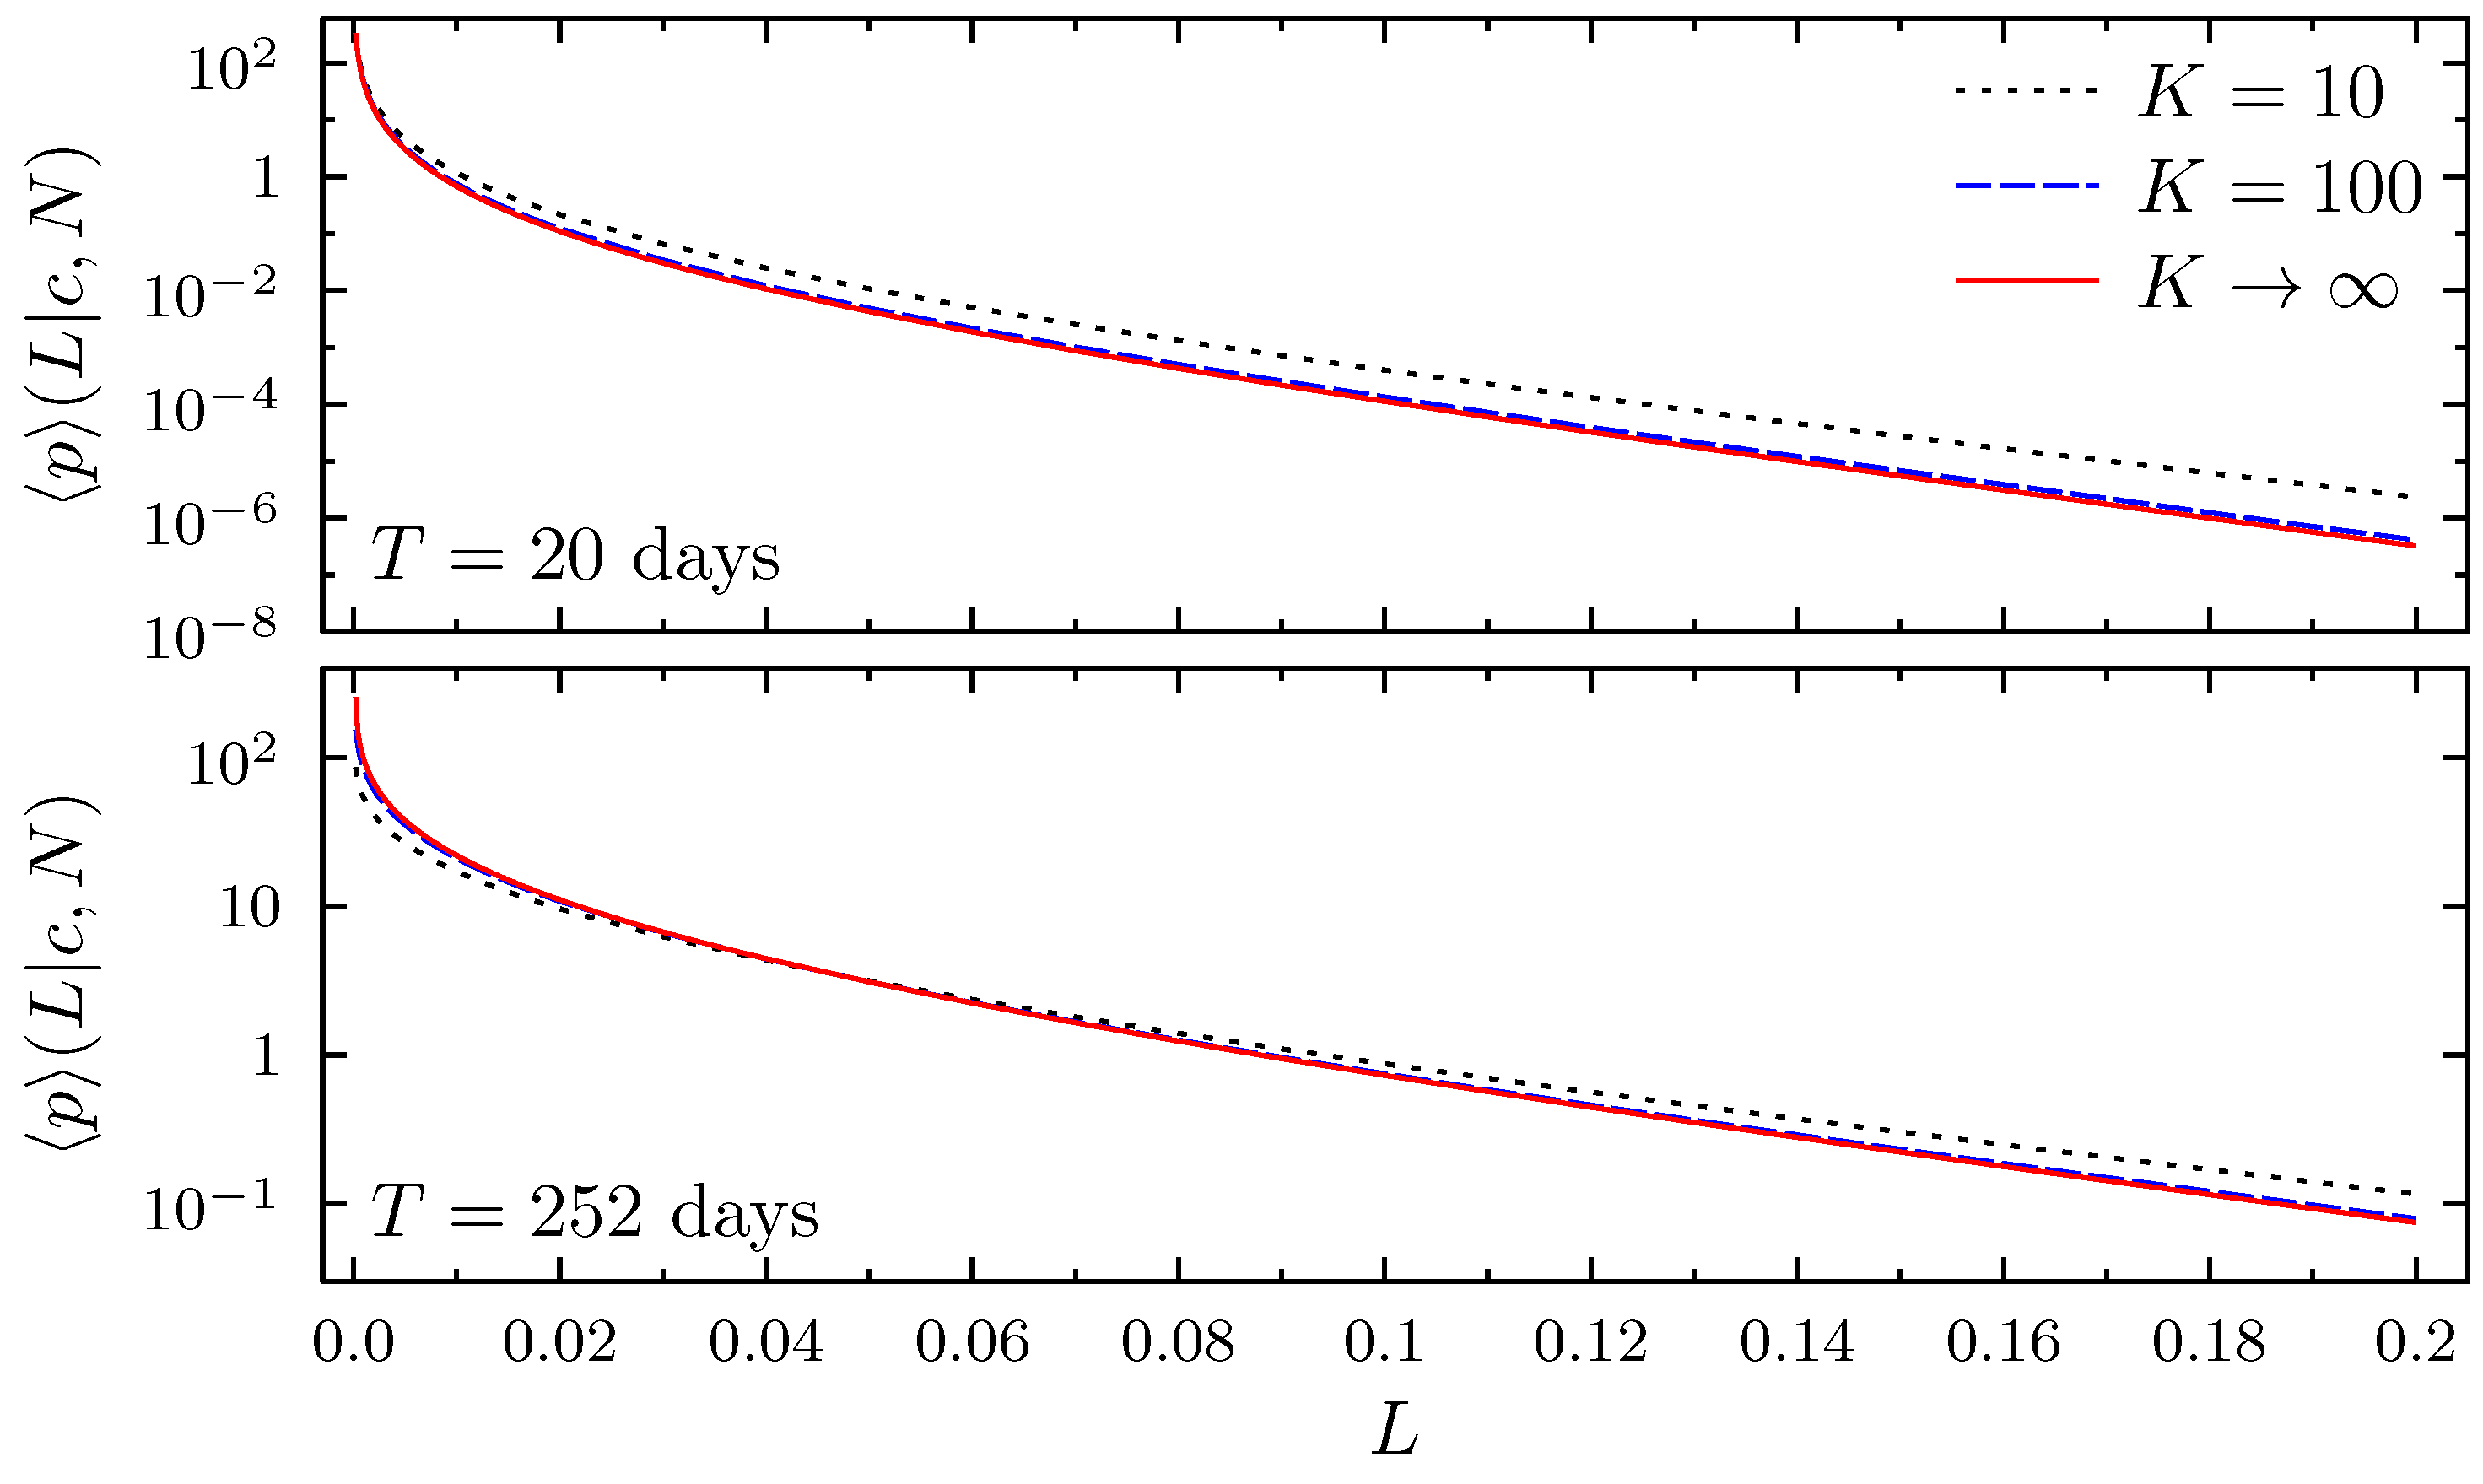
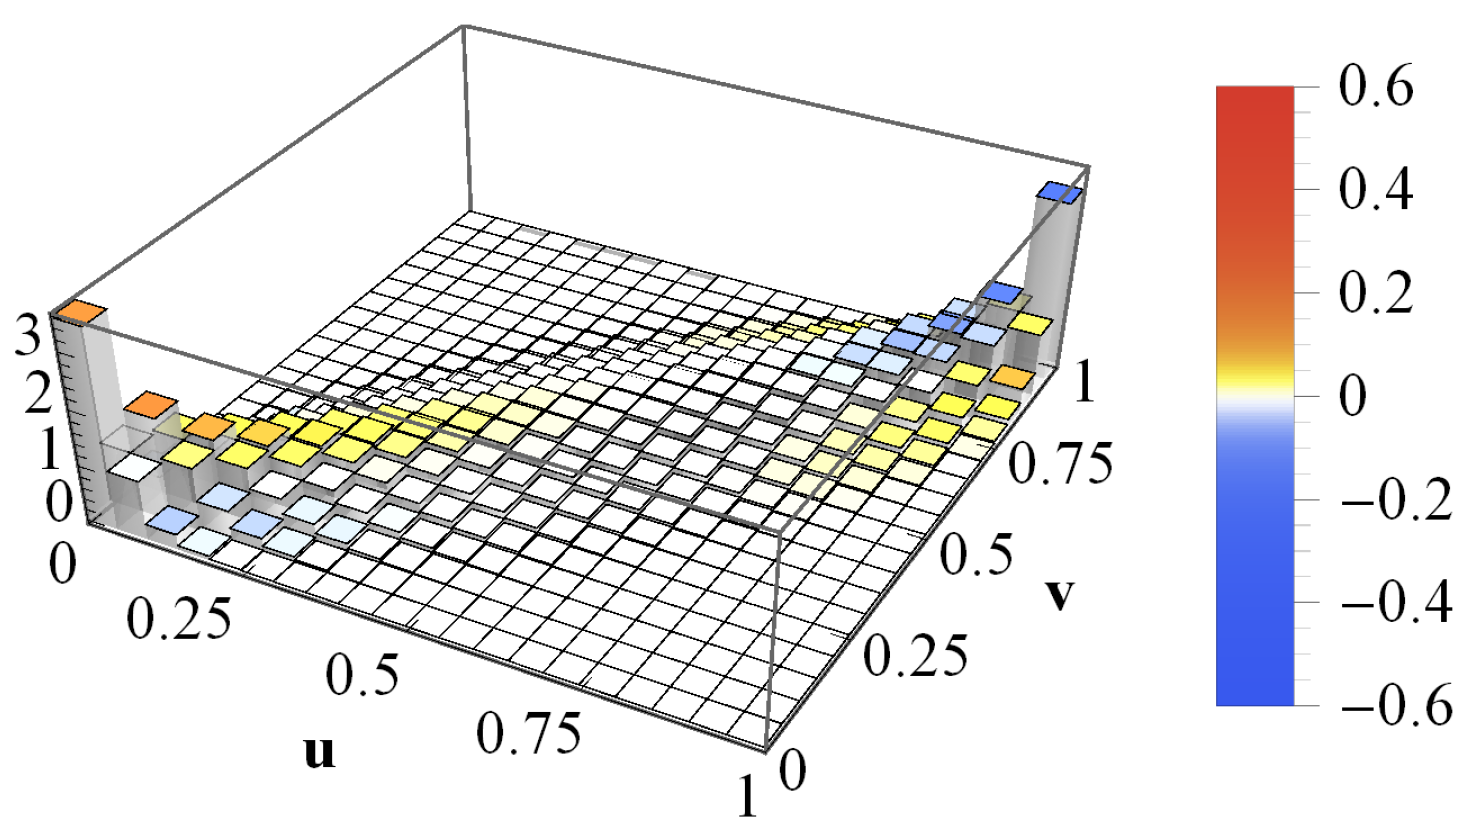
Table 1.
Average parameters used for two different time horizons. Taken from (Schmitt et al. 2015).
Table 1.
Average parameters used for two different time horizons. Taken from (Schmitt et al. 2015).
| Time Horizon for Estimation | K | in Month | in Month | c | |
|---|---|---|---|---|---|
| 2002–2004 | 436 | 5 | 0.10 | 0.015 | 0.30 |
| 2008–2010 | 478 | 5 | 0.12 | 0.01 | 0.46 |
© 2018 by the authors. Licensee MDPI, Basel, Switzerland. This article is an open access article distributed under the terms and conditions of the Creative Commons Attribution (CC BY) license (http://creativecommons.org/licenses/by/4.0/).
Share and Cite
MDPI and ACS Style
Mühlbacher, A.; Guhr, T. Credit Risk Meets Random Matrices: Coping with Non-Stationary Asset Correlations. Risks 2018, 6, 42. https://doi.org/10.3390/risks6020042
AMA Style
Mühlbacher A, Guhr T. Credit Risk Meets Random Matrices: Coping with Non-Stationary Asset Correlations. Risks. 2018; 6(2):42. https://doi.org/10.3390/risks6020042
Chicago/Turabian StyleMühlbacher, Andreas, and Thomas Guhr. 2018. "Credit Risk Meets Random Matrices: Coping with Non-Stationary Asset Correlations" Risks 6, no. 2: 42. https://doi.org/10.3390/risks6020042
Note that from the first issue of 2016, this journal uses article numbers instead of page numbers. See further details here.