
Field-Amplified Sample Injection-Micellar Electrokinetic Chromatography for the Determination of Benzophenones in Food Simulants


Abstract
:1. Introduction
2. Materials and Methods
2.1. Chemicals

| Compound | Abbreviation | pka value a | Structure | CAS number |
|---|---|---|---|---|
| 4,4'-dihydroxybenzophenone | 44DHBP | 7.67 ± 0.15 |  | 611-99-4 |
| 2,2',4,4'-tetrahydroxybenzophenone | THBP | 6.98 ± 0.35 |  | 131-55-5 |
| 2,3,4-trihydroxybenzophenone | TrHB | 7.51 ± 0.40 |  | 1143-72-2 |
| 4-hydroxybenzophenone | HBP | 8.14 ± 0.13 |  | 1137-42-4 |
| 2,4-dihydroxybenzophenone | 24DHBP | 7.72 ± 0.35 |  | 131-56-6 |
| methyl 2-benzoylbenzoate | MBB | - |  | 606-28-0 |
| benzophenone | BP | - |  | 119-61-9 |
| 2-hydroxy-4-methoxybenzophenone | HMBP | 7.56 ± 0.35 |  | 131-57-7 |
| 4-methylbenzophenone | MBP | - |  | 134-84-9 |
| 4-allyloxy-2-hydroxybenzophenone | AHBP | 7.63 ± 0.35 |  | 2549-87-3 |
| 4-benzoylbiphenyl | PBZ | - |  | 2128-93-0 |
| 4,4'-bis(diethylamine)benzophenone | DEAB | 4.14 ± 0.32 |  | 90-93-7 |
| 2-hydroxy-4-(octyloxy)benzophenone | HOBP | 7.59 ± 0.35 |  | 1843-05-6 |
2.2. Instrumentation and Methods
2.3. Capillary Conditioning
2.4. Food Simulant
3. Results and Discussion
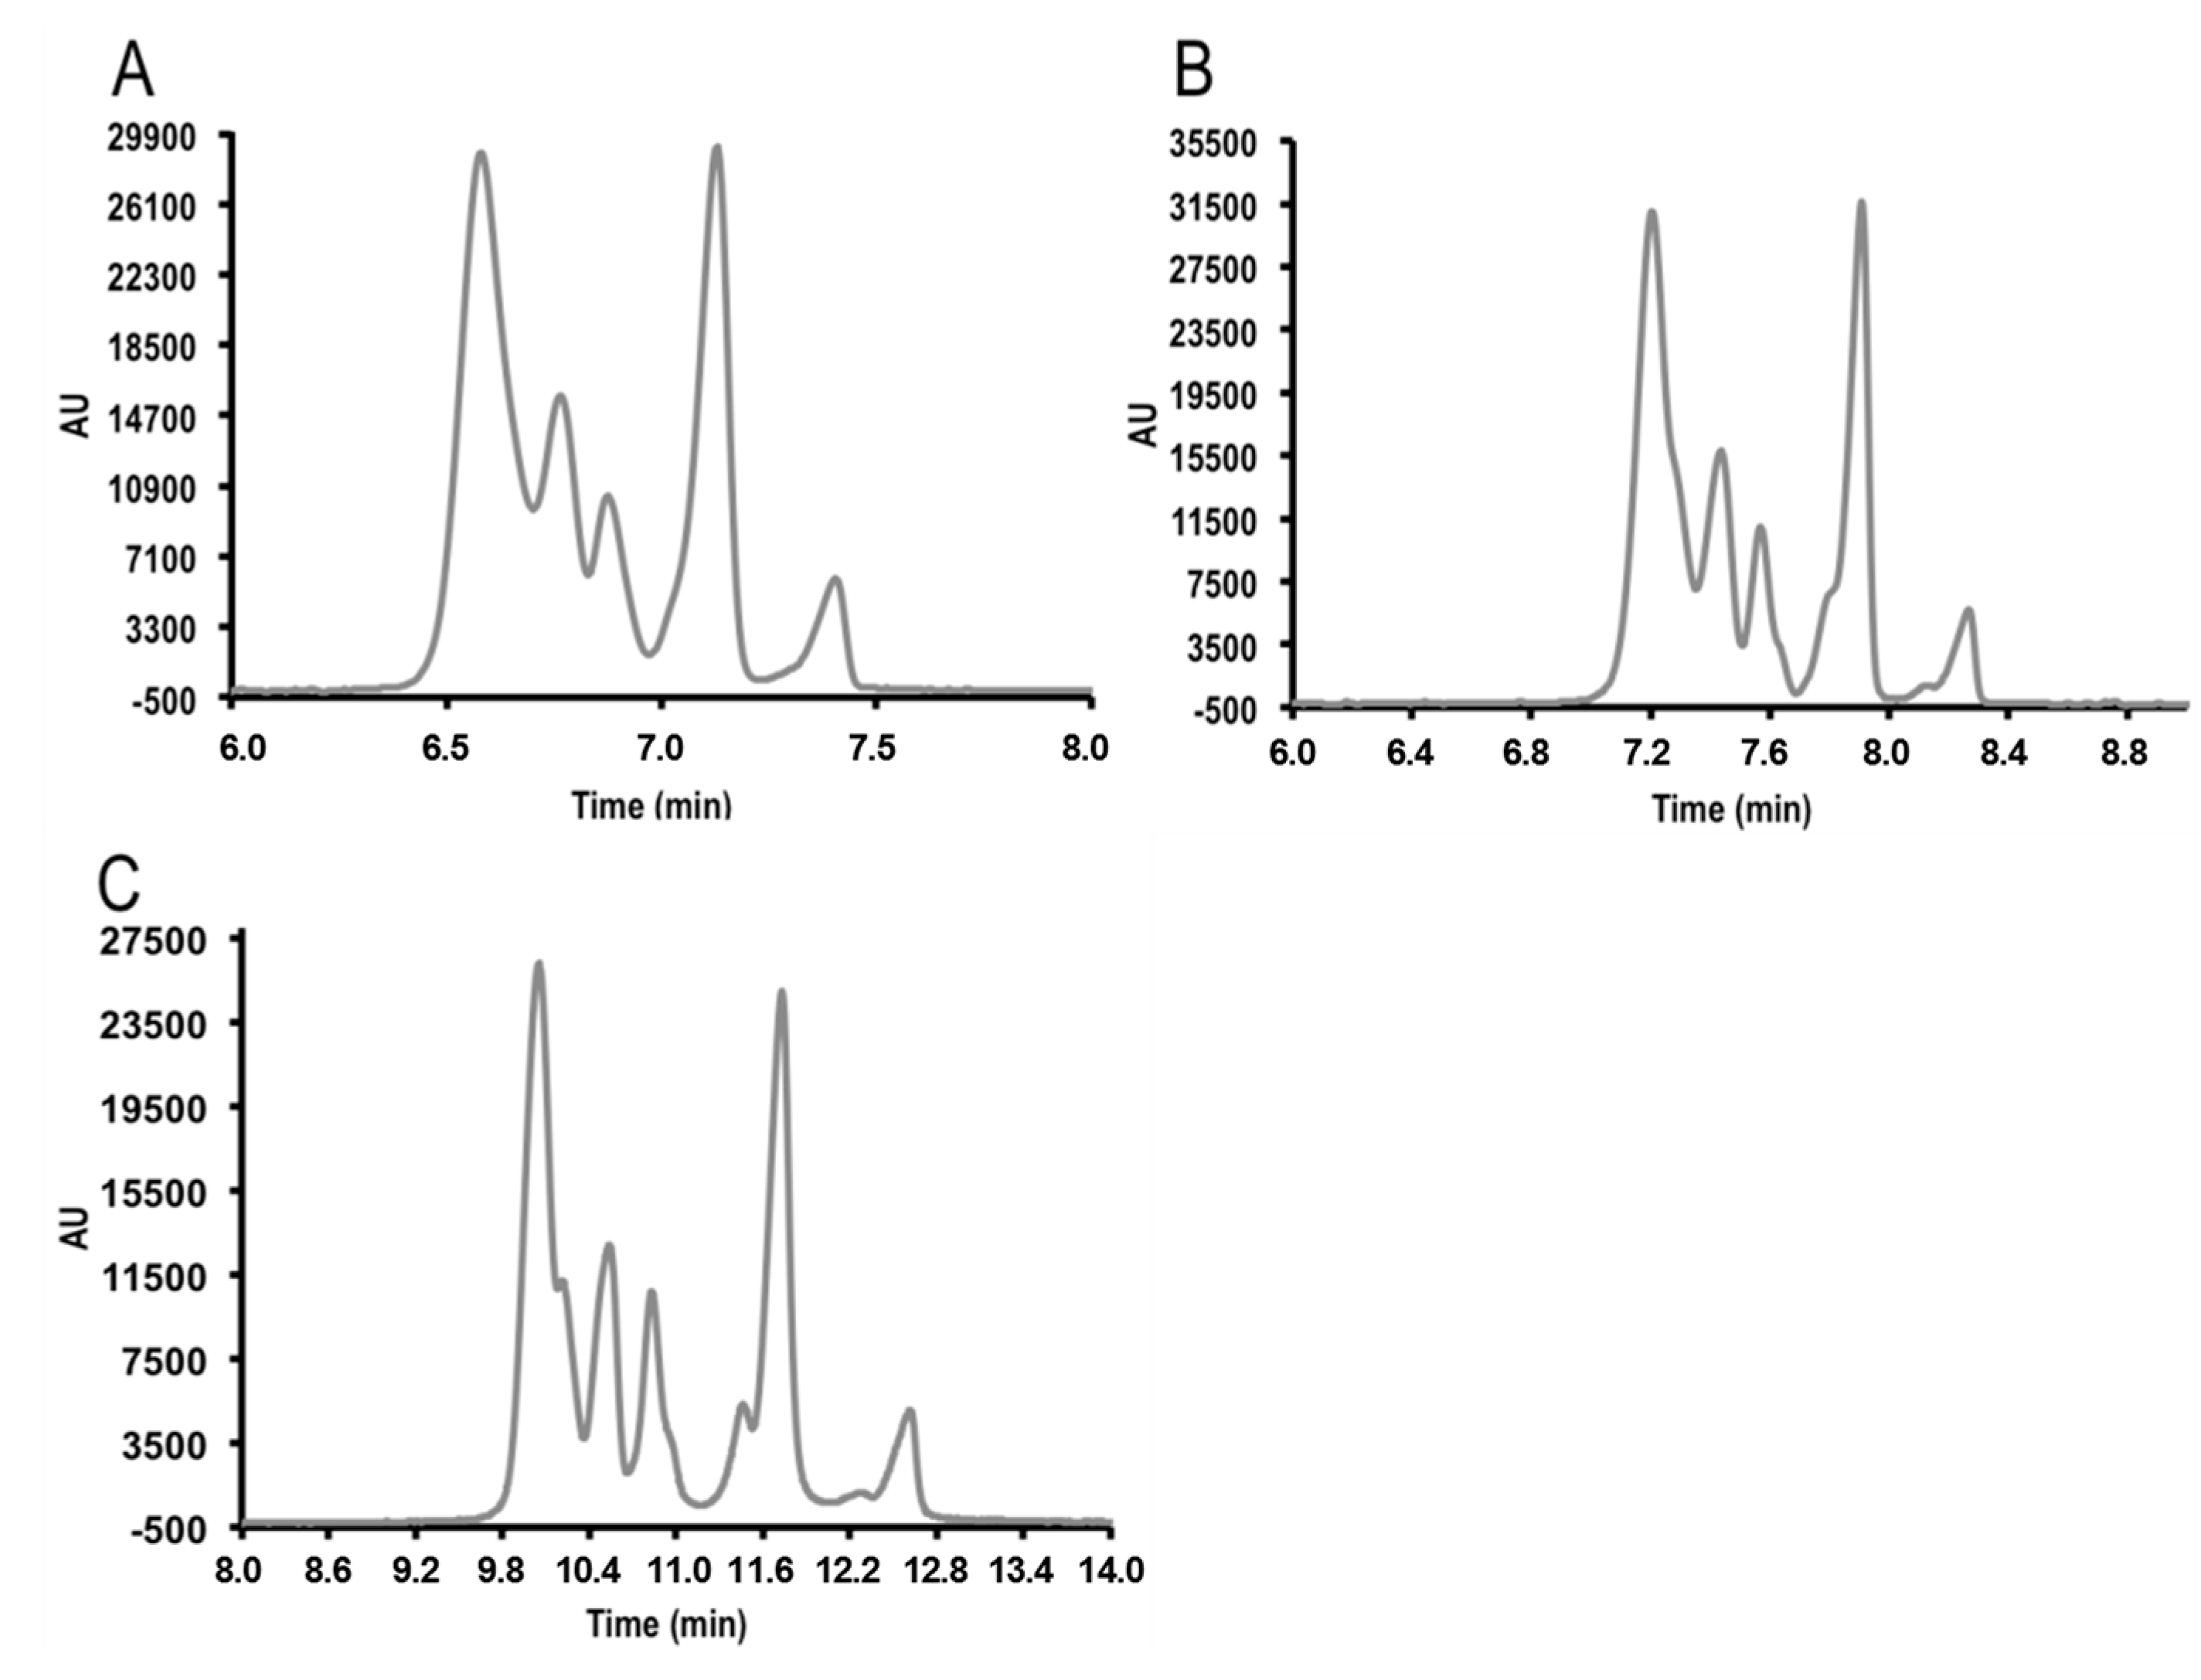
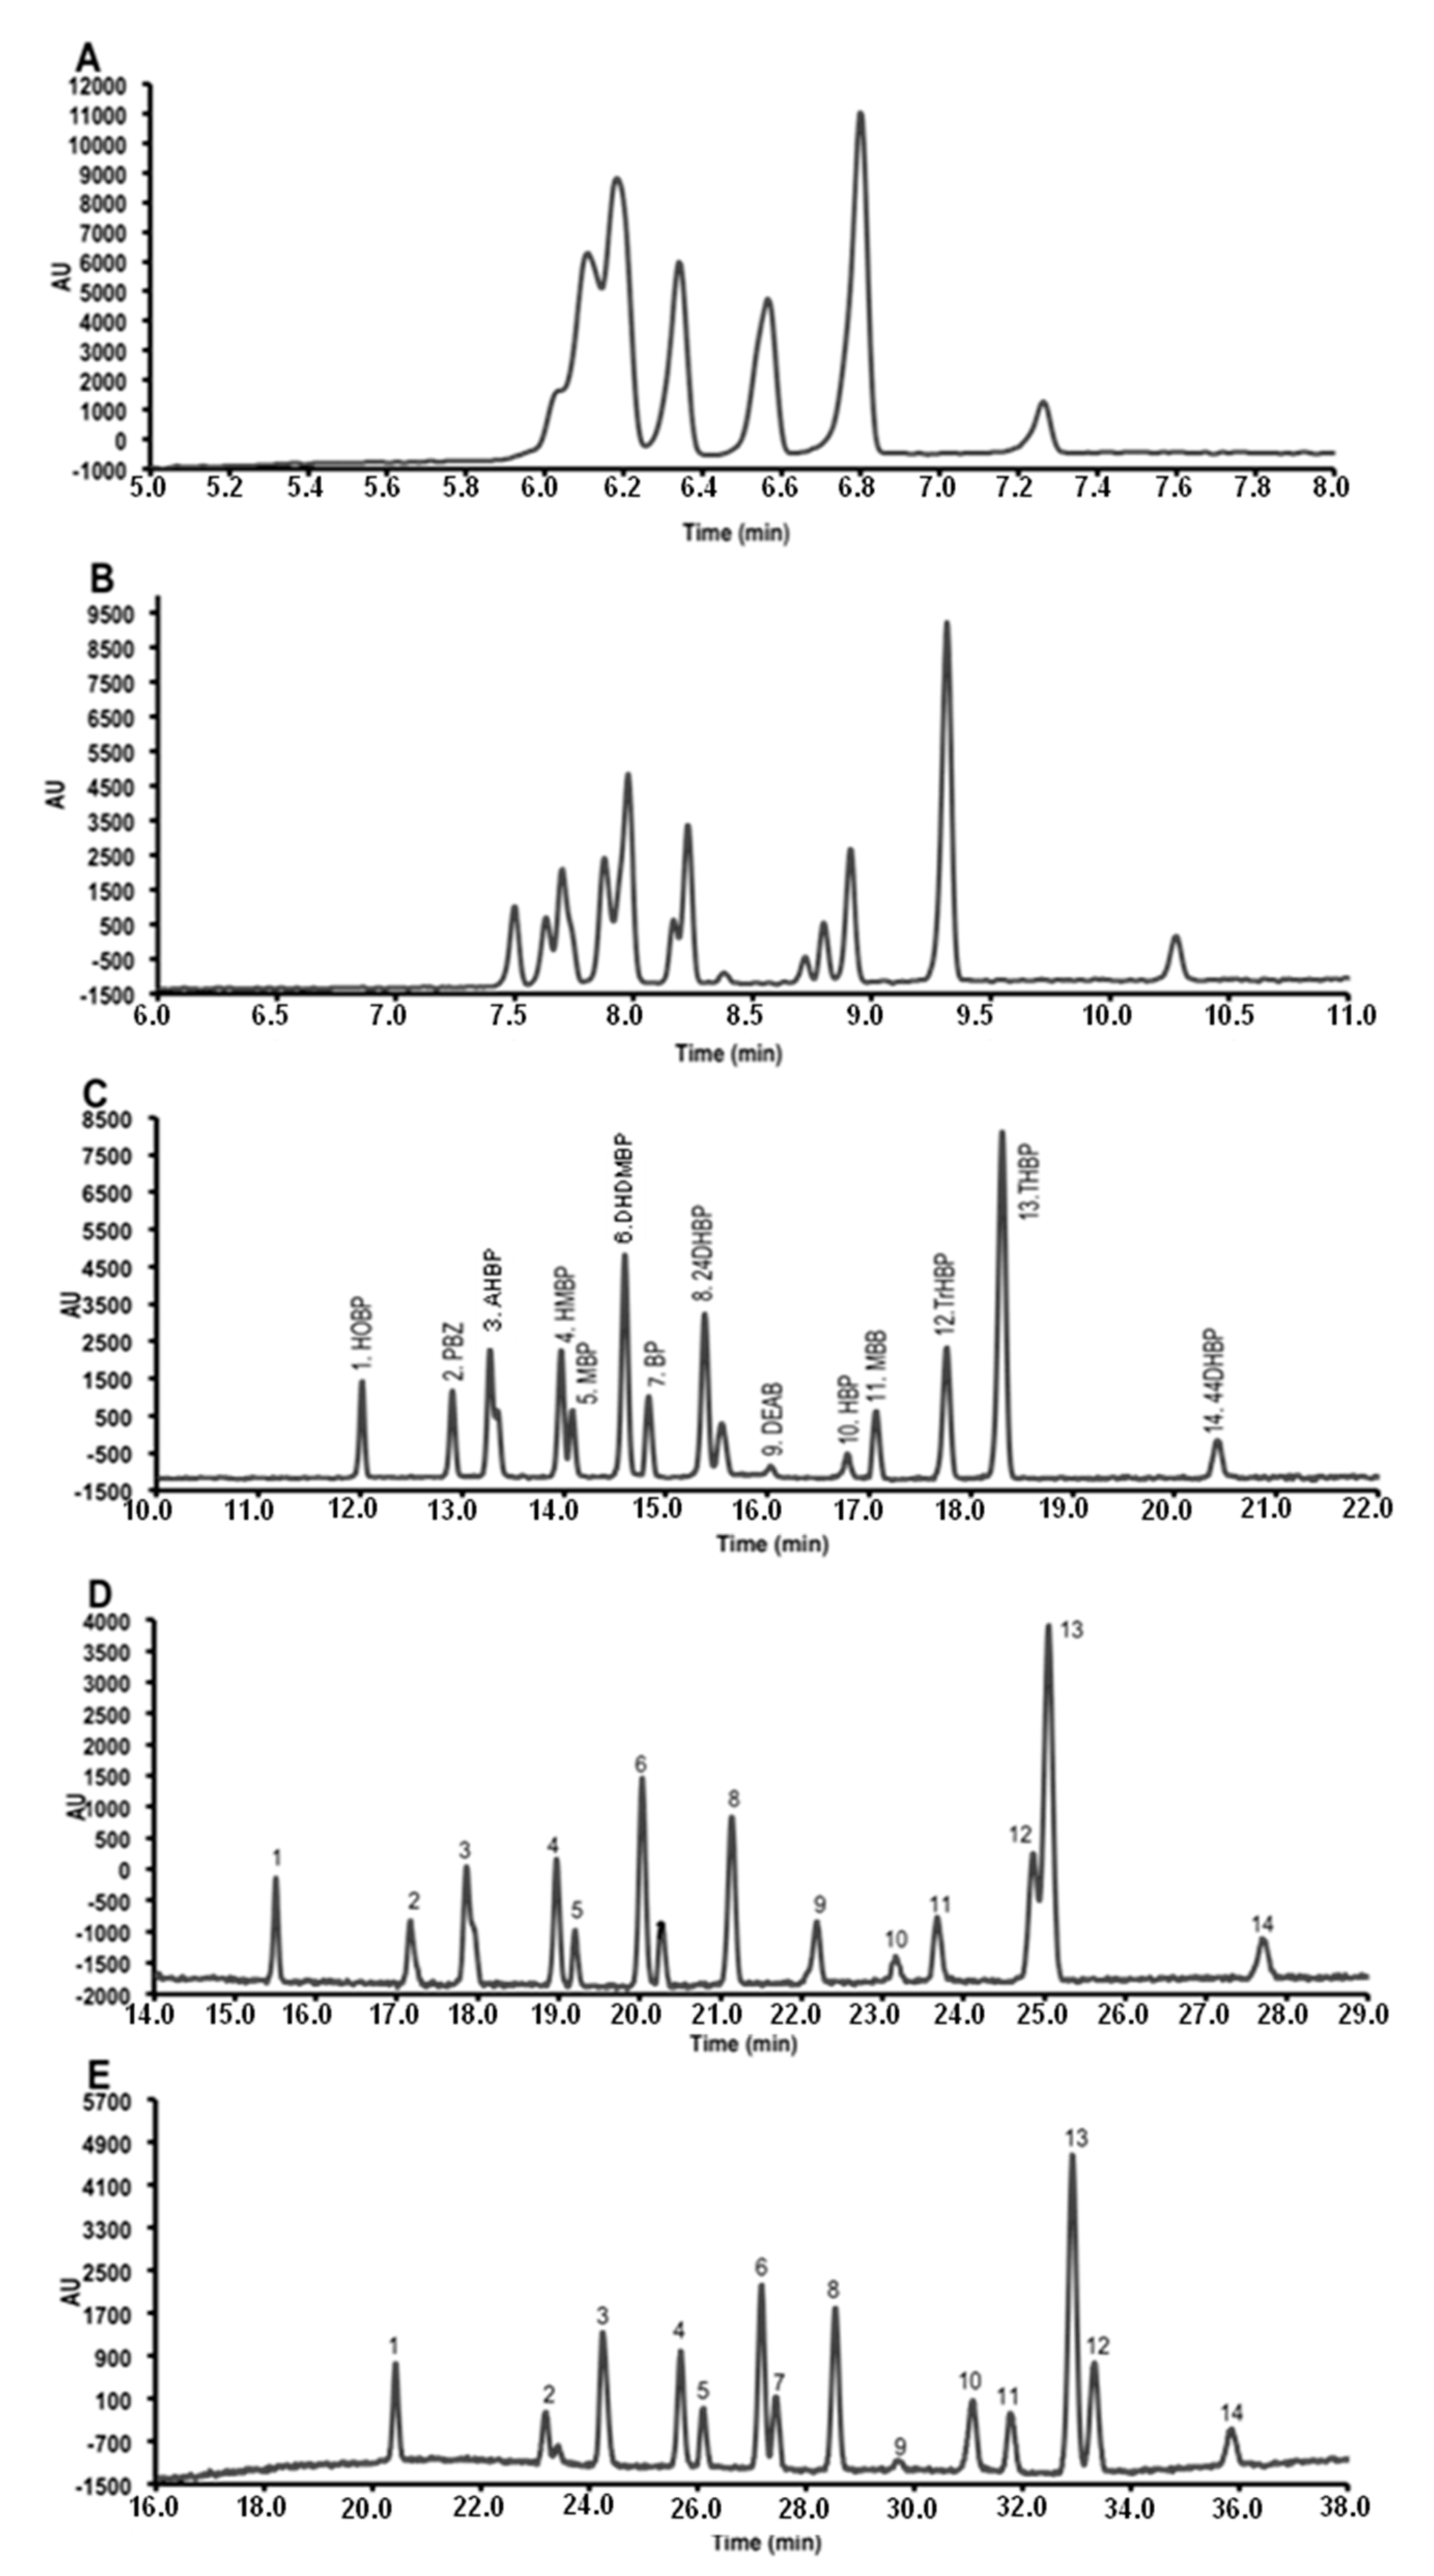
3.1. Micellar Electrokinetic Capillary Chromatography Conditions


3.2. Field Amplified Sample Injection

3.3. Instrumental Quality Parameters
| Compound | Method | LODs (µg/L) | Sensitivity enhancement (SE) a | LOQ (µg/L) | Run-to-run precision (% RSD, n = 5) | Accuracy c (%) | |
|---|---|---|---|---|---|---|---|
| Migration time | Concentration b | ||||||
| HOBP | MEKC | 4400 | - | 14,500 | 1.2 | 6.4 | 4.0 |
| FASI | 14.1 | 314.3 | 46.5 | 1.0 | 22.3 | 5.6 | |
| PBZ | MEKC | 4000 | - | 13,200 | 1.3 | 11.3 | 7.3 |
| FASI | 5.1 | 784.3 | 16.8 | 1.0 | 17.0 | 15.0 | |
| AHBP | MEKC | 4300 | - | 14,200 | 1.3 | 4.3 | 11.2 |
| FASI | 10.1 | 425.7 | 33.3 | 1.0 | 15.5 | 8.3 | |
| HMBP | MEKC | 3200 | - | 10,600 | 1.3 | 5.4 | 15.4 |
| FASI | 12.5 | 256.0 | 41.3 | 1.0 | 17.6 | 16.5 | |
| MBP | MEKC | 2700 | - | 8800 | 1.3 | 6.1 | 14.7 |
| FASI | 18.1 | 150.0 | 59.7 | 1.0 | 12.4 | 18.8 | |
| DHDMBP | MEKC | 3800 | - | 12,600 | 1.4 | 5.9 | 12.6 |
| FASI | 58.9 | 64.5 | 194.5 | 1.0 | 10.6 | 18.5 | |
| BP | MEKC | 1800 | - | 6000 | 1.4 | 4.1 | 11.7 |
| FASI | 60.6 | 30.0 | 200.0 | 2.8 | 6.8 | 18.9 | |
| 24DHBP | MEKC | 2000 | - | 6600 | 1.4 | 5.3 | 0.4 |
| FASI | 49.1 | 40.7 | 162.0 | 1.1 | 15.5 | 18.4 | |
| DEAB | MEKC | 4600 | - | 15,100 | 1.4 | 9.6 | 12.2 |
| FASI | 68.4 | 67.3 | 225.7 | 1.3 | 15.9 | 17.7 | |
| HBP | MEKC | 1600 | - | 5200 | 1.5 | 6.6 | 1.5 |
| FASI | 59.4 | 26.9 | 178.2 | 2.5 | 13.7 | 19.9 | |
| MBB | MEKC | 1200 | - | 3900 | 1.5 | 6.6 | 7.1 |
| FASI | 47.6 | 25.2 | 157.1 | 1.1 | 5.6 | 18.4 | |
| TrHBP | MEKC | 1100 | - | 3600 | 1.5 | 6.0 | 8.3 |
| FASI | 50.8 | 21.6 | 167.6 | 1.2 | 5.9 | 18.8 | |
| THBP | MEKC | 2500 | - | 8300 | 1.5 | 5.2 | 9.6 |
| FASI | 56.3 | 44.4 | 185.8 | 4.3 | 5.7 | 21.0 | |
| 44DHBP | MEKC | 1400 | - | 4700 | 1.6 | 5.6 | 0.4 |
| FASI | 38.0 | 36.8 | 125.4 | 1.0 | 6.0 | 16.2 | |
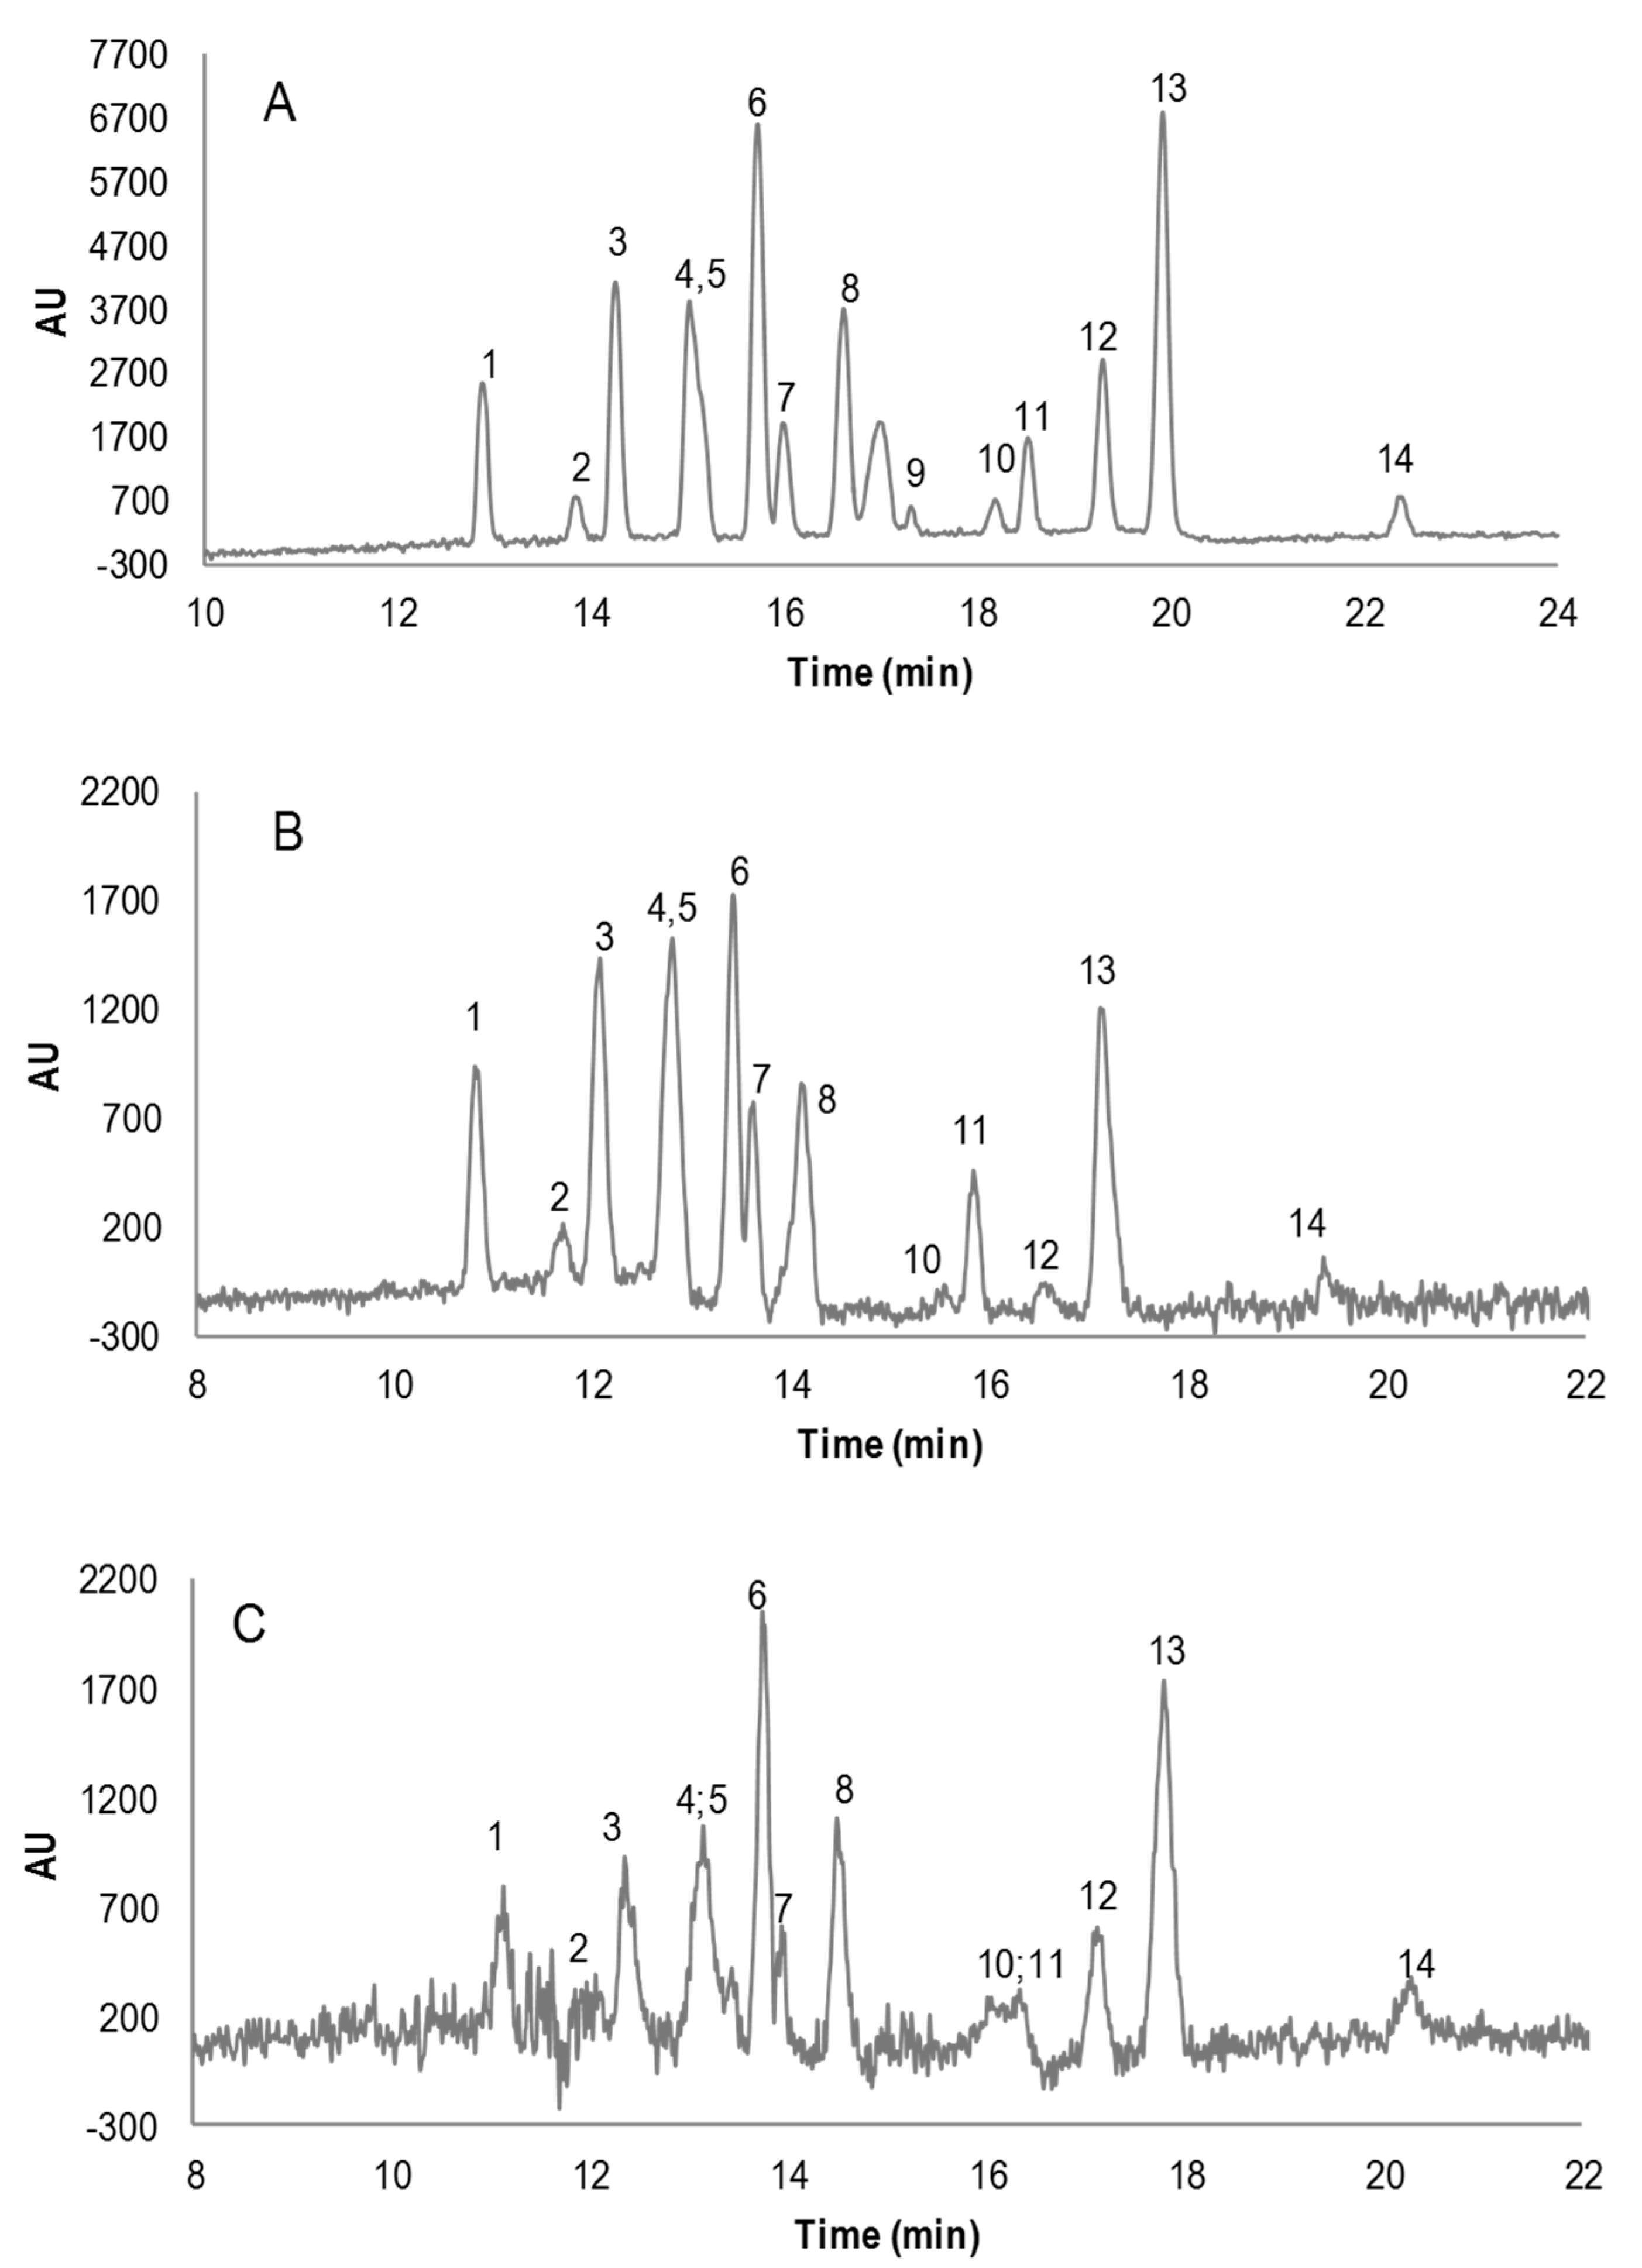
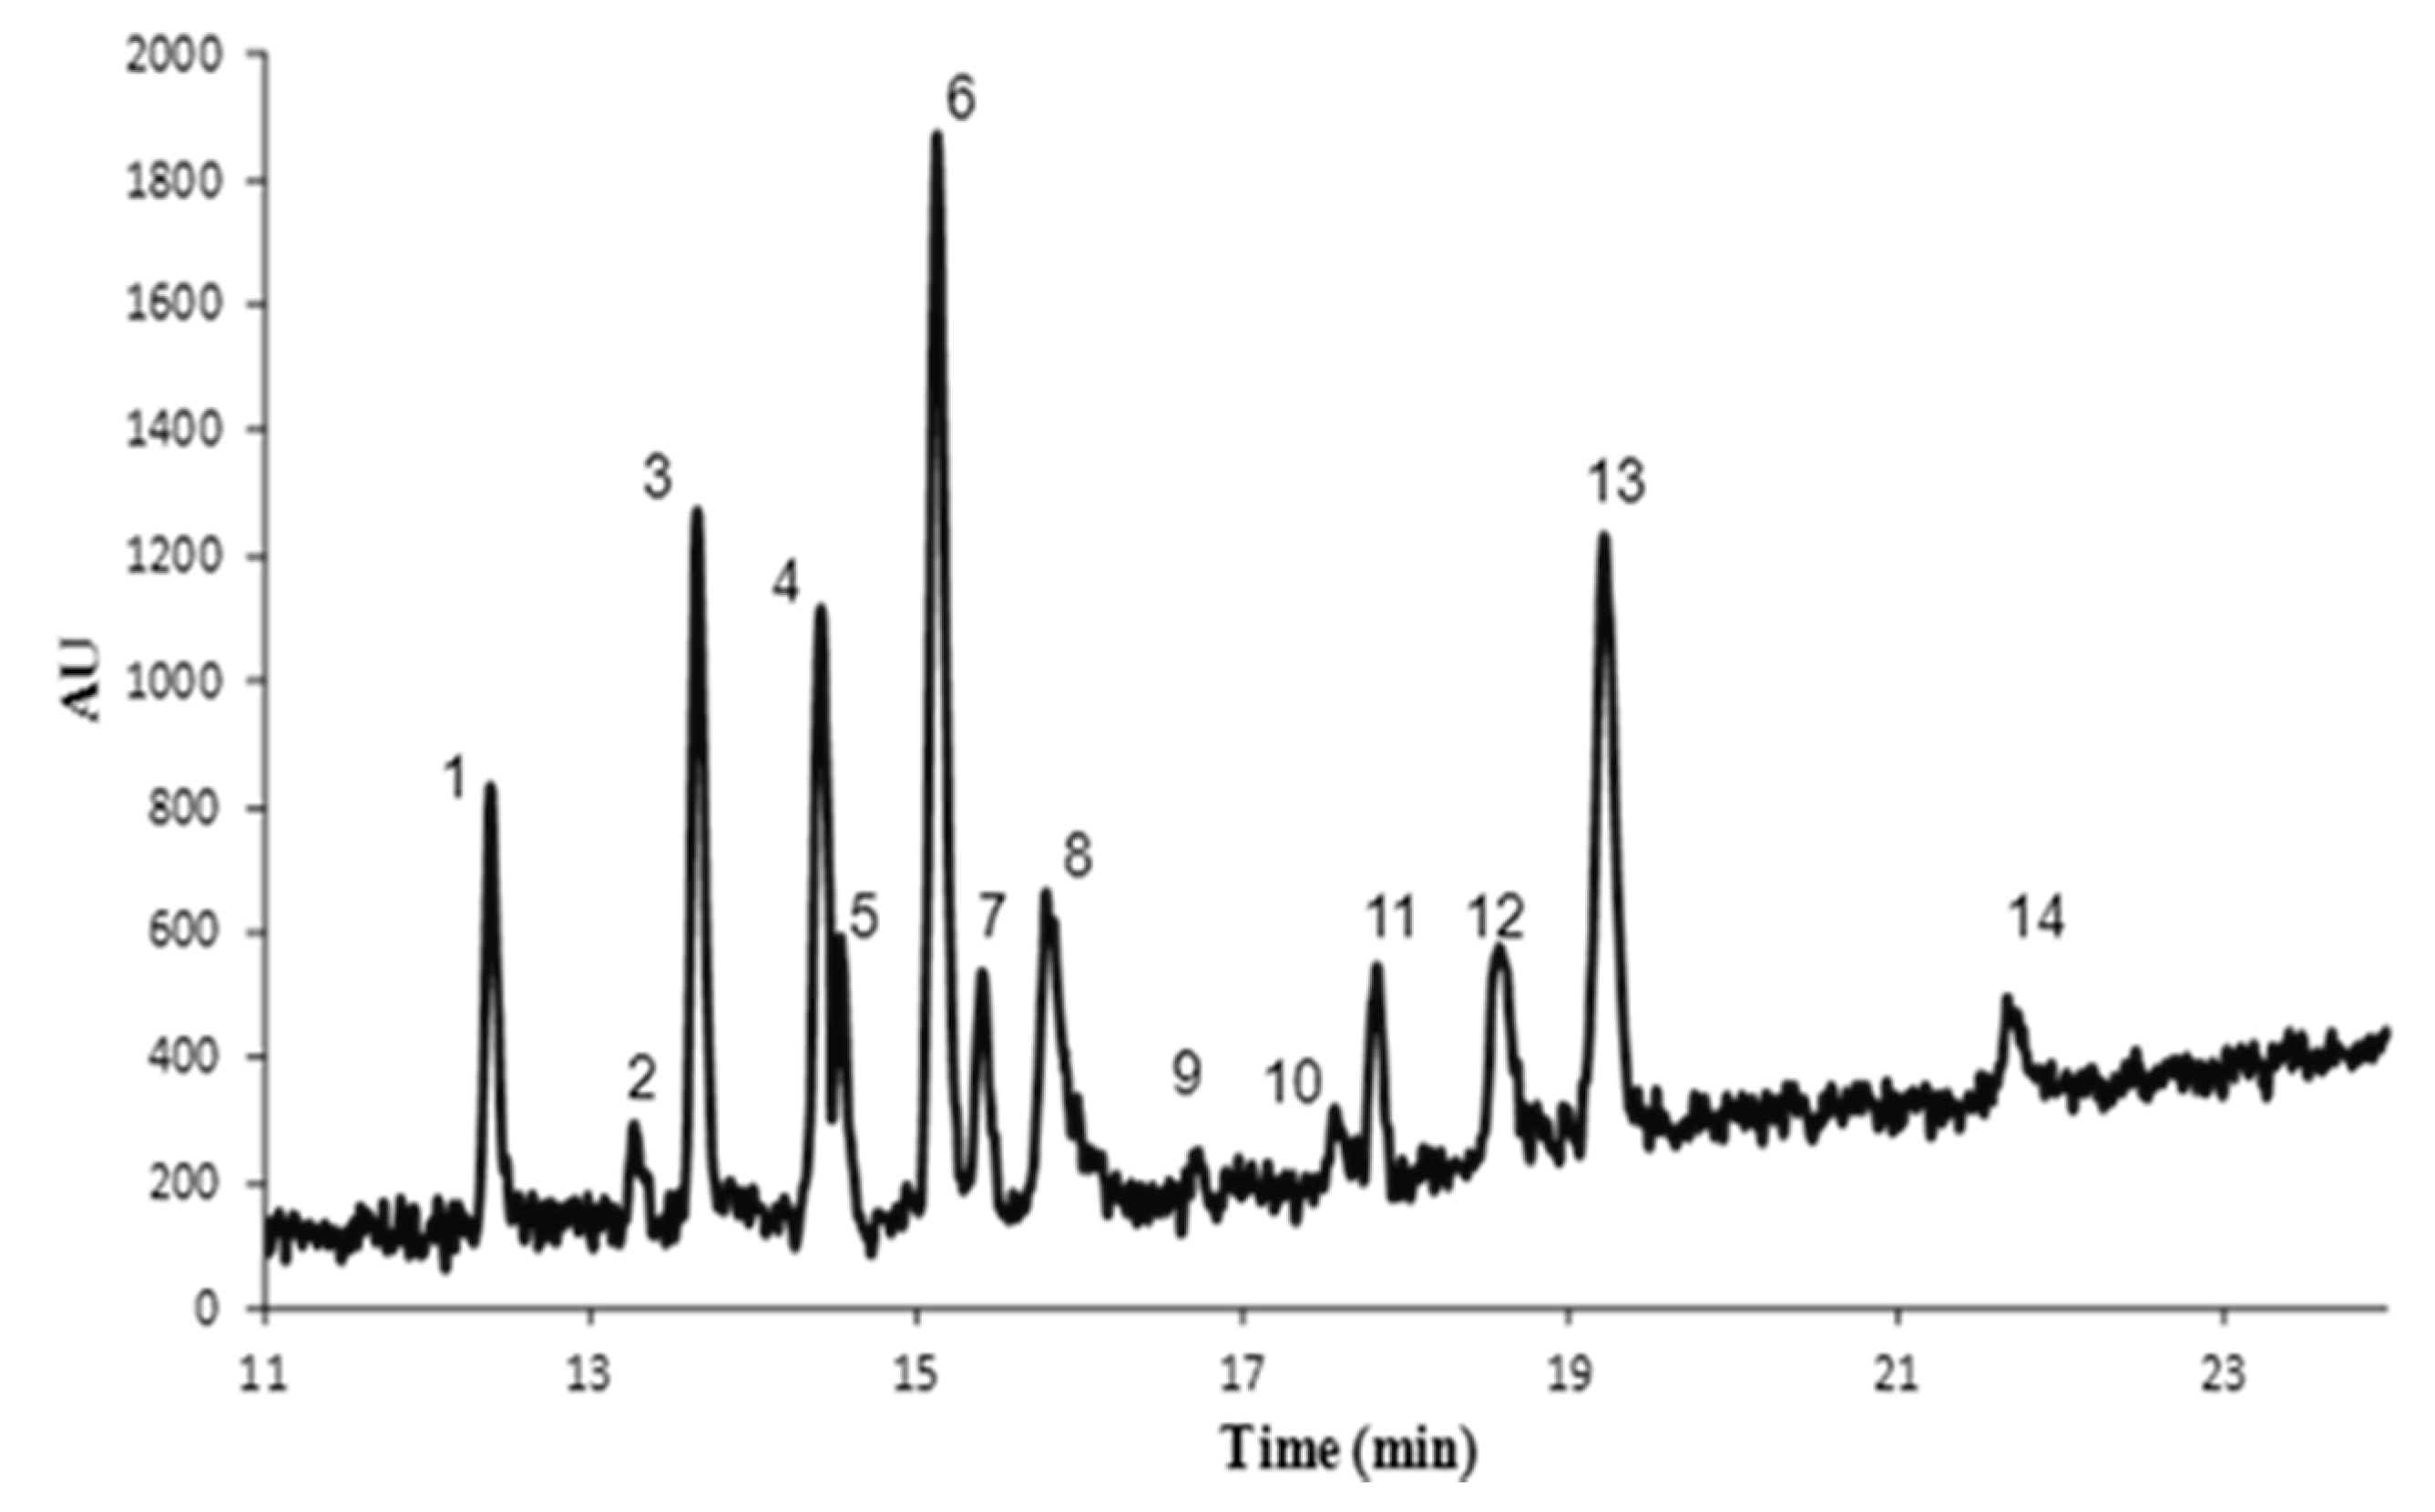
3.4. Application
| Compound | LODs (µg/L) | LOQ (µg/L) | Run-to-run precision (% RSD, n = 5) | Accuracy b (%) | |
|---|---|---|---|---|---|
| Migration time | Concentration a | ||||
| HOBP | 33.0 | 108.9 | 0.7 | 24.9 | 11.0 |
| PBZ | 52.1 | 172.1 | 0.9 | 19.6 | 13.9 |
| AHBP | 68.7 | 226.6 | 1.0 | 15.4 | 16.9 |
| HMBP | 64.3 | 212.1 | 0.8 | 15.5 | 11.0 |
| MBP | 72.4 | 239.0 | 1.3 | 16.0 | 22.8 |
| DHDMBP | 102.6 | 338.6 | 1.0 | 15.4 | 23.0 |
| BP | 100.4 | 331.3 | 1.0 | 13.3 | 15.0 |
| 24DHBP | 39.3 | 129.6 | 1.3 | 23.7 | 8.7 |
| DEAB | 72.4 | 238.9 | 2.1 | 14.5 | 12.5 |
| HBP | 47.1 | 155.4 | 1.0 | 4.7 | 6.1 |
| MBB | 72.4 | 238.8 | 1.2 | 16.0 | 17.5 |
| TrHBP | 65.1 | 214.8 | 0.2 | 10.1 | 11.5 |
| THBP | 56.7 | 187.1 | 1.0 | 7.9 | 18.4 |
| 44DHBP | 65.3 | 215.5 | 1.0 | 5.8 | 3.2 |

4. Conclusions
Acknowledgements
Author Contributions
Conflicts of Interest
References
- Cronology of Withdrawal of Nestlè and Other Liquid Milks, 2005. Available online: www.ibfan.org/art/416-1.doc (accessed on 15 July 2015).
- Sagratini, G.; Caprioli, G.; Cristalli, G.; Giardina, D.; Ricciutelli, M.; Volpini, R.; Zuo, Y.; Vittori, S. Determination of ink photoinitiators in packaged beverages by gas chromatography-mass spectrometry and liquid chromatography-mass spectrometry. J. Chromatogr. A 2008, 1194, 213–220. [Google Scholar] [CrossRef] [PubMed]
- Gallart-Ayala, H.; Nunez, O.; Moyano, E.; Galceran, M.T. Analysis of UV ink photoinitiators in packaged food by fast liquid chromatography at sub-ambient temperature coupled to tandem mass spectrometry. J. Chromatogr. A 2011, 1218, 459–466. [Google Scholar] [CrossRef] [PubMed] [Green Version]
- Gallart-Ayala, H.; Nunez, O.; Moyano, E.; Galceran, M.T.; Martins, C.P.B. Preventing false negatives with high-resolution mass spectrometry: The benzophenone case. Rapid Commun. Mass Spectrom. 2011, 25, 3161–3166. [Google Scholar] [CrossRef] [PubMed] [Green Version]
- Gallart-Ayala, H.; Nunez, O.; Lucci, P. Recent advances in LC-MS analysis of food-packaging contaminants. TrAC Trends Anal. Chem. 2013, 42, 99–124. [Google Scholar] [CrossRef] [Green Version]
- Wielogorska, E.; Elliott, C.T.; Danaher, M.; Chevallier, O.; Connolly, L. Validation of an ultra high performance liquid chromatography-tandem mass spectrometry method for detection and quantitation of 19 endocrine disruptors in milk. Food Control 2015, 48, 48–55. [Google Scholar] [CrossRef]
- Lacorte, S.; Cortina, M.; Guart, A.; Borrell, A. Food-Packaging Contaminants, in Fast Liquid Chromatography-Mass Spectrometry Methods in Food and Environmental Analysis; Núñez, O., Gallart-Ayala, H., Martins, C.P.B., Lucci, P., Eds.; Imperial College Press: London, UK, 2015. [Google Scholar]
- European Commission. Commission Regulation (EU) No 10/2011 of 14 January 2011 on plastic materials and articles intended to come into contact with food. Off. J. Eur. Union 2015, L12, 1–89. [Google Scholar]
- Aurela, B.; Science, K.; Söderhjelm, L. Food Packaging Inks and Varnishes and Chemical Migration into Food, in Chemical Migration and Food Contact Materials; Barnes, K., Sinclair, R., Watson, D., Eds.; CRC Press: Boca Raton, FL, USA, 2007. [Google Scholar]
- Muncke, J. Endocrine disrupting chemicals and other substances of concern in food contact materials: An updated review of exposure, effect and risk assessment. J. Steroid Biochem. Mol. Biol. 2011, 127, 118–127. [Google Scholar] [CrossRef] [PubMed]
- Diaz-Cruz, M.S.; Gago-Ferrero, P.; Llorca, M.; Barcelo, D. Analysis of UV filters in tap water and other clean waters in Spain. Anal. Bioanal. Chem. 2012, 402, 2325–2333. [Google Scholar] [CrossRef] [PubMed]
- Vela-Soria, F.; Rodríguez, I.; Ballesteros, O.; Zafra-Gomez, A.; Ballesteros, L.; Cela, R.; Navalon, A. Simplified matrix solid phase dispersion procedure for the determination of parabens and benzophenone-ultraviolet filters in human placental tissue samples. J. Chromatogr. A 2014, 1371, 39–47. [Google Scholar] [CrossRef] [PubMed]
- Kakasaheb, N.A.; Sandhyakumari, B.; Ramakrishna, K.; Srinivasarao, V. Determination of benzophenone, as potential leachable from printed labels used in ophthalmic solutions packaging system. PHARMANEST 2014, 5, 1972–1979. [Google Scholar]
- Tarazona, I.; Chisvert, A.; Salvador, A. Development of a gas chromatography-mass spectrometry method for the determination of ultraviolet filters in beach sand samsples. Anal. Methods 2014, 6, 7772–7780. [Google Scholar] [CrossRef]
- Benede, J.L.; Chisvert, A.; Salvador, A.; Sanchez-Quiles, D.; Tovar-Sanchez, A. Determination of UV filters in both soluble and particulate fractions of seawaters by dispersive liquid-liquid microextraction followed by gas chromatography-mass spectrometry. Anal. Chim. Acta 2014, 812, 50–58. [Google Scholar] [CrossRef] [PubMed]
- Kotnik, K.; Kosjek, T.; Krajnc, U.; Heath, E. Trace analysis of benzophenone-derived compounds in surface waters and sediments using solid-phase extraction and microwave-assisted extraction followed by gas chromatography-mass spectrometry. Anal. Bioanal. Chem. 2014, 406, 3179–3190. [Google Scholar] [CrossRef] [PubMed]
- Rodríguez-Gómez, R.; Zafra-Gómez, A.; Dorival-Garcia, N.; Ballesteros, O.; Navalon, A. Determination of benzophenone-UV filters in human milk samples using ultrasound-assisted extraction and clean-up with dispersive sorbents followed by UHPLC-MS/MS analysis. Talanta 2015, 134, 657–664. [Google Scholar] [CrossRef] [PubMed]
- Asimakopoulos, A.G.; Wang, L.; Thomaidis, N.S.; Kannan, K. A multi-class bioanalytical methodology for the determination of bisphenol A diglycidyl ethers, p-hydroxybenzoic acid esters, benzophenone-type ultraviolet filters, triclosan, and triclocarban in human urine by liquid chromatography-tandem mass spectrometry. J. Chromatogr. A 2014, 1324, 141–148. [Google Scholar] [PubMed]
- Shen, D.Y.; Lian, H.Z.; Ding, T.; Xu, J.Z.; Shen, C.Y. Determination of low-level ink photoinitiator residues in packaged milk by solid-phase extraction and LC-ESI/MS/MS using triple-quadrupole mass analyzer. Anal. Bioanal. Chem. 2009, 395, 2359–2370. [Google Scholar] [CrossRef] [PubMed]
- Maijó, I.; Fontanals, N.; Borrull, F.; Neusuess, C.; Calull, M.; Aguilar, C. Determination of UV filters in river water samples by in-line SPE-CE-MS. Electrophoresis 2013, 34, 374–382. [Google Scholar] [CrossRef] [PubMed]
- Purrà, M.; Cinca, R.; Legaz, J.; Núñez, O. Solid-phase extraction and field-amplified sample injection-capillary zone electrophoresis for the analysis of benzophenone UV filters in environmental water samples. Anal. Bioanal. Chem. 2014, 406, 6189–6202. [Google Scholar] [CrossRef] [PubMed] [Green Version]
- Lin, C.E.; Chen, M.J. Separation and selectivity of benzophenones in micellar electrokinetic chromatography using sodium dodecyl sulfate micelles or sodium cholate modified mixed micelles. J. Chromatogr. A 2001, 923, 241–248. [Google Scholar] [CrossRef]
- Wang, S.P.; Lee, W.T. Determination of benzophenones in a cosmetic matrix by supercritical fluid extraction and capillary electrophoresis. J. Chromatogr. A 2003, 987, 269–275. [Google Scholar] [CrossRef]
- Klampfl, C.W.; Leitner, T. Quantitative determination of UV filters in sunscreen lotions using microemulsion electrokinetic chromatography. J. Sep. Sci. 2003, 26, 1259–1262. [Google Scholar] [CrossRef]
- Huang, H.Y.; Chiu, C.W.; Huang, I.Y.; Lee, S. Analyses of benzophenones by capillary electrochromatography using methacrylate ester-based monolithic columns. J. Chromatogr. A 2005, 1089, 250–257. [Google Scholar] [CrossRef] [PubMed]
- Wu, Y.W.; Jiang, Y.Y.; Iiu, J.F.; Xiong, K. Cloud point extraction combined with micellar electrokinetic capillary chromatography determination of benzophenones in cosmetic matrix. Electrophoresis 2008, 29, 819–826. [Google Scholar] [CrossRef] [PubMed]
- Hsiao, W.Y.; Jiang, S.J.; Feng, C.H.; Wang, S.W.; Chen, Y.L. Determining ultraviolet absorbents in sunscreen products by combining direct injection with micelle collapse on-line preconcentration capillary electrophoresis. J. Chromatogr. A 2015, 1383, 175–181. [Google Scholar] [CrossRef] [PubMed]
- Ma, T.; Li, Z.; Li, Y.; Zhou, W.; Niu, Q. Double dispersant-assisted ionic liquid dispersive liquid-liquid microextraction coupled with capillary electrophoresis for the determination of benzophenone-type ultraviolet (UV) filters in sunscreen cosmetic product. Electrophoresis 2015. [Google Scholar] [CrossRef]
- Osbourn, D.M.; Weiss, D.J.; Lunte, C.E. On-Line preconcentration methods for capillary electrophoresis. Electrophoresis 2000, 21, 2768–2779. [Google Scholar] [CrossRef]
- Núñez, O. On-Line Electrophoretic-based Preconcentration Methods in Capillary Zone Electrophoresis: Principles and Relevant Applications, in Capillary Electrophoresis (CE): Principles, Challenges and Applications; Reed, C., Ed.; Nova Science Publishers: Hauppauge, NY, USA, 2015. [Google Scholar]
- Núñez, O. On-Line Electrophoretic-based Preconcentration Methods in Micellar Electrokinetic Capillary Chromatography: Principles and Relevant Applications, in Capillary Electrophoresis (CE): Principles, Challenges and Applications; Reed, C., Ed.; Nova Science Publishers: Hauppauge, NY, USA, 2015. [Google Scholar]
- Quirino, J.P.; Terabe, S. On-Line concentration of neutral analytes for micellar electrokinetic chromatography. 5. Field-enhanced sample injection with reverse migrating micelles. Anal. Chem. 1998, 70, 1893–1901. [Google Scholar] [CrossRef] [PubMed]
- Aranas, A.T.; Guidote, A.M., Jr.; Haddad, P.R.; Quirino, J.P. Sweeping-micellar electrokinetic chromatography for the simultaneous analysis of tricyclic antidepressant and β-blocker drugs in wastewater. Talanta 2011, 85, 86–90. [Google Scholar] [CrossRef] [PubMed]
- Burgi, D.S.; Chien, R.L. Application and limits of sample stacking in capillary electrophoresis. Methods Mol. Biol. 1996, 52, 211–226. [Google Scholar] [PubMed]
- Chien, R.L.; Burgi, D.S. Sample stacking of an extremely large injection volume in high-performance capillary electrophoresis. Anal. Chem. 1992, 64, 1046–1050. [Google Scholar] [CrossRef]
- Chien, R.L. Sample stacking revisited: A personal perspective. Electrophoresis 2003, 24, 486–497. [Google Scholar] [CrossRef] [PubMed]
- Breadmore, M.C.; Shallan, A.I.; Rabanes, H.R.; Gstoettenmayr, D.; Abdul Keyon, A.S.; Gaspar, A.; Dawod, M.; Quirino, J.P. Recent advances in enhancing the sensitivity of electrophoresis and electrochromatography in capillaries and microchips (2010–2012). Electrophoresis 2013, 34, 29–54. [Google Scholar] [CrossRef] [PubMed]
- Gallart-Ayala, H.; Núñez, O.; Moyano, E.; Galceran, M.T. Field-amplified sample injection-micellar electrokinetic capillary chromatography for the analysis of bisphenol A, bisphenol F, and their diglycidyl ethers and derivatives in canned soft drinks. Electrophoresis 2010, 31, 1550–1559. [Google Scholar] [CrossRef] [PubMed]
- Schaeper, J.P.; Sepaniak, M.J. Parameters affecting reproducibility in capillary electrophoresis. Electrophoresis 2000, 21, 1421–1429. [Google Scholar] [CrossRef]
© 2015 by the authors; licensee MDPI, Basel, Switzerland. This article is an open access article distributed under the terms and conditions of the Creative Commons Attribution license (http://creativecommons.org/licenses/by/4.0/).
Share and Cite
Félez, C.; Molet, A.; Núñez, O. Field-Amplified Sample Injection-Micellar Electrokinetic Chromatography for the Determination of Benzophenones in Food Simulants. Chromatography 2015, 2, 452-471. https://doi.org/10.3390/chromatography2030452
Félez C, Molet A, Núñez O. Field-Amplified Sample Injection-Micellar Electrokinetic Chromatography for the Determination of Benzophenones in Food Simulants. Chromatography. 2015; 2(3):452-471. https://doi.org/10.3390/chromatography2030452
Chicago/Turabian StyleFélez, Cristina, Anna Molet, and Oscar Núñez. 2015. "Field-Amplified Sample Injection-Micellar Electrokinetic Chromatography for the Determination of Benzophenones in Food Simulants" Chromatography 2, no. 3: 452-471. https://doi.org/10.3390/chromatography2030452