Next Article in Journal
Screening and Identification of Mitragynine and 7-Hydroxymitragynine in Human Urine by LC-MS/MS
Next Article in Special Issue
Studying Plant–Insect Interactions with Solid Phase Microextraction: Screening for Airborne Volatile Emissions Response of Soybeans to the Soybean Aphid, Aphis glycines Matsumura (Hemiptera: Aphididae)
Previous Article in Journal
TLC-Direct Bioautography as a High Throughput Method for Detection of Antimicrobials in Plants
Previous Article in Special Issue
The Evaluation of Magnetic Polymethacrylate-based Microspheres Used for Solid Phase DNA Micro-Extraction
 
 
Please note that, as of 1 January 2016, Chromatography has been renamed to Separations and is now published here.
Article

Rapid Separation of Elemental Species by Fast Multicapillary Gas Chromatography with Multichannel Optical Spectrometry Detection following Headspace Solid Phase Microextraction

Department of Analytical Chemistry, Faculty of Chemistry, Warsaw University of Technology, Warsaw, 00-664, Poland
*
Author to whom correspondence should be addressed.
Chromatography 2015, 2(2), 239-252; https://doi.org/10.3390/chromatography2020239
Submission received: 28 March 2015 / Revised: 6 May 2015 / Accepted: 18 May 2015 / Published: 22 May 2015
(This article belongs to the Special Issue Solid Phase Micro-Extraction)

Abstract

:
A method for conducting fast and efficient gas chromatography based on short multicapillaries in straight alignment combined with atomic emission detection was developed for field analysis. The strategy enables for speciation analysis of organometallic compounds. The analytes are simultaneously ethylated and preconcentrated on a solid phase microextraction (SPME) fiber placed in the headspace over the sample for 25 min. The ethylated species are then completely separated and selectively quantified within 25 s under isothermal conditions. A new miniaturized speciation analyzer has been constructed and evaluated. The system consists of a GC injection port and a lab-made miniaturized GC unit directly coupled with miniaturized plasma excitation source. The emitted light is transferred via optical fiber and registered with a miniaturized charged coupled device (CCD) based spectrometer. Working parameters for multicapillary column gas chromatography with atomic emission detector, including carrier gas flow rate, desorption temperature, and GC column temperature, were optimized to achieve good separation of analytes. Basic investigations of the fundamental properties of 5 cm-long multicapillary column, to evaluate its potential and limitations as a rapid separation unit, are presented. The adaptation of the technique for use with a SPME system and with a multichannel element-selective plasma-emission detector is highlighted.

1. Introduction

Gas chromatography is a popular and powerful analytical tool, but often suffers from long analysis times. Analytical chemists are increasingly turning to the use of multicapillary column GC systems to address the increasing demand for speed, selectivity, and sensitivity of analysis. Also, in the last decade, there has been an increasing interest within the chromatographic community for fast GC. Since its introduction, there has been permanent progress in both instrumental design and column technology. This is obviously related to the fact that the number of samples subjected to GC analysis has risen greatly.
Multicapillary gas chromatography microwave induced plasma optical emission spectrometry (MCGC-MIP-OES) combined with derivatization to alkyl compounds has been widely employed for speciation analysis of harmful organometallic pollutants. Because of their toxicity and widespread distribution in environmental samples, butyltin and methylmercury compounds were most often determined among volatile organometallic species during the last 20 years. Both classes of compounds have been found mainly in aquatic environments as result of human activity (butyltin compounds) and as a consequence of natural biomethylation of inorganic mercury. MCGC columns in combination with MIP-OES detection have been proposed as more selective and sensitive substitution of classic GC [1,2,3]. Numerous analytical methods have been described in the literature to measure mercury and tin organic species in samples of various origin [4,5,6].
A method based on solid phase microextraction (SPME) in combination with MCGC separation and MIP-OES detection was developed and applied for ultra-trace mercury and tin speciation analysis in water samples. Typically, 1m-long MCGC columns consisted of approximately 1000 capillaries of 40 µm internal diameter are applied for this approach. In several cases straight 20–25 cm-long columns were used. Conversely to capillary columns, for MCGC columns maximum efficiency is achieved in a wide range of carrier gas velocities. This feature enables the easy adjustment of the optimum carrier gas flow rate for GC separation of mercury and tin compounds to the central gas flow rate for MIP source. This procedure allowed for detection for the selective determination of organic mercury and tin compounds at the low ppt-level, within 5 min [4].
We show that this technique can be further miniaturized even to portable analyzer while using several new and relatively cheap technologies. SPME provides significant advantages of simplicity, high analyte separation and preconcentration capacity and ease of operation. Thus, higher sensitivity and lower matrix-suppression effects can be achieved that is extremely beneficial for detection of trace compounds from complex matrices. The coupling of SPME with GC was successfully realized by applying a GC-injection port as interface, in which analytes are released by thermal desorption and carried into GC column for separation and analysis. SPME is also capable of interfacing with optical or mass spectrometry directly for detection of analytes without employing chromatographic separation [7,8]. This arrangement provided fast desorption and high sample introduction efficiency, allowing determination of total content of the element of interest in a given sample.
In this study a highly flexible technology for constructing plasma sources based on the rotating field concept and the digitally controlled modulation of plasma heating has been used to construct a plasma atomic emission detector [9]. Digitally controlled plasma (DP) allows for the production of non-stationary plasma discharge sustained by a rotating electric field produced within several electrodes positioned in the plane around the axis. Thus, a stable planar low-flow helium discharge is formed at atmospheric pressure operating at total gas consumption of 100–500 mL min−1, which is self-igniting, a property that is especially desirable in portable analyzers. The device has been already shown to be useful for atomic emission spectrometric determination of hydride forming elements and mercury at the ng·mL−1 level [9].
Also, a miniaturized spectrometer with CCD-based detection system has been employed in this study. The detector is considerably cheaper and it also allows for simultaneous determination of several elements at low concentration level comparable with that usually found in the environment. The CCD-based spectrometer in not only of particularly small size but it enables for collecting full range spectra simultaneously. This indicates that a single chromatographic separation is documented as a series of hundreds spectra measured with short integration time, so the final result is a 3D time-resolved spectrum. This leads to conclusion that more than one element can be analyzed at once if only it has emission lines in spectrometer’s range.
This paper reports for the first time the development of simple, rapid and simultaneous method for speciation analysis of methylmercury and butyltins on the basis of only 5 cm-long multicapillary gas chromatography column (MCGC) after their extraction by headspace solid phase microextraction. The detection system of the presented miniature analyzer is based on plasma atomic emission detection equipped with a mini CCD-based spectrometer. In the first step, optimum detection conditions were found for three different derivatives of butyltin compounds in the same run. After that, headspace solid-phase microextraction (HS-SPME) conditions were adjusted for the separation and preconcentration of butyltin species. Two fiber coatings for headspace solid-phase microextraction (HS-SPME) are compared in terms of extraction efficiency.

2. Experimental

2.1. Apparatus

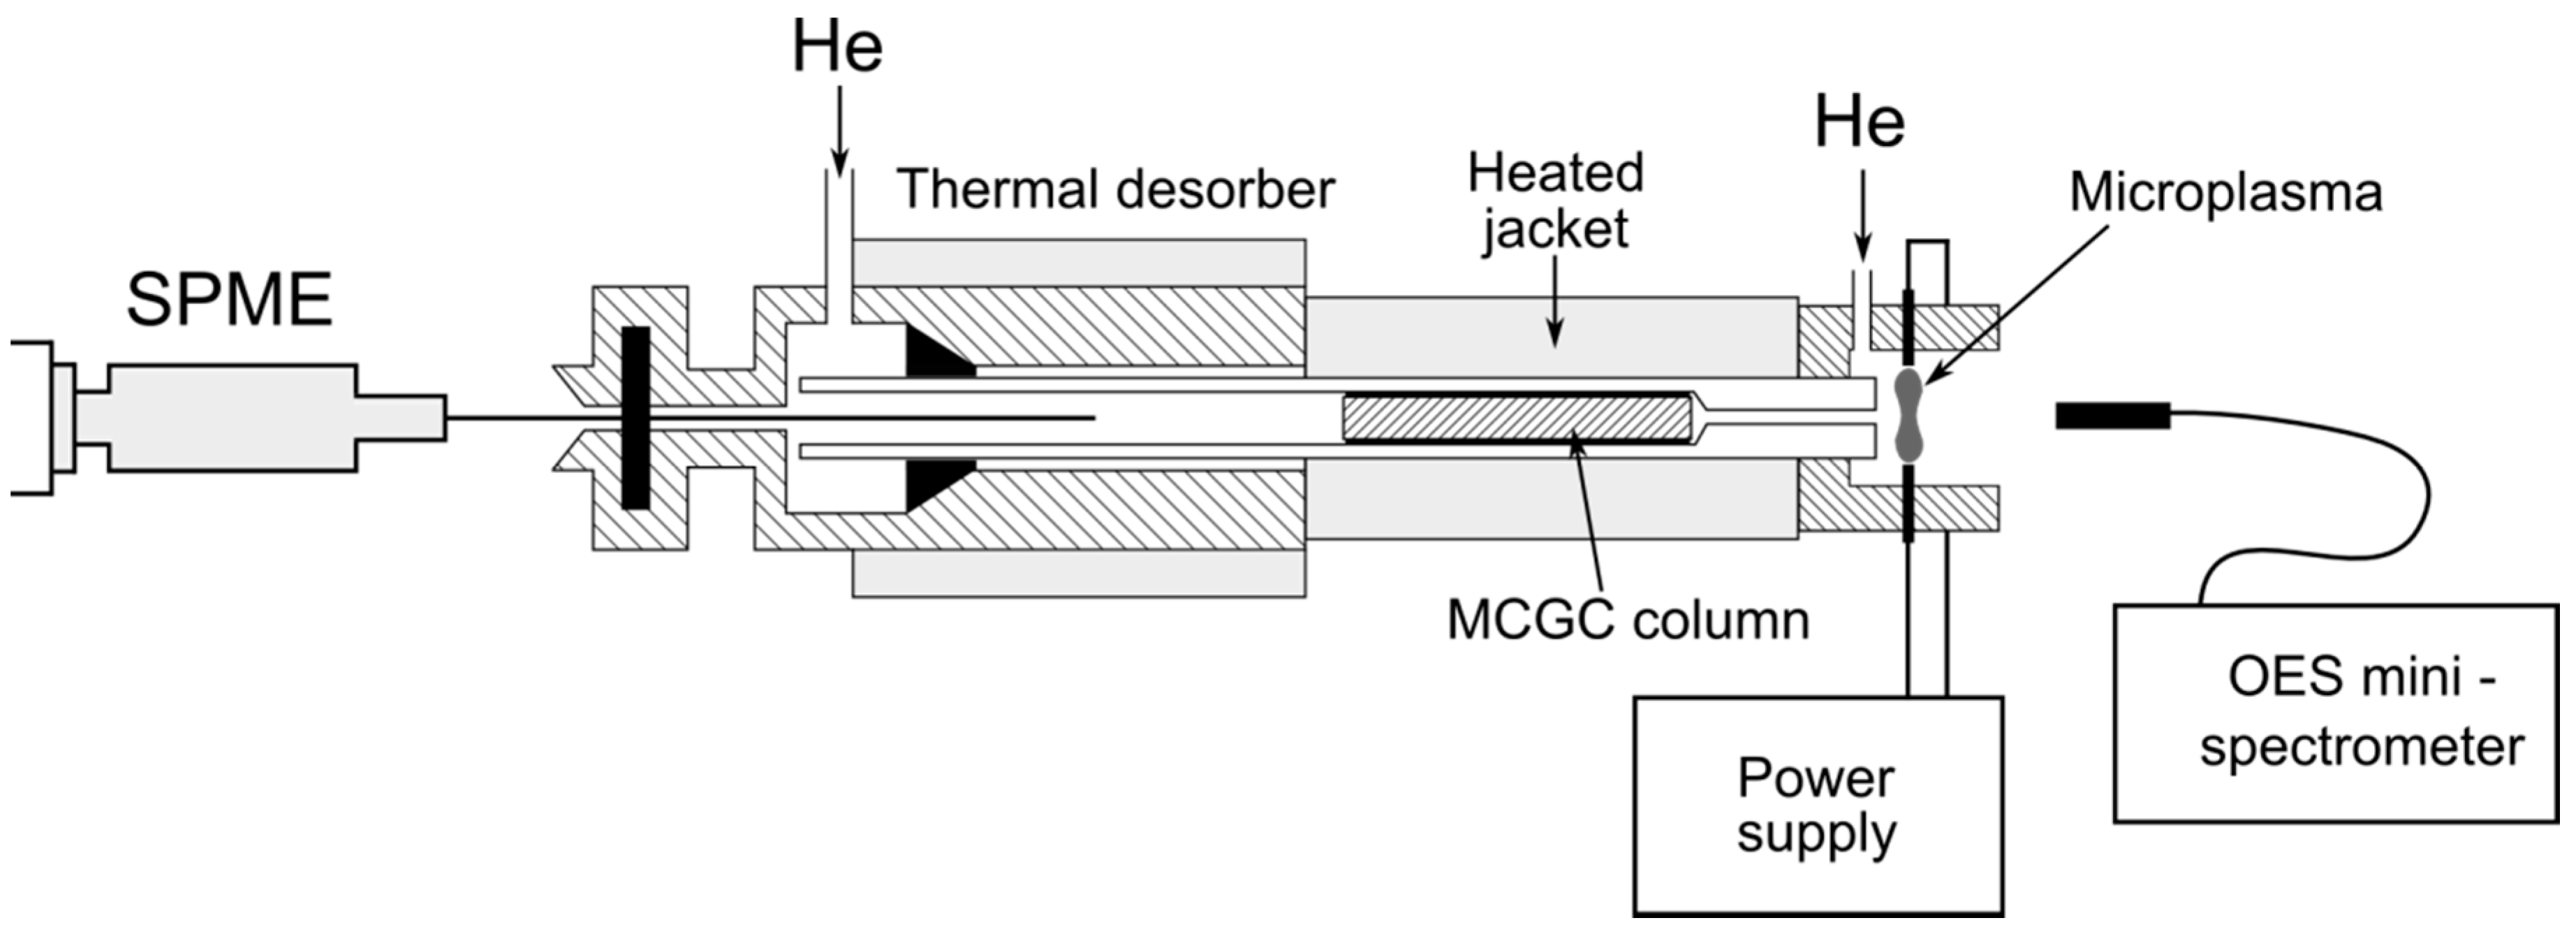
The lab-constructed prototype miniature analyzer includes electrically heated thermal desorption port with silicone SPME septum (Thermogreen, Supelco, USA), multicapillary GC column with a heated jacket and finally microplasma source as shown in Figure 1. The integrated channel for analyte vaporization and transport consists of a heated, glass-lined, splitless type GC injector and a 5 cm-long multicapillary column placed directly at the base of the plasma cavity to minimize the length of transfer line. The applied setup enables column temperature control, however separation is too fast to perform reasonable temperature gradient so isothermal-mode of operation is provided. The multicapillary column (St2-40/OV1701/0.6#1, Multichrom Ltd, Novosibirsk, Russia) employed in this study consists of approximately 900 capillaries 40 µm in diameter coated with OV-1701 stationary phase. Digitally controlled plasma source is supplied with helium by central gas flow (carrier) and auxiliary gas flow from the side. A five-phase rotating field plasma source operating at frequency in the range of 20–100 kHz was manufactured by Ertec-Poland (Wrocław, Poland). The DP source consists of a cylindrically shaped cavity with five 1.6 mm diameter stainless steel rod electrodes supplied from five symmetrically placed connectors. The plasma discharge operating at atmospheric pressure is established within the electrodes, arranged on a circle of 5 mm diameter. The plasma was axially viewed by AvaSpec-3648-USB2 miniaturized spectrometer (wavelength range 170–300 nm) with optical fiber FC-UV-400-2-SR-HT (Avantes, The Netherlands). Note that whole analyzer with spectrometer weights no more than 10 kg and can be easily hidden in a single typical suitcase. Two different SPME fibers were examined—Carboxen/PDMS, 85 µm, Stableflex, and PDMS, 100 µm, fused silica, both purchased from Supelco (USA). A magnetic stirrer plate (IKA C-MAG HS7, IKA-Werke GmbH, Staufen, Germany) and PTFE-coated stir bars were used for stirring the liquid samples during SPME extraction.
Figure 1. Scheme of the miniature multicapillary gas chromatography column (MCGC) speciation analyzer system.
Chromatography 02 00239 g001

2.2. Reagents

Sodium tetraethylborate (TEB) was purchased from Sigma-Aldrich (Germany). Fresh solution, of concentration 1%w/v, was prepared daily by dissolution with redistilled water. High grade individual standard solutions of monobutyltin (MBT), dibutyltin (DBT), tributyltin (TBT), methylmercury (MeHg) (Sigma-Aldrich, Germany) at concentration of 1 mg mL−1 were prepared by weighting and dissolving in analytical grade methanol (with the exception of methylmercury dissolved in 1%v/v HNO3 solution) and stored at fridge. Working solutions were prepared from standard solutions by dilution with redistilled water.

3. Results and Discussion

The optimization of operating parameters of the analyzer has been conducted in order to obtain satisfactory separation of the analytes and the highest sensitivity of the detection system.

3.1. Optical, Technical Parameters and Temperatures

Parameters such as integration time (the time of single spectrum recording), optical fiber position, desorption unit and GC column temperatures, and GC column length, capillaries diameter as long as all plasma operating parameters including power, commutation and frequency have been quickly optimized at the beginning of this study. However, a large number of parameters that needed optimization limited the whole process only to indispensable and surely full optimization has been not completed yet for the analyzer. Operating parameters have been listed below in Table 1.
Table 1. Operating parameters for examined headspace solid-phase microextraction combined with gas chromatography and digitally controlled plasma optical emission spectrometry technique.(HS-SPME-GC-DP-OES).
ParameterOptimum value
Optical conditions
Integration time / ms500
Optical fiber position Axial
Analytical lines / nmSn 284.02Hg 253.67
Analyzer & Chromatography conditions
Desorption temperature / °C195
Column temperature / °C70
Column length / cm5
Column capillary diameter / µm40
Number of capillaries 900
Stationary phase OV-1701
Carrier gas flow / mL min−1100
Plasma conditions
Plasma power supply / W50
Frequency / kHZ45
Auxiliary gas flow / mL min−1150
SPME conditions
Extraction time / min25
Amount of sample / mL10
Amount of added TEB solution / µL100
TEB solution concentration by weight / %1
SPME coatingCarboxen/PDMS and PDMS

3.1. Separation and Multichannel Detection

Due to usage of simultaneous CCD-based spectrometer it was possible to perform multichannel detection, which in practice enables multielement detection. A sample containing trace methylmercury and butyltin compounds has been analyzed. From more than 3600 available chromatograms, three were chosen to show the capabilities of that solution (see Figure 2). These are chromatograms registered for spectral line of tin at 284.02 nm, OH band at 283.87 nm and mercury line at 253.69 nm.
HS SPME-MCGC separations of the organometallic compounds were carried out by using multicapillary column of only 5 cm length with inner diameters of 40 µm with fair separation efficiency (half peak widths below 4 s) in less than 10 s retention time except tributyltin derivative. Retention times of all separated compounds are collected in Table 2. The first occurring peak within 6 ± 2 s corresponds to OH emission, and it has been established as dead retention time. OH band peak is always present when analyzing water samples so it is convenient to use this peak as a reference value for determining reduced retention times that eliminates human factor during manual sample injection. The use of the short 5-cm column allowed a slight decrease of the duration of a run for a full GC analysis of butyltins compared with a 22-cm multicapillary column used by Łobiński et al. [10] for temperature-programmed separation. However, a two-fold decrease of retention times for MBT and DBT was observed compared with a 1-m MCGC column.
Figure 2. Extracted chromatograms registered at Hg (253.69 nm), OH (283.87 nm) and Sn (284.02 nm) wavelengths.
Chromatography 02 00239 g002
Table 2. Reduced retention times obtained for detected compounds by the SPME-MCGC-DP-OES system.
PeakReduced retention time / s
MeHg2.5
MBT3.5
DBT8.0
TBT21.0
The other important observation is a substantial peak tailing from OH emission which influences the baseline for peaks of three butyltin compounds on the chromatogram recorded at 284.02 nm. A reduced solvent loading offered by SPME comparing with typical solvent loading is beneficial for fast GC because retention times for several analyte peaks are very close to that for solvent peak, which, however, is reasonably small in this case. Further, headspace SPME sampling is recommended rather than direct insertion mode to minimize solvent loading. Despite the short column length and relatively high carrier gas flow retention times turned out to be exceedingly long, especially for TBT. These values are similar with those obtained by Schmitt et al. [11] for same organotin compounds using 1 m long multicapillary column and temperature 170 °C. This proves very strong interaction between analyzed compounds and stationary phase at low temperatures, and suggests that MC column temperature would be further optimized. Also, boiling temperatures of the separated compounds should be considered being substantially different for ethylated methylmercury and three butyltin compounds.
As shown in Figure 2, three organotin compounds are separated very well under experimental conditions with the use of the 5 cm-long MCGC column. The resolving power of a multicapillary column is determined by two measurable parameters: carrier gas flow and GC column temperature. Usually an increase of these parameters shorten retention time and peak width. Also, a decrease of analysis time by using a short column will cause a slight decrease in efficiency. Column efficiency values were calculated from following equation:
N = 5.54 ( t R w 0 , 5 ) 2
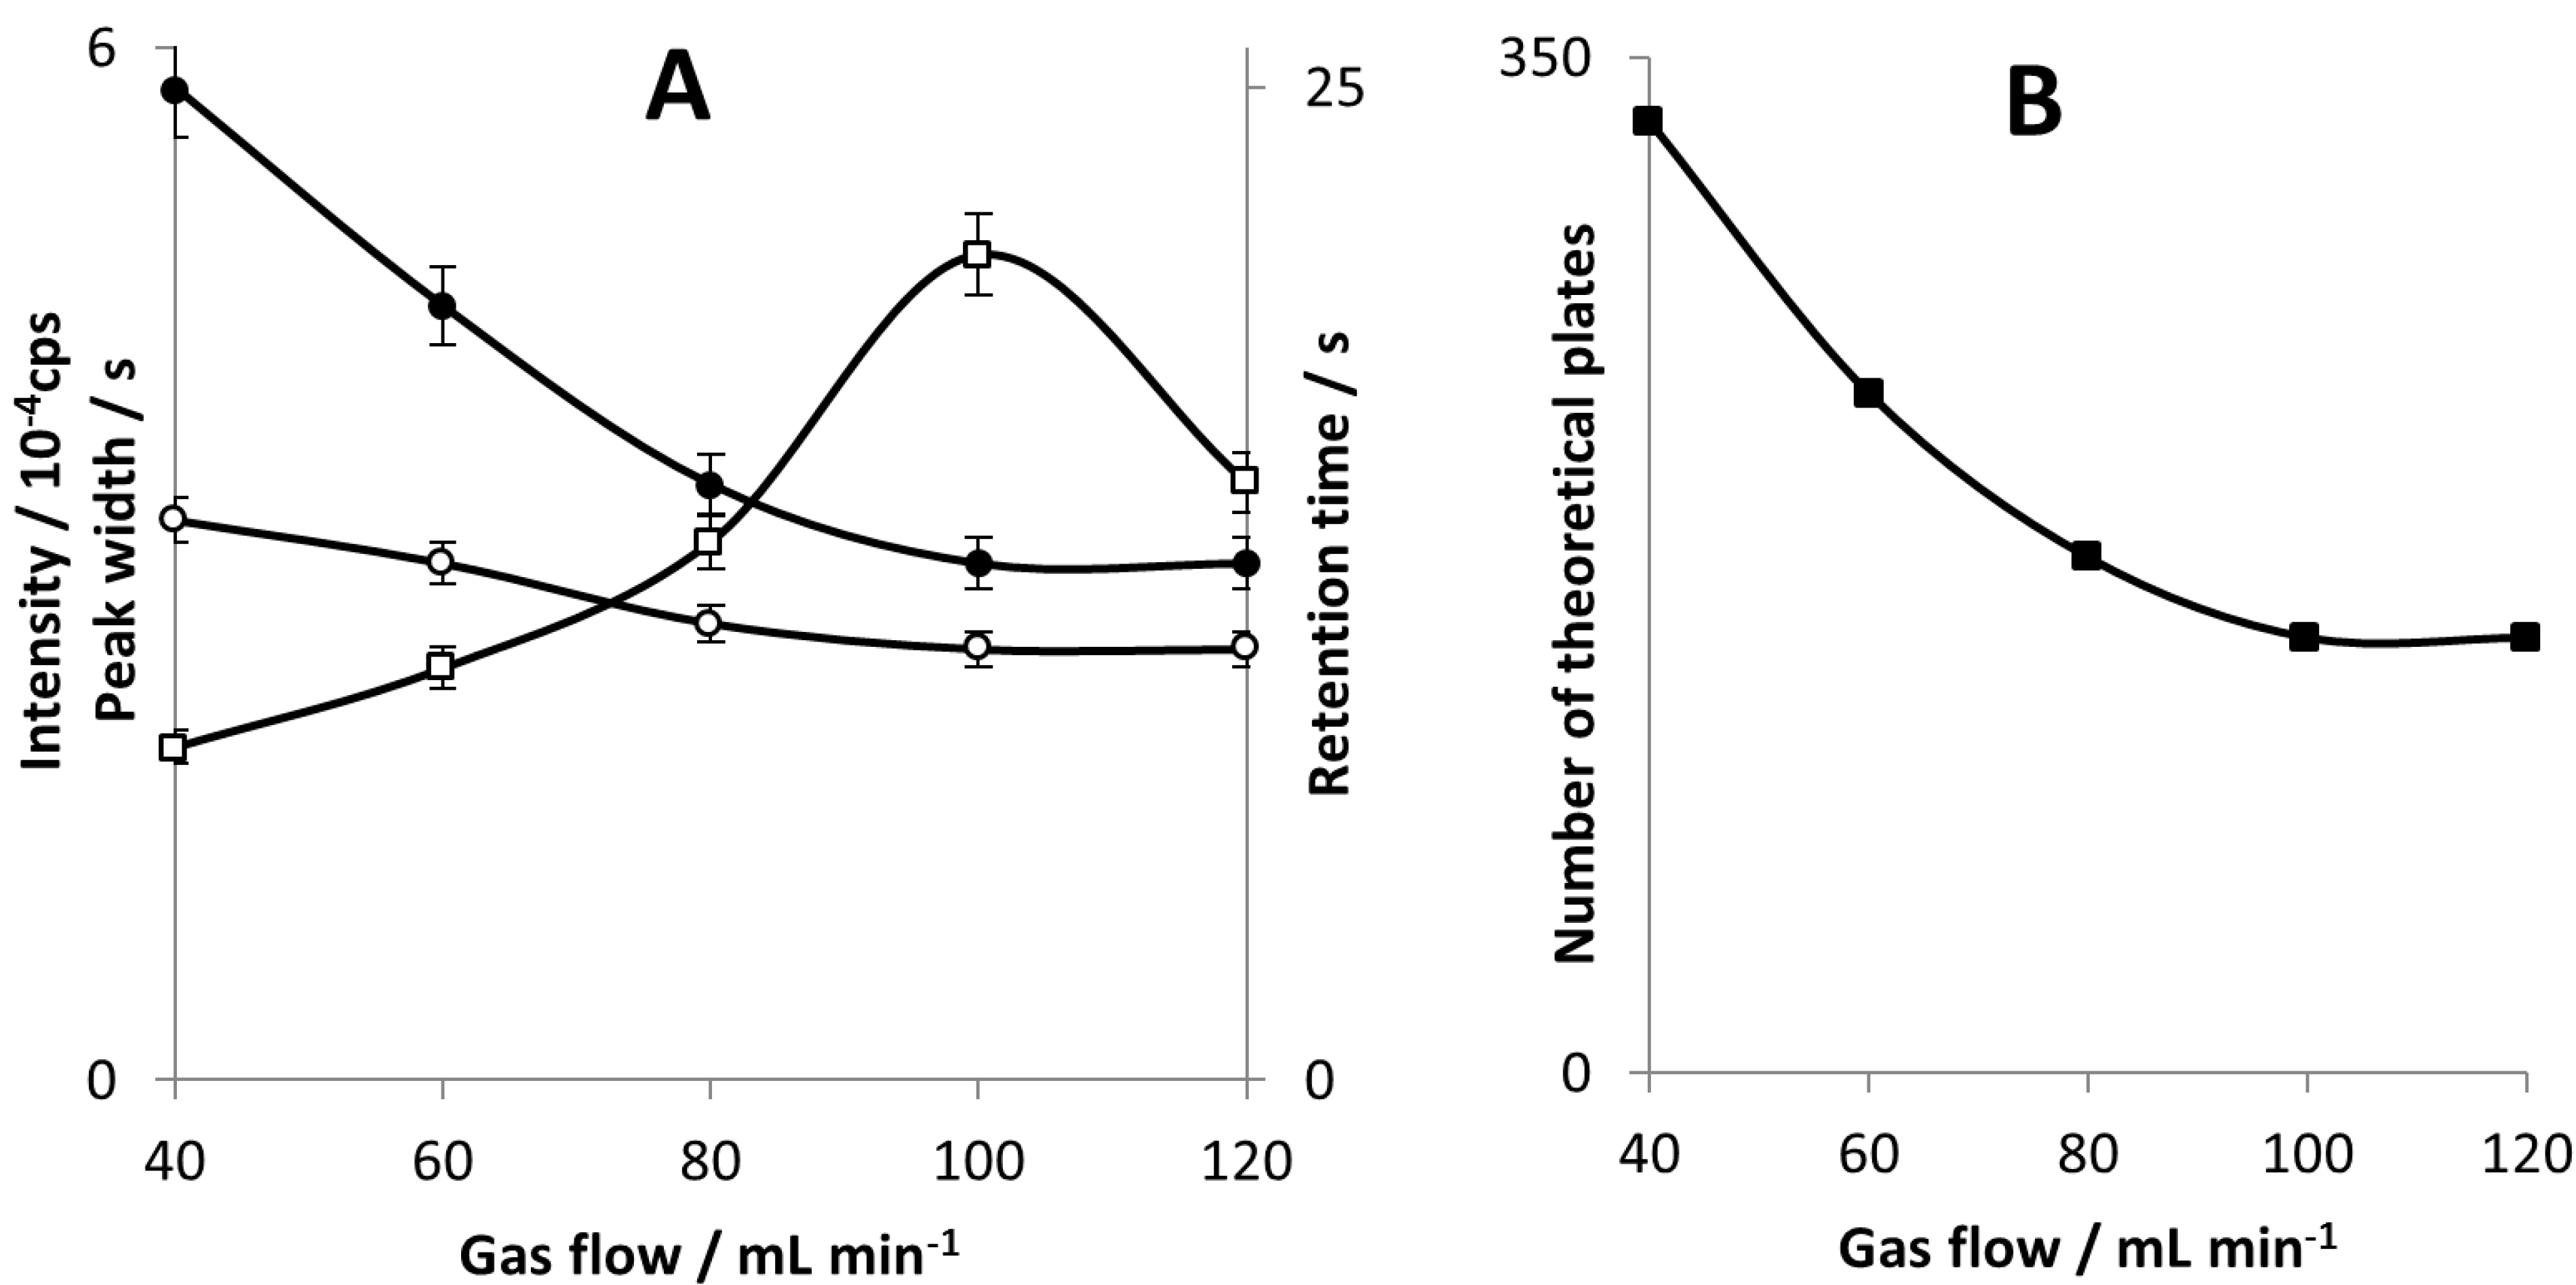
where N is number of theoretical plates, tR is retention time and w 0 , 5 is half peak width. Column efficiency may be also expressed by the theoretical plate height (HETP). MCGC column efficiency has been calculated for DBT and methylmercury. For DBT, the maximum number of theoretical plates and HETP has been determined for carrier gas flow rate of 40 mL∙min−1, and they were 328 and 0.15 mm, respectively. The HETP value is very close to that obtained for tertabutyltin (below 0.2 mm) by Rodriguez Pereiro et al. [12] using a 1 m-long MCGC column coated with SE-30 and fast oven temperature ramp rate. Next, similar calculations have been made for methylmercury for our experimental setup, and the respective data were 270 and 0.18 mm. A similar HETP value has been obtained by Rosenkranz et al. [3] for diethylmercury (0.17 mm) under similar conditions but for 1 m-long MCGC column.
The best peak resolution has been obtained for carrier gas flow rate of 40 mL∙min−1. However, the highest sensitivity of the signal measurement, for both peak area and peak height, have been obtained at gas flow of 100 mL∙min−1 (see Figure 3A). Likely, carrier gas flow rate changes the plasma excitation conditions and thus the response of the detector. A higher gas flow rate shortens sample residence time in the plasma and sample-plasma interaction is too weak. Since plasma deformation and decrease in size were visible with a bare eye, it is probable reason why there is a drop in peak height at 120 mL∙min−1.
Figure 3. Peak intensity (□), peak half-width (○) and retention time (●) for DBT as a function of carrier gas flow (A); column efficiency (■) calculated for DBT as a function of a carrier gas flow (B).
Chromatography 02 00239 g003
Our study revealed that carrier gas flow in the range of 40–120 mL min−1 significantly influences column separation efficiency. This fact is probably due to the short column length and the use of SMPE which is known to be relatively slow desorption method. That is why peak width changes very little with increasing gas flow. However, retention time shows a significant decrease with increasing gas flow so it is not balanced by peak half-width and as a result column efficiency is gas flow dependent in examined range.
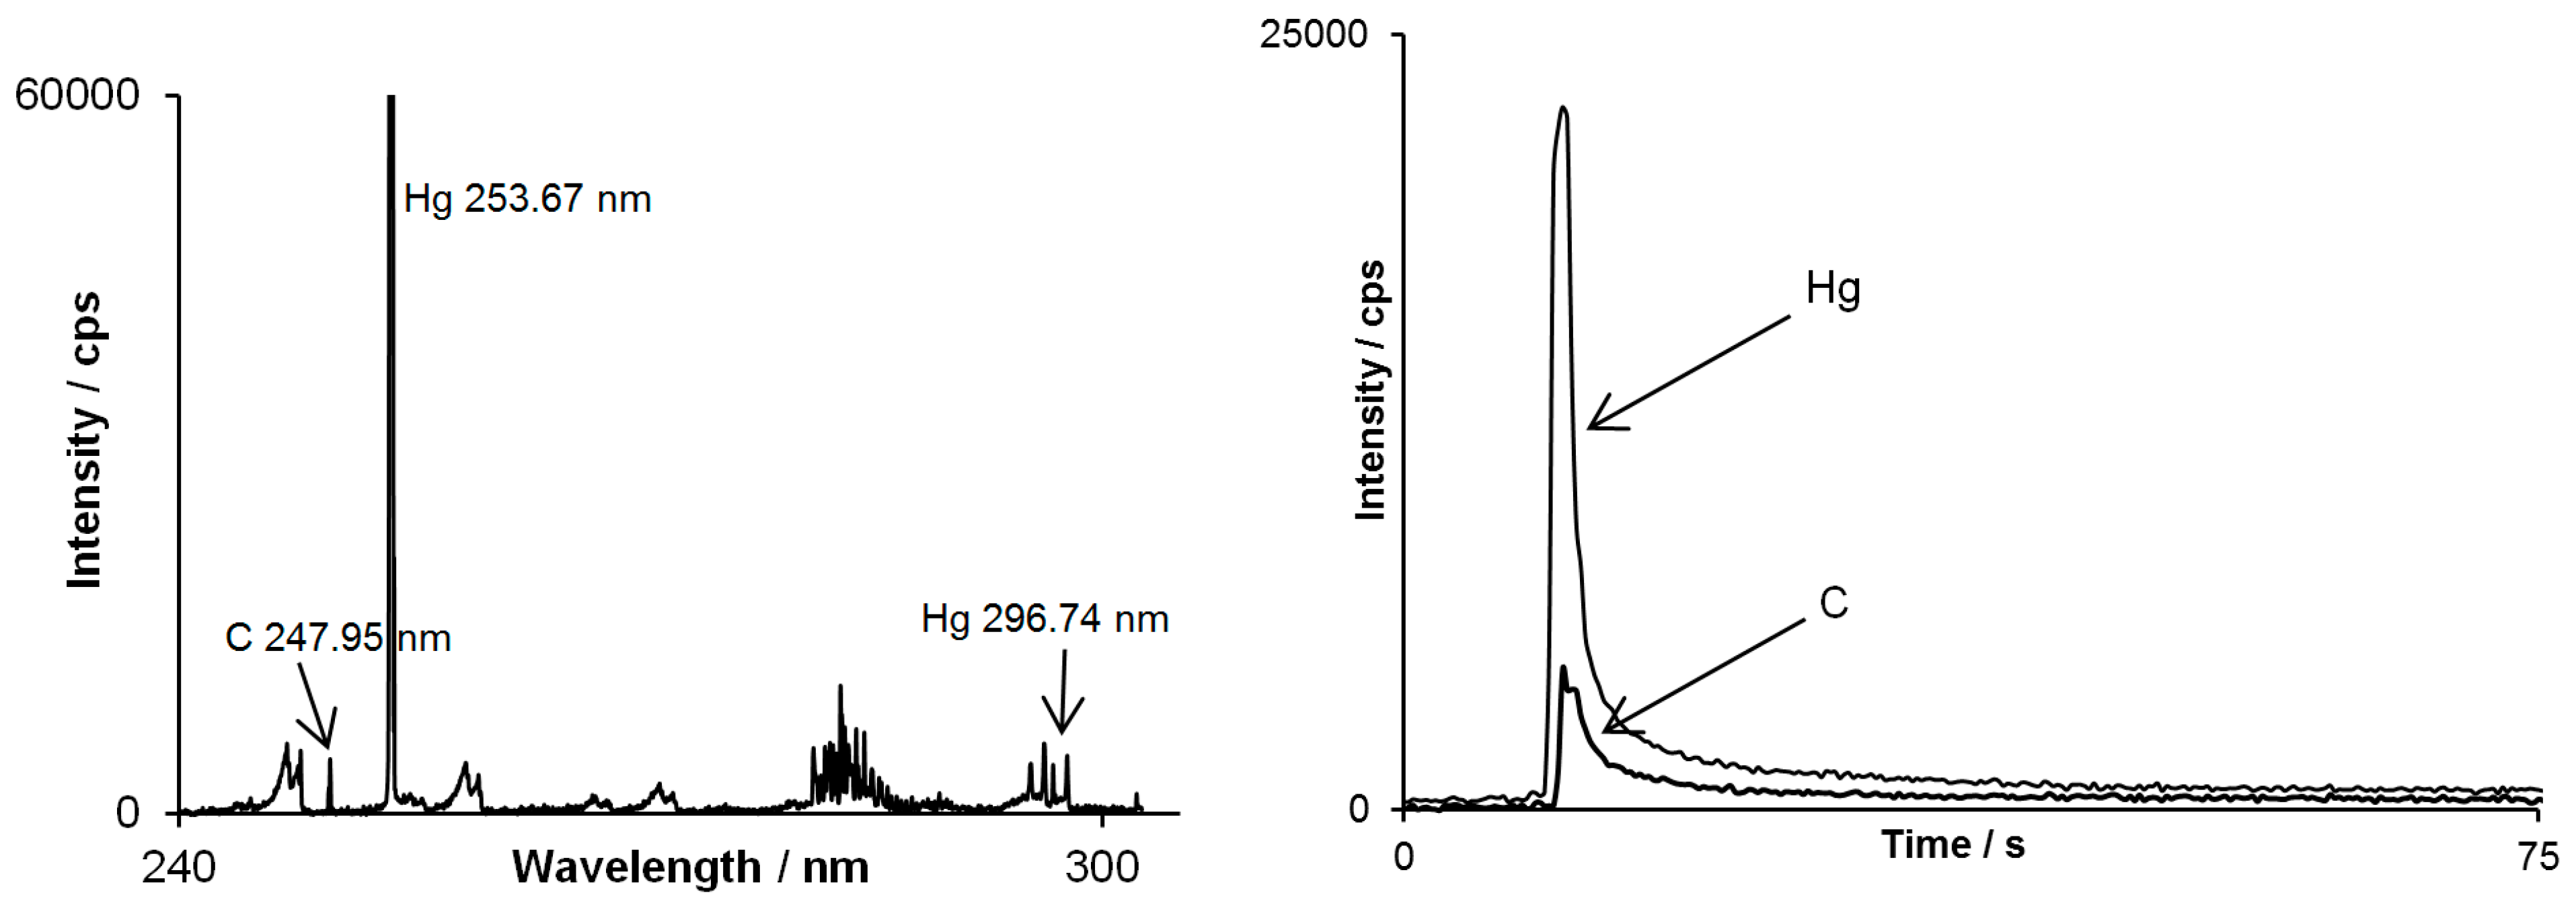
However there is another important feature which comes with the multichannel CCD-based detector used in this study in context of separation techniques. When an analyte examined is an unknown substance, a registered emission spectrum assigned to its peak may support the identification of the substance along with the retention time value. As shown in Figure 4, on emission spectrum assigned to methylmercury peak, besides strong mercury line, carbon line occurred as well. This indicates that mercury is chemically bounded to carbon atom(s) and approves the identification of methylmercury.
Figure 4. Spectrum by DP-OES assigned to the methylmercury peak (on the left) and chromatograms simultaneously registered for mercury line at 253.67 nm and carbon line at 247.95 nm (on the right).
Chromatography 02 00239 g004
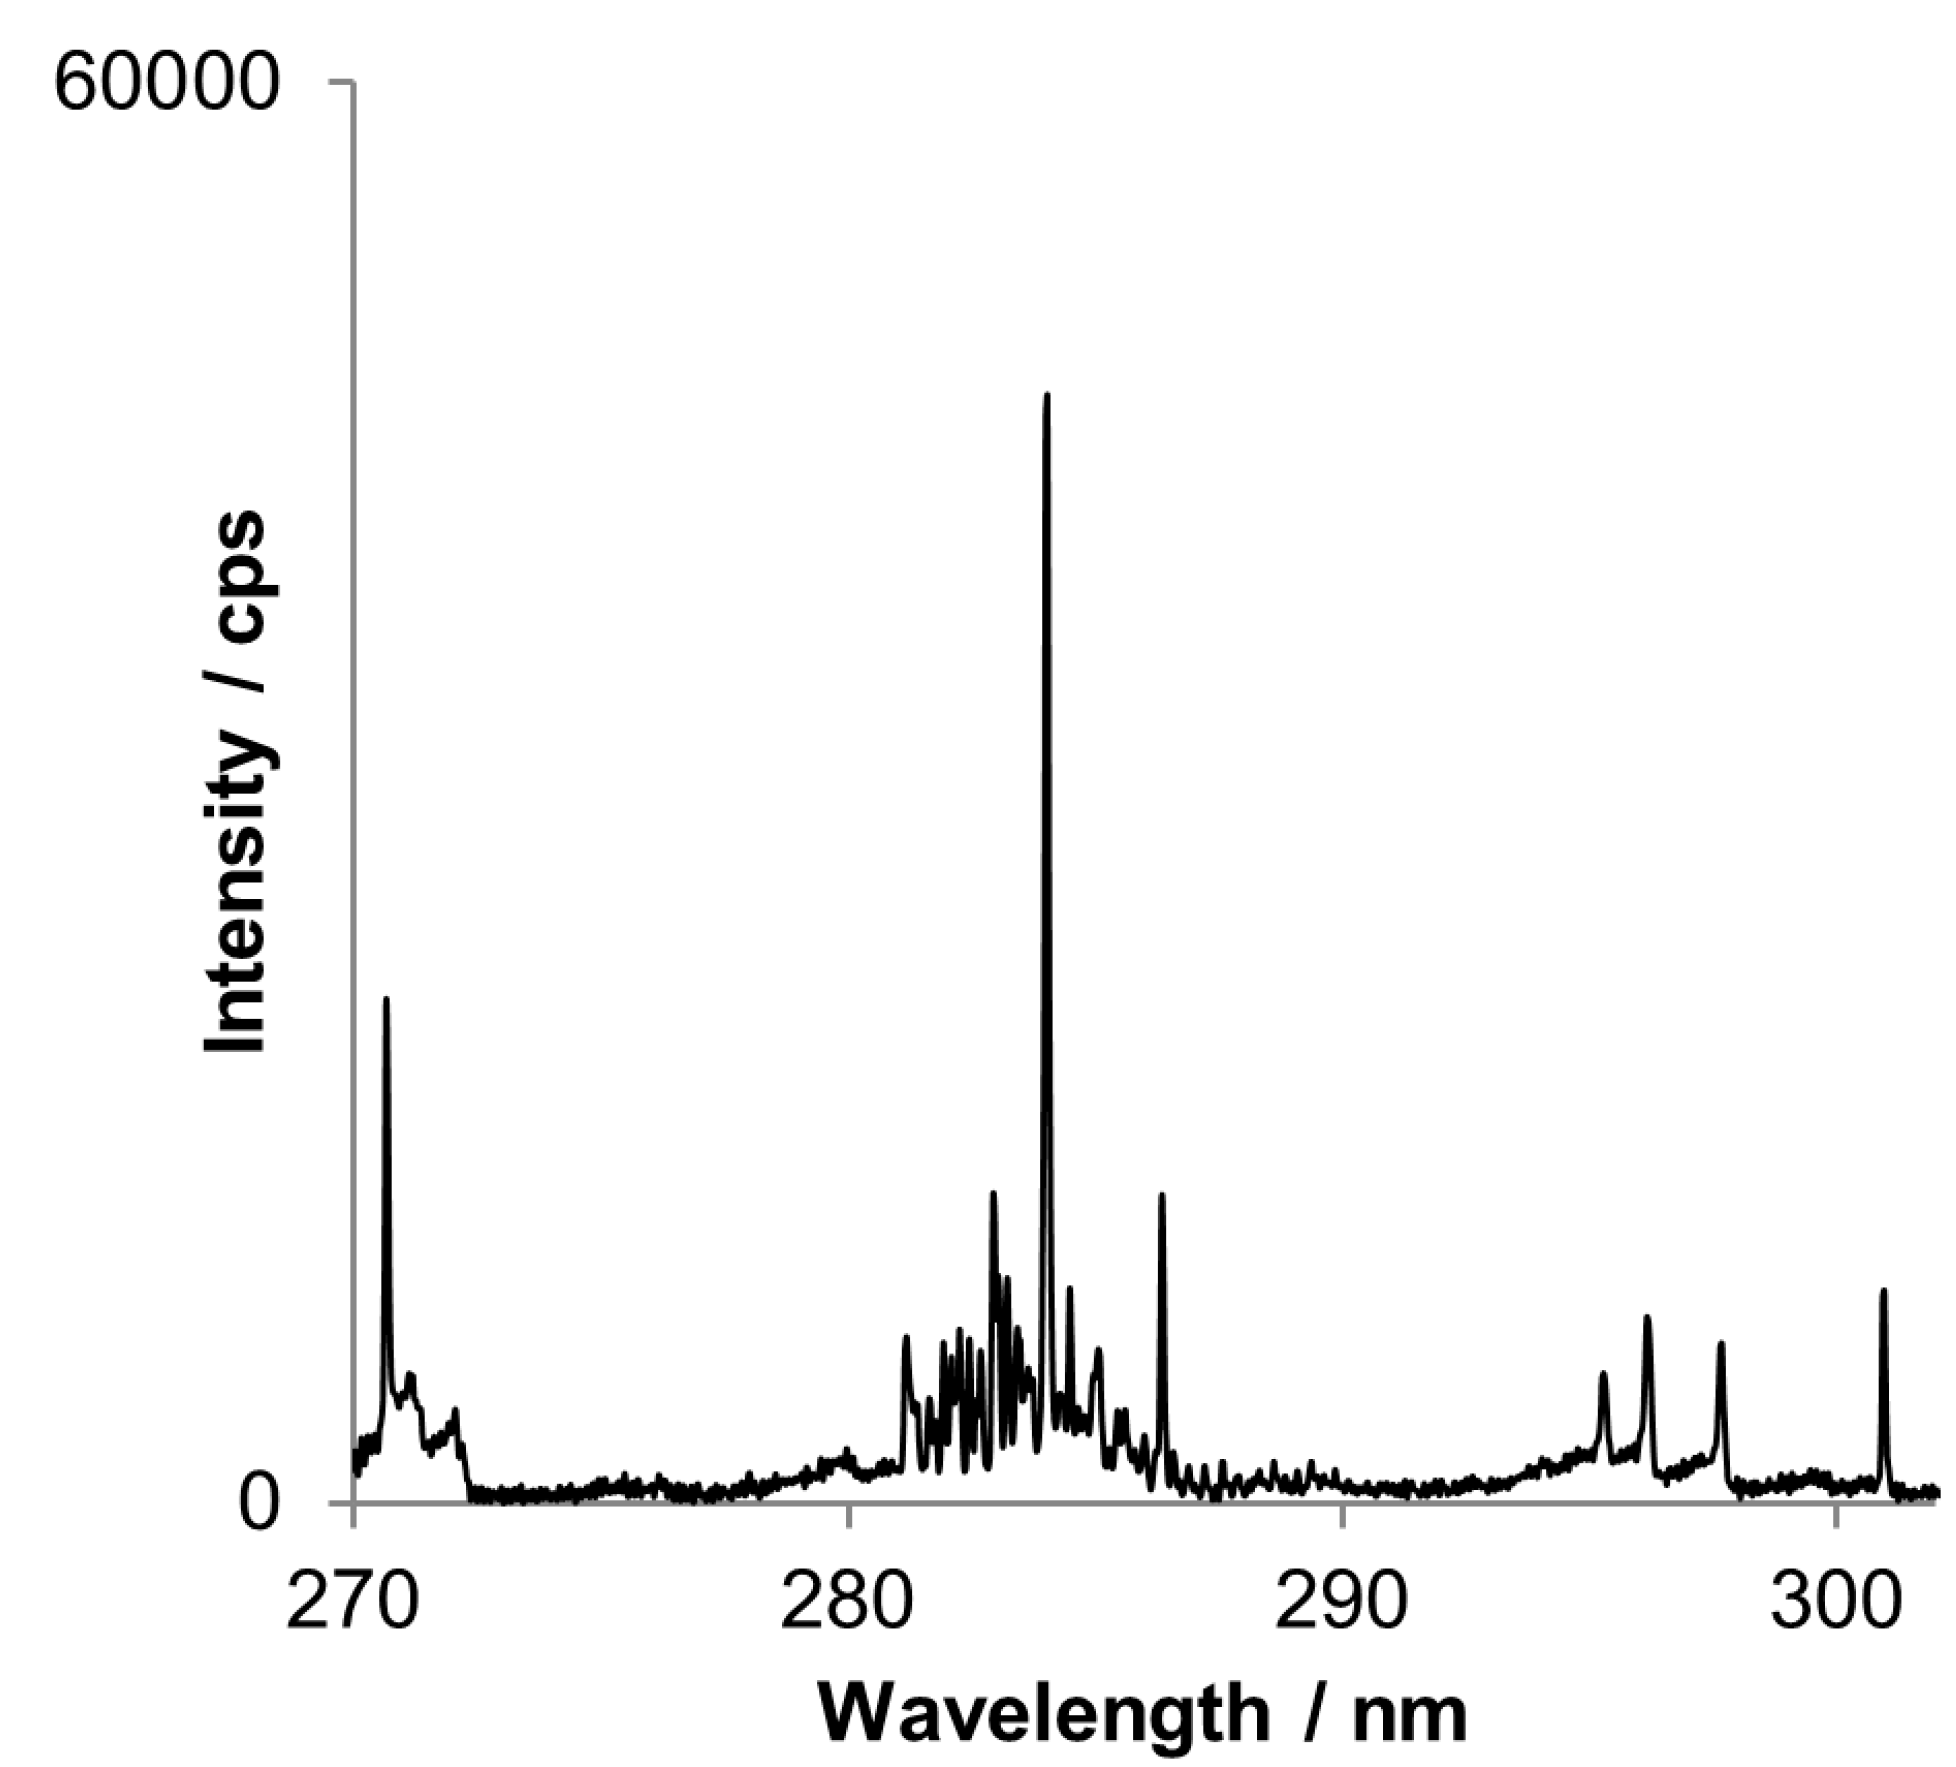
Another advantage of simultaneous CCD-based detector is possibility of best analytical line selection. When a commonly used analytical line is too strong and saturates the detector, less sensitive line may be chosen for external calibration. Recording whole spectra is also helpful when the prominent line is interfered. However as it is discussed below spectral interference does not exclude affected line when using the CCD-based detector. Often met problem is a spectral line interference caused by molecular band or background drift, as exemplary shown for tin lines in Figure 5. However this unfavorable situation may be avoided by subtraction of the transient signal registered for a “neighboring” pixel, because molecular bands are generally wide and many pixels are similarly affected by the interfering OH emission while they do not contain analyte emission. An example is attached in Figure 6.
Figure 6A represents a chromatogram for three butyltin compounds. The most sensitive line of tin (284.02 nm) in this spectral range is significantly interfered by emission of OH rotational band (281–285 nm), typically present in spectra of cold plasmas. The interference is disclosed as long background tailing, because water is always present in a considerable amount. A simple subtraction of chromatogram at 283.87 nm where OH band emission is the same as for 284.02 nm and does not contain tin emission, deals the problem entirely. This procedure is repeatable for all tested conditions and can help to avoid strong interference without the need of performing additional measurements. Eventually profile of corrected chromatogram for 284.02 nm line is the same as for non-interfered line at 300.92 nm (Figure 6B).
Figure 5. A part of the spectrum by DP-OES assigned to the DBT peak (second peak on chromatograms below). Tin lines at 284.02 and 286.34 nm are interfered by OH rotational band.
Chromatography 02 00239 g005
Figure 6. Corrected chromatogram registered for tin spectral line at 284.02 nm (A) compared to chromatogram for non-interfered tin spectral line and 300.92 nm (B). After baseline correction profiles are similar for both chromatograms.
Chromatography 02 00239 g006

3.2. SPME Optimization and Analytical Performance Calculation

The SPME procedure has been briefly optimized in order to achieve maximum sensitivity, efficient use of expensive reagents and reasonably short extraction time. Parameters are listed in Table 1. In order to evaluate the performance of SPME sampling of butyltin compounds, the experimental extraction effieciency has been determined according to Haberhauer Troyer et al. [13] who proposed a simple procedure for estimation of the extraction efficiency (EE), based on successive extractions of the same sample after the derivatization step. The following equation is given below.
l o g P A n = l o g ( 1 E E 100 ) ( n 1 ) + l o g P A 1
where PAn is peak area, and n is number of extractions. The EE (%) can be calculated from the slope of the linear regression. Results for each butyltin compound are listed in Table 3.
Table 3. Experimental extraction efficiency values for sampling of butyltins with PDMS fiber coating.
CompoundExtraction efficiency / %
MBT2.0
DBT53.5
TBT54.0
TBT and DBT exhibit very high extraction efficiency exceeding 50% whilst MBT reaches only 2%. The difference was easily recognized during succesive extractions when for first two compunds forth extraction signals were bearly measurable while for MBT it was possible to carry on more than 15 measurements with similar signal value. Also, the lower extraction efficiency of MBT comparing to DBT and TBT was observed in numerous studies, however, the nature of this discrepancy remains unknown and further investigation is required. The extraction efficiency values for DBT and TBT are very high when comparing to 4% and 8% obtained by Grinberg et al. [14] for CH3Hg+ and Hg2+, respectively.
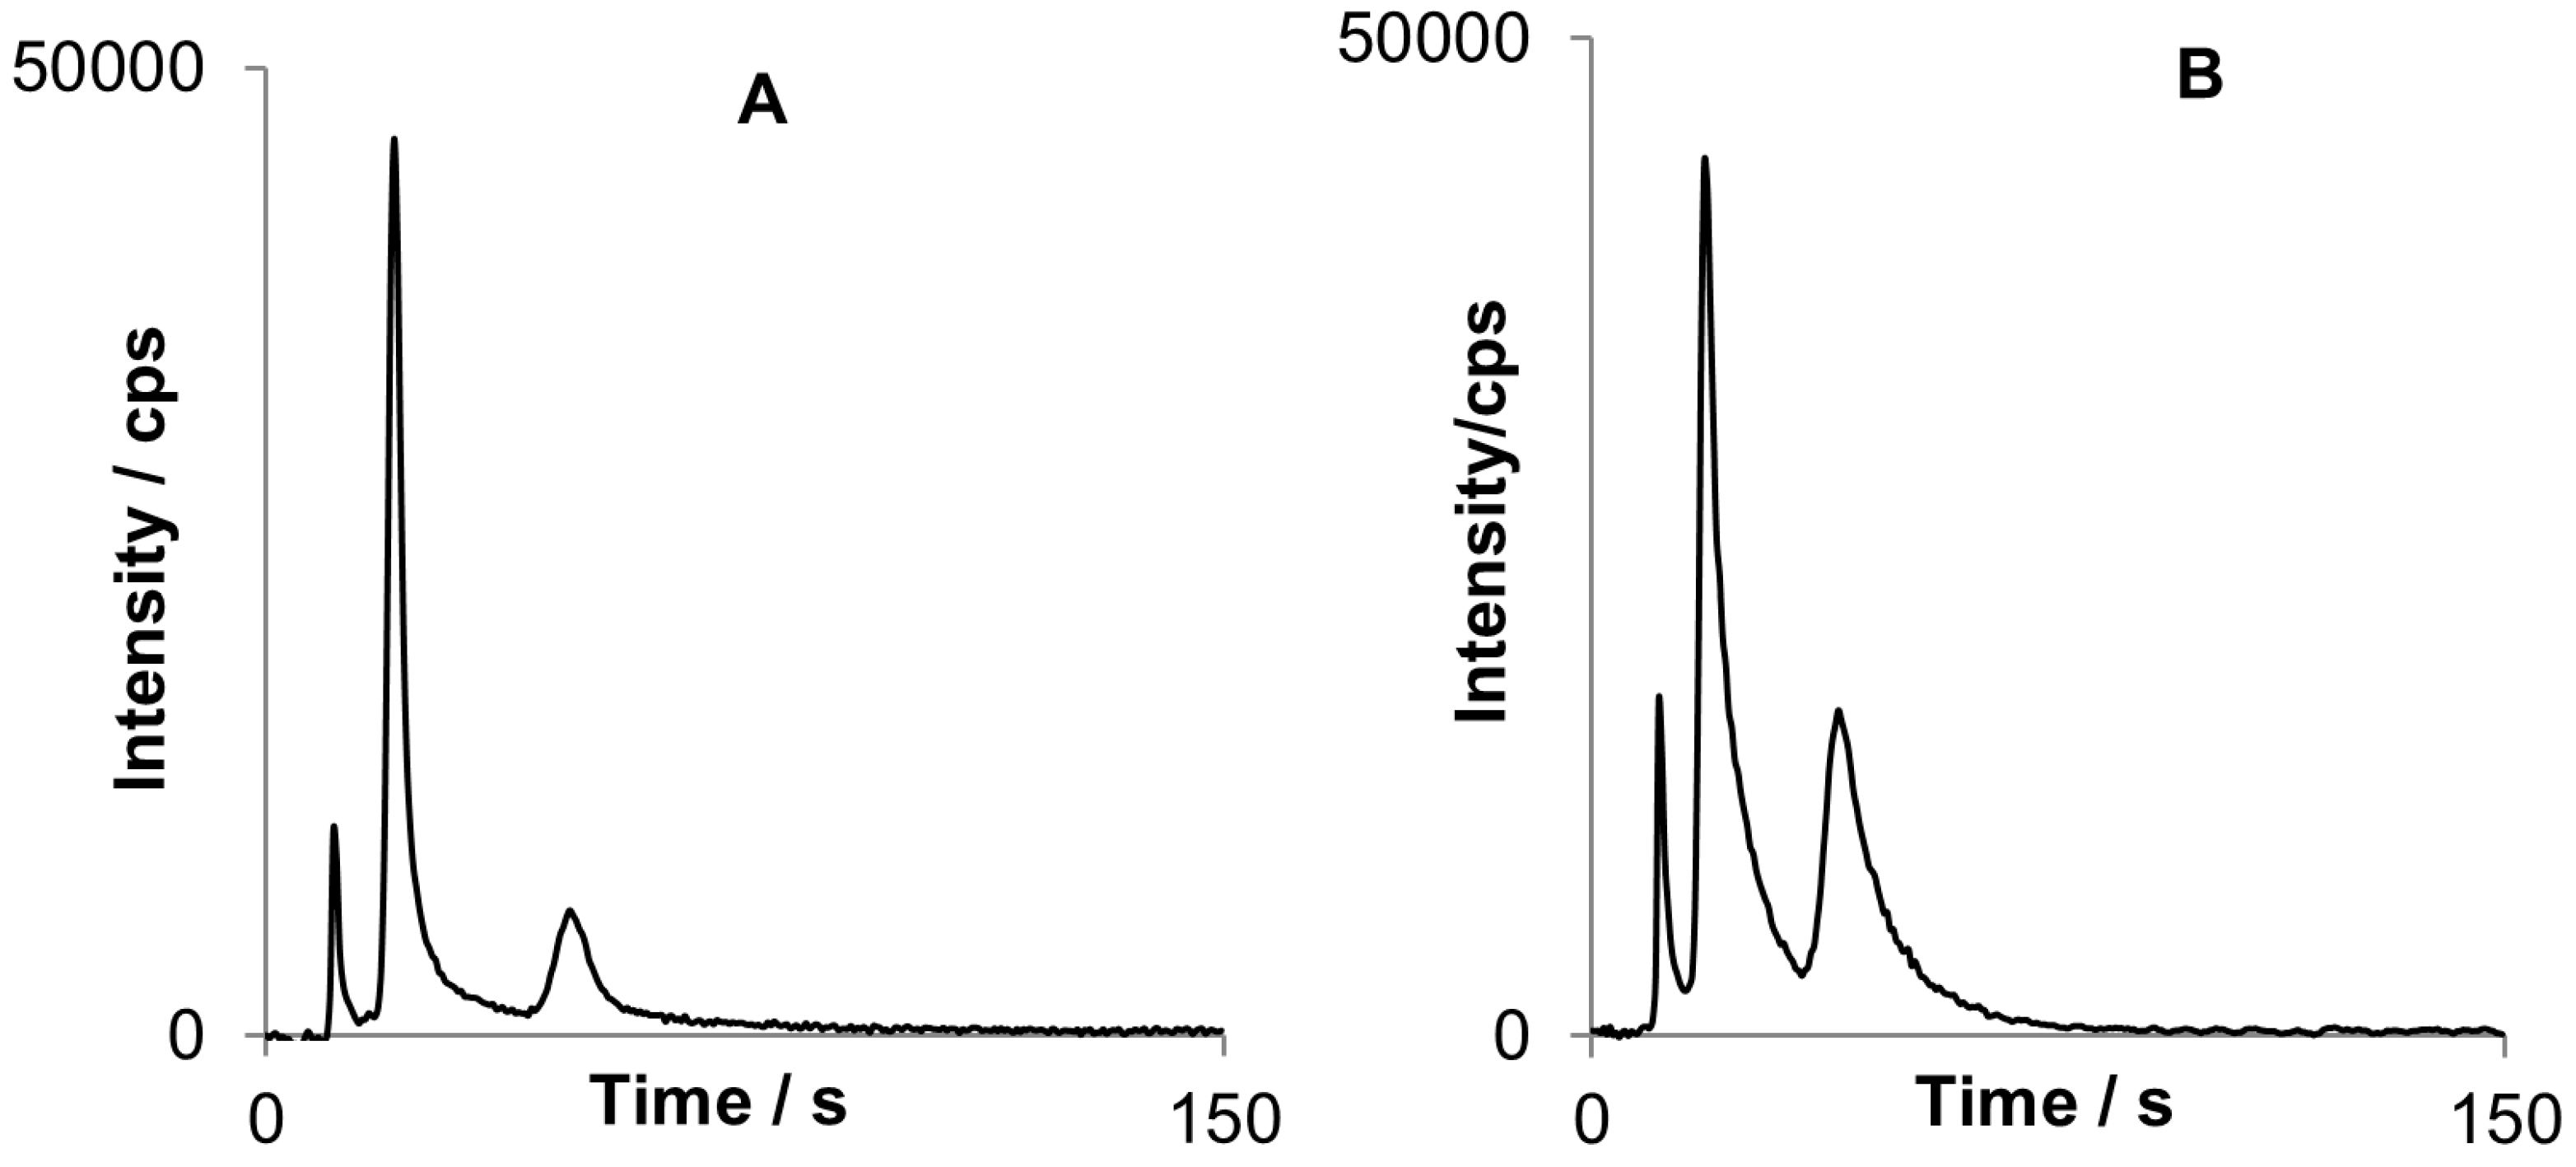
Two different fiber coatings were examined for SPME sampling procedure: Carboxen/PDMS and PDMS. To compare the performance of these fibers same sorption and detection conditions were applied (Figure 7).
Figure 7. Two chromatograms obtained for MBT (first peak), DBT (second peak) and TBT (third peak): Chromatogram A) was obtained after sorption on Carboxen/PDMS fiber while (B) with the use of PDMS fiber.
Chromatography 02 00239 g007
PDMS fiber turned out to be better for organotin sorption, especially for DBT and TBT with peak areas approximately twice bigger than for Carboxen/PDMS in similar conditions. However the peaks are not fully separated that implies further optimization of the system when using PDMS.
The fiber performance was evaluated and confirmed through the fiber concentration capability index (Fij), first introduced by Zuba et al. [15] and modified by Hamm et al. [16] as:
F i j = Σ i H i j 1 k Σ i j H i j
where Fij is the concentration capability index of fiber j for analyte i, k is the number of fibers investigated and Hij is the peak height of analyte i with fiber j.
The fiber concentration capability index for PDMS and Carboxen/PDMS fibers was calculated to be 1.08 and 0.98, respectively. That is why PDMS fiber is recommended. On the other hand, peak shapes and lower half peak widths obtained after sorption with the use of Carboxen/PDMS comparing with PDMS suggest that desorption of the analytes from the former sorbent goes more rapidly that is beneficial for the fast GC approach.
Basic analytical parameters has been calculated for dibutyltin as experimental conditions seem to be the most optimized for this compound so far. The signal intensity as a function of DBT concentration for two fiber coatings is sketched in Figure 8.
Figure 8. Linearity range estimated for PDMS (●) and Carboxen/PDMS fiber (○).
Chromatography 02 00239 g008
This calibration function is based on peak height measurements since peak area dependence turned out to be not linear. Upper concentration limit of linearity for both fiber coatings is approximately close to 100 ng mL−1. This means that the fibers capacity is reached for this amount of analytes and leads to the conclusion that upper limit of linearity is defined rather by the fiber properties than by the performance of the detection system. For all analyzed butyltin compounds limits of detection has been calculated (LOD = 3σblank / s where σblank is blank signal standard deviation and s is method sensitivity) and were in respect to tin 278 pg mL−1, 106 pg mL−1, 235 pg mL−1 for MBT, DBT and TBT, respectively. Despite big difference in extraction efficiency between MBT and TBT LODs are in the same range. Generally, for all LOD calculations peak height was used as analytical signal, which was actually similar for both compounds. However, when comparing MBT and TBT peak area at the same concentrations the second one characterizes much bigger value. That is why further system optimization must be performed in order to make TBT signal more sharp. Presented limits of detection are higher than those obtained by Botana et al. [4], which were in the range of 1–5 pg mL−1. Significant decrease in sensitivity comparing to mentioned results can be explained by the use of miniature CCD-based spectrometer which obviously cannot match the performance of lab-standing spectrometers. Another factor is also a relatively low excitation efficiency of the DP source comparing with MIP source commonly used in atomic emission detectors. This implies the need of further improvement in developing small-sized portable and low-cost analyzer. Nevertheless, the limits of detection obtained in this study are fairly low to make promise for future study.
4. Conclusion

The presented analytical setup combines numerous techniques and contains some novel and not used before in this field features like rotating helium plasma source and simultaneous spectra recording. Combining MCGC with presented miniaturized plasma source is beneficial because using specifically thin plasma causes short sample residence and short-term signal emission. Thus presented solution is very promising in context of detecting signal from fast chromatography technique which is usually characterized by very short and sharp signals. Since many different parameters may influence the system efficiency, optimization process is long and laborious; however, some milestones have been reached so far. Basic operational parameters for SPME and analyzer have been optimized as well as fundamental trends and relations have been described and explained. The dimension of the short column used in this work (5 cm in straight alignment) allows for further miniaturization of the GC separation unit and the development of a compact MCGC-DP-OES analyzer for speciation analysis in remote environment. Owing to miniature plasma source the device characterizes low energy (less than 200W for plasma and heating) and media consumption (270 mL∙min−1 of helium). All these efforts were made in order to minimize the size, the cost of apparatus and maintenance to make it commonly available and fully portable in future. This solution, if succeeded, may be very attractive for all analysts involved in ecology and pollutant control as employed prototype device allowed for simultaneous and fast analysis of three organotin compounds and methylmercury at sub-ppm levels that was confirmed in this study. Moreover, mentioned compounds are currently classified as one of the most dangerous pollutants of seas and oceans on our planet so rapid and cheap analysis of these chemicals is a critical point in environmental research. Therefore, we expect that presented device will meet a lot of interest since there is no other possibility to perform similar analyzes out of the laboratory and without excessive financial expenses. Further optimization will probably let improve sensitivity for at least one order of magnitude comparing to presented results. Furthermore analysis of other organometallic compounds should be examined in nearest future to evaluate the usefulness of presented setup.

Acknowledgments

This project is financed in the framework of grant entitled “Production and attestation of new types of reference materials crucial for achieving European accreditation for polish industrial laboratories” attributed by the National Center for Research and Development.

Author Contributions

Jacek Giersz and Monika Truskolaska performed the experiments, Jacek Giersz analyzed the data and wrote the paper. All steps have been made under Prof. Krzysztof Jankowski’s supervision.

Conflicts of Interests

The authors declare no conflict of interest.

References

  1. Pereiro, I.; Wasik, A.; Łobiński, R. Determination of mercury species in fish reference materials by isothermal multicapillary gas chromatography with atomic emission detection after microwave-assisted solubilization and solvent extraction. J. Anal. At. Spectrom. 1998, 13, 743–747. [Google Scholar] [CrossRef]
  2. Pereiro, I.; Łobiński, R. Fast Species-selective Screening for Organolead Compounds in Gasoline by Multicapillary Gas Chromatography With Microwave-induced Plasma Atomic Emission Detection. J. Anal. At. Spectrom. 1997, 12, 1381–1385. [Google Scholar] [CrossRef]
  3. Rosenkranz, B.; Bettmer, J. Rapid separation of elemental species. Anal. Bioanal. Chem. 2002, 373, 461–465. [Google Scholar] [CrossRef] [PubMed]
  4. Botana, J.; Rodríguez, R.; Díaz, A.; Ferreira, R.; Torrijos, R.; Pereiro, I. Fast and simultaneous determination of tin and mercury species using SPME, multicapillary gas chromatography and MIP-AES detection. J. Anal. At. Spectrom. 2002, 17, 904–907. [Google Scholar] [CrossRef]
  5. Dietz, C.; Landaluze, J.S.; Ximénez-Embún, P.; Madrid-Albarrán, Y.; Cámara, C. Volatile organo-selenium speciation in biological matter by solid phase microextraction–moderate temperature multicapillary gas chromatography with microwave induced plasma atomic emission spectrometry detection. Anal. Chim. Acta 2004, 501, 157–167. [Google Scholar] [CrossRef]
  6. Botana, C.; Pereiro, I.; Torrijos, R. Rapid determination of butyltin species in water samples by multicapillary gas chromatography with atomic emission detection following headspace solid-phase microextraction. J. Chromatogr. A 2002, 963, 195–203. [Google Scholar] [CrossRef] [PubMed]
  7. Noventa, S.; Barbaro, S.; Formalewicz, M.; Gion, C.; Rampazzo, F.; Boscolo Brusà, R.; Gabellini, M.; Berto, D. A fast and effective routine method based on HS-SPME–GC–MS/MS for the analysis of organotin compounds in biota samples. Anal. Chim. Acta 2015, 858, 66–73. [Google Scholar] [CrossRef] [PubMed]
  8. Tyburska, A.; Jankowski, K.; Rodzik, A. Determination of arsenic and selenium by hydride generation and headspace solid phase microextraction coupled with optical emission spectrometry. Spectrochim. Acta Part B 2011, 66, 517–521. [Google Scholar] [CrossRef]
  9. Jankowski, K.; Ramsza, A.; Reszke, E.; Tyburska, A. A digitally controlled rotating field plasma source for analytical spectrometry. J. Anal. At. Spectrom. 2012, 27, 1287–1293. [Google Scholar] [CrossRef]
  10. Łobiński, R.; Sidelnikov, V.; Patrushev, Y.; Rodriguez, I.; Wasik, A. Multicapillary column gas chromatography with element-selective detection. Tr. Anal. Chem. 1999, 18, 449–460. [Google Scholar] [CrossRef]
  11. Schmitt, V.; Pereiro, I.; Łobiński, R. Flash Species-selective Analysis by Multicapillary Gas Chromatography with Microwave Induced Plasma Atomic Spectrometric Detection. Anal. Commun. 1997, 34, 141–143. [Google Scholar] [CrossRef]
  12. Pereiro, I.; Wasik, A.; Łobinski, R. Purge-and-Trap Isothermal Multicapillary Gas Chromatographic Sample Introduction Accessory for Speciation of Mercury by Microwave-Induced Plasma Atomic Emission Spectrometry. Anal. Chem. 1998, 70, 4063–4069. [Google Scholar] [CrossRef] [PubMed]
  13. Haberhauer-Troyer, C.; Rosenberg, E.; Grasserbauer, M. Evaluation of solid-phase microextraction for sampling of volatile organic sulfur compounds in air for subsequent gas chromatographic analysis with atomic emission detection. J. Chromatogr. A 1999, 848, 305–315. [Google Scholar] [CrossRef]
  14. Grinberg, P.; Campos, R.; Mester, Z.; Sturgeon, R. Solid phase microextraction capillary gas chromatography combined with furnace atomization plasma emission spectrometry for speciation of mercury in fish tissues. Spectrochim. Acta Part B 2003, 58, 427–441. [Google Scholar] [CrossRef]
  15. Zuba, D.; Parczewski, A.; Reichenbacher, M. Optimization of solid-phase microextraction conditions for gas chromatographic determination of ethanol and other volatile compounds in blood. J. Chromatogr. B 2002, 773, 75–82. [Google Scholar] [CrossRef]
  16. Hamm, D.; Lesellier, E.; Bleton, J.; Tchapla, A. Optimization of headspace solid phase microextraction for gas chromatography/mass spectrometry analysis of widely different volatility and polarity terpenoids in olibanum. J. Chromatogr. A 2003, 1018, 73–83. [Google Scholar] [CrossRef] [PubMed]