Next Article in Journal / Special Issue
Effects of Different Levels of Echinostoma caproni Miracidial Dose on Glucose and Maltose Composition of Biomphalaria glabrata Snails as Determined by High Performance Thin-Layer Chromatography-Densitometry
Previous Article in Journal
The Evaluation of Magnetic Polymethacrylate-based Microspheres Used for Solid Phase DNA Micro-Extraction
Previous Article in Special Issue
Analysis of Bioactive Components of Oilseed Cakes by High-Performance Thin-Layer Chromatography-(Bio)assay Combined with Mass Spectrometry
 
 
Please note that, as of 1 January 2016, Chromatography has been renamed to Separations and is now published here.
Article

A Hyphenated Technique based on High-Performance Thin Layer Chromatography for Determining Neutral Sphingolipids: A Proof of Concept

1
ICB-CSIC, C/ Miguel Luesma, 4, 50018 Zaragoza, Spain
2
Departamento de Química Analítica, Universidad de Zaragoza, 50009 Zaragoza, Spain
3
CEQMA-CSIC, Facultad de Ciencias, Universidad de Zaragoza, 50009 Zaragoza, Spain
4
ICMA-CSIC, Facultad de Ciencias, Universidad de Zaragoza, 50009 Zaragoza, Spain
5
Departamento de Química-Física, Universidad de Zaragoza, 50009 Zaragoza, Spain
*
Author to whom correspondence should be addressed.
Chromatography 2015, 2(2), 167-187; https://doi.org/10.3390/chromatography2020167
Submission received: 21 January 2015 / Revised: 16 March 2015 / Accepted: 26 March 2015 / Published: 8 April 2015
(This article belongs to the Special Issue New Trends in Thin-Layer Chromatography)

Abstract

:
Hyphenated HPTLC has been used to analyze several neutral sphingolipids acting as lysosomal storage disease (LSD) biomarkers. Automated multiple development (AMD) provides separation of lipid peaks, which are detected and quantified using fluorescence detection by intensity changes (FDIC) after primuline post-impregnation. A final online transfer to a mass spectrometer by means of an elution-based interface allows their identification using electrospray ionization (ESI) and atmospheric pressure chemical ionization (APCI).Given that the increases in fluorescent emission detected by FDIC are produced by non-specific, electrostatic interactions between the primuline and hydrocarbon chains in the ceramide backbones of sphingolipids, it is a non-destructive detection technique, allowing the precise location and transfer of biomarker peaks to a mass spectrometer using an elution interface. By using primuline as a fluorophore, the technique is also compatible with ESI-APCI and does not interfere with the MS of sphingolipids. APCI provides useful and complementary structural information to the ESI for sphingolipid identification. Moreover, FDIC emission can be used for quantitative purposes. Results include the determination of sphingomyelin (SM) in human-plasma samples (RSD < 6%) by means of a standard addition method with non-linear calibration, and the identification of globotriaosylceramide (Gb3) in the plasma of a Fabry patient. Only one HPTLC plate is needed to perform the analysis.

1. Introduction

Lysosomal storage diseases (LSDs) are a group of approximately 50 rare, inherited metabolic disorders caused by lysosomal dysfunction, usually as a consequence of the deficiency of a single enzyme, which causes accumulation of different sphingolipids (SLs) within the cell [1]. Among these, certain neutral SLs, such as glucosylceramide (GluCer), globotriaosylceramide (Gb3), and sphingomyelin (SM), have been considered biomarkers of Gaucher, Fabry, and Niemann–Pick diseases, respectively. Increased concentrations in body fluids (plasma, urine) and certain tissues have been associated with progression of the disease or response to Enzyme Replacement Therapy [1,2,3,4,5].
A number of works suggest that several related isoforms and analogs of the aforementioned SLs [4], in addition to their lyso-derivatives [5,6], may also be potentially reliable biomarkers of certain diseases. SLs are not pure compounds. Each SL is a mixture of several isoforms (from different fatty acid derived chains coupled by amide linkage to the sphingoid chain in the ceramide) and analogs (from sphingoid-bases other than d18:1 sphingosine). A lyso-SL has the same polar group as the related SL but only the sphingoid chain instead of the complete ceramide moiety.
Recently, Schiffmann et al. [7] found that Gb3 is elevated not only in patients with Fabry disease but also in the general population of patients with non-Fabry-related heart disease. According to this study, elevated Gb3 may be a risk marker with prognostic value for assessment of near-term risk of death.
Separation and identification of SL isoforms and analogs take advantage of the high resolutive power of gradient separation by Ultrahigh Performance Liquid Chromatography (UPLC/UHPLC) coupled with tandem mass spectrometry [5,6,8]. However, this technique is complex and costly, in equipment and maintenance, in run time per sample, and in data processing time. LC-based hyphenated systems are designed for obtaining all possible information about the sample in a single experiment [9]. Such systems require the development of expensive and complex equipment and the ability to handle large amounts of data. Once a run starts, it cannot be aborted, meaning that this mode of operation leads to high costs in time and solvents. This may not necessarily be the best option in the case of samples for which different information is sought.
HPTLC has been the technique of choice for lipids, and is particularly well adapted to providing lipid-class separations [10].
High Performance Thin-Layer Chromatography (HPTLC) has benefited from great instrumental development in recent years. HPTLC is now a fully automated and computerized analytical technique [11], which makes possible the design of original hyphenated instrumental methods that are well suited to a particular analytical issue [9]. As an example, fine-tuned separations can be achieved using AMD, an automated technique that combines incremental multiple development and solvent gradient elution [12]. Likewise, separations can be coupled to MS [9].
HPTLC may be a useful tool for lipidomics owing to its ease of use, reasonable speed of analysis, and the high number of samples processed per plate.
HPTLC can be a complementary tool for LC-based techniques, particularly for routine clinical analyses.
Different approaches [10,13] had previously been used for the HPTLC of neutral SLs. However, performing a full SL analysis on the same HPTLC plate posed several problems as samples required separation, detection, quantification, and, finally, transfer to an MS system for their characterization.
Automated multiple development (AMD) was able to provide fine separation of SLs, but common, non-destructive, direct detection and quantification using UV scanning densitometry [12,14,15,16,17,18,19,20,21,22,23,24] was not possible owing to their poor UV absorption properties. Derivatization with CuSO4/H3PO4 [14,15,16,17,18,19,20,21,22], orcinol [25,26,27,28], or resorcinol [24] provided UV detection and quantification, but required heating or other severe conditions that would lead to sample destruction and prevent SL characterization. Non-destructive, unspecific fluorescent revealing agents, such as primuline, had also been used for qualitative visualization of separated SLs, as they show an increase in fluorescence emission without any apparent chemical reaction [10,13,23,25,26,27,28,29,30], but a general lack of knowledge of the mechanisms behind the generation of the fluorescent signal hindered the possibility of using these procedures for quantitative analysis.
More light has now been shed on the mechanism of fluorescence induction. Fluorophores such as primuline increase their emission in the presence of molecules bearing hydrocarbon chains [31,32] as a result of dipolar-induced, non-specific interactions between the fluorophore and analyte in a silica gel medium [33,34]. Cationic fluorophores, such as berberine or coralyne, show good examples of this behavior in the presence of saturated hydrocarbons [33,35] and also of SLs [12]. The longer the alkyl chain, the higher the fluorescent response. A model has been proposed to explain increases in emission [32,33]. The application of this effect to HPTLC-scanning densitometry is referred to as FDIC [12,34]. The magnitude of emission can be modulated through chromatographic parameters and fluorophore concentration, and FDIC can be used for quantitative purposes [36] through a simple plate post-impregnation step.
For use in the MS characterization of SLs, the elution head-based TLC-MS interface allows a simple, direct and modular connection of HPTLC with API-MS techniques [37,38,39]. A solvent is pumped through a head onto the plate to elute the whole substance zone, inclusive of its depth profile. The peak at that position is quickly extracted from the HPTLC plate; this has been reported to be satisfactory even for quantification down to the pg/band range [40]. As a related example, non-glycosylic SLs from Stratum Corneum were separated and transferred from a silica gel plate to MS using this interface [15]. However, derivatization of a second plate with CuSO4/H3PO4 was required in order to locate the corresponding bands.
Moreover, primuline has been reported to be compatible with electrospray ionization (ESI), which involves the use of an off-line, manual procedure [26,27,28,29]. Therefore, our approach in this work was to study the use of primuline as an FDIC post-impregnation fluorophore to locate and quantify SLs, as this also allows direct sample transfer using an elution head-based TLC-MS interface to Atmospheric Pressure Ionization (API)-MS equipment for further analysis.
With regard to API sources, ESI has mostly been used in HPTLC for characterizing relatively high polar compounds [40], but it does not work well with less polar ones that are not correctly ionized. In this context, the use of APCI as a complementary tool to ESI showed potential for SL identification.
The purpose of this paper is to establish the basis and evaluate the viability of one-plate HPTLC neutral SL analysis of human plasma samples using an original hyphenated method that provides AMD separation, FDIC detection and quantitative determination, and Atmospheric Pressure Ionization (API-MS) identification of compounds, using APCI and ESI by means of an elution-based interface.
The optimization of individual steps and their sequential combination for identifying and determining SLs is presented, including examples of SM determination in two plasma samples and the identification of Gb3 in a Fabry patient plasma.

2. Experimental Section
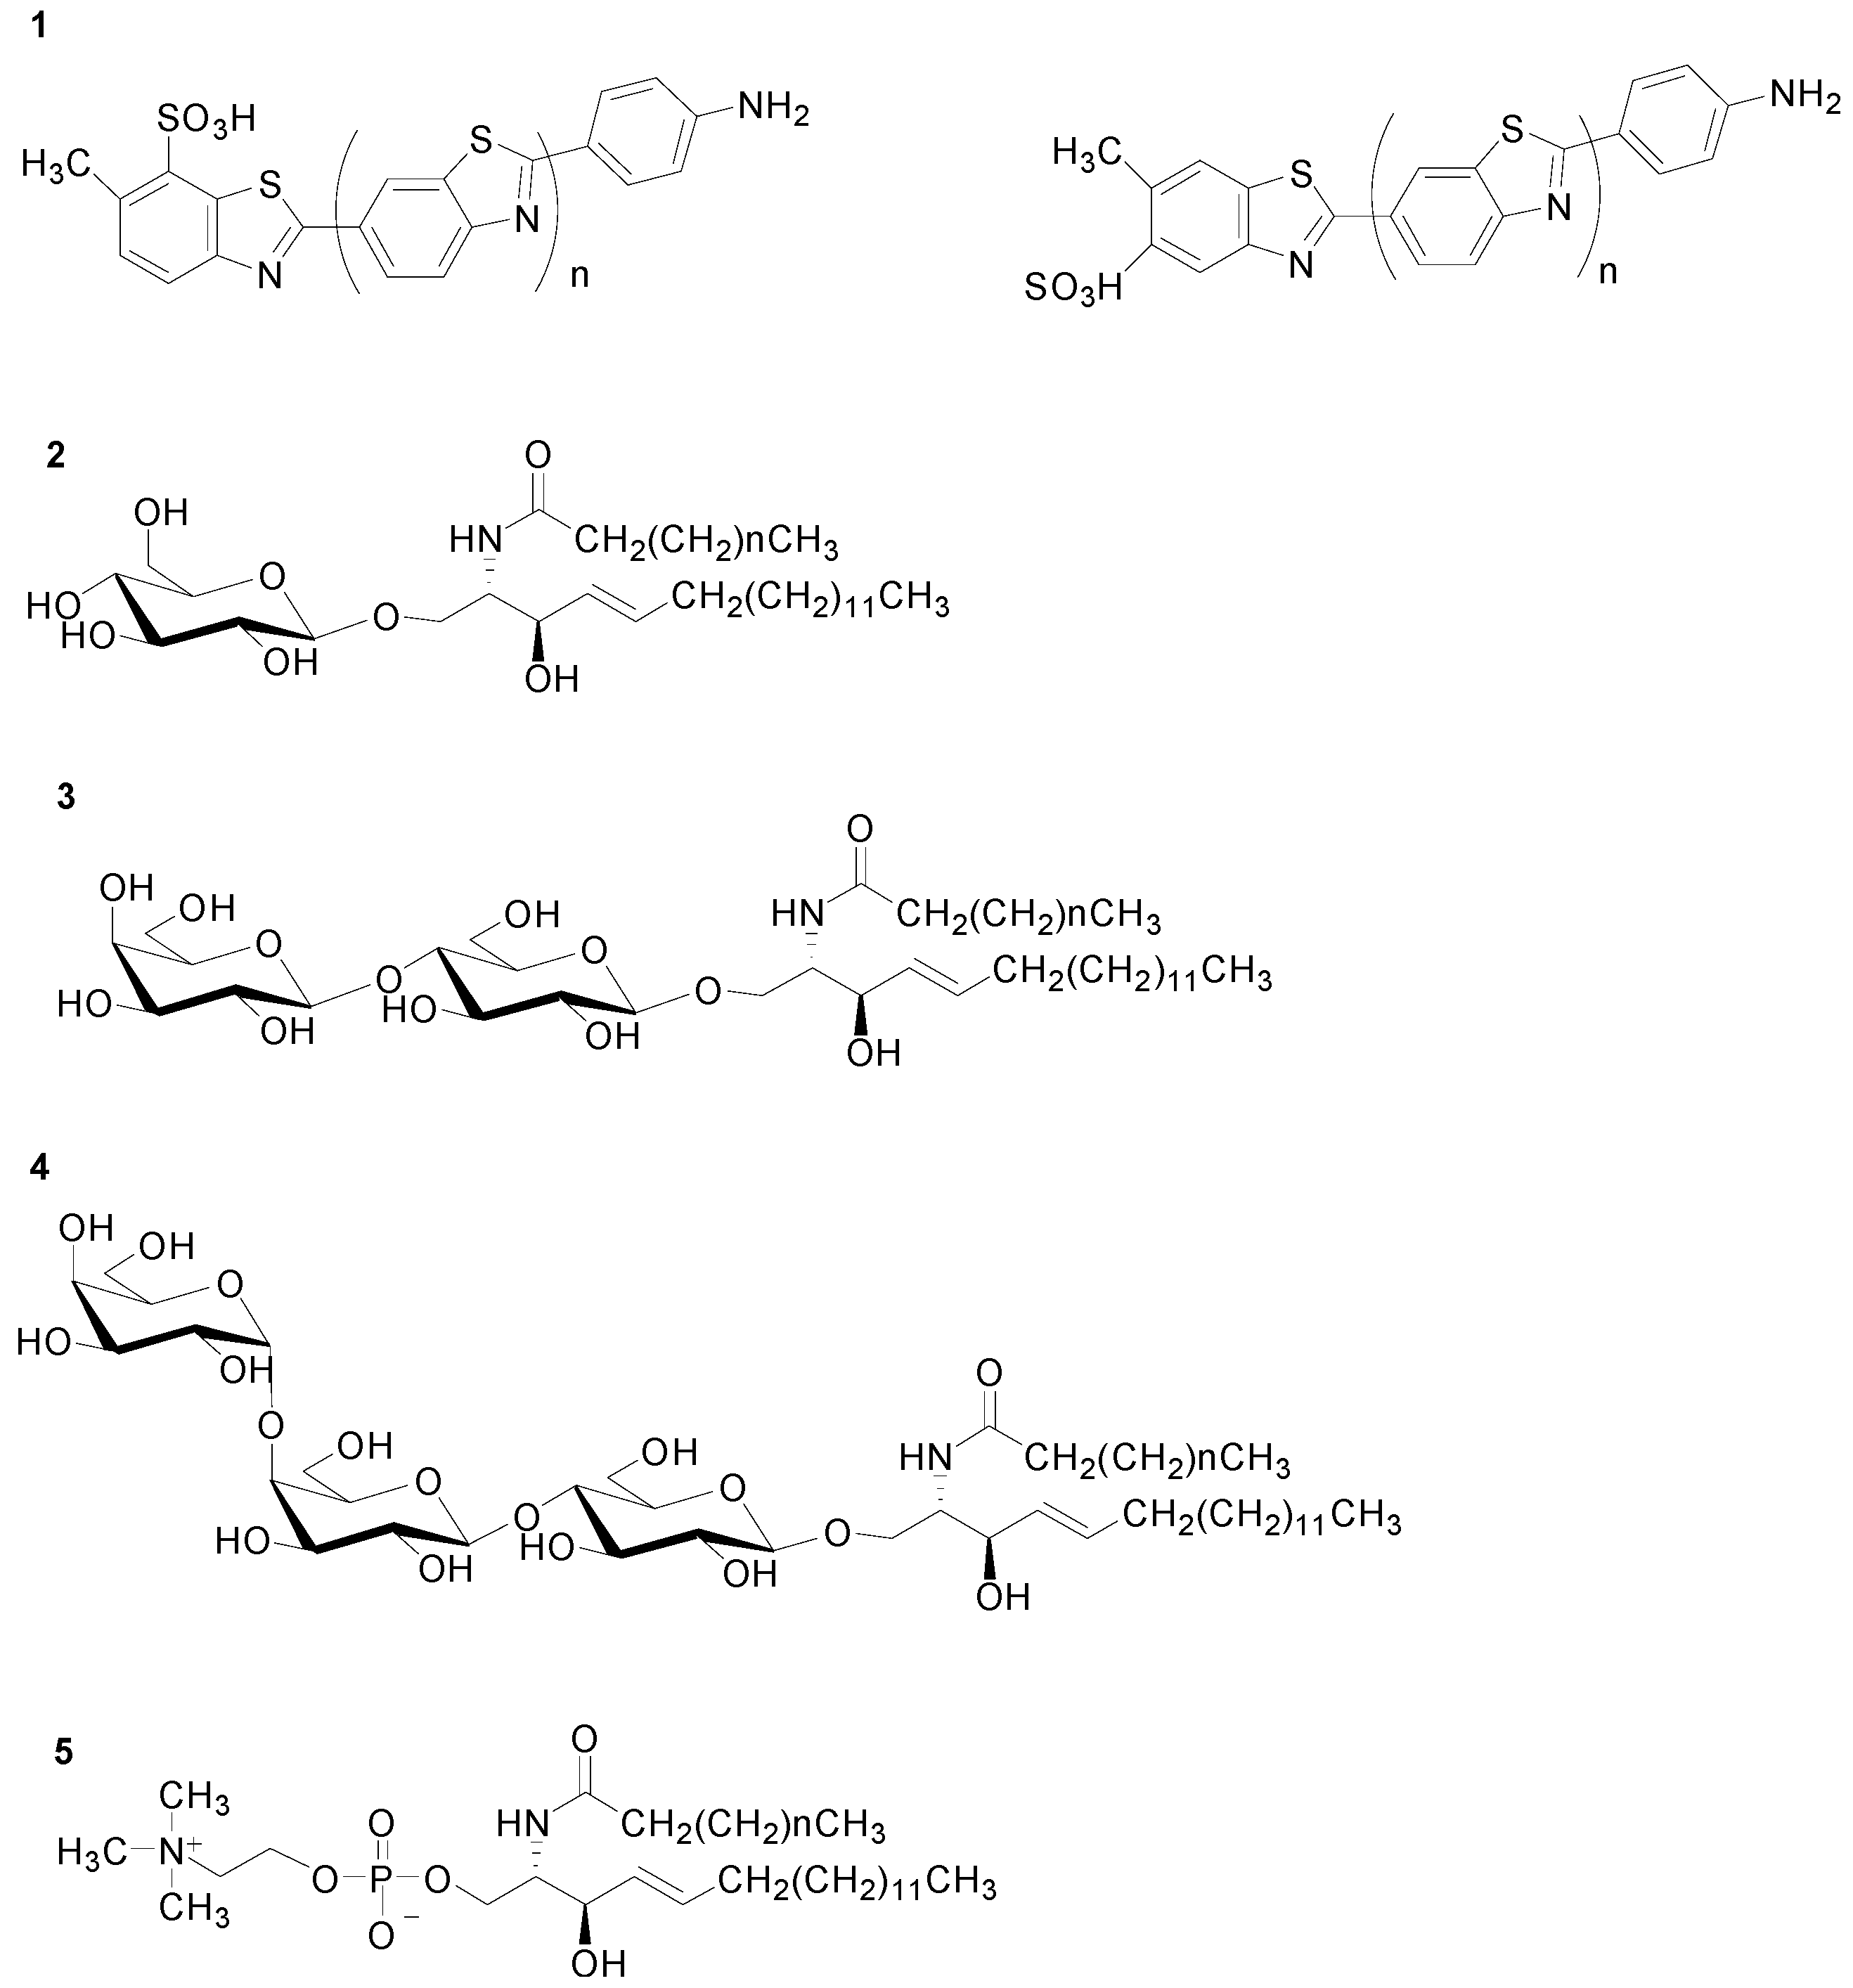
2.1. Fluorophore

Primuline (dye content 50%; CAS number: 8064-60-6) was supplied by Sigma-Aldrich, Inc. (St. Louis, MO, USA). See Figure 1 (1; n = 0.1) for its chemical structure, and 3.4 for a detailed explanation.

2.2. SL Standards and Plasma Samples

Saturated hydrocarbons n-tetracosane (C24, >99%; [646-31-1]); n-octacosane (C28, ≥98%; [630-02-4]); n-dotriacontane (C32, ≥98%; [544-85-4]) were purchased from Fluka (Steinheim, Germany).
SL standards were purchased from Matreya LLC (Pleasant Gap, PA, USA), unless otherwise stated. Their structures are shown in Figure 1: 2, GluCer (98%; MW = 784); 3, lactosyl ceramide (LacCer, 98+%; [4682-48-8]; MW = 890); 4, Gb3, (98+%; [71965-57-6] CAS; MW = 1137); 5, SM (≥97%; [85187-10-6] CAS: MW = 731).These were applied on the plates individually.
Plasma samples were obtained from the Aragon Institute of Health Sciences after approval of the Ethical Committee of Aragon, Spain.

2.3. Sample Treatment

Before their application in the hyphenated system, samples were treated according to a procedure described elsewhere [41]. For 250 µL aliquots, vials were extracted for 30 min with 2 mL of CHCl3–Methanol (MeOH) (1:1, v/v) in an overhead shaker, and centrifuged for 10 min at 5000 rpm. Precipitated protein was removed. The upper layer was submitted to alkaline hydrolysis by adding 75 µL of 2 M NaOH, and incubated with magnetic stirring for 2 h at 40 °C. Subsequently, 1 mL of water and 1 mL of MeOH were added, and vials were centrifuged at 5000 rpm for 20 min. The lower layer containing the neutral SLs was then transferred to a new vial and dried under N2. Samples were reconstituted in 250 µL of CH2Cl2 (DCM)–MeOH (1:1, v/v).
Figure 1. Chemical structures of primuline (1), and studied sphingolipids: glucosylceramide (GluCer, 2); lactosylceramide (LacCer, 3); globotriaosylceramide (Gb3, 4); sphingomyelin (SM, 5). (See text for definition of n).
Chromatography 02 00167 g001

2.4. Plates for HPTLC Separation

Glass silica gel HPTLC plates, 10 × 20 cm; 3–10 µm particle size; 60 Å pore size; 0.2 mm thick layer from Merck (Darmstadt, Germany), were used. Plates were cleaned before use by elution with tetrahydrofuran (THF) in a conventional, vertical developing chamber up to the end of plate (100 mm), and air dried.

2.5. AMD-FDIC-MS Hyphenated System: Description and Conditions for SL Analysis

2.5.1. Sample Application

Standards and samples were dissolved in a 1:1 v/v mixture of HPLC-grade DCM (99.5%) and MeOH (99.9%), from Scharlau (Barcelona, Spain). They were applied using the Automatic TLC Sampler 4 (Camag, Müttenz, Switzerland), in 4 mm bands. Typically, up to 28 samples were applied on the same plate, starting at 10 mm with a distance of 2.5 mm between tracks. One track was always empty, as a blank run. The distance from lower edge of plate was 10 mm.
For migration experiments, SL standards were used with typical application volumes of between 0.1 and 3 µL, and concentration range from 0.01 µg μL−1 to 1 µg μL−1. Applied volumes of plasma were 25 µL for Gb3 identification, and 0.6 µL for SM determination.

2.5.2. HPTLC Using AMD

An AMD2 system (Camag, Müttenz, Switzerland) was used. The optimized operating conditions for separating the studied SLs were: MeOH–DCM gradient from 50:50 to 10:90 v/v, in seven steps over a total developing distance of 90 mm (Table 1). The run duration was 1 h 15 min.
Table 1. AMD solvent gradient conditions for separating SM and Gb3 in human plasma samples.
MeOH (vol %)DCM (vol %)Migration (mm)
Step 1505030
Step 2505030
Step 3505030
Step 4505030
Step 5505030
Step 6307060
Step 7109090
The optimized operating conditions for separating SM from the rest of the whole plasma were: MeOH–DCM gradient from 80:20 to 50:50 v/v, in two steps over a total developing distance of 50 mm (Table 2) (hereafter “short” development). The run duration was 19 min.
Table 2. AMD solvent gradient conditions for separating SM in human plasma samples.
MeOH (vol %)DCM (vol %)Migration (mm)
Step 1802020
Step 2505050

2.5.3. FDIC Using Fluorescence Scanning Densitometry

A TLC Scanner 3 (Camag, Müttenz, Switzerland) was used in UV (190 nm) and fluorescence modes, using primuline as fluorophore for FDIC (λexc = 365 or 406 nm; λem > 400 nm or >540 nm, respectively). In the case of fluorescence, post-impregnation was performed by dipping the plates into solutions of primuline in MeOH (200 mg L−1) using a Camag Chromatogram Immersion Device III.

2.5.4. Coupling AMD-FDIC to API-MS

A TLC-MS Interface (Camag, Müttenz, Switzerland) equipped with a 4 × 2-mm extraction head was used together with a PU-2080 HPLC pump (from Jasco, Tokyo, Japan). N2 pressure was 3 bars. A2-μmstainless steel filter was used to remove the silica gel. Extraction was performed with MeOH at 0.2 mL min−1. A blank portion of silica gel plate was also extracted as a control.
An Esquire 3000 Plus ion trap mass spectrometer (Bruker Daltonics, Bremen, Germany) was used with ESI and APCI sources. Solvents were MeOH for APCI, and either MeOH or a mixture of 90:10 v/v MeOH and 0.1% v/v formic acid solution for ESI. Nebulizer (N2) gas pressure, drying (N2) gas flow rate, and drying gas temperature were set at 40 psi, 9.0 Lmin1, and 350 °C, respectively.
ESI-MS ion-trap analysis was conducted in positive mode, with capillary and endplate offset voltages of 4000 and −500 V, respectively. Spectra were acquired in the m/z 300–1500 range at the Standard/Normal scan mode.
APCI ionization conditions were as follows: capillary voltage 2000–3000 V; current intensity 5000–6000 nA; nebulizer pressure 45 psi; flow and temperature of drying gas 5 mLmin1 and 350 °C, respectively; vaporization temperature 450 °C. Full scans were recorded up to 1500 m/z in positive ion mode.
Bruker Daltonics software packages Esquire Control v.5.3 and Data Analysis v.4.0 were used to control the MS apparatus and process data, respectively.

2.6. Repeatability of Sample Treatment

Three aliquots of plasma were submitted to sample treatment in three different vials. After treatment, samples were applied in triplicate on three different HPTLC plates. After using the short AMD development sequence, the SM peak was measured by FDIC (λexc = 365 nm; λem > 400 nm) under the conditions described in 2.5.3. A control run of 1 µg of SM standard was always applied on each plate to normalize the fluorescence signal.
Analysis of variance (ANOVA) of results showed that there were no significant differences between FDIC responses (area counts) of the SM obtained under these conditions (RSD% = 4; F = 0.4241).

2.7. Calibration and Quantification of SM in Plasma Using FDIC

Calibration by the standard addition method was used for SM quantification in two human plasma samples. In each case, six plasma calibration solutions were prepared from six aliquots of 250 µL of the plasma sample and 100 µL of SM solutions in chloroform–methanol (CHCl3–MeOH; 1:1, v/v) with concentrations of 0.21, 0.42, 0.63, 0.84, 1.05, and 1.26 µg µL1 (0.126, 0.251, 0.377, 0.502, 0.628, and 0.753 µg of added SM on the applied sample). Both the plasma and standard solutions were submitted to the treatment procedure (see Section 2.3).
A volume of 0.6 µL of treated human plasma and its six plasma calibration solutions were applied in triplicate on three HPTLC plates on different days (n = 9).
A scheme of the application of plasma sample and calibration solutions on a silica gel HPTLC plate for SM determination is given as supplementary data.

3. Results and Discussion

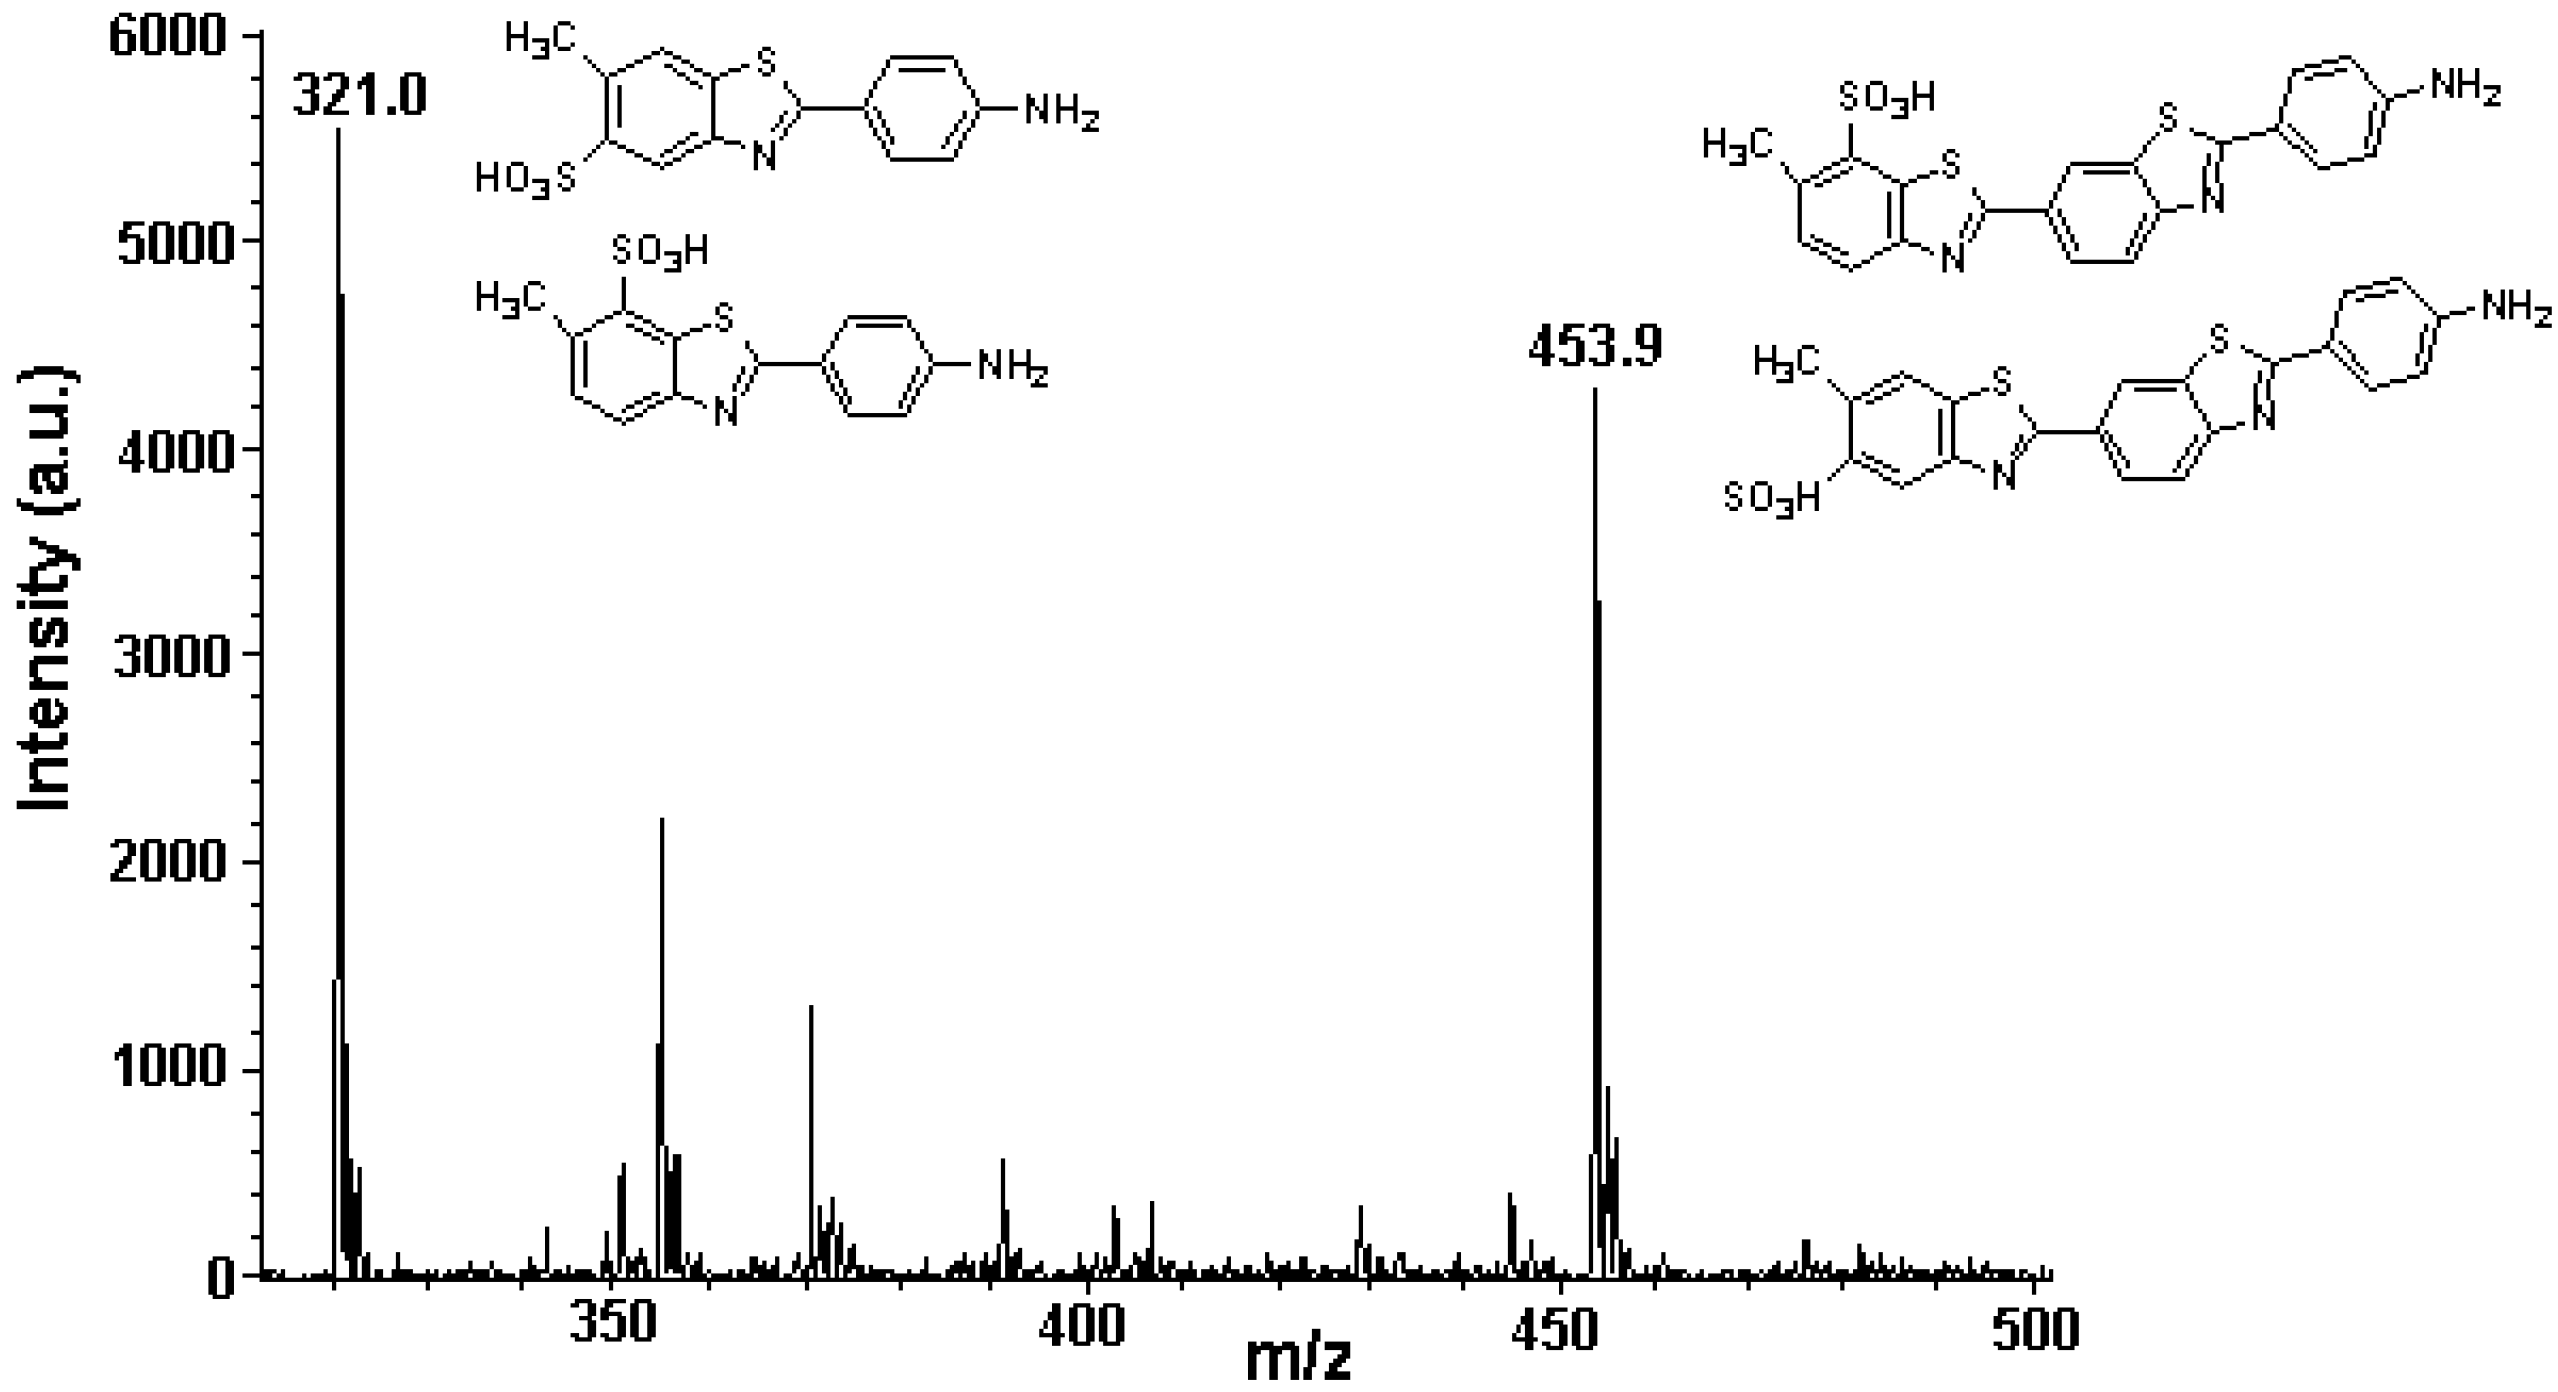
3.1. Primuline as an FDIC Fluorophore

The effect of hydrocarbon chains on primuline fluorescence emission intensity can be seen in Figure 2. Long-chain, non-fluorescent, saturated hydrocarbons (C24, C28, C32) provide strong increases in primuline emission without any change in emission wavelength. For the alkane homologous series, fluorescence response is a function of chain length, i.e., hydrocarbon polarizability, as demonstrated for other fluorophores [32,33,34]. This effect of chain length was also observed for neutral lipids and SLs using berberine as a fluorophore [12]. Therefore, primuline behaves as a FDIC fluorophore.
The presence of a sufficiently long hydrocarbon chain modifies the fluorophore microenvironment in silica gel, and hence the balance between radiative and non-radiative constants. A model based on weak, non-specific, induced dipole electrostatic interactions between the analyte and fluorophore has been proposed. For a given fluorophore and a homologous series of compounds, emission intensity depends on analyte polarizability (αi) [32,33]. The analyte provides an apolar environment that prevents non-radiative de-excitation pathways.
Figure 2. Effect of hydrocarbon chain: C24 (□), C28 (○), C32 (Δ), and sample load on fluorescent detection by changes in primuline emission intensity. Conditions: samples load from 0.01 to 3 µg; application point at 10 mm; bands of 4mm; AMD in one step with n-heptane as mobile phase over 30 mm total migration distance; FDIC-primuline (200 mg L1) at λexc = 365 nm; λem > 400 nm.
Chromatography 02 00167 g002
The different fluorescent responses of compounds depend on the polar groups that are associated with the hydrocarbon chains in the molecule. Specific interactions of polar groups with a fluorophore increase the value of knr and either emission decreases (with regard to that of hydrocarbon chains) or even quenching may be observed if this contribution prevails [34]. For example, it has been reported that berberine experiences high emission increases in the presence of saturated hydrocarbons. However, it gives low increases in the presence of SLs [12]. As shown in Section 3.3, primuline provides different fluorescent responses for the studied SLs.

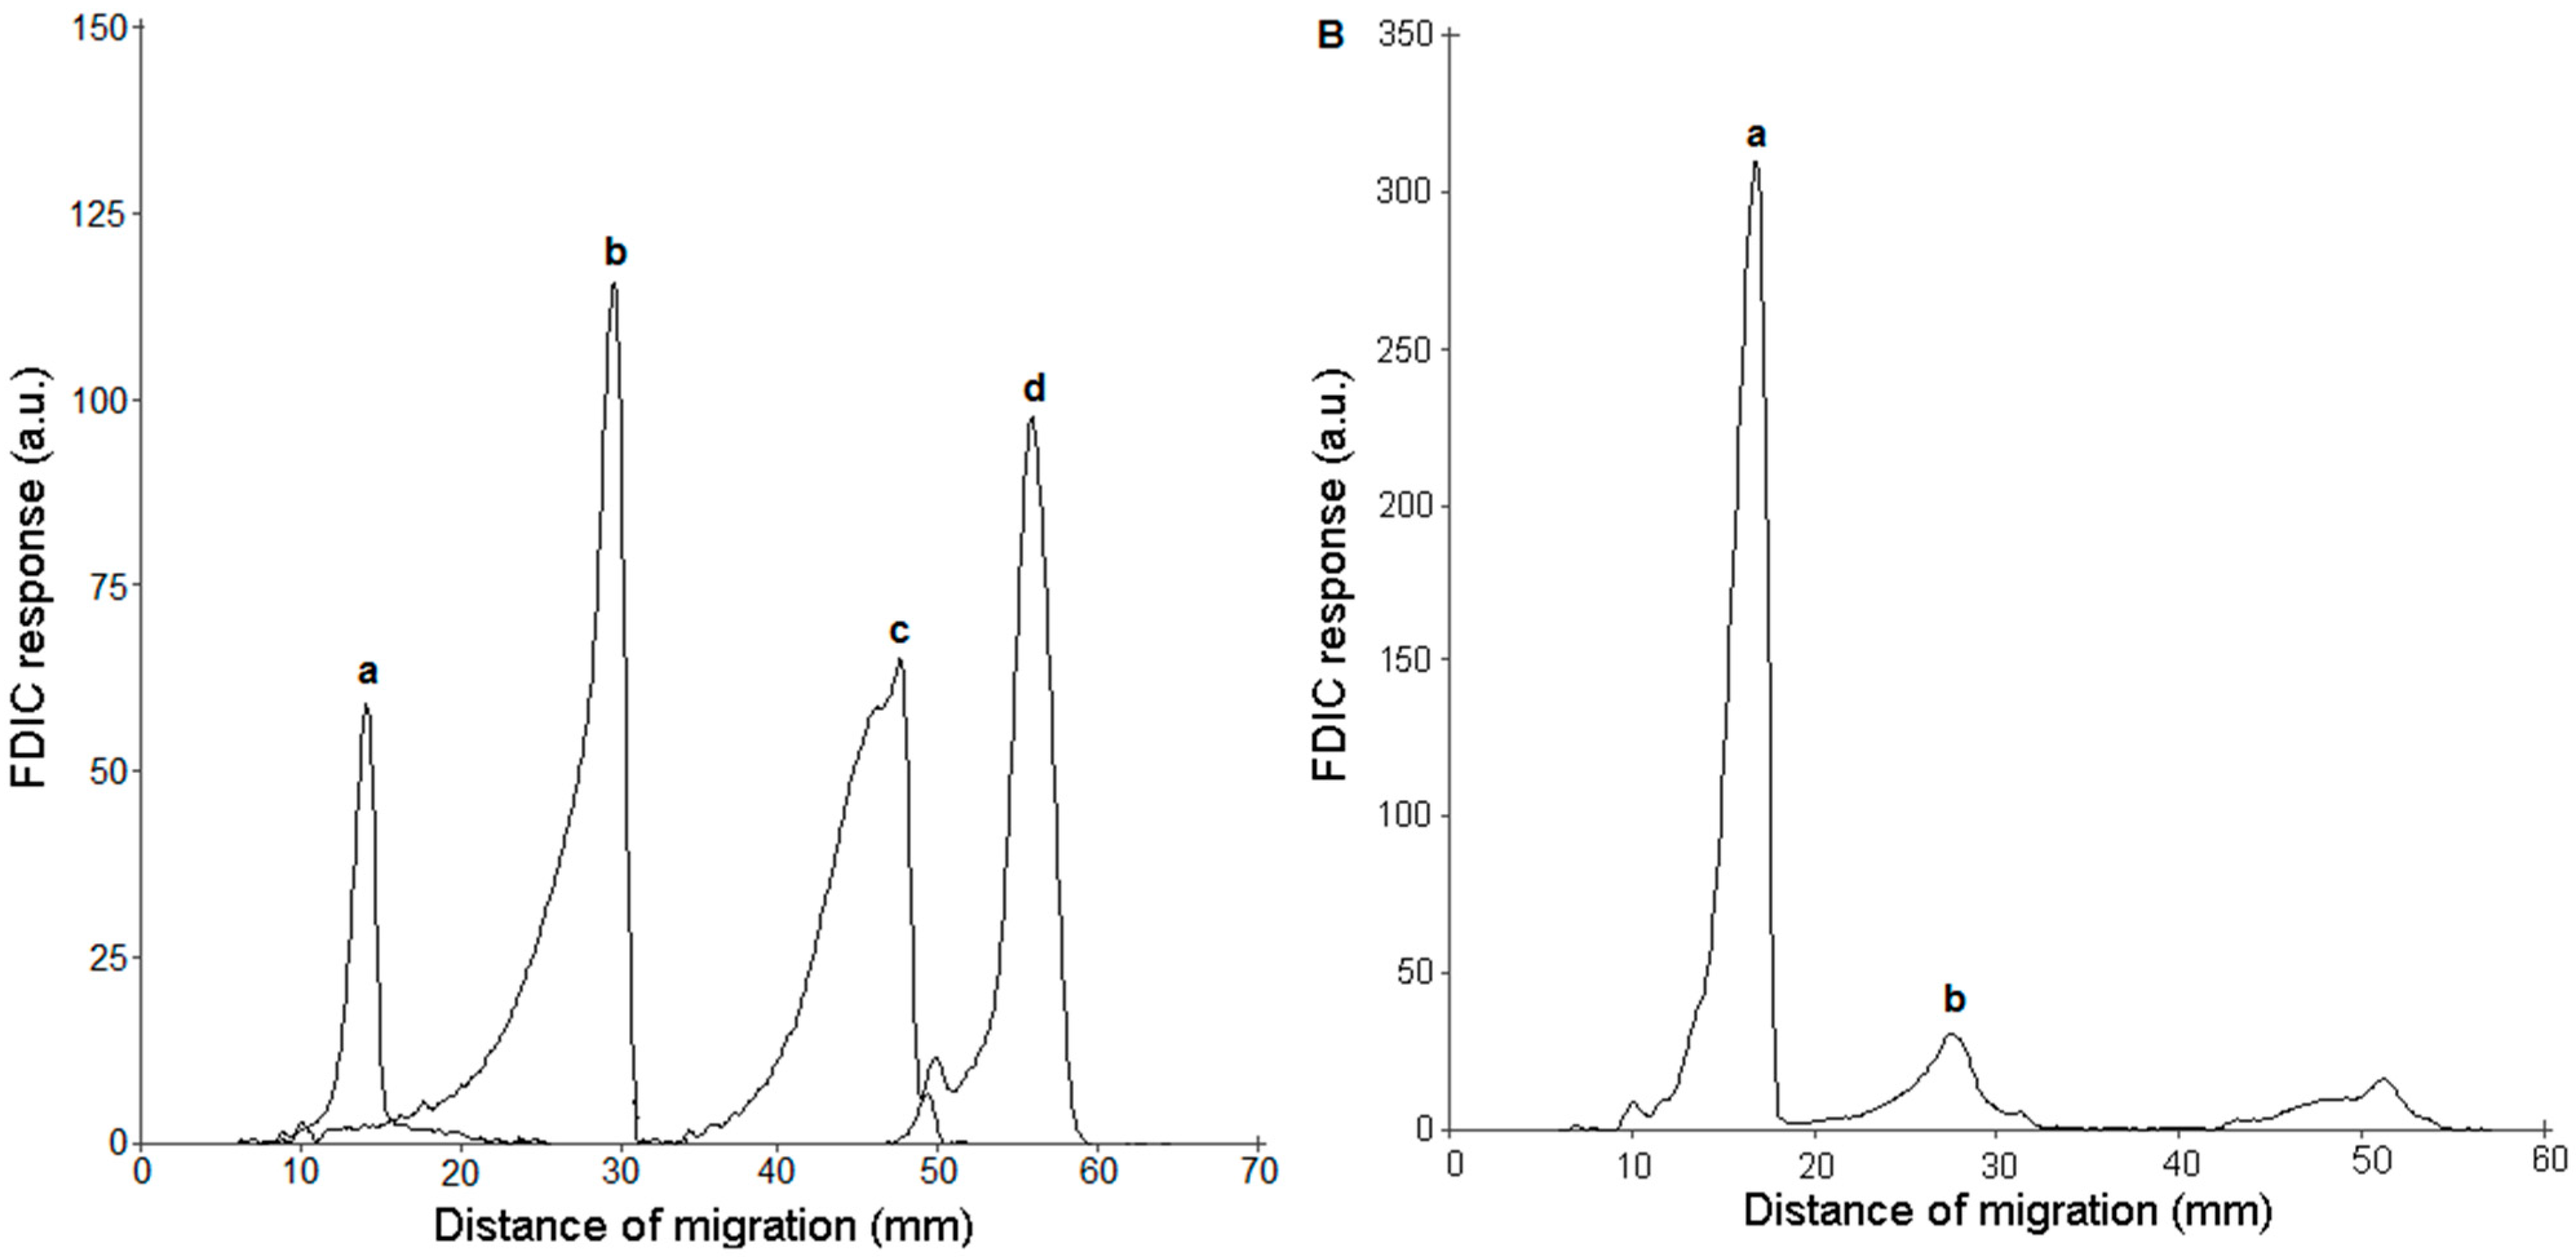
3.2. AMD-Gradient Separation of SLs

The use of AMD provides efficient, gradient-based sample separation. Separation takes place in several steps of increasing development length in which the mobile phase composition may be different. As each development step goes a little farther than the previous one, there is also a refocusing effect.
Several development schemes for SLs have mostly been applied to Stratum Corneum, a skin-derived sample with a high concentration in ceramide-based lipids [14,15,16,17,18,19,20,21,22]. The number of steps depends on the nature of other neutral lipids coexisting in the sample with target SLs.
A separation of SM, Gb3, LacCer, and GluCer, was reported in a previous work using an 18-step, universal gradient (MeOH–DCM, from 80:20 to 0:100, v/v) [12].
Separation of neutral SLs on silica gel plates takes place according to lipid polarity. Glycosphingolipids were separated according to the number of sugar units: Gb3 (3 units), LacCer (2 units), and GluCer (1 unit), with increasing migration distances. By using the universal gradient scheme described, the more polar the compound, the lower the migration distance. Polar SM gives the lowest migration distance.
The long duration of this sequence (4 h 15 m) was due to the large number of steps involved, long total migration distance (m.d., 76 mm, plus an additional cleaning stage of 90 mm in a vertical developing chamber), and the duplication of each elution step for increased peak refocusing.
Regardless of the sequence used in an AMD separation, a final cleaning step is always needed in order to drag impurities traveling with the solvent front outside the zone of interest. Solvent additives, such as stabilizers and dry matter, and many other non-absorbing compounds, can be detected by FDIC. Impurities may come from compounds adsorbed during analysis, which are usually distributed uniformly on the plate. Impurities may also be the result of a matrix effect. This is important when working with lipid standards, and more particularly in the case of biological samples.
Taking this method as a starting point, AMD separation was optimized. Refocusing seemed convenient as the SL standards were not pure compounds and their peaks may not have been narrow enough after a single elution step. However, when studying the behavior of each standard during a multi-step elution, we noticed that refocusing was only needed in the case of Gb3.
Use was made of a faster, seven-step MeOH–DCM gradient from 50:50 to 10:90, v/v, with 20% variation between steps, without losing separation quality and keeping a final cleaning step up to 90 mm as a total m.d. Selected AMD conditions are described in Table 1. Separation of standards is shown in Figure 3A. Peak positions were determined by FDIC.
Figure 3. HPTLC-FDIC chromatograms of: (A) standards, SM, 0.5 µg, m.d. 14.1 mm (a), Gb3, 1 µg, m.d. 29.6 mm (b), LacCer, 1 µg, m.d. 47.6 mm (c), and GluCer, 1 µg, m.d. 55.9 mm (d). (B) plasma from a Fabry patient (25 µL). SM 16.8 mm (a), Gb3 27.4 mm (b). Application point at 10 mm; AMD conditions in Table 1. FDIC-primuline (200 mg L−1) at λexc = 406 nm; λem > 540 nm.
Chromatography 02 00167 g003
A final step (10:90) dragged impurities to 90 mm, on the apolar side of the chromatogram where there was no interference with the target peaks, improving the baseline. Separation of the four studied SL stook 1 h 15 min.
The chromatogram showing the application of this AMD sequence to a plasma sample from a Fabry patient is shown in Figure 3B. As migration distance was not a sufficient criterion for attributing peak identity, identification of peaks at 16.8 and 27.4 mm by means of online MS is discussed in Section 3.5.
Shorter sequences can be designed for a single target analyte. For example, SM can be separated from the entire human plasma sample matrix in 19 min using a 2-step MeOH–DCM gradient (30 mm step−1), from 80:20 to 50:50, v/v, over 50 mm of total developing distance (Table 2, Figure 4). Attribution of SM identity to the peak at 13.7 mm is detailed in 3.5. The large peak at m.d. of 50 mm includes all the remaining peaks of the plasma sample.
Figure 4. HPTLC-FDIC chromatogram of plasma from a healthy volunteer (0.6 μL): SM, m.d.13.7 mm (a). Application point at 10 mm; AMD conditions in Table 2. FDIC-primuline (200 mg L−1) at λexc = 365 nm; λem > 400 nm.
Chromatography 02 00167 g004

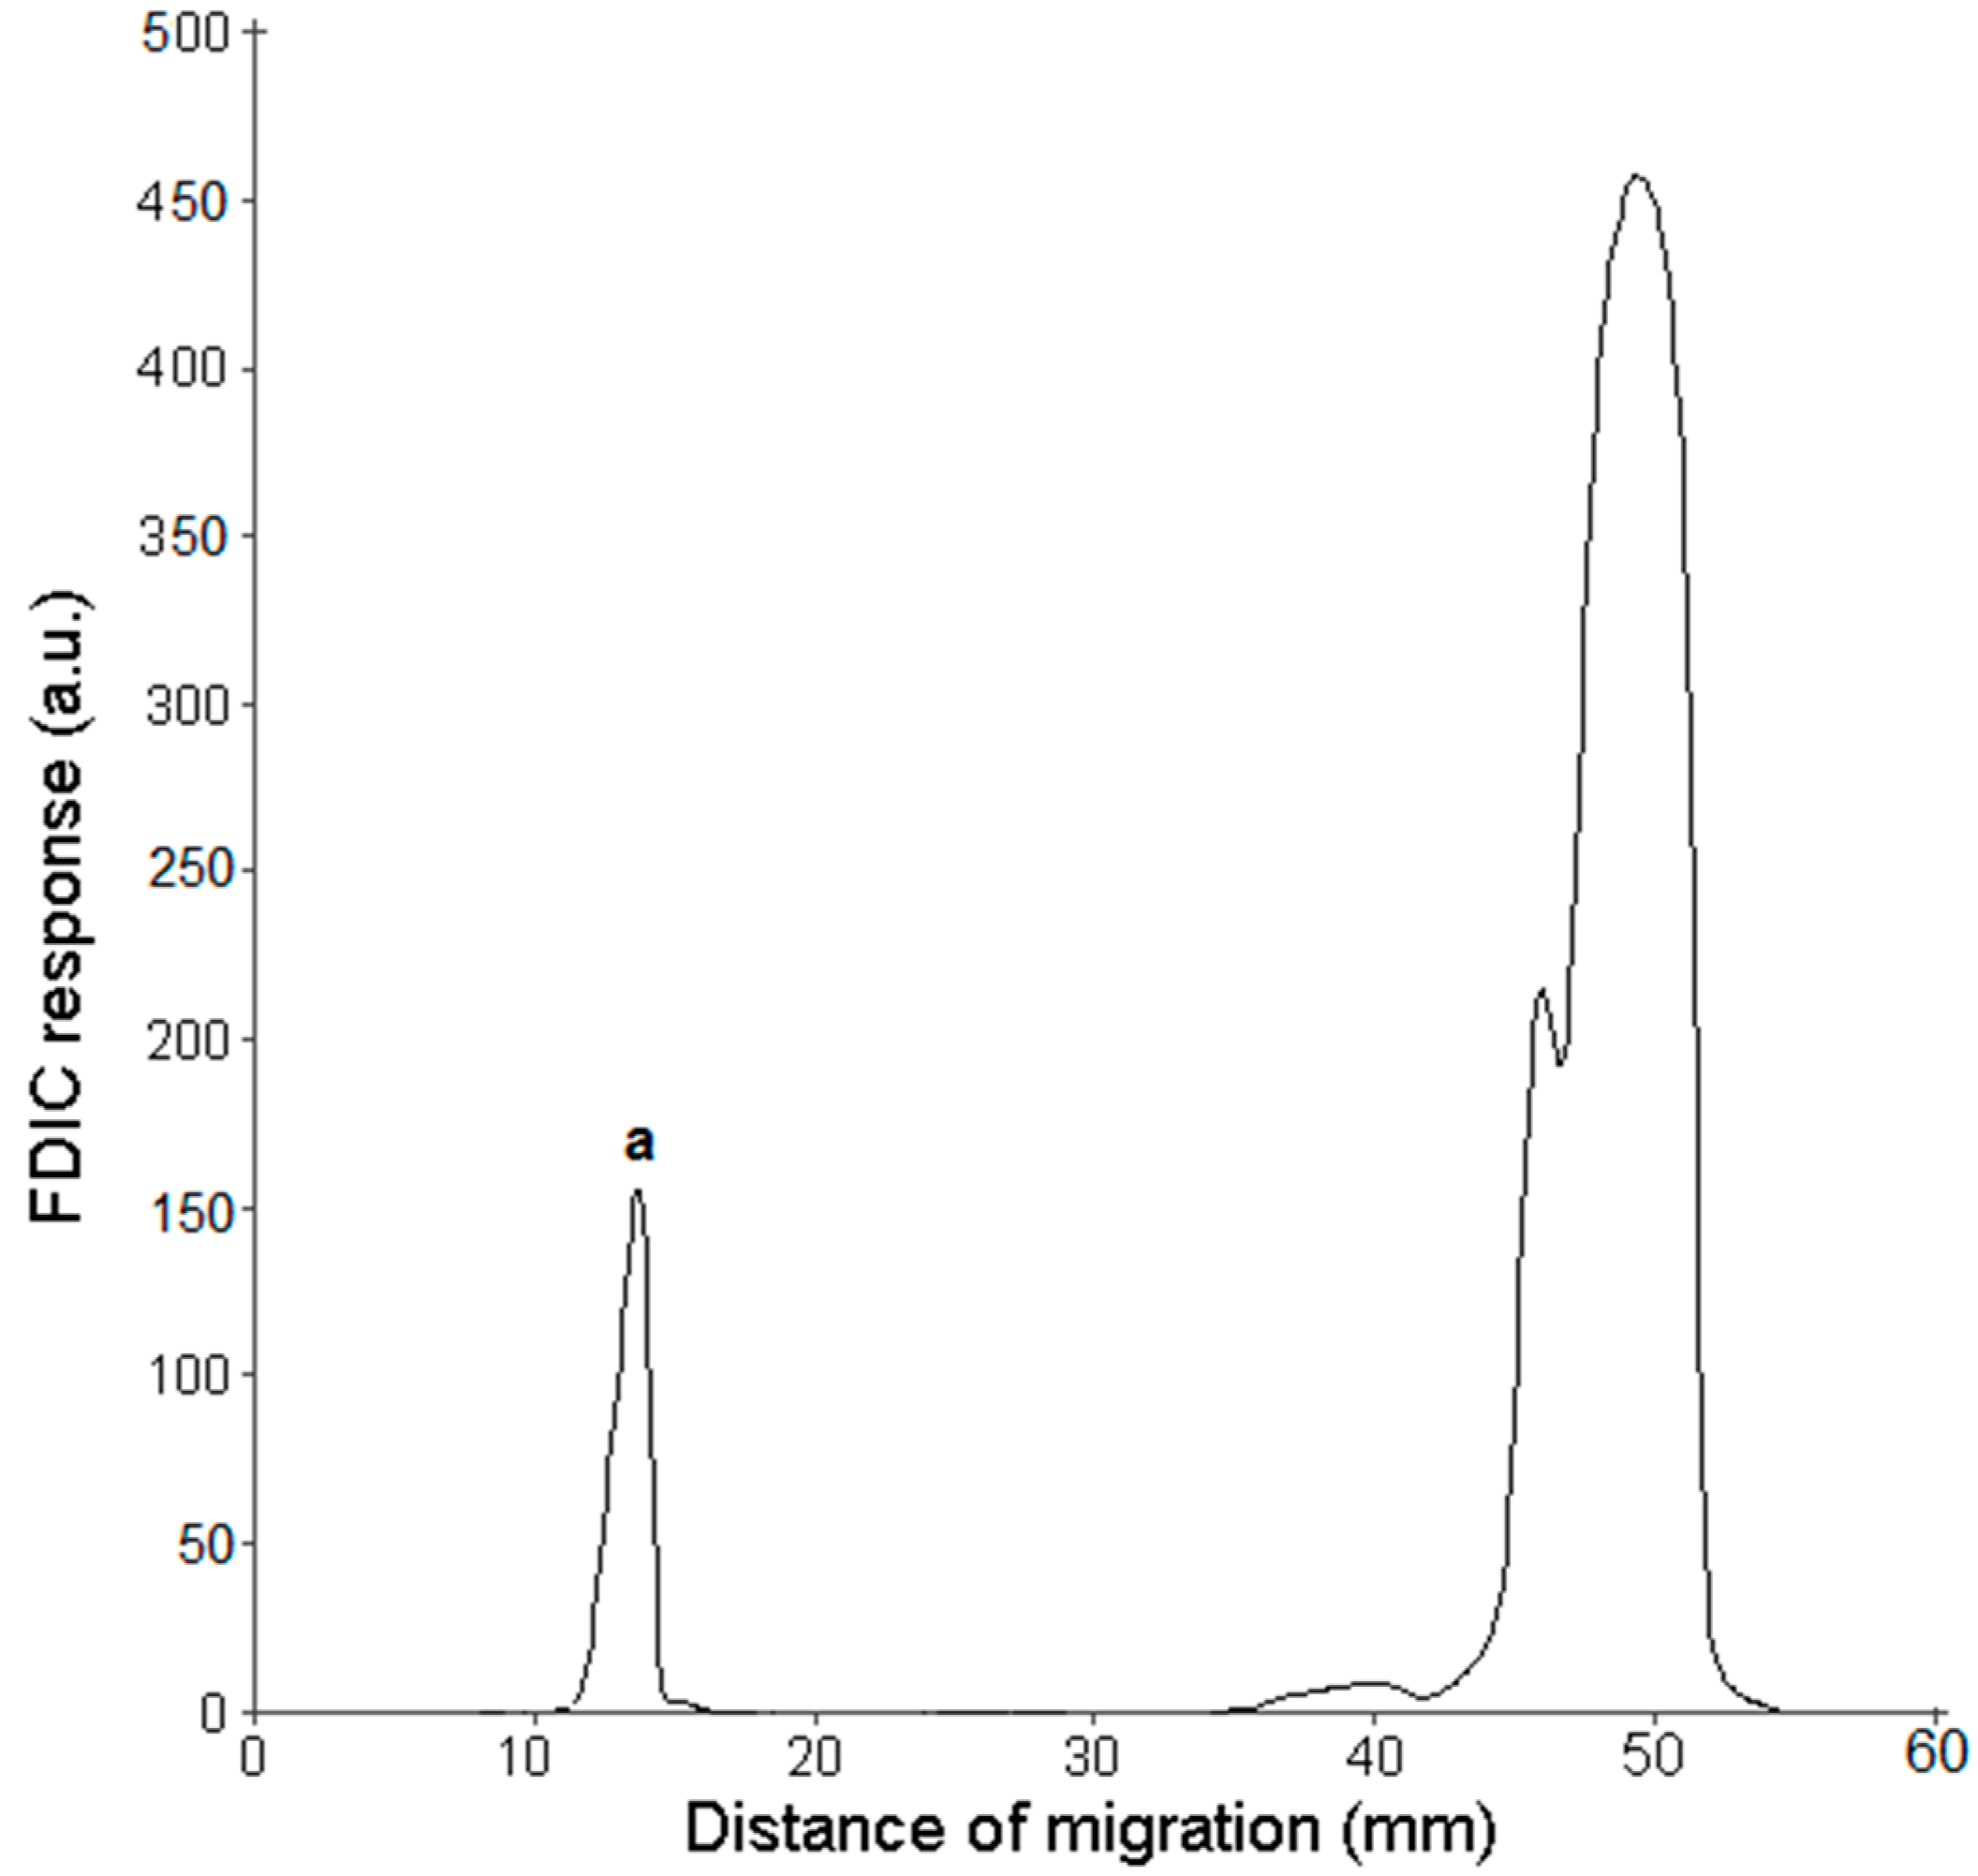
3.3. FDIC of Separated SLs Using Primuline

The fluorescent chromatograms shown in Figure 3 and Figure 4 were obtained by impregnation of plates with primuline after AMD separation and excitation under the conditions described in the Experimental section. Primuline provides sensitive fluorescent peaks with areas 5–7 times higher than those from UV detection at 190 nm (see supplementary data). In the case of SM and GluCer, the limits of detection (LOD) were 0.3 and 0.03 µg for UV and primuline induced-fluorescence, respectively. In the case of Gb3, they were 2 and 0.2 µg, respectively. LacCer showed the same LOD in UV and fluorescence: 0.3 µg. Figure 5 represents responses vs. sample load of SL standards using primuline-induced fluorescence.
The FDIC emission signal of SLs was intense, despite their poor absorption properties and not being fluorescent molecules. As explained in Section 3.1, increases in the fluorescence emission of SLs are due to their associated long hydrocarbon chains. For a given chemical family, the longer the chain length, the higher the fluorescent response. The different fluorescent responses of SLs depend on the balance between these increases in emission and the quenching produced by the polar head-groups that are associated with hydrocarbon chains in the SL structure.
The use of FDIC for quantification of SLs is addressed in Section 3.6, where a calibration procedure based on standard addition was used to determine SM in plasma.
Figure 5. Fluorescent responses (area counts) vs. sample load of SL standards: SM (0), Gb3 (□), LactoCer (Δ), and GlucoCer (◊). FDIC-primuline (200 mg L1) at λexc = 365 nm; λem > 400 nm.
Chromatography 02 00167 g005

3.4. Online AMD-FDIC-MS Coupling

Primuline can be used in combination with the TLC-MS elution interface and is compatible with API-MS, as shown in Figure 6, which illustrates a blank run of a primuline-impregnated silica gel plate under the conditions described in the Experimental section. This spectrum provides interesting structural information on primuline composition. Fragmentation is compatible with the description of primuline as not being a pure compound, but a mixture of oligomers of substituted benzothiazoles, according to Li et al. [42]. Structures attributed to MS-fragments are given in Figure 6, where n is the number of units of benzothiazole. Thus, the molecular ion (m/z = 453.9) corresponds to both 2'-(4-aminophenyl)-6-methyl-[2,6'-bibenzo[d]thiazole]-7-sulfonic acid and2'-(4-aminophenyl)-6-methyl-[2,6'-bibenzo[d]thiazole]-5-sulfonic acid isomers, with n = 1. Likewise, the fragment at m/z = 321.0 corresponds to the isomers with n = 0: 2-(4-aminophenyl)-6-methylbenzo[d]thiazole-7-sulfonic acid and 2-(4-aminophenyl)-6-methylbenzo[d]thiazole-5-sulfonic acid. Despite Li et al. [42] also isolating traces of oligomers with n = 2 and n = 3 by silica gel column chromatography of primuline and subsequent purification using preparative reversed phase HPLC, we did not find these structures in MS spectra.
Figure 6. APCI-MS spectrum of primuline eluted from a portion of a primuline-impregnated silica gel plate using the TLC-MS interface (Conditions in the Experimental section).
Chromatography 02 00167 g006

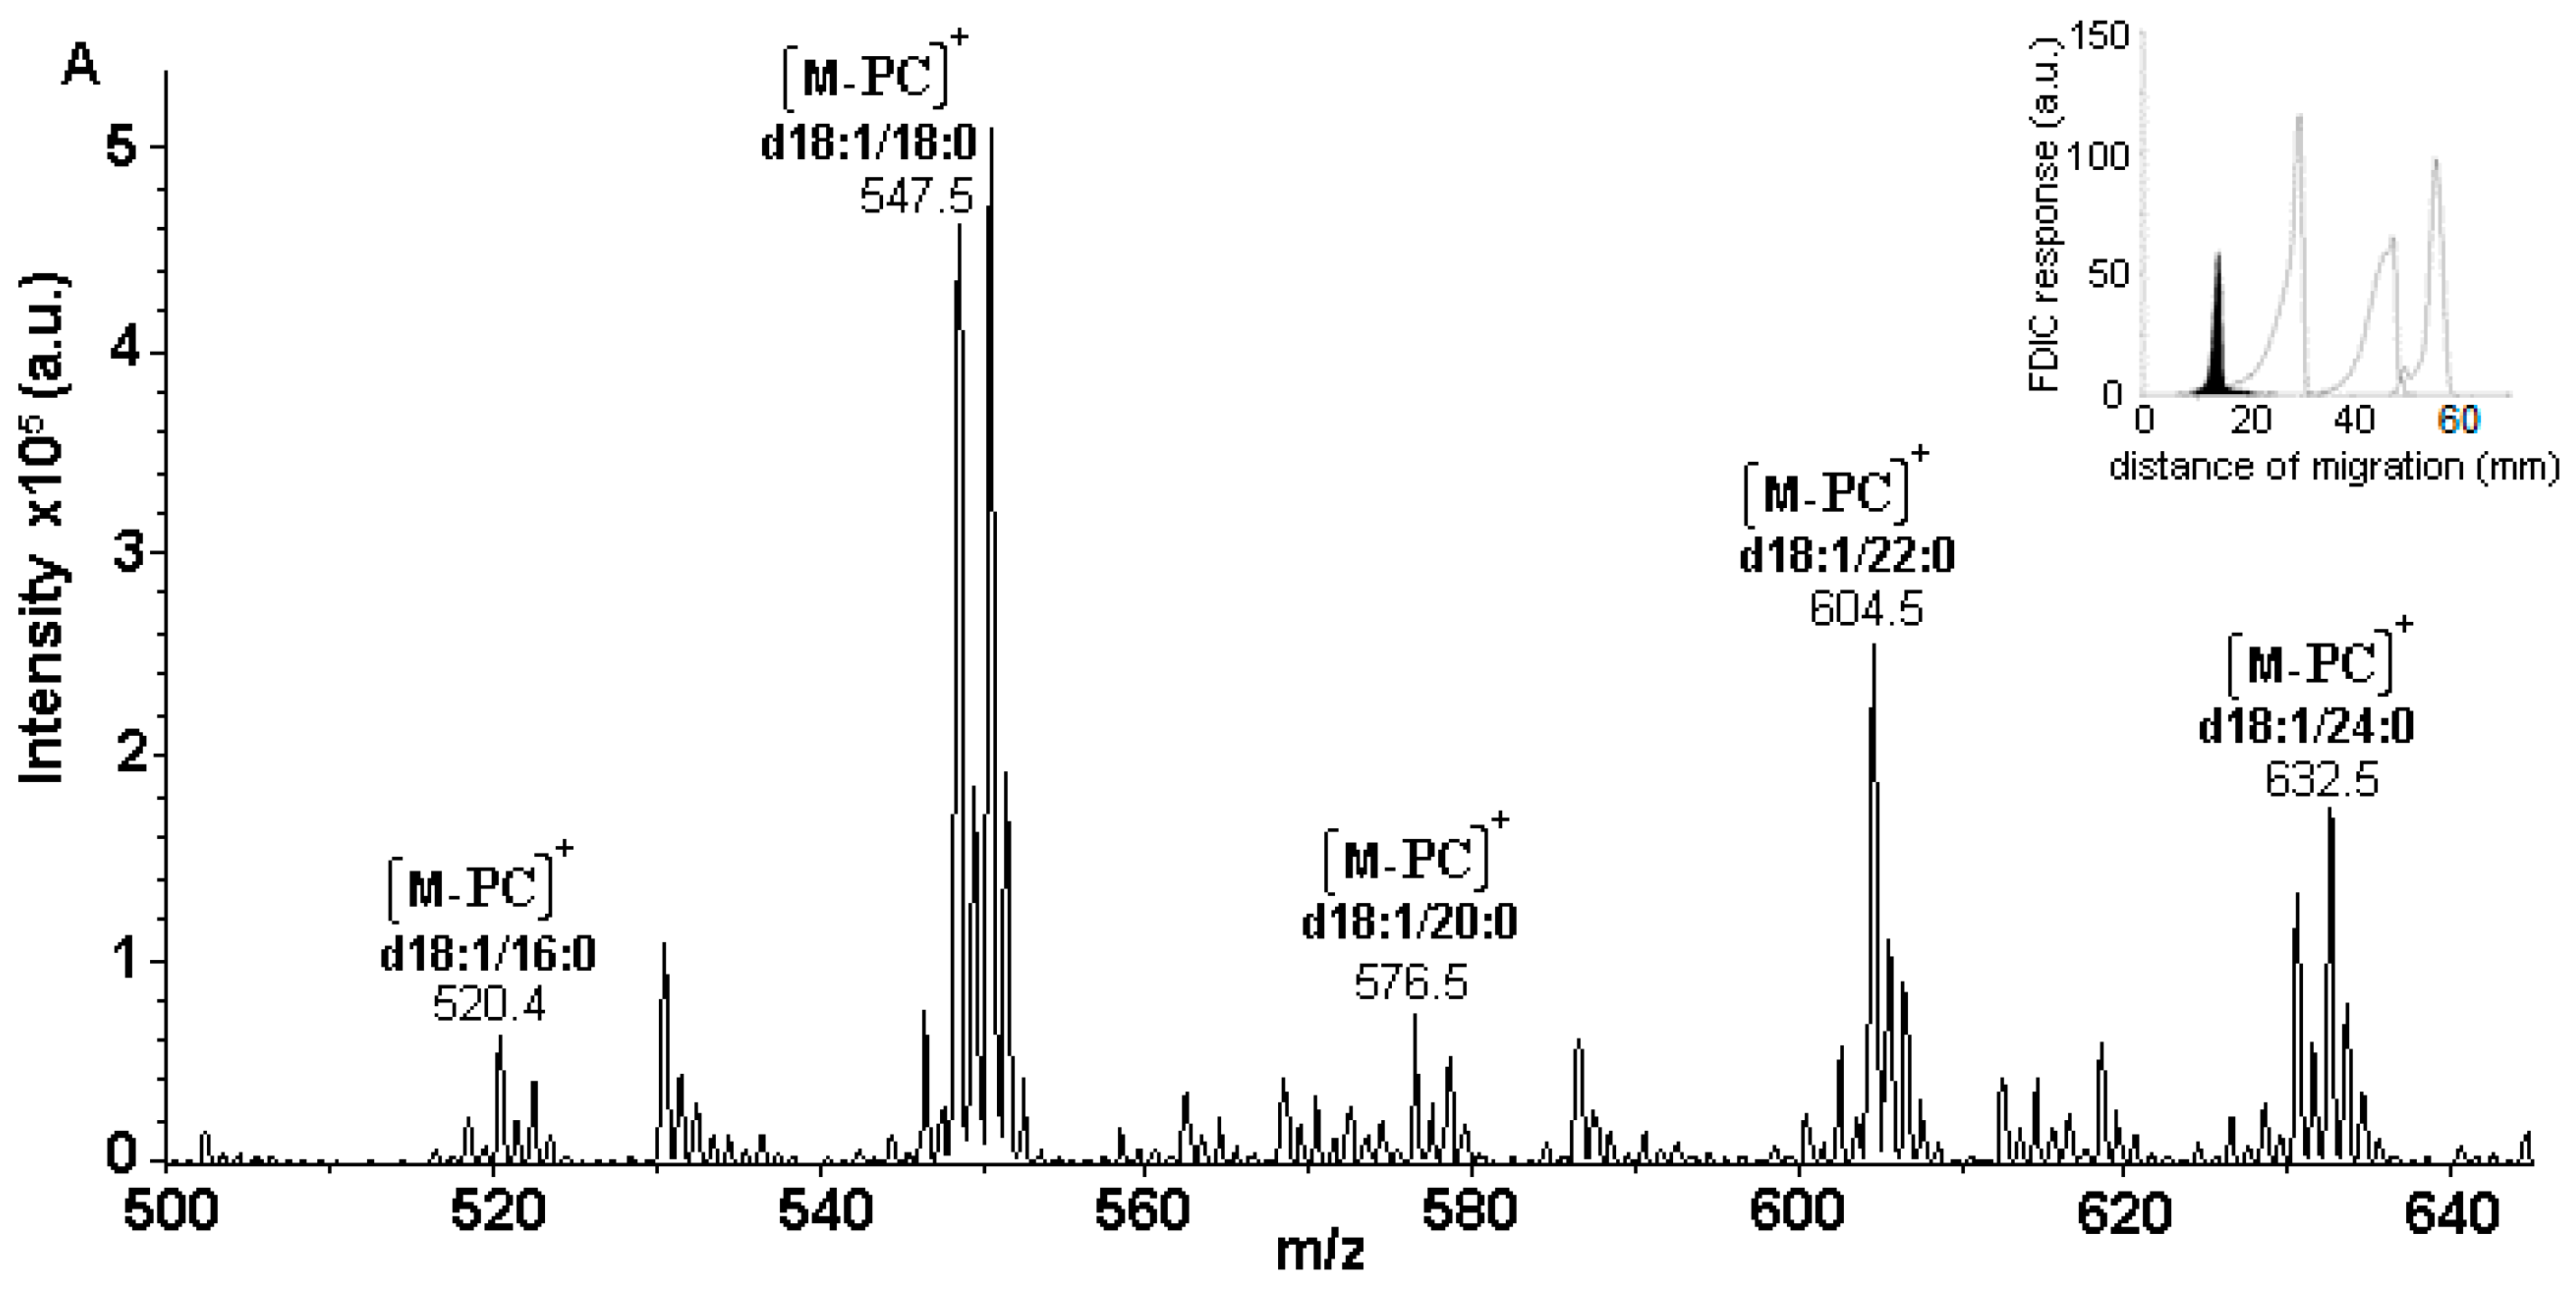
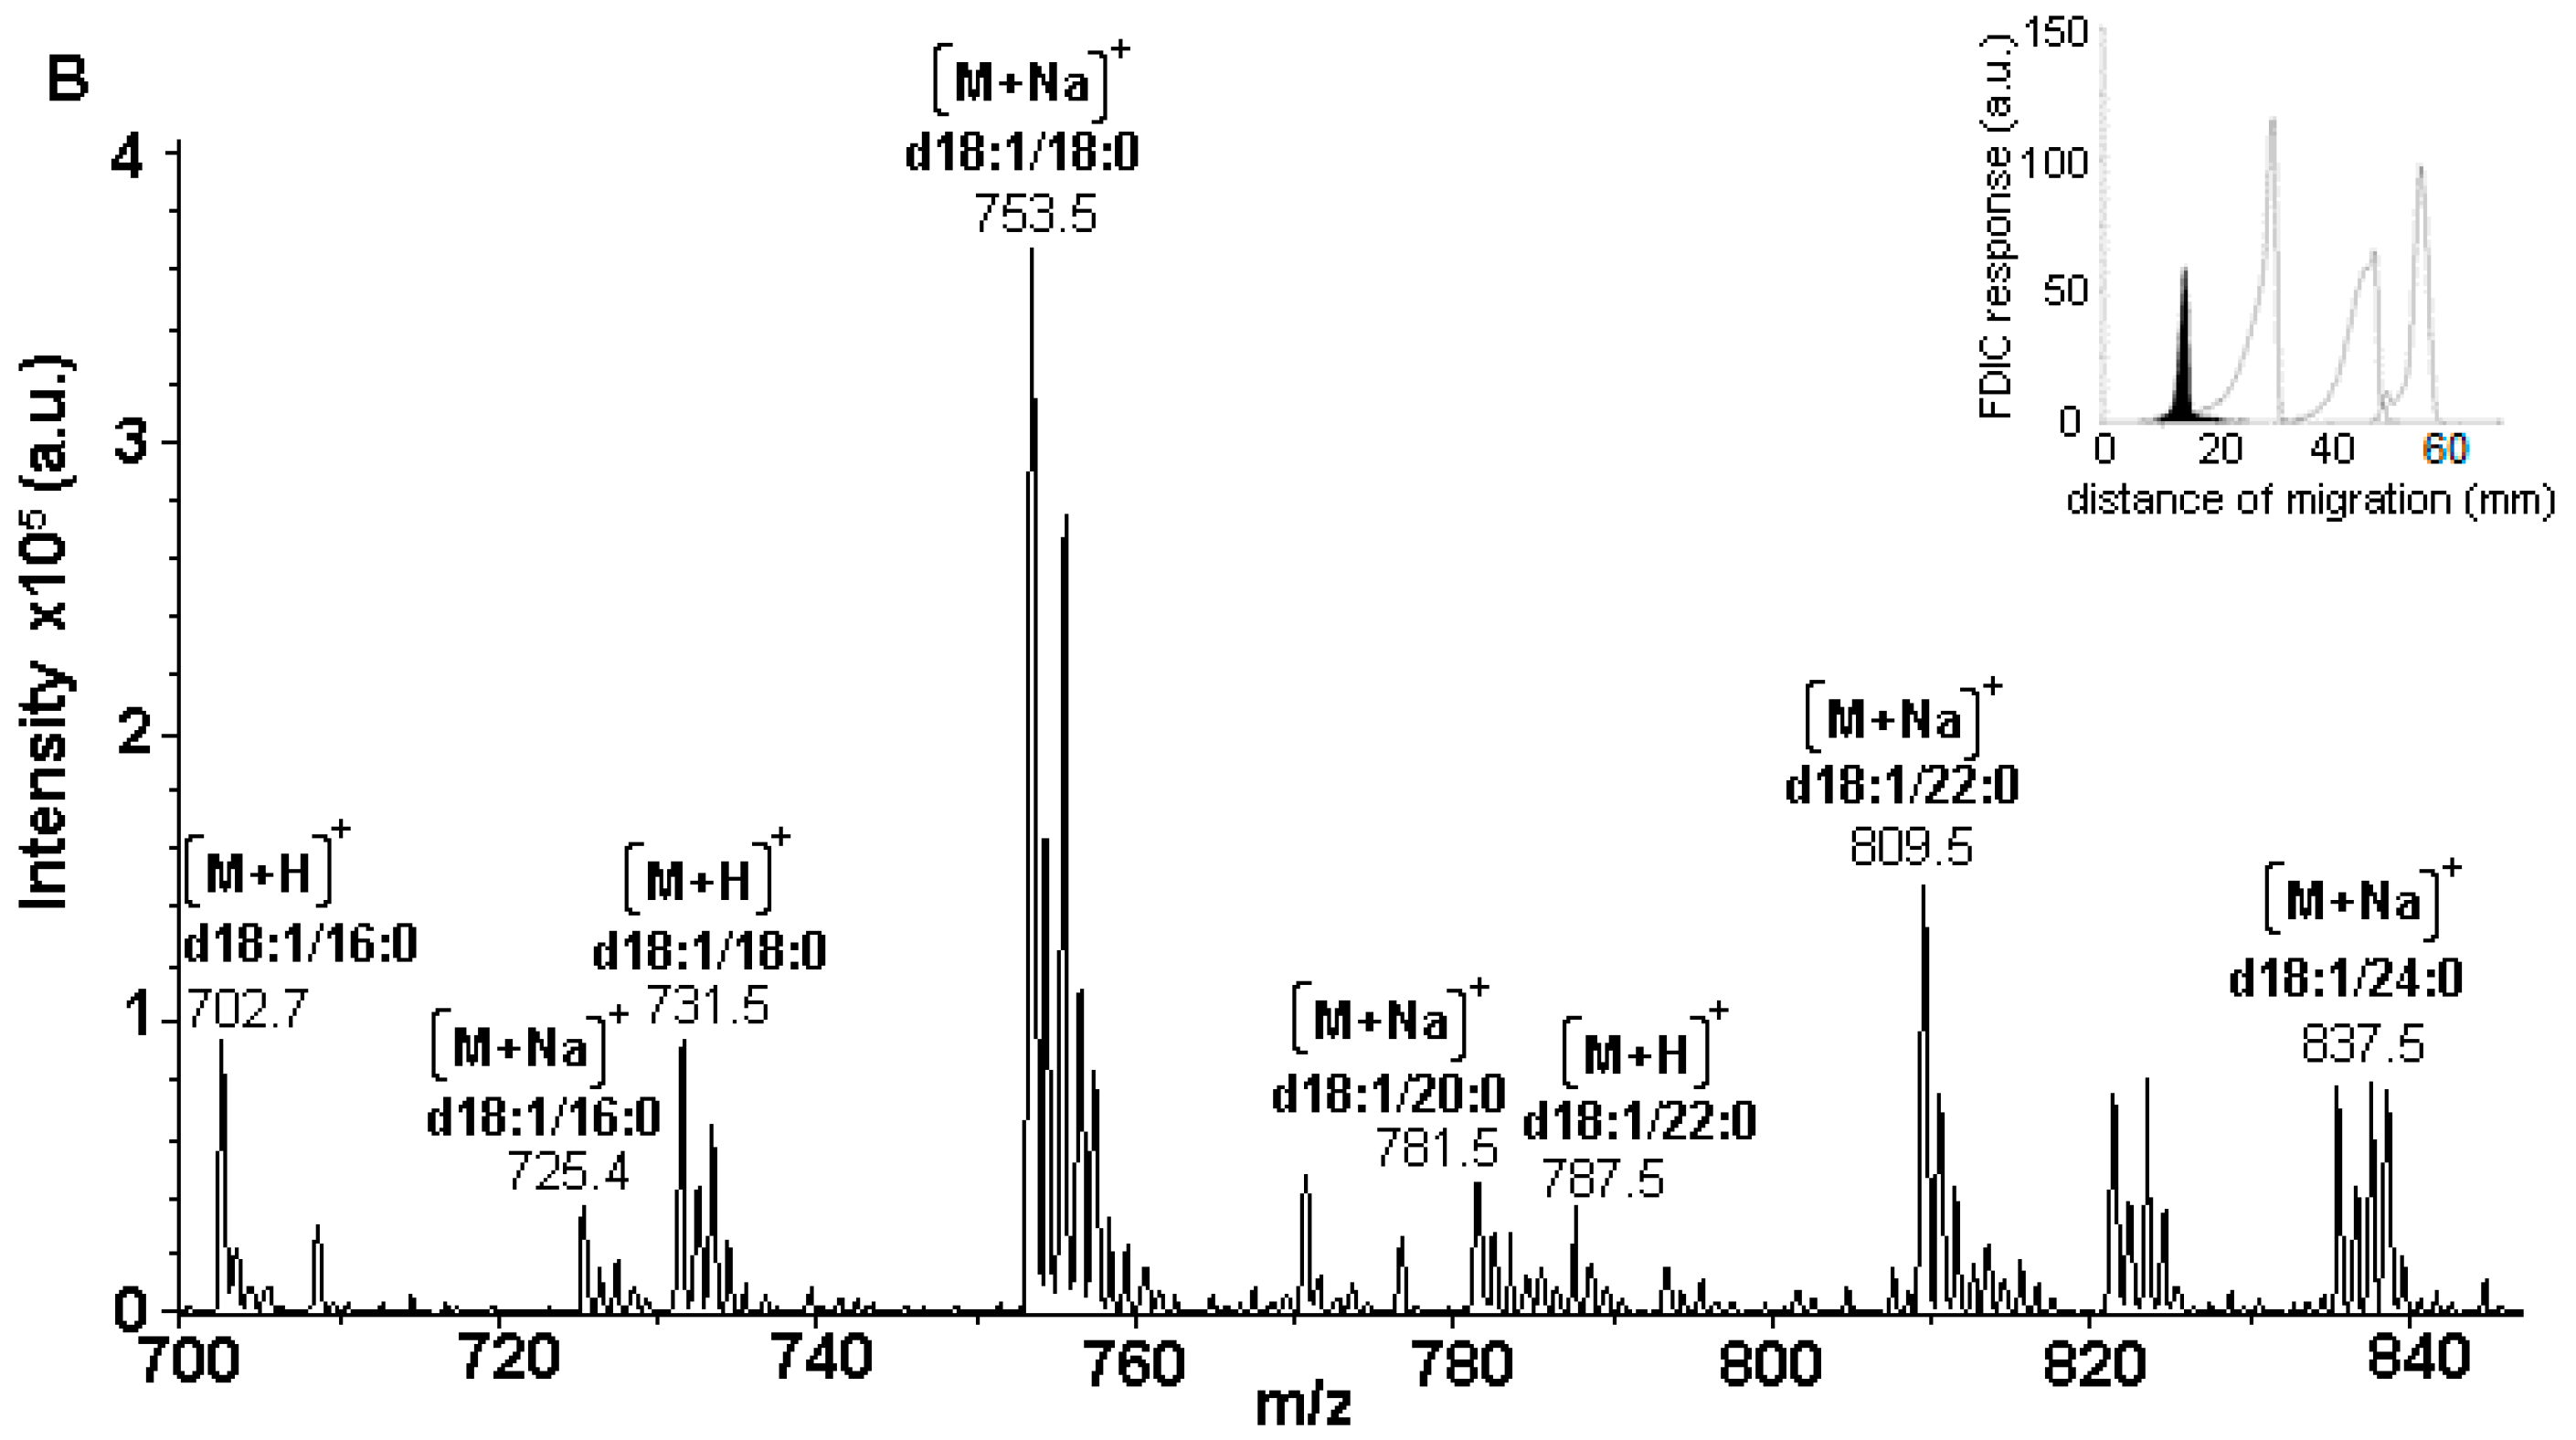
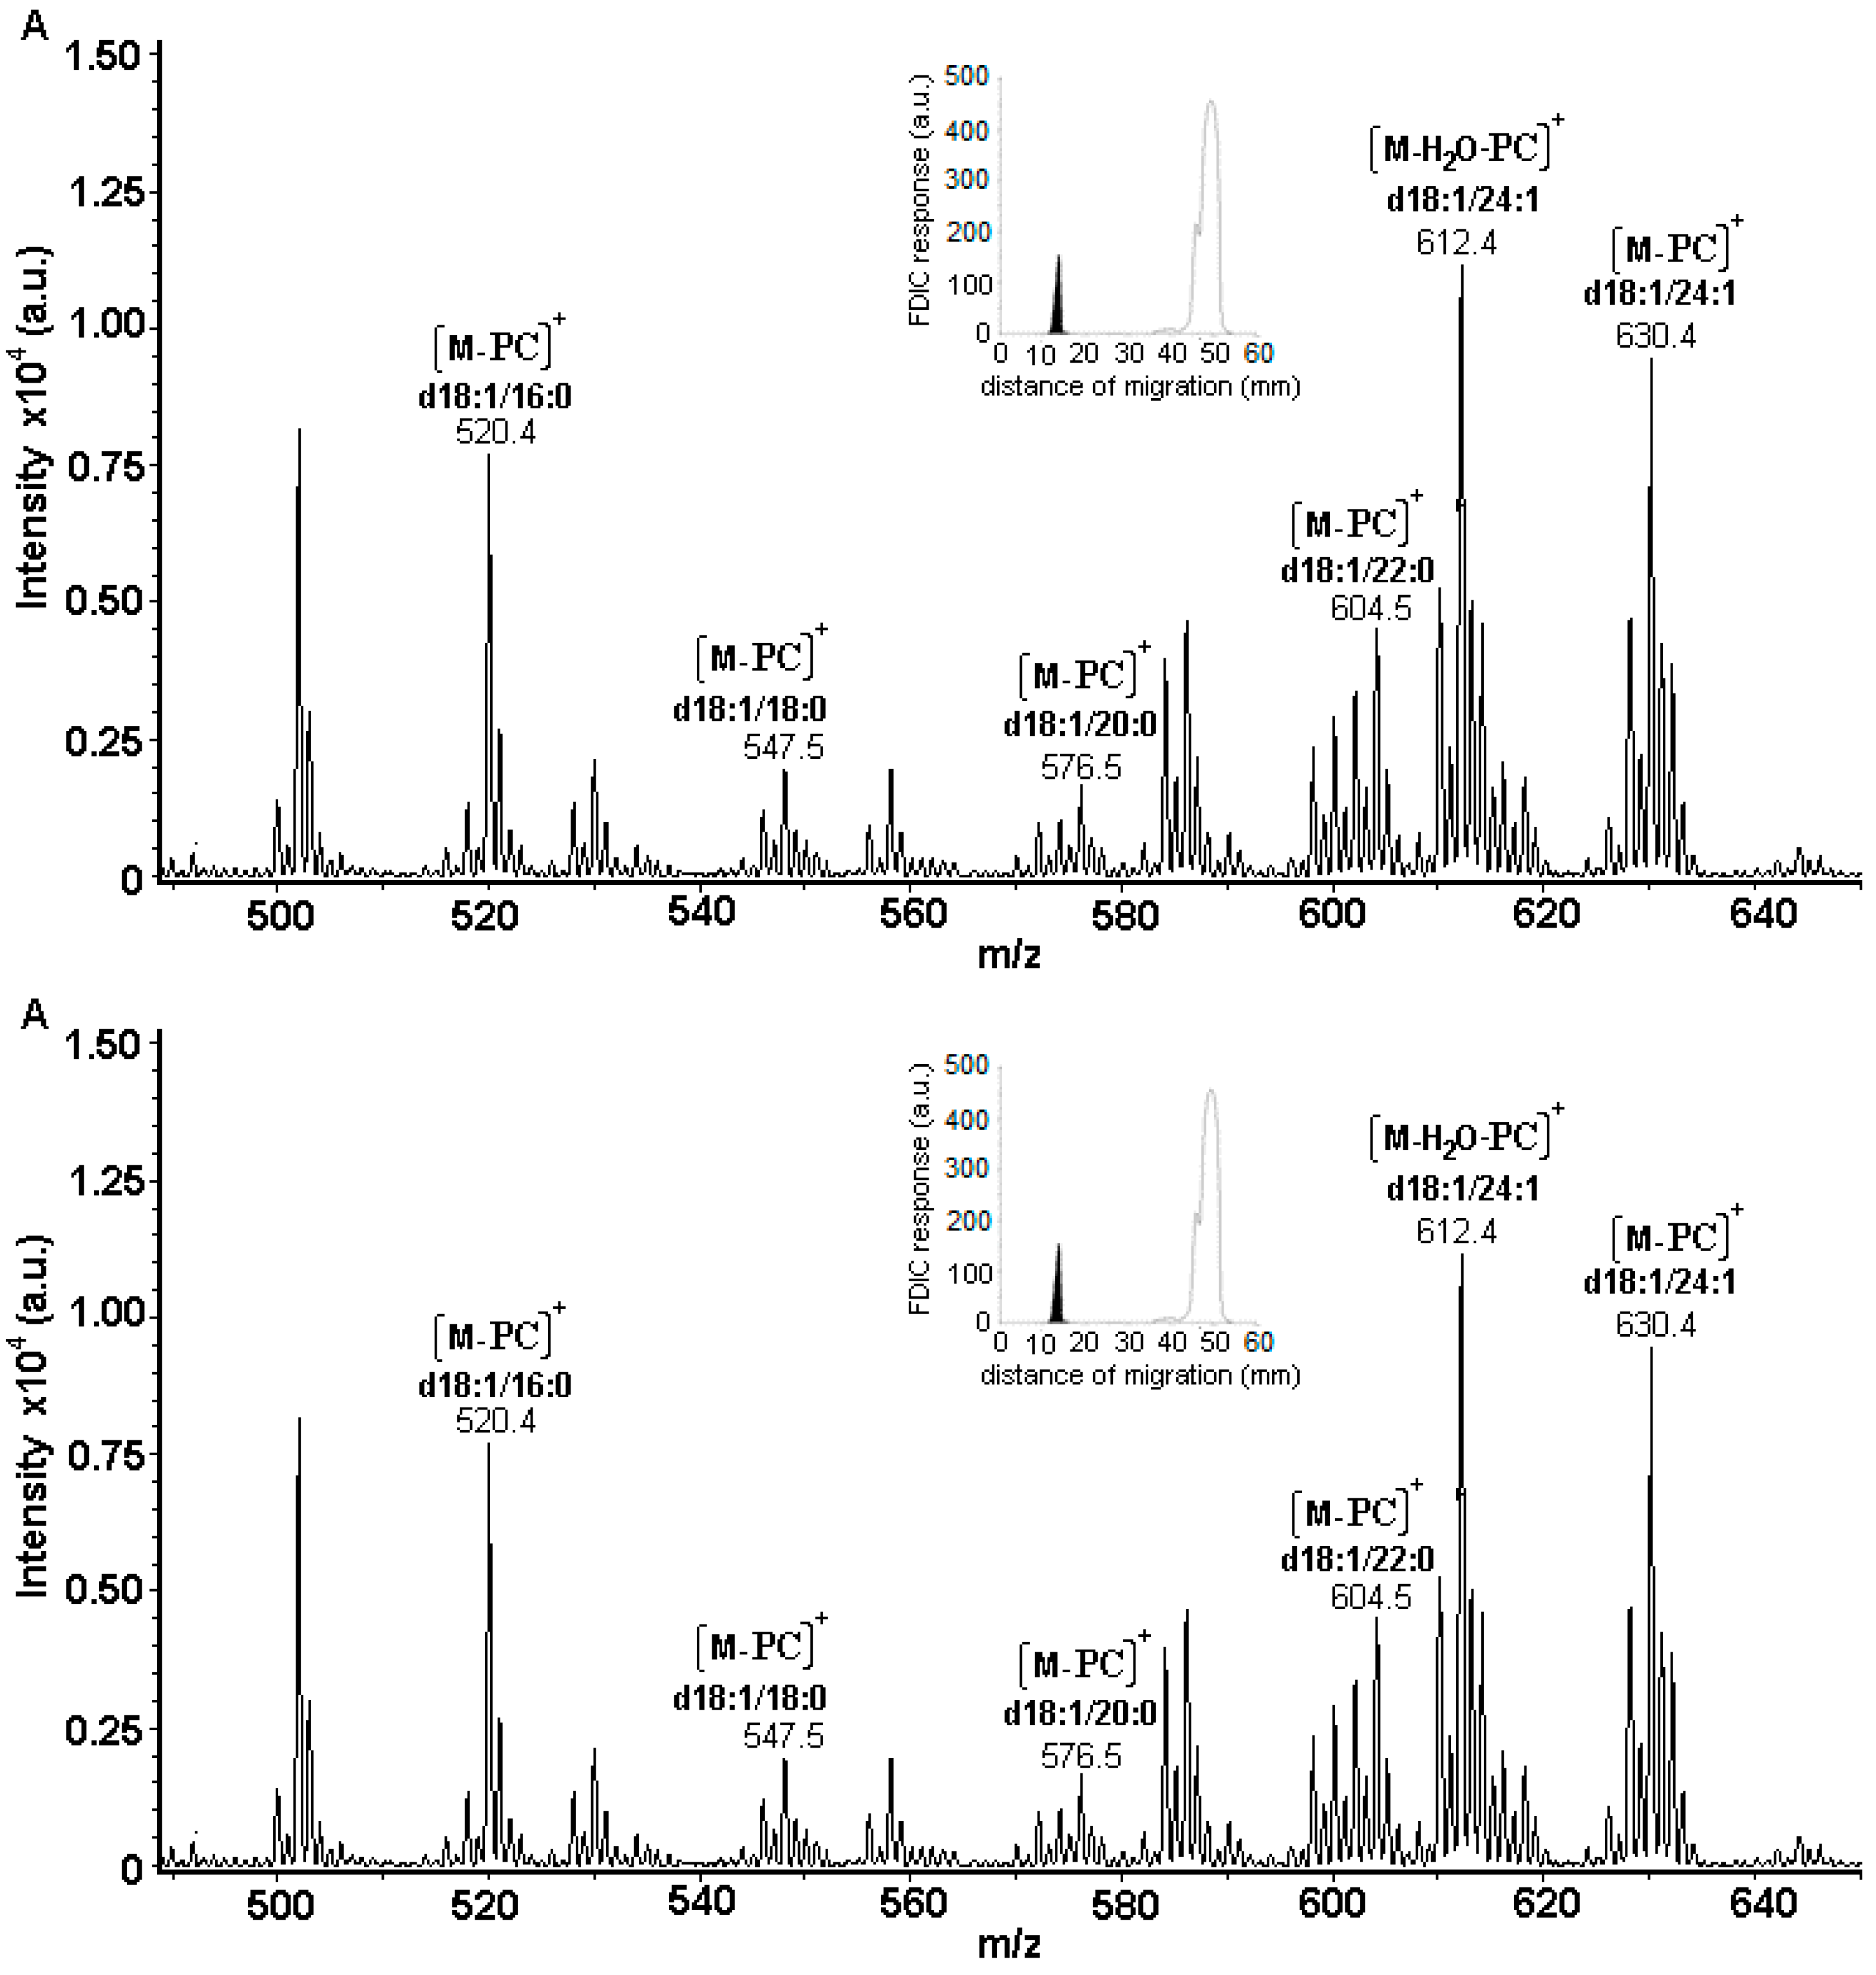
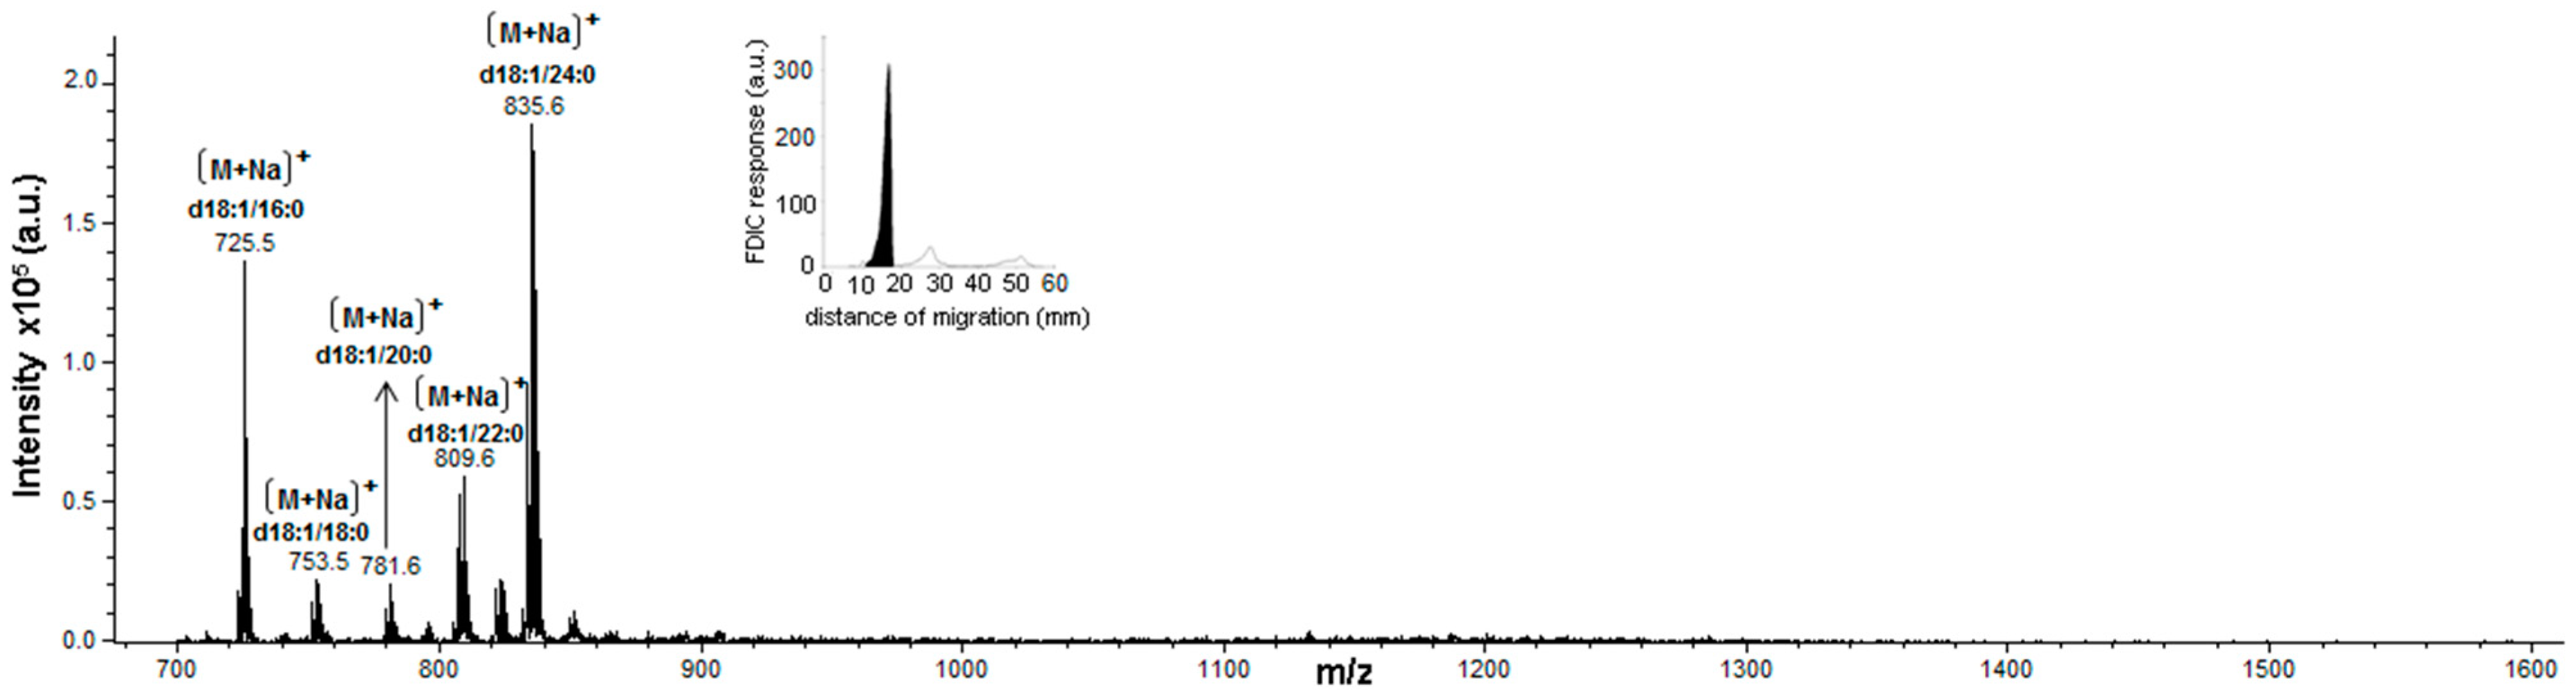
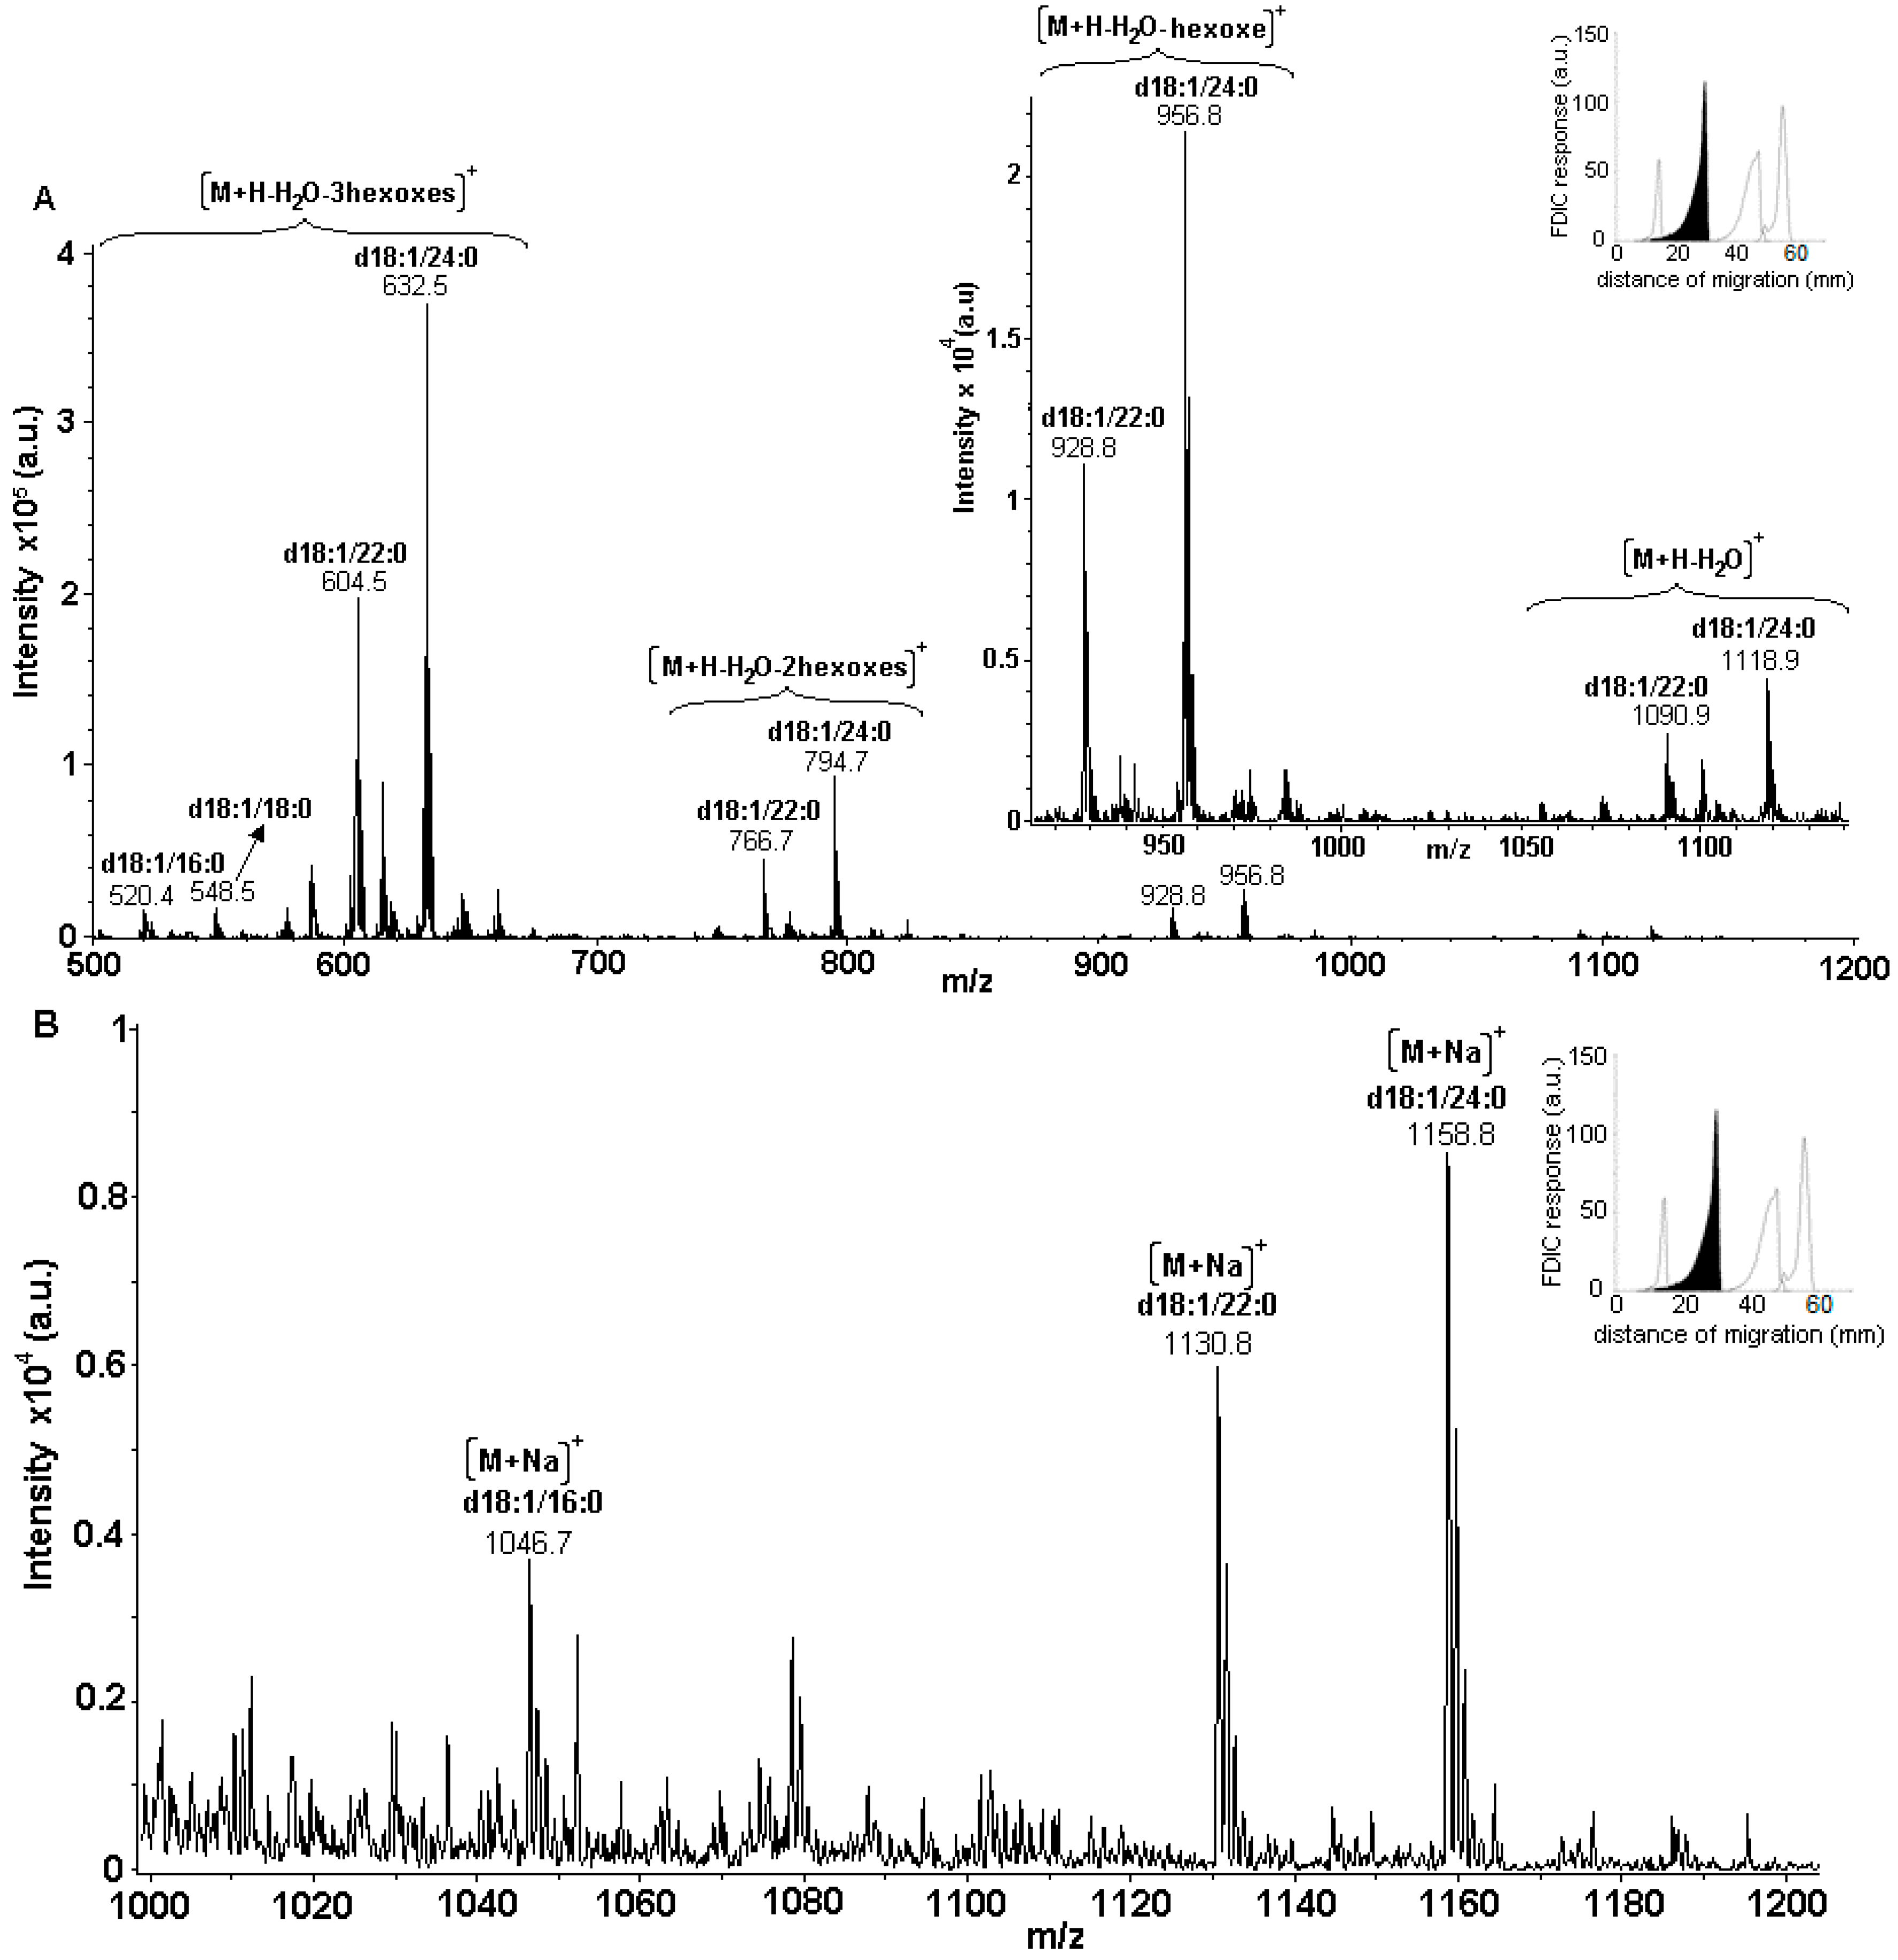
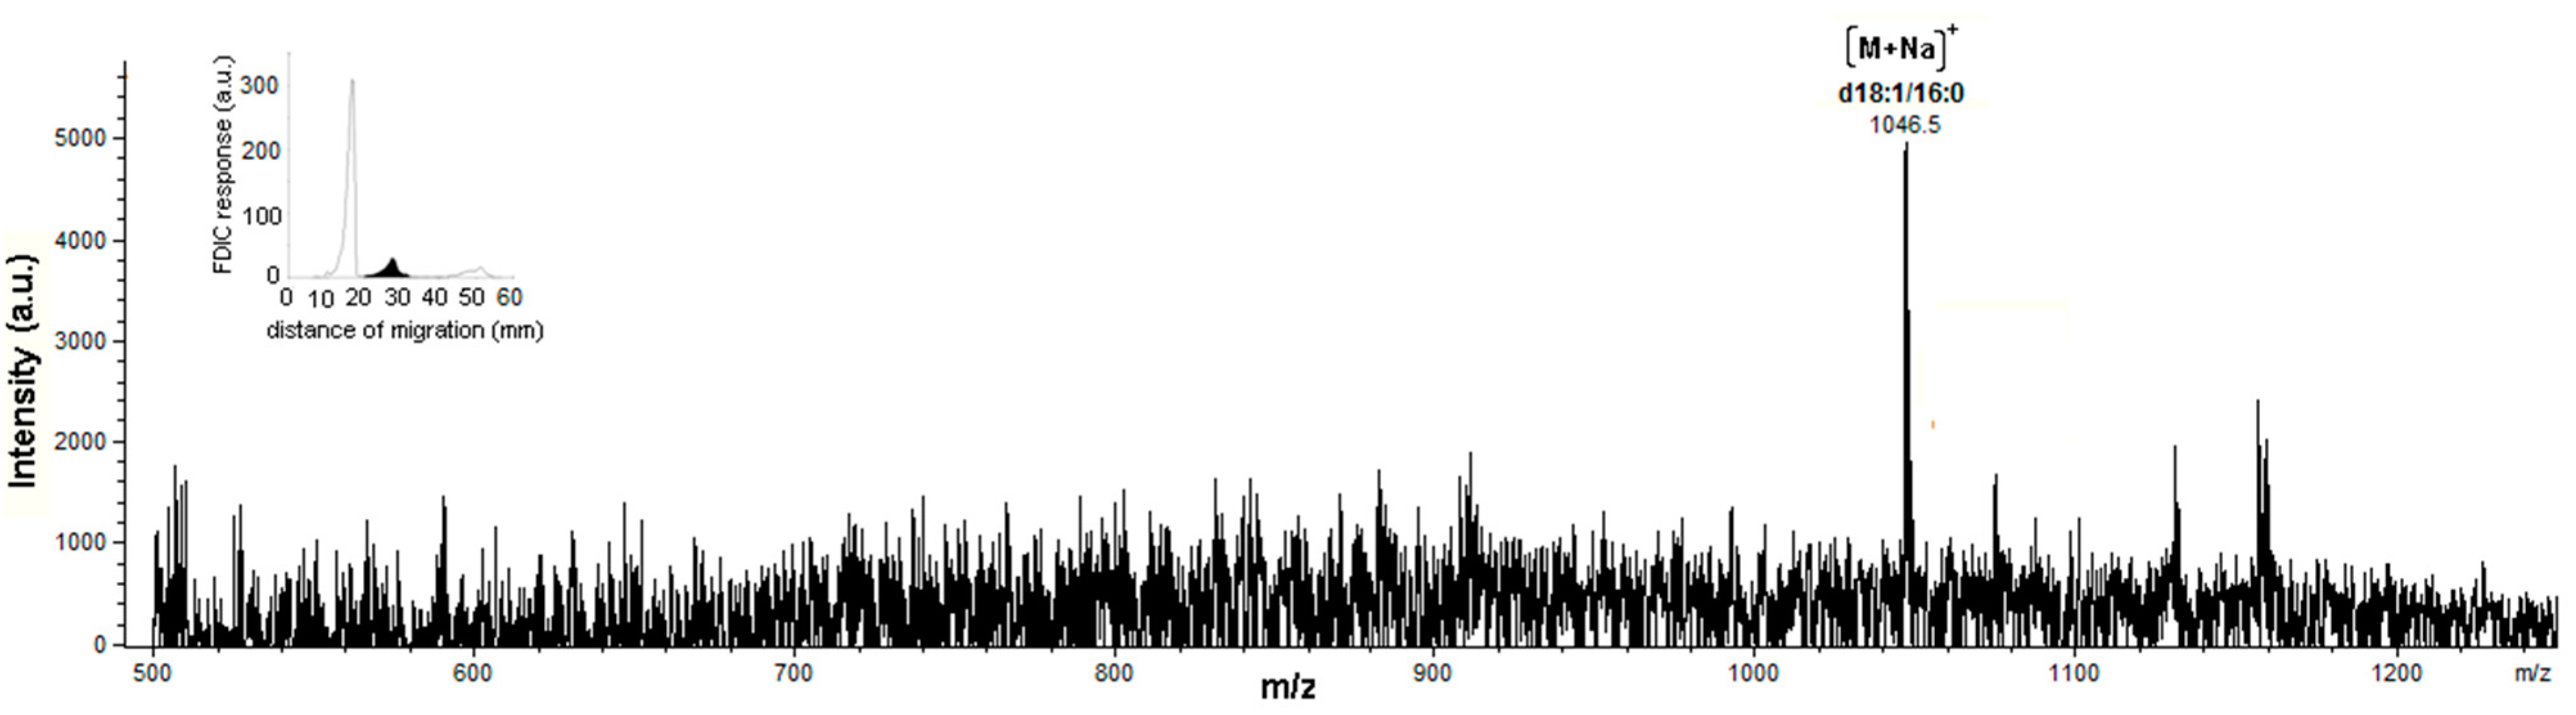
3.5. Identification of SLs Using AMD-FDIC-(API)-MS

FDIC allows peak coordinates to be fixed. Thus, the TLC-MS elution interface extracts each separated HPTLC peak from the primuline-impregnated plate for an online transfer to API-MS. Primuline-impregnated plates can be used in combination with MS for SL identification because their MW range (<454 uma) does not interfere with those of studied SLs. Furthermore, the intensity of signals for the SL spectra obtained from primuline-impregnated plates is similar to that obtained from pure silica gel plates under the selected APCI conditions. By working at 3000 V and 5000 nA, ionization of primuline does not compete with SL ionization, and the signal intensity from APCI mass spectra is adequate.
ESI and APCI provide complementary information on a given SL for identification of peaks from standards and plasma samples directly recorded from the plate, using the interface.
Figure 7, Figure 8 and Figure 9 correspond to the mass spectra of the SM standard and SM separated from two different human plasma samples, respectively. Figure 10 and Figure 11 correspond to the mass spectra of the Gb3 standard and Gb3 separated from a plasma sample of a Fabry patient.
Figure 7. MS spectra of the peak corresponding to SM standard from a primuline-impregnated plate, eluted using the TLC-MS interface (see Experimental section). (A) APCI-MS and (B) ESI-MS (PC: phosphocholine).
Chromatography 02 00167 g007aChromatography 02 00167 g007b
Figure 8. Detail of an MS spectrum of the peak corresponding to SM from a plasma sample from a healthy volunteer, and eluted using the TLC-MS interface (see Table 2 and Figure 4). (A) APCI-MS and (B) ESI-MS.
Chromatography 02 00167 g008
Figure 9. Broad M/Z window of an ESI-MS spectrum of the peak corresponding to SM from a plasma sample and transferred using the TLC-MS interface (see Table 1 and Figure 3B).
Chromatography 02 00167 g009
Figure 10. MS spectra of the peak corresponding to the Gb3 standard from a primuline-impregnated plate, eluted using the TLC-MS interface (see the Experimental section). (A) APCI-MS and (B) ESI-MS.
Chromatography 02 00167 g010
Figure 11. MS spectrum of the peak corresponding to Gb3 from a plasma sample of a Fabry patient, and eluted using the TLC-MS interface (see Table 1 and Figure 3B). (A) APCI-MS and (B) ESI-MS.
Chromatography 02 00167 g011
The peak at 27.4 mm in the plasma sample of a Fabry patient in Figure 3B was unequivocally identified as Gb3 (Figure 11). The ESI spectrum showed an [M+Na]+ ion of m/z = 1046.5, which corresponded to its d18:1/16:0 isoform. This was reported to be the most predominant form of Gb3 in plasma from Fabry patients [4].
In general, ESI provided [M+Na]+, and also [M+H]+ in some cases; APCI gave a more complex fragmentation pattern, with fragments corresponding to Cer moieties. For a given SL standard, isoforms between C16 and C24 were identified in MS.
In the case of SM (Figure 7, Figure 8 and Figure 9), [M+Na]+ and [M+H]+ were observed in ESI spectrum and [M+H−phosphocholine]+ fragments were observed in the APCI spectrum. In order to show fragmentation in detail, the figures depict the ranges of m/z corresponding to the different isoforms found.
In a plasma sample (Figure 8), the peak at 13.1 mm (separated using the short AMD sequence; see Figure 4) can be attributed to SM. In fact, ESI and APCI-MS spectra directly obtained from this peak showed similar fragments to those of the SM standard (Figure 7). A fragment corresponding to [M−H2O−PC]+ was in APCI-MS of SM from plasma sample. Its probable origin is the random dehydration that occurred during the sample treatment procedure. Thus, in general, the isoforms found in the peak separated from the plasma were in agreement with those found in the SM standard. As expected, their relative distribution was different in the standards, of porcine origin, and in human plasma samples.
In a plasma sample separated using the longer AMD sequence (see Figure 3B), the peak at 16.8 mm can also be attributed to SM for the same reason. Figure 9 shows the ESI spectrum corresponding to this peak, recorded in a broad MW range, which includes the zone m/z > 1000. This spectrum shows that globosides were not found in the SM peak from this sample.
In the case of glycosphingolipids, [M+Na]+ were observed in ESI spectra, and fragments corresponding to [M+H−H2O−n hexoses]+ were observed in APCI spectra. The APCI spectrum corresponding to the Gb3 standard (Figure 10A) showed fragments corresponding to the sequential loss of one, two, and three glucose units to give the Cer backbone. A low relative abundance of [M+H−H2O]+ was also noticed. Similar fragmentation occurred in the case of LacCer and GluCer, whose spectra can be found in the supplementary data.
This ion was of low intensity, given that Gb3 is found in low concentrations in plasma, and this compound presented problems with ionization in ESI. In spite of low sensitivity, this was the first online detection of Gb3, from a HPTLC plate, from human plasma, as far as the authors are aware.
On the other hand, Gb3 in our healthy plasma samples was under LOD of ESI-MS under the described conditions. According to the literature, Gb3 in plasma from Fabry patients, determined by a HPLC-MS technique, is found in higher concentrations than in healthy controls [4]. Consequently, in another work using a similar technique, Quehenberger et al. did not report Gb3 in healthy plasma samples [43].

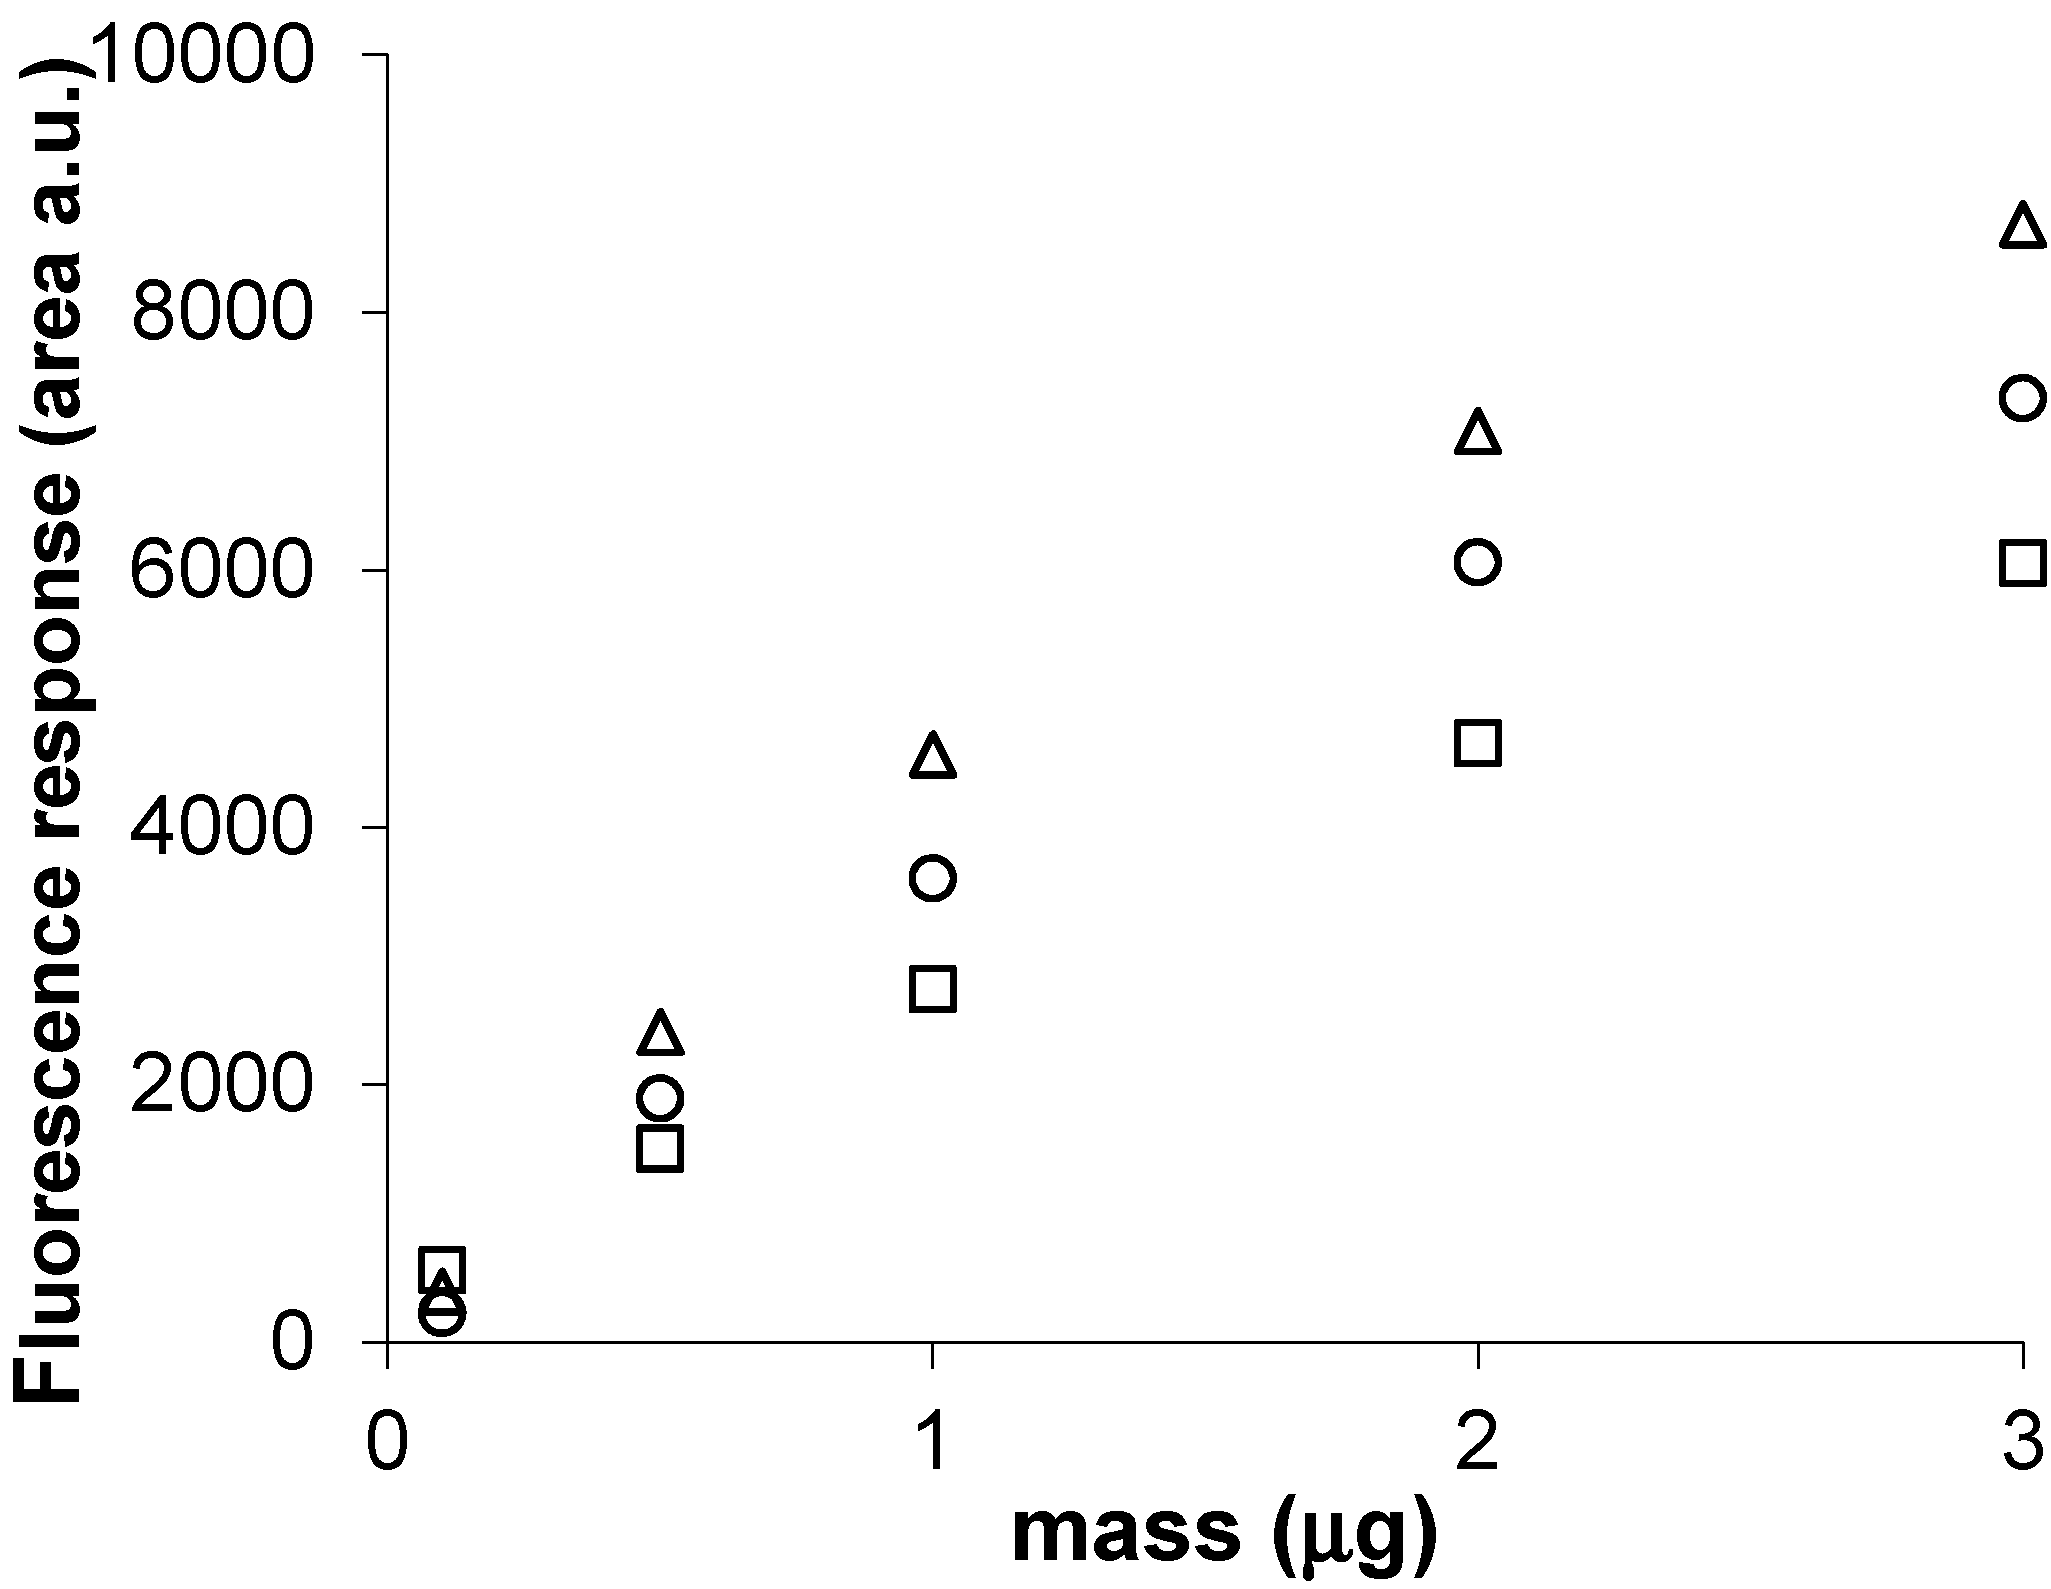
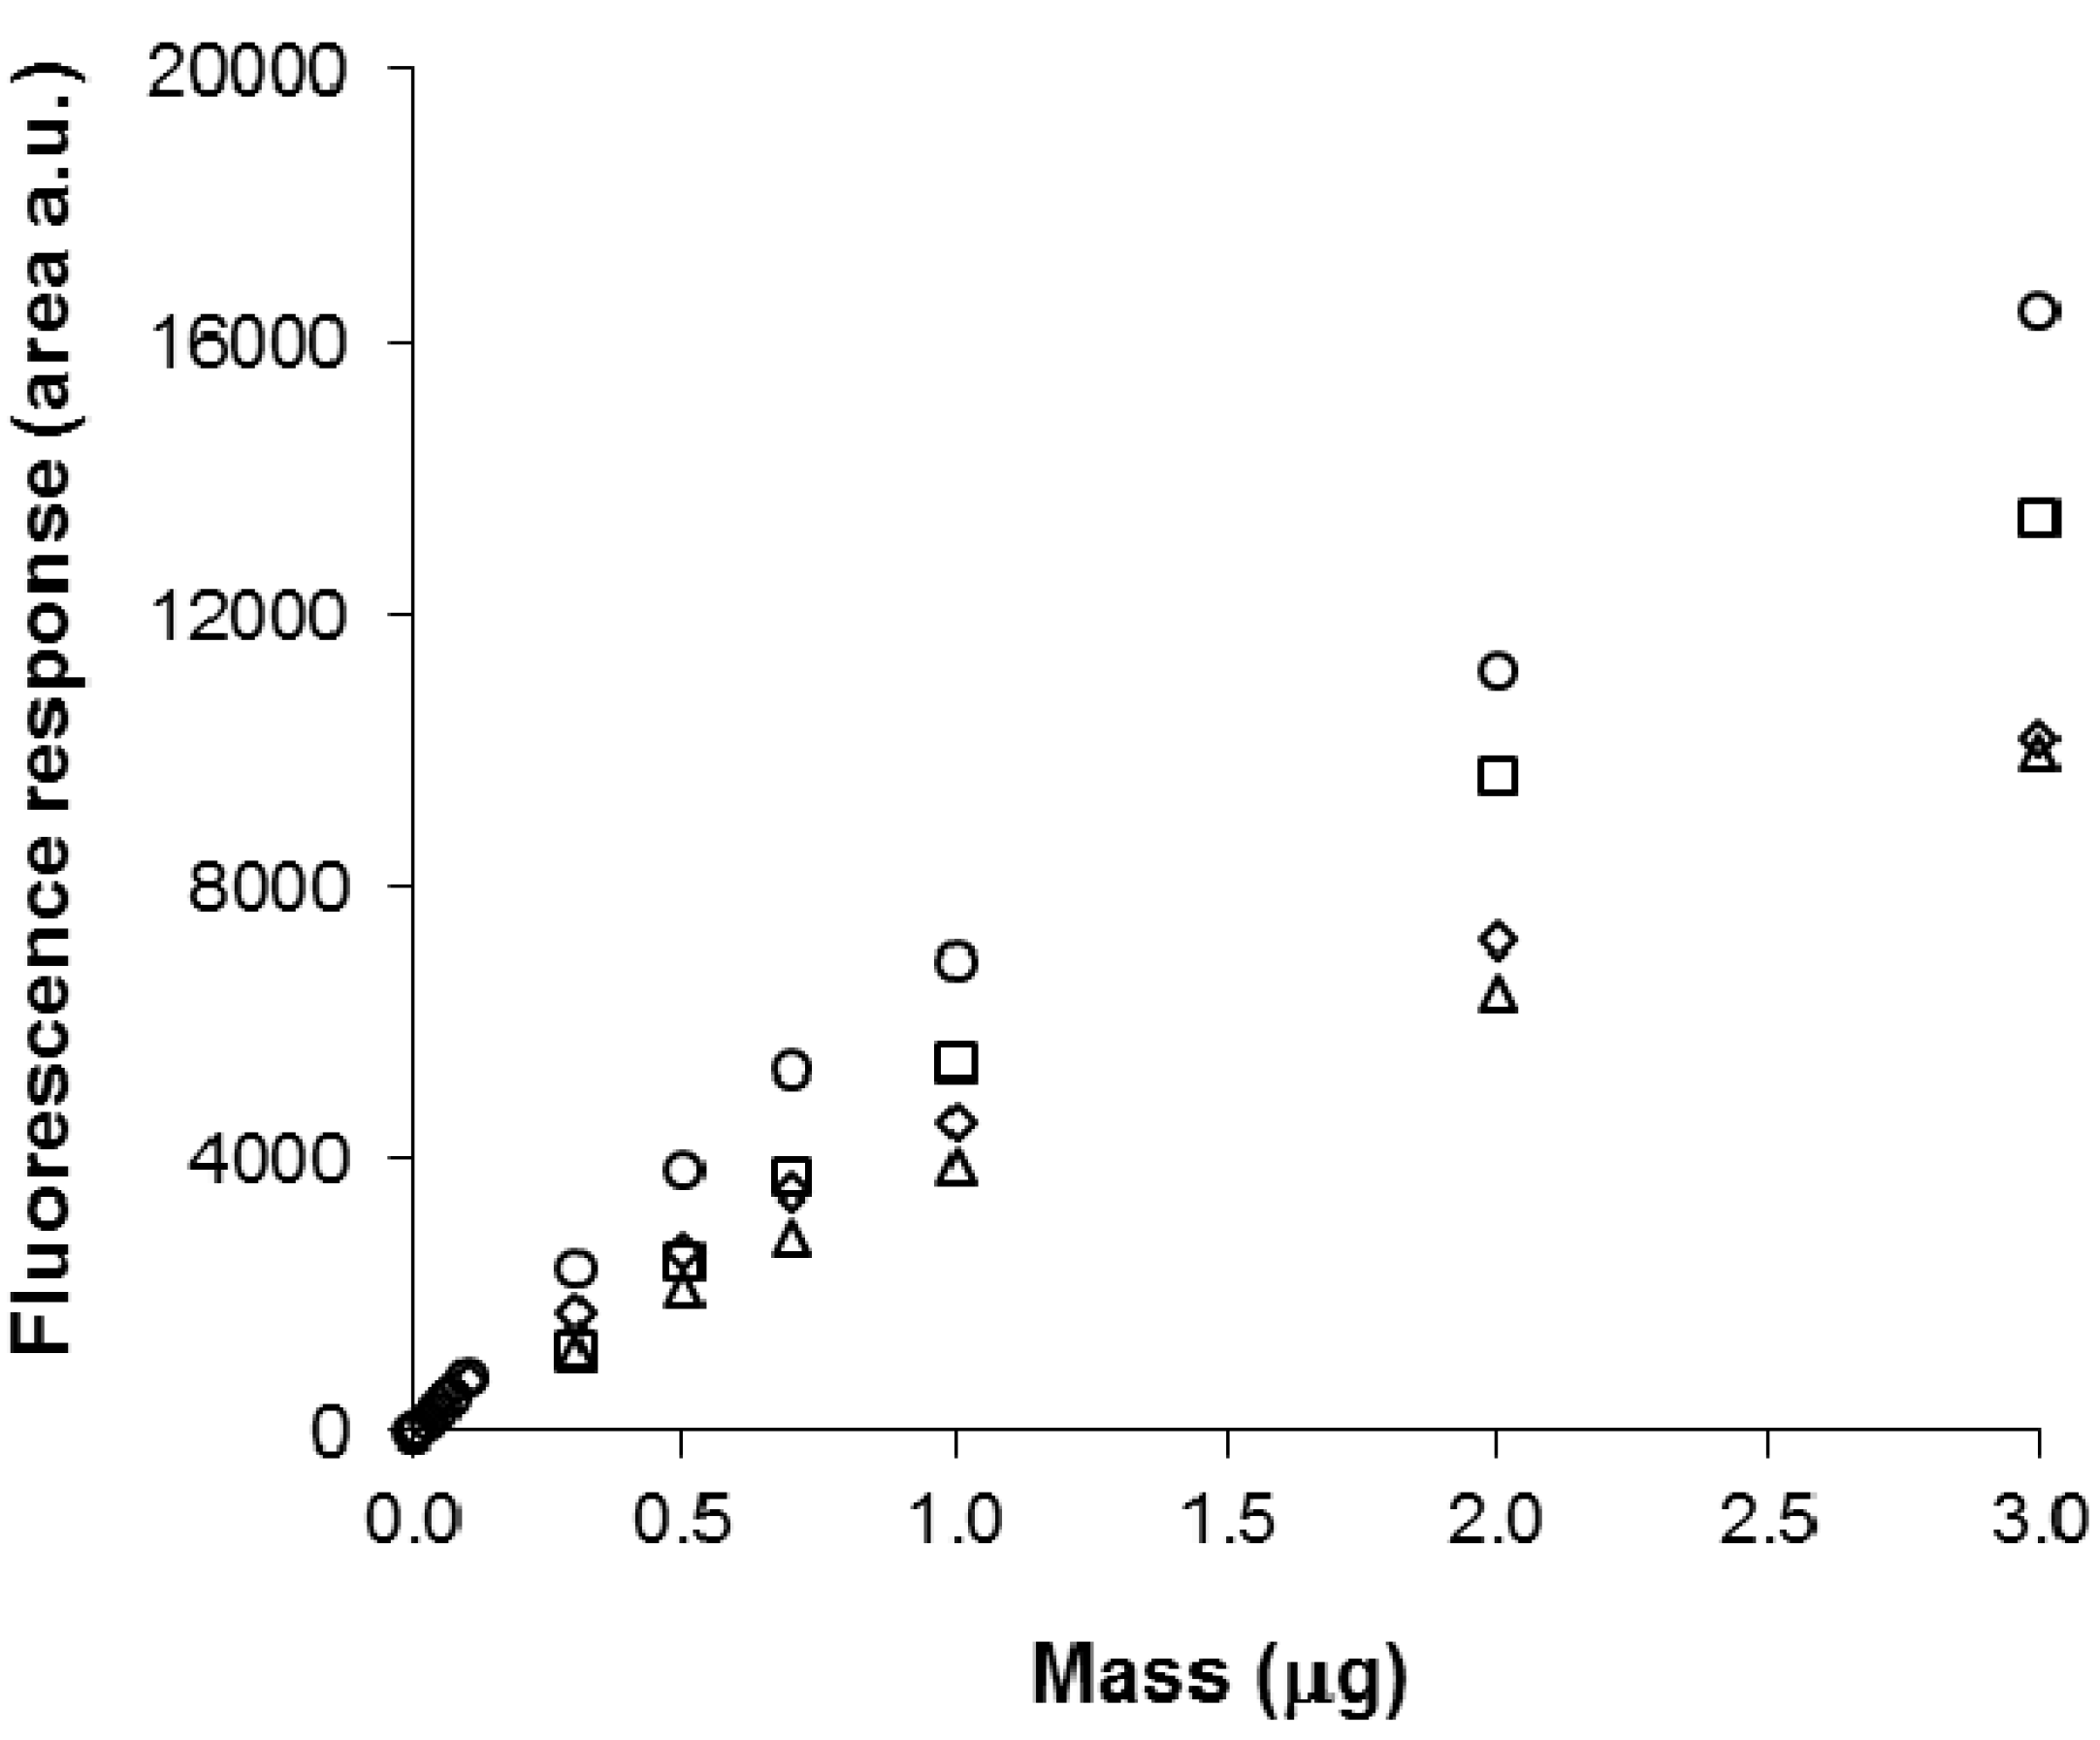
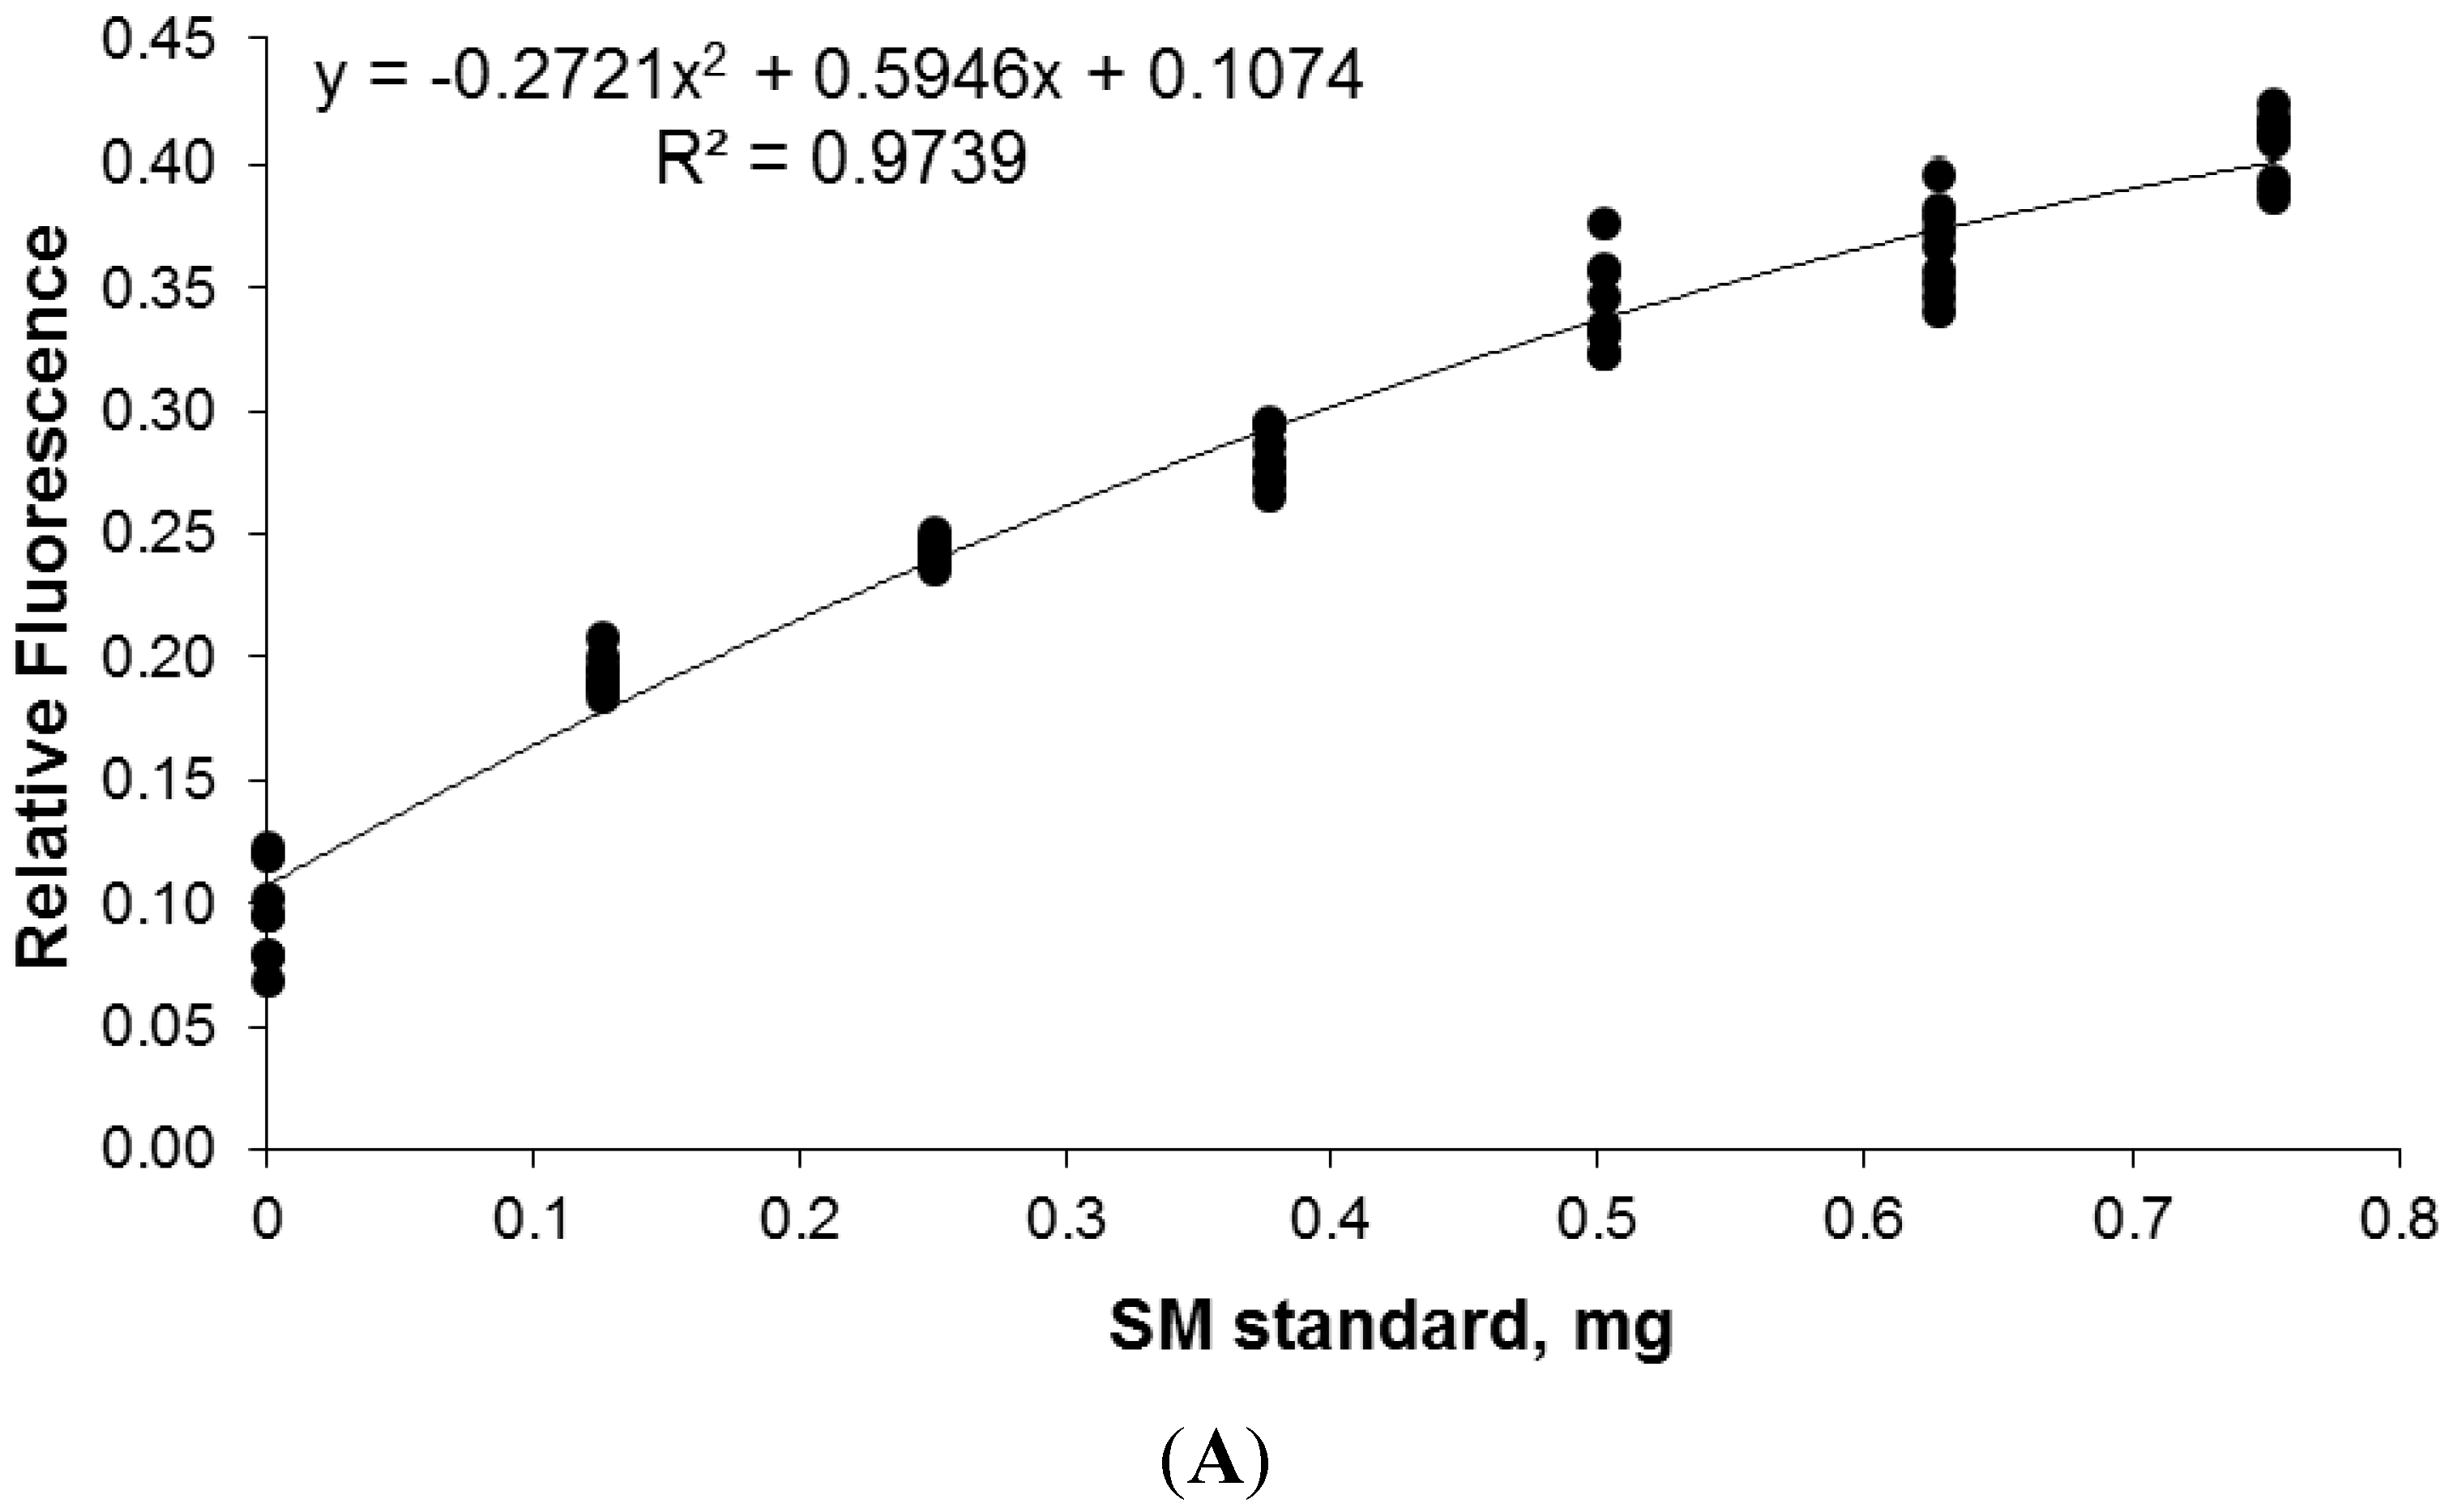
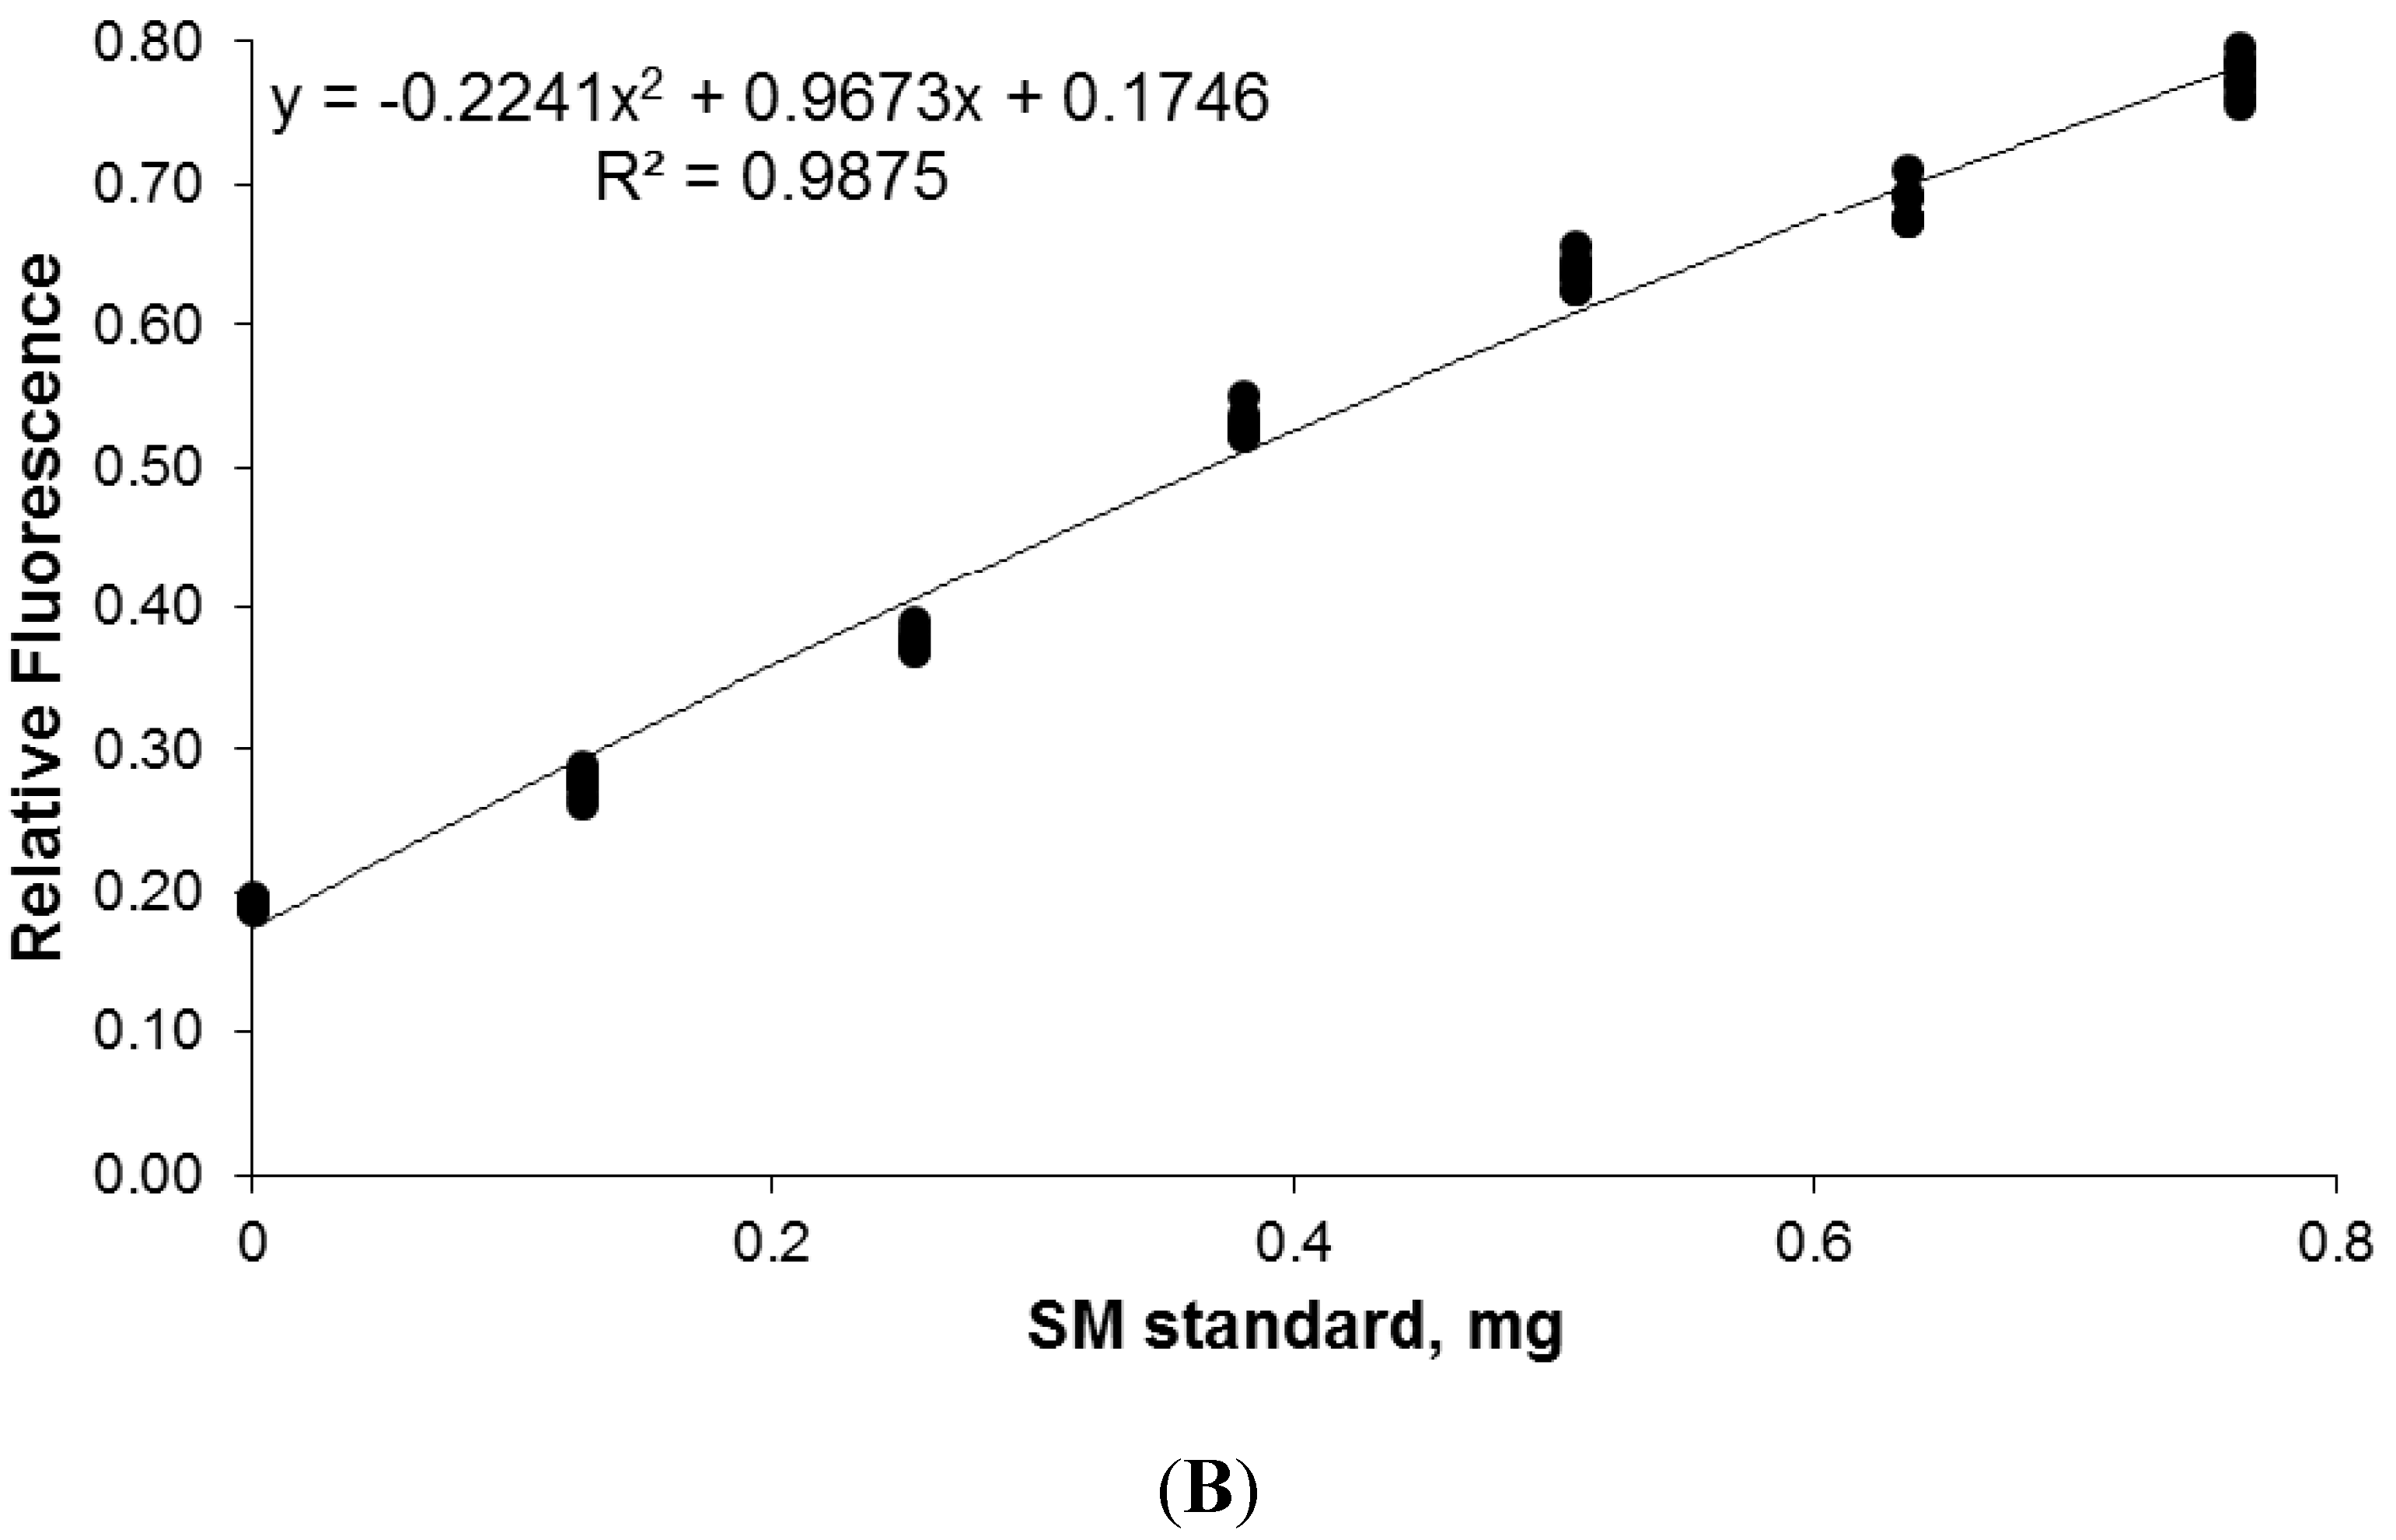
3.6. Quantitative Analysis of SLs by FDIC

The addition of a low percentage of the SL standard to the sample before treatment using the previously described method allows its use for the determination of human SLs using the standard addition method, owing to the fact that the migration distances of both standards and their counterpart human-peaks are the same and all ceramide-based hydrocarbon chains can be detected by FDIC. Two human plasma samples were submitted to the analytical procedure described in Section 2.7.
Second-order calibration curves were obtained when plotting FDIC response (area counts) vs. added SM (µg). The concentration of the analyte (xextr) was calculated as the absolute value of the added SM corresponding to a null response, by extrapolation of the polynomial fitting (x-axis intercept).
The results are given as:
XSM = Xextr ± Sv
with XSM in ppm, and Sv being the standard deviation calculated according to the method described by Koscielniak [44] for polynomial standard addition fitting.
Figure 12 shows the calibration curves of FDIC response vs. added SM (µg). The fluorescence signal from different plates was normalized using a control run of an SM standard (1 µg). Therefore, relative fluorescence was used instead of FDIC response (Area counts).
Figure 12. Calibration curve representing relative fluorescence vs. amount of added SM (µg) for SM determination in two human plasma samples by a non-linear standard addition method (see conditions in Section 2.7).
Chromatography 02 00167 g012aChromatography 02 00167 g012b
Requirements for non-linear calibration by the standard addition method are accomplished [44] relative to the degree of curvature of parabolic function (Q > 0), number (n = 6) and size of additions, and number of measurements (n = 9).
Results obtained were 280 ±17 (n = 9) mg L−1 for volunteer 1 and 289 ±12 (n = 9) mg L−1 for volunteer 2. The uncertainty of the determination was lower than 6% (RSD). The results fall inside the ranges previously given in the literature for concentration of SM in plasma [45,46,47].

4. Conclusions

We present the basis of an online, HPTLC-based hyphenated technique that allows the separation, identification, and quantification of certain SLs from the same plate. Our results suggest that this method can be used for SL determination in human-derived plasma.
Separation by AMD, peak detection and quantification by FDIC using primuline, and a direct transfer of peaks from the primuline-impregnated plate to API-MS using an elution head based-interface are the sequential steps of the technique. Quantification of SM in plasma is performed by FDIC using calibration with a non-linear standard addition method.
The use of HPTLC involves manual operations to transfer the plates from one module to another (AMD, densitometer, and interface). Far from being a disadvantage, this confers a high degree of flexibility. Information can be obtained for unknown bands of a large number of samples on the same plate (as many as 28,in this case), in a reasonable time, under strictly identical conditions, restricted to desired zones if required, with minimal solvent requirements, reduced time and effort, and important cost savings.
SL identification is guaranteed by the use of SL standards during AMD, and by API-MS. In this regard, the results show that APCI can be a valuable tool for SL identification.
The understanding of induced-fluorescence mechanisms should enable other fluorophores to be proposed for improving detection sensitivity.

Supplementary Materials

Supplementary materials can be accessed at: https://www.mdpi.com/2227-9075/2/2/167/s1.

Acknowledgments

The authors thank M. Pocoví and P. Giraldo for fruitful discussions, the Spanish Ministry of Economy and Competitiveness (MINECO) and FEDER (UE) (Plan Nacional de I+D+I, projects CTQ2012-035535 and CTQ2012-34774), as well as DGA-ESF, for financial support. Carmen Jarne thanks CSIC and ESF for a JAE-doc grant.

Author Contributions

Andrés Domínguez and Carmen Jarne performed experimental chromatographic work, data analysis, and interpretation of results; Vicente L. Cebolla, Luis Membrado, and Javier Galbán conceived and designed experiments, and wrote and revised the manuscript; Rosa Garriga, María-Pilar Lapieza, and Elena Romero performed experiments on fluorescence detection; Jesús Orduna and María Savirón performed MS experiments, data analyses, and interpretation; and Isabel Sanz Vicente and Susana de Marcos performed sample preparation, supervised students, and revised the manuscript.

Conflicts of Interest

The authors declare no conflict of interest.

References and Notes

  1. Aerts, J.M.; Kallemeijn, W.W.; Wegdam, W.; Joao Ferraz, M.; van Breemen, M.J.; Dekker, N.; Kramer, G.; Poorthuis, B.J.; Groener, J.E.M.; Cox-Brinkman, J.; et al. Biomarkers in the diagnosis of lysosomal storage disorders: Proteins, lipids and inhibodies. J. Inherit. Metab. Dis. 2011, 34, 605–619. [Google Scholar] [CrossRef] [PubMed]
  2. Elstein, D.; Altarescu, G.; Beck, M. Fabry Disease; Springer: Dordrecht, The Netherlands, 2010. [Google Scholar]
  3. Aerts, J.M.; Groener, J.E.; Kuiper, S.; Donker-Kooperman, W.E.; Strijland, A.; Ottenhoff, R.; van Roomen, C.; Mirzaian, M.; Wijburg, F.A.; Linthorst, G.E.; et al. Elevated globotriaosylsphingosine is a hallmark of Fabry disease. Proc. Nat. Acad. Sci. USA 2008, 105, 2812–2817. [Google Scholar] [CrossRef] [PubMed]
  4. Manwaring, V.; Boutin, M.; Auray-Blais, C. A metabolomic study to identify new globotriaosylceramide related biomarkers in the plasma of Fabry disease patients. Anal. Chem. 2013, 85, 9039–9048. [Google Scholar] [CrossRef] [PubMed]
  5. Boutin, M.; Auray-Blais, C. Multiplex tandem mass spectrometry analysis of novel plasma lyso-Gb3-related analogues in Fabry disease. Anal. Chem. 2014, 86, 3476–3483. [Google Scholar] [CrossRef] [PubMed]
  6. Rolfs, A.; Giese, A.K.; Grittner, U.; Mascher, D.; Elstein, D.; Zimran, A.; Böttcher, T.; Lukas, J.; Hübner, R.; Gölnitz, U.; et al. Glucosylsphingosine Is a Highly Sensitive and Specific Biomarker for Primary Diagnostic and Follow-Up Monitoring in Gaucher Disease in a Non-Jewish, Caucasian Cohort of Gaucher Disease Patients. PLoS One 2013, 8, e79732. [Google Scholar] [CrossRef] [PubMed] [Green Version]
  7. Schiffmann, R.; Forni, S.; Swift, C.; Brignol, N.; Wu, X.; Lockhart, D.J.; Blankenship, D.; Wang, X.; Grayburn, P.A.; Taylor, M.R.G.; et al. Risk of Death in Heart Disease is Associated With Elevated Urinary Globotriaosylceramide. J. Am. Heart Assoc. 2014, 3, e000394. [Google Scholar] [CrossRef] [PubMed]
  8. Gold, H.; Mirzaian, M.; Dekker, N.; Ferraz, M.J.; Lugtenburg, J.; Codée, J.D.C.; van der Marel, G.A.; Overkleeft, H.S.; Linhorst, G.; Groener, J.E.M.; et al. Quantification of globotriaosylsphingosine in plasma and urine of Fabry patients by stable isotope ultraperformance liquid chromatography-tandem mass spectrometry. Clin. Chem. 2013, 59, 547–556. [Google Scholar] [CrossRef] [PubMed]
  9. Morlock, G.; Schwack, W. Hyphenations in planar chromatography. J. Chromatogr. A 2010, 1217, 6600–6609. [Google Scholar] [CrossRef] [PubMed]
  10. Fuchs, B.; Süβ, R.; Teuber, K.; Eibish, M.; Schiller, J. Lipid analysis by thin-layer chromatography- A review of the current state. J. Chromatogr. A 2011, 1218, 2754–2774. [Google Scholar] [CrossRef] [PubMed]
  11. Reich, E.; Schibli, A. High-Performance Thin-Layer Chromatography for the Analysis of Medicinal Plants; Thieme: New York, NY, USA, 2007. [Google Scholar]
  12. Cebolla, V.L.; Jarne, C.; Domingo, M.P.; Domínguez, A.; Delgado-Camón, A.; Garriga, R.; Galbán, J.; Membrado, L.; Gálvez, E.M.; Cossío, F.P. Fluorescence detection by intensity changes for high-performance thin-layer chromatography separation of lipids using automated multiple development. J. Chromatogr. A 2011, 1218, 2668–2675. [Google Scholar] [CrossRef] [PubMed]
  13. Müthing, J.; Distler, U. Advances on the compositional analysis of glycosphingolipids combining thin-layer chromatography with mass spectrometr. Mass Spectrom. Rev. 2010, 29, 425–479. [Google Scholar] [PubMed]
  14. Ochalek, M.; Heissler, S.; Wohlrab, J.; Neubert, R.H.H. Characterization of model lipid membranes designed for studying impact of ceramide species on drug diffusion and penetration. Eur. J. Pharm. Biopharm. 2012, 81, 113–120. [Google Scholar] [CrossRef] [PubMed]
  15. Kabrodt, K.; Lüttich, J.; Dittler, I.; Schellenberg, I. Improved HPTLC separation of lipids using Automated Multiple Development (AMD) and identification with the TLC-MS-Interface. In Proceedings of the HPTLC International Symposium 2011, Basel, Switzerland, July 2011; p. 63.
  16. Opitz, A.; Wirtz, M.; Melchior, D.; Mehling, A.; Kling, H.-W.; Neubert, R.R.H. Improved method for stratum corneum lipid analysis by automated multiple development HPTLC. Chromatographia 2011, 73, 559–565. [Google Scholar] [CrossRef]
  17. Farwanah, H.; Raith, K.; Neubert, R.H.H.; Wohlrab, J. Ceramide profiles of uninvolved skin in atopic dermatitis and psoriasis are comparable to those of healthy skin. Arch. Dermatol. Res. 2005, 296, 514–521. [Google Scholar] [CrossRef] [PubMed]
  18. Raith, K.; Zellmer, S.; Lasch, J.; Neubert, R.H.H. Profiling of human stratum corneum ceramides by liquid chromatographyelectrospray mass spectrometry. Anal. Chim. Acta 2000, 418, 167–173. [Google Scholar] [CrossRef]
  19. Zellmer, S.; Lasch, J. Individual variation of human plantar stratum corneum lipids, determined by automated multiple development of high-performance thin-layer chromatography plates. J. Chromatogr. B 1997, 691, 321–329. [Google Scholar] [CrossRef]
  20. Farwanah, H.; Neubert, R.; Zellmer, S.; Raith, K. Improved procedure for the separation of major stratum corneum lipids by means of automated multiple development thin-layer chromatography. J. Chromatogr. B 2002, 780, 443–450. [Google Scholar] [CrossRef]
  21. Gildenast, T.; Lasch, J. Isolation of ceramide fractions from human stratum corneum lipid extracts by high-performance liquid chromatography. Biochim. Biophys. Acta 1997, 1346, 69–74. [Google Scholar] [CrossRef] [PubMed]
  22. Bonté, F.; Saunois, A.; Pinguet, P.; Meybeck, A. Existence of a lipid gradient in the upper stratum corneum and its possible biological significance. Arch. Dermatol. Res. 1997, 289, 78–82. [Google Scholar] [CrossRef] [PubMed]
  23. Müthing, J. Improved thin-layer chromatographic separation of gangliosides by automated multiple development. J. Chromatogr. B 1994, 657, 75–81. [Google Scholar] [CrossRef]
  24. Müthing, J.; Ziehr, H. Enhanced thin-layer chromatographic separation of GM1b-type gangliosides by automated multiple development. J. Chromatogr. B 1996, 687, 357–362. [Google Scholar] [CrossRef]
  25. Suzuki, A.; Miyazaki, M.; Matsuda, J.; Yoneshige, A. High-performance thin-layer chromatography/mass spectrometry for the analysis of neutral glycosphingolipids. Biochim. Biophys. Acta 2011, 1811, 861–874. [Google Scholar] [CrossRef] [PubMed]
  26. Hildebrandt, H.; Jonas, U.; Ohashi, M.; Klaiber, I.; Rahman, H. Direct electrospray-ionization mass spectrometric analysis of the major ganglioside from crucian carp liver after thin-layer chromatography. Comp. Biochem. Phys. B 1999, 122, 83–88. [Google Scholar] [CrossRef]
  27. Dreisewerd, K.; Müthing, J.; Rohlfing, A.; Meisen, I.; Vukelić, Z.; Peter-Katalinic, J.; Hillenkamp, F.; Berkenkamp, S. Analysis of gangliosides directly from thin-layer chromatography plates by infrared matrix-assisted laser desorption/ionization orthogonal time-of-flight mass spectrometry with a glycerol matrix. Anal. Chem. 2005, 77, 4098–4107. [Google Scholar] [CrossRef] [PubMed]
  28. Nakamura, K.; Suzuki, Y.; Goto-Inoue, N.; Yoshida-Noro, C.; Suzuki, A. Structural characterization of neutral glycosphingolipids by thin-layer chromatography coupled to matrix-assisted laser desorption/ionization quadrupole ion trap time-of-flight MS/MS. Anal. Chem. 2006, 78, 5736–5743. [Google Scholar] [CrossRef] [PubMed]
  29. Meisen, I.; Peter-Katalinic, J.; Müthing, J. Direct analysis of silica gel extracts from inmunostained glycosphingolipids by nanoelectrospray ionization quadrupole time-of-flight mass spectrometry. Anal. Chem. 2004, 76, 2248–2255. [Google Scholar] [CrossRef] [PubMed]
  30. Cansell, M.; Gouygou, J.P.; Jozefonvicz, J.; Letourneur, D. Lipid composition of cultured endothelial cells in relation to their growth. Lipids 1997, 32, 39–44. [Google Scholar] [CrossRef] [PubMed]
  31. Cossío, F.P.; Arrieta, A.; Cebolla, V.L.; Membrado, L.; Garriga, R.; Vela, J.; Domingo, M.P. Berberinecation: A fluorecentchemosensor for alkanes and other low-polarity compounds. A theoretical explanation of this phenomenon. Org. Lett. 2000, 2, 2311–2313. [Google Scholar] [CrossRef] [PubMed]
  32. Cebolla, V.L.; Mateos, E.; Garriga, R.; Membrado, L.; Cossío, F.P.; Gálvez, E.M.; Matt, M.; Delgado-Camón, A. Changes in fluorescent emission induced by non-covalent interactions as a general detection procedure in thin-layer chromatography. ChemPhysChem 2012, 13, 291–299. [Google Scholar] [CrossRef] [PubMed]
  33. Cossío, F.P.; Arrieta, A.; Cebolla, V.L.; Membrado, L.; Domingo, M.P.; Henrion, P.; Vela, J. Enhancement of fluorescence in thin-layer chromatography induced by the interaction between n-alkanes and an organic cation. Anal. Chem. 2000, 72, 1759–1766. [Google Scholar] [CrossRef] [PubMed]
  34. Gálvez, E.M.; Matt, M.; Cebolla, V.L.; Fernandes, F.; Membrado, L.; Cossío, F.P.; Garriga, R.; Vela, J.; Guermouche, M.H. General contribution of nonspecific interactions to fluorescence intensity enhancements. Anal. Chem. 2006, 78, 3699–3705. [Google Scholar] [CrossRef] [PubMed]
  35. Mateos, E.M.; Cebolla, V.L.; Membrado, L.; Vela, J.; Gálvez, E.M.; Matt, M.; Cossío, F.P. Coralynecation, a fluorescent probe for general detection in planar chromatography. J. Chromatogr. A 2007, 1146, 251–257. [Google Scholar] [CrossRef] [PubMed]
  36. Cebolla, V.L.; Membrado, L.; Domingo, M.P.; Henrion, P.; Garriga, R.; González, P.; Cossío, F.P.; Arrieta, A.; Vela, J. Quantitative applications of fluorescence and ultraviolet scanning densitometry for compositional analysis of petroleum products in thin-layer chromatography. J. Chromatogr. Sci. 1999, 37, 219–226. [Google Scholar] [CrossRef]
  37. Luftmann, H. A simple device for the extraction of TLC spots: Direct coupling with an electrospray mass spectrometer. Anal. Bioanal. Chem. 2004, 378, 964–968. [Google Scholar] [CrossRef] [PubMed]
  38. Luftmann, H.; Aranda, M.; Morlock, G.E. Automated interface for hyphenation of planar chromatography with mass spectrometry. Rapid Commun. Mass Spectrom. 2007, 21, 3772–3776. [Google Scholar] [CrossRef] [PubMed]
  39. Aranda, M.; Morlock, G. New method for caffeine quantification by planar chromatography coupled with electrospray ionization mass spectrometry using stable isotope dilution analysis. Rapid Commun. Mass Spectrom. 2007, 21, 1297–1303. [Google Scholar] [CrossRef] [PubMed]
  40. Morlock, G.; Schwack, W. Coupling of planar chromatography to mass spectrometry. TrAC 2010, 29, 1157–1171. [Google Scholar]
  41. Farwanah, H.; Wirtz, J.; Kolter, T.; Raith, K.; Neubert, R.H.H.; Sandhoff, K. Normal phase liquid chromatography coupled to quadrupole time of flight atmospheric pressure chemical ionization mass spectrometry for separation, detection and mass spectrometric profiling of neutral sphingolipids and cholesterol. J. Chromatogr. B 2009, 877, 2976–2982. [Google Scholar] [CrossRef]
  42. Li, K.; Frankowski, K.J.; Belon, C.A.; Neuenswander, B.; Ndjomou, J.; Hanson, A.M.; Shanahan, M.A.; Schoenen, F.J.; Blagg, B.S.J.; Aubé, J.; et al. Optimization of potent hepatitis C virus NS3 helicase inhibitors isolated from the yellow dyes thioflavine S and primuline. J. Med. Chem. 2012, 55, 3319–3330. [Google Scholar] [CrossRef] [PubMed]
  43. Quehenberger, O.; Armando, A.M.; Brown, A.H.; Milne, S.B.; Myers, D.S.; Merrill, A.H.; Bandyopadhyay, S.; Jones, K.N.; Kelly, S.; Shaner, R.L.; et al. Lipidomic reveals a remarkable diversity of lipids in human plasma. J. Lipid Res. 2010, 51, 3299–3305. [Google Scholar] [CrossRef] [PubMed]
  44. Koscielniak, P. Nonlinear calibration by the standard addition method. Chemometr. Intell. Lab. 1999, 47, 275–287. [Google Scholar] [CrossRef]
  45. He, X.; Chen, F.; Gatt, S.; Schuchman, E.H. An enzymatic assay for quantifying spingomyelin in tissues and plasma from humans and mice with Niemann-Pick disease. Anal. Biochem. 2001, 293, 204–211. [Google Scholar] [CrossRef] [PubMed]
  46. He, X.; Chen, F.; McGovern, M.M.; Schuchman, E.H. A fluorescence-based high-throughput sphingomyelin assay for the analysis of Niemann-Pick disease and other disorders of sphingomyelin metabolism. Anal. Biochem. 2002, 306, 115–123. [Google Scholar] [CrossRef] [PubMed]
  47. Hidaka, H.; Yamauchi, K.; Ohta, H.; Akamatsu, T.; Honda, T.; Katsuyama, T. Specific, rapid and sensitive enzymatic measurement of sphingomyelin, phosphatidylcholine and lysophosphatidylcholine in serum and lipid extracts. Clin. Biochem. 2008, 41, 1211–1217. [Google Scholar] [CrossRef] [PubMed]

