High-Throughput Mass Spectrometry Applied to Structural Genomics

Abstract
:1. Introduction

2. Experimental Section
2.1. Protein Samples
2.2. Electrospray Mass Spectrometry-Time of Flight (ESI-TOF) Intact Mass Analysis
2.3. Intact Mass Data Analysis
2.4. In-Gel Tryptic Digestion
2.5. LC-MSMS Analysis of Digests
2.6. MSMS Data Analysis
3. Results and Discussion
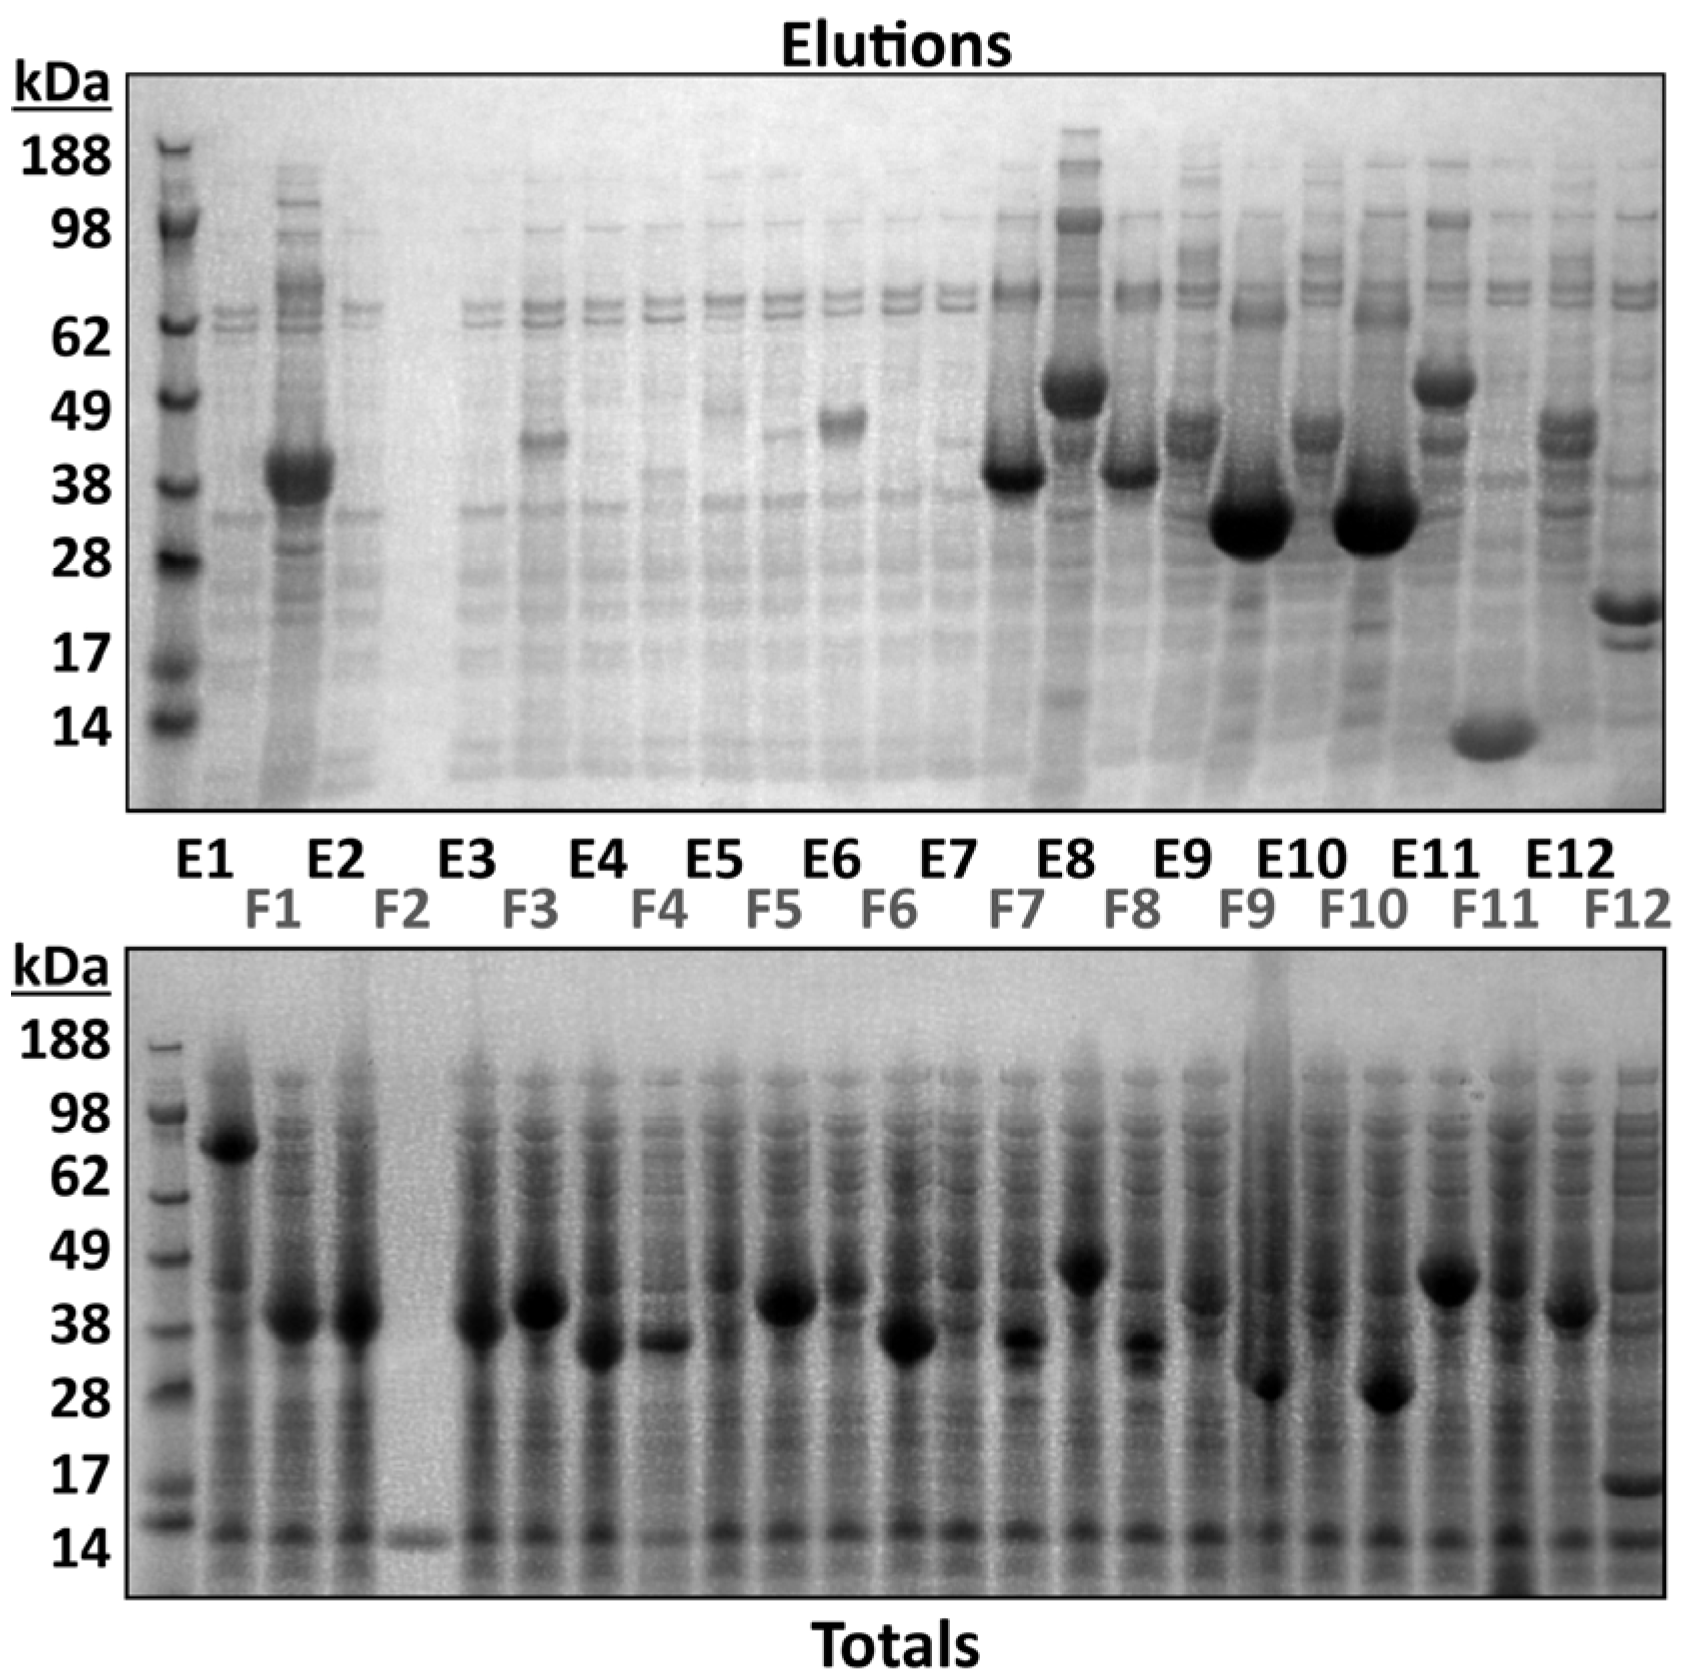
3.1. MS Can be Integrated in a High-Throughput Structural Biology Pipeline
3.2. Intact Mass Analysis Can Guide Small-Scale Test Expression of Multiple Clones

| Sample Description | Intact Mass Analysis | MSMS Analysis Ni Elution | MSMS Analysis Total Protein | |||||||||
|---|---|---|---|---|---|---|---|---|---|---|---|---|
| Construct | N or C Terminal Tag | Elution Yield (SDS PAGE) | Plate Well | Expected Mass (Da) | Observed Mass (Da) | Delta Mass | Relative Intensity × 103 | Comments | MOWSE Score | Identity | MOWSE Score | Identity |
| HDAC6 (478–1215) | N | 0: None | E01 | 81,248.4 | 519 | HDAC6 | ||||||
| HDAC6 (478–844) | N | 0: None | E02 | 42,797.7 | 543 | HDAC6 | ||||||
| HDAC6 (478–835) | N | 0: None | E03 | 41,753.5 | 571 | HDAC6 | ||||||
| HDAC6 (478–801) | N | 0: None | E04 | 37,878 | 220 | HDAC6 | ||||||
| HDAC7 (483–903) | N | 0: None | E05 | 48,005.4 | 314 | HDAC7 | ||||||
| HDAC8 (1–286) | N | 3: Medium | E06 | 44,294.4 | not found | 122 | HDAC8 | 564 | HDAC8 | |||
| No construct | ||||||||||||
| NDEL1 (1–345) | N | 5: High | E08 | 41,900.7 | 44,011.52 | 2110.82 | 310 | Unidentified | 1341 | NDEL1 | 1466 | NDEL1 |
| NDEL1 (1–321) | N | 3: Medium | E09 | 38,777.1 | 697 | NDEL1 | 391 | NDEL1 | ||||
| No construct | ||||||||||||
| NDEL1 (1–310) | N | 5: High | E10 | 37,477.7 | not found | 1071 | NDEL1 | 1241 | NDEL1 | |||
| NDEL1 (13–345) | N | 5: High | E11 | 40,724.5 | 42,836 | 2111.5 | 7 | Unidentified | 1487 | NDEL1 | 1306 | NDEL1 |
| NDEL1 (13–321) | N | 5: High | E12 | 37,600.9 | not found | 1089 | NDEL1 | 61 | NDEL1 | |||
| NDEL1 (13–310) | N | 5: High | F01 | 36,301.5 | not found | 1272 | NDEL1 | |||||
| No construct | ||||||||||||
| SIRT2 (34–389) | N | 1: Low | F03 | 42,571.9 | not found | 299 | SIRT2 | 1011 | SIRT2 | |||
| SIRT2 (34–356) | N | 1: Low | F04 | 39,173.1 | not found | 144 | SIRT2 | 951 | SIRT2 | |||
| SIRT2 (38–389) | N | 1: Low | F05 | 42,068.3 | not found | 191 | SIRT2 | 1158 | SIRT2 | |||
| SIRT2 (38–356) | N | 0: None | F06 | 38,669.6 | 841 | SIRT2 | ||||||
| cobB (1–279) | N | 5: High | F07 | 34,016.9 | not found | 802 | COB1 | 718 | COB1 | |||
| cobB (1–274) | N | 5: High | F08 | 33,617.4 | 33,618.47 | 1.07 | 260 | Intact mass | 837 | COB1 | 785 | COB1 |
| cobB (40–279) | N | 5: High | F09 | 29,140.1 | 29,140.27 | 0.17 | 4100 | Intact mass | 756 | COB1 | 609 | COB1 |
| cobB (40–274) | N | 5: High | F10 | 28,740.6 | 28,741.33 | 0.73 | 2200 | Intact mass | 662 | COB1 | 655 | COB1 |
| RPS27A (1–76) | N | 5: High | F11 | 11,117.6 | 11,118.01 | 0.41 | 26,000 | Intact mass | 206 | RPS27A | no hit | |
| SSBP1 (17–148) | N | 5: High | F12 | 17,879.1 | 17,879.64 | 0.54 | 3600 | Intact mass | 834 | SSBP1 | 726 | SSBP1 |
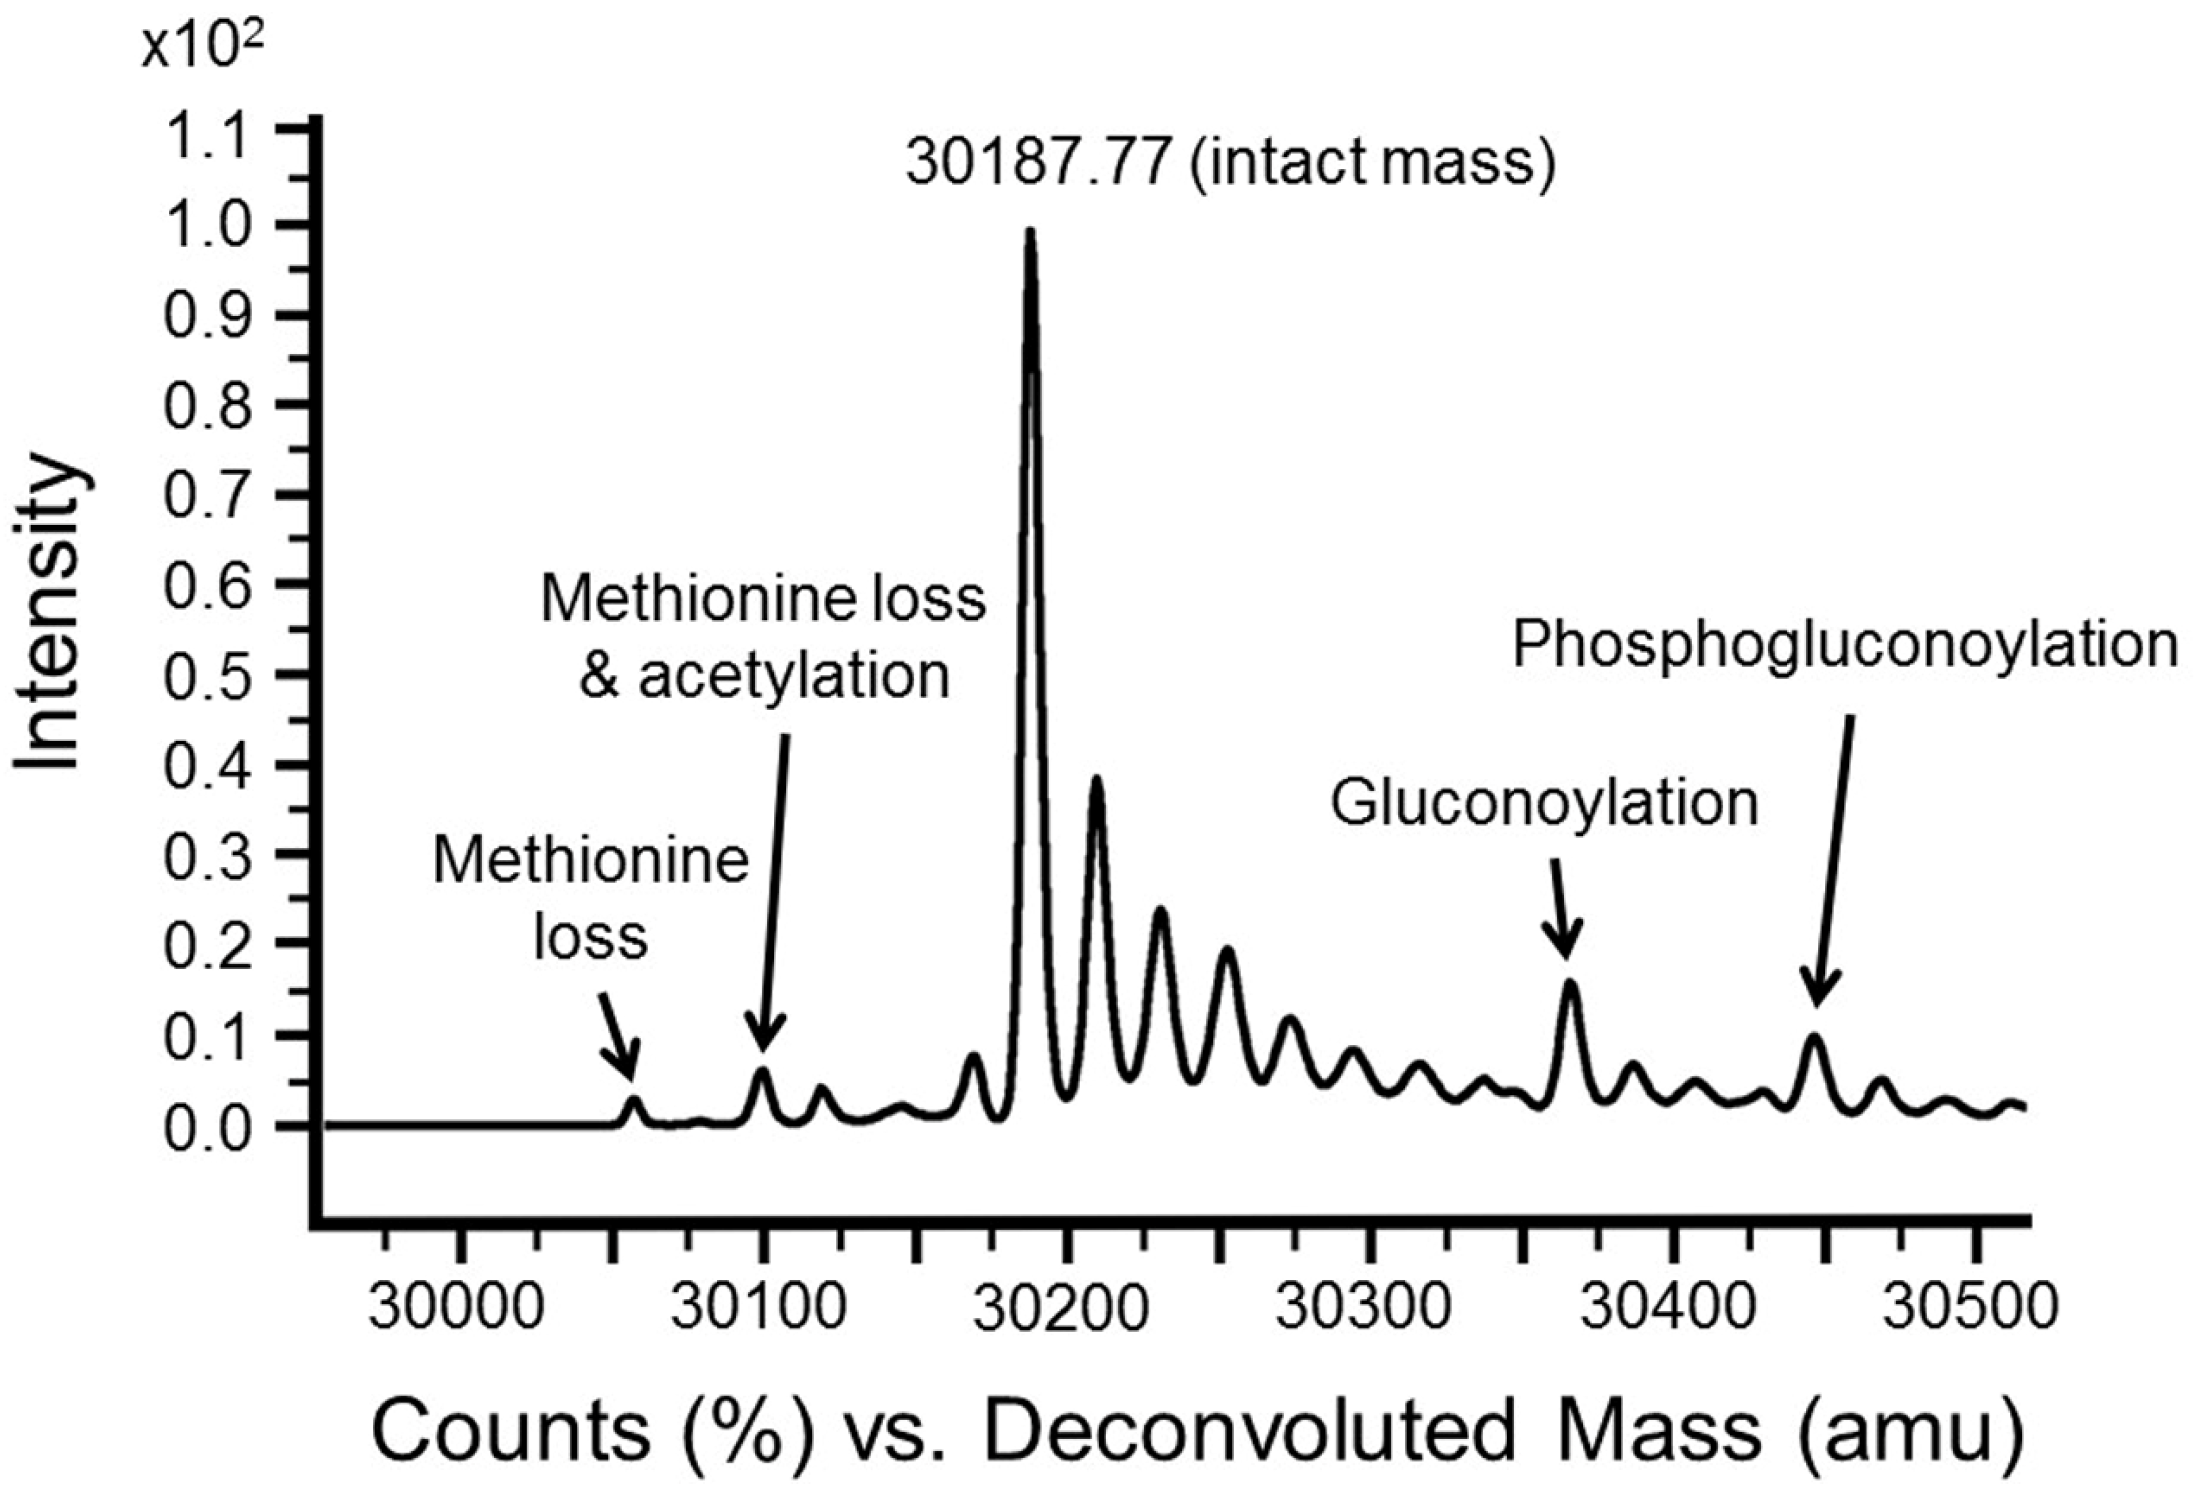
| Delta Mass (Da) | Tentative Interpretation |
|---|---|
| +(22) n | Sodium adduct and proton loss |
| −89 | N-terminal methionine loss and acetylation |
| −131 | N-terminal methionine loss |
| +178 | Gluconoylation [13] |
| +256 | Phosphogluconylation |
| +(80) n | Phosphorylation |
| −18 | Pyroglutamic acid from N-terminal glutamine |
| +42 | Acetylation |
| +(16) n | Oxidation |
| +14 | Methylation |
| <−131 | (1) N-terminal or C-terminal truncation |
| <−131 | (2) N-terminal and C-terminal truncation |
| <−131 | (3) Different construct |
| <−131 | (4) Different protein |
| +305 | Glutathione |
| +56 | Nickel adduct and 2 proton loss |
| +227 | Biotinylation |
| +1216 | Glycan core |
| +1216 + (161) n | Glycosylation envelope |
| various | Point mutation |
| + theoretical mass | (1) Deconvolution artefact |
| + theoretical mass | (2) Dimer |
| − theoretical mass/2 | Deconvolution artefact |
| +29 | S-nitroyslation |
| +70 | N-pyruvic acid 2-iminyl |
| +119 | Cysteinylation |
| +454 | FMN |
| +48 (n) | Selenomethionine |
| −14 | Lysine demethylation |
| −28 | Arginine-Lysine substitution |
3.3. Intact Mass Analysis Is Used to Reveal Expected/Unexpected Post-Translational Modifications

3.4. MSMS Data Is Used to Confirm Identity of Target Proteins
| Expression System | Contaminant Protein | |
|---|---|---|
| E.coli | 50S ribosomal protein L2 | |
| 60 kDa chaperonin | ||
| Bifunctional polymyxin resistance protein ArnA | ||
| Catabolite gene activator | ||
| Chaperone protein htpG | ||
| Chloramphenicol acetyltransferase | ||
| Triosephosphate isomerase | ||
| Insect cell | Host origin | 40S ribosomal protein S16 |
| 40S ribosomal protein S3 | ||
| 40S ribosomal protein S3a | ||
| Eukaryotic translation initiation factor 3 subunit A | ||
| Guanine nucleotide-binding protein subunit beta-like protein | ||
| Heat shock 70 kDa protein cognate 4 | ||
| Tubulin alpha-1 chain | ||
| Tubulin beta-1 chain | ||
| Histone H2A | ||
| Histone H2B | ||
| Histone H4 | ||
| Viral origin | Early 39 kDa protein | |
| Major capsid protein | ||
| Probable endochitinase | ||
3.5. MS Is Complementary to SDS-PAGE in a Structural Biologist’s Toolkit
3.6. MS Can Help Detect Mistakes and Mitigate Downstream Decision
4. Conclusions
Supplementary Materials
Acknowledgments
Author Contributions
Conflicts of Interest
References
- Savitsky, P.; Bray, J.; Cooper, C.D.O.; Marsden, B.D.; Mahajan, P.; Burgess-Brown, N.A.; Gileadia, O. High-throughput production of human proteins for crystallization: The SGC experience. J. Struct. Biol. 2010, 172, 3–13. [Google Scholar] [CrossRef]
- Edwards, A. Large-Scale Structural Biology of the Human Proteome. Annu. Rev. Biochem. 2009, 78, 541–568. [Google Scholar] [CrossRef]
- Terwilliger, T.C.; Stuart, D.; Yokoyama, S. Lessons from Structural Genomics. Annu. Rev. Biophys. 2009, 38, 371–383. [Google Scholar] [CrossRef]
- Graslund, S.; Sagemark, J.; Berglund, H.; Dahlgren, L.G.; Flores, A.; Hammarström, M.; Johansson, I.; Kotenyova, T.; Nilsson, M.; Nordlund, P.; et al. The use of systematic N- and C-terminal deletions to promote production and structural studies of recombinant proteins. Protein Expr. Purif. 2008, 58, 210–221. [Google Scholar] [CrossRef]
- Cohen, S.L.; Chait, B.T. Mass spectrometry as a tool for protein crystallography. Annu. Rev. Biophys. Biomol. Struct. 2001, 30, 67–85. [Google Scholar] [CrossRef]
- Rosenfeld, J.; Capdevielle, J.; Guillemot, J.C.; Ferrara, P. In-gel digestion of proteins for internal sequence analysis after one-or two-dimensional gel electrophoresis. Anal. Biochem. 1992, 203, 173–179. [Google Scholar] [CrossRef]
- Rath, A.; Glibowicka, M.; Nadeau, V.G.; Chen, G.; Deber, C.M. Detergent binding explains anomalous SDS-PAGE migration of membrane proteins. Proc. Natl. Acad. Sci. USA 2009, 106, 1760–1765. [Google Scholar] [CrossRef]
- Graslund, S.; Nordlund, P.; Weigelt, J.; Hallberg, B.M.; Bray, J.; Gileadi, O.; Knapp, S.; Oppermann, U.; Arrowsmith, C.; Hui, R.; et al. Protein production and purification. Nat. Methods 2008, 5, 135–146. [Google Scholar] [CrossRef]
- Burgess-Brown, N.A.; Mahajan, P.; Strain-Damerell, C.; Gileadi, O.; Gräslund, S. Medium-throughput production of recombinant human proteins: Protein production in E. coli. Methods Mol. Biol. 2014, 1091, 73–94. [Google Scholar]
- Mahajan, P.; Strain-Damerell, C.; Gileadi, O.; Burgess-Brown, N.A. Medium-throughput production of recombinant human proteins: Protein production in insect cells. Methods Mol. Biol. 2014, 1091, 95–121. [Google Scholar]
- Strain-Damerell, C.; Mahajan, P.; Gileadi, O.; Burgess-Brown, N.A. Medium-throughput production of recombinant human proteins: Ligation-independent cloning. Methods Mol. Biol. 2014, 1091, 55–72. [Google Scholar]
- UNIMOD: Protein modifications for mass spectrometry. Available online: http://www.unimod.org (accessed on 16 September 2014).
- Geoghegan, K.F.; Dixon, H.B.; Rosner, P.J.; Hoth, L.R.; Lanzetti, A.J.; Borzilleri, K.A.; Marr, E.S.; Pezzullo, L.H.; Martin, L.B.; LeMotte, P.K.; et al. Spontaneous alpha-N-6-phosphogluconoylation of a “His tag” in Escherichia coli: The cause of extra mass of 258 or 178 Da in fusion proteins. Anal. Biochem. 1999, 267, 169–184. [Google Scholar] [CrossRef]
- Whitelegge, J.P. Integral membrane proteins and bilayer proteomics. Anal. Chem. 2013, 85, 2558–2568. [Google Scholar] [CrossRef]
- Sharma, J.; Panico, M.; Barber, J.; Morris, H.R. Purification and determination of intact molecular mass by electrospray ionization mass spectrometry of the photosystem II reaction center subunits. J. Biol. Chem. 1997, 272, 33153–33157. [Google Scholar] [CrossRef]
- Hufnagel, P.; Schweiger, U.; Eckerskorn, C.; Oesterhelt, D. Electrospray ionization mass spectrometry of genetically and chemically modified bacteriorhodopsins. Anal. Biochem. 1996, 243, 46–54. [Google Scholar] [CrossRef]
- Le Coutre, J.; Whitelegge, J.P.; Gross, A.; Turk, E.; Wright, E.M.; Kaback, H.R.; Faull, K.F. Proteomics on full-length membrane proteins using mass spectrometry. Biochemistry 2000, 39, 4237–4242. [Google Scholar] [CrossRef]
- Whitelegge, J.P.; Gundersen, C.B.; Faull, K.F. Electrospray-ionization mass spectrometry of intact intrinsic membrane proteins. Protein Sci. 1998, 7, 1423–1430. [Google Scholar] [CrossRef]
- Le Coutre, J.; Lee, J.C.; Engel, C.K.; Privé, G.G.; Faull, K.F.; Kaback, H.R. Toward the bilayer proteome, electrospray ionization-mass spectrometry of large, intact transmembrane proteins. Proc. Natl. Acad. Sci. USA 1999, 96, 10695–10698. [Google Scholar] [CrossRef]
- Whitelegge, J.P.; Zhang, H.; Aguilera, R.; Taylor, R.M.; Cramer, W.A. Full subunit coverage liquid chromatography electrospray ionization mass spectrometry (LCMS+) of an oligomeric membrane protein: Cytochrome b(6)f complex from spinach and the cyanobacterium Mastigocladus laminosus. Mol. Cell. Proteomics 2002, 1, 816–827. [Google Scholar] [CrossRef]
- Berridge, G.; Chalk, R.; D’Avanzo, N.; Dong, L.; Doyle, D.; Kim, J.I.; Xia, X.; Burgess-Brown, N.; Deriso, A.; Carpenter, E.P. High-performance liquid chromatography separation and intact mass analysis of detergent-solubilized integral membrane proteins. Anal. Biochem. 2011, 410, 272–280. [Google Scholar] [CrossRef]
- DeltaMass. A database of protein post-translational modifications. Available online: http://www.abrf.org/index.cfm/dm.home (accessed on 15 September 2014).
- Edmonds, C.G.; Smith, R.D. [22] Electrospray ionization mass spectrometry. In Methods in Enzymology; James, A.M., Ed.; Academic Press: Amsterdam, The Netherlands, 1990; pp. 412–431. [Google Scholar]
- Gibson, B.W.; Cohen, P. [26] Liquid Secondary Ion Mass Spectrometry of Phosphorylated and Sulfated Peptides and Proteins. In Methods in Enzymology; James, A.M., Ed.; Academic Press: Amsterdam, The Netherlands, 1990; pp. 480–501. [Google Scholar]
- Holmes, C.F.; Tonks, N.K.; Major, H.; Cohen, P. Analysis of the in vivo phosphorylation state of protein phosphatase inhibitor-2 from rabbit skeletal muscle by fast-atom bombardment mass spectrometry. BBA-Mol. Cell Res. 1987, 929, 208–219. [Google Scholar]
- Keates, T.; Cooper, C.D.; Savitsky, P.; Allerston, C.K.; Phillips, C.; Hammarström, M.; Daga, N.; Berridge, G.; Mahajan, P.; Burgess-Brown, N.A.; et al. Expressing the human proteome for affinity proteomics: Optimising expression of soluble protein domains and in vivo biotinylation. New Biotechnol. 2012, 29, 515–525. [Google Scholar] [CrossRef]
- Kim, Y.; Quartey, P.; Li, H.; Volkart, L.; Hatzos, C.; Chang, C.; Nocek, B.; Cuff, M.; Osipiuk, J.; Tan, K.; et al. Large-scale evaluation of protein reductive methylation for improving protein crystallization. Nat. Methods 2008, 5, 853–854. [Google Scholar] [CrossRef]
- Chaikuad, A.; Froese, D.S.; Berridge, G.; von Delft, F.; Oppermann, U.; Yue, W.W. Conformational plasticity of glycogenin and its maltosaccharide substrate during glycogen biogenesis. Proc. Natl. Acad. Sci. USA 2011, 108, 21028–21033. [Google Scholar] [CrossRef]
- Loo, J.A.; Edmonds, C.G.; Smith, R.D. Tandem mass spectrometry of very large molecules: Serum albumin sequence information from multiply charged ions formed by electrospray ionization. Anal. Chem. 1991, 63, 2488–2499. [Google Scholar] [CrossRef]
- Twerenbold, D.; Gerber, D.; Gritti, D.; Gonin, Y.; Netuschill, A.; Rossel, F.; Schenker, D.; Vuilleumier, J.L. Single molecule detector for mass spectrometry with mass independent detection efficiency. Proteomics 2001, 1, 66–69. [Google Scholar] [CrossRef]
- Wu, C.C.; Yates, J.R. The application of mass spectrometry to membrane proteomics. Nat. Biotechnol. 2003, 21, 262–267. [Google Scholar] [CrossRef]
- Wilm, M.; Shevchenko, A.; Houthaeve, T.; Breit, S.; Schweigerer, L.; Fotsis, T.; Mann, M. Femtomole sequencing of proteins from polyacrylamide gels by nano-electrospray mass spectrometry. Nature 1996, 379, 466–469. [Google Scholar] [CrossRef]
© 2014 by the authors; licensee MDPI, Basel, Switzerland. This article is an open access article distributed under the terms and conditions of the Creative Commons Attribution license (http://creativecommons.org/licenses/by/4.0/).
Share and Cite
Chalk, R.; Berridge, G.; Shrestha, L.; Strain-Damerell, C.; Mahajan, P.; Yue, W.W.; Gileadi, O.; Burgess-Brown, N.A. High-Throughput Mass Spectrometry Applied to Structural Genomics. Chromatography 2014, 1, 159-175. https://doi.org/10.3390/chromatography1040159
Chalk R, Berridge G, Shrestha L, Strain-Damerell C, Mahajan P, Yue WW, Gileadi O, Burgess-Brown NA. High-Throughput Mass Spectrometry Applied to Structural Genomics. Chromatography. 2014; 1(4):159-175. https://doi.org/10.3390/chromatography1040159
Chicago/Turabian StyleChalk, Rod, Georgina Berridge, Leela Shrestha, Claire Strain-Damerell, Pravin Mahajan, Wyatt W. Yue, Opher Gileadi, and Nicola A. Burgess-Brown. 2014. "High-Throughput Mass Spectrometry Applied to Structural Genomics" Chromatography 1, no. 4: 159-175. https://doi.org/10.3390/chromatography1040159