Honey Evaluation Using Electronic Tongues: An Overview
by

Ana C. A. Veloso
1,2, 
Mara E. B. C. Sousa
3,
Leticia Estevinho
3,
Luís G. Dias
3 and
António M. Peres
3,4,* 1
Instituto Politécnico de Coimbra, ISEC, DEQB, Rua Pedro Nunes, Quinta da Nora, 3030-199 Coimbra, Portugal
2
CEB-Centre of Biological Engineering, University of Minho, Campus de Gualtar, 4710-057 Braga, Portugal
3
Centro de Investigação de Montanha (CIMO), ESA, Instituto Politécnico de Bragança, Campus de Santa Apolónia, 5300-253 Bragança, Portugal
4
Laboratory of Separation and Reaction Engineering—Laboratory of Catalysis and Materials (LSRE-LCM), ESA, Instituto Politécnico de Bragança, Campus Santa Apolónia, 5300-253 Bragança, Portugal
*
Author to whom correspondence should be addressed.
Chemosensors 2018, 6(3), 28; https://doi.org/10.3390/chemosensors6030028
Submission received: 14 June 2018
/
Revised: 10 July 2018
/
Accepted: 17 July 2018
/
Published: 19 July 2018
(This article belongs to the Special Issue Electronic nose’s, Machine Olfaction and Electronic Tongue’s)
Abstract
:Honey-rich composition in biologically active compounds makes honey a food products highly appreciated due to the nutritional and healthy properties. Food-manufacturing is very prone to different types of adulterations and fraudulent labelling making it urgent to establish accurate, fast and cost-effective analytical techniques for honey assessment. In addition to the classical techniques (e.g., physicochemical analysis, microscopy, chromatography, immunoassay, DNA metabarcoding, spectroscopy), electrochemical based-sensor devices have arisen as reliable and green techniques for food analysis including honey evaluation, allowing in-situ and on-line assessment, being a user-friendly procedure not requiring high technical expertise. In this work, the use of electronic tongues, also known as taste sensor devices, for honey authenticity and assessment is reviewed. Also, the versatility of electronic tongues to qualitative (e.g., botanical and/or geographical origin assessment as well as detection of adulteration) and quantitative (e.g., assessment of adulterants levels, determination of flavonoids levels or antibiotics and insecticides residues, flavonoids) honey analysis is shown. The review is mainly focused on the research outputs reported during the last decade aiming to demonstrate the potentialities of potentiometric and voltammetric multi-sensor devices, pointing out their main advantages and present and future challenges for becoming a practical quality analytical tool at industrial and commercial levels.
1. Introduction
Honey is a natural sweet substance consisting of floral extracts and bee secretions, derived from pollen and nectar and produced by several species of bees [1]. Both polyfloral and monofloral honeys can be found, although the latter is usually preferred by consumers due to their rarity, unique flavors and medicinal properties, being in some cases very expensive [2]. Indeed, several biological properties and therapeutic effects of honey consumption are known [3,4]. Thus, considering the physicochemical and medicinal known properties, their potential use by the pharmaceutical and cosmetic industries has significantly increased. Honey has been used to prevent, and treat patients with, oral mucositis resulting from radio/chemotherapy [5,6], to reduce esophagitis induced by chemoradiation therapy during the treatment of lung cancer [7], to treat skin ulcer [8,9] and to treat acute irritating cough [10]. Also, due to the recognized antibacterial activity of honey [11,12,13,14] its potential application in wound healing and tissue engineering has been studied [15,16], as for example for the treatment of burns and skin disorders [12,17]. Indeed, over the centuries, honey has been an essential ingredient in traditional medicines around the world [1]. On the other hand, the possibility of using honey as a natural sucrose-alternative sweetener in the food industry has been evaluated [18]. Thus, to fulfill the worldwide honey demand and considering the decline of the bee-keeping industry in many parts of the world [1], honey commercialization is prone to several fraudulent practices including adulteration or commercializing of mislabeled low quality honey as higher price honeys.
Several analytical techniques, some of them coupled with traditional melissopalynology analysis, together with chemometric tools have been developed and implemented for honey analysis, namely for:
- (i)
- (ii)
- (iii)
- (iv)
Researchers usually aim to develop highly sensitive and accurate techniques such as chromatographic methods (e.g., thin-layer chromatography; gas chromatography; high-performance liquid chromatography coupled to electrochemical detection, anion-exchange or tandem mass spectrometry; immunochromatography) and spectroscopy/spectrometry techniques (e.g., front phase fluorometric spectroscopy, near- or mid-infrared spectroscopy, nuclear magnetic resonance spectroscopy, Raman spectroscopy, quadrupole time-of-flight mass spectrometry, inductively coupled plasma atomic emission spectroscopy also referred as inductively coupled plasma optical emission spectrometry), as recently reviewed [30,64,65]. Other less common techniques have also been used for honey analysis, namely, DNA metabarcoding [2,65] or hyperspectral imaging analysis [60]. However, the majority of the analytical techniques reported for honey analysis (e.g., physicochemical characterization, biological and therapeutic activities evaluation) or, the detection of adulterations (e.g., dilution of high-value honey with water, the addition of high-sugar corn syrups or sugar-based adulterants, as well as the filtration of low-value honey to remove its source pollen and spiked with pollen from the ‘desired’ high-value honey), are usually time-consuming, destructive and expensive techniques, hardly applied in-situ and on-line, being far away from the economic possibilities and technical skills available at the majority of the small and medium bee-keeping industries.
The acknowledgement of this fact has recently attracted attention of the scientific research community, which are developing, building and testing fast, low-cost and user-friendly techniques such as electrochemical sensor devices for honey analysis, which require minimum sample pre-treatment steps and that may be miniaturized allowing their practical in-situ application. Thus, in the last decade electronic noses (E-noses) and electronic tongues (E-tongues) have been proposed for the classification of honeys according to botanical or geographical origins as well as to detect possible honey adulterations or the presence of atypical chemical compounds that have been intentionally incorporated in honey or derive from bee-keeping practices such as the use of non-legal antibiotics to treat different bees’ diseases. The fast progress in key fields, which include artificial intelligence, digital electronic sensors design, material sciences, microcircuit design, software innovations, and electronic systems integration, has stimulated the development of electronic sensor technologies applicable to many diverse areas of human activity [66]. E-tongues are electrochemical-based analytical devices comprising single or multi non-specific cross-sensitivity, non-specific and poorly selective sensor arrays coupled to chemometric tools, aiming the establishment of predictive multivariate statistical models that can relate the sensors signals to their analytical meaning [67,68,69,70]. Qualitative and quantitative multivariate models are developed based on the meaningful chemical fingerprint contained in the recorded electrochemical complex data profiles, which are identified after the removal of redundant data through the application of different variable selection statistical techniques (e.g., heuristic or meta-heuristic algorithms). Also, the E-tongue sensors allow the simultaneous determination of several species, with risks related to interferences, drifts and/or non-linearity, minimized or overcome by the use of advanced chemometric tools [71,72]. In some situations, the sensors with different measuring principles (e.g., potentiometry, voltammetry among others) have been applied, requiring the use of sensor data fusion techniques, taking advantage of their specific analytical characteristics, and thus, improving the dataset quality and permitting to develop more robust prediction or decision models [68].
The present work intends to summarize the work published during the last decade regarding the use of E-tongue devices for honey assessment. In fact, the versatility of E-tongues and their broad range of applicability for food analysis have been clearly described in the literature. A number of books, book chapters and review papers have been devoted to this important issue [73,74,75,76,77,78]. Also, their potential use for biomedical applications has been recently reviewed [79]. Thus, in this review a detailed survey and discussion is carried out focusing the problematic and challenge of applying E-tongues for honey evaluation; a food product highly appreciated by consumers due to the physicochemical, nutritional, biological and therapeutic known properties. First, a brief overview of the most common electrochemical techniques is made, aiming to introduce the less known reader to some theoretical basic knowledge concerning electrochemical principles, allowing a better understanding of the E-tongue potentialities as a practical tool within the food analysis field. Since the application of multi-sensor devices results in large datasets, the most used chemometric tools for extracting the valuable information contained in the electrochemical profiles recorded are briefly referred together with the usefulness of applying variable selection algorithms to avoid the use of redundant variables, minimizing the risk of overfitting and consequent overoptimistic estimation results and poor predictive performances. Also, model validation issues are addressed. Later, works reporting the use of E-tongues for honey analysis are introduced and discussed, identifying possible drawbacks and advantages, aiming to demonstrate the usefulness of these sensor-based approaches. Finally, future trends, perspectives and challenges are briefly discussed.
2. Electrochemical Sensor Devices for Honey Evaluation: Overview and Usual Chemometric Tools
In the literature, several research works reported the development and application of E-tongues based on different electrochemical techniques (e.g., potentiometry, voltammetry, impedance, etc.) as well as hybrid E-tongues, which are systems that merge different techniques by applying data fusion approaches with different abstraction levels (i.e., the way how data originated from several analytical techniques or different sources, can be merged, and form a consistent concatenated single data matrix). In which concerns honey analysis, both potentiometric and voltammetric E-tongues have been proposed and applied for both qualitative and quantitative analysis and will be the focus of the present review. At this point, it would be helpful to contextualize the E-tongue meaning. As pointed out by Kirsanov and co-workers [80], the nowadays widely used E-tongue terminology was introduced in the late 90’s as an alternative to the more limited “taste sensor” term. In a broader sense, E-tongues are systems composed of one or more arrays of chemical sensors, namely electrochemical, coupled with appropriate multivariate data processing techniques. The basic concepts and principles regarding the two most common electrochemical techniques associated (i.e., potentiometry and voltammetry) to the E-tongues have been recently addressed in detail [79,81].
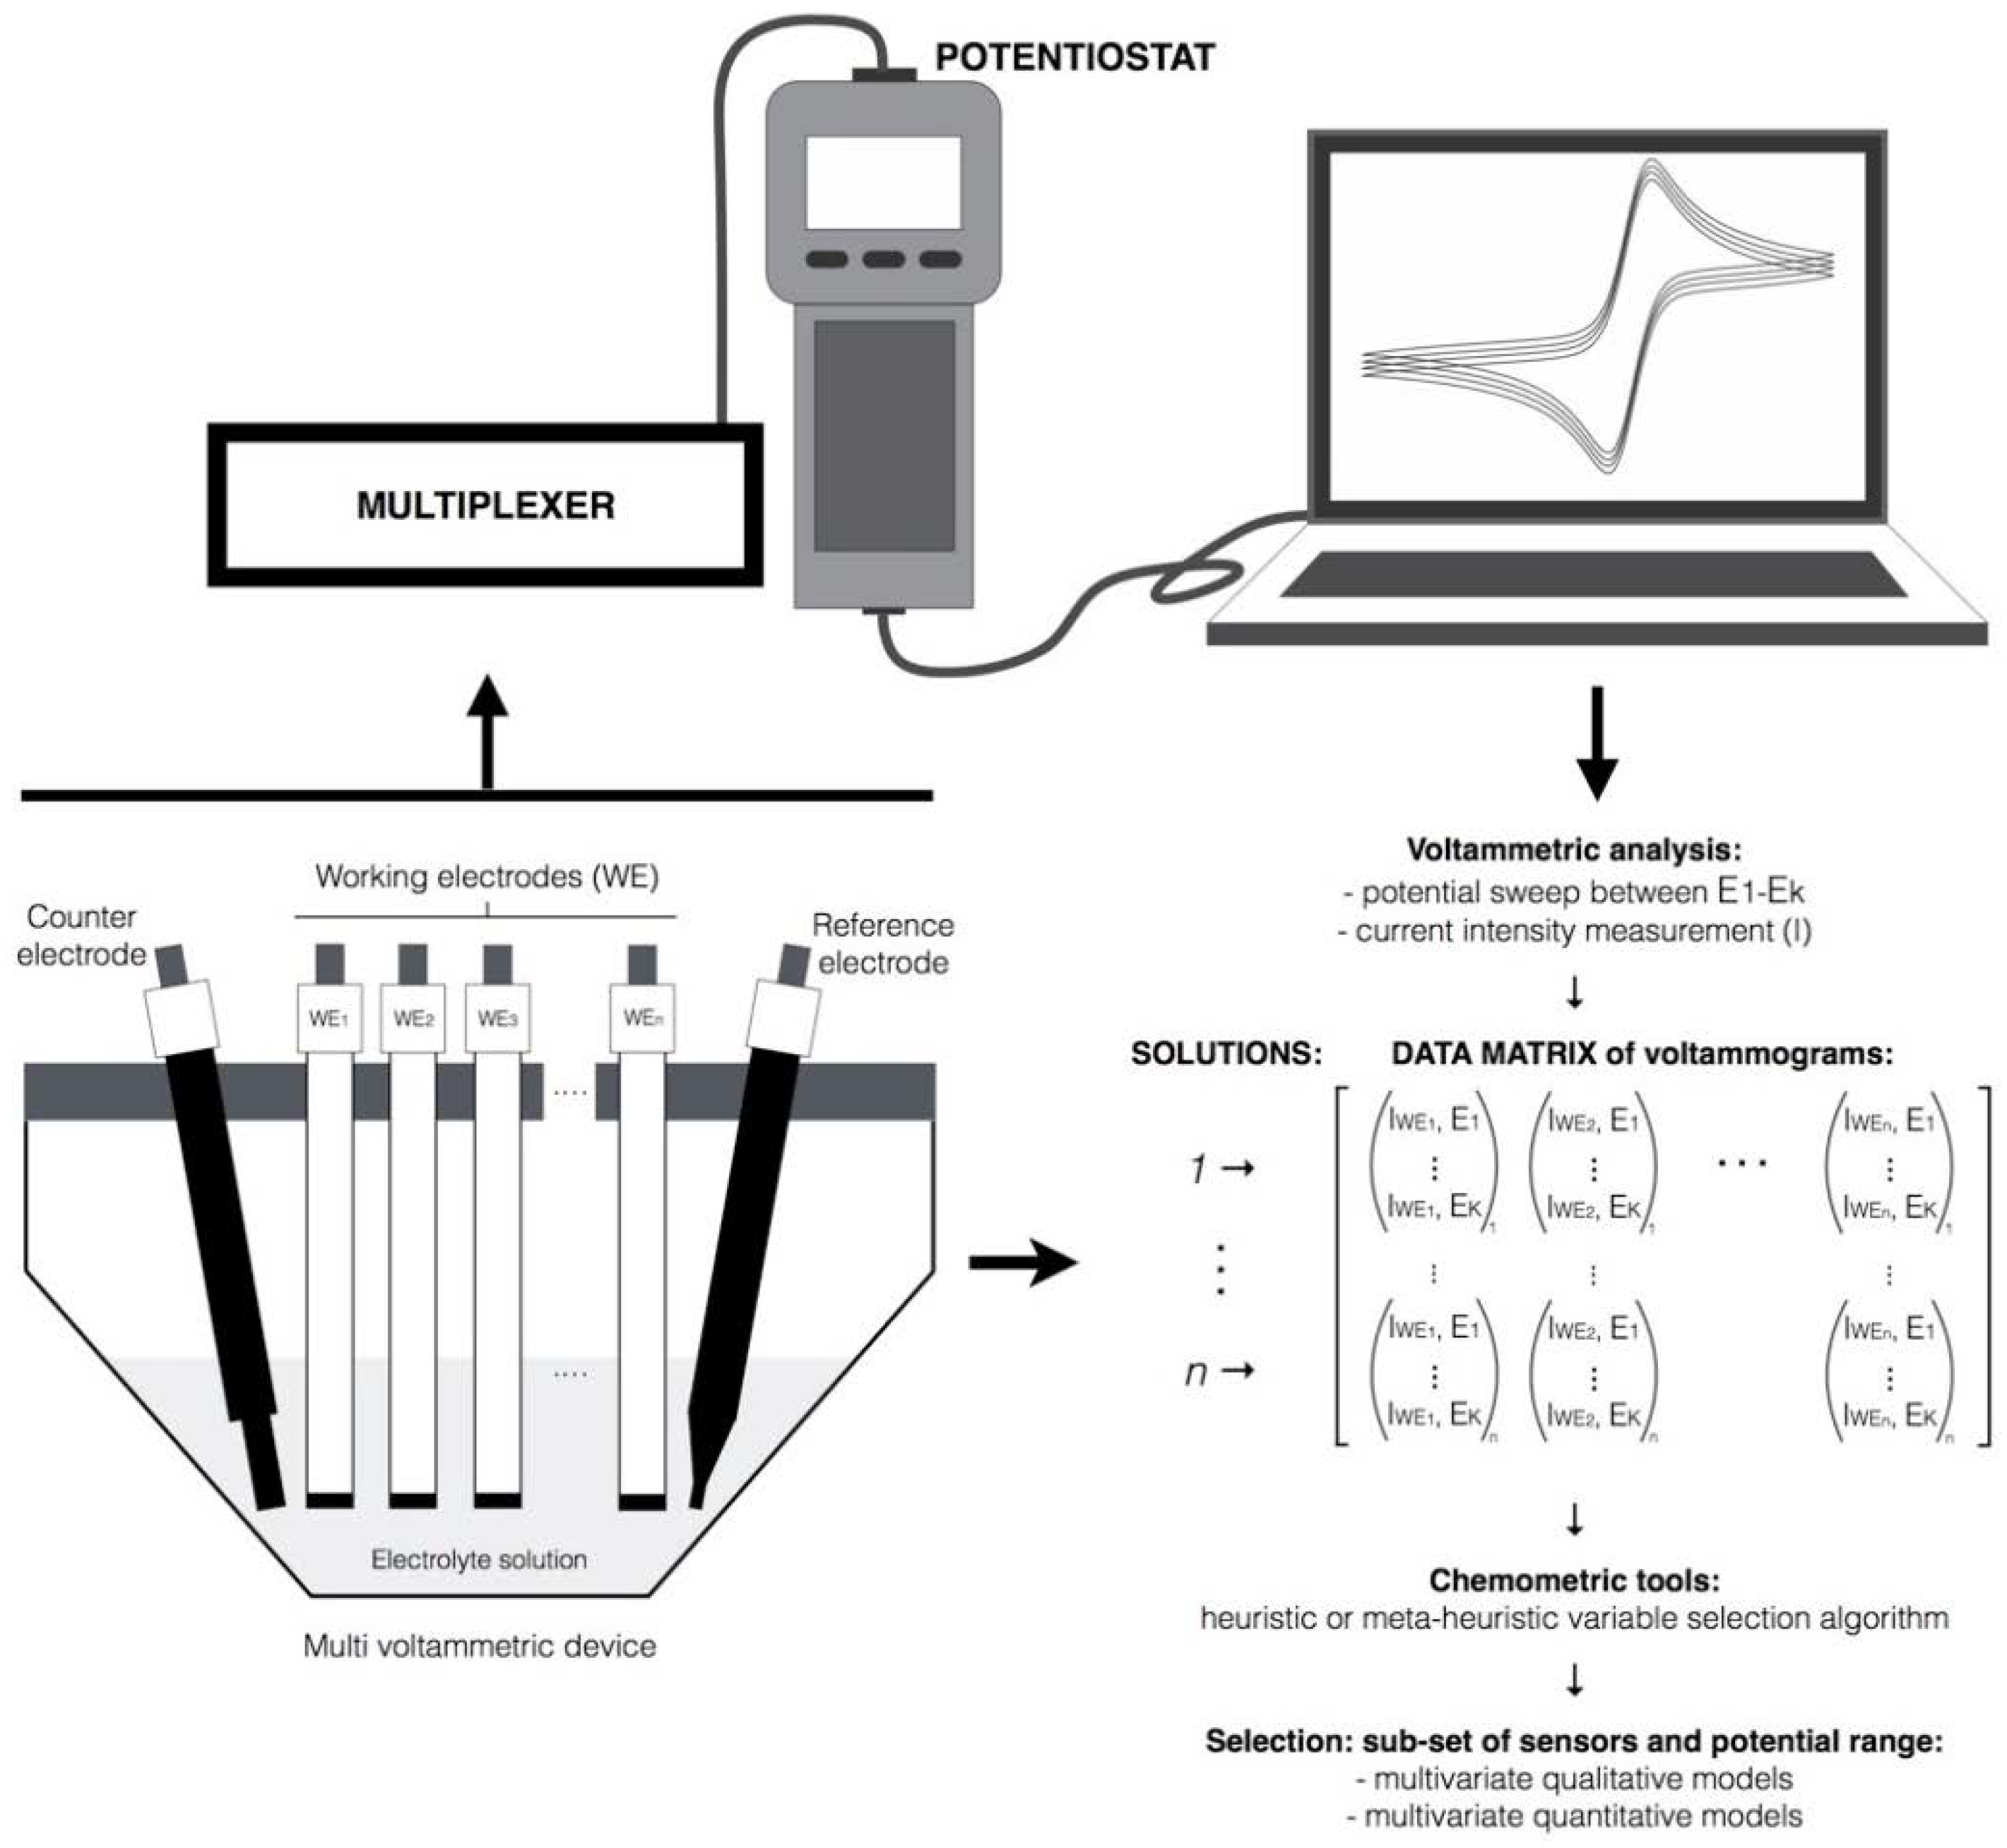
Similar to other analytical techniques that generate a huge amount of data per sample analysis (e.g., spectroscopy-based techniques), the full application of E-tongues-based strategies requires multivariate data analysis for pattern recognition, classification and quantification purposes. A potentiometric E-tongue comprising multi-sensors (i.e., N sensors) may generate for each sample (M samples) one potentiometric signal per sensor and sensor array (K arrays), resulting in a final matrix of (M × KN) data. In Figure 1 a scheme is represented aiming to illustrate, as an example, the complexity of the potentiometric data matrix that can be generated by using and E-tongue device with multi-sensors.
For voltammetric E-tongues, a vector with K voltammetric measures per working electrode may be obtained either for cyclic or square-wave voltammetry. Figure 2 aims to exemplify the possible complexity when using a multi-working electrodes (multi-WEs) voltammetric E-tongue and the need of using variable selection algorithms to extract the most valuable information of the data gathered by the electrochemical device.
For both approaches, taking into account the magnitude and the complexity of the data matrices generated, the use of feature extraction strategies is required. Among them, heuristic or meta-heuristic variable selection algorithms are usually applied, aiming to reduce the number of variables that will be included in the final regression/predictive qualitative or quantitative statistical models and therefore, noise effects or overcoming issues.
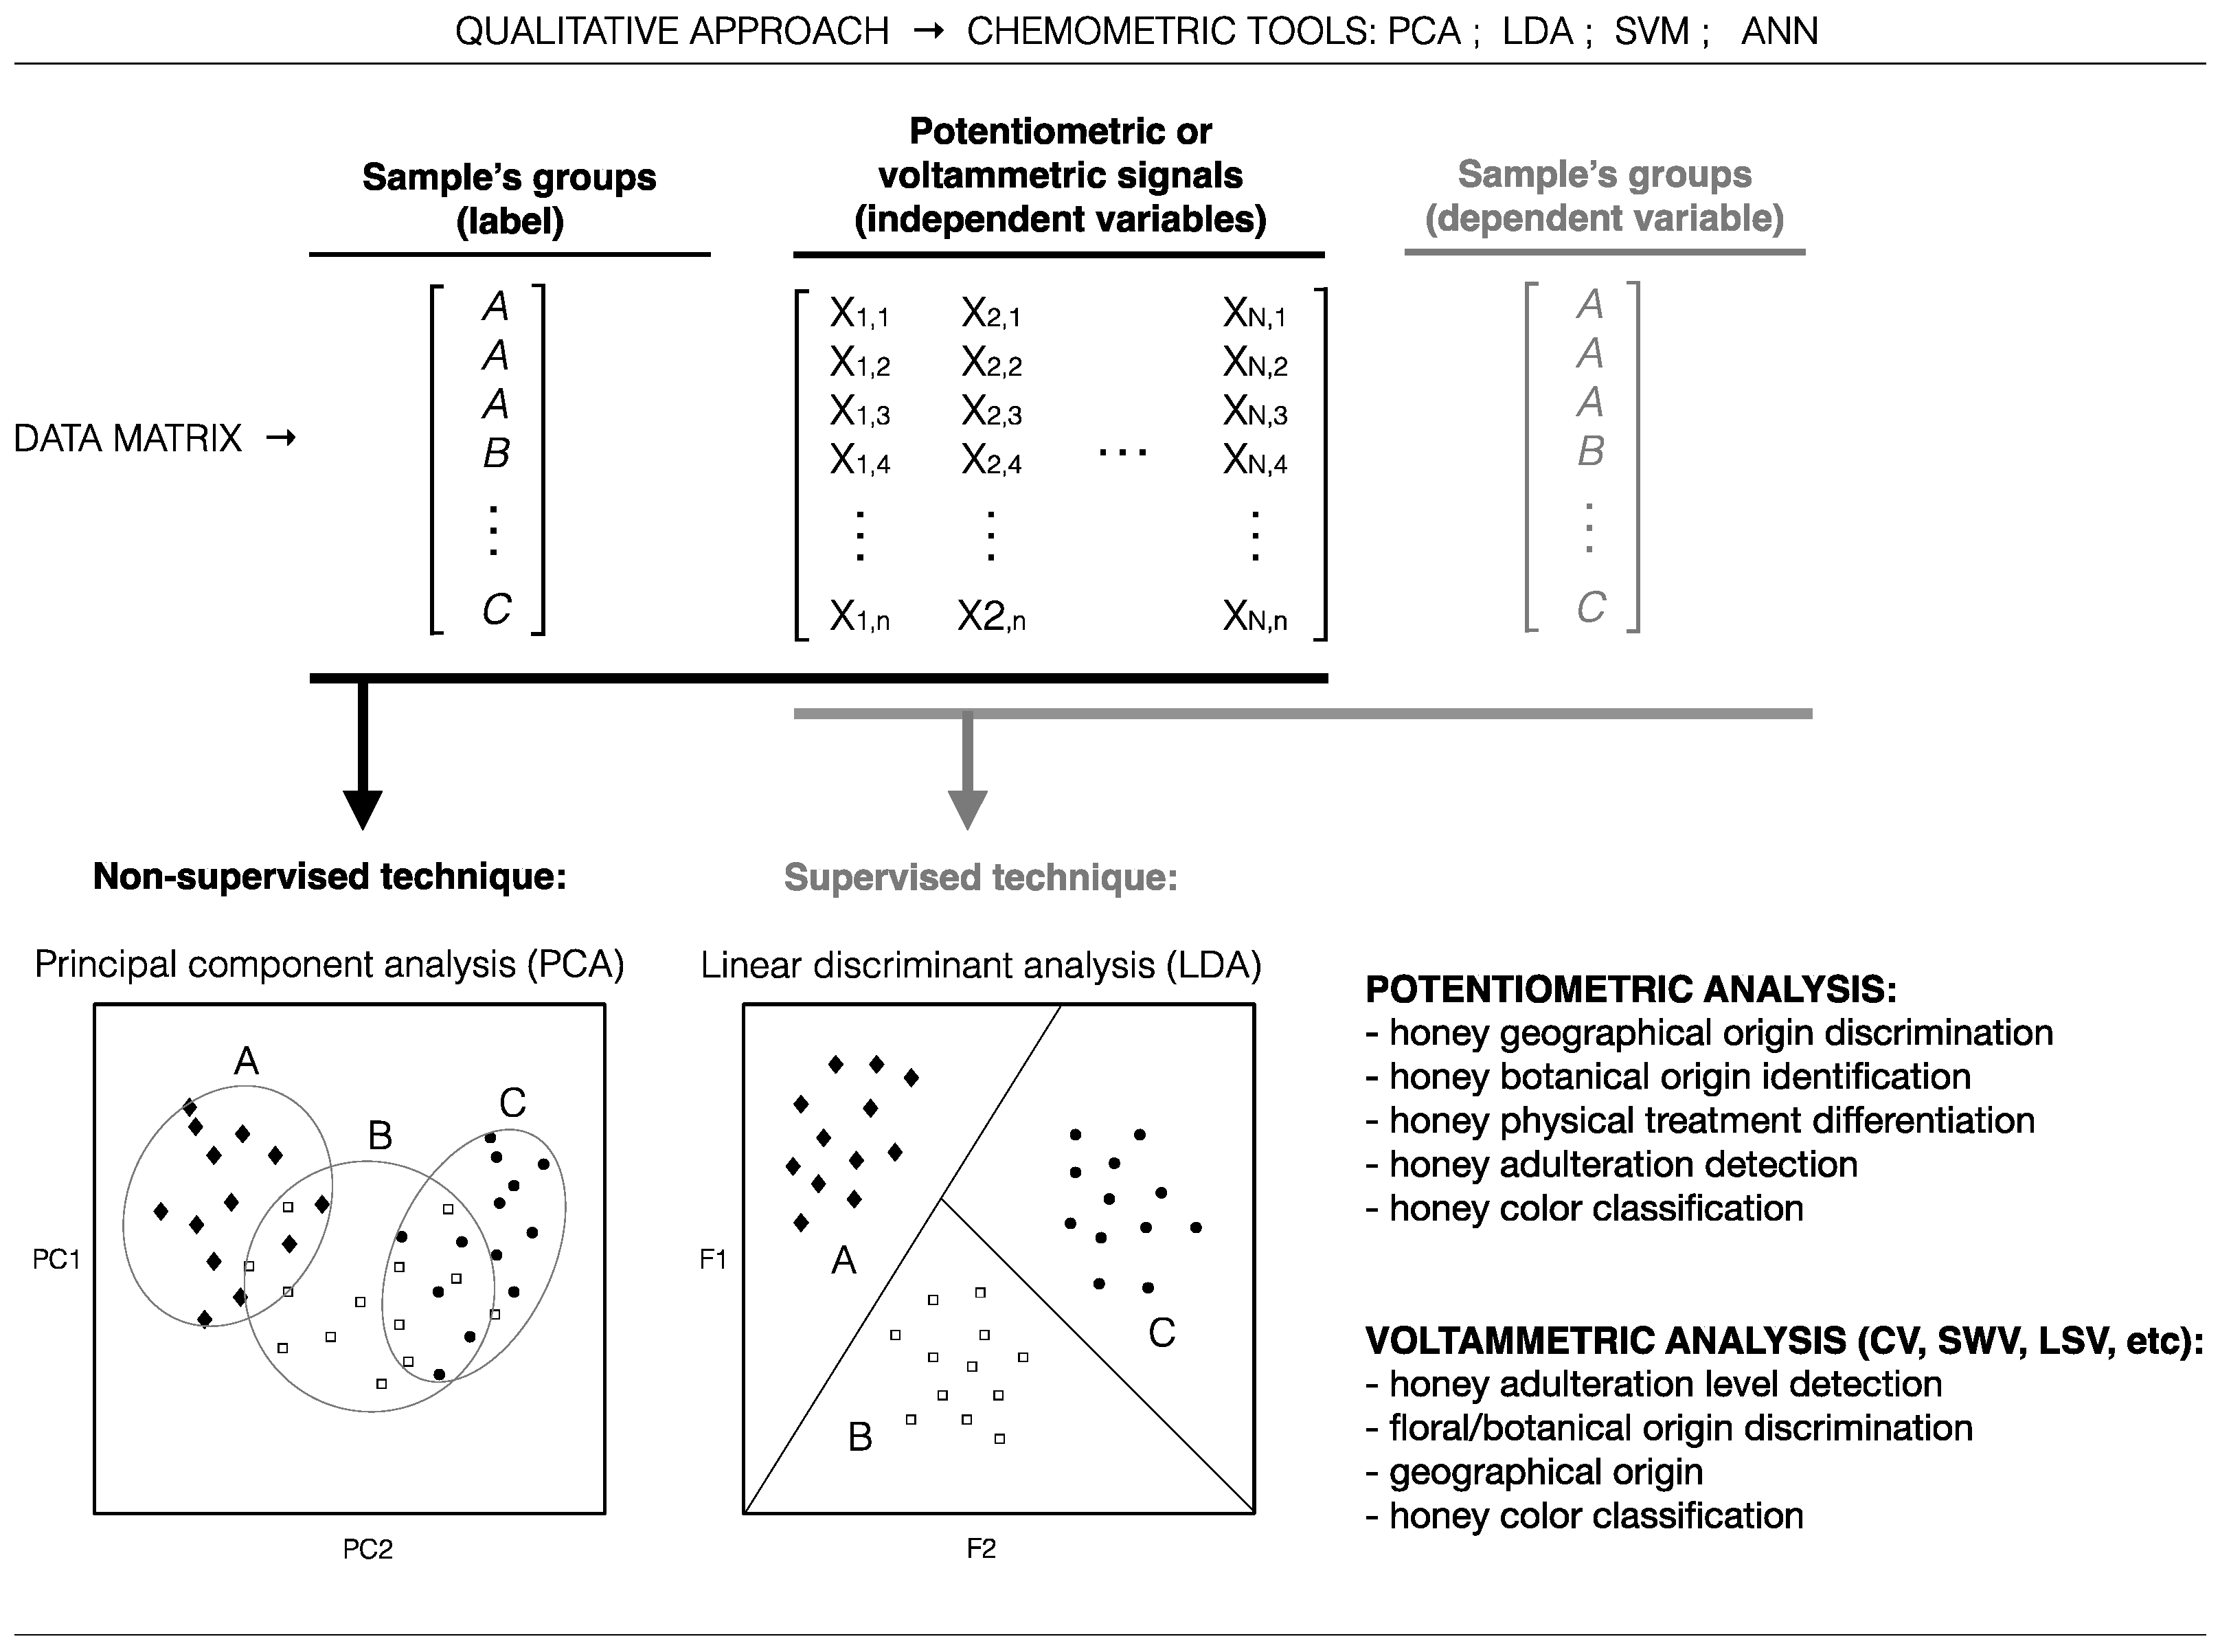
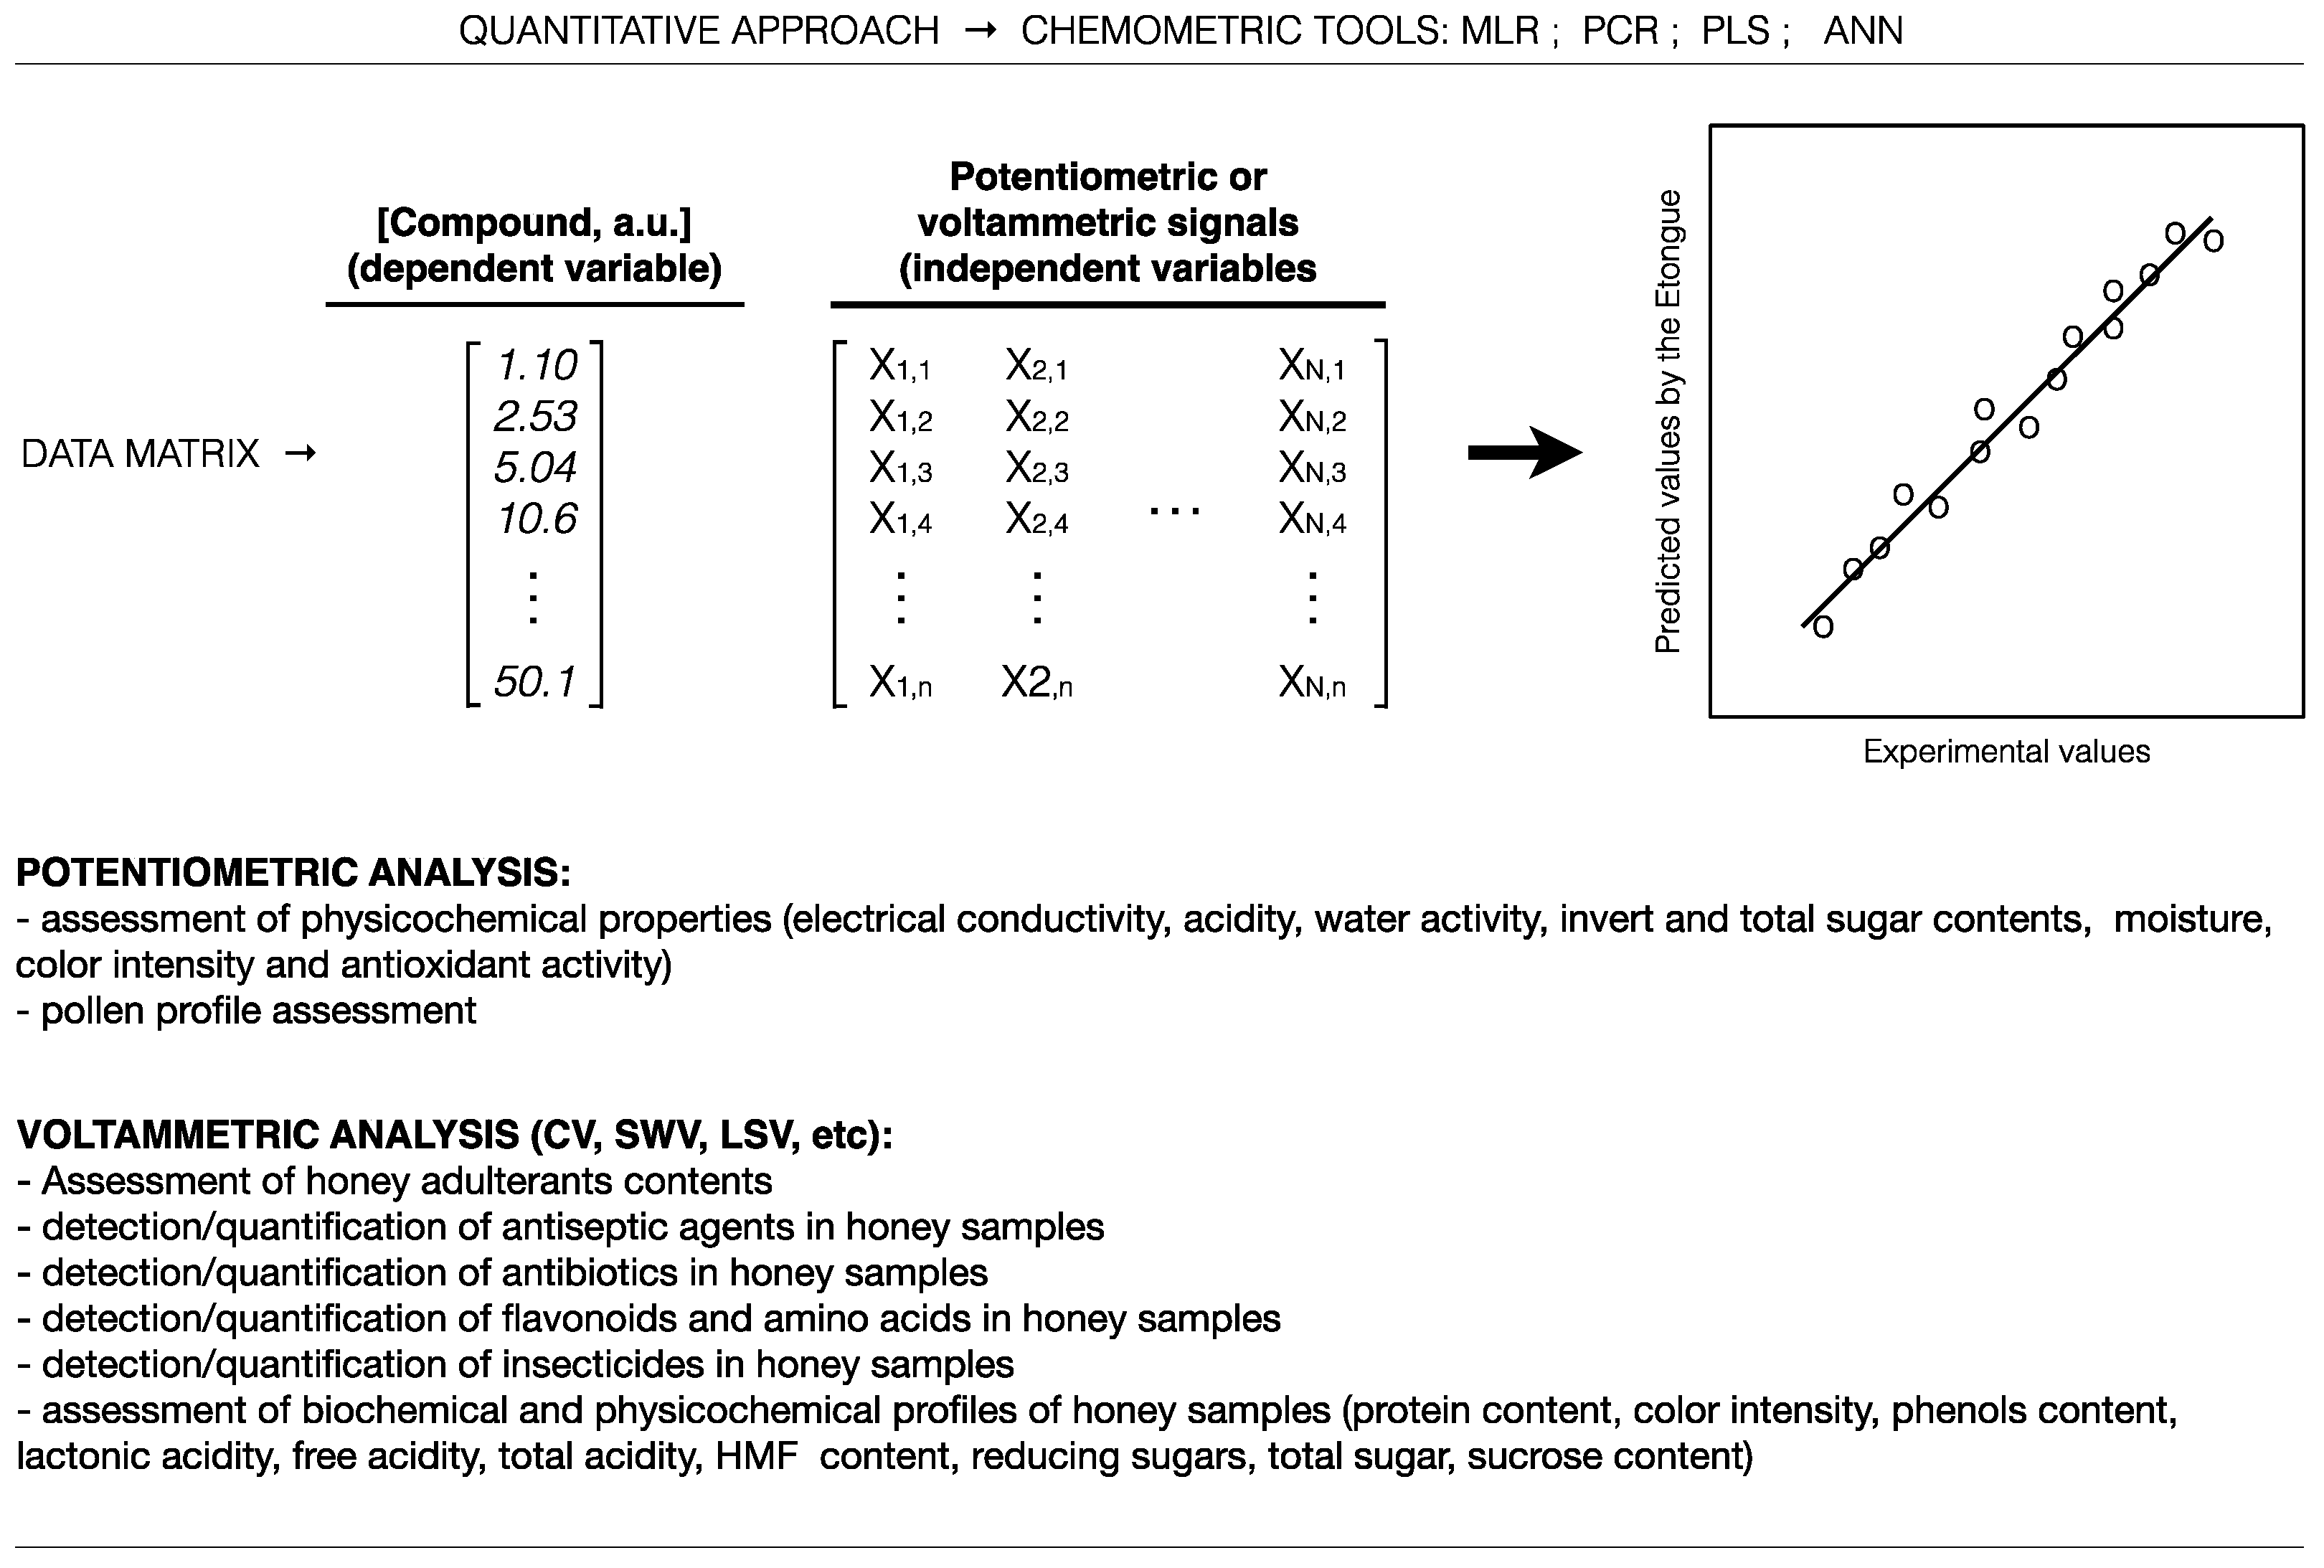
Thus, usually E-tongue systems are combined with linear and non-linear qualitative and quantitative chemometric techniques, which allow verifying the capability and versatility of these electrochemical devices. Among linear pattern recognition approaches, the most common are the Principal Component Analysis (PCA), the K-Nearest Neighbor (KNN) and Linear Discriminant Analysis (LDA). For quantitative assessment, Multiple Linear Regression (MLR), Principal Component Regression (PCR) and Partial Least-Squares (PLS) models are often used. On the other hand, concerning qualitative and/or quantitative non-linear strategies, Artificial Neural Networks (ANNs) are the most applied, which include Probabilistic Neural Networks (PNNs) with Radial Basis Functions (RBF) or Feed-Forward Networks with Backpropagation (BP) learning method, Fuzzy Adaptive Resonance Theory Multidimensional Maps (ARTMAP) Neural Networks or Support Vector Machines (SVMs) are quite applied [68].
For supervised statistical classification techniques as well as for multivariate regression models, feature extraction is a key stage, allowing selecting the best set of input variables that will enable to achieve correct a posteriori classification of the data in their a priori groups or the quantitative prediction of a parameter of interest. Feature extraction tools allow identifying the meaningful variables from a set of complex data, avoiding redundancies and overcoming collinearity issues, enabling the establishment of robust mathematical models with good generalization capabilities. Among these tools, heuristic (e.g., forward, backward and stepwise techniques) and meta-heuristic (e.g., genetic algorithms, simulated annealing, etc.) variable selection algorithms are commonly applied. Moreover, to verify the predictive performance of the multivariate statistical models, in general, cross-validation variants (e.g., leave-one-out, repeated K-folds, among others) are usually used. When the dataset size allows, data split techniques (e.g., random, Kennard–Stones algorithm, etc.) are also implemented allowing establishing independent training and testing data subsets, being the latter used to evaluate the real predictive performance of the multivariate qualitative and/or quantitative models established using the former dataset.
3. Electrochemical Sensor Devices for Honey Assessment
The broad range of applicability of E-tongue devices for food analysis has been recently reviewed by different authors [66,71,73,74,75,76,77,78,82,83,84,85,86]. At this point, a deeper overview is envisaged regarding the potential use of E-tongues for honey assessment, namely potentiometric and/or voltammetric based strategies.
3.1. Potentiometric Electronic Tongues
In the last decade several E-tongue potentiometric approaches have been described for honey evaluation, either based on E-tongue commercial devices (Table 1) or on home-made E-tongue multi-sensor arrays (Table 2).
The success of this emerging electronic sensor technology is mainly related to the ability of merging different key fields like artificial intelligence, digital electronic sensors design, material sciences and electronic systems integration [66], allowing to develop fast and cost-effective complementary analytical devices which on-line and in-situ applications may be foreseen. Nevertheless, it should be remarked that few E-tongue devices are being commercialized, being in general different home-made solutions developed by each research team. The low number of commercial E-tongues may be partially attributed to the significant time effort and resources spent during calibration and recalibration of a new system as well as to the difficulty in establishing generalized models valid over various systems [102]. Indeed, commercial and home-made devices incorporate different chemical sensors, such as pure metals and metallic compounds, ion-selective sensors, cross-selective liquid sensors or lipid membranes.
The potentiometric E-tongues, coupled with different chemometric tools (e.g., PCA, LDA, ANN, etc.), have been mainly applied for qualitative honey analysis, namely as practical and successful tools for honey classification according to color, botanical or geographical origins, as well as, for honey adulteration identification [87,88,89,90,92,93,94,95,96,97,98,99,101]. Although in a few cases, some works also reported the satisfactory quantitative performance of potentiometric E-tongue devices (using, MLR, PLS and ANN models) for the determination of honey physicochemical levels or honey pollen profile assessment [92,97,100,101], confirming the broad versatility and potential of potentiometric E-tongues for honey evaluation. Some of these studies, also pointed out the advantages of using variable selection algorithms with multi-sensor potentiometric E-tongues, which allow minimizing noise effects arising from the use redundant sensor signal data [90,92,98,99,100].
3.2. Voltammetric Electronic Tongues
Similarly to the potentiometric E-tongues several voltammetric devices have been successfully applied for qualitative and quantitative honey analysis, using self-assembled or lab-made (with modified WEs with biofilms or nanoparticles) devices. These works usually reported the use of conventional three-electrode systems (one single WE coupled with one reference electrode (RE) and one counter electrode (CE)) or multi-WE devices (combined with one RE and one CE). In general, the WE include noble metals (e.g., platinum, gold, palladium), non-noble metals (e.g., copper, glassy carbon, nickel) and/or reactive noble metal (e.g., silver). Also, the RE is either a Ag/AgCl electrode (saturated with KCl or NaCl) or a saturated calomel electrode (SCE). The CE, is usually a platinum wire or electrode. From a qualitative (i.e., classification/discrimination) point of view, the majority of the literature works addressed the possibility of classifying honey samples according to the botanical or geographical origins as well as to identify honey adulterations or the adulteration level [81,91,103,104,105,106,107,108,109,110,111,112,113]. A substantial number of works reported the satisfactory quantitative performance of voltammetric E-tongues used to predict chemical and biochemical honey composition as well as the levels of adulterants and/or contaminants [91,104,106,113,114,115,116,117,118,119,120,121,122,123,124,125]. As can be easily inferred from Table 3 (commercial devices) and Table 4 and Table 5 (self-assembled lab-made conventional or multi-sensors devices), the use of voltammetric E-tongues for honey analysis is a more recent practice (from 2011) compared to the potentiometric approaches (from 2008) being largely used together with different multivariate statistical techniques (e.g., multiple linear regression models (MLRM), PLS, ANN, among others) as successful quantitative analytical tools. Only one work reported the use of a commercial conventional three-component device [114]. In contrast all the other studies, reported, as previously stated, the development and/or use of lab-made devices comprising a single WE [81,105,106,107,108,109,110,111,115,116,117,118,119,120,121,122,123,124,125] or more WEs [91,103,104,112,113], some of them modified incorporated porous films or nanoparticles [99,100,101,115,117,118,119,120,121,122,123,124,125]. Within these applications, different voltammetric techniques have been applied namely cyclic voltammetry (CV, the most common), square-wave voltammetry (SWV) and square-wave cathodic stripping voltammetry (SWCSV), differential pulse voltammetry (DPV) and multifrequency large amplitude pulse voltammetry (MLAPV) as well as linear sweep voltammetry (LSV). Overall, all the above-mentioned works demonstrate the versatility and feasibility of applying voltammetric E-tongues as alternative/complementary analytical tool for honey analysis, allowing in some cases in-situ assays due to the potential portable nature of these electronic device [105].
4. Advantages, Limitations and Drawbacks of the Two Most Common Electronic Tongues Variants
As pointed out (Table 1, Table 2, Table 3, Table 4 and Table 5), E-tongues have suffered an increasing application in honey screening analysis, which broad number of qualitative and quantitative applications, reported in the literature, are summarized in Figure 3 and Figure 4, respectively.
These electrochemical devices have emerged as an innovative sensing technology, supported by the development of different scientific areas such as artificial intelligence, digital electronic sensors design, material sciences, microcircuit design, software innovations, and electronic systems integration. Also, the increase interest relies on several known advantages of electrochemical devices over other conventional analytical methods. Besides being fast, flexible, cost-effective, sensitive, accurate and user-friendly techniques, the use of E-tongues does not require specialized staff neither complex sample pre-treatments. In fact, some potentiometric multi-sensor arrays may be directly immersed into the honey sample, allowing a direct measurement and, in other cases (depending on the sample’s viscosity); it is only necessary to previously dissolve a known mass of honey into a pre-defined volume of distilled water, leading to the change of the membrane potentials in response to the different sample chemical compositions [94,95,99,100]. In some cases, prior to the potentiometric analysis the E-tongue sensors may need to be conditioned and calibrated using, in general, an aqueous acid solution [94]. Regarding the voltammetric devices, the honey analysis requires its previous dissolution using an electrolyte solution (e.g., KCl or phosphate buffer saline solution, PBS) [120,124] or in some specific cases, extraction/centrifugation steps [119]. As pointed out by several researchers, both methodologies would require some special washing procedures, between the measurements or after a set of assays, in order to remove all sample leftovers from the sensors surface membranes, ensuring stable and repeatable signal profiles [103,113], although the voltammetric devices may also require the electrodes surfaces to be polished. Depending on the type of sample, sensor membranes may be negatively or positively charged and so, an acid or basic washing solutions are usually used, respectively, although in some cases only a washing step with ultrapure water is reported. Voltammetric analysis may further require a deoxygenation step by purging the sample solution with an inert gas like nitrogen, turning out into a more complex sample pretreatment compared to the potentiometric analysis [123]. In general, as reported in the literature, both E-tongues show long-term electrochemical response stability and repeatability over time and after storage, being potentiometric devices be more prune to signal drift issues, which may be minimized or overcome by the washing procedures or by the subsequent use of statistical treatments for signal drifts corrections [126,127,128,129,130,131]. Moreover, the majority of the assays can be carried out at room temperature. Furthermore, the E-tongue profiles together with chemometric tools allow assessing honey physicochemical and biochemical parameters using the electrochemical fingerprints recorded in a single experimental run, which avoids the need of applying several different analytical techniques. Additionally, E-tongues may be easily miniaturized, handled and cleaned, have low power consumption as well as an intrinsic portable characteristic enabling in-situ and continuous analysis, even in harsh industrial environments.
Nevertheless, several authors still have concerns regarding the lack of specific odor and taste sensors or the difficulty validating the multivariate models established due to the lack of establishing large databases [74]. To address these concerns, new sensors with improved selectivity, including nanosensors and biosensors, have been the focus of several research groups. Also, efforts are being carried out aiming to establish international databases that would allow assembling a large number of well characterized samples to carry out an appropriate training and validation [74]. The occurrence of signal drifts and/or noise effects when the electrochemical analysis is carried out during a long period of time is also a problem that has precluded a broad adoption of E-tongues as routine analytical tools [126]. Indeed, E-tongue’s calibration lifetime is typically limited due to the changes of sensor materials related to several physical and chemical phenomena like adsorption of sample components, temperature deviations, surface chemical reactions, among others [126]. Also, it is known that even if two electrochemical devices are sensitive towards the same family of chemical compounds, the different devices can hardly operate in the framework of a single unified calibration model, which would enable interpreting simultaneously the responses of both systems [102]. Several strategies have been recently developed aiming to overcome these drawbacks. Recently, it has been experimentally verified the feasibility of calibration transfer between voltammetric and potentiometric multi-sensor arrays, which showed the possibility of transforming potentiometric data into voltammetric format, and vice versa, allowing modeling a system response using multivariate regression models built with data from another type of multi-sensor system [102]. Mathematical sensor drift correction procedures have been successfully used to overcome problems related to sensor readings’ drift that can invalidate corresponding multivariate calibrations [126,127,128,129,130,131]. These mathematical procedures minimize the need of E-tongue frequent recalibrations and thus allow maximizing the related investment of time and experimental effort, being of utmost importance for unique and expensive samples. In fact, these works pointed out that it is possible to extend the calibration lifetime in multi-sensor analysis of real complex samples by mathematical drift correction, instead of trying to take into account these issues within the framework of each regression model. Furthermore, as pointed out by Panchuk and co-workers [126], the particular standardization method should be used taking into account the sensor array structure and the analytical task. If a strong correlation in sensor responses towards target parameter is expected, the use of multivariate standardization methods is recommended. If the sensors comprised in the E-tongue show dissimilar signal profiles, univariate single sensor standardization could be the right choice.
The previous discussion clearly points out the difficulty in choosing one E-tongue approach over the other, for honey analysis. Indeed, both potentiometric and voltammetric devices show emerging advantages, posing some limitations and disadvantages. Still, it could be concluded that potentiometric E-tongues may deliver a broader chemical fingerprint of a specific honey sample, since they may detect the presence of any chemical compound that may impose a potential shift of the sensors’ membranes due to, for example, electrostatic or hydrophobic interactions [132], not being limited to the analysis of redox chemical compounds. Also, in general, potentiometric devices require less complex sample pre-treatments compared to the voltammetric ones. On the contrary, potentiometric sensor arrays are mainly used for qualitative evaluations, allowing the richness information of the voltammograms a deeper analysis including both qualitative and quantitative perspectives. Moreover, signal drifts are usually more relevant in potentiometric analysis requiring subsequent complex statistical analysis. Thus, the although the capabilities and advantages of E-tongues for honey analysis is evident and straightforward for the majority of the researchers within the electrochemistry field, it is not an easy task to prioritize the best strategy, which will mostly depend on the researcher familiarity with this subject as well as of the equipment availability.
Finally, the overall analytical (qualitative and quantitative) satisfactory performance of E-tongue systems together with the possibility of overcoming issues such as signal’s drifts, may envisage a broader routine application in day-to-day laboratory and industrial practices.
5. Conclusions
In conclusion, this review examined and demonstrated the theoretical and practical feasibility and versatility of both potentiometric and voltammetric E-tongues for botanical and geographical origin identification and contaminant detection as well as pollen profile assessment and chemical composition determination. The vast number of research works available in the literature clearly pointed out that these devices are very promising tools for honey analysis, profiting of their portability, miniaturization and possible compatible with smartphone technology, in-situ and on-line operation as well as of the user-friendly and green potentialities. Furthermore, these devices may be very effective tools especially in combination with appropriate chemometric techniques, with the use of improved feature extraction techniques for electronic sensor response analysis, which is a key issue.
Nevertheless, more research is required to develop and take full advantage of E-tongue instruments, bringing them to the full potential of capabilities for industrial applications, overcoming typical concerns of the real world; namely, contributing to shortening the distance between the optimism of the researchers and the skepticism of the industry and retailers. At present, the main challenge relies in reaching the market, which is obvious considering the scarcity of commercially available E-tongue devices. Indeed, the key challenge would be to build E-tongues with repeatable electrical or electrochemical properties, negligible ageing and temperature effects, as well as the irreversible binding of substances on the materials used as sensing units in some applications., requiring sensor units’ replacement and thus, leading to time-consuming re-calibration steps. These drawbacks have prevented the wide use of E-tongues in the market. So, in the future, strategies must comprise the design of arrays formed by new sensing (nano)materials with improved selectivity and sensitivity.
Author Contributions
Conceptualization, A.M.P. and A.C.A.V.; Visualization, M.E.B.C.S. and L.G.D.; Supervision, A.M.P. and L.G.D.; Funding Acquisition, A.C.A.V., L.E., L.G.D. and A.M.P.
Funding
This work was financially supported by Project POCI-01-0145-FEDER-006984-Associate Laboratory LSRE-LCM, Project UID/BIO/04469/2013-CEB and strategic project PEst-OE/AGR/UI0690/2014-CIMO all funded by FEDER-Fundo Europeu de Desenvolvimento Regional through COMPETE2020-Programa Operacional Competitividade e Internacionalização (POCI)—and by national funds through FCT-Fundação para a Ciência e a Tecnologia, Portugal.
Conflicts of Interest
The authors declare no conflict of interest.
References
- Anthony, C.R.M.; Balasuriya, D.N. Electronic honey quality analyser. Eng. J. Inst. Eng. Sri Lanka 2016, 49, 41–47. [Google Scholar] [CrossRef]
- Prosser, S.W.J.; Hebert, P.D.N. Rapid identification of the botanical and entomological sources of honey using DNA metabarcoding. Food Chem. 2017, 214, 183–191. [Google Scholar] [CrossRef] [PubMed]
- Rao, P.V.; Krishnan, K.T.; Salleh, N.; Gan, S.H. Biological and therapeutic effects of honey produced by honey bees and stingless bees: A comparative review. Rev. Bras. Farmacogn. 2016, 26, 657–664. [Google Scholar] [CrossRef]
- Oryan, A.; Alemzadeh, E.; Moshiri, A. Biological properties and therapeutic activities of honey in wound healing: A narrative review and meta-analysis. J. Tissue Viability 2016, 25, 98–118. [Google Scholar] [CrossRef] [PubMed]
- Bulut, H.K.; Tüfekci, F.G. Honey prevents oral mocositis in children undergoing chemotherapy: A quasi-experimental study with a control group. Complement. Ther. Med. 2016, 29, 132–140. [Google Scholar] [CrossRef] [PubMed]
- Xu, J.-L.; Xia, R.; Sun, Z.-H.; Sun, L.; Min, X.; Liu, C.; Zhang, H.; Zhu, Y.-M. Effects of honey use on the management of radio/chemotherapy-induced mucositis: A meta-analysis of randomized controlled trials. Int. J. Oral Maxillofac. Surg. 2016, 45, 1618–1625. [Google Scholar] [CrossRef] [PubMed]
- Fogh, S.E.; Deshmukh, S.; Berk, L.B.; Dueck, A.C.; Roof, K.; Yacoub, S.; Gergel, T.; Stephans, K.; Rimner, A.; DeNittis, A.; et al. A Randomized Phase 2 Trial of Prophylactic Manuka Honey for the Reduction of Chemoradiation Therapy–Induced Esophagitis During the Treatment of Lung Cancer: Results of NRG Oncology RTOG 1012. Int. J. Radiat. Oncol. Biol. Phys. 2017, 97, 786–796. [Google Scholar] [CrossRef] [PubMed] [Green Version]
- Kateel, R.; Adhikari, P.; Augustine, A.J.; Ullal, S. Topical honey for the treatment of diabetic foot ulcer: A systematic review. Complement. Ther. Clin. Pract. 2016, 24, 130–133. [Google Scholar] [CrossRef] [PubMed]
- Tenci, M.; Rossi, S.; Bonferoni, M.C.; Sandri, G.; Boselli, C.; Di Lorenzo, A.; Daglia, M.; Cornaglia, A.I.; Gioglio, L.; Perotti, C.; et al. Particulate systems based on pectin/chitosan association for the delivery of manuka honey components and platelet lysate in chronic skin ulcers. Int. J. Pharm. 2016, 509, 59–70. [Google Scholar] [CrossRef] [PubMed]
- Peixoto, D.M.; Rizzo, J.A.; Schor, D.; Silva, A.R.; de Oliveira, D.C.; Solé, D.; Sarinho, E. Use of honey associated with Ananas comosus (Bromelin) in the treatment of acute irritative cough. Rev. Paul Pediatr. 2016, 34, 412–417. [Google Scholar] [CrossRef] [PubMed]
- Almasaudi, S.B.; Al-Nahari, A.A.M.; El-Ghany, E.S.M.A.; Barbour, E.; Al Muhayawi, S.M.; Al-Jaouni, S.; Azhar, E.; Qari, M.; Qari, Y.A.; Harakeh, S. Antimicrobial effect of different types of honey on Staphylococcus Aureus. Saudi J. Biol. Sci. 2017, 24, 1255–1261. [Google Scholar] [CrossRef] [PubMed]
- McLoone, P.; Warnock, M.; Fyfe, L. Honey: A realistic antimicrobial for disorders of the skin. J. Microbiol. Immunol. Infect. 2016, 49, 161–167. [Google Scholar] [CrossRef] [PubMed]
- Osés, S.M.; Pascual-Maté, A.; de la Fuente, D.; de Pablo, A.; Fernández-Muiño, M.A.; Sancho, M.T. Comparison of methods to determine antibacterial activity of honeys against Staphylococcus aureus. NJAS-Wagen. J. Life Sci. 2016, 78, 29–33. [Google Scholar] [CrossRef]
- Bueno-Costa, F.M.; Zambiazi, R.C.; Bohmer, B.W.; Chaves, F.C.; da Silva, W.P.; Zanusso, J.T.; Dutra, I. Antibacterial and antioxidant activity of honeys from the state of Rio Grande do Sul, Brazil. LWT Food Sci. Technol. 2016, 65, 333–340. [Google Scholar] [CrossRef]
- Alvarez-Suarez, J.M.; Giampieri, F.; Cordero, M.; Gasparrini, M.; Forbes-Hernández, T.Y.; Mazzoni, L.; Afrin, S.; Beltrán-Ayala, P.; González-Paramás, A.M.; Santos-Buelga, C.; et al. Activation of AMPK/Nrf2 signalling by Manuka honey protects human dermal fibroblasts against oxidative damage by improving antioxidant response and mitochondrial function promoting wound healing. J. Funct. Foods 2016, 25, 38–49. [Google Scholar] [CrossRef]
- Sarhan, W.A.; Azzazy, H.M.E.; El-Sherbiny, I.M. The effect of increasing honey concentration on the properties of the honey/polyvinyl alcohol/chitosan nanofibers. Mater. Sci. Eng. C 2016, 67, 276–284. [Google Scholar] [CrossRef] [PubMed]
- Aziz, Z.; Hassan, B.A.R. The effects of honey compared to silver sulfadiazine for the treatment of burns: A systematic review of randomized controlled trials. Burns 2017, 43, 50–57. [Google Scholar] [CrossRef] [PubMed]
- Moriano, M.E.; Alamprese, C. Honey, trehalose and erythritol as sucrose-alternative sweeteners for artisanal ice cream. A pilot study. LWT Food Sci. Technol. 2017, 75, 329–334. [Google Scholar] [CrossRef] [Green Version]
- Belay, A.; Haki, G.D.; Birringer, M.; Borck, H.; Addi, A.; Baye, K.; Melaku, S. Rheology and botanical origin of Ethiopian monofloral honey. LWT Food Sci. Technol. 2017, 75, 393–401. [Google Scholar] [CrossRef]
- Castro-Vázquez, L.; Díaz-Maroto, M.C.; de Torres, C.; Pérez-Coello, M.S. Effect of geographical origin on the chemical and sensory characteristics of chestnut honeys. Food Res. Int. 2010, 43, 2335–2340. [Google Scholar] [CrossRef]
- Corvucci, F.; Nobili, L.; Melucci, D.; Grillenzoni, F.-V. The discrimination of honey origin using melissopalynology and Raman spectroscopy techniques coupled with multivariate analysis. Food Chem. 2015, 169, 297–304. [Google Scholar] [CrossRef] [PubMed]
- Escriche, I.; Kadar, M.; Juan-Borrás, M.; Domenech, E. Suitability of antioxidant capacity, flavonoids and phenolic acids for floral authentication of honey. Impact of industrial thermal treatment. Food Chem. 2014, 142, 135–143. [Google Scholar] [CrossRef] [PubMed]
- Fechner, D.C.; Moresi, A.L.; Díaz, J.D.R.; Pellerano, R.G.; Vazquez, F.A. Multivariate classification of honeys from Corrientes (Argentina) according to geographical origin based on physicochemical properties. Food Biosci. 2016, 15, 49–54. [Google Scholar] [CrossRef]
- Guelpa, A.; Marini, F.; du Plessis, A.; Slabbert, R.; Manley, M. Verification of authenticity and fraud detection in South African honey using NIR spectroscopy. Food Control 2017, 73, 1388–1396. [Google Scholar] [CrossRef]
- Karabagias, I.K.; Louppis, A.P.; Karabournioti, S.; Kontakos, S.; Papastephanou, C.; Kontominas, M.G. Characterization and geographical discrimination of commercial Citrus spp. honeys produced in different Mediterranean countries based on minerals, volatile compounds and physicochemical parameters, using chemometrics. Food Chem. 2017, 217, 445–455. [Google Scholar] [CrossRef] [PubMed]
- Kato, Y.; Araki, Y.; Juri, M.; Ishisaka, A.; Nitta, Y.; Niwa, T.; Kitamoto, N.; Takimoto, Y. Competitive immunochromatographic assay for leptosperin as a plausible authentication marker of manuka honey. Food Chem. 2016, 194, 362–365. [Google Scholar] [CrossRef] [PubMed]
- Kortesniemi, M.; Slupsky, C.M.; Ollikka, T.; Kaukoe, L.; Spevacek, A.R.; Sjövall, O.; Yang, B.; Kallio, H. NMR profiling clarifies the characterization of Finnish honeys of different botanical origins. Food Res. Int. 2016, 86, 83–92. [Google Scholar] [CrossRef] [Green Version]
- Kuś, P.M.; Congiu, F.; Teper, D.; Sroka, Z.; Jerković, I.; Tuberoso, C.I.G. Antioxidant activity, color characteristics, total phenol content and general HPLC fingerprints of six Polish unifloral honey types. LWT Food Sci. Technol. 2014, 55, 124–130. [Google Scholar] [CrossRef]
- Scandurra, G.; Tripodi, G.; Verzera, A. Impedance spectroscopy for rapid determination of honey floral origin. J. Food Eng. 2013, 119, 738–743. [Google Scholar] [CrossRef]
- Siddiqui, A.J.; Musharraf, S.G.; Choudhary, M.I.; Rahman, A.-U. Application of analytical methods in authentication and adulteration of honey. Food Chem. 2017, 217, 687–698. [Google Scholar] [CrossRef] [PubMed]
- Silva, P.; Freitas, J.; Silva, C.L.; Perestrelo, R.; Nunes, F.M.; Câmara, J.S. Establishment of authenticity and typicality of sugarcane honey based on volatile profile and multivariate analysis. Food Control 2017, 73, 1176–1188. [Google Scholar] [CrossRef]
- Spiteri, M.; Rogers, K.M.; Jamin, E.; Thomas, F.; Guyader, S.; Lees, M.; Rutledge, D.N. Combination of 1H NMR and chemometrics to discriminate manuka honey from other floral honey types from Oceania. Food Chem. 2017, 217, 766–772. [Google Scholar] [CrossRef] [PubMed]
- Zhao, J.; Du, X.; Cheng, N.; Chen, L.; Xue, X.; Zhao, J.; Wu, L.; Cao, W. Identification of monofloral honeys using HPLC–ECD and chemometrics. Food Chem. 2016, 194, 167–174. [Google Scholar] [CrossRef] [PubMed]
- Al, M.L.; Daniel, D.; Moise, A.; Bobis, O.; Laslo, L.; Bogdanov, S. Physico-chemical and bioactive properties of different floral origin honeys from Romania. Food Chem. 2009, 112, 863–867. [Google Scholar] [CrossRef]
- Almeida-Muradian, L.B.; Stramm, K.M.; Horita, A.; Barth, O.M.; Freitas, A.S.; Estevinho, L.M. Comparative study of the physicochemical and palynological characteristics of honey from Melipona subnitida and Apis mellifera. Int. J. Food Sci. Technol. 2013, 48, 1698–1706. [Google Scholar] [CrossRef]
- Alvarez-Suarez, J.M.; Tulipani, S.; Díaz, D.; Estevez, Y.; Romandini, S.; Giampieri, F.; Damiani, E.; Astolfi, P.; Bompadre, S.; Battino, M. Antioxidant and antimicrobial capacity of several monofloral Cuban honeys and their correlation with color, polyphenol content and other chemical compounds. Food Chem. Toxicol. 2010, 48, 2490–2499. [Google Scholar] [CrossRef] [PubMed]
- Chaikham, P.; Kemsawasd, V.; Apichartsrangkoon, A. Effects of conventional and ultrasound treatments on physicochemical properties and antioxidant capacity of floral honeys from Northern Thailand. Food Biosci. 2016, 15, 19–26. [Google Scholar] [CrossRef]
- Del Campo, G.; Zuriarrain, J.; Zuriarrain, A.; Berregi, I. Quantitative determination of carboxylic acids, amino acids, carbohydrates, ethanol and hydroxymethylfurfural in honey by 1H NMR. Food Chem. 2016, 196, 1031–1039. [Google Scholar] [CrossRef] [PubMed]
- Escuredo, O.; Silva, L.R.; Valentão, P.; Seijo, M.C.; Andrade, P.B. Assessing Rubus honey value: Pollen and phenolic compounds content and antibacterial capacity. Food Chem. 2012, 130, 671–678. [Google Scholar] [CrossRef]
- Ferreira, I.C.F.R.; Aires, E.; Barreira, J.C.M.; Estevinho, L.M. Antioxidant activity of Portuguese honey samples: Different contributions of the entire honey and phenolic extract. Food Chem. 2009, 114, 1438–1443. [Google Scholar] [CrossRef]
- Gannabathula, S.; Krissansen, G.W.; Bisson-Rowe, L.; Skinner, M.; Steinhorn, G.; Schlothauer, R. Correlation of the immunostimulatory activities of honeys with their contents of identified bioactives. Food Chem. 2017, 221, 39–46. [Google Scholar] [CrossRef] [PubMed]
- Gomes, S.; Dias, L.G.; Moreira, L.L.; Rodrigues, P.; Estevinho, L. Physicochemical, microbiological and antimicrobial properties of commercial honeys from Portugal. Food Chem. Toxicol. 2010, 48, 544–548. [Google Scholar] [CrossRef] [PubMed] [Green Version]
- Isla, M.I.; Craig, A.; Ordoñez, R.; Zampini, C.; Sayago, J.; Bedascarrasbure, E.; Alvarez, A.; Salomón, V.; Maldonado, L. Physico chemical and bioactive properties of honeys from Northwestern Argentina. LWT Food Sci. Technol. 2011, 44, 1922–1930. [Google Scholar] [CrossRef]
- Jerković, I.; Kuś, P.M.; Tuberoso, C.I.G.; Šarolić, M. Phytochemical and physical–chemical analysis of Polish willow (Salix spp.) honey: Identification of the marker compounds. Food Chem. 2014, 145, 8–14. [Google Scholar] [CrossRef] [PubMed]
- Kaygusuz, H.; Tezcan, F.; Erim, F.B.; Yildiz, O.; Sahin, H.; Can, Z.; Kolayli, S. Characterization of Anatolian honeys based on minerals, bioactive components and principal component analysis. LWT Food Sci. Technol. 2016, 68, 273–279. [Google Scholar] [CrossRef]
- Lazarević, J.S.; Palić, R.M.; Radulović, N.S.; Ristić, N.R.; Stojanović, G.S. Chemical composition and screening of the antimicrobial and antioxidative activity of extracts of Stachys species. J. Serb. Chem. Soc. 2010, 75, 1347–1359. [Google Scholar] [CrossRef]
- Mattonai, M.; Parri, E.; Querci, D.; Degano, I.; Ribechini, E. Development and validation of an HPLC-DAD and HPLC/ESI-MS2 method for the determination of polyphenols in monofloral honeys from Tuscany (Italy). Microchem. J. 2016, 126, 220–229. [Google Scholar] [CrossRef]
- Mouhoubi-Tafinine, Z.; Ouchemoukh, S.; Tamendjari, A. Antioxydant activity of some Algerian honey and propolis. Ind. Crops Prod. 2016, 88, 85–90. [Google Scholar] [CrossRef]
- Moussa, A.; Noureddine, D.; Saad, A.; Abdelmalek, M.; Salima, B. The Influence of Botanical Origin and Physico-chemical Parameters on the Antifungal Activity of Algerian Honey. Plant Pathol. Microbiol. 2012, 3, 1000132J. [Google Scholar] [CrossRef]
- Özcan, M.M.; Ölmez, Ç. Some qualitative properties of different monofloral honeys. Food Chem. 2014, 163, 212–218. [Google Scholar] [CrossRef] [PubMed]
- Sousa, J.M.; de Souza, E.L.; Marques, G.; Meireles, B.; Cordeiro, Â.T.M.; Gullón, B.; Pintado, M.M.; Magnani, M. Polyphenolic profile and antioxidant and antibacterial activities of Monofloral honeys produced by Meliponini in the Brazilian semiarid region. Food Res. Int. 2016, 84, 61–68. [Google Scholar] [CrossRef]
- Veríssimo, M.I.; Gamelas, J.A.; Evtuguin, D.V.; Gomes, M.T. Determination of 5-hydroxymethylfurfural in honey, using head space solid-phase microextraction coupled with a polyoxometalate-coated piezoelectric quartz crystal. Food Chem. 2017, 220, 420–426. [Google Scholar] [CrossRef] [PubMed]
- Viuda-Martos, M.; Ruiz-Navajas, Y.; Zaldivar-Cruz, J.M.; Kuri, V.; Fernández-López, J.; Carbonell-Barrachina, Á.A.; Pérez-Álvarez, J.Á. Aroma profile and physico-chemical properties of artisanal honey from Tabasco, Mexico. Int. J. Food Sci. Technol. 2010, 45, 1111–1118. [Google Scholar] [CrossRef]
- Jin, Y.; Zhang, J.; Zhao, W.; Zhang, W.; Wang, L.; Zhou, J.; Li, Y. Development and validation of a multiclass method for the quantification of veterinary drug residues in honey and royal jelly by liquid chromatography–tandem mass spectrometry. Food Chem. 2017, 221, 1298–1307. [Google Scholar] [CrossRef] [PubMed]
- Juan-Borrás, M.; Domenech, E.; Escriche, I. Mixture-risk-assessment of pesticide residues in retail polyfloral honey. Food Control 2016, 67, 127–134. [Google Scholar] [CrossRef] [Green Version]
- Tette, P.A.S.; Oliveira, F.A.S.; Pereira, E.N.C.; Silva, G.; Glória, M.B.A.; Fernandes, C. Multiclass method for pesticides quantification in honey by means of modified QuEChERS and UHPLC–MS/MS. Food Chem. 2016, 211, 130–139. [Google Scholar] [CrossRef] [PubMed]
- Vichapong, J.; Burakham, R.; Santaladchaiyakit, Y.; Srijaranai, S. A preconcentration method for analysis of neonicotinoids in honey samples by ionic liquid-based cold-induced aggregation microextraction. Talanta 2016, 155, 216–221. [Google Scholar] [CrossRef] [PubMed]
- Bázár, G.; Romvári, R.; Szabó, A.; Somogyi, T.; Éles, V.; Tsenkova, R. NIR detection of honey adulteration reveals differences in water spectral pattern. Food Chem. 2016, 194, 873–880. [Google Scholar] [CrossRef] [PubMed]
- Li, S.; Zhang, X.; Shan, Y.; Su, D.; Ma, Q.; Wen, R.; Li, J. Qualitative and quantitative detection of honey adulterated with high-fructose corn syrup and maltose syrup by using near-infrared spectroscopy. Food Chem. 2017, 218, 231–236. [Google Scholar] [CrossRef] [PubMed]
- Shafiee, S.; Polder, G.; Minaei, S.; Moghadam-Charkari, N.; van Ruth, S.; Kuś, P.M. Detection of Honey Adulteration using Hyperspectral Imaging. IFAC-PapersOnLine 2016, 49, 311–314. [Google Scholar] [CrossRef]
- Shendy, A.H.; Al-Ghobashy, M.A.; Mohammed, M.N.; Alla, S.A.G.; Lotfy, H.M. Simultaneous determination of 200 pesticide residues in honey using gas chromatography–tandem mass spectrometry in conjunction with stream lined quantification approach. J. Chromatogr. A 2016, 1427, 142–160. [Google Scholar] [CrossRef] [PubMed]
- Shendy, A.H.; Al-Ghobashy, M.A.; Alla, S.A.G.; Lotfy, H.M. Development and validation of a modified QuEChERS protocol coupled to LC–MS/MS for simultaneous determination of multi-class antibiotic residues in honey. Food Chem. 2016, 190, 982–989. [Google Scholar] [CrossRef] [PubMed]
- Tette, P.A.S.; Guidi, L.R.; Glória, M.B.A.; Fernandes, C. Pesticides in honey: A review on chromatographic analytical methods. Talanta 2016, 149, 124–141. [Google Scholar] [CrossRef] [PubMed]
- Wu, L.; Du, B.; Heyden, Y.V.; Chen, L.; Zhao, L.; Wang, M.; Xue, X. Recent advancements in detecting sugar-based adulterants in honey—A challenge. Trends Anal. Chem. 2017, 86, 25–38. [Google Scholar] [CrossRef]
- Naila, A.; Flint, S.H.; Sulaiman, A.Z.; Ajit, A.; Weeds, Z. Classical and novel approaches to the analysis of honey and detection of adulterants. Food Control 2018, 90, 152–165. [Google Scholar] [CrossRef]
- Wilson, A.D.; Baietto, M. Advances in Electronic-Nose Technologies Developed for Biomedical Applications. Sensors 2011, 11, 1105–1176. [Google Scholar] [CrossRef] [PubMed] [Green Version]
- Vlasov, Y.; Legin, A.; Rudnitskaya, A.; Di Natale, C.; D’Amico, C. Nonspecific sensor arrays (“electronic tongue”) for chemical analysis of liquids: (IUPAC technical report). Pure Appl. Chem. 2005, 77, 1965–1983. [Google Scholar] [CrossRef]
- Gutiérrez, J.M.; Haddi, Z.; Amari, A.; Bouchikhi, B.; Mimendia, A.; Cetó, X.; del Valle, M. Hybrid electronic tongue based on multisensory data fusion for discrimination of beers. Sens. Actuator B Chem. 2013, 177, 989–996. [Google Scholar] [CrossRef]
- Cetó, X.; Gutiérrez-Capitán, M.; Calvo, D.; del Valle, M. Beer classification by means of a potentiometric electronic tongue. Food Chem. 2013, 141, 2533–2540. [Google Scholar] [CrossRef]
- Holmberg, M.; Eriksson, M.; Krantz-Rülcker, C.; Artursson, T.; Winquist, F.; Lloyd-Spetz, A.; Lundström, I. 2nd Workshop of the Second Network on Artificial Olfactory Sensing (NOSE II). Sens. Actuator B Chem. 2004, 101, 213–223. [Google Scholar] [CrossRef]
- Riul, A., Jr.; Dantas, C.A.R.; Miyazaki, C.M.; Oliveira, O.N., Jr. Recent advances in electronic tongues. Analyst 2010, 135, 2481–2495. [Google Scholar] [CrossRef] [PubMed] [Green Version]
- Mimendia, A.; Gutiérrez, J.M.; Leija, L.; Hernández, P.R.; Favari, L.; Muñoz, R.; del Valle, M. A review of the use of the potentiometric electronic tongue in the monitoring of environmental systems. Environ. Model. Softw. 2010, 25, 1023–1030. [Google Scholar] [CrossRef]
- Rodríguez-Méndez, M.L. Electronic Noses and Tongues in Food Science, 1st ed.; Academic Press: London, UK, 2016; 332p, ISBN 9780128002438. [Google Scholar]
- Rodríguez-Méndez, M.L.; De Saja, J.A.; González-Antón, R.; García-Hernández, C.; Medina-Plaza, C.; García-Cabezón, C.; Martín-Pedrosa, F. Electronic Noses and Tongues in Wine Industry. Front. Bioeng. Biotechnol. 2016, 4, 81. [Google Scholar] [CrossRef] [PubMed]
- Peris, M.; Escuder-Gilabert, L. Electronic noses and tongues to assess food authenticity and adulteration. Trends Food Sci. Technol. 2016, 58, 40–54. [Google Scholar] [CrossRef] [Green Version]
- Śliwińska, M.; Wiśniewska, P.; Dymerski, T.; Namieśnik, J.; Wardencki, W. Food Analysis Using Artificial Senses. J. Agric. Food Chem. 2014, 62, 1423–1448. [Google Scholar] [CrossRef] [PubMed]
- Toko, K. Biochemical Sensors: Mimicking Gustatory and Olfactory Senses; CRC Press: Boca Raton, FL, USA, 2013; 560p, ISBN 9789814267076. [Google Scholar]
- Valli, E.; Bendini, A.; Berardinelli, A.; Ragni, L.; Riccò, B.; Grossi, M.; Toschi, T.G. Rapid and innovative instrumental approaches for quality and authenticity of olive oils. Eur. J. Lipid Sci. Technol. 2016, 118, 1601–1619. [Google Scholar] [CrossRef]
- Dias, L.G.; Meirinho, S.; Veloso, A.C.A.; Rodrigues, L.R.; Peres, A.M. Chapter 13. Electronic Tongues and Aptasensors. In Bioinspired Materials for Medical Applications; Rodrigues, L.R., Mota, M., Eds.; Woodhead Publishing: Duxford, UK, 2017; pp. 371–402. ISBN 978-0-08-100746-4. [Google Scholar]
- Kirsanov, D.; Zadorozhnaya, O.; Krasheninnikov, A.; Komarova, N.; Popov, A.; Legin, A. Water toxicity evaluation in terms of bioassay with an Electronic Tongue. Sens. Actuator B Chem. 2013, 179, 282–286. [Google Scholar] [CrossRef]
- Peres, A.M.; Sousa, M.E.B.; Veloso, A.C.A.; Estevinho, L.; Dias, L.G. Chapter 6. Electrochemical Sensors for Assessing Antioxidant Capacity of Bee Products. In Applications of Honeybee Plant-Derived Products; Cardoso, S.M., Silva, A.M.S., Eds.; Bentham Science Publishers: Emirate of Sharjah, UAE, 2016; pp. 196–223. ISBN 978-1-68108-238-7. [Google Scholar]
- Ramamoorthy, H.V.; Mohamed, S.N.; Devi, D.S. E-Nose and E-Tongue: Applications and Advances in Sensor Technology. J. Nanosci. Nanotechnol. 2014, 2, 370–376. [Google Scholar]
- Zábrodská, B.; Vorlová, L. Adulteration of honey and available methods for detection—A review. Acta Vet. Brno 2014, 83, S85–S102. [Google Scholar] [CrossRef]
- Banerjee, R.; Tudu, B.; Bandyopadhyay, R.; Bhattacharyya, N. A review on combined odor and taste sensor systems. J. Food Eng. 2016, 190, 10–21. [Google Scholar] [CrossRef]
- Tahara, Y.; Toko, K. Electronic Tongues—A Review. IEEE Sens. J. 2013, 13, 3001–3011. [Google Scholar] [CrossRef]
- Zou, Y.; Wan, H.; Zhang, X.; Ha, D.; Wang, P. Chapter 2. Electronic Nose and Electronic Tongue. In Bioinspired Smell and Taste Sensors; Wang, P., Liu, Q., Wu, C., Hsia, K.J., Eds.; Science Press: Beijing, China; Springer Science + Business Media: Dordrecht, The Netherlands, 2015; pp. 19–44. ISBN 978-94-017-7332-4. [Google Scholar]
- Wei, X.; Wang, J. Discrimination of Honeys by Electronic Tongue and Different Analytical Techniques. In Proceedings of the 2009 2nd International Congress on Image and Signal Processing, Tianjin, China, 17–19 October 2009; p. 5, ISBN 978-1-4244-4129-7. [Google Scholar] [CrossRef]
- Wei, Z.; Wang, J.; Liao, W. Technique potential for classification of honey by electronic tongue. J. Food Eng. 2009, 94, 260–266. [Google Scholar] [CrossRef]
- Zakaria, A.; Md Shakaff, A.Y.; Masnan, M.J.; Ahmad, M.N.; Adom, A.H.; Jaafar, M.N.; Ghani, S.A.; Abdullah, A.H.; Aziz, A.H.A.; Kamarudin, L.M.; et al. A Biomimetic Sensor for the Classification of Honeys of Different Floral Origin and the Detection of Adulteration. Sensors 2011, 11, 7799–7822. [Google Scholar] [CrossRef] [PubMed] [Green Version]
- Masnan, M.J.; Mahat, N.I.; Zakaria, A.; Shakaff, A.Y.M.; Adom, A.H.; Sa’ad, F.S.A. Enhancing Classification Performance of Multisensory Data through Extraction and Selection of Features. Procedia Chem. 2012, 6, 132–140. [Google Scholar] [CrossRef]
- Wei, Z.; Wang, J. Tracing floral and geographical origins of honeys by potentiometric and voltammetric electronic tongue. Comput. Electron. Agric. 2014, 108, 112–122. [Google Scholar] [CrossRef]
- Major, N.; Marković, K.; Krpan, M.; Šarić, G.; Hruškar, M.; Vahčić, N. Rapid honey characterization and botanical classification by an electronic tongue. Talanta 2011, 85, 569–574. [Google Scholar] [CrossRef] [PubMed]
- Gan, Z.; Yang, Y.; Li, J.; Wen, X.; Zhu, M.; Jiang, Y.; Ni, Y. Using sensor and spectral analysis to classify botanical origin and determine adulteration of raw honey. J. Food Eng. 2016, 178, 151–158. [Google Scholar] [CrossRef]
- Di Rosa, A.R.; Leone, F.; Scattareggia, C.; Chiofalo, V. Botanical origin identification of Sicilian honeys based on artificial senses and multi-sensor data fusion. Eur. Food Res. Technol. 2018, 244, 117–125. [Google Scholar] [CrossRef]
- Dias, L.A.; Peres, A.M.; Vilas-Boas, M.; Rocha, M.A.; Estevinho, L.; Machado, A.A. An electronic tongue for honey classification. Microchim. Acta 2008, 163, 97–102. [Google Scholar] [CrossRef] [Green Version]
- Gil-Sánchez, L.; Garcia-Breijo, E.; Garrigues, J.; Alcañiz, M.; Escriche, I.; Kadar, M. Classification of Honeys of Different Floral Origins by Artificial Neural Networks. In Proceedings of the IEEE Sensors Proceedings, Limerick, Ireland, 28–31 October 2011; pp. 1780–1783. [Google Scholar] [CrossRef]
- Escriche, I.; Kadar, M.; Domenech, E.; Gil-Sánchez, L. A potentiometric electronic tongue for the discrimination of honey according to the botanical origin. Comparison with traditional methodologies: Physicochemical parameters and volatile profile. J. Food Eng. 2012, 109, 449–456. [Google Scholar] [CrossRef]
- Garcia-Breijo, E.; Garrigues, J.; Sanchez, L.G.; Laguarda-Miro, N. An Embedded Simplified Fuzzy ARTMAP Implemented on a Microcontroller for Food Classification. Sensors 2013, 13, 10418–10429. [Google Scholar] [CrossRef] [PubMed]
- Sousa, M.E.B.C.; Dias, L.G.; Veloso, A.C.A.; Estevinho, L.; Peres, A.M.; Machado, A.A.S.C. Practical procedure for discriminating monofloral honey with abroad pollen profile variability using an electronic tongue. Talanta 2014, 128, 284–292. [Google Scholar] [CrossRef] [PubMed] [Green Version]
- Dias, L.G.; Veloso, A.C.A.; Sousa, M.E.B.C.; Estevinho, L.; Machado, A.A.S.C.; Peres, A.M. A novel approach for honey pollen profile assessment using an electronic tongue and chemometric tools. Anal. Chim. Acta 2015, 900, 36–45. [Google Scholar] [CrossRef] [PubMed] [Green Version]
- Juan-Borrás, M.; Soto, J.; Gil-Sánchez, L.; Pascual-Maté, A.; Escriche, I. Antioxidant activity and physico-chemical parameters for the differentiation of honey using a potentiometric electronic tongue. J. Sci. Food Agric. 2017, 97, 2215–2222. [Google Scholar] [CrossRef] [PubMed]
- Khaydukova, M.; Medina-Plaza, C.; Rodriguez-Mendez, M.L.; Panchuk, V.; Kirsanov, D.; Andrey Legin, A. Multivariate calibration transfer between two different types of multisensor systems. Sens. Actuator B Chem. 2017, 246, 994–1000. [Google Scholar] [CrossRef]
- Bougrini, M.; Tahri, K.; Saidi, T.; El Hassani, N.E.; Bouchikhi, B.; El Bari, N. Classification of Honey According to Geographical and Botanical Origins and Detection of Its Adulteration Using Voltammetric Electronic Tongue. Food Anal. Method. 2016, 9, 2161–2173. [Google Scholar] [CrossRef]
- El Hassani, N.E.; Tahri, K.; Llobet, E.; Bouchikhib, B.; Errachid, A.; Zine, N.; El Bari, N. Emerging approach for analytical characterization and geographical classification of Moroccan and French honeys by means of a voltammetric electronic tongue. Food Chem. 2018, 243, 36–42. [Google Scholar] [CrossRef] [PubMed]
- Giordano, G.F.; Vicentini, M.B.R.; Murer, R.C.; Augusto, F.; Ferrão, M.F.; Helferd, G.A.; da Costa, A.B.; Gobbi, A.L.; Hantao, L.W.; Lima, R.S. Point-of-use electroanalytical platform based on homemade potentiostat and smartphone for multivariate data processing. Electrochim. Acta 2016, 219, 170–177. [Google Scholar] [CrossRef]
- Men, H.; Gao, H.; Li, J.; Liu, J.; Zhang, Y. Fuzzy ARTMAP for the Adulterated Honey Discrimination with Voltammetric Electronic Tongue. Sens. Transducers 2014, 178, 40–46. [Google Scholar]
- Tiwari, K.; Tudu, B.; Bandhopadhya, R.; Chatterjee, A. Discrimination of Monofloral Honey Using Cyclic Voltammetry. In Proceedings of the 3rd National Conference on Emerging Trends and Applications in Computer Science, Shillong, India, 30–31 March 2012; pp. 132–136. [Google Scholar] [CrossRef]
- Tiwari, K.; Tudu, B.; Bandyopadhyay, R.; Chatterjee, A. Identification of monofloral honey using voltammetric electronic tongue. J. Food Eng. 2013, 117, 205–210. [Google Scholar] [CrossRef]
- Tiwari, K.; Biswas, S.; Tudu, B.; Bandhopadhyay, R.; Chatterjee, A.; Pramanik, P. Voltammetric Technique for Honey Analysis Using NiO/Nps Modified Carbon Paste Electrode. In Proceedings of the 2014 International Conference on Control, Instrumentation, Energy & Communication (CIEC), Calcutta, India, 31 January–2 February 2014; pp. 152–155, ISBN 978-1-4799-2044-0/14. [Google Scholar]
- Tiwari, K.; Biswas, S.; Tudu, B.; Bandhopadhyay, R.; Pramanik, P. Development of metal oxide-modified carbon paste based sensor for honey analysis using electronic tongue. Mater. Today-Proc. 2017, 4, 9500–9504. [Google Scholar] [CrossRef]
- Tiwari, K.; Tudu, B.; Bandyopadhyay, R.; Chatterjee, A.; Pramanik, P. Voltammetric sensor for electrochemical determination of the floral origin of honey based on a zinc oxide nanoparticle modified carbon paste electrode. J. Sens. Sens. Syst. 2018, 7, 319–329. [Google Scholar] [CrossRef] [Green Version]
- Wei, Z.; Wang, J. Classification of monofloral honeys by voltammetric electronic tongue with chemometrics method. Electrochim. Acta 2011, 56, 4907–4915. [Google Scholar] [CrossRef]
- Sobrino-Gregorio, L.; Bataller, R.; Soto, J.; Escriche, I. Monitoring honey adulteration with sugar syrups using an automatic pulse voltammetric electronic tongue. Food Control 2018, 91, 254–260. [Google Scholar] [CrossRef]
- Cai, J.; Wu, X.; Yuan, L.; Han, E.; Zhou, L.; Zhou, A. Determination of Chinese Angelica honey adulterated with rice syrup by an electrochemical sensor and Chemometrics. Anal. Methods 2013, 5, 2324–2328. [Google Scholar] [CrossRef]
- Krepper, G.; Pierini, G.D.; Pistonesi, M.F.; Di Nezio, M.S. “In-situ” antimony film electrode for the determination of tetracyclines in Argentinean honey samples. Sens. Actuator B Chem. 2017, 241, 560–566. [Google Scholar] [CrossRef]
- Tonello, N.; Moressi, M.B.; Robledo, S.N.; D’Eramo, F.; Marioli, J.M. Square wave voltammetry with multivariate calibration tools for determination of eugenol, carvacrol and thymol in honey. Talanta 2016, 158, 306–314. [Google Scholar] [CrossRef] [PubMed]
- Zhao, X.; Zhang, Q.; Chen, H.; Liu, G.; Bai, W. Highly Sensitive Molecularly Imprinted Sensor Based on Platinum Thin-film Microelectrode for Detection of Chloramphenicol in Food Samples. Electroanalysis 2017, 29, 1918–1924. [Google Scholar] [CrossRef]
- Zhang, W.; Zhang, Z.; Li, Y.; Chen, J.; Li, X.; Zhang, Y.; Zhang, Y. Novel nanostructured MIL-101(Cr)/XC-72 modified electrode sensor: A highly sensitive and selective determination of chloramphenicol. Sens. Actuator B Chem. 2017, 247, 756–764. [Google Scholar] [CrossRef]
- Zhang, W.; Zong, L.; Geng, G.; Li, Y.; Zhang, Y. Enhancing determination of quercetin in honey samples through electrochemical sensors based on highly porous polypyrrole coupled with nanohybrid modified GCE. Sens. Actuator B Chem. 2018, 257, 1099–1109. [Google Scholar] [CrossRef]
- Sakthivel, R.; Kubendhiran, S.; Chen, S.-M.; Ranganathan, P.; Rwei, S.-P. Functionalized Carbon Black Nanospheres Hybrid with MoS2 Nanoclusters for the Effective Electrocatalytic Reduction of Chloramphenicol. Electroanalysis 2018, 30, 10. [Google Scholar] [CrossRef]
- Xiao, L.; Xu, R.; Yuan, Q.; Wang, F. Highly sensitive electrochemical sensor for chloramphenicol based on MOF derived exfoliated porous carbon. Talanta 2017, 167, 39–43. [Google Scholar] [CrossRef] [PubMed]
- Sun, Y.; Wei, T.; Jiang, M.; Xu, L.; Xu, Z. Voltammetric sensor for chloramphenicol determination based on a dual signal enhancement strategy with ordered mesoporous carbon@polydopamine and β-cyclodextrin. Sens. Actuator B Chem. 2018, 255, 2155–2162. [Google Scholar] [CrossRef]
- Wen, Y.; Liao, X.; Deng, C.; Liu, G.; Yan, Q.; Li, L.; Wang, X. Imprinted voltammetric streptomycin sensor based on a glassy carbon electrode modified with electropolymerized poly(pyrrole-3-carboxy acid) and electrochemically reduced graphene oxide. Microchim. Acta 2017, 184, 935–941. [Google Scholar] [CrossRef]
- Tajyani, S.; Babaei, A. A new sensing platform based on magnetic Fe3O4@NiO core/shell nanoparticles modified carbon paste electrode for simultaneous voltammetric determination of Quercetin and Tryptophan. J. Electroanal. Chem. 2018, 808, 50–58. [Google Scholar] [CrossRef]
- Oliveira, A.E.F.; Bettio, G.B.; Pereira, A.C. An Electrochemical Sensor Based on Electropolymerization of ß-Cyclodextrin and Reduced Graphene Oxide on a Glassy Carbon Electrode for Determination of Neonicotinoids. Electroanalysis 2018, 30, 10. [Google Scholar] [CrossRef]
- Panchuk, V.; Lvova, L.; Kirsanov, D.; Gonçalves, C.G.; Di Natale, C.; Paolesse, R.; Legin, A. Extending electronic tongue calibration lifetime through mathematical drift correction: Case study of microcystin toxicity analysis in waters. Sens. Actuator B Chem. 2016, 237, 962–968. [Google Scholar] [CrossRef]
- Sales, F.; Callao, M.P.; Rius, F.X. Multivariate standardization techniques on ion-selective sensor arrays. Analyst 1999, 124, 1045–1051. [Google Scholar] [CrossRef]
- Sales, F.; Callao, M.P.; Rius, F.X. Multivariate standardization for correcting the ionic strength variation on potentiometric sensor arrays. Analyst 2000, 125, 883–888. [Google Scholar] [CrossRef]
- Holmin, S.; Krantz-Rülcker, C.; Lundström, I.; Winquist, F. Drift correction of electronic tongue responses. Meas. Sci. Technol. 2001, 12, 1348–1354. [Google Scholar] [CrossRef]
- Rodrigues, N.; Dias, L.G.; Veloso, A.C.A.; Pereira, J.A.; Peres, A.M. Evaluation of extra-virgin olive oils shelf life using an electronic tongue—Chemometric approach. Eur. Food Res. Technol. 2017, 243, 597–607. [Google Scholar] [CrossRef]
- Rodrigues, N.; Dias, L.G.; Veloso, A.C.A.; Pereira, J.A.; Peres, A.M. Monitoring olive oils quality and oxidative resistance during storage using an electronic tongue. LWT Food Sci. Technol. 2016, 73, 683–692. [Google Scholar] [CrossRef] [Green Version]
- Kobayashi, Y.; Habara, M.; Ikezazki, H.; Chen, R.; Naito, Y.; Toko, K. Advanced taste sensors based on artificial lipids with global selectivity to basic taste qualities and high correlation to sensory scores. Sensors 2010, 10, 3411–3443. [Google Scholar] [CrossRef] [PubMed]
Figure 1.
Database of signal profiles generated by a potentiometric E-tongue device comprising K sensor arrays each with N sensors, during the analysis of M samples.
Figure 1.
Database of signal profiles generated by a potentiometric E-tongue device comprising K sensor arrays each with N sensors, during the analysis of M samples.

Figure 2.
Database of signals profiles generated by a voltammetric E-tongue device comprising K working electrodes, during the analysis of M samples.
Figure 2.
Database of signals profiles generated by a voltammetric E-tongue device comprising K working electrodes, during the analysis of M samples.

Figure 3.
Common qualitative applications of potentiometric and voltammetric E-tongues coupled with chemometric tools for honey analysis, according to the literature survey.
Figure 3.
Common qualitative applications of potentiometric and voltammetric E-tongues coupled with chemometric tools for honey analysis, according to the literature survey.

Figure 4.
Common quantitative applications of potentiometric and voltammetric E-tongues coupled with chemometric tools for honey analysis, according to the literature survey.
Figure 4.
Common quantitative applications of potentiometric and voltammetric E-tongues coupled with chemometric tools for honey analysis, according to the literature survey.


Table 1.
Honey evaluation using commercial potentiometric E-tongue based devices.
| E-Tongue Sensors | Type of Application | Chemometric Approach and Performance | Ref. |
|---|---|---|---|
| α-AstreeTM: ChemFET sensor technology with 7 cross-selective liquid sensors(sensitive to ionic, neutral and chemical compounds responsible for taste) coupled with an Ag/AgCl reference electrode | Honey classification according to floral origin (Acacia, Astragali, Data, Coptis, Vitex, Motherwort, Radix Changll and Buckwheat) | - PCA - DFA - BP-ANN (correct honey classification of 98.43% according to the floral origin) | [87] |
| α-AstreeTM: ChemFET sensor technology with 7 cross-selective liquid sensors(sensitive to ionic, neutral and chemical compounds responsible for taste) coupled with an Ag/AgCl reference electrode | Honey classification according to floral origin (Acacia, Astragali, Data, Coptis, Vitex, Motherwort, Radix Changll and Buckwheat) Honey classification according to geographical origin | - PCA - CA (correct honey classification: 90% according to the floral origin and 92% according to geographical origin) - ANN (correct honey classification: 93.75% according to the floral origin and 95% according to geographical origin, for test group) | [88] |
| Chalcogenide-based device: Ion-selective sensors (iron, cadmium, copper, mercury, titanium, sulfur and chromium ions) plus a Ag/AgCl reference electrode | Monofloral honey classification Identification of honey adulteration | - PCA - LDA (correct classification rate of 96.7%, for LOO-CV) - PNN (90.74% of corrected classifications for test group) | [89] |
| Chalcogenide-based device (commercial device): Ion-selective sensors (iron, cadmium, copper, mercury, titanium, sulfur and chromium ions) plus a Ag/AgCl reference electrode | Honeys classification (different floral origins, including leaf, durian, maluka, coconut, starfruit, wax apple and tualang; or, of tualang honey from different producers) | LDA with feature extraction or selection methods: LDA plus backward selection: 86.54% of correct classification using signals from 3 sensors LDA plus forward selection: 94.23% of correct classification using signals from 2 sensors LDA plus PCA: 57.70% of correct classification using data from 4 principal components | [90] |
| α-AstreeTM: ChemFET sensor technology with 7 potentiometric chemical sensors based on chemically modified field effect transistor technology, with sensors coated with materials sensitive to the basic tastes, coupled with an Ag/AgCl reference electrode | Classification of honey samples according to their botanical (Acacia, Data, Motherwort and Buckwheat) and geographic (4 regions) origins | Pattern recognition techniques with feature extraction (12 variable features), - PCA and DFA: honey samples correctly grouped in 2-D principal components according to the floral origin or geographical origin Quantitative analysis: - PCR, PLSR and LS-SVM models (floral and geographical origins were coded, varying from 1 to 4): prediction R2 equal to 0.7360, 0.9021 and 0.9447, respectively | [91] |
| α-AstreeTM: ChemFET sensor technology with 7 cross-selective liquid sensors(sensitive to ionic, neutral and chemical compounds responsible for taste) coupled with an Ag/AgCl reference electrode | Honey classification according to botanical origin (acacia, chestnut and honeydew) Honey analysis (physicochemical properties: electrical conductivity, acidity, water content, invert and total sugar contents) | Pattern recognition techniques: - PCA - CCA - ANN (downsizing of the model required to avoid overfitting: 100% of correct honey classification according to botanical origin, for the test group) Quantitative analysis: - ANN (models established for physicochemical parameters: 0.982 ≤ R-value ≤ 0.999, for the test group) | [92] |
| α-AstreeTM: ChemFET sensor technology with 7 cross-selective liquid sensors(sensitive to ionic, neutral and chemical compounds responsible for taste) coupled with an Ag/AgCl reference electrode | Honey botanical origin classification (acacia, jujube and vitex varieties from different geographical origins) Identification of raw honey adulteration (honey adulterated with different percentages of corn or rice syrups) | Sensor data pretreatment: SNV, autoscale, smoothing and derivatives PCA PLSDA classification models: - botanical origin: 91.53% of correct classification for test group - adulteration identification: 100% of correct classification for test group SVMDA classification models: - botanical origin: 100% of correct classification for test group | [93] |
| α-AstreeTM: ChemFET sensor technology with 7 cross-selective liquid sensors(sensitive to ionic, neutral and chemical compounds responsible for taste) coupled with an Ag/AgCl reference electrode | Classification of different Sicilian honey varieties: chestnut, eucalyptus, sulla and orange blossom from 7 different provenances | PCA: - effective discrimination of the different honeys according to their botanical origin using the potentiometric data DFA: - overall 70.8% of correct classifications for cross-validation | [94] |
ANN: artificial neural networks; BP-ANN: back propagation artificial neural networks; CA: cluster analysis; CCA: canonical correlation analysis; DFA: discriminant function analysis; KNN: k-nearest neighbor; LDA: linear discriminant analysis; LOO-CV: leave-one-out cross-validation procedure; LS-SVM: least squares-support vector machines models; PCA: principal component analysis; PLS: partial least squares models; PLSDA: partial least squares discriminant analysis models; PNN: probabilistic neural network; R-value: correlation coefficient; R2: determination coefficient; SA: simulated annealing variable selection algorithm; SNV: standard normal variate; SVM: support vector machine; SVMDA models: support vector machine discriminant analysis.
Table 2.
Honey evaluation using lab-made potentiometric E-tongue based devices.
| E-Tongue Sensors | Type of Application | Chemometric Approach and Performance | Ref. |
|---|---|---|---|
| All-solid-state sensors device: 20 polymeric membranes (additive + plasticizer + PVC) applied on solid conducting silver-epoxy supports plus a Ag/AgCl reference electrode | Honey classification according to floral origin (Erica, Echium and Lavandula) | - PCA - LDA coupled with heuristic variable selection algorithms (stepwise, backward and forward) allowed 72% of correct classifications, for LOO-CV procedure | [95] |
| Multi-electrode device (metallic electrodes): Pure metals (Au, Ag and Cu) and metal compound electrodes (Cu2O, Ag2O, AgCl, Ag2CO3 and Ag2SO4) plus a Ag/AgCl reference electrode. | Honey classification according to floral origin (citrus, rosemary, polyfloral and honeydew—forest origin) Honey physical treatment (raw, liquefied and pasteurized honeys) | - PCA - ANN (Fuzzy-ARTMAP network; correct honey classification: 83.3% according to the floral origin and 58.3% according to physical treatment) | [96] |
| Multi-electrode device: Pure metals (e.g., gold, silver and copper) and metallic compounds (e.g., AgO2, CuO2, AgCl and Ag2CO3) plus a Ag/AgCl reference electrode. | Honey botanical origin classification (citrus, rosemary, polyfloral and honeydew) Honey physical treatment (raw, liquefied and pasteurized honeys) | Pattern recognition techniques: - PCA - Fuzzy-ARTMAP neural networks (correct classification rates, for LOO-CV, of 94% and 42% for botanical origin and physical treatment, respectively) Quantitative analysis: - PLS (satisfactory performance for mmPfund color scale, color coordinate L* and diastase activity; R2 ≥ 0.926) | [97] |
| Multi-electrode device (metallic electrodes): Pure metals (e.g., gold, silver and copper) and metallic compounds (e.g., AgO2, CuO2, AgCl and Ag2CO3) plus a Ag/AgCl reference electrode. | Honey floral origin classification (citrus, rosemary, polyfloral and forest) Honey physical treatment (raw, liquefied and pasteurized honeys) | Fuzzy ARTMAP neural networks SFAM networks coupled or not to heuristic variable selection algorithms (stepwise, backward and forward) Better recognition performance for floral origin compared to physical treatment Maximum recognition rate of 75% for a test group | [98] |
| Multi-sensor arrays: 20 lipid membrane sensors and respective replicas (combinations of different lipid additives and plasticizers with PVC) | Honey classification according to color (white, amber and dark) Honey classification according to botanical origin (Castanea sp., Echium sp., Erica sp., Lavandula sp., Prunus sp. and Rubus sp.) | LDA coupled with feature selection (meta-heuristic SA variable selection algorithm): - color classification: 91% of corrected classified honey samples for LOO-CV - floral origin classification: 100% of correctly classified samples for LOO-CV after color split | [99] |
| Multi-sensor arrays: 20 lipid membrane sensors and respective replicas (combinations of different lipid additives and plasticizers with PVC) | Honey pollen profile assessment (i.e., quantification of pollen percentage in honey samples): monofloral honey of Castanea sp., Echium sp., Erica sp., Eucalyptus sp., Lavandula sp., Prunus sp., Rubus sp. and Trifolium sp.; and polyfloral honeys | MLR models coupled with feature selection (meta-heuristic SA variable selection algorithm): - pollen percentage quantification: MLR-SA models with mean R2 values (±SD) between 0.91 ± 0.15 and 0.996 ± 0.010, for repeated K-fold-CV, after color split (keeping more than 10% of data for prediction purposes) | [100] |
| Sensor array: Eight metallic electrodes including noble metals (gold, platinum, iridium and rhodium) and non-noble metals (copper, silver, nickel and cobalt) | Honey classification: orange blossom, rosemary, thyme, sunflower, winter savory and honeydew honey. Honey physicochemical evaluation: water activity, conductivity, moisture, color and antioxidant activity. | Pattern recognition techniques: - PCA - Fuzzy ARTMAP artificial neural networks: - 100% honey type classification success for the test group Quantitative MLR models: - Predicted R-value of 0.9666 and 0.8959 for antioxidant activity and electrical conductivity, respectively | [101] |
ANN: artificial neural networks; CA: cluster analysis; CCA: canonical correlation analysis; DFA: discriminant function analysis; Fuzzy-ARTMAP: fuzzy adaptive resonance theory multidimensional maps; K-fold-CV: repeated K folds cross-validation procedure; LDA: linear discriminant analysis; LOO-CV: leave-one-out cross-validation procedure; MLR model: multiple linear regression model; PCA: principal component analysis; PLS models: partial least squares models; R2: determination coefficient; R-value: correlation coefficient; SA: simulated annealing variable selection algorithm; SD: standard deviation; SFAM: simplified fuzzy adaptive resonance theory map.
Table 3.
Honey evaluation using commercial voltammetric E-tongue based device.
| E-Tongue Sensors | Technique | Type of Application | Chemometric Approach and Performance | Ref. |
|---|---|---|---|---|
| CHI660D electrochemical analyzer: - one WE (glassy carbon) - one RE (saturated calomel electrode, saturated with KCl solution) - one CE (platinum wire) | CV | Detection of honey adulteration with rice syrups | Pattern recognition techniques with feature extraction (12 variable features), - PCA: pure and adulterated honey samples were completely distinguished using the two first PCs - PCA-LDA and LDA: recognition rates of 100% for both calibration and prediction sets Quantitative analysis, - MLR model with 12 PCs: Rprediction = 0.898 - PCR model with 3 PCs Rprediction = 0.881 - PLS with 4 PCS: Rprediction = 0.898 | [114] |
CE: counter electrode; CV: cyclic voltammetry; LDA: linear discriminant analysis; MLR model: multiple linear regression model; PCA: principal component analysis; PCR: principal components regression; PCs: principal components; PLS: partial least squares model; R2: determination coefficient; RE: reference electrode; R-value: correlation coefficient; WE: working electrode.
Table 4.
Honey analysis using self-assembled lab-made conventional three-electrodes voltammetric devices.
Table 4.
Honey analysis using self-assembled lab-made conventional three-electrodes voltammetric devices.
| E-Tongue Sensors | Technique | Type of Application | Chemometric Approach and Performance | Ref. |
|---|---|---|---|---|
| - one WE: platinum electrode - one RE: Ag/AgCl saturated KCl - one CE: platinum electrode | CV | Discrimination of monofloral honeys: Eucalyptus, Til, Leechu and Khalisa | PCA used as a pattern recognition classifier: successful recognition of floral origin | [107] |
| - one WE: platinum electrode - one RE: Ag/AgCl saturated KCl - one CE: platinum electrode | CV | Identification of floral honey origin: Eucalyptus (Eucalyptus globulus) Til (Sesamum indicum) Leechu (Litchi chinensis) Khalisa (regional name) | - PCA (with relative scale2 method): Til and Eucalyptus honeys grouped into two distinct clusters while honey samples from Kholisa and Leechi overlapped - LDA (with autoscale method): 100% of corrected classified samples (original grouped samples) - BP-MLP neural network (with range scale method): 93.42% of correct classifications for a validation dataset - RBF neural network (with baseline subtraction method): 82.50% of correct classifications for a validation dataset | [108] |
| - one WE: NiO/Nps modified carbon paste electrode - one RE: Ag/AgCl saturated KCl - one CE: platinum wire | CV | Floral characterization of honey (Eucalyptus, Til, Lecchi, Pumpkin, Mustard and polyfloral) with the same geographical origin | PCA: honey samples correctly grouped according to the floral origin in 2-D dimensional planes, being polyfloral honey samples, a mixture of eucalyptus and mustard honeys, grouped closely to mustard and eucalyptus honey groups | [109] |
| - one WE: gold electrode - one RE: saturated calomel electrode - one CE: platinum electrode | DPV LSV CV SWV | Detection of honey adulteration with sugar syrups Quantification of adulteration percentage | Pattern recognition methods: - PCA: allows distinguishing honey samples according to the adulteration percentage (from 0% up to 70%) - RBF: 83.33% of honey samples correctly classified according to adulteration level (from 0% to 70%) - FKNN: 88.89% of honey samples correctly classified according to adulteration level (from 0% to 70%) - Fuzzy ARTMAP: 94.40% of honey samples correctly classified according to adulteration level (from 0% to 70%) Quantitative analysis: - PLS: honey adulteration percentage satisfactorily predicted (R-value = 0.8442) | [106] |
| Portable device with integrated chemometrics tools: - one WE: gold disk electrode - one RE: Ag/AgCl electrode - one CE: gold disk electrode | CV | Classification of honey samples according to their botanical (quince, orange, and coffee) and geographic 3 regions) origins | PCA (four-components model based on 408 variables, with decomposed signals): successfully applied to fingerprint honey samples according to their botanical and geographic origins. | [105] |
| - one WE: silver electrode - one RE: Ag/AgCl electrode - one CE: platinum electrode | CV | Differentiation of monofloral honeys according to botanical origin (Castanea sp., Echium sp., Rubus sp., Lavandula sp., Prunus sp., Erica sp., Trifolium sp.) Monofloral honey differentiation according to color scale | Qualitative approach: - honey samples from the same color group, anodic peak currents and anodic areas differ with floral origin of honeys - similar oxidation potentials and overall voltammetric profiles observed for Lavandula sp. honeys, regardless honey color - anodic peak current and anodic curve area of Lavandula sp. honeys increase with darkness increasing of Lavandula sp. honeys (mmPfund values versus anodic peak current intensity, R = 0.9680) | [81] |
| - one WE: glassy carbon electrode disk - one RE: KCl saturated calomel electrode - one CE: platinum foil | CV SWV | Determination of antiseptic agents (eugenol, carvacrol and thymol) in honey samples | Multivariate calibration tools developed based on SWV data, with baseline correction and signal alignment: - PLS: poor predictive capability (validation set: 0.19 ≤ R2 ≤ 0.76 with relative errors of prediction greater than 30%) - ANN (feed-forward network with Levenberg-Marquardt back propagation training): - validation set: 0.968 ≤ R2 ≤ 0.997 with relative errors of prediction of 5–7% and limits of detection between 0.010 and 0.240 mg L−1 | [116] |
| - one WE: modified platinum thin-film microelectrode with o-phenylenediamine - one RE: platinum electrode - one CE: platinum electrode | CV SWV | Determination of antibiotics in honey: chloramphenicol (CAP) | CAP dynamic range: from 0.9 to 10 nM (R = 0.992) CAP detection limit: 0.39 nM CAP recovery assays: from 89 to 107.3% | [117] |
| - one WE: modified glassy carbon electrode using an isoreticular carbon porous metal-organic framework - one RE: saturated calomel electrode - one CE: platinum wire | SWV | Determination of antibiotics in honey: chloramphenicol (CAP) | CAP dynamic range: from 10 nM to 1 μM (R2 ≥0.991) CAP detection limit: 2.9 nM CAP (0.1 to 1.5 μM) recovery assays: from 96 to 110% | [121] |
| - one WE: bare glassy carbon electrode or modified electrode (MIL-101(Cr)/XC-72/GCE sensor) - one RE: saturated calomel electrode - one CE: platinum wire | CV DPV | Determination of antibiotics in honey: chloramphenicol (CAP) | CAP dynamic range: from 10 nM to 20 μM (R = 0.985) CAP detection limit: 1.5 nM CAP (0.2 to 1.0 μM) recovery assays: from 95 to 101% | [118] |
| - one WE: functionalized carbon black nanospheres hybrid with MoS2 nanocluster - one RE: Ag/AgCl saturated KCl - one CE: platinum wire | CV DPV | Determination of antibiotics in honey: chloramphenicol (CAP) | CAP dynamic range: from 0.015 to 1370 μM (R2 = 0.989) CAP detection limit: 0.002 μM CAP (25 and 50 μM) recovery assays: from 93.0 to 96.2% CAP sensitivity: 3400 μAμM−1cm−2 | [120] |
| - one WE: glassy carbon electrode modified (or not) with ordered mesoporous carbon@polydopamine and β-cyclodextrin - one RE: saturated calomel electrode - one CE: platinum wire | CV SWV | Determination of antibiotics in honey: chloramphenicol (CAP) | CAP dynamic range: from 0.5 μM to 0.5 mM (R2 = 0.9992) CAP detection limit: 0.2 μM CAP recovery assays (5 to 50 μM): 80.0 to 93.0%. | [122] |
| - one WE: glassy carbon electrode modified with electro-polymerized poly(pyrrole-3-carboxy acid) and electrochemically reduced graphene oxide - one RE: saturated calomel electrode - one CE: platinum electrode | CV DPV | Determination of antibiotics in honey: streptomycin (STR) | STR dynamic range: 2 nM to 1 μM (R > 0.99) STR detection limit: 0.5 nM STR (25 nM to 1 μM) recovery assays: 96 to 104% | [123] |
| - one WE: antimony film coating a glassy carbon electrode - one RE: Ag/AgCl saturated NaCl - one CE: platinum wire | CV SWCSV | Determination of antibiotics (tetracyclines) in honey samples | Quantitative analysis using a LR model based on SWCSV: - linear range: 0.40–3.00 μM - sensitivity: 1.46 μA μM−1 - detection limit: 0.15 μM - recoveries: from 91.81% to 109.69% | [115] |
| - one WE: ZrO2NPs with modified carbon paste electrode and paraffin oil - one RE: Ag/AgCl saturated KCl - one CE: platinum wire | CV | Floral characterization of honey with different floral origins (Eucalyptus, Til, Pumpkin and Mustard) from different apiaries of the same geographical region | PCA (data preprocessed: scaled): honey samples correctly grouped according to the floral origin in 2-D dimensional planes | [110] |
| - one WE: carbon paste electrode modified with zinc oxide nanoparticles - one RE: Ag/AgCl saturated KCL - one CE: platinum wire | CV | Discrimination of the floral origin of honey: Eucalyptus globulus, Cucurbita maxima, Litchi chinensis, Brassica juncea, Sesamum indicum | Pattern recognition techniques: - PCA: allowed the discrimination among the different floral types - ANN (BP-MLP and RBF): classification model with more than 90% accuracy (86 to 97% of correct classification according to each honey floral type) | [111] |
| - one WE: carbon paste electrode modified with magnetic Fe3O4@NiO core/shell nanoparticles - one RE: Ag/AgCl electrode - one CE: platinum rod | CV DPV | Determination of Quercetin (Q, flavonoid) and Tryptophan (Trp, essential aminoacid) in honey samples | Q dynamic range: 0.08–60 μM (R2 = 0.9845) Trp dynamic range: 0.1–120 μM (R2 = 0.9893) Q detection limit: 2.18 nM Trp detection limit: 14.23 nM | [124] |
| - one WE: modified nanohybrid glassy carbon electrode with highly porous polypyrrole (MIP/MIL-101 (Cr)/MoS2/GCE sensor) - one RE: saturated calomel electrode - one CE: platinum foil | CV DPV | Determination of Quercetin (Q, flavonoid) in honey samples | Q dynamic range: 0.1 to 700 μM (R2 = 0.999) Q detection limit: 0.06 μM in phosphate buffer solution (PBS, pH = 3.5) Q recovery assays (1.1 to 1.5 μM): 97.3 to 101.3% | [119] |
| - one WE: glassy carbon electrode modified with ß-cyclodextrin and graphene oxide - one RE: Ag/AgCl electrode - one CE: platinum wire | CV SWV | Determination of neonicotinoids (insecticides): imidacloprid (IMP), clothianidin (CLT) and thiamethoxam (TMX) | IMP dynamic range: 0 to 165 μM CLT dynamic range: 7.5 to 80 μM TMX dynamic range: 10 to 70 μM IMP detection limit: 8.92 μM CLT detection limit: 4.72 μM TMX detection limit: 7.45 μM Recovery assays (added 20 μM): 108.75, 107.75 and 116% for IMP, CLT and TMX, respectively. | [125] |
ANN: artificial neural networks; BP-MLP: back-propagation multi-layer perceptron algorithm; CE: counter electrode; CV: cyclic voltammetry; DPV: differential pulse voltammetry; FKNN: fuzzy k-nearest neighbor algorithm; Fuzzy ARTMAP: Fuzzy adaptive resonance theory multidimensional map; LDA: linear discriminant analysis; LR: linear regression; LSV: linear sweep voltammetry; Nps: nanoparticles; PCA: principal component analysis; PLS: partial least squares; R2: determination coefficient; RBF: radial basis function; RE: reference electrode; R-value: correlation coefficient; SWCSV: square wave cathodic stripping voltammetry; SWV: square wave voltammetry; WE: working electrode.
Table 5.
Honey analysis using self-assembled lab-made multi-working electrodes voltammetric E-tongues.
Table 5.
Honey analysis using self-assembled lab-made multi-working electrodes voltammetric E-tongues.
| E-Tongue Sensors | Technique | Type of Application | Chemometric Approach and Performance | Ref. |
|---|---|---|---|---|
| - six WEs: gold, silver, platinum, palladium, tungsten, and titanium - one RE: Ag/AgCl saturated KCl - one CE: platinum electrode | MLAPV | Classification of honey samples, from the same geographical area, according to their botanical (Acacia, Astragali, Buckwheat, Coptis, Data, Motherwort and Vitex) | Pattern recognition techniques with feature extraction: - PCA, DFA and CA: the three methods based on the two databases have similar discrimination performances and the difference between the two databases has no effect to the separation ability | [112] |
| - six WEs: gold, silver, platinum, palladium, tungsten and titanium - one RE: Ag/AgCl saturated KCl - one CE: platinum electrode | MLAPV | Classification of honey samples according to their botanical (Acacia, Data, Motherwort and Buckwheat) and geographic (4 regions) origins | Pattern recognition techniques with feature extraction (12 variable features): - PCA and DFA: honey samples correctly grouped in 2-D principal components according to the floral origin or geographical origin Quantitative analysis: - PCR, PLSR and LS-SVM models (floral and geographical origins were coded, varying from 1 to 4): prediction R2 equal to 0.8924, 0.9887 and 0.9985, respectively | [91] |
| - seven WEs: noble metals (platinum, gold, palladium), non-noble metals (copper, glassy carbon, nickel) and reactive noble metal (silver) - one RE: Ag/AgCl electrode - one CE: platinum electrode | CV | Classification of honeys according to geographical (9 countries) and botanical (Lime green, Thyme, Rosemary, Natural blueberry, Saracen, Carob, Jujube, Mountain, Eucalyptus, Spurge, Orange and Polyfloral) origins Detection of honeys’ adulteration with sugar syrups | Pattern recognition techniques with feature extraction: - PCA: allowed to correctly discriminate honeys according to geographical or botanical origins, as well as to recognize all adulteration levels. - SVM: 100% success rate in the recognition of honeys of different geographical origins as well as of different botanical origins, for LOO-CV, as well as for the identification of adulterated honey - HCA: no errors or misclassifications of honey samples according to geographical or botanical origins as well as to distinguish between different classes of adulterated honey | [103] |
| - seven WEs: noble metals (platinum, gold, palladium), non-noble metals (copper, glassy carbon, nickel) and reactive noble metal (silver) - one RE: Ag/AgCl electrode - one CE: platinum electrode | CV | Classification of polyfloral honeys according to geographical origin (2 countries: Morocco and France) and type Quantitative prediction of biochemical and physicochemical profiles of honey samples (protein content, color intensity, phenols content, lactonic acidity, free acidity, total acidity, HMF (hydroxymethylfurfural) content, reducing sugars, total sugar, sucrose content) | Pattern recognition techniques with feature extraction (3 variable features): - PCA: successful discrimination of honeys according to geographical or botanical origins. - SVM: 100% success rate in the recognition of honeys of different geographical origins as well as of different botanical origins, for LOO-CV. - HCA: no errors or misclassifications of honey samples according to geographical or botanical origins. Quantitative analysis: - PLS: 0.821 ≤ R2 ≤ 0.998 0.015 ≤ NRMSE ≤ 0.184 2.306 ≤ RPD ≤ 7.658 | [104] |
| - four WEs: iridium, rhodium, platinum, gold - one RE: saturated calomel electrode - one CE: stainless steel circular piece | PV | Detection of honey adulteration with sugar syrups: monofloral honeys (heather, orange blossom and sunflower), syrup (rice, barley and corn), and adulterated honey (2.5, 5, 10, 20 and 40% of syrup) | Pattern recognition techniques: - PCA: voltammetric data allowed distinguishing pure honey, syrup, and different levels of adulterants Quantitative analysis: - PLS analysis: allowed to predict the level of the adulterants in each honey (sunflower honey adulterated with barley, corn or brown rice syrup: 0.949 ≤ R2 ≤ 0.997; orange blossom honey adulterated with barley, corn or brown rice syrup: 0.879 ≤ R2 ≤ 0.993; and, heather honey adulterated with barley, corn or brown rice syrup: 0.763 ≤ R2 ≤ 0.997) | [113] |
CA: clusters analysis; CE: counter electrode; CV: cyclic voltammetry; DFA: discriminant actor analysis; HCA: hierarchical cluster analysis; LOO-CV: leave-one-out cross-validation procedure; LS-SVM: least squared-support vector machines; MLAPV: multifrequency large amplitude pulse voltammetry; NRMSE: normalized root-mean-square error; PCA: principal component analysis; PCR: principal component regression; PLS: partial least squares; PLSR: partial least squares regression; PV: pulse voltammetry; R2: determination coefficient; RE: reference electrode; RPD: ratio of performance to deviation (ratio of the standard error in prediction to the standard deviation of the samples); SVM: support vector machines; WE: working electrode.
© 2018 by the authors. Licensee MDPI, Basel, Switzerland. This article is an open access article distributed under the terms and conditions of the Creative Commons Attribution (CC BY) license (http://creativecommons.org/licenses/by/4.0/).
Share and Cite
MDPI and ACS Style
Veloso, A.C.A.; Sousa, M.E.B.C.; Estevinho, L.; Dias, L.G.; Peres, A.M. Honey Evaluation Using Electronic Tongues: An Overview. Chemosensors 2018, 6, 28. https://doi.org/10.3390/chemosensors6030028
AMA Style
Veloso ACA, Sousa MEBC, Estevinho L, Dias LG, Peres AM. Honey Evaluation Using Electronic Tongues: An Overview. Chemosensors. 2018; 6(3):28. https://doi.org/10.3390/chemosensors6030028
Chicago/Turabian StyleVeloso, Ana C. A., Mara E. B. C. Sousa, Leticia Estevinho, Luís G. Dias, and António M. Peres. 2018. "Honey Evaluation Using Electronic Tongues: An Overview" Chemosensors 6, no. 3: 28. https://doi.org/10.3390/chemosensors6030028
Note that from the first issue of 2016, this journal uses article numbers instead of page numbers. See further details here.