Article

Selectivity of Catalytically Modified Tin Dioxide to CO and NH3 Gas Mixtures

Chemistry Department, Moscow State University, Vorobyevy gory 1-3, Moscow 119991, Russia
*
Author to whom correspondence should be addressed.
Chemosensors 2015, 3(4), 241-252; https://doi.org/10.3390/chemosensors3040241
Submission received: 2 September 2015 / Revised: 25 September 2015 / Accepted: 28 September 2015 / Published: 9 October 2015
(This article belongs to the Special Issue Chemical Vapor Sensing)

Abstract

:
This paper is aimed at selectivity investigation of gas sensors, based on chemically modified nanocrystalline tin dioxide in the detection of CO and ammonia mixtures in air. Sol-gel prepared tin dioxide was modified by palladium and ruthenium oxides clusters via an impregnation technique. Sensing behavior to CO, NH3 and their mixtures in air was studied by in situ resistance measurements. Using the appropriate match of operating temperatures, it was shown that the reducing gases mixed in a ppm-level with air could be discriminated by the noble metal oxide-modified SnO2. Introducing palladium oxide provided high CO-sensitivity at 25–50 °C. Tin dioxide modified by ruthenium oxide demonstrated increased sensor signals to ammonia at 150–200 °C, and selectivity to NH3 in presence of higher CO concentrations.

Graphical Abstract

1. Introduction

Lack of selectivity is a major drawback of semiconductor metal oxide gas sensors. Nanocrystalline tin dioxide is one of the most utilized materials for such devices due to a combination of appropriate structural, adsorptive, and electrophysical properties [1]. The material, possessing several advantages, such as large active surface area and surface-to-volume ratio, result in high gas sensitivity, stability in air, and low cost, makes it challenging to improve selectivity [2]. The problem of selectivity is complicated by the fact that most toxic gases (CO, NH3, H2S, volatile organic compounds) are the reducing ones. The sensor response to these gases is determined by the molecules oxidation on the material surface.
There are several tools to improve the sensitivity and selectivity of the detection of reducing gases. These include modulation of temperature regime of sensors operation, such as pulsed-temperature [3] or cycled-temperature regime [4]. Another approach is the modulation of the sensor measurement principle. For example, measuring voltage fluctuations instead of DC-resistance of nanocrystalline PdxWO3-based sensors was shown to be hundreds of times more sensitive to the presence of ethanol vapor [5]. In environmental applications there is the need to selectively detect traces of reducing gases mixed in air, e.g., to discriminate toxic, fire alarming gases, food quality indicators, disease markers, etc. [6]. A promising tool to meet this challenge is the development of artificial olfaction systems (electronic nose). Such systems are based on a network of sensors operated in similar or different temperature modes. The treatment of multidimensional data from sensors networks requires a pattern recognition algorithm, such as principal component analysis [6]. In a recent review by Seifert et al., new mathematic algorithms for calibration and pattern recognition of sensor networks were demonstrated, the procedures being efficient for components concentration evaluation in gas mixtures composed of volatile organic compounds [7]. The operation temperature regime is also important in sensors networks: it was established that ammonia leakages could be selectively detected in the presence of water vapor, using commercial tin dioxide-based sensors operated in a linear heating–cooling mode [8]. On the other hand, in multisensory networks, it is reasonable to combine sensors with specific sensitivities to target gases. In this case, the “orthogonal” data from different sensors would be beneficial for the detection of various target gases and reliable discrimination of their mixtures. Thus, improving sensing materials’ selectivities is a challenge, not only for individual gas sensors, but also for sensor network systems.
An efficient approach to improve the selectivity of a gas sensing material is the chemical modification of a semiconductor oxide [2,9]. Catalytic additives of noble metals have been established as efficient modifiers, enhancing sensitivity and selectivity to reducing gases, e.g., to CO the efficient modifiers are Pd [10,11,12,13], Au [14,15], Pt [16]; to H2S—CuO [17]; to NH3—RuO2 [18]; to LPG—Pd [19], Au [20]. However, the appropriate choice of a modifier is a non-trivial issue, since in the complex process of gas sensing not only the catalytic activity of clusters, but also their interference with the oxide surface sites, defines the sensor characteristics of modified material [21,22]. In our recent works, we demonstrated that nanocrystalline tin dioxide modification by palladium oxide increased sensor responses to CO at as low temperature as room temperature [23]; while introducing ruthenium oxide provided high responses to NH3 at a raised temperature [24]. However, these studies dealt with individual gases. The specific sensitization to CO and NH3 motivated an interest to appreciate whether the catalytic additives bring about enough selectivity to allow for distinguishing these reducing gases mixed together in a ppm-concentration level.
In the present work, the cross-sensing behavior of nanocrystalline SnO2 modified by palladium and ruthenium oxides to CO + NH3 gas mixtures in air was studied to estimate the selectivity.

2. Experimental Section

Nanocrystalline SnO2, SnO2/PdOx, and SnO2/RuOy materials were used for the study. Tin dioxide was synthesized using the aqueous ammonia-assisted sol-gel route [23]. 0.3 M solution of tin (IV) chloride in deionized water was obtained using SnCl4∙5H2O (>99% pure, Sigma-Aldrich). 1 M ammonia solution was rapidly added until pH 6 was reached, after that, the deposit of α-stannic acid was left for 1 h at room temperature. Next, it was separated by centrifugation and washed several times with deionized water to remove chloride-ions (check by AgNO3 solution). The washed SnO2·nH2O deposit was dried at 50 °C overnight and annealed in air at 300 °C for 24 h. Chemical modification of nanocrystalline tin dioxide by 1 wt.% of PdOx or RuOy was performed via the impregnation of as-obtained SnO2 powder by ethanol solution of noble metal acetylacetonate precursors. The impregnated samples, SnO2/Pd(acac)2 and SnO2/Ru(acac)3, were calcined at 225 °C and 265 °C, respectively, to decompose the modifier precursors at a sufficiently lower temperature [25,26].
The concentration of noble metal modifiers was measured by ICP-assisted analysis using a quadruple mass-spectrometer 7500c (“Agilent”). For this purpose, the powders were alloyed with zinc and then dissolved in nitric acid under heating. The measurements were performed for five isotopes of each modifier, and the signal were registered at mass numbers: for Pd at 104, 105, 106, 108, 110; and for Ru at 96, 98, 100, 101, 102. The micrographs of the nanocomposites were obtained using high-resolution transmission electron microscopy (HRTEM), high angle annular dark field scanning transmission electron microscopy (HAADF-STEM), and energy-dispersive X-ray (EDX) analysis with a Tecnai G2 transmission electron microscope operated at 200 kV. Characterization of the samples by X-ray diffraction (XRD), electron diffraction (ED), X-ray absorption spectroscopy (XANES and EXAFS), X-ray photoelectron spectroscopy (XPS), and electron paramagnetic resonance (EPR) were described in our previous publications [23,24,25,26,27]. The composition and microstructure parameters of the samples are summarized in Table 1.
Sensor tests were performed by in situ measurements of the sensors’ DC-resistance at temperatures in the range of 25–250 °C and with controlled gas composition. To prepare the sensors, the sample powders were mixed with a binder (terpeniol). The paste was thick film-deposited onto alumina microelectronic hotplates, which provided vapor-deposited rectangular-shaped Pt contacts (0.3 × 0.2 mm) separated by a 0.2 mm gap and with embedded Pt-heaters. The sensing layer (5–7 micrometres thick) covered an area of 1.0 × 0.5 mm. The sensors were placed in the gas-purged (100 mL/min) chamber of a resistance-measuring device. Before measurements, the sensors were annealed at 200 °C for 14 h under purified air to remove the binder and to clean the surface from atmospheric impurities. Test gas was purged through the chamber in a pulsed regime: background gas–test gas–background gas. A purified air generator (model 1,2-3,5, “Himelectronica”, Russia) was used as the source of the background gas; the contaminations level is not exceeding: 10 ppm H2O, 2 ppm CO2, 0.1 ppm hydrocarbons. The test gas sources were certified gas mixtures (“Linde-Gas”, Moscow, Russia): CO (517 ± 12 ppm): N2 and NH3 (209 ± 8 ppm): air. Exposure time in test gas was 15 min, recovery time in air was 30 min. The cycled target gas exposure was performed three to four times for reproducibility. The concentrations of analytes were 2–50 ppm CO and 0.4–50 ppm NH3 in the analyses of individual gases. The dilution of target gases in purified air was performed using mass-flow controllers (“Bronkhorst”). The sensor signal was defined as a ratio of sensor resistance in background gas (Rair) to that in test gas (Rgas):
S = Rair/Rgas
For selectivity tests, the mixtures of CO + NH3 with component concentrations, varied in the range of 5–20 ppm in air, were prepared. Sensors were operated at constant temperatures, corresponding to the maximum sensitivity to individual gases: SnO2 at 250 °C, SnO2/PdOx at 50 °C, and SnO2/RuOy at 200 °C.

3. Results and Discussion

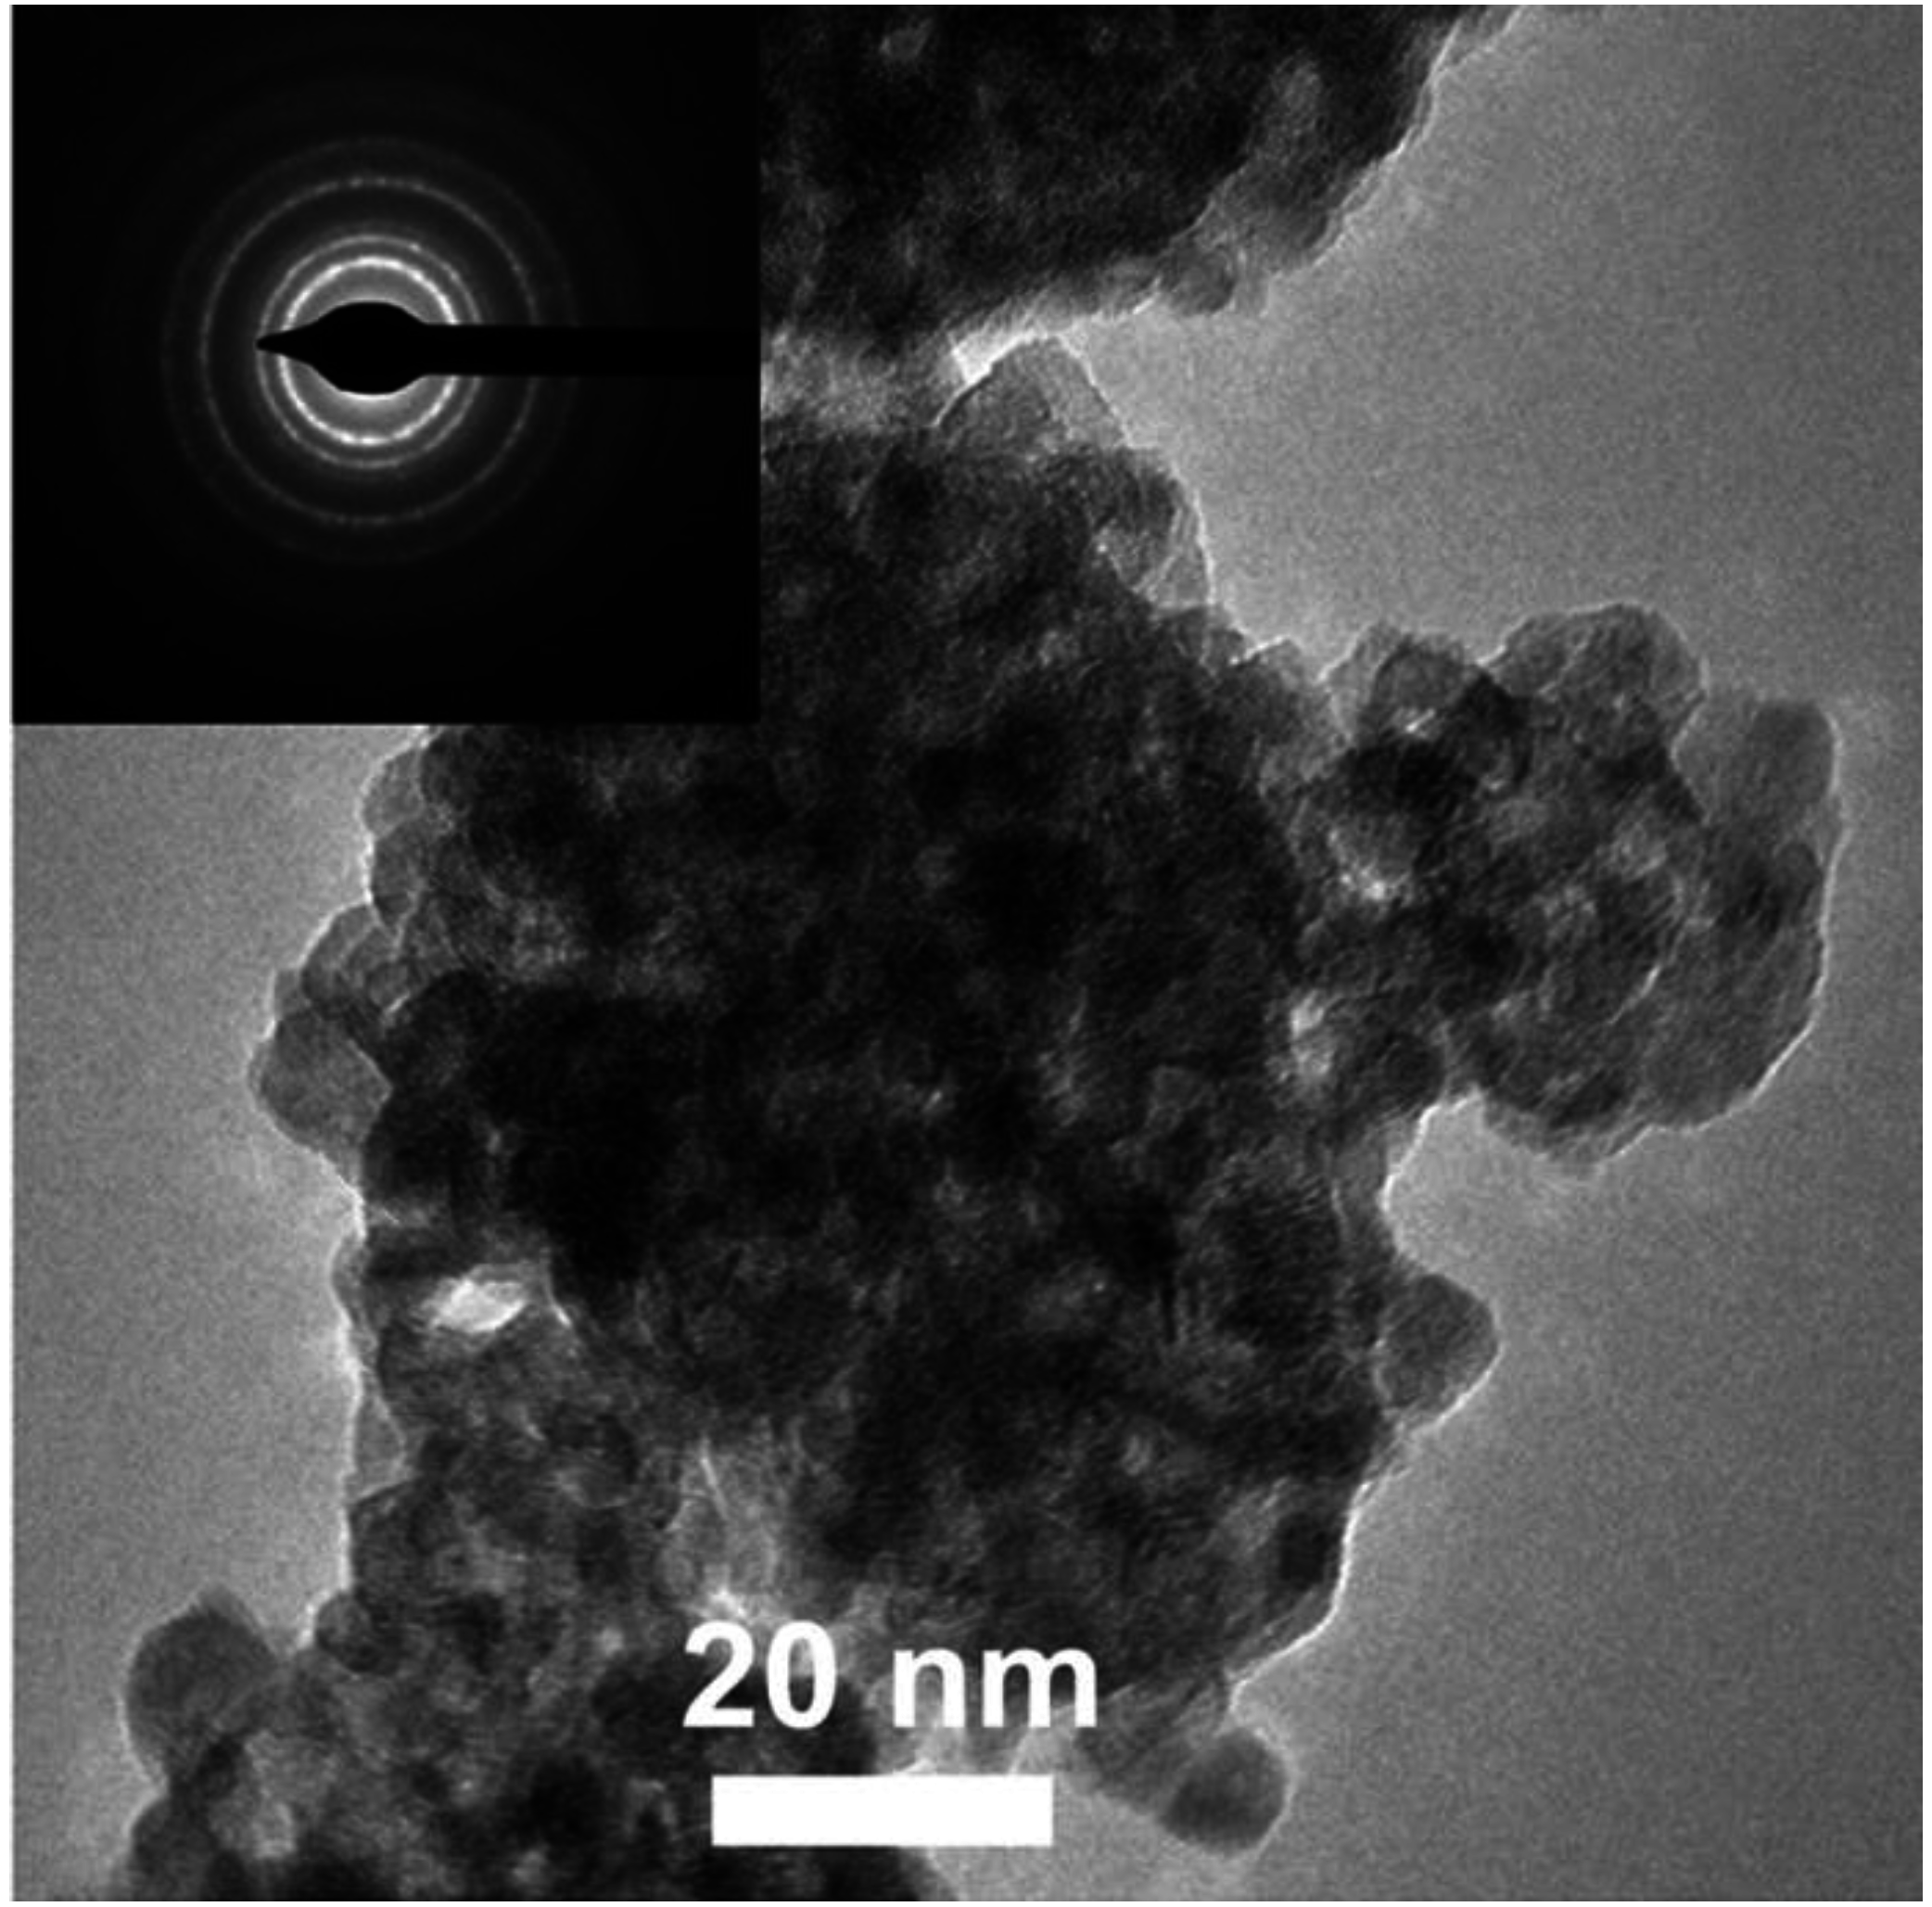
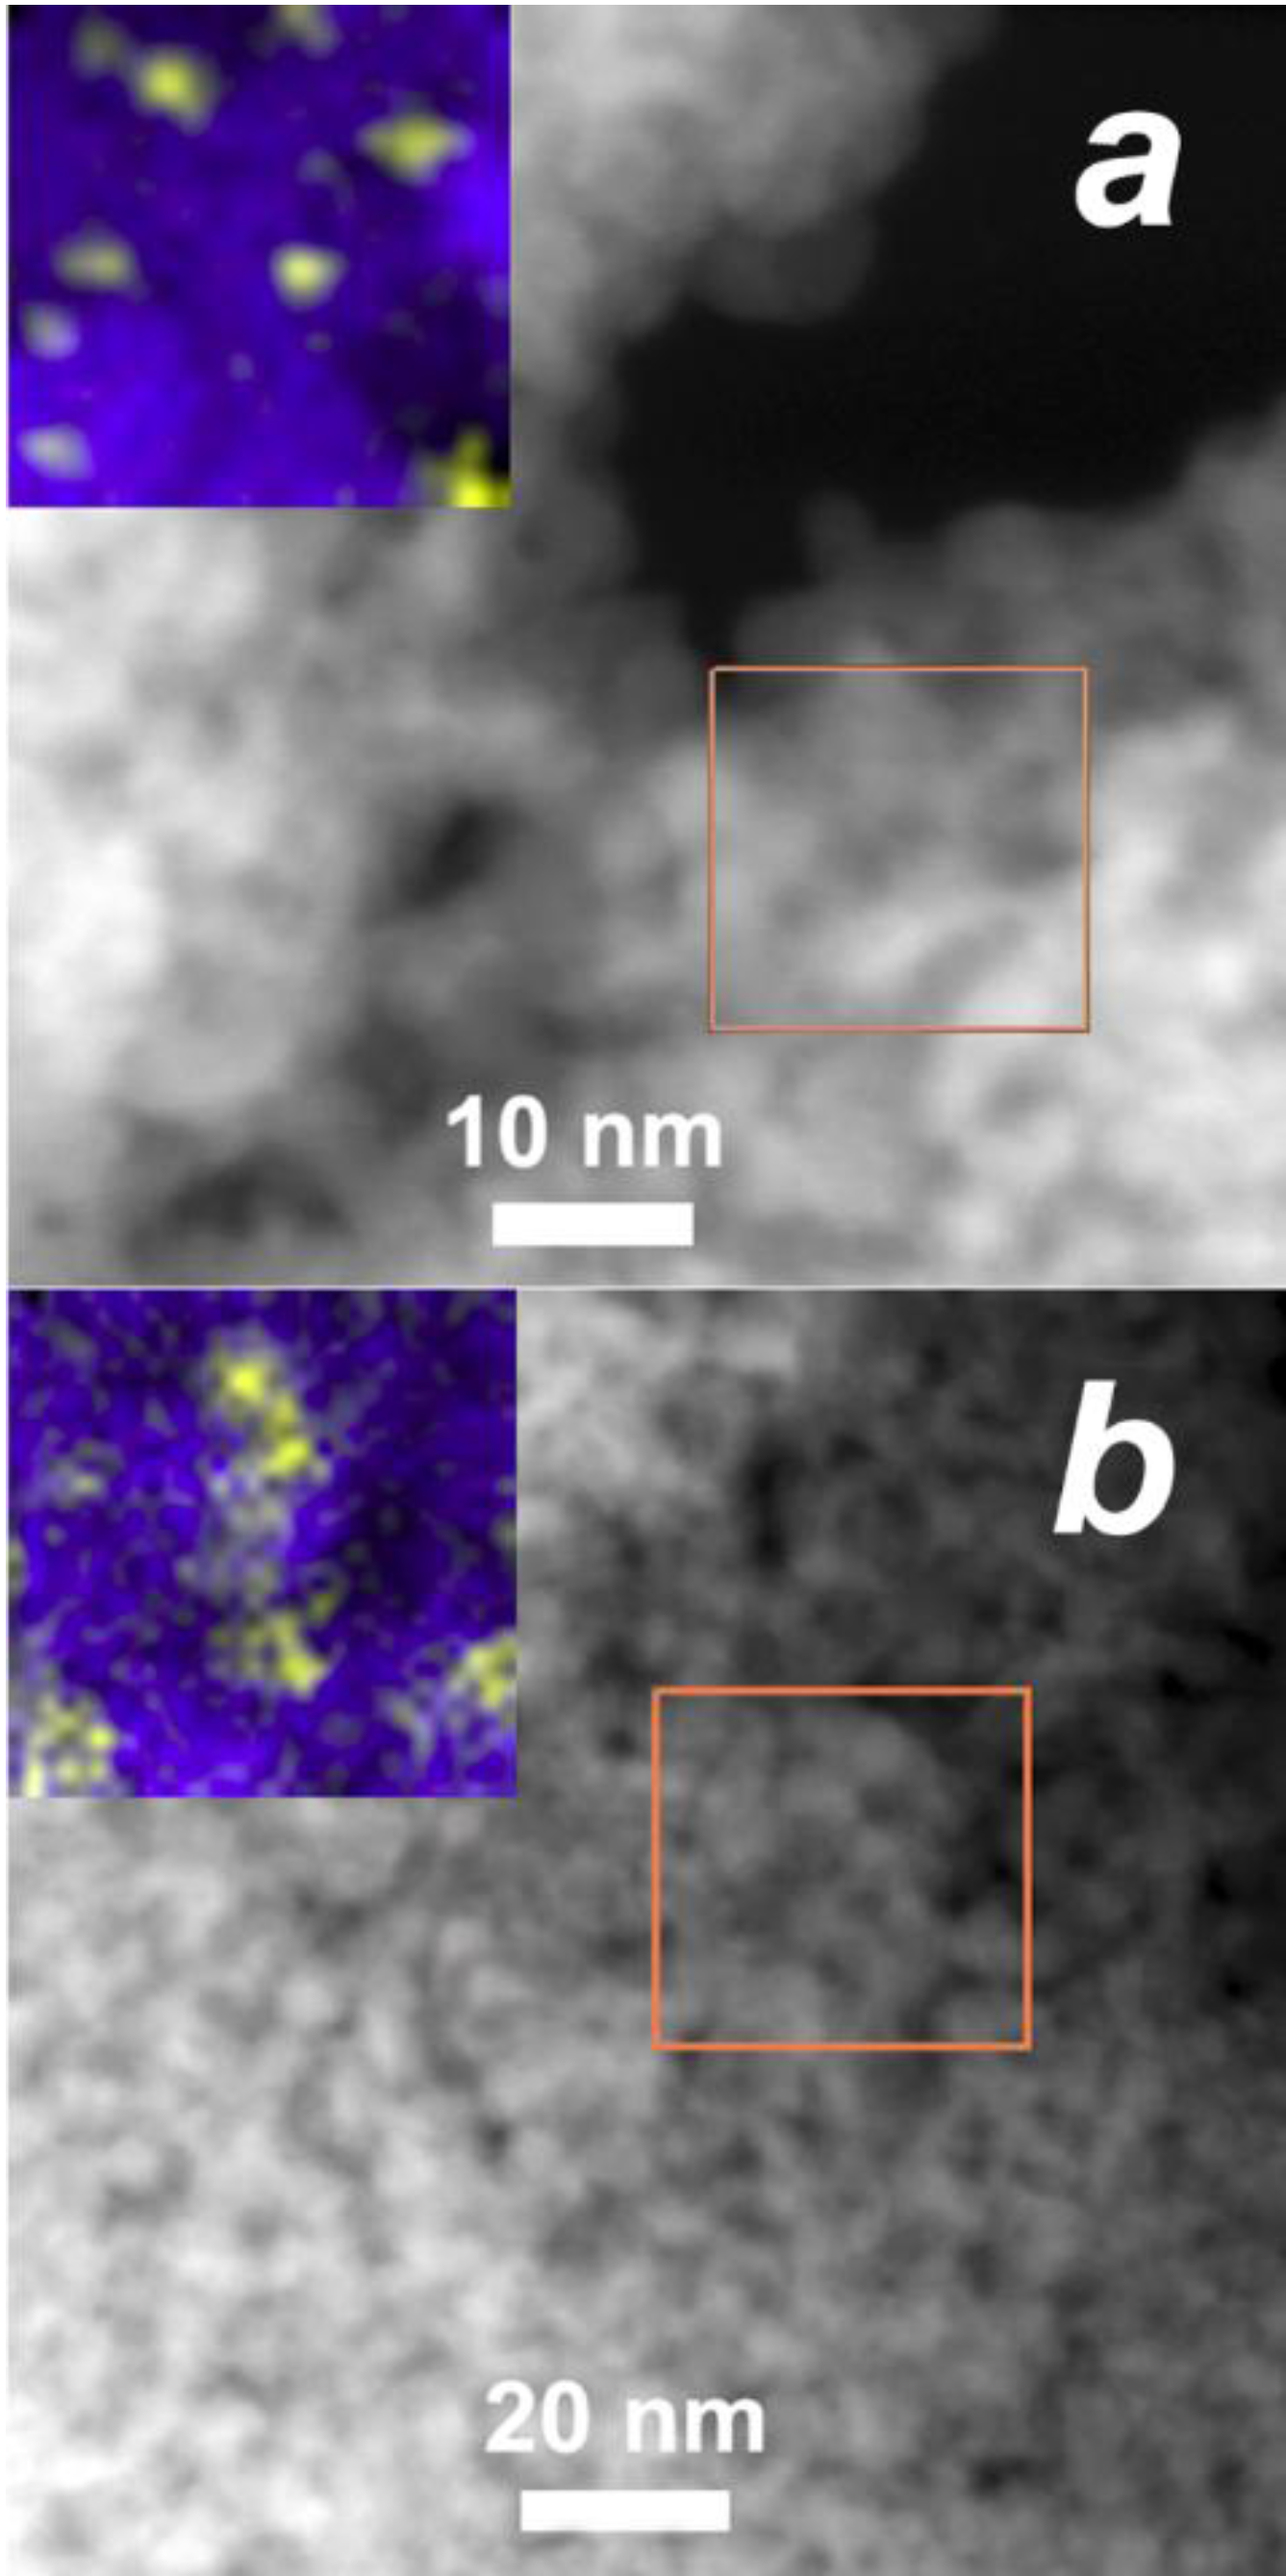
3.1. Materials Composition and Microstructure

As was shown by diffraction techniques (Table 1), the samples contain one crystalline phase of cassiterite (SnO2), with an average crystallite size of 3–6 nm. Due to small concentrations, the additives could not be detected by XRD or ED. Using XPS, XANES, EXAFS, and EPR, the modifiers were shown to exist in the form of mixed-valence noble metal oxides, which could be formalized as PdOx and RuOy, respectively. The techniques allowed estimation of the fractions of different oxidation states of palladium and ruthenium in the nanocomposites (Table 1). The total concentration of Pd and Ru, measured by ICP-mass spectrometry, is close to the loaded amount of 1 wt.%. The additives could not be visualized on HRTEM images (Figure 1), presumably due to close atomic numbers with Sn, and, hence, close contrast with the support on the electronic micrographs. Using EDX-mapping with HAADF-STEM, the modifiers were observed in the form of clusters on the surface of agglomerated tin dioxide nanoparticles (Figure 2a,b). The size of PdOx and RuOy clusters were estimated at 1–5 nm, while those of aggregates of tin dioxide particles reached 20–80 nm. Previously, we demonstrated micrographs of PdOx clustered on SnO2 crystallites with a size of more than 50 nm (tin dioxide annealed at 700 °C) that was detectable by HRTEM [27].
Figure 1. HRTEM micrograph of SnO2/PdOx sample; inset—electron diffraction pattern.
Chemosensors 03 00241 g001
Table 1. Materials composition and microstructure parameters.
SampleCrystalline Phase aModifier Content and CompositionParticle Size, nmBET Area, m2/g
Total Concentration b, wt.%Oxidation and Crystalline State c, at.% from Total Modifier ConcentrationSnO2Modifier e
(dXRD)a(dTEM)d
SnO2SnO23–62–895–100
SnO2/PdOx0.94 ± 0.0570 at.%––PdO (amorphous)
25 at.%––Pd0
5 at.%––Pd3+
3–51–390–95
SnO2/RuOy0.81 ± 0.0580 at.%––RuO2 (structured)
20 at.%––Ru3+
3–52–590–95
a According to XRD and electron diffraction [23,24,26,27];b from ICP-mass spectrometry analysis;c estimated by XANES, EXAFS, XPS and EPR [23,24,25,27],d from HRTEM;e evaluated by HAADF-STEM and EDX-mapping.
Figure 2. HAADF-STEM images of (a) SnO2/PdOx and (b) SnO2/RuOy samples; inset—EDX maps of selected areas (blue—Sn, yellow—noble metal).
Chemosensors 03 00241 g002

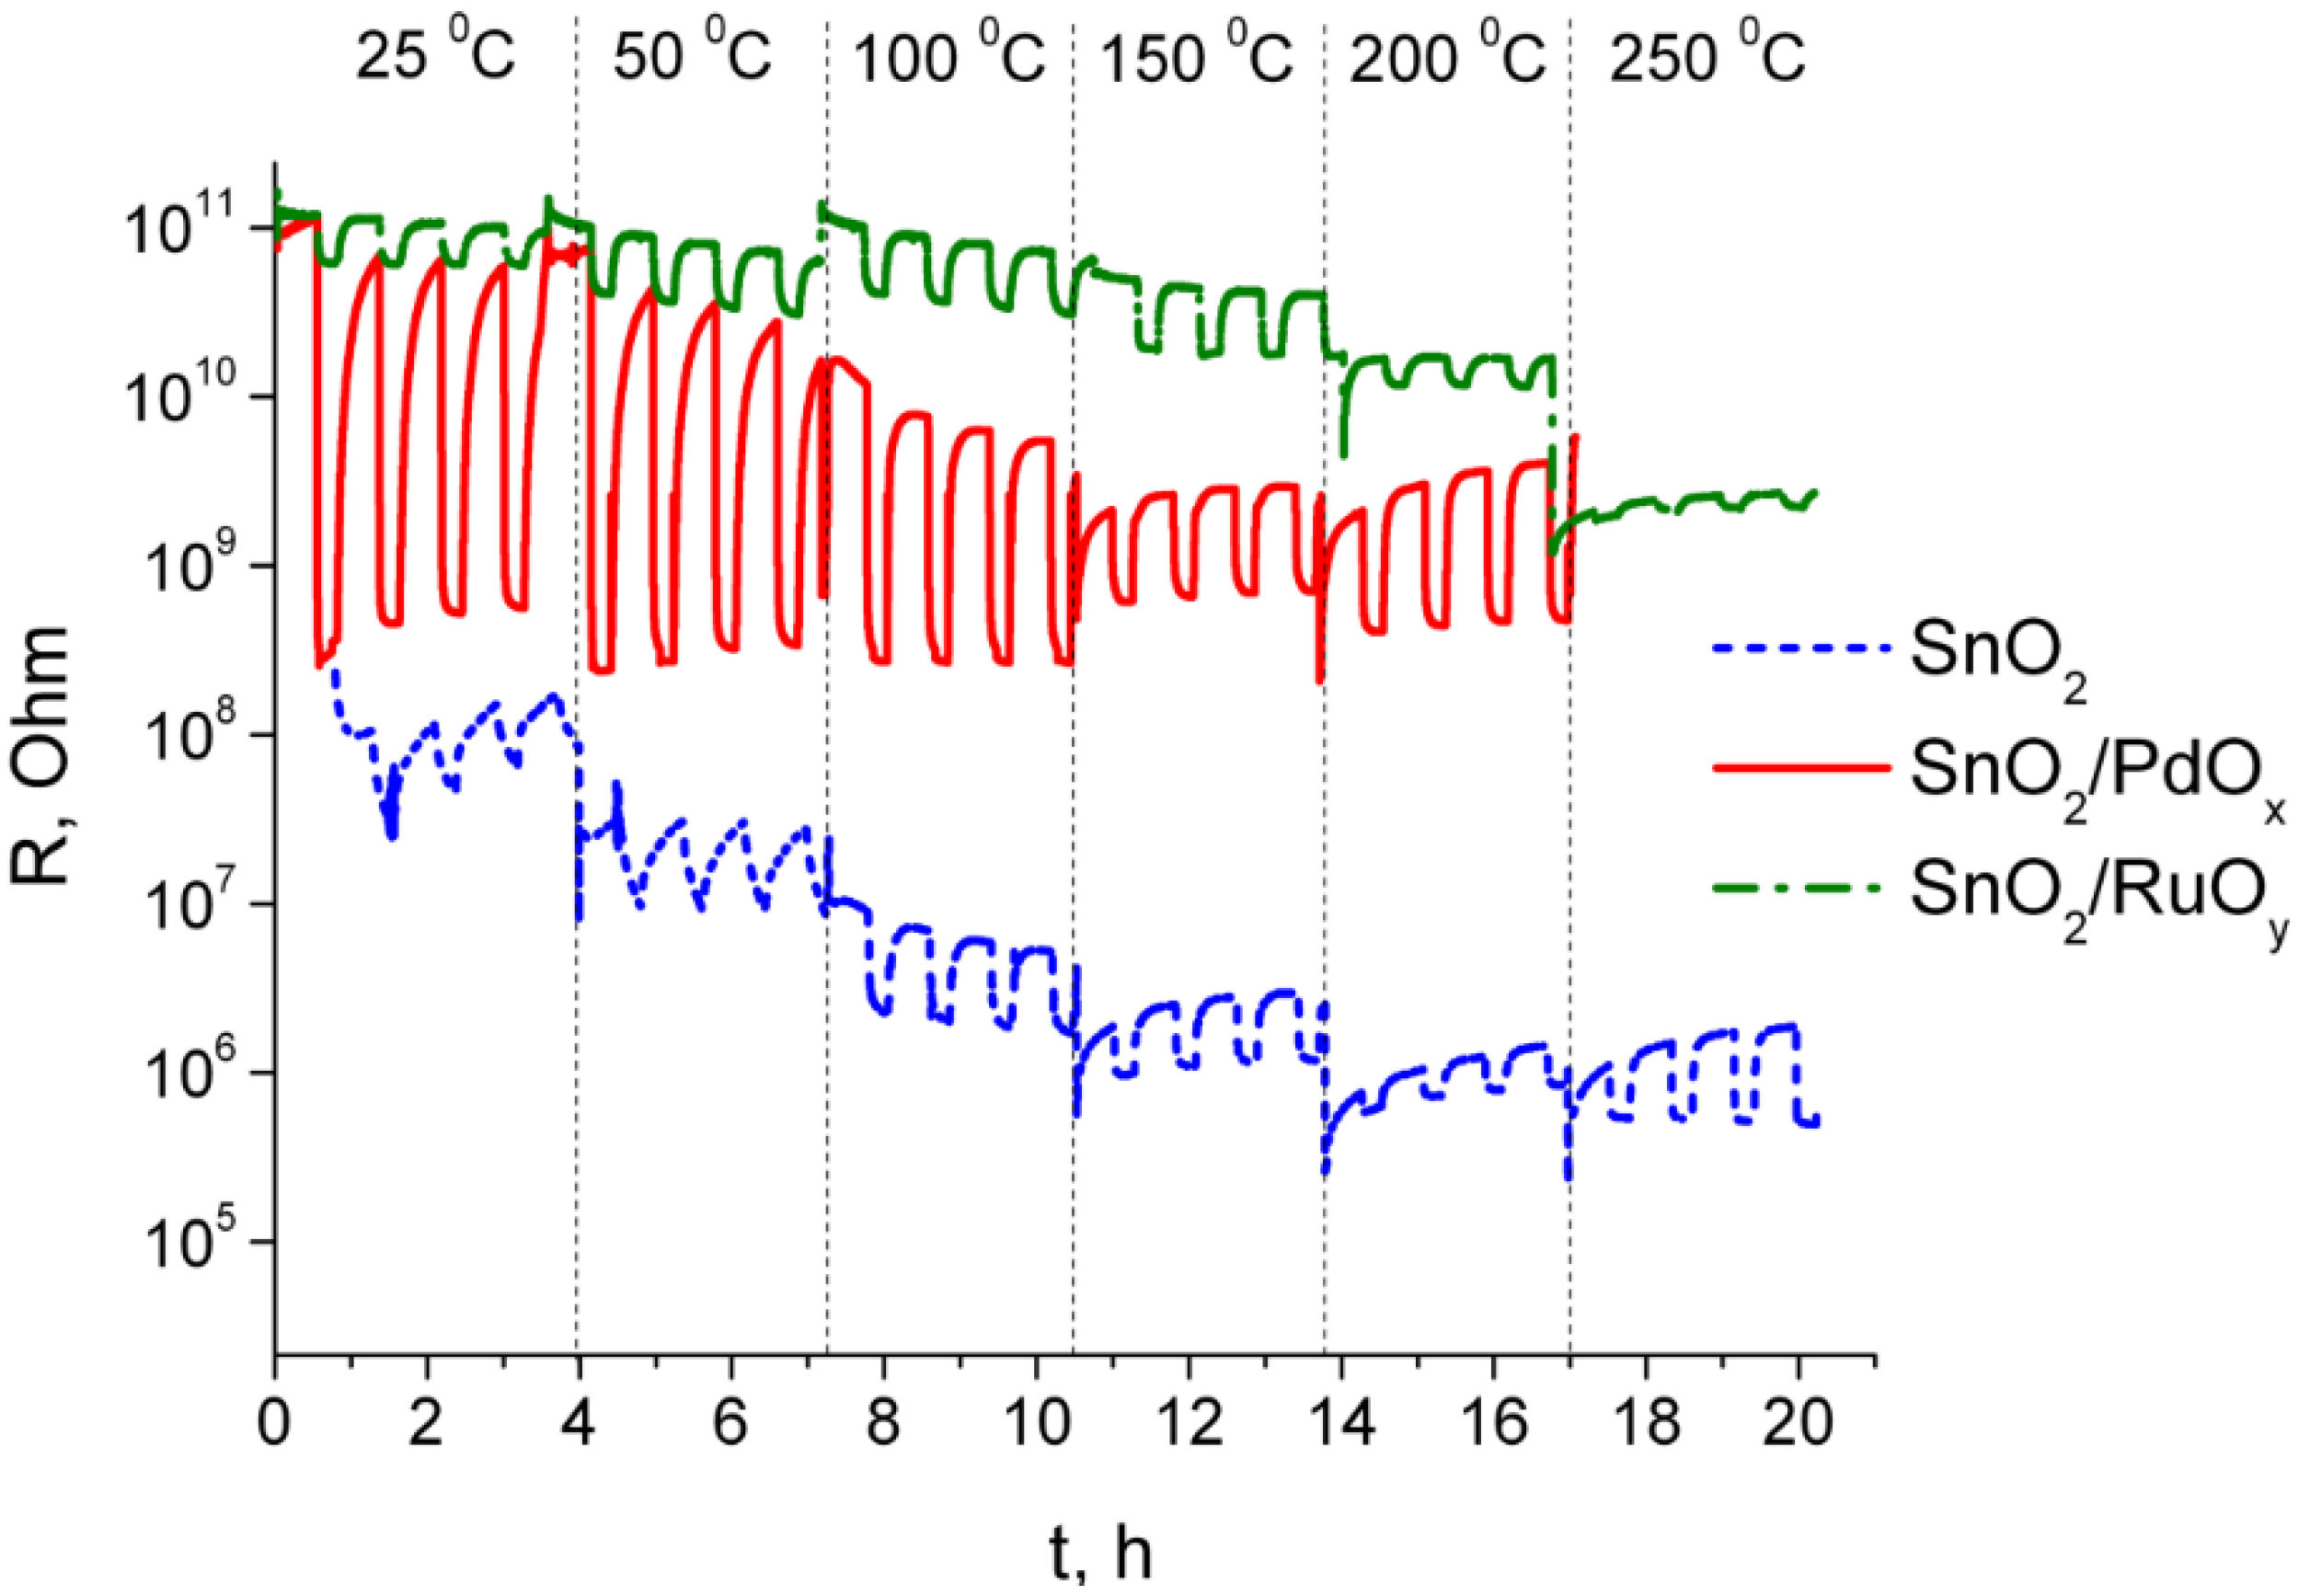
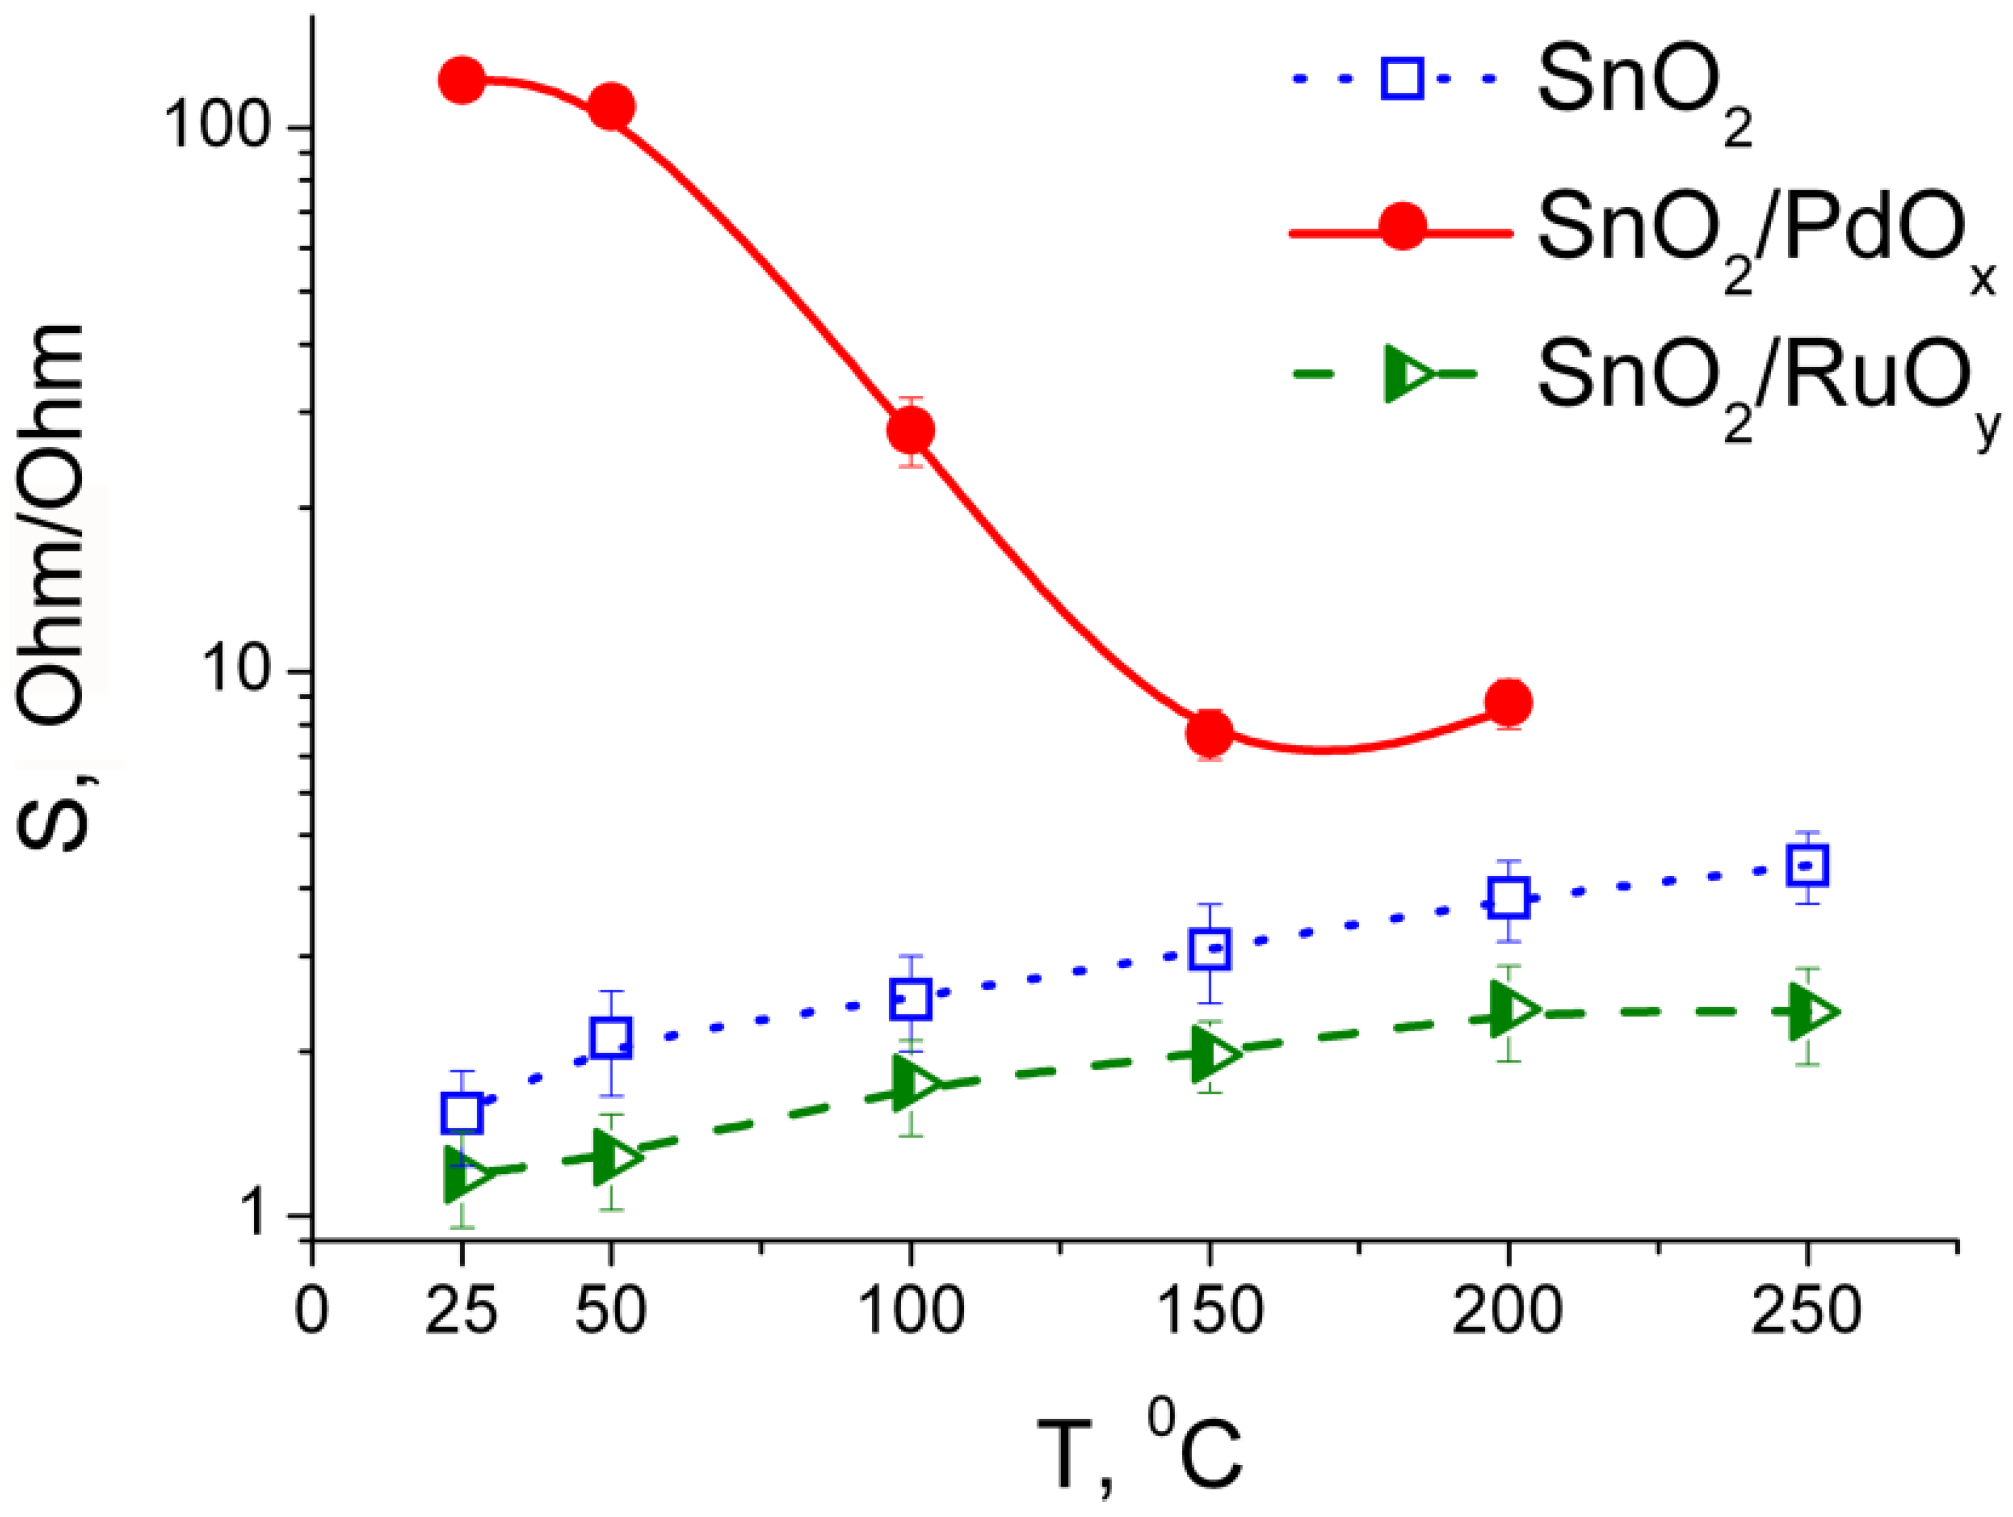
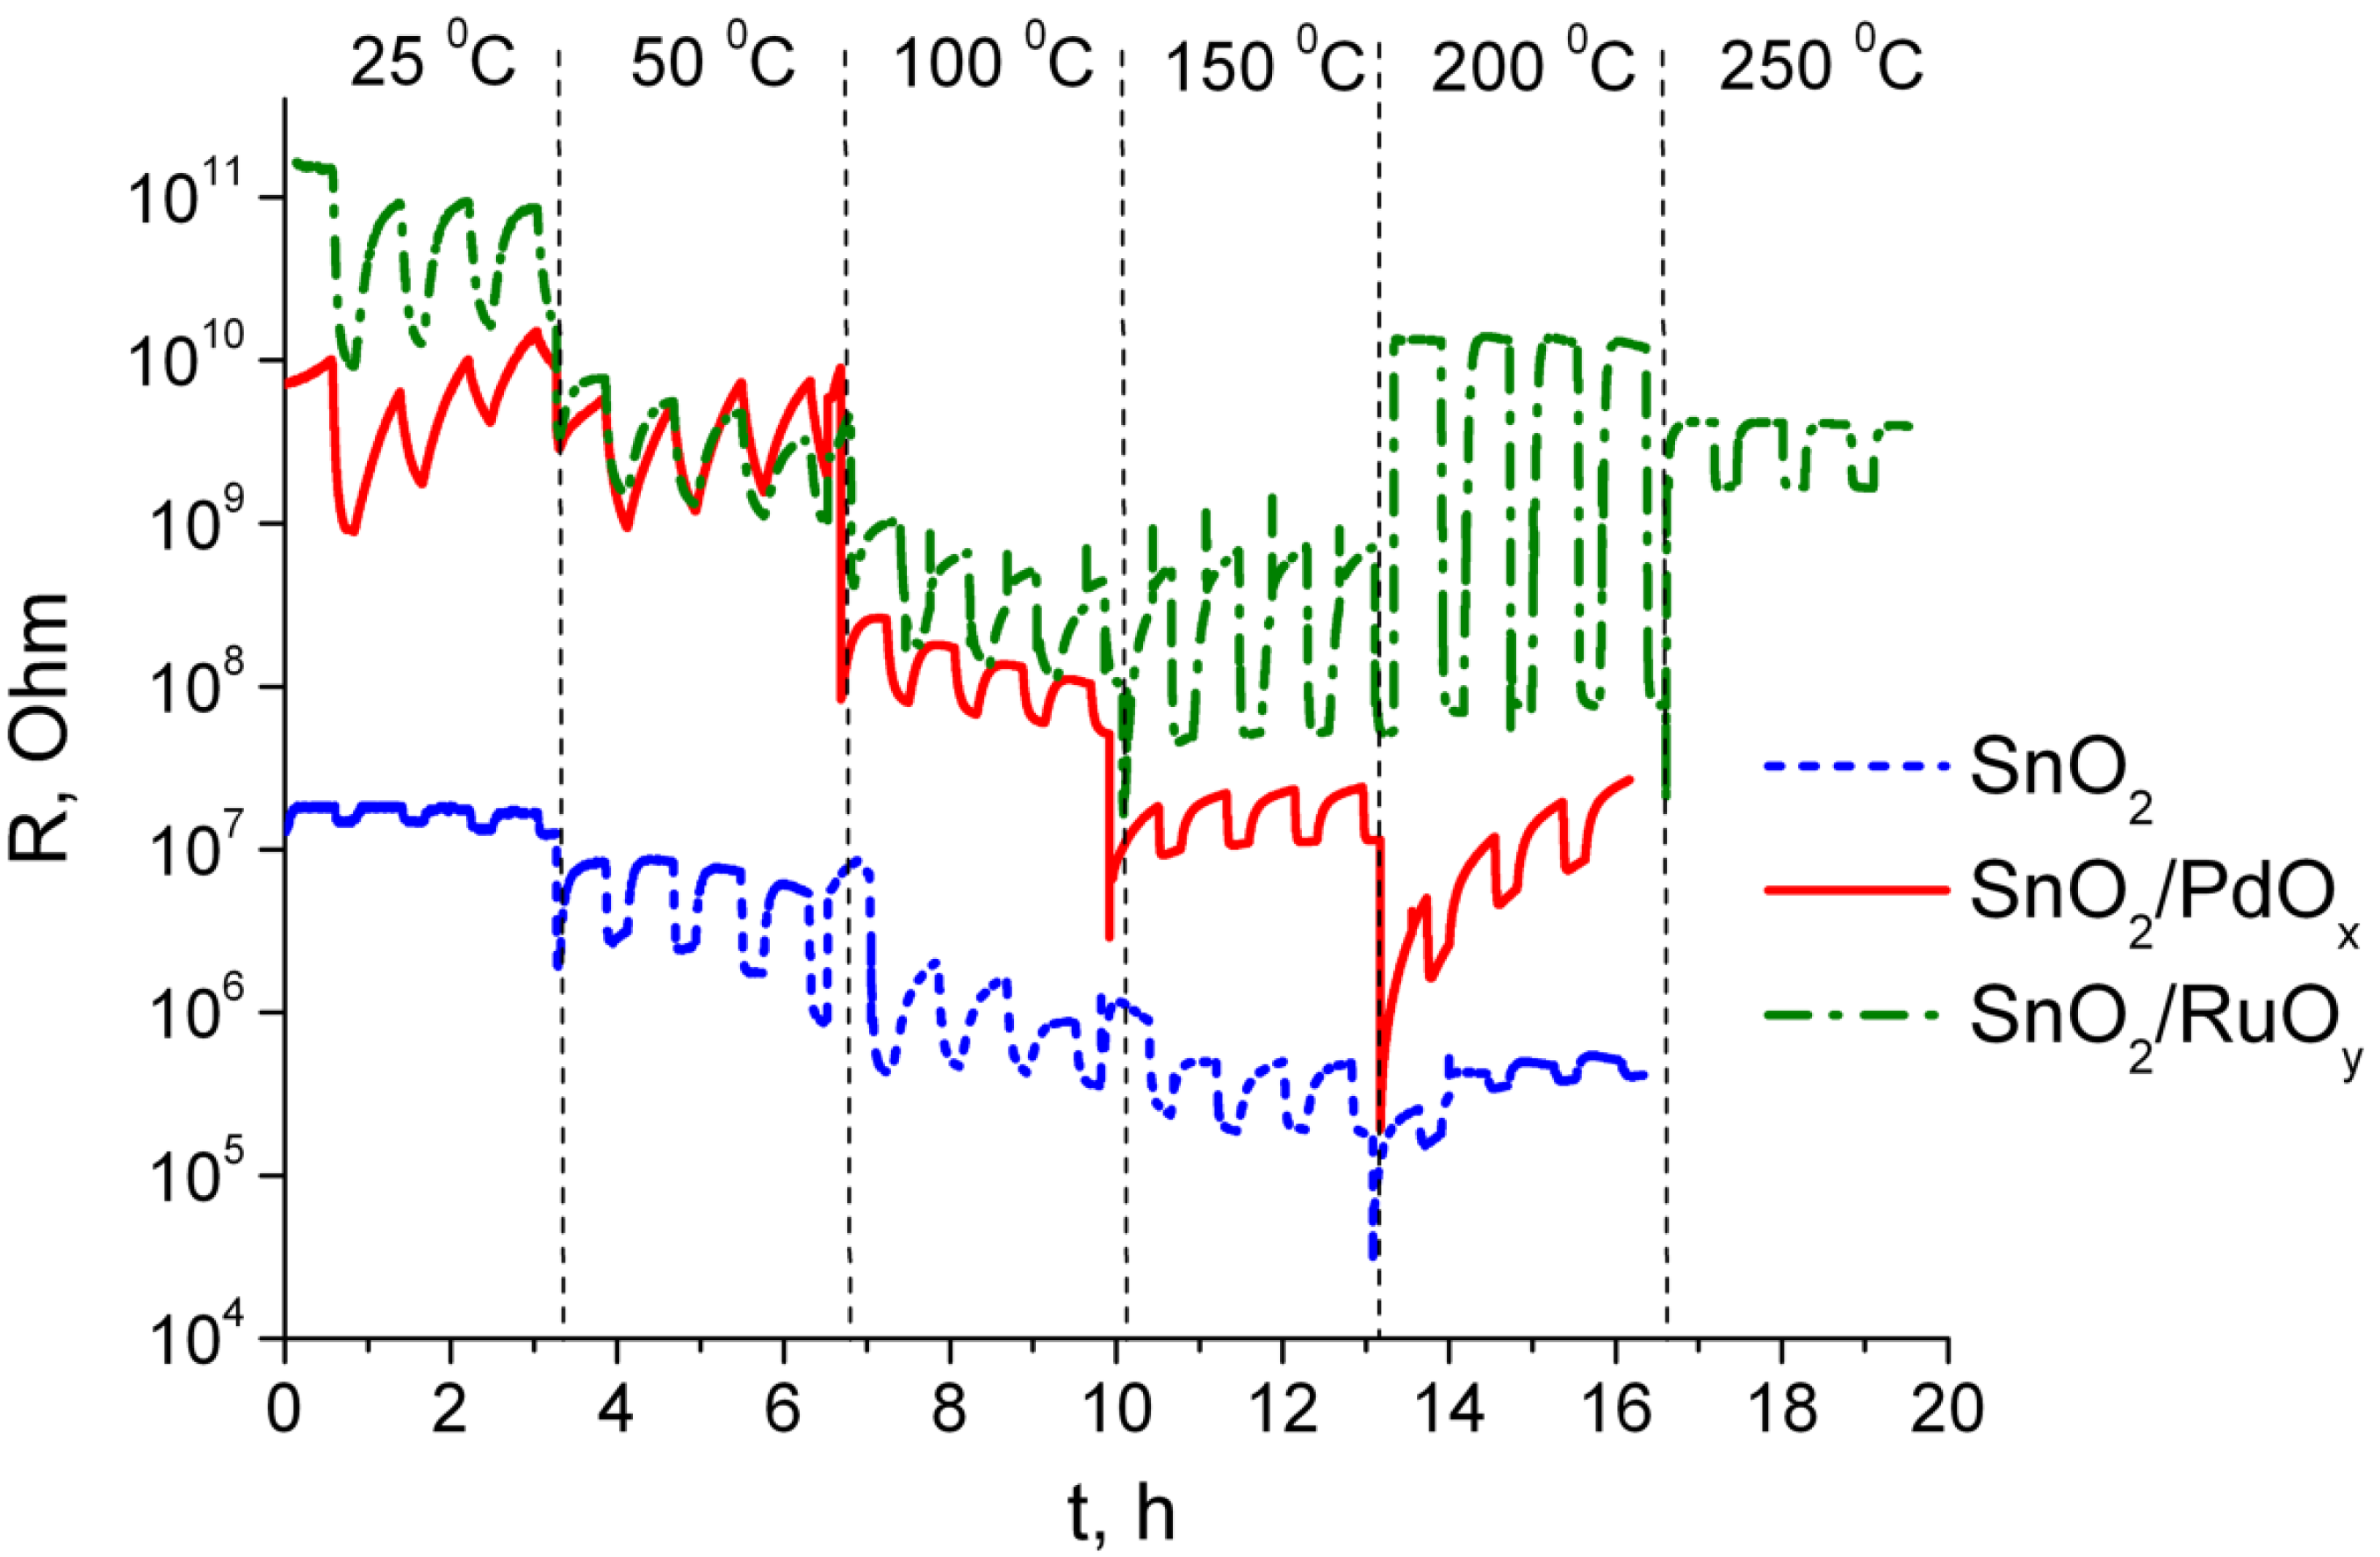
3.2. Sensing Behavior to Individual CO and NH3 Gases

The influence of PdOx and RuOy catalytic clusters on the sensitivity of nanocrystalline tin dioxide to CO and NH3 was compared from the sensing tests to individual gases. Figure 3 and Figure 4 illustrate the dynamic resistance response of SnO2, SnO2/PdOx, and SnO2/RuOy sensors to 50 ppm of CO or NH3 at variable operating temperatures of 25–250 °C. The highest responses to CO were observed for PdOx-modified tin dioxide in the whole temperature range (Figure 3). At a lower temperature region (25–50 °C), the sensitivity of SnO2/PdOx increased, however, the response kinetics were poor: the recovery time, i.e., time needed to reach 90% of resistance value in air (Rair) when the target gas is switched off, increased from τ90 ~ 10 min at T = 200 °C to τ90 ~ 25 min at room temperature.
Figure 3. Dynamic resistance response of SnO2, SnO2/PdOx, and SnO2/RuOy sensors to the pulses of 50 ppm CO in air at different temperatures.
Chemosensors 03 00241 g003
Figure 4. Dynamic resistance response of SnO2, SnO2/PdOx, and SnO2/RuOy sensors to the pulses of 50 ppm NH3 in air at different temperatures.
Chemosensors 03 00241 g004
The response of SnO2/PdOx to 50 ppm NH3 was low and unstable, especially at low temperature (Figure 4). Low responses with long response (τ90 > 10 min) and recovery (τ90 > 25 min) time were characteristic for all the sensors when detecting NH3 at T = 25–50 °C. Raising the operating temperature resulted in the increase of sensitivity to NH3, most prominently for SnO2/RuOy sensor (Figure 4). Corresponding sensor signals to 50 ppm of CO and NH3, calculated via Equation (1), are plotted in Figure 5 and Figure 6, respectively, as a function of operating temperature. SnO2/PdOx demonstrated the highest sensor signals to CO compared to other samples, with the maximum at T = 25–50 °C (Figure 5). SnO2/RuOy was characterized by superior signals to ammonia, with the maximum at T = 200 °C (Figure 6). Since the samples are characterized by quite close particle sizes and BET area values (Table 1), the sensitization effects are due to the influence of catalytic modifiers on the interaction of materials’ surfaces with target gas molecules, rather than their affecting the materials’ microstructure. Recently, we reported on the specific promoting effect of PdOx and RuOy clusters on the active sites on the surface of nanocrystalline tin dioxide [28]. This should be an important factor controlling the specificity of materials’ interaction with gases.
Figure 5. Temperature dependence of sensor signals of nanocrystalline SnO2, SnO2/PdOx, and SnO2/RuOy samples to 50 ppm CO.
Chemosensors 03 00241 g005
Figure 6. Temperature dependence of sensor signals of nanocrystalline SnO2, SnO2/PdOx, and SnO2/RuOy samples to 50 ppm NH3.
Chemosensors 03 00241 g006

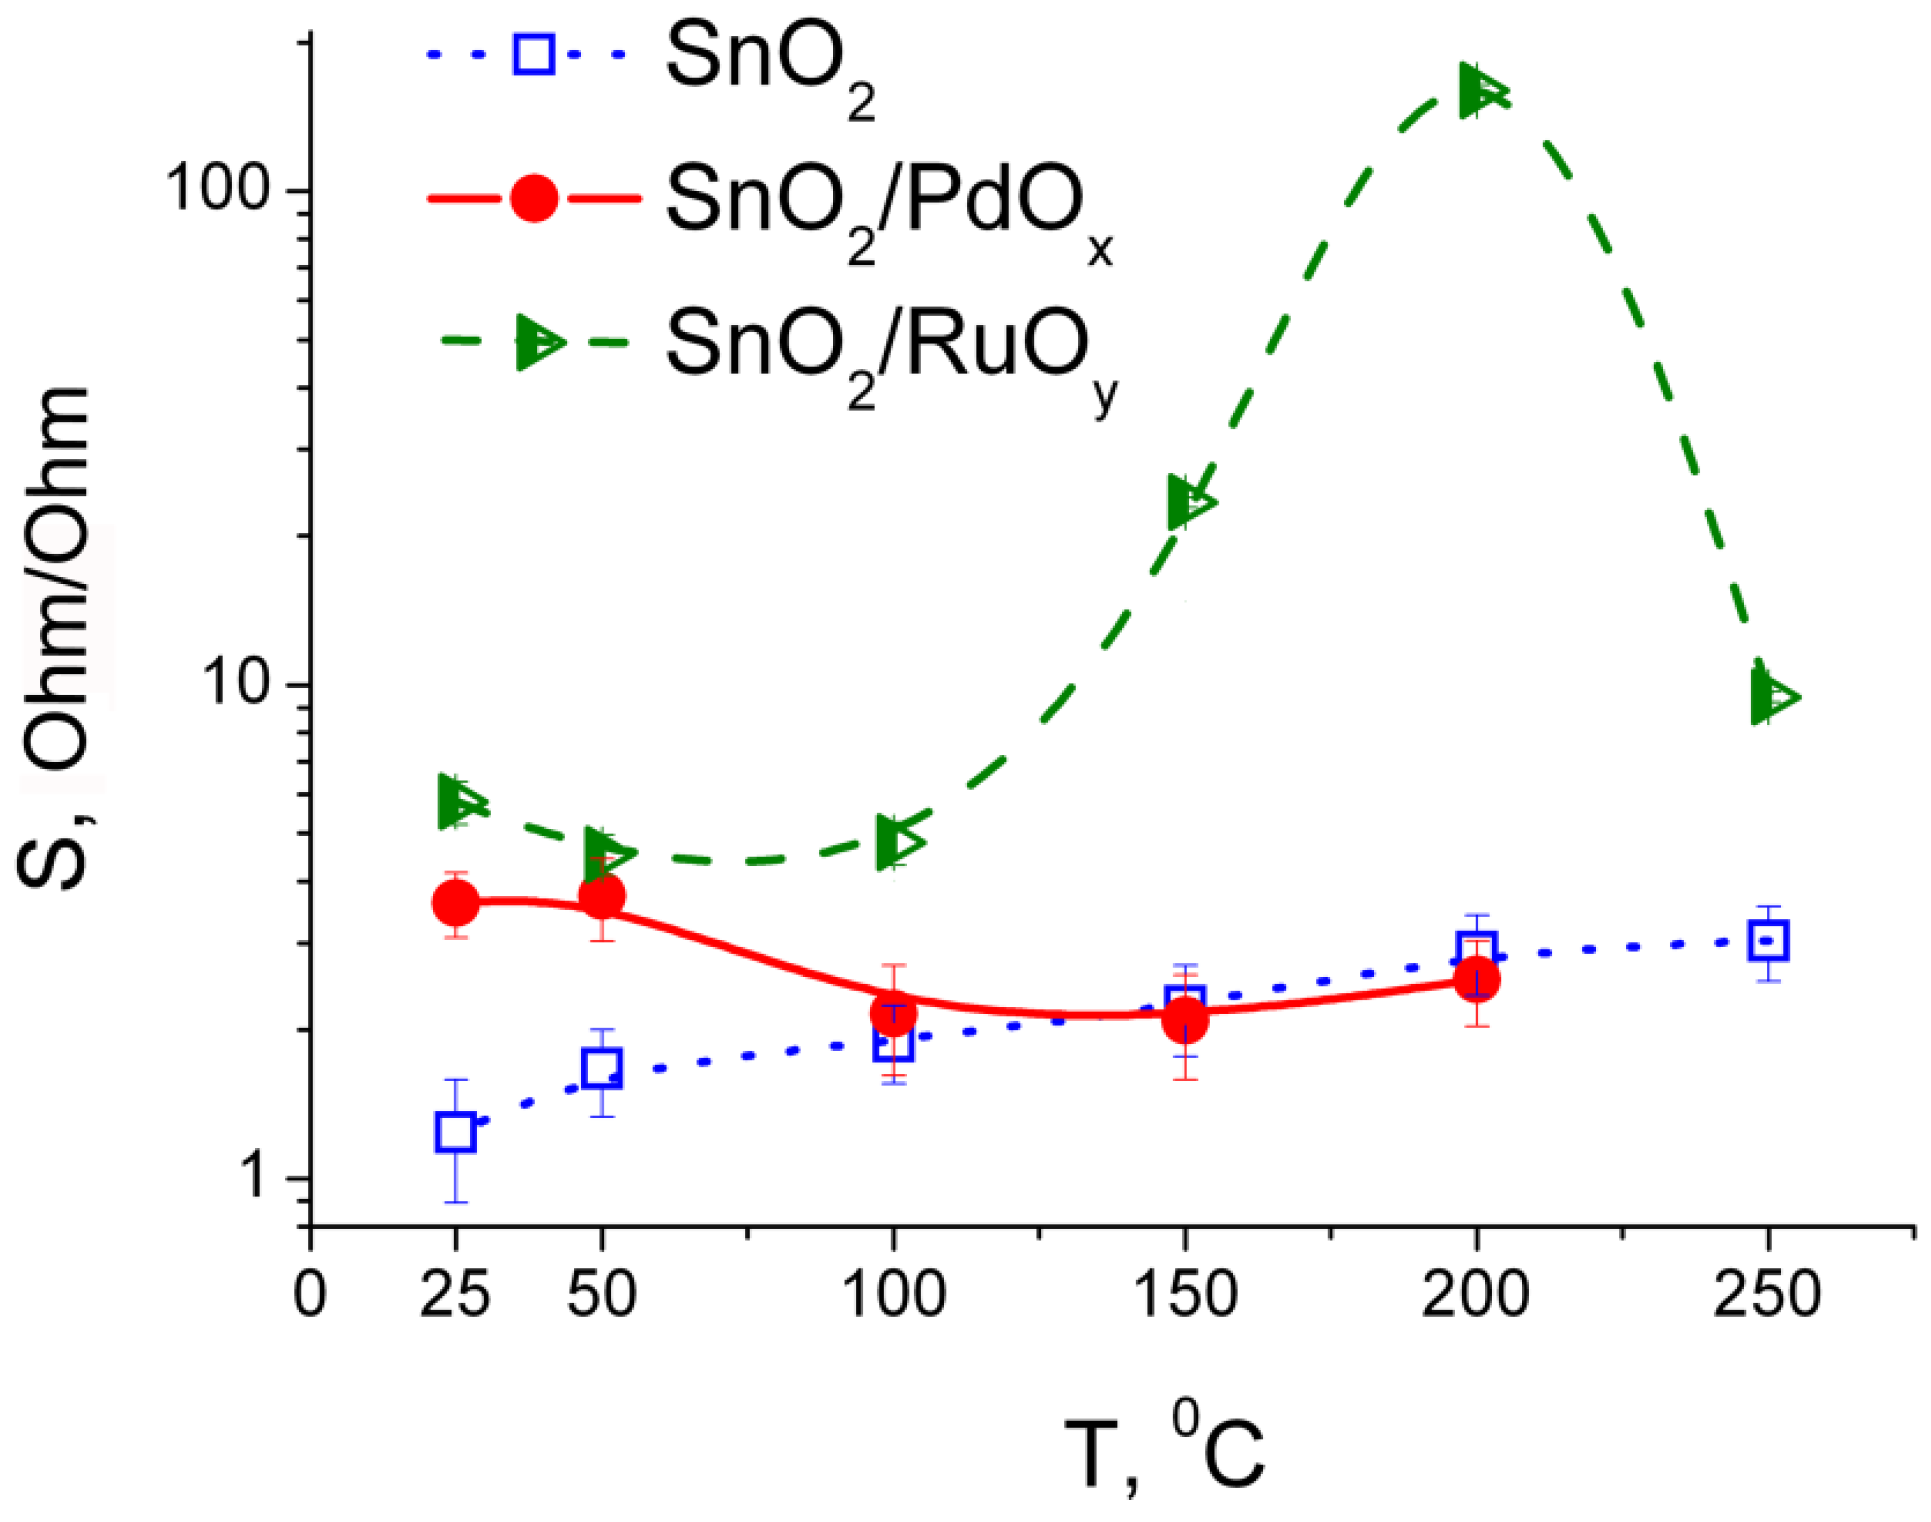
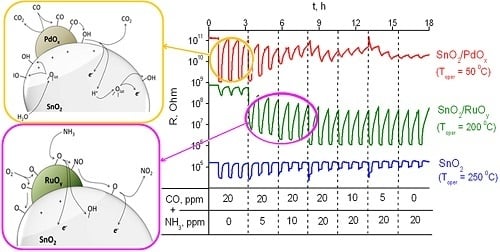
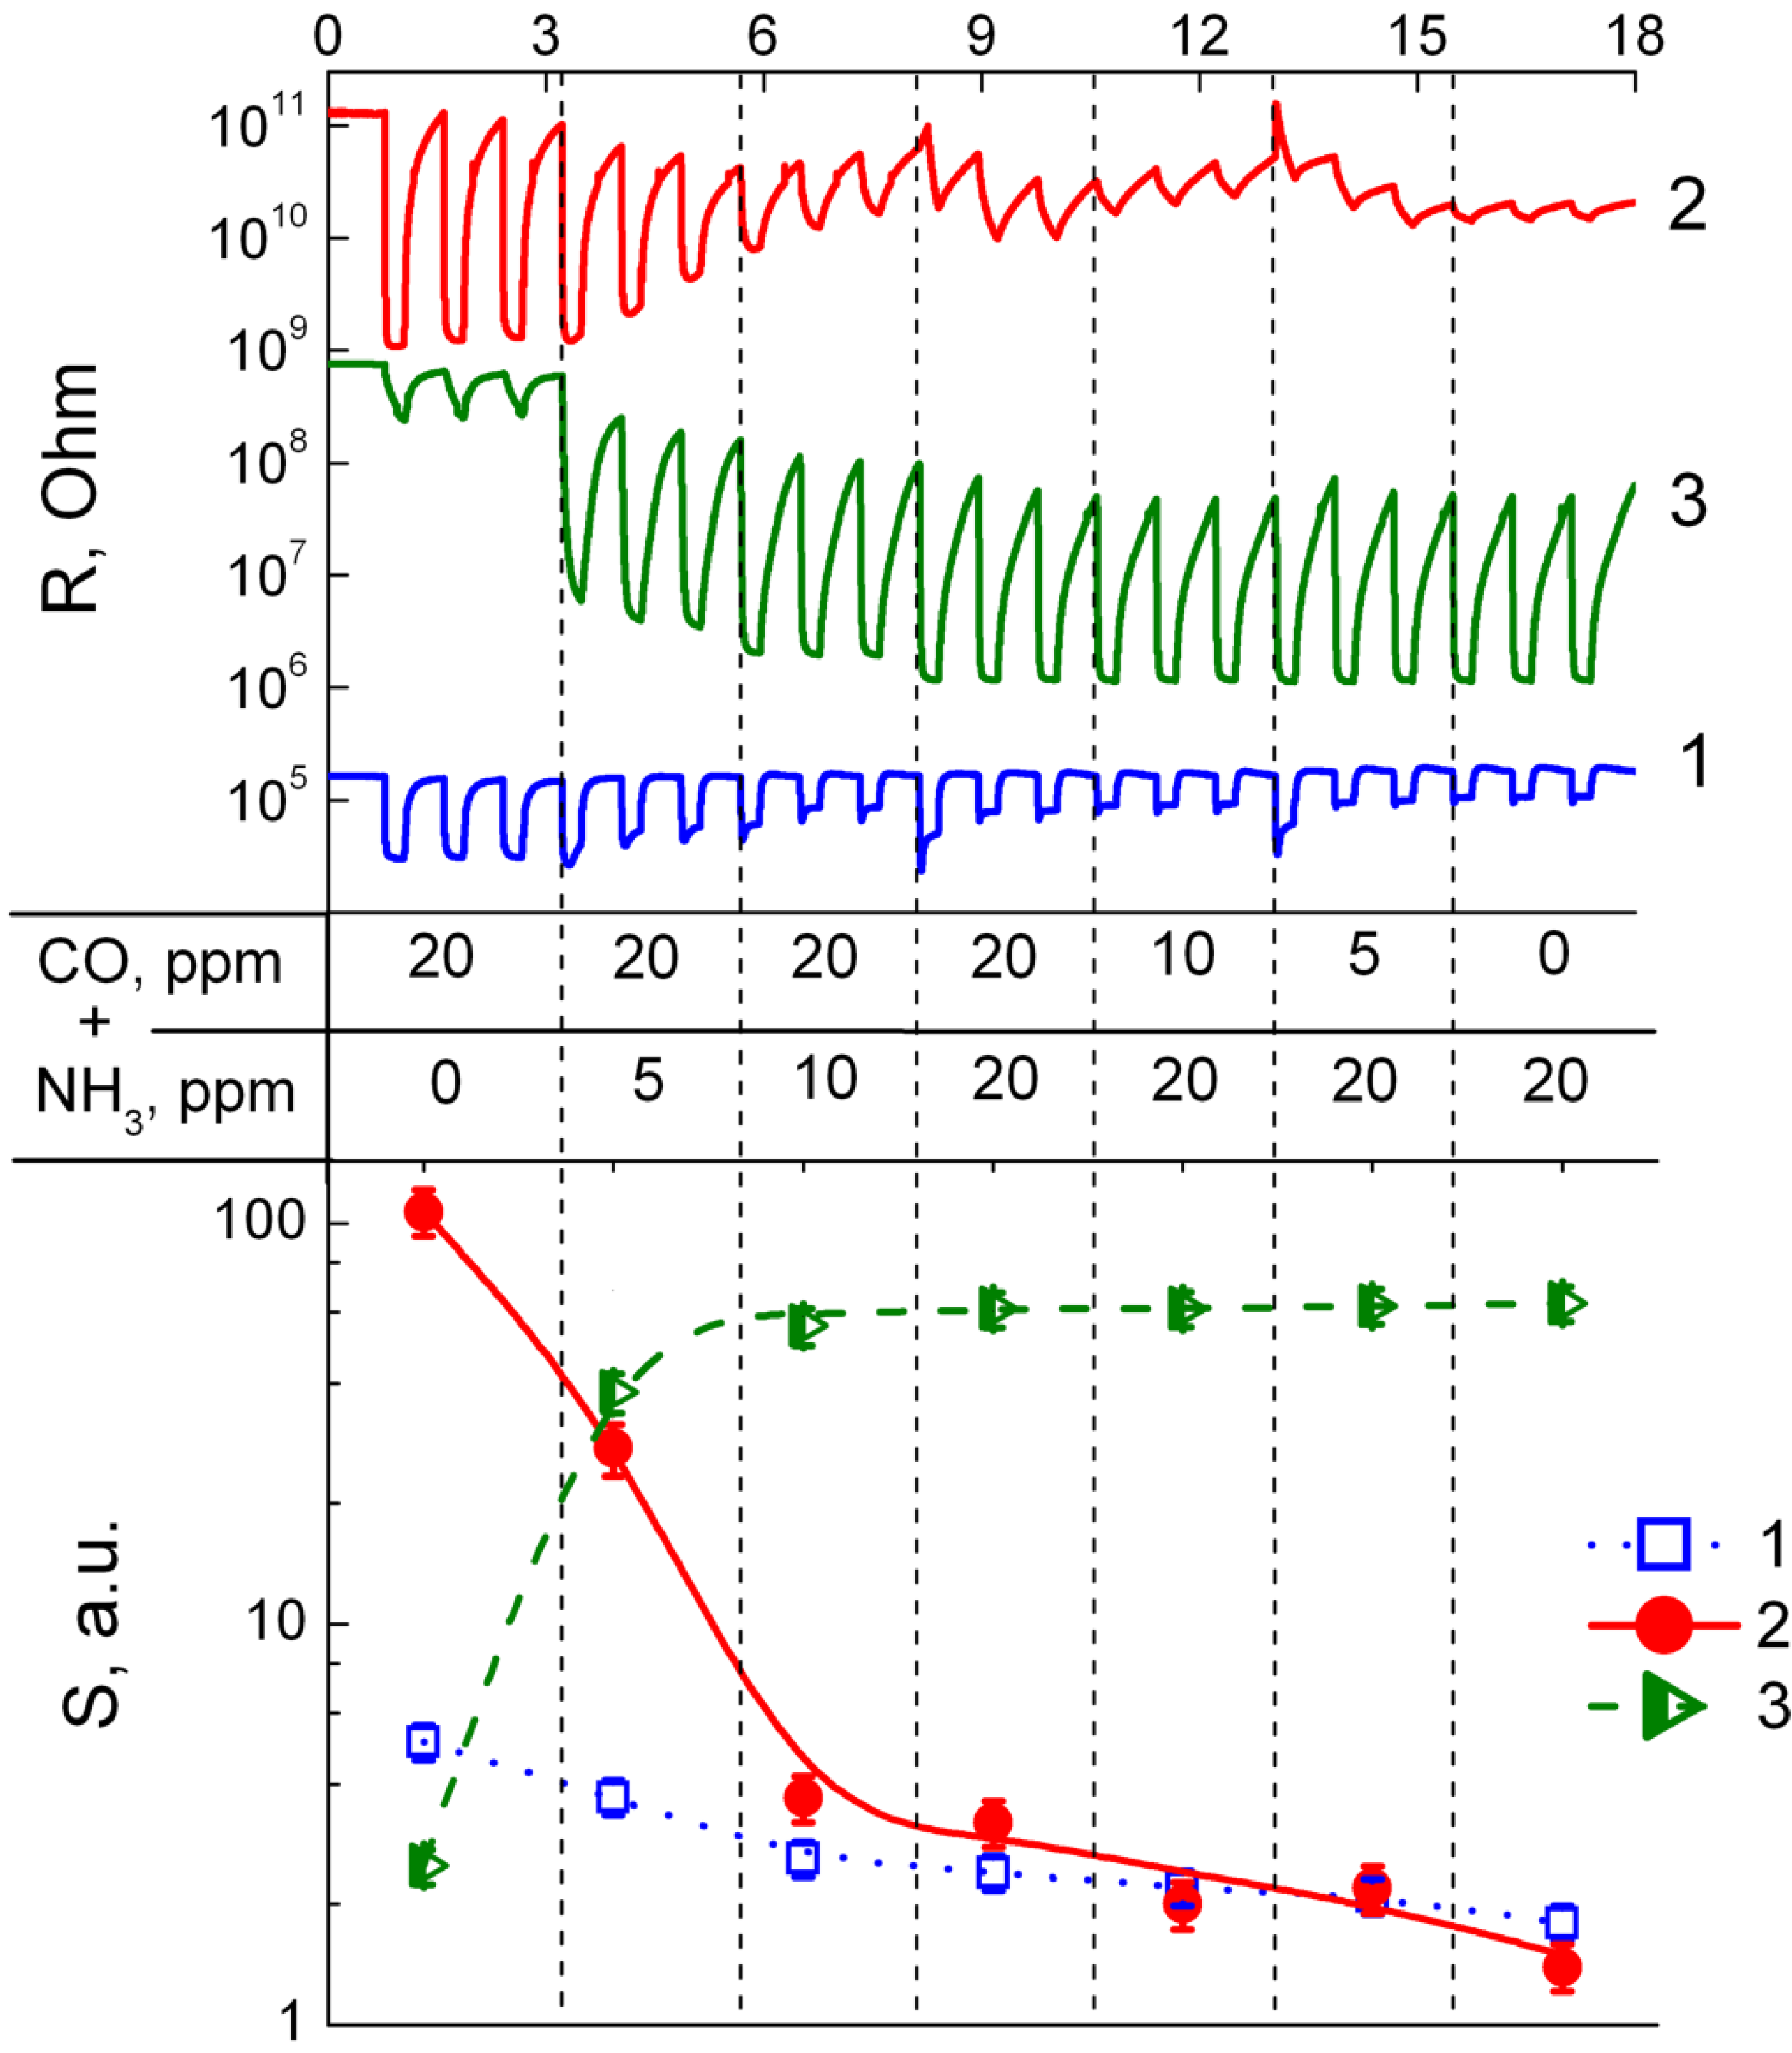
3.3. Sensing Behavior to CO + NH3 Gases Mixtures

To estimate the selectivity of the catalytically-modified tin dioxide sensing test to gas mixtures of CO + NH3 was performed. The upper plot in Figure 7 shows the dynamic resistance responses of the sensors to target gas mixtures with different component concentrations. During the measurements, the sensors were operated at temperatures appropriate for the specific detection of corresponding molecules, which were chosen based on the above-discussed temperature profiles of sensor signals (Figure 5 and Figure 6). SnO2/PdOx was operated at 50 °C to detect CO in the mixture, SnO2/RuOy at 200 °C for specific NH3 sensing. Blank SnO2, the sensitivity of which unselectively increased with temperature, was operated at 250 °C as a reference sensor. The experiment was carried out so that, firstly, CO (20 ppm) pulses were purged through the chamber. Subsequently, an increasing concentration of NH3 (5–10–20 ppm) was admixed to the test gas containing 20 ppm CO. Finally, NH3 concentration was fixed at 20 ppm and CO content was decreased step-by-step to 10–5–0 ppm. Corresponding sensor signals to test gas mixtures were calculated using Equation (1) and are plotted in the lower part of Figure 7.
Figure 7. Upper plot: dynamic resistance response of SnO2 (1), SnO2/PdOx (2), and SnO2/RuOy (3) sensors to the pulses of CO + NH3 mixtures in air. The component concentrations in the test gas mixture are shown in the middle table. Operating temperature of sensors: SnO2—250 °C, SnO2/PdOx—50 °C, SnO2/RuOy—200 °C. Lower plot: corresponding sensor signals to the test gas mixtures.
Chemosensors 03 00241 g007
As can be seen in Figure 7, the SnO2/RuOy sensor displayed extremely low responses to 20 ppm CO. However, introducing a lower concentration of NH3 (5 ppm) to the test gas mixture resulted in a drastic sensor signal growth, increasing further with the increase of NH3 concentration. Decreasing the concentration of CO affected, neither response behavior, nor the sensor signal values of SnO2/RuOy (Figure 7). Hence, SnO2/RuOy is selective to ammonia in comparison with CO when the gases are mixed in a ppm-concentration level with air. Previously, the additive of RuOy was found to promote oxygen spillover and dissociation on the surface of SnO2/RuOy to a larger extent than on SnO2 or SnO2/PdOx [27]. This resulted in the highest promotion of oxygen species on the surface of SnO2/RuOy, comparing to other samples [28]. These oxygen species could be the active sites for ammonia oxidation at raised temperatures. However, since surface oxygen species are unselective to reducing gases, the main reason for SnO2/RuOy–NH3 selectivity should be the specific catalysis of ammonia oxidation. In a recent work, we established catalytic role of RuOy clusters in deep NH3 oxidation to nitrogen oxides as the main feature reflecting increased sensitivity of SnO2/RuOy to ammonia at raised temperatures [24]. In contrast to that, ammonia is likely oxidized to N2 on the surface of PdOx-modified or blank SnO2.
The SnO2/PdOx sensor demonstrated highest responses to 20 ppm CO when there was no ammonia in the test gas (Figure 7). The addition of as little as 5 ppm NH3 resulted in a sensor signal decrease, despite the persistence of a CO concentration (20 ppm). This effect increased as a higher concentration of ammonia was added to the gas mixture. A similar behavior was observed for blank SnO2-based sensor, but the NH3-induced sensor signal depression was less prominent in this case (Figure 7). It suggests that interaction of tin dioxide with CO, and the sensitization provided by PdOx clusters at low temperatures, proceed via a different mechanism in comparison to the SnO2/RuOy-NH3 interaction at raised temperatures. Direct CO oxidation by surface OH-groups on the surface of SnO2/Pd, facilitated by the catalytic additive, was discovered in the works of Barsan et al. [21]. We proposed that CO interaction with surface hydroxyls is responsible for increased SnO2/PdOx sensitivity to carbon oxide at temperatures as low as room temperature [23]. Moreover, it was PdOx that, to the largest extent, promoted tin dioxide surface hydroxylation by increasing the concentration of different hydroxyl species, including reactive ones, such as Broensted acid sites, paramagnetic OH∙, and hydrogen-bonded OH…OH groups [28]. In this respect, the inhibition of SnO2/PdOx sensitivity to a fixed (20 ppm) CO concentration by adding even a smaller concentration of ammonia (5 ppm) can be attributed to blocking surface OH-groups by chemisorbed ammonia. Furthermore, the low operating temperature of the SnO2/PdOx sensor (50 °C) is favorable for the adsorption of basic NH3 molecules on Broensted acid sites, i.e., on surface hydroxyl species.
In this context, the sensors’ operation at low temperatures has limited applicability for environmental monitoring. Moreover, ambient humidity would block the active sites for CO oxidation, as well as ammonia gas in the above-discussed situation with SnO2/PdOx and SnO2. However, we believe that the specific sensitivities of the studied materials might be advantageous for the use of the sensors (as a future prospect) in multisensory devices. In the work of Frank et al., it was shown that using sensor networks, based on tin dioxide with different additives (palladium oxide, cobalt oxide, copper oxide, etc.), the realization of the selective analysis of hydrocarbons gas mixtures could be achieved [29]. Perhaps, the selectivity of CO and ammonia detection in gas mixtures could benefit from the strong distinction of the temperature dependence of sensitivity in the SnO2/PdOx-CO (Figure 5) and SnO2/RuOy–NH3 systems (Figure 6). The issue of sensor surface poisoning at low temperatures could be overcome by an appropriate modulation of the operating temperature, e.g., pulsed heating to desorb impurities or applying a temperature gradient to the sensing layers [4,29]. However, this is a matter for further research with these materials.

4. Conclusions

Modification of nanocrystalline SnO2 using palladium and ruthenium oxides results in gas sensitivity increase to CO at low temperatures (25–50 °C) and to NH3 at a raised temperature (150–200 °C), respectively. A selectivity test for the detection of CO + NH3 gas mixtures with air revealed that SnO2/RuOy is selective to NH3 in the presence of higher CO concentrations. The selectivity is supposed to arise from RuOy-catalyzed oxidation of NH3 to nitrogen dioxide. CO sensing by PdOx-modified tin dioxide at low temperatures is likely to involve target molecules oxidation by surface OH-groups, which are promoted by the modifier. CO sensitivity of SnO2/PdOx is suppressed by lower ammonia concentrations in gas mixtures due to the inhibition of active surface hydroxyls by NH3 chemisorption, favored by low operating temperatures.

Acknowledgments

The authors acknowledge the Russian Science Foundation (grant 14-19-00120) for financial support.

Author Contributions

Artem Marikutsa and Marina Rumyantseva contributed equally to the experimental work and discussion of the results. Alexander Gaskov contributed greatly to the concept, purposing of the work, and discussion of the results.

Conflicts of Interest

The authors declare no conflicts of interest.

References

  1. Batzill, M.; Diebold, U. The surface and materials science of tin oxide. Prog. Surf. Sci. 2005, 79, 47–154. [Google Scholar] [CrossRef]
  2. Korotcenkov, G. Gas response control through structural and chemical modification of metal oxide films: state of the art and approaches. Sens. Actuators B Chem. 2005, 107, 209–232. [Google Scholar] [CrossRef]
  3. Samotaev, N.N.; Vasiliev, A.A.; Podlepetsky, B.I.; Sokolov, A.V.; Pisliakov, A.V. The mechanism of the formation of selective response of semiconductor gas sensor in mixture of CH4/H2/CO with air. Sens. Actuators B Chem. 2007, 127, 242–247. [Google Scholar] [CrossRef]
  4. Frank, K.; Kohler, H.; Guth, U. Influence of the measurement conditions on the sensitivity of SnO2 gas sensors operated thermo-cyclically. Sens. Actuators B Chem. 2009, 141, 361–369. [Google Scholar] [CrossRef]
  5. Ederth, J.; Smulko, J.M.; Kish, L.B.; Heszler, P.; Granqvist, C.G. Comparison of classical and fluctuation-enhanced gas sensing with PdxWO3 nanoparticle films. Sens. Actuators B Chem. 2006, 113, 310–315. [Google Scholar] [CrossRef]
  6. Pearce, T.C.; Schiffman, S.S.; Nagle, H.T.; Gardner, J.W. Handbook of Machine Olfaction: Electronic Nose Technology; Weinheim: Wiley, Weinheim, Germany, 2003. [Google Scholar]
  7. Seifert, R.; Keller, H.; Matthes, J. A review on innovative procedures for the analysis of data from gas sensor systems and networks. Sens. Transducers 2015, 184, 1–10. [Google Scholar]
  8. Jerger, A.; Kohler, H.; Becker, F.; Keller, H.B.; Seifert, R. New applications of tin oxide gas sensors II. Intelligent sensor system for reliable monitoring of ammonia leakages. Sens. Actuators B Chem. 2002, 81, 301–307. [Google Scholar] [CrossRef]
  9. Rumyantseva, M.N.; Gaskov, A.M. Chemical modification of nanocrystalline metal oxides: Effect of the real structure and surface chemistry on the sensor properties. Rus. Chem. Bull. 2008, 57, 1106–1125. [Google Scholar] [CrossRef]
  10. Cabot, A.; Arbiol, J.; Morante, J.R.; Weimar, U.; Barsan, N.; Gopel, W. Analysis of the noble metal catalytic additives introduced by impregnation of as obtained SnO2 sol–gel nanocrystals for gas sensors. Sens. Actuators B Chem. 2000, 70, 87–100. [Google Scholar] [CrossRef]
  11. Yuasa, M.; Masaki, T.; Kida, T.; Shimanoe, K.; Yamazoe, N. Nano-sized PdO loaded SnO2 nanoparticles by reverse micelle method for highly sensitive CO gas sensor. Sens. Actuators B Chem. 2009, 136, 99–104. [Google Scholar] [CrossRef]
  12. Aruna, I.; Kruis, F.E.; Kundu, S.; Muhler, M.; Theissmann, R.; Spasova, M. CO ppb sensors based on monodispersed SnOx: Pd mixed nanoparticle layers: Insight into dual conductance response. J. Appl. Phys. 2009. [Google Scholar] [CrossRef]
  13. Kim, B.; Lu, Y.J.; Hannon, A.; Meyyappan, M.; Li, J. Low temperature Pd/SnO2 sensor for carbon monoxide detection. Sens. Actuators B Chem. 2013, 177, 770–775. [Google Scholar] [CrossRef]
  14. Manjula, P.; Arunkumar, S.; Manorama, S.V. Au/SnO2 an excellent material for room temperature carbon monoxide sensing. Sens. Actuators B Chem. 2011, 152, 168–175. [Google Scholar] [CrossRef]
  15. Hubner, M.; Koziej, D.; Grunwaldt, J.-D.; Weimar, U.; Barsan, N. An Au clusters related spill-over sensitization mechanism in SnO2-based gas sensors identified by operando HERFD-XAS, work function changes, DC resistance and catalytic conversion studies. Phys. Chem. Chem. Phys. 2012, 14, 13249–13254. [Google Scholar] [CrossRef] [PubMed]
  16. Ramgir, N.S.; Hwang, Y.K.; Jhung, S.H.; Mulla, I.S.; Chang, J.-S. Effect of Pt concentration on the physicochemical properties and CO sensing activity of mesostructured SnO2. Sens. Actuators B Chem. 2006, 114, 275–282. [Google Scholar] [CrossRef]
  17. Vasiliev, R.B.; Rumyantseva, M.N.; Yakovlev, N.V.; Gaskov, A.M. CuO/SnO2 thin film heterostructures as chemical sensors to H2S. Sens. Actuators B Chem. 1998, 50, 186–193. [Google Scholar] [CrossRef]
  18. Wagh, M.S.; Jain, G.H.; Patil, D.R.; Patil, S.A.; Patil, L.A. Modified zinc oxide thick film resistors as NH3 gas sensor. Sens. Actuators B Chem. 2006, 115, 128–133. [Google Scholar] [CrossRef]
  19. Srivastava, J.K.; Pandey, P.; Mishra, V.N.; Dwivedi, R. Sensing mechanism of Pd-doped SnO2 sensor for LPG detection. Solid State Sci. 2009, 11, 1602–1605. [Google Scholar] [CrossRef]
  20. Mishra, V.N.; Agarwal, R.P. Sensitivity, response and recovery time of SnO2 based thick-film sensor array for H2, CO, CH4 and LPG. Microelectron. J. 1998, 29, 861–874. [Google Scholar] [CrossRef]
  21. Barsan, N.; Weimar, U. Understanding the fundamental principles of metal oxide based gas sensors; the example of CO sensing with SnO2 sensors in the presence of humidity. J. Phys. Condens. Matter 2003, 15, 813–839. [Google Scholar] [CrossRef]
  22. Menini, P.; Parret, F.; Guerrero, M.; Soulantica, K.; Erades, L.; Maisonnat, A.; Chaudret, B. CO response of a nanostructured SnO2 gas sensor doped with palladium and platinum. Sens. Actuators B Chem. 2004, 103, 111–114. [Google Scholar] [CrossRef]
  23. Marikutsa, A.V.; Rumyantseva, M.N.; Yashina, L.V.; Gaskov, A.M. Role of surface hydroxyl groups in promoting room temperature CO sensing by Pd-modified nanocrystalline SnO2. J. Solid State Chem. 2010, 183, 2389–2399. [Google Scholar] [CrossRef]
  24. Marikutsa, A.V.; Krivetskiy, V.; Yashina, L.V.; Rumyantseva, M.; Konstantinova, E.A.; Ponzoni, A.; Comini, E.; Abakumov, A.; Gaskov, A.M. Catalytic impact of RuOx clusters to high ammonia sensitivity of tin dioxide. Sens. Actuators B Chem. 2012, 175, 186–193. [Google Scholar] [CrossRef]
  25. Marikutsa, A.V.; Rumyantseva, M.N.; Gaskov, A.M.; Konstantinova, E.A.; Grishina, D.A.; Deygen, D.M. CO and NH3 sensor properties and paramagnetic centers of nanocrystalline SnO2 modified by Pd and Ru. Thin Solid Films 2011, 520, 904–908. [Google Scholar] [CrossRef]
  26. Frolov, D.D.; Kotovshchikov, Y.N.; Morozov, I.V.; Boltalin, A.I.; Fedorova, A.A.; Marikutsa, A.V.; Rumyantseva, M.N.; Gaskov, A.M.; Sadovskaya, E.M.; Abakumov, A.M. Oxygen exchange on nanocrystalline tin dioxide modified by palladium. J. Solid State Chem. 2012, 186, 1–8. [Google Scholar] [CrossRef]
  27. Marikutsa, A.V.; Rumyantseva, M.N.; Frolov, D.D.; Morozov, I.V.; Boltalin, A.I.; Fedorova, A.A.; Petukhov, I.; Yashina, L.V.; Konstantinova, E.A.; Sadovskaya, E.M.; et al. Role of PdOx and RuOy clusters in oxygen exchange between nanocrystalline tin dioxide and the gas phase. J. Phys. Chem. C 2013, 117, 23858–23867. [Google Scholar] [CrossRef]
  28. Marikutsa, A.V.; Rumyantseva, M.N.; Konstantinova, E.A.; Shatalova, T.B.; Gaskov, A.M. Active sites on nanocrystalline tin dioxide surface: effect of palladium and ruthenium oxides clusters. J. Phys. Chem. C 2014, 118, 21541–21549. [Google Scholar] [CrossRef]
  29. Frank, K.; Magapu, V.; Schindler, V.; Kohler, H.; Keller, H.B.; Seifert, R. Chemical analysis with tin oxide gas sensors: Choice of additives, method of operation and analysis of numerical signal. Sens. Lett. 2008, 6, 908–911. [Google Scholar] [CrossRef]

