Article

Age- and Activity-Related Differences in the Abundance of Myosin Essential and Regulatory Light Chains in Human Muscle

1
Division of Sport and Exercise Science, Abertay University, 40 Bell Street, Kydd Building, Dundee DD1 1HG, UK
2
Faculty of Sport Science and Coaching, Universiti Pendidikan Sultan Idris, Tanjung Malim, Perak 35900, Malaysia
3
Research Institute for Sport and Exercise Sciences, Liverpool John Moores University, Liverpool L3 3AF, UK
*
Author to whom correspondence should be addressed.
These authors contributed equally to this work.
Proteomes 2016, 4(2), 15; https://doi.org/10.3390/proteomes4020015
Submission received: 27 February 2016 / Revised: 30 March 2016 / Accepted: 1 April 2016 / Published: 8 April 2016
(This article belongs to the Special Issue Striated Muscle Proteomics)

Abstract

:
Traditional methods for phenotyping skeletal muscle (e.g., immunohistochemistry) are labor-intensive and ill-suited to multixplex analysis, i.e., assays must be performed in a series. Addressing these concerns represents a largely unmet research need but more comprehensive parallel analysis of myofibrillar proteins could advance knowledge regarding age- and activity-dependent changes in human muscle. We report a label-free, semi-automated and time efficient LC-MS proteomic workflow for phenotyping the myofibrillar proteome. Application of this workflow in old and young as well as trained and untrained human skeletal muscle yielded several novel observations that were subsequently verified by multiple reaction monitoring (MRM). We report novel data demonstrating that human ageing is associated with lesser myosin light chain 1 content and greater myosin light chain 3 content, consistent with an age-related reduction in type II muscle fibers. We also disambiguate conflicting data regarding myosin regulatory light chain, revealing that age-related changes in this protein more closely reflect physical activity status than ageing per se. This finding reinforces the need to control for physical activity levels when investigating the natural process of ageing. Taken together, our data confirm and extend knowledge regarding age- and activity-related phenotypes. In addition, the MRM transitions described here provide a methodological platform that can be fine-tuned to suite multiple research needs and thus advance myofibrillar phenotyping.

1. Introduction

Musculoskeletal ageing is characterized by age-related muscle fiber atrophy, as a corollary of motor unit (MU) loss [1]. Each MU comprises a presynaptic motor neuron and a postsynaptic population of mono-innervated skeletal muscle fibers [2]. MUs are, typically but not always [3], defined by uniform skeletal muscle fiber isoform (Type I, Type II) content [4]. Type II MUs are preferentially lost with age, owing to failed re-innervation [2]. Functionally, type II MU loss underpins age-related phenotypical alterations (e.g., reduced skeletal muscle power [5]), owing to the distinct contractile and metabolic properties associated with each fiber type (reviewed in [4,6]). Therefore, classification of skeletal muscle fiber type can provide insight into the nature of the phenotypical alterations that define musculoskeletal ageing [7].
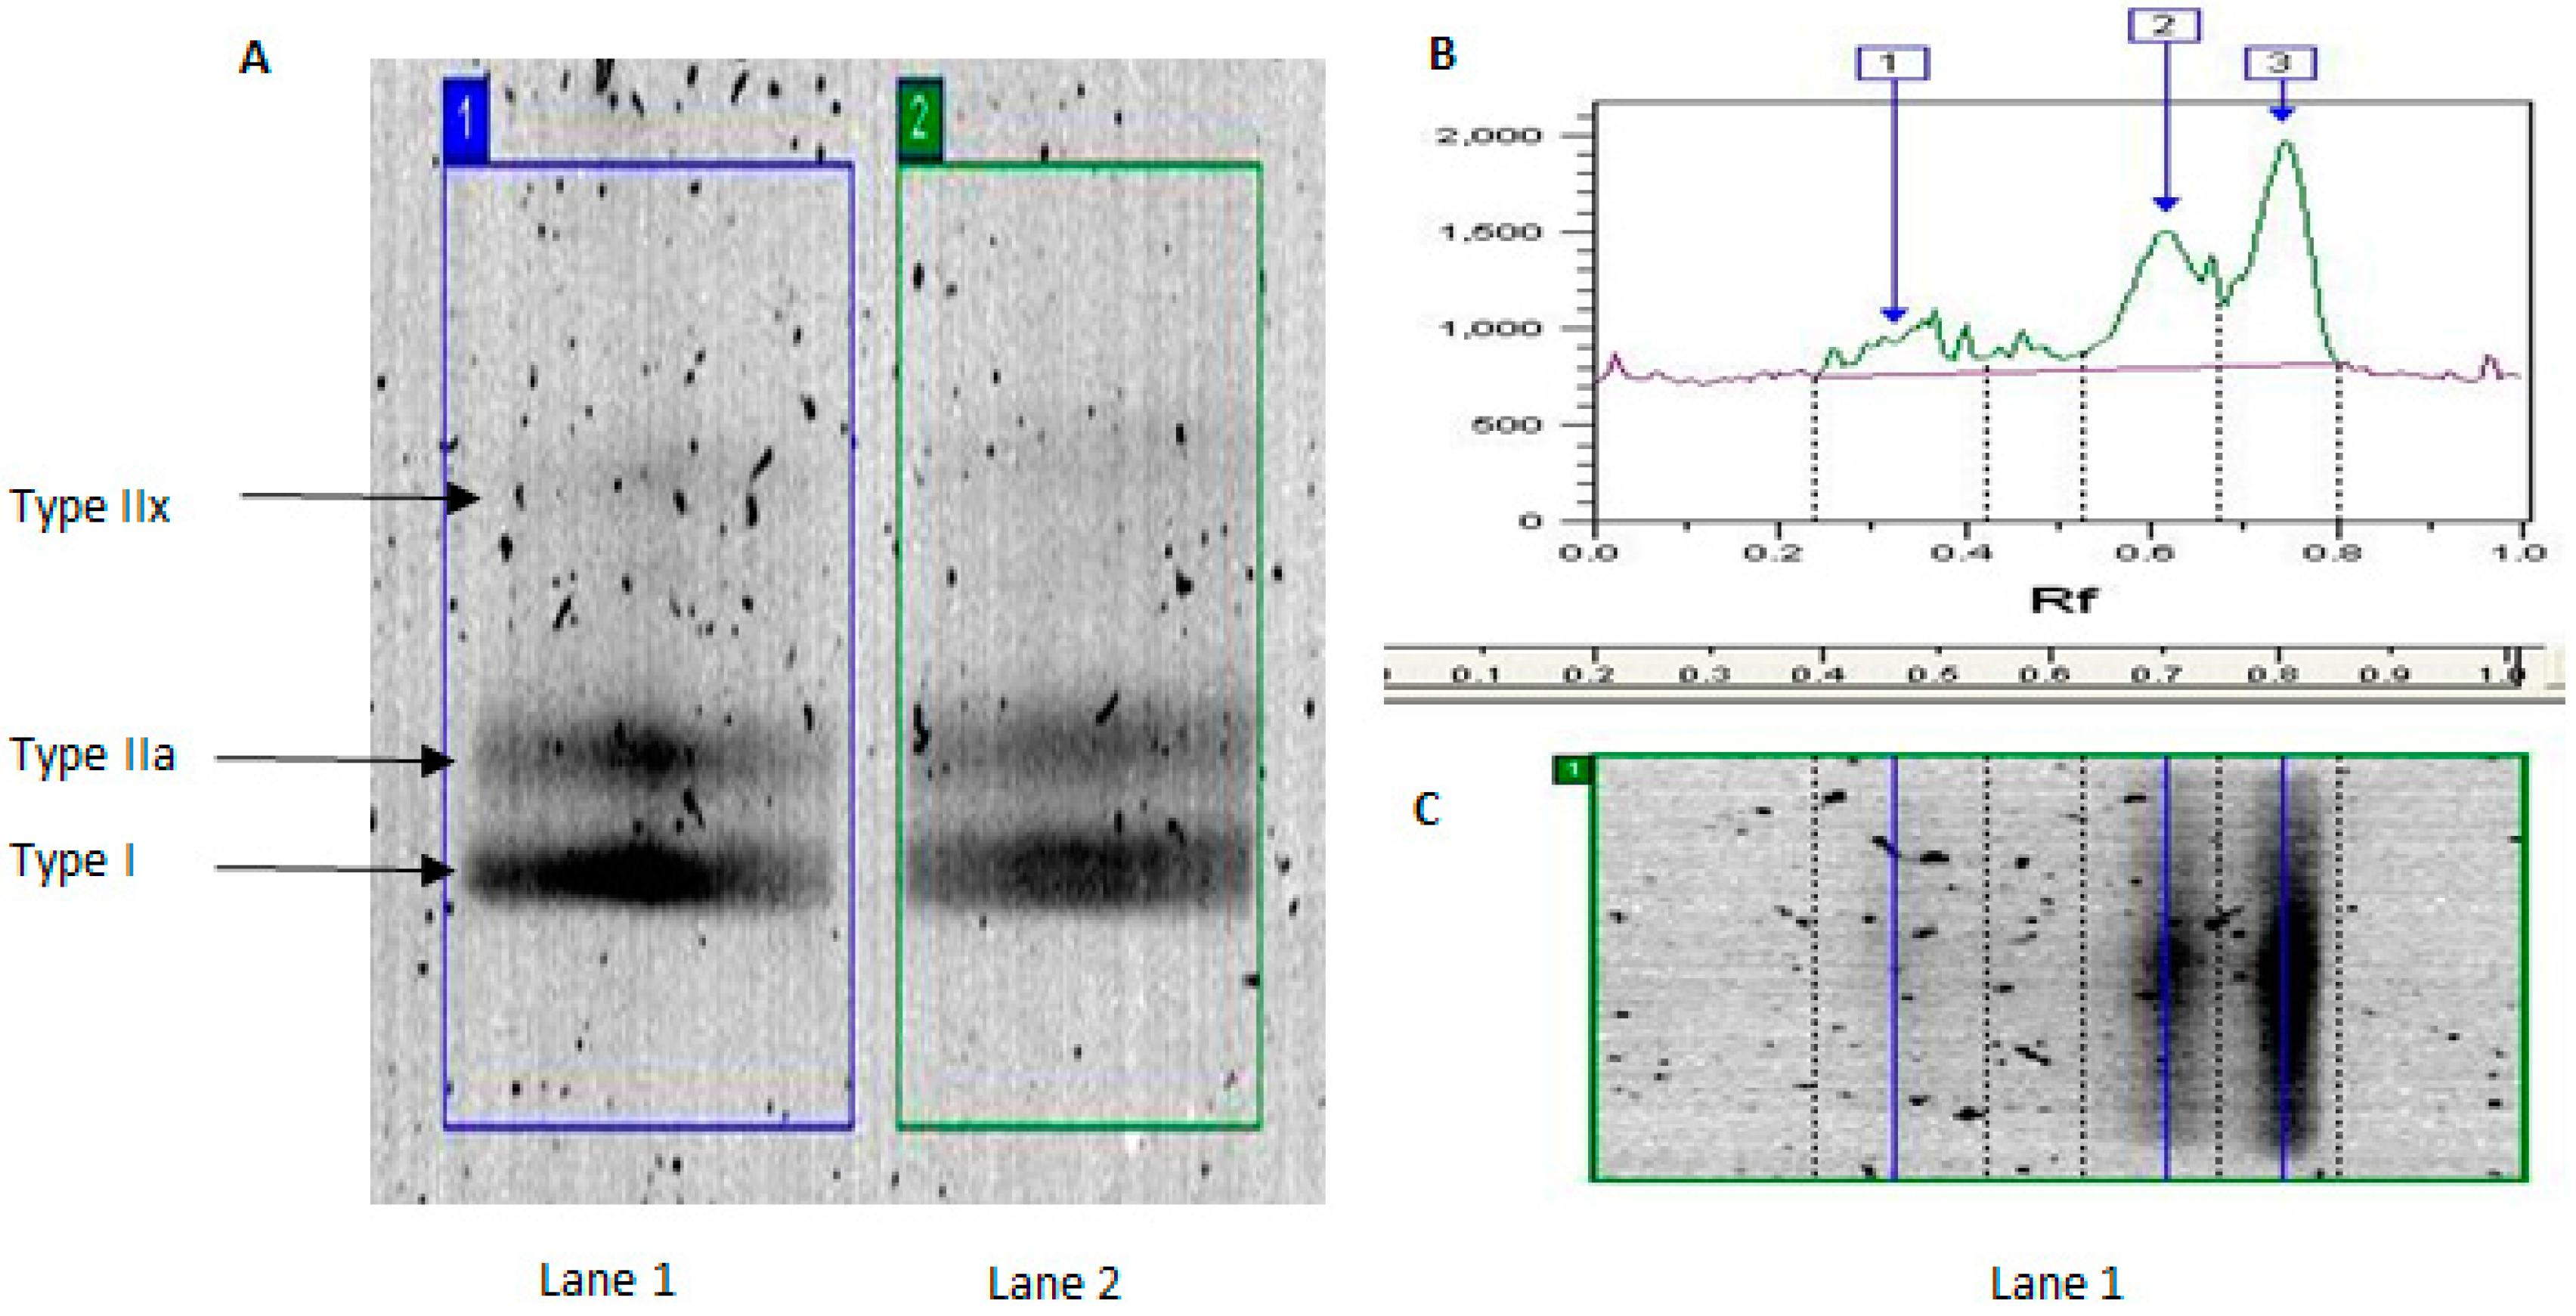
Traditional biochemical and histochemical approaches to characterizing skeletal muscle phenotype involve assessment of metabolic enzyme activity (e.g., citrate synthase activity) and myosin heavy chain (MyHC) isoform content and/or ATPase activity [8,9]. Such approaches have revealed that musculoskeletal ageing is associated with reduced citric acid cycle and electron transport chain subunit activity and content [10,11], although this is modifiable by physical activity levels [1]. Ageing is also associated with reduced MyHCIIa and MyHCIIx expression, consistent with type II MU loss [7]. Unfortunately, the techniques used to collect the aforementioned data require relatively large amounts of sample and are ill-suited to multiplex analysis so typically just a few proteins are studied in isolation [9,12,13,14] and in a serial rather than parallel manner. The latter is a particular concern because metabolic and contractile differences can be uncoupled [12,15]. Resultantly, metabolic differences can exist despite similar MyHC isoform content [12]. The age-related appearance of hybrid skeletal muscle fibers that co-express multiple MyHC isoforms further complicates this issue [16]. The collective limitations of traditional biochemical and histochemical approaches preclude complete characterization of age and physical activity level phenotypes in skeletal muscle.
Proteomic approaches to characterizing skeletal muscle phenotype confer several important advantages, notably the capacity to analyze multiple proteins in a parallel and un-biased manner [17,18,19,20]. Consequently, proteomic research has advanced understanding of the phenotypical changes associated with musculoskeletal ageing [7,10,21,22,23,24,25]. For example, Gelfi et al. [7] reported myosin regulatory light chain (MLRS) content was lower in older compared with younger individuals, which may contribute to age-related contractile dysfunction [26]. Nevertheless, existing literature is broadly limited by two major caveats. First, the confounding influence of activity levels has seldom been standardized or controlled in human studies. For instance, lower MLRS isoform content of elderly individuals [7] could reflect reduced physical activity rather than a direct effect of ageing per se. Second, inconsistencies exist between proteomic studies in model species (e.g., rodents) compared with humans. For example, in contrast to humans, commonly used rodent models are inbred and rodents express a fast type MyHCII isoform (Type II b [9,15]), which is not present in human locomotive muscles.
Two-dimensional gel electrophoresis (2DGE) has been commonly employed in muscle proteomic investigations but this technique has widely acknowledged [12,19,21,27,28,29] technical limitations. In an effort to overcome some of the technical issues associated with 2DGE, we have used a high-performance liquid chromatography coupled mass spectrometry (LC-MS) that affords time-efficient (180 min per sample), automated and quantitative analysis of skeletal muscle samples [12]. Recent application of this approach identified heart-type fatty acid binding protein as a novel biomarker of aerobic capacity in both rodent and human skeletal muscle samples [12]; confirming the utility of this novel phenotypical approach. We reasoned that application of LC-MS to the myofibrillar fraction may advance phenotyping by enabling the measurement of isoform expression and splice variation of the myofibrillar proteome. Accordingly, the aims of the present study were to: (1) quantify differences in MyHC content using traditional denaturing gel electrophoresis methods; then (2) mine the myofibrillar proteome using LC-MS/MS; and (3) investigate differences between muscle samples of young and elderly adults using LC-MS label-free profiling. In addition, trained and untrained participants were included in each age group to further dissect the influence of physical activity levels on phenotypical biomarkers of ageing [10,11,30]. Finally, we used multiple reaction monitoring to verify discoveries generated by LC-MS profiling.

2. Results

2.1. MyHC Isoform Analysis

Denaturing gel electrophoresis conditions were optimized using a pooled standard (10 µg protein from each individual, n = 24). MyHC isoforms (MyHCI, MyHCIIa and MyHCIIx) were successfully resolved into three distinct bands (Figure 1). MyHC isoform content (MyHCI: 52.4% ± 1.7%, MyHCIIa: 38.4% ± 3.9% and MyHCIIx: 9.2% ± 2.2%) was consistent with previous literature [31]. Satisfied with the optimization of our electrophoresis protocol, we next analyzed individual samples (Figure 2). Endurance trained individuals typically exhibit greater Type I fiber content and thus lower Type IIa and Type IIx content compared with untrained individuals, as a function of genetic and environmental factors [3,6,15]. Consistent with this, percentage MyHCI and MyHCIIa levels were greater and lower, respectively, in trained compared with untrained participants (Table 1), irrespective of age [7]. Type IIa and Type IIx muscle fibers are preferentially lost with age as a consequence of failed re-innervation [2]. Accordingly, we report MyHCIIa levels were lower in older compared with younger participants, regardless of training status (Table 1). In addition, MyHCIIa and MyHCIIx levels were lower in the old trained (OT) compared with young trained (YT) group. Taken together, our MyHC isoform content analysis confirms known age- and physical activity-related phenotypes.

2.2. LC-MS-MS Mining of the Myofibrillar Proteome

Denaturing gel electrophoresis-based MyHC isoform staining approaches are laborious and time consuming, i.e., typically requiring electrophoresis at a stable temperature for ~15 h. Therefore, we investigated whether mass spectrometry-based analyses could provide a more comprehensive and time efficient analysis of muscle phenotype. We first mined the myofibrillar fraction (pooled standard) before quantifying phenotypical differences in individual samples. LC-MS/MS mining of the myofibrillar fraction of a pooled standard identified 47 proteins (M and SD: Mascot Score 5295 ± 8146; Sequence coverage: 34.6% ± 20.4%; Number of peptides: 10 ± 17; Table 2), which represents the most abundant myofibrillar proteins [28], including the actin-myosin complex, troponins, myosin light chains and tropomyosins (Figure 3). This demonstrates the potential utility of LC-MS profiling to identify and study multiple isoforms of common myofibrillar proteins in a semi-automated and time-efficient manner.

2.3. Differences in the Myofibrillar Proteome Due to Age or Habitual Levels of Physical Activity

Label-free LC-MS profiling matched 265 peptides across samples from young untrained (YU), young trained (YT), old untrained (OU) and old trained (OT) individuals. Statistical analysis of these data discovered 19 peptides from six proteins exhibited age- and physical activity-related differences (Table 3). Six peptides were specific for different isoforms of myosin essential or regulatory light chains, whereas peptides belonging to MyHC could not be used to unambiguously identify specific isoforms.
Peptide data from label-free profiling were analyzed by two-way analysis of variance. Data represent statistical output (p values) of the main comparisons for age (young versus old) or training status (trained versus untrained) or the interaction between age and training status for each peptide. The retention time and mass-to-charge ratio of each peptide is reported and proteins were identified from the SwissProt database: skeletal muscle actin (ACTS), skeletal muscle myosin regulatory light chain (MLRS), myosin heavy chain (MYH), myosin essential light chain 1 (MYL1), myosin essential light chain 3 (MYL3) and tropomyosin (TPM).

2.4. Confirmation of Age- and Activity-Related Differences in Myosin Light and Regulatory Chain Isoforms Using Selective Reaction Monitoring

Label-free LC-MS profiling of the human myofibrillar proteome discovered MLRS, MYL1 and MYL3 abundance may significantly differ as a function of age and physical activity. To verify these discoveries, we further performed selective reaction monitoring of isoform specific tryptic peptides [12]. The utility of this approach was first confirmed by programming the mass spectrometer to selectively monitor single isoform-specific transitions, for example the doubly charged precursor ion (600.82 m/z) corresponding to ITLSQVDVLR of human MYL1 and the selective transition to the y6 Fragment ion (658.3 m/z) illustrated in Figure 4. Thereafter, we used multiple reaction monitoring (MRM) to quantify (Table 4) the following isoform-specific transitions: 505.7 → 550.2 (MYL1), 600.8 → 658.3 (MYL1), 771.7 → 835.4 (MYL1), 498.2 → 759.4 (MYL3), 600.2 → 735.4 (MLRS) and 762.8 → 780.2 (MLRS).
MYL1: MRM analysis of MYL1 revealed that each isoform specific transition was significantly (p ≤ 0.05) greater in young compared with old participants, irrespective of training status (Table 4). Accordingly, mean MYL1 isoform abundance was significantly greater (p ≤ 0.05) in young compared with old participants. MYL1, is principally expressed in fast twitch fibers [32] and MYL1 abundance was significantly less in OT (p = 0.004) and OU (p = 0.045) groups compared with YU group (Table 5). There was also a trend (p = 0.63) towards greater MY1 abundance in YU compared with YT. Altogether, MYL1 data are consistent with greater fast twitch fiber abundance in trained compared with untrained participants and an age-related loss of fast twitch muscle fibers in skeletal muscle [6,7,15,21].
MYL3: MYL3, which is enriched in slow skeletal muscle fibers [13,33], displayed the reverse profile being significantly (p = 0.021) greater in older compared with younger participants, with a trend (p = 0.083) towards higher levels in trained compared with untrained participants (Table 4). MYL3 abundance was significantly (p = 0.038) less in YU compared with OT. MYL3 abundance was not different (p ≥ 0.05) between YT and OT groups (Table 5). MYL3 data are, therefore, consistent with the greater type I fiber content in older compared with younger skeletal muscle [6,7,15,21], driven by lower levels in YU compared with OT.
MLRS: Mean MLRS (also referred to MLC2-f) content was significantly (p = 0.031) greater in untrained compared with trained participants, with a trend (p = 0.055) towards lower MLRS content in older compared with younger participants (Table 4). Mean MLRS abundance (Table 5) was significantly (p = 0.030) greater in YU compared with OT, whereas mean MLRS abundance did not differ (p ≥ 0.05) between YU and YT. Therefore, our MLRS data are broadly consistent with greater fast twitch fiber content in untrained compared with trained participants [6,7,15,21].
Collectively, our data demonstrate that isoform specific myosin light chain transitions are useful phenotypical biomarkers of age and activity related phenomena in human skeletal muscle.

3. Discussion

We used traditional biochemical analysis of MyHC isoforms to confirm age-related differences in human muscle phenotype and further demonstrate the effect of habitual activity on these data. We expand on our previous work [12,
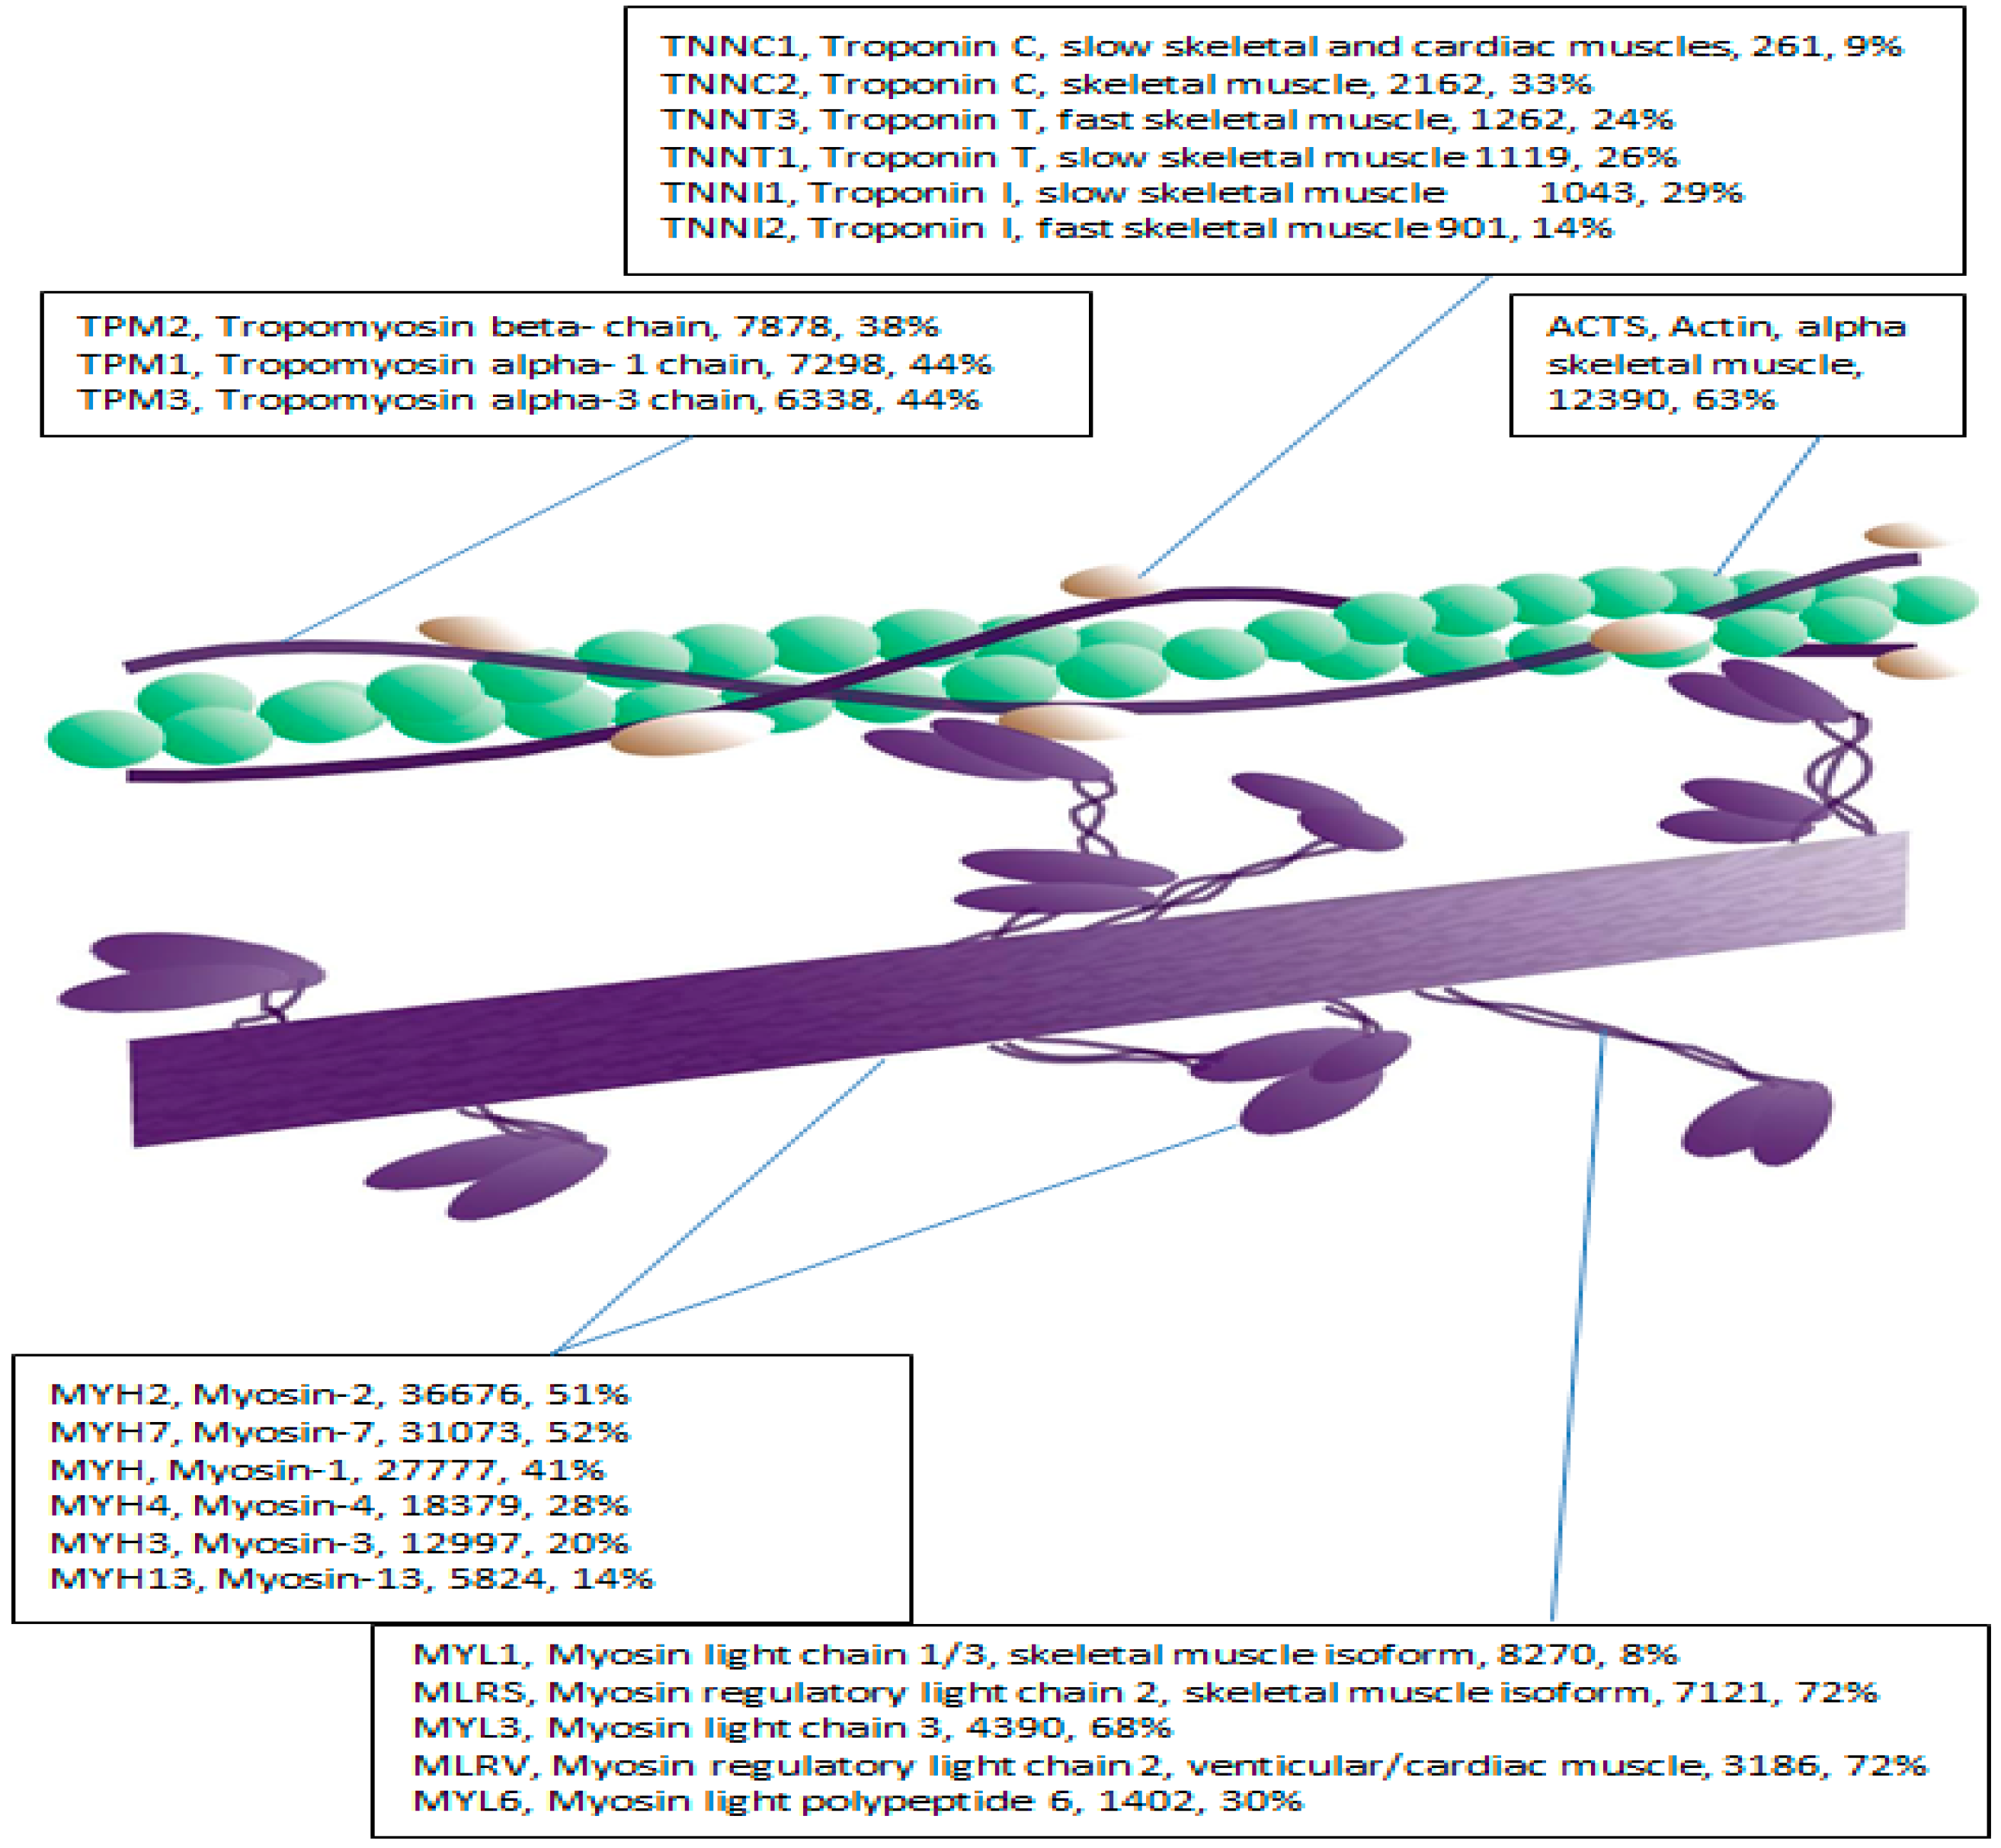
28], by using label-free LC-MS profiling to phenotype the human myofibrillar proteome. We resolved 47 myofibrillar proteins without prior orthogonal separation, which is consistent with the well-documented high-abundance of a small number of contractile proteins in skeletal muscle [17,19,20]. Indeed, just ten contractile and metabolic proteins account for over half of the total protein content in skeletal muscle [29,30]. LC-MS profiling detected significant differences in the abundance of peptides belonging to essential and regulatory myosin light chains between young and elderly individuals that were either sedentary or undertook regular exercise training. To verify these findings, we performed MRM of selected isoform-specific peptides using a condensed LC gradient with a sample turn-around of 40 min. In addition to verifying novel information regarding age-related differences in myosin light chain abundances, future researchers are able to capitalize on these findings and also perform rapid, semi-automated and parallel profiling of muscle proteins using our reported transitions.
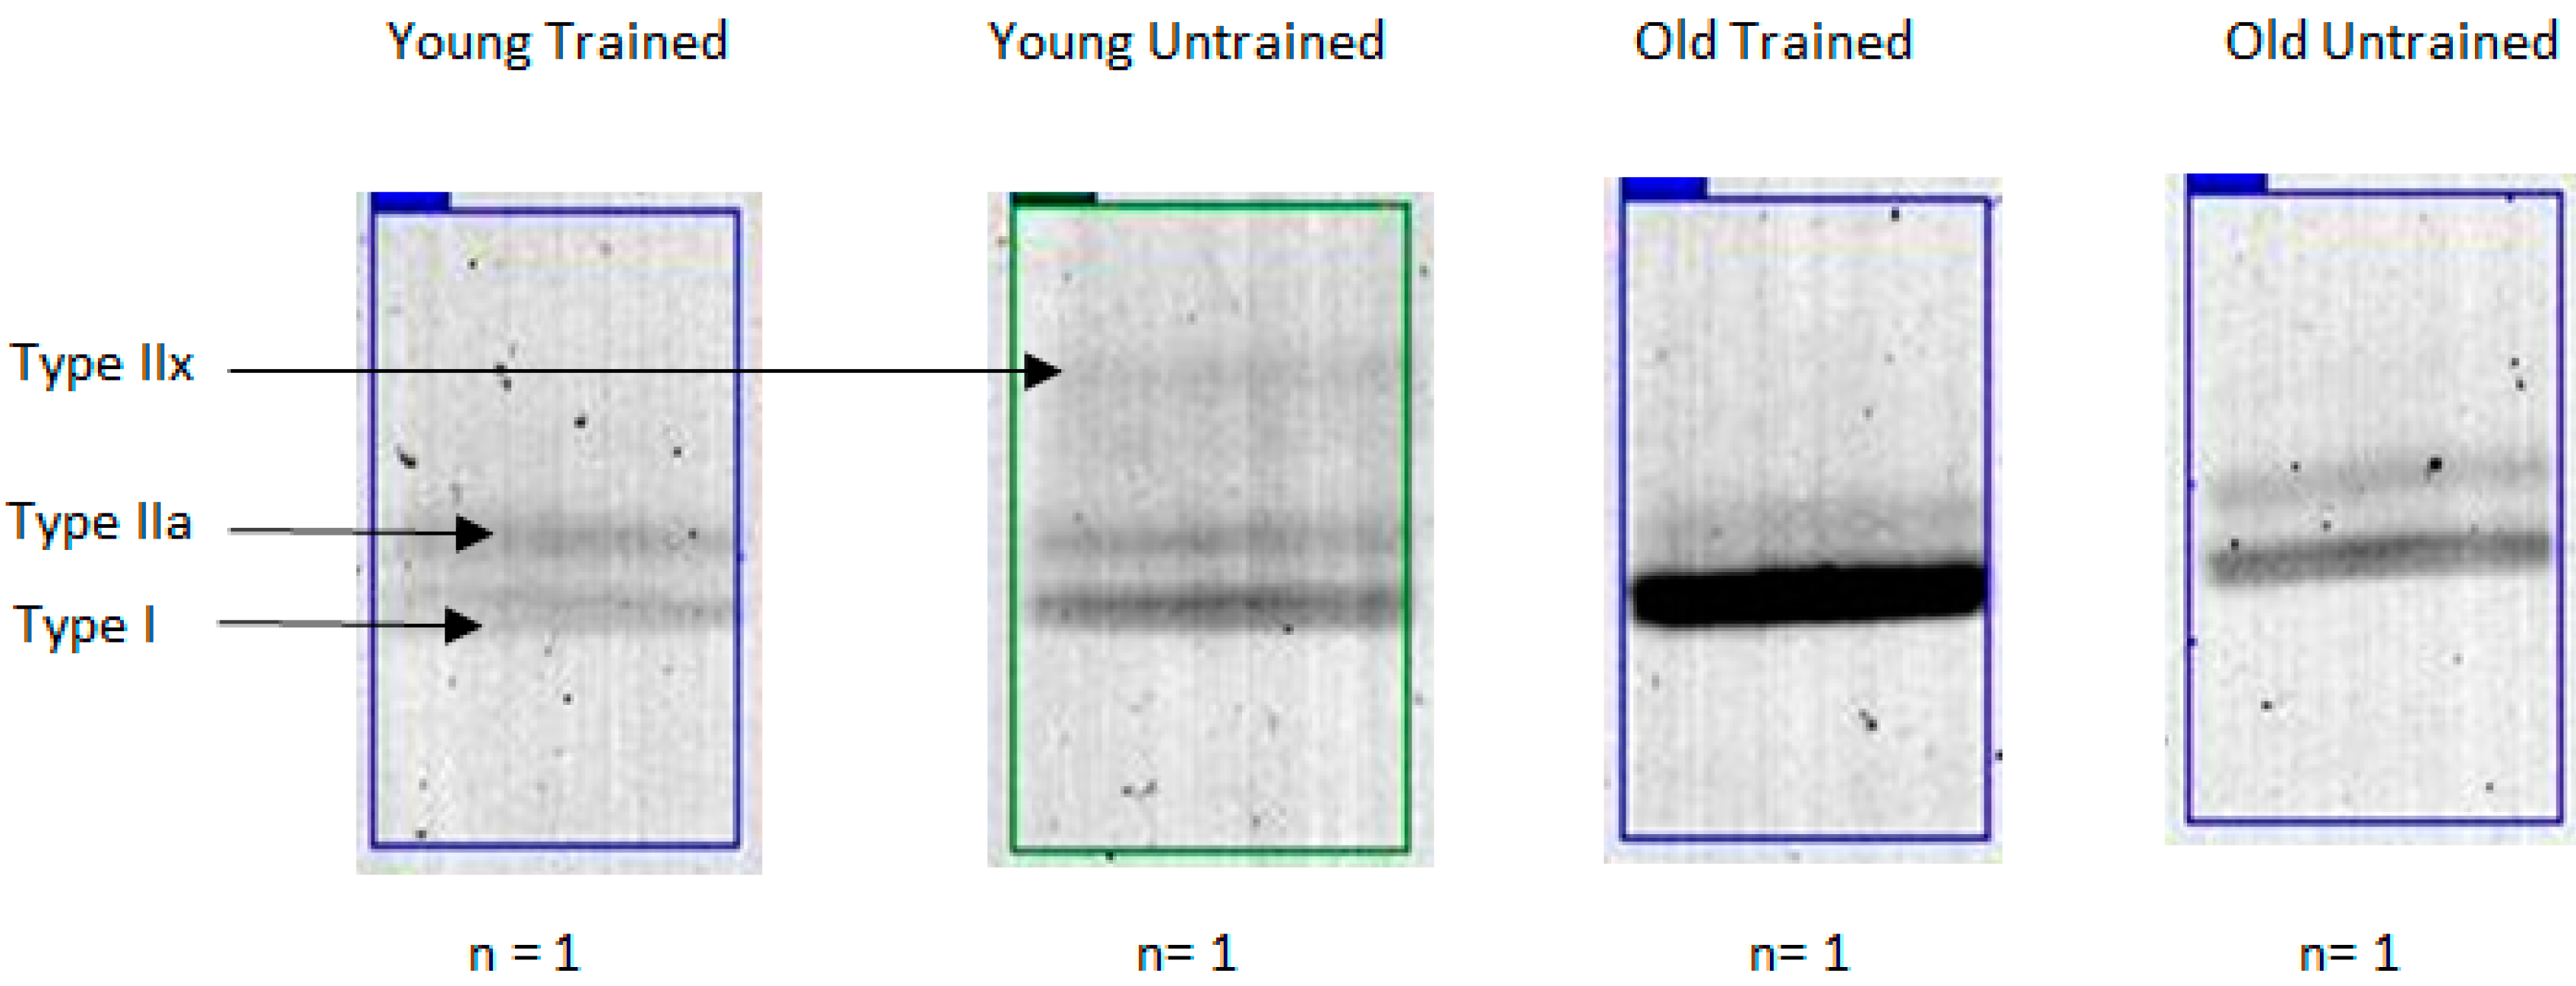
Consistent with previous literature [7,21,31], MyHCIIa abundance, a marker of Type IIa fiber content, was less in older compared with younger individuals, regardless of training status. Indeed, MyHCIIx, a marker of Type IIx content, was almost completely absent in the OT group. MyHCIIa and MyHC IIx phenotypes are likely to be associated with the age-related preferential loss of Type II MU [2,34]. The molecular sequelae underpinning Type II MU loss are unclear but this phenomenon may be driven by aberrant repulsive axonal guidance (e.g., Semaphorin 3A) mediated denervation [34,35,36]. Irrespective of age, trained participants displayed greater MyHCI and lesser MyHCIIa abundance compared with untrained participants. This is consistent with greater Type I and lesser Type IIa fiber content in endurance-trained individuals owing to genetic and environmental factors [6,15]. Whilst our cross-sectional design precludes causative analysis [10], MyHC data are consistent with known age- and activity-related phenotypes [7,21,25]. Our ability to confirm existing paradigms of age- and activity-related MyHC phenotypes using traditional analysis meant we could largely exclude the possibility that discoveries made by LC-MS profiling were entirely specific to the population of individuals and instead can be discussed alongside existing literature.
Label-free profiling overcomes many of the technical limitations associated with 1D and 2D gel electrophoresis and could significantly advance phenotyping of skeletal muscle. Nonetheless, LC-MS analysis based solely on intensities of parent ion masses can be confounded by interference from unrelated peptides that share analogous retention times and mass-to-charge ratios [
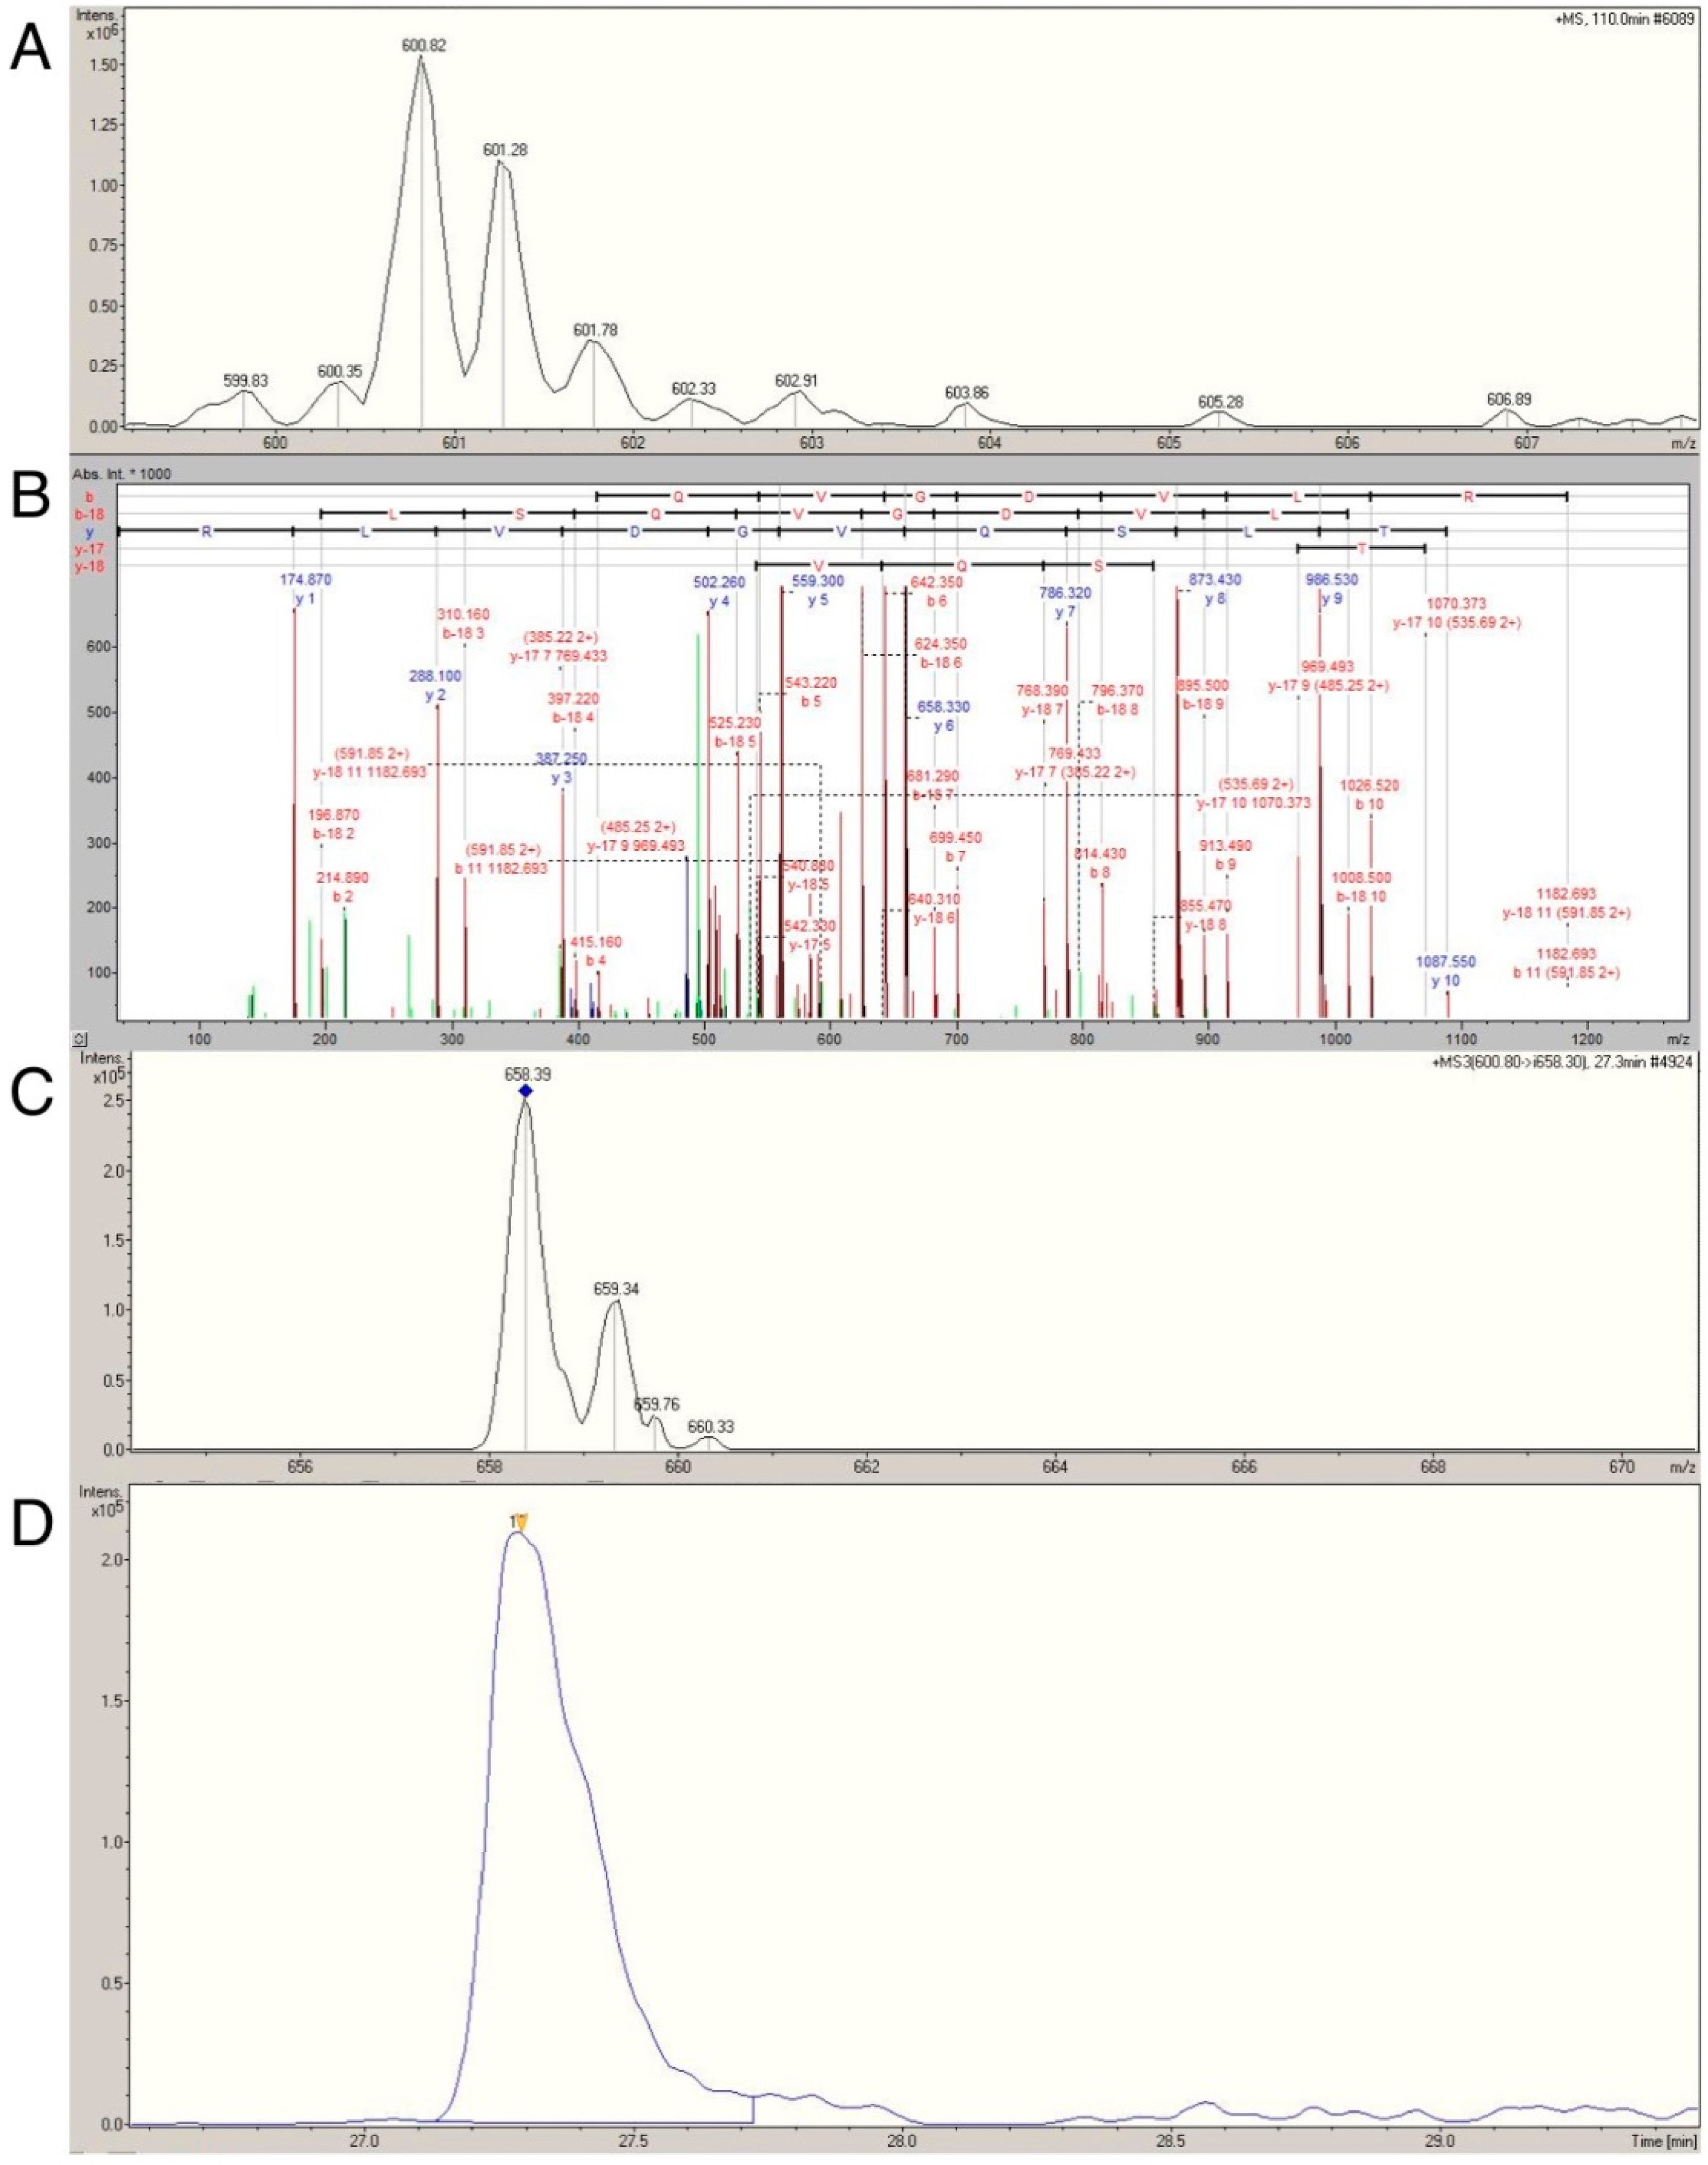
12]. With this limitation in mind, we sought to verify the age- and activity-related differences in actin, myosin, tropomyosin, MLRS, MYL1 and MYL3 using multiple reaction monitoring (MRM; reviewed in [37]) This technique selectively monitors and quantifies the intensity of daughter ions from known parent ions (termed transitions [12]), which greatly enhances the specificity of the analysis. We previously used MRM to confirm that heart-type fatty acid protein was more abundant in rodents artificially selected for higher aerobic capacity compared with lower aerobic capacity [12], affirming the utility of this approach in skeletal muscle. Application of MRM to the myofibrillar fraction presented a significant analytical challenge owing to high myofibrillar protein sequence homology. For example, MYL1 and MYL3 share 72.6% sequence identify. Consequently, only isoform specific transitions in selected proteins were analyzed.
Myosin essential (MYL1, MYL3) and regulatory (MLRS) light chains were selected for MRM analysis owing to their essential role in regulating contractile velocity [38] and prior reports of differential expression in old compared with young skeletal muscle [7,22]. MYL1 and MLRS are predominately, but not exclusively [39,40], expressed in fast twitch muscle, whereas MYL3 is predominately expressed in slow twitch muscle [13,24]. Using known age and activity related phenotypes as a conceptual framework [2,3,6,21,34], it could be predicted, a priori, that: (1) MYL1 and MLRS content should be greater; and (2) MYL3 content should be lesser in the skeletal muscle of elderly compared to young adults. The prediction for MLRS is complicated by conflicting reports of an age-related decrease in MLRS in humans [7] against a drastic increase in MLRS that demarcates the onset of senescence in rodent skeletal muscle [26]. Whilst this could be related to interspecies differences [41], it could equally be attributable to a failure to control for physical activity status particularly in human studies [1,42]. We reasoned that the latter was more likely owing to a recent report documenting lower MRLS content in trained compared with recreational runners [43]. In support of this, we report novel evidence that age-related changes in MLRS abundance could easily be confounded by the physical activity status of the participants. Specifically, MLRS differed as a function of training status and the trend towards differential age-related expression was owing to significantly greater levels in YU compared with OT, but not YT compared with OT. This observation warrants further mechanistic exploration. Future reports may wish to extend our observations by comparing the relative abundance and phosphorylation status of each of the fast and slow regulatory isoforms.
We also report novel data identifying that MYL1 and MYL3 content is lesser and greater, respectively, in the muscle of old compared with younger adults. As a consequence, the ratio between MYL3 and MYL1 is dramatically different between young, elderly, trained and untrained humans (Table 4 and Table 5). Our findings are the first of their kind rendering comparison with previous literature difficult. This notwithstanding, MYL1, MYL3 and MLRS data confirm our MyHC analysis and are consistent with the notion that ageing is accompanied by preferential Type II MU loss [2,34]. It will, however, be important to confirm this observation with longitudinal studies that permit greater mechanistic insight; as one cannot rule out the possibility that innate fiber type differences between our groups underpinned our observations and not age or physical activity status per se. Such caveats should be viewed globally; that is, they are generic to the research field, being unrestricted to the present study owing to the difficulties associated with conducting longitudinal studies of human ageing.
MRM affords semi-automated, rapid and quantitative phenotyping [12,37] and the potential wider application of this approach has not escaped our attention. Future investigators may wish to use our data as a resource to perform isoform specific MRM analysis of myosin light chain content; thus, obviating the limitations of traditional methods of muscle phenotyping. In the future, this approach could be further extended by spiking samples with stable isotope-labeled peptides to provide quantitative analysis of human samples.

4. Materials and Methods

4.1. Participants

Ethical approval was granted from the Liverpool John Moores University Ethics Committee and the present study adhered to the declaration of Helsinki. After providing written informed consent, 12 younger (18–30 years) and 12 older (≥55 years) Caucasian males participated and were segregated according to training history to yield four experimental groups: young trained (YT, n = 6), young untrained (YU, n = 6), old trained (OT, n = 6) and old untrained (OU, n = 6). Trained participants were competitive amateur cyclists that had habitually completed at least five endurance sessions per week. Untrained participants did not participate in systematic endurance training and completed ≥3 exercise sessions per week. Basic participant anthropometrical and physiological characteristics have been reported previously [42,44].

4.2. Muscle Biopsies

After the administration of a local anesthetic (0.5% Marcaine), muscle biopsies were obtained from the Vastus Lateralis using a Bard Monopty disposable biopsy instrument (12 cm × 10 cm gauge, Bard Monopty Systems, Tempe, AZ, USA). Muscle samples were immediately snap frozen in liquid nitrogen and stored at −80 °C until further analysis.

4.3. MyHC Isoform Staining

Approximately 20–30 mg of frozen muscle tissue was ground to powder and homogenized in 120 μL of ice cold lysis buffer supplemented with phosphatase and protease inhibitors (25 mM Tris/HCl (pH 7.4), 50 mM NaF, 100 mM NaCl, 5 mM EGTA, 1 mM EDTA, 10 mM Na-Pyrophosphatase, 1 mM Na3VO4, 0.27 M sucrose, 1% Triton X-100, 0.1% 2-mercaptoethanol). Homogenates were centrifuged at 1000 g for 10 min at 4 °C. The resultant pellet (myofibrillar protein) was re-suspended in 1% SDS buffer and boiled at 95 °C for 5 min. Protein content was determined using a Bradford assay [45]. Samples (10 µL equivalent to 0.5 µg·µL−1 protein) were separated by molecular weight using an 8% denaturing gel electrophoresis protocol (see [29,30]). Samples were electrophoresed on ice for 15 h at 280 V. Polyacrylamide gels were washed (ddH2O) and stained with Coomassie blue, as previously described [46,47]. Bands were quantified by densitometry analysis on T120 (Total lab., Newcastle upon Tyne, UK) software.

4.4. Label Free Liquid Chromatography Coupled Mass Spectrometry (LC-MS)

The myofibrillar faction was prepared for in-solution digest by precipitating supernatants in 5 volumes of acetone, re-suspending in 0.1% (w/v) Rapigest SF (Waters; Milford, MA, USA) and 50 mM ammonium bicarbonate before incubation at 80 °C for 15 min. Pellets were reduced with DTT (final concentration 1 mM) at 60 °C for 15 min in the dark before being alkylated with 5 mM at 4 °C for 30 min. Sequence grade trypsin (Promega, Madison, WI, USA) was added at a protein ratio of 1:50 and digestion allowed to proceed at 37 °C overnight. Digestion was terminated by 2 μL concentrated TFA addition. Tryptic peptide solutions were cleared by centrifugation at 13,000 g for 15 min at room temperature.
Label free LC-MS analysis was performed on a quadrupole-high capacity ion-trap (HCT Ultra ETD II; Bruker Daltonics, Bremen, Germany) coupled to an online electrospray ionization and nano-flow HPLC system (Ultimate 3000; Dionex, Sunnyvale, CA, USA). Consistent with previous work [12], tryptic digests (0.8 μg/μL) were diluted 1:10 in 0.1% formic acid (FA) solution. Samples (5 µL) were loaded onto a pre-column (Agilent Technologies Ltd., Santa Carla, CA, USA) and separated on Zorbax 300SB C18 3.5 μm, 15 cm × 75 μm analytical reverse phase column (Agilent Technologies Ltd.) at a flow rate of 300 nL·min−1 using a non-linear gradient rising to 40% acetonitrile 0.1% FA over 160 min. Mass spectra for LC-MS profiling were recorded between 200 m/z and 2500 m/z using standard enhanced mode (8100 (m/z)/s). Equivalent data-dependent tandem mass spectrometry (MS/MS) spectra were collected from triplicate analysis of a pooled standard. MS/MS spectra of collision-induced dissociation fragment ions were recorded for the 5 most abundant precursors from each survey scan (350 to 1600 m/z).
Profile analysis (defined by two attributes: age and physical activity status) was used to calculate peptide regulation ratios. Peptides that significantly differed between group attributes were determined (Profile Analysis Version 4.0; Bruker Daltonics, Bremen, Germany). LC-MS/MS data were combined to identify proteins with a Swiss-Prot database restricted to “Human” on a locally implemented Mascot (www.matrixscience.com) server (version 2.2.03). Peptide/protein identifications were linked to the peptide regulation ratios determined in Profile Analysis and protein regulation ratios were calculated from peptide regulation ratios.

4.5. Selective Reaction Monitoring (SRM)

SRM [37] was used to verify and quantify differences in myosin light chain 1 (MYL1), myosin light chain 3 (MYL3) and myosin regulatory light chain 2 (MLRS) isoform specific tryptic digests and their associated precursor and product fragment ions. Samples were separated using a linear chromatographic gradient rising to 40% acetonitrile and 0.1% FA over 15 min. Samples were analyzed in duplicate and in a randomized order. Transitions of m/z 498–759 were monitored for MYL3, m/z 771–835 and m/z 600–658 for MYL1, m/z 660–735 and m/z 762–780 for MLRS.

4.6. Statistical Analysis

A two-way ANOVA was employed to determine the influence of age (i.e., young vs. old) and physical activity (i.e., trained vs. untrained) levels on outcome variables (e.g., MyHC content). To determine where significant differences occurred, significant main effects of age and activity levels were further explored with post-hoc Bonferroni tests. An α value of p ≤ 0.05 was used for all tests. Statistical analysis was performed on the Statistical Package for Social Sciences (SPSS, version 17.0, SPSS Inc.: Chicago, IL, USA). Data are presented as Mean and SD (±).

5. Conclusions

We used an advanced analytical workflow to perform phenotypic profiling of the human myofibrillar proteome. In doing so we discovered and verified novel differences in the abundance of essential myosin light chains MYL1 and MYL3 associated with age. Moreover, by studying well-defined populations of physically-active and sedentary individuals we were able to resolve previously conflicting data regarding differences in regulatory myosin light chain content in the muscle of young and elderly adults.

Acknowledgments

Z.A.M. was funded by University Pendidikan Sultan Idris and Ministry of Higher Education, Malaysia.

Author Contributions

G.L.C., J.P.M. and J.G.B. conceived and designed the experiments; J.N.C. and Z.A.M performed the experiments; all authors analyzed the data and contributed reagents/materials/analysis tools; and J.N.C., Z.A.M. and J.G.B. wrote the paper.

Conflicts of Interest

The authors declare no conflict of interest.

Abbreviations

The following abbreviations are used in this manuscript:
2DGETwo-dimensional gel electrophoresis
LC-MSliquid chromatography mass spectrometry
MLRSMyosin Light Regulatory Chain, fast isoform
MRMMultiple Reaction Monitoring
MyHCMyosin Heavy Chain
MYL1Myosin Light Chain 1
MYL3Myosin Light Chain 3
MUMotor unit
OTOld Trained
OUOld Untrained
SRMSelective Reaction Monitoring
YTYoung Trained
YUYoung Untrained

References

  1. Cobley, J.N.; Moult, P.R.; Burniston, J.G.; Morton, J.P.; Close, G.L. Exercise improves mitochondrial and redox-regulated stress responses in the elderly: Better late than never! Biogerontology 2015, 16, 249–264. [Google Scholar] [CrossRef] [PubMed]
  2. Piasecki, M.; Ireland, A.; Jones, D.A.; McPhee, J.S. Age-dependent motor unit remodelling in human limb muscles. Biogerontology 2015. [Google Scholar] [CrossRef] [PubMed]
  3. Pette, D.; Staron, R.S. Myosin isoforms, muscle fiber types, and transitions. Microsc. Res. Tech. 2000, 50, 500–509. [Google Scholar] [CrossRef]
  4. Schiaffino, S.; Reggiani, C. Fiber types in mammalian skeletal muscles. Physiol. Rev. 2011, 91, 1447–531. [Google Scholar] [CrossRef] [PubMed]
  5. Deschenes, M.R. Effects of aging on muscle fibre type and size. Sports Med. 2004, 34, 809–824. [Google Scholar] [CrossRef] [PubMed]
  6. Zierath, J.R.; Hawley, J.A. Skeletal muscle fiber type: Influence on contractile and metabolic properties. PLoS Biol. 2004, 2, e348. [Google Scholar] [CrossRef] [PubMed] [Green Version]
  7. Gelfi, C.; Viganò, A.; Ripamonti, M.; Pontoglio, A.; Begum, S.; Pellegrino, M.A.; Grassi, B.; Bottinelli, R.; Wait, R.; Cerretelli, P. The human muscle proteome in aging. J. Proteome Res. 2006, 5, 1344–1353. [Google Scholar] [CrossRef] [PubMed]
  8. Kammoun, M.; Cassar-Malek, I.; Meunier, B.; Picard, B. A simplified immunohistochemical classification of skeletal muscle fibres in mouse. Eur. J. Histochem. 2014, 58, 2254. [Google Scholar] [CrossRef] [PubMed]
  9. Bloemberg, D.; Quadrilatero, J. Rapid determination of myosin heavy chain expression in rat, mouse, and human skeletal muscle using multicolor immunofluorescence analysis. PLoS ONE 2012, 7, e35273. [Google Scholar] [CrossRef] [PubMed]
  10. Lanza, I.R.; Short, D.K.; Short, K.R.; Raghavakaimal, S.; Basu, R.; Joyner, M.J.; McConnell, J.P.; Nair, K.S. Endurance exercise as a countermeasure for aging. Diabetes 2008, 57, 2933–2942. [Google Scholar] [CrossRef] [PubMed]
  11. Safdar, A.; Hamadeh, M.J.; Kaczor, J.J.; Raha, S.; DeBeer, J.; Tarnopolsky, M.A. Aberrant mitochondrial homeostasis in the skeletal muscle of sedentary older adults. PLoS ONE 2010, 5, e10778. [Google Scholar] [CrossRef] [PubMed]
  12. Malik, Z.A.; Cobley, J.N.; Morton, J.P.; Close, G.L.; Edwards, B.J.; Koch, L.G.; Britton, S.L.; Burniston, J.G. Label-Free LC-MS Profiling of Skeletal Muscle Reveals Heart-Type Fatty Acid Binding Protein as a Candidate Biomarker of Aerobic Capacity. Proteomes 2013, 1, 290–308. [Google Scholar] [CrossRef] [PubMed]
  13. Drexler, H.C.A.; Ruhs, A.; Konzer, A.; Mendler, L.; Bruckskotten, M.; Looso, M.; Gunther, S.; Boettger, T.; Kruger, M.; Braun, T. On Marathons and Sprints: An Integrated Quantitative Proteomics and Transcriptomics Analysis of Differences Between Slow and Fast Muscle Fibers. Mol. Cell. Proteom. 2012, 11, 1–16. [Google Scholar] [CrossRef] [PubMed]
  14. Burniston, J.G.; Kenyani, J.; Gray, D.; Guadagnin, E.; Jarman, I.H.; Cobley, J.N.; Cuthbertson, D.J.; Chen, Y.W.; Wastling, J.M.; Lisboa, P.J.; et al. Conditional independence mapping of DIGE data reveals PDIA3 protein species as key nodes associated with muscle aerobic capacity. J. Proteom. 2014, 106, 230–245. [Google Scholar] [CrossRef] [PubMed]
  15. Spangenburg, E.E.; Booth, F.W. Molecular regulation of individual skeletal muscle fibre types. Acta Physiol. Scand. 2003, 178, 413–424. [Google Scholar] [CrossRef] [PubMed]
  16. Rowan, S.L.; Rygiel, K.; Purves-Smith, F.M.; Solbak, N.M.; Turnbull, D.M.; Hepple, R.T. Denervation causes fiber atrophy and myosin heavy chain co-expression in senescent skeletal muscle. PLoS ONE 2012, 7, e29082. [Google Scholar] [CrossRef] [PubMed]
  17. Burniston, J.G.; Hoffman, E.P. Proteomic responses of skeletal and cardiac muscle to exercise. Expert Rev. Proteom. 2011, 8, 361–377. [Google Scholar] [CrossRef] [PubMed]
  18. Parker, K.C.; Walsh, R.J.; Salajegheh, M.; Amato, A.A.; Krastins, B.; Sarracino, D.A.; Greenberg, S.A. Characterization of human skeletal muscle biopsy samples using shotgun proteomics. J. Proteome Res. 2009, 8, 3265–3277. [Google Scholar] [CrossRef] [PubMed]
  19. Gelfi, C.; De Palma, S.; Cerretelli, P.; Begum, S.; Wait, R. Two-dimensional protein map of human vastus lateralis muscle. Electrophoresis 2003, 24, 286–295. [Google Scholar] [CrossRef] [PubMed]
  20. Højlund, K.; Yi, Z.; Hwang, H.; Bowen, B.; Lefort, N.; Flynn, C.R.; Langlais, P.; Weintraub, S.T.; Mandarino, L.J. Characterization of the human skeletal muscle proteome by one-dimensional gel electrophoresis and HPLC-ESI-MS/MS. Mol. Cell. Proteom. 2008, 7, 257–267. [Google Scholar] [CrossRef] [PubMed]
  21. Doran, P.; Donoghue, P.; O’Connell, K.; Gannon, J.; Ohlendieck, K. Proteomics of skeletal muscle aging. Proteomics 2009, 9, 989–1003. [Google Scholar] [CrossRef] [PubMed]
  22. Gannon, J.; Doran, P.; Kirwan, A.; Ohlendieck, K. Drastic increase of myosin light chain MLC-2 in senescent skeletal muscle indicates fast-to-slow fibre transition in sarcopenia of old age. Eur. J. Cell Biol. 2009, 88, 685–700. [Google Scholar] [CrossRef] [PubMed]
  23. Connell, K.O.; Gannon, J.; Doran, P.; Ohlendieck, K.A.Y.; O’Connell, K. Proteomic profiling reveals a severely perturbed protein expression pattern in aged skeletal muscle. Int. J. Mol. Med. 2007, 20, 145–153. [Google Scholar]
  24. Staunton, L.; Zweyer, M.; Swandulla, D.; Ohlendieck, K. Mass spectrometry-based proteomic analysis of middle-aged vs. aged vastus lateralis reveals increased levels of carbonic anhydrase isoform 3 in senescent human skeletal muscle. Int. J. Mol. Med. 2012, 30, 723–733. [Google Scholar] [PubMed]
  25. Capitanio, D.; Vasso, M.; de Palma, S.; Fania, C.; Torretta, E.; Cammarata, F.P.; Magnaghi, V.; Procacci, P.; Gelfi, C. Specific protein changes contribute to the differential muscle mass loss during ageing. Proteomics 2016, 16, 645–656. [Google Scholar] [CrossRef] [PubMed]
  26. Gannon, J.; Doran, P.; Kirwan, A.; Ohlendieck, K. Drastic increase of myosin light chain MLC-2 in senescent skeletal muscle indicates fast-to-slow fibre transition in sarcopenia of old age. Eur. J. Cell Biol. 2009, 88, 685–700. [Google Scholar] [CrossRef] [PubMed]
  27. Jungblut, P.R.; Holzhütter, H.G.; Apweiler, R.; Schlüter, H. The speciation of the proteome. Chem. Cent. J. 2008, 2, 16. [Google Scholar] [CrossRef] [PubMed]
  28. Burniston, J.G.; Connolly, J.; Kainulainen, H.; Britton, S.L.; Koch, L.G. Label-free profiling of skeletal muscle using high-definition mass spectrometry. Proteomics 2014, 14, 2339–2344. [Google Scholar] [CrossRef] [PubMed]
  29. Deshmukh, A.S.; Murgia, M.; Nagaraj, N.; Treebak, J.T. Deep Proteomics of Mouse Skeletal Muscle Enables Quantitation of Protein Isoforms, Metabolic Pathways, and Transcription Factors. Mol. Cell. Proteom. 2015, 14, 841–853. [Google Scholar] [CrossRef] [PubMed]
  30. Cobley, J.N.; Sakellariou, G.K.; Murray, S.; Waldron, S.; Gregson, W.; Burniston, J.G.; Morton, J.P.; Iwanejko, L.A.; Close, G.L. Lifelong endurance training attenuates age-related genotoxic stress in human skeletal muscle. Longev. Health 2013, 2, 11. [Google Scholar] [CrossRef] [PubMed]
  31. Staron, R.S.; Hagerman, F.C.; Hikida, R.S.; Murray, T.F.; Hostler, D.P.; Crill, M.T.; Ragg, K.E.; Toma, K. Fiber Type Composition of the Vastus Lateralis Muscle of Young Men and Women. J. Histochem. Cytochem. 2000, 48, 623–629. [Google Scholar] [CrossRef] [PubMed]
  32. Periasamy, M.; Strehler, E.E.; Garfinkel, L.I.; Gubits, R.M.; Ruiz-Opazo, N.; Nadal-Ginard, B. Fast skeletal muscle myosin light chains 1 and 3 are produced from a single gene by a combined process of differential RNA transcription and splicing. J. Biol. Chem. 1984, 259, 13595–13604. [Google Scholar] [PubMed]
  33. Cohen-Haguenauer, O.; Barton, P.J.R.; van Cong, N.; Cohen, A.; Masset, M.; Buckingham, M.; Frézal, J. Chromosomal assignment of two myosin alkali light-chain genes encoding the ventricular/slow skeletal muscle isoform and the atrial/fetal muscle isoform (MYL3, MYL4). Hum. Genet. 1989, 81, 278–282. [Google Scholar] [CrossRef] [PubMed]
  34. Hepple, R.T.; Rice, C.L. Innervation and neuromuscular control in ageing skeletal muscle. J Physiol. 2015. [Google Scholar] [CrossRef] [PubMed]
  35. De Winter, F.; Vo, T.; Stam, F.J.; Wisman, L.A.B.; Bär, P.R.; Niclou, S.P.; van Muiswinkel, F.L.; Verhaagen, J. The expression of the chemorepellent Semaphorin 3A is selectively induced in terminal Schwann cells of a subset of neuromuscular synapses that display limited anatomical plasticity and enhanced vulnerability in motor neuron disease. Mol. Cell. Neurosci. 2006, 32, 102–117. [Google Scholar] [CrossRef] [PubMed]
  36. Pasterkamp, R.J. Getting neural circuits into shape with semaphorins. Nat. Rev. Neurosci. 2012, 13, 605–618. [Google Scholar] [CrossRef] [PubMed]
  37. Picotti, P.; Aebersold, R. Selected reaction monitoring–based proteomics: Workflows, potential, pitfalls and future directions. Nat. Methods 2012, 9, 555–566. [Google Scholar] [CrossRef] [PubMed]
  38. Kim, J.H.; Torgerud, W.S.; Mosser, K.H.H.; Hirai, H.; Watanabe, S.; Asakura, A.; Thompson, L.V. Myosin light chain 3f attenuates age-induced decline in contractile velocity in MHC type II single muscle fibers. Aging Cell 2012, 11, 203–212. [Google Scholar] [CrossRef] [PubMed]
  39. Billeter, R.; Heizmann, C.W.; Howald, H.; Jenny, E. Analysis of myosin light and heavy chain types in single human skeletal muscle fibers. Eur. J. Biochem. 1981, 116, 389–395. [Google Scholar] [CrossRef] [PubMed]
  40. Miller, M.S.; Bedrin, N.G.; Callahan, D.M.; Previs, M.J.; Jennings, M.E.; Ades, P.A.; Maughan, D.W.; Palmer, B.M.; Toth, M.J. Age-related slowing of myosin actin cross-bridge kinetics is sex specific and predicts decrements in whole skeletal muscle performance in humans. J. Appl. Physiol. 2013, 115, 1004–1014. [Google Scholar] [CrossRef] [PubMed]
  41. Rennie, M.J.; Selby, A.; Atherton, P.; Smith, K.; Kumar, V.; Glover, E.L.; Philips, S.M. Facts, noise and wishful thinking: Muscle protein turnover in aging and human disuse atrophy. Scand. J. Med. Sci. Sport 2010, 20, 5–9. [Google Scholar] [CrossRef] [PubMed]
  42. Cobley, J.N.; Sakellariou, G.K.; Owens, D.J.; Murray, S.; Waldron, S.; Gregson, W.; Fraser, W.D.; Burniston, J.G.; Iwanejko, L.A.; McArdle, A.; et al. Lifelong training preserves some redox-regulated adaptive responses after an acute exercise stimulus in aged human skeletal muscle. Free Radic. Biol. Med. 2014, 70, 23–32. [Google Scholar] [CrossRef] [PubMed]
  43. Reidy, P.T.; Hinkley, J.M.; Trappe, T.A.; Trappe, S.W.; Harber, M.P. Protein composition of endurance trained human skeletal muscle. Int. J. Sports Med. 2014, 35, 476–481. [Google Scholar] [CrossRef] [PubMed]
  44. Cobley, J.N.; Bartlett, J.D.; Kayani, A.; Murray, S.W.; Louhelainen, J.; Donovan, T.; Waldron, S.; Gregson, W.; Burniston, J.G.; Morton, J.P.; et al. PGC-1α transcriptional response and mitochondrial adaptation to acute exercise is maintained in skeletal muscle of sedentary elderly males. Biogerontology 2012, 13, 621–631. [Google Scholar] [CrossRef] [PubMed]
  45. Bradford, M.M. A rapid and sensitive method for the quantitation of microgram quantities of protein utilizing the principle of protein-dye binding. Anal. Biochem. 1976, 72, 248–254. [Google Scholar] [CrossRef]
  46. Talmadge, R.J.; Roy, R.R. Electrophoretic separation of rat skeletal muscle myosin heavy-chain isoforms. J. Appl. Physiol. 1993, 75, 2337–2340. [Google Scholar] [PubMed]
  47. Bamman, M.M.; Clarke, M.S.; Talmadge, R.J.; Feedback, D.L. Enhanced protein electrophoresis technique for separating human skeletal muscle myosin heavy chain isoforms General. Electrophoresis 1999, 20, 466–468. [Google Scholar] [CrossRef]
Figure 1. Separation of MyHC isoforms in human skeletal muscle using denaturing gel electrophoresis: (A) representative image of gel lanes showing separation of MyHC isoforms; (B) density plot showing area of interest, into distinct bands (IIx, IIa, I) based in differences in migration (pooled standard, n = 24); and (C) images of lanes aligned with the area of interest.
Proteomes 04 00015 g001
Figure 2. Influence of age and activity levels on MyHC isoform content in human skeletal muscle. Representative image of gel lanes from young trained (YT), young untrained (YU), old trained (OT) and old untrained (OU) individuals with clear separation of MyHC isoforms into distinct bands.
Proteomes 04 00015 g002
Figure 3. Illustration of the structure of thin filament (actin) and thick (myosin) filament; and its main protein components that are known to exist as multiple isoforms. Protein identifiers and descriptions are from the SwissProt database. The MOWSE score and sequence coverage for each protein are also reported from the database searches.
Proteomes 04 00015 g003
Figure 4. Selective reaction monitoring of MYL1 transition 600.8 → 658.3. Parent ion MS spectra (A) and annotated MS/MS spectra (B) of the doubly-charged peptide ITLSQVGDVLR spanning residues 70–80 of MYL1_HUMAN. Selective monitoring (C) of the y6 ion (m/z 658.3) was used and relative abundance was measured as area under the curve of the extracted ion (m/z 600.8 → 658.3) chromatogram (D).
Proteomes 04 00015 g004
Table 1. Quantitative analysis of MyHC isoform content by group.
BandYTYUOTOUEffect of Age in TrainedEffect of Age in Untrained
IIx (%)9.0 ± 8.313.8 ± 13.50.2 ± 0.49.5 ± 13.198% lower31% lower
Iia (%)35.6 ± 14.250.2 ± 15.121.7 ± 13.8 *30.0 ± 20.740% lower40% lower
I (%)55.4 ± 27.836.0 ± 12.178.1 ± 14.2 *60.5 ± 30.141% higher68% higher
* Denotes significant difference (p ≤ 0.05) from YU.
Table 2. List of myofibrillar proteins identified by LC-MS-MS in a pooled standard.
AccessionProtein NameScoreSC (%)PeptidesMWpI
MYH3Myosin-312,997201223.85.5
MYH13Myosin-135824141223.55.4
MYH7Myosin-731,0735271223.05.5
MYH1Myosin-127,7774111223.05.5
MYH2Myosin-236,6765194222.95.5
MYH4Myosin-418,379281222.95.6
MYOM2Myomesin-211695164.85.8
MYPC1Myosin-binding protein C, slow type7631714128.25.7
ACTN2Alpha-actinin-257054531103.85.2
LDB3LIM domain-binding protein 3125918977.19.4
ALBUSerum albumin precursor1689412069.35.9
K2C1Keratin, type II cytoskeletal 117110666.08.8
PDLI5PDZ and LIM domain protein 513515463.99.6
K1C10Keratin, type I cytoskeletal1166358.85.0
ATPBATP synthase subunit beta, mitochondrial26121656.55.1
DESMDesmin1778391553.55.1
VIMEVimentin42414252.64.9
ENOBBeta-enolase32447446.98.6
CASQ1Calsequestrin-1171811244.53.9
KCRMCreatine kinase M-type518243143.16.9
ACTSActin, alpha skeletal muscle12,390632342.05.1
ACTBActin, cytoplasmic 1635330141.75.2
ALDOAFructose-bisphosphate aldolase A115941.8939.49.2
ALDOCFructose-biphosphate aldolase C10218139.46.5
FHL1Four and a half LIM domains protein 139814336.210.5
G3PGlyceraldehyde-3-phosphate dehydrogenase59938736.09.3
TNNT1Troponin T, slow skeletal muscle111926632.95.8
TPM2Tropomyosin beta- chain 7878381332.84.5
TPM3Tropomyosin alpha-3 chain633844732.84.5
TPM1Tropomyosin alpha- 1 chain 7298441132.74.5
TNNT3Troponin T, fast skeletal muscle126224631.85.6
MYOZ1Myozenin-159951731.79.3
CAH3Carbonic anhydrase 376038629.57.1
MYL6BMyosin light chain 6B15215122.75.5
MYL3Myosin light chain 34390681021.94.9
TNNI1Troponin I, slow skeletal muscle104329521.710.3
TNNI2Troponin I, fast skeletal muscle90114321.39.6
MYL1Myosin light chain 1/3, skeletal muscle827081521.14.8
MLRSMyosin regulatory light chain 2, skeletal muscle 7121722194.7
MLRVMyosin regulatory light chain 2, venticular/cardiac3186721118.84.7
TNNC1Troponin C, slow skeletal and cardiac2619218.43.9
TNNC2Troponin C, skeletal muscle216233418.13.9
MYGMyoglobin316355817.27.9
MYL6Myosin light polypeptide 6140230216.94.4
HBBHemoglobin subunit beta11,4038812166.9
HBDHemoglobin subunit delta4206692169.1
HBAHemoglobin subunit alpha258653615.29.4
Table 3. Label-free LC-MS-MS profiling of the myofibrillar faction of individual samples.
AccessionRetention Time: Mass/Charge Ratiop-Value
AgeTrainingAge × TrainingSequence
ACTS40.1 min: 644.31 m/z0.5520.2890.02GILTLK
98.9 min: 895.86 m/z0.0240.3150.336SYELPDGQVITIGNER
44.7 min: 1162.47 m/z0.0430.5370.678EITALAPSTMK
MLRS83.4 min: 652.64 m/z0.1590.0290.05VAPEEHPTLLTEAPLNPK
103.8 min: 1524.61 m/z0.1170.030.2FLEELLTTQCDR
32.1 min: 1173.43 m/z0.060.0260.399DGIIDKEDLR
MYH104.4 min: 1319.51 m/z0.0450.0460.465GADPEDVITGAFK
117.6 min: 895.91 m/z0.0260.0960.211NAYEESLDQLETLK
21.9 min: 1004.37 m/z0.2680.3480.041ELEEISER
144.6 min: 1893.88 m/z0.0040.0510.051LLSTLFANYAGADAPIEK
67.1 min: 1507.59 m/z0.0150.2750.302LTYTQQLEDLKR
21.5 min: 1272.36 m/z0.0150.510.87TLEDQMNEHR
MYL120.0 min: 1411.48 m/z0.8760.8320.027ELTYQTEEDRK
17.8 min: 1482.51 m/z0.1080.5550.033KVQHELDEAEER
119.4 min: 1010.42 m/z0.5080.0220.444EAFLLFDR
MYL3116.4 min: 1542.60 m/z0.0010.8410.798DQATYEDFVEGLR
22.9 min: 1524.60 m/z0.030.9170.662AAPAPAPPPEPERPK
TPM68.8 min: 1243.50 m/z0.040.5740.63IQLVEEELDR
Table 4. Verification of myosin light chain abundances by multiple reaction monitoring.
TransitionYoungOldAge (p Value)Trained UntrainedActivity (p-Value)
MYL1 (771.7 → 835.4)1372 ± 669796 ± 2800.06868 ± 3881343 ± 6840.024
MYL1 (600.8 → 658.3)2790 ± 13091682 ± 6400.0071761 ± 8482806 ± 12520.013
MYL1 (505.7 → 550.2)3829 ± 21331764 ± 11870.0072014 ± 15153744 ± 21490.025
MYL1 total2081 ± 9771239 ± 4500.0061315 ± 6142075 ± 9530.014
MLY3 (498.2 → 759.4)3579 ± 16826353 ± 33470.0215881 ± 31403867 ± 24030.083
MYL3:MYL1 ratio1.725.13 4.471.86
MLRS (660.2 → 735.4)1029 ± 436740 ± 3990.108701 ± 3791097 ± 4100.029
MLRS (762.8 → 780.2)2101 ± 11351236 ± 8340.0481251 ± 9042164 ± 10800.039
MLRS total1565 ± 778988 ± 5910.055976 ± 6301630 ± 7250.031
Data are presented as mean ± standard deviation (SD) of the area under the curve for each isoform specific transition. Main effect p values are presented for statistical analysis by age (young and old) and activity (trained and untrained) level.
Table 5. MRM transition area under the curve by group.
Isform Specific TransitionYTYUOTOU
MYL1 (771.7 → 835.4)1034 ± 4821779 ± 672703 ± 181 *907 ± 356 *
MYL1 (600.8 → 658.3)5777 ± 25325707 ± 75835457 ± 5430 *8436 ± 8908
MYL1 (505.7 → 550.2)2829 ± 18224829 ± 20721199 ± 373 *2441 ± 1515
MYL1 Average1568 ± 8012698 ± 4591062 ± 186 *1451 ± 600 *
MYL3 (498.2 → 759.4)4529 ± 14782438 ± 11667233 ± 3889 *5296 ± 2556
MYL3:MYL1 ratio2.890.906.813.65
MLRS (762.8 → 780.2)1632 ± 1162571 ± 980869 ± 321 *1675 ± 1081
MLRS (660.2 → 735.4)829 ± 4501229 ± 345573 ± 273 *939 ± 46
MLRS Average1231 ± 7941900 ± 658721 ± 295 *1307 ± 730
Data are presented as mean ± standard deviation (SD) of the area under the curve for each isoform specific transition. * Denotes significant difference (p ≤ 0.05) from YU group.

