1. Introduction
The goal of this research article is to present education for sustainability as a curricular model that promotes science learning in a U.S. elementary classroom through equity pedagogy. We define equity pedagogy as teaching and learning strategies that help diverse students attain the knowledge and skills needed to function effectively in a democratic society [
1]. Equity pedagogy aligns with the United Nation’s (UN) goals of sustainable development, which includes the reduction of inequalities and the provision of quality education [
2]. We view sustainability not as a utopian future or an unalterable state, but as a process of searching for balance [
3]. Likewise, equity is neither solely about ‘closing the achievement gap’ nor does it represent a fixed endpoint [
4]. The parallels drawn between sustainability and equity are intended to emphasize their interdependence in science education. For example, by nurturing the adaptability of communities to environmental change, we are concurrently deepening knowledge about human and natural systems [
5].
A key challenge facing the U.S. in the coming decades is the need to recruit, train, and retain a diverse, well-prepared science workforce [
6]. This is particularly pressing for traditionally underrepresented populations in science, and has helped precipitate the Next Generation Science Standards (NGSS). The NGSS re-centers K-12 science education on core disciplinary ideas but also emphasizes connections across multiple, related areas of learning [
7]. Instead of NGSS, however, some schools in the country have opted to use education for sustainability (EFS) as an interdisciplinary framework for teaching and learning science. For example, one EFS content standard (or essential learning outcome) states that students will develop a strong connection to the places they live by recognizing and valuing the interdependency of ecological and social systems [
8]. Consequently, EFS does not compartmentalize science into discrete bodies of knowledge. Instead, teachers in science, social studies, and humanities might co-develop an instructional unit on deforestation that addresses the historical contexts as well as ecological impacts of logging in post-colonial landscapes. Viewed from this perspective, EFS is well suited to equity pedagogy in science education because it validates the diverse worlds that learners inhabit, both in and out of the classroom.
Efforts to increase equity in science classrooms are not new. For instance, the work by Ladson-Billings [
9] draws attention to the need for a culturally responsive pedagogy. Furthermore, Barton [
4] advocates for commitment to an urban science education focused on social justice, while Meyer and Crawford [
10] contend that science should be taught as a cultural way of knowing. These efforts, however, have typically been situated within the framework of NGSS (or earlier curricular models) rather than EFS. While this is not necessarily a disadvantage, it does highlight the relative absence of research about equity in the context of sustainability, particularly when science is framed by human–environment relationships. For example, Tugurian and Carrier [
11] note that learners’ connections to the environment as well as their interests and feelings in relation to the natural world are largely absent from elementary science education. Our study, therefore, presents a unique opportunity to understand equity in EFS, and to discuss its implications for science education.
2. Concept Maps and EFS
According to Novak and Gowin [
12], concept maps are “schematic devices for representing a set of concept meanings embedded in a framework of propositions” (p. 15). They are a visual road map of learners’ cognitive structures with multi-directional lines and linking words connecting different concepts. Concept maps allow growth to be charted utilizing pre- and post-concept maps, which are similar to cartographic maps illustrating learners’ expanding geographic knowledge over time [
13]. Concept maps are a unique teaching and learning tool in that they can be assessed qualitatively and/or quantitatively [
14,
15]. Additionally, concept maps can be scaffolded for a variety of instructional and learning needs, thereby promoting equity in science education. For example:
Concept maps can be constructed with learner-created linking phrases or with instructor-selected prompts [
16];
Concept maps can be computer constructed or made with paper and pencil/pen [
17,
18]; and
Concept maps can vary in structure and content according to the context of the curriculum and the goals of the teacher [
19].
Due to the diverse and adaptive nature of concept maps, a variety of learners and learning styles are supported. Parker, Guillemard, Goetz, and Glarza [
20] found concept maps to be an effective reading comprehension strategy for students who typically performed “lower” on standardized tests. This success of concept maps was credited to their visual representation of content, which is often more effective than text or verbal summaries in understanding, retention, and use of information. Conversely, studies have investigated concept maps as tools for analyzing the thinking patterns and common misconceptions of “high achieving” students [
21]. These researchers found that concept maps were useful in assessing how students relate, organize, and structure concepts. However, there is a paucity of research investigating whether concept maps can benefit different types of learners in the same classroom. Furthermore, while concept maps have been applied as a form of assessment in mainstream curricular models such as NGSS [see for example, 16] studies involving concept maps to understand science learning in EFS as a form of equity pedagogy are relatively scarce, especially with younger learners.
Concept maps are appropriate for use in EFS as they elicit holistic understandings of complex environmental systems, and they prepare learners for environmental challenges that have multiple causes, effects, and interactions. The use of concept maps in EFS also addresses a troubling view of equity where learners are “assigned to social statuses that relate only to race, economic status or gender, rather than to intelligences” [
22] (p. 89). By incorporating concept mapping into EFS, students are encouraged to utilize different intelligences to help them learn and make sense of school science [
23]. That being said, we also recognize that non-visual learners might find concept maps challenging. Additionally, it is also important to note that research has found that not all students reach the level of expertise in concept mapping needed to take full advantage of its benefits [
24]. Cañas, Reiska, and Möllits [
24] discovered the reason for this can usually be traced back to the instructors. Specifically, how the concept map is used with students, the instructors’ understanding of concept mapping, as well as the learning environment and methodology they practice in classrooms. It is important to note that we do not view concept maps as a panacea for equity in science education, but rather, as one way to validate the diversity of learners and the cultural spaces where they are situated. With that in mind, our research question was: Do concept maps equitably elicit science understandings and promote learning among diverse elementary students in EFS?
3. Theoretical Framing: Systems Theory and Mental Models
In the same way that concept maps highlight non-linear interactions, causes and effects in systems tend to be circular. Systems theory has emerged as a theoretical framework that encourages interdisciplinary, non-linear solutions to complex environmental problems [
5]. Systems theory reveals complex patterns and relationships that connote an ensemble of interacting parts that is more than the sum of its components [
25]. In that sense, EFS is a curricular model, or system, designed to encourage holistic thinking about patterns and relationships between science and other disciplines. Then there are broader, cultural systems that EFS and other curricular models are embedded within. These include institutionalized structures about how student learning is evaluated in schools and how success is defined, particularly in school science. An example of this structure is the unspoken expectation that all science learners will know and master the same domains of scientific knowledge.
In addition to the knowledge and cultural systems described above, science learners also construct knowledge in different contexts. They are not “empty vessels” waiting to be filled with knowledge. Rather, learners are actively constructing mental schemas, or mental models, to accommodate new information. In our study, we focus on English Language Acquisition (ELA) and Gifted/Talented (GT) students as two groups of science learners in EFS with mental models that are shaped by different levels of experience, language development, and cognitive maturity. Learners generate mental models from their lived experiences to interpret and explain phenomena [
26]. ELA and GT students may be presented with the same information in class but different mental models may lead to different meanings and understandings of science. Concept maps, therefore, are not only evidence of scientific knowledge; they are also internalized knowledge representations or mental models. Mental models are acquired at an early age and they allow us to explain, justify, and make predictions about phenomena [
27]. Mental models are also reinforced by situational factors (e.g., classroom instruction, community setting), and evolve as further experiences allow learners to refine relations and concepts [
28]. For example, novice science learners may explain that a door should remain closed in winter to prevent warm air from escaping (a common mental model), and later refine their explanation to recognize that opening a door brings in cold air (change in air pressure), which drops the temperature. It is important to acknowledge mental models as valid learning pathways in science education because they play an “organizational role in [children’s] construction of new knowledge and their interpretation of new information” [
29] (p. 7). Thus, concept maps are a tool for eliciting students’ mental models, which in turn exemplify the knowledge and cultural systems within which they learn.
4. Participants and Setting
This study involved ELA and GT students from two, fourth-grade classrooms at a pre-K-8 school in an urban district of Denver. Students are identified as ELA because they do not speak English well or at all, based on an assessment of their language skills. Additionally, a student may be identified as ELA if their spoken skills are proficient, but their reading and writing skills are not [
30]. Students are identified as GT if they demonstrate abilities, talents, and/or the potential for accomplishments that are either exceptional or developmentally advanced such that s/he requires unique educational provisions [
31]. As part of reform efforts in the state of Colorado to meet student achievement benchmarks, the elementary school in this study (Tucker Green School, pseudonym) operates as an innovation school. Innovation schools have increased autonomy and flexibility in areas such as curriculum, budget, school scheduling, staffing, and professional development. Tucker Green School (TGS) received the innovation designation in 2010 partly because of its use of an EFS curriculum. At the time of this study, there were over 500 enrolled students, about 52% male and 48% female, from 18 different countries. Additionally, 60% of the student population qualified for free and reduced lunch (a demographic indicator of low-income) and 20% qualified for English language services. Specifically, TGS had a student population consisting of 20% ELA and 14% GT in 2014 compared to 14% and 3% statewide. Because the population of ELA and GT students were relatively well represented at TGS, teachers were eager to study these populations of learners. Therefore, this study included two fourth-grade classes (students aged 10–11 years): one class had a total of 26 students, with seven ELA and eight GT students. The other class of 27 students had 6 ELA and 10 GT students (
Table 1,
Figure 1).
The EFS curriculum used at TGS has an independent structure and set of science learning outcomes developed by The Cloud Institute, a non-profit organization [
8]. A typical day at the school involves project-based learning where students and teachers can be found engaging with/in energy-efficient buildings, a working farm, and a community garden. For example, we observed a science teacher bringing his students to the garden to explain abiotic and biotic components of ecosystems. The appeal of EFS lies in its ability to motivate students who often do not feel engaged in the classroom, and this is supported by teachers who continue to develop assessments that encourage different expressions of science learning. As education researchers at a local university, we were invited to collaborate with TGS to implement a teaching/learning tool that would provide an alternative assessment for ELA and GT students. Two fourth-grade teachers (one science, one social studies) were able and willing to commit their time to this study. Hence, the study sample consisted of 13 ELA and 18 GT students (31 total) from their respective classrooms.
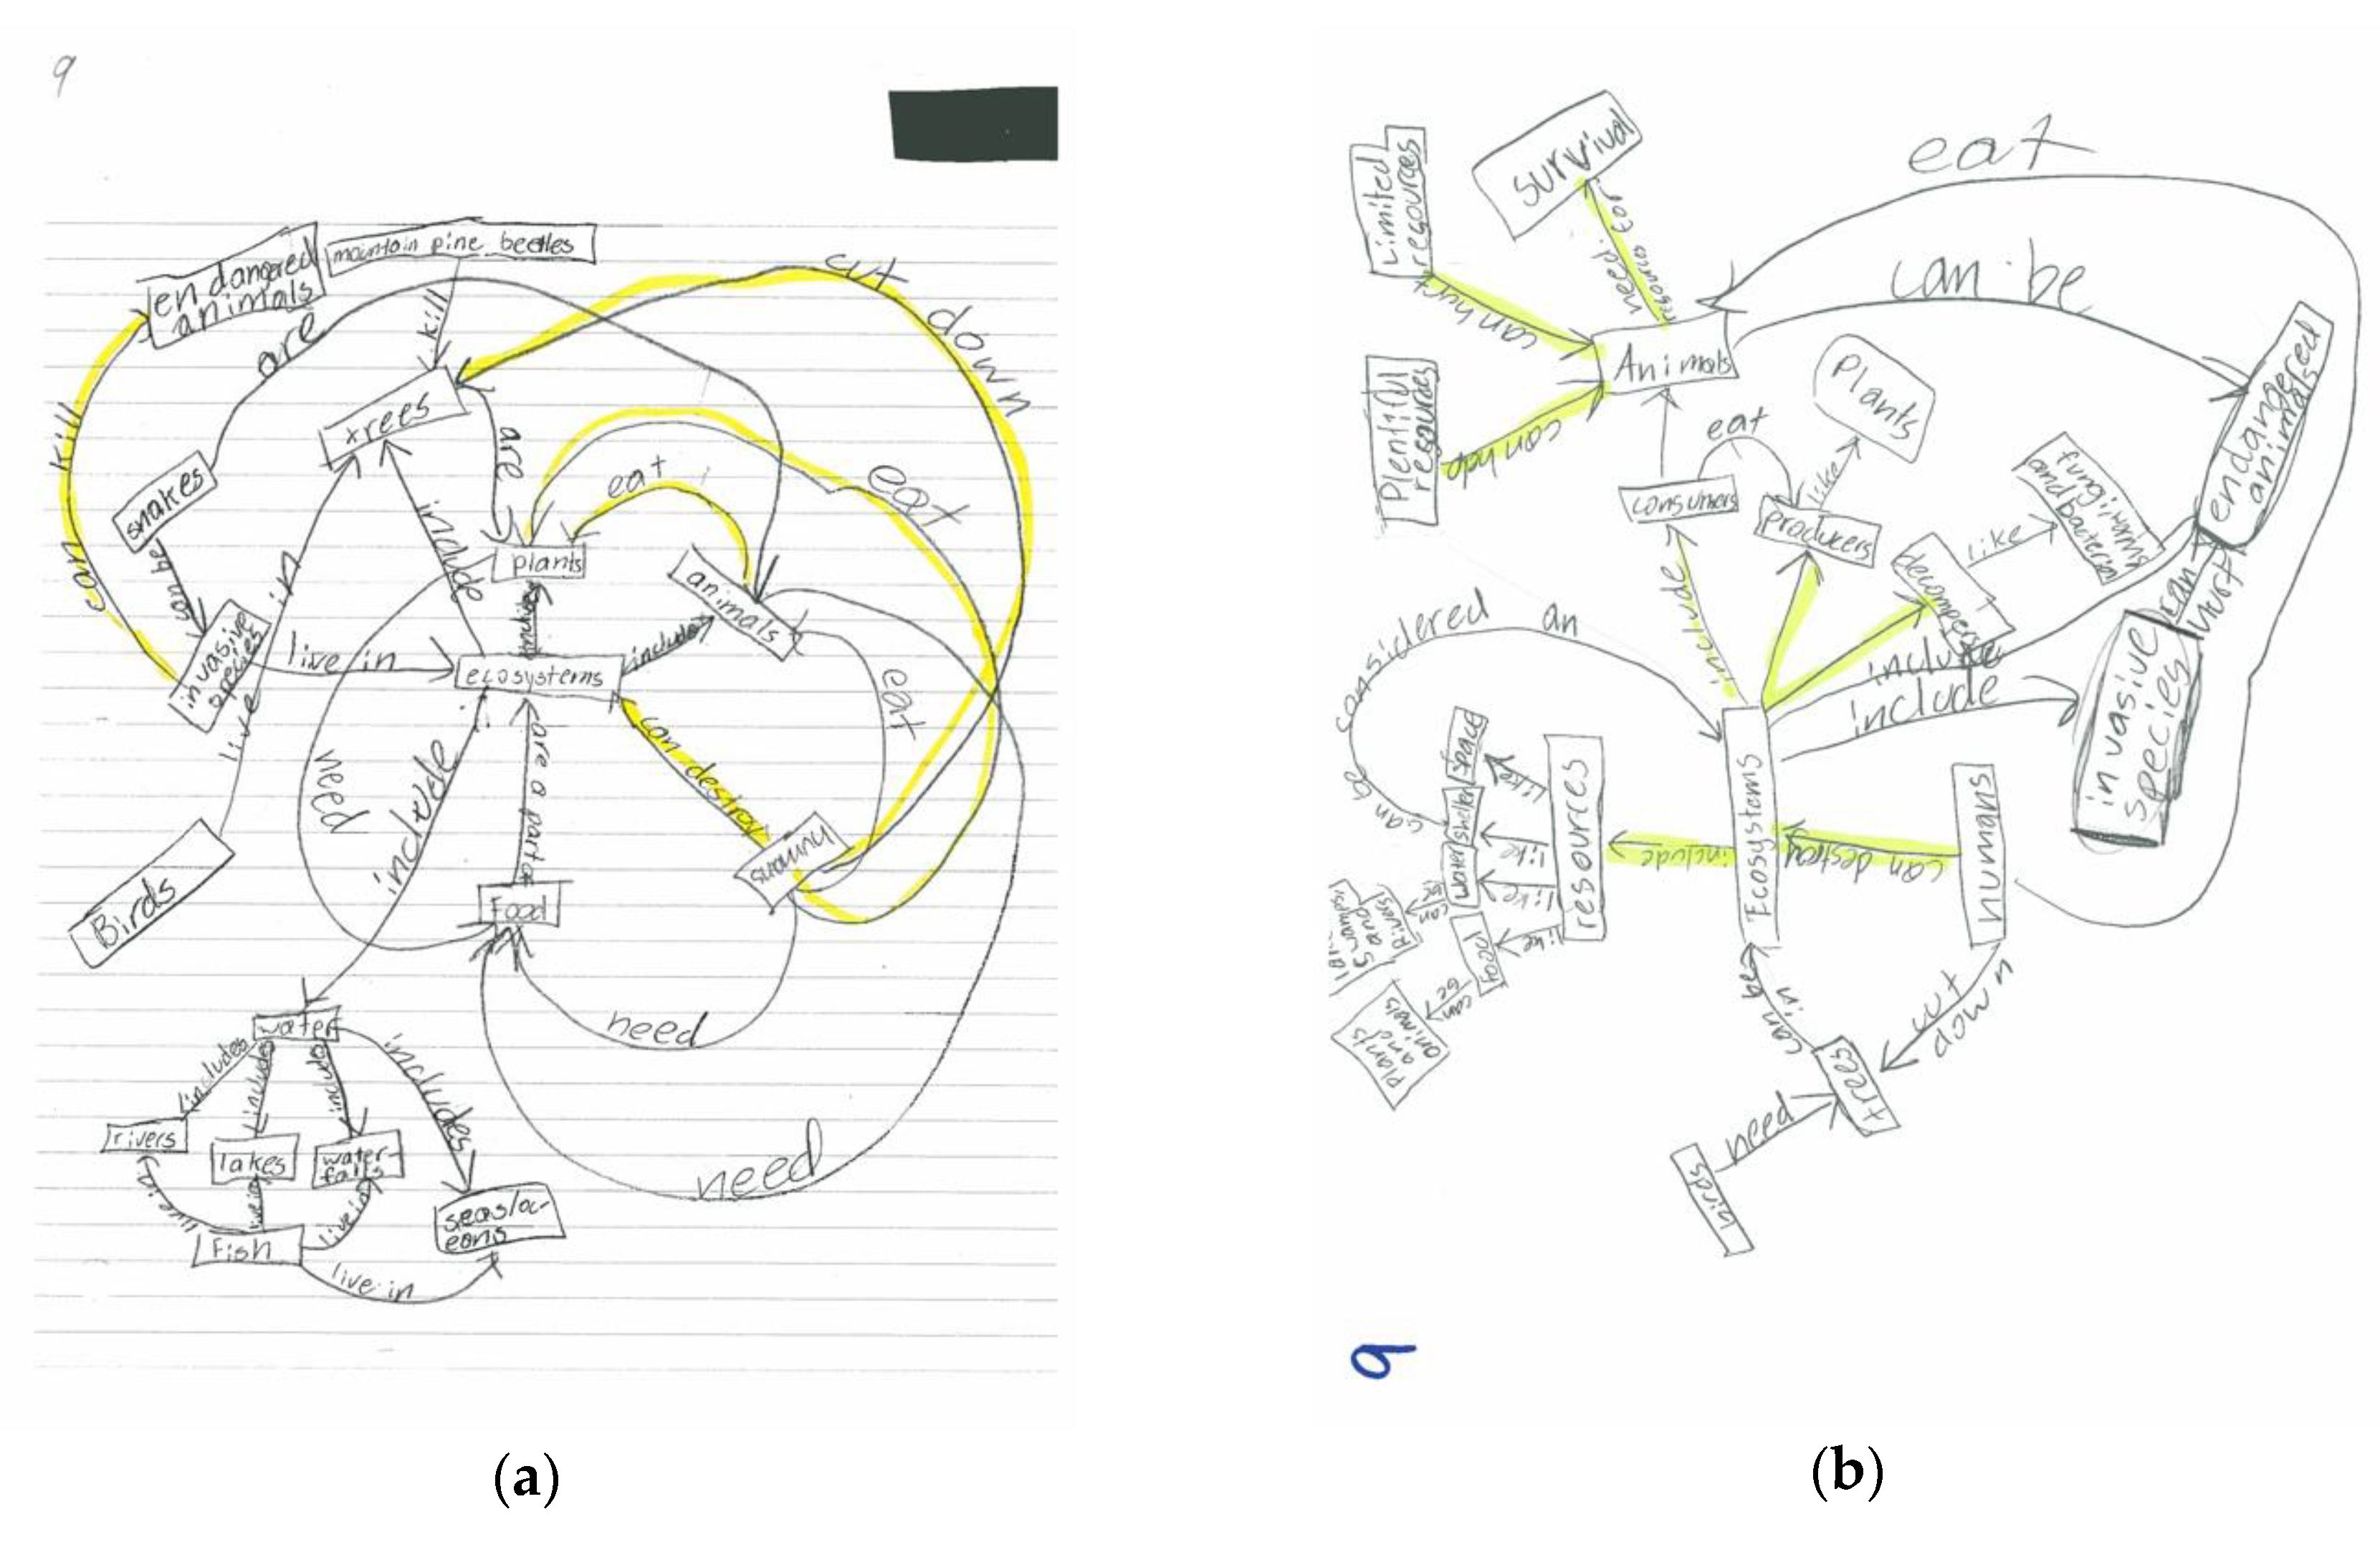
5. Data Collection and Analysis
Upon obtaining human subjects, research approval and informed consent from students and teachers, ELA and GT students from the two classrooms were given the following prompt as part of the fourth-grade science curriculum: “Based on what you know about ecosystems, please make or draw a concept map that shows the interactions between plants, animals and humans for survival, and the changes that result from that”. The concept map focused on ecosystem interactions, and as noted earlier, the prompt emphasized human–environment relationships as part of EFS learning outcomes. Each student completed two concept maps: one prior to and another at the conclusion of, an eight-week curriculum that was collaboratively designed by both teachers. Additionally, ELA and GT students in both classes had already been introduced to concept mapping the year before (when they were in third grade), so they were relatively familiar with the instrument. Specifically, teachers attended a one-day workshop on how to use/score concept maps. They then applied concept maps in their classrooms, at their discretion, for one semester prior to this study. Students’ concept mapping skills were gradually scaffolded to support the introduction of concept maps, and to help them distinguish ‘good’ from ‘bad’ maps—e.g., students were first taught to list key words—then to draw connecting lines, and later to add descriptors. There was no consultation with teachers during this time nor were there any classroom observations. In this way, teachers and students alike were provided opportunities to develop concept mapping skills, and to take advantage of their intrinsic benefits, thereby reducing the risks presented by Cañas et al. [
24] earlier. While it is likely that students’ concept maps in this study more closely reflect their understandings of ecosystem interactions given this ‘trial period’ before data collection, we also recognize limitations with the durability of students’ comfort level with concept maps. This is particularly the case for students whose long-term familiarity with standardized assessments results in them providing discrete facts rather than integrated, holistic understandings in science.
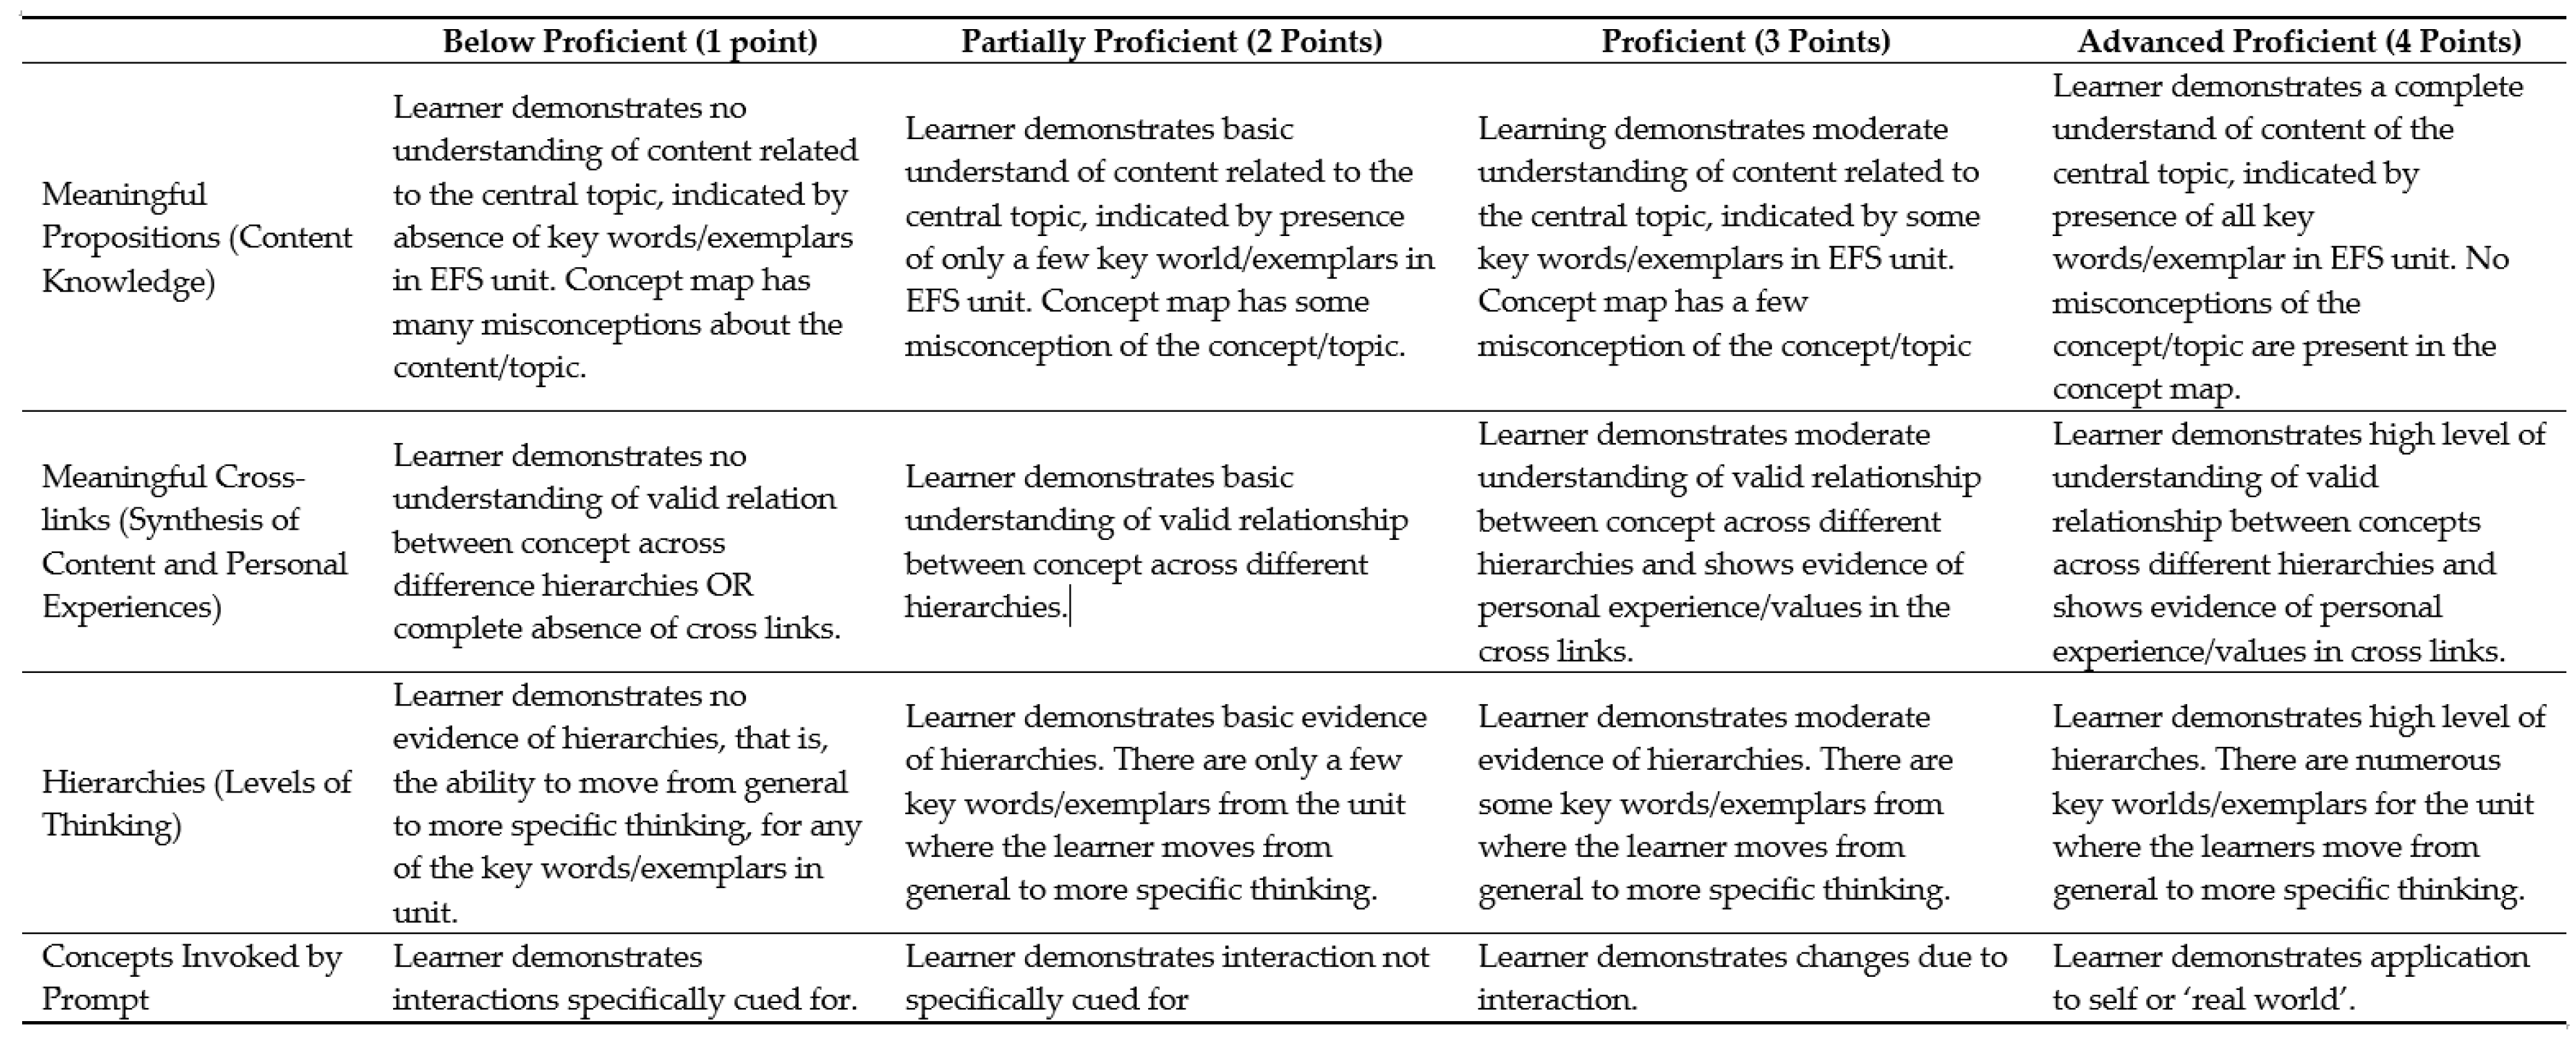
A combined 11 ELA students and 14 GT students (25 out of 31, or 80%) completed both pre- and post-concept maps. Classes were pooled to increase sample size for statistical analyses. The prompt did not change, and all concept maps were scored by two researchers to maintain consistency in interpretation. These researchers scored all concept maps independently and then compared results to insure inter-rater reliability. Both researchers together resolved any discrepancies before giving a final, agreed-upon score to the concept map in question. Additionally, pre- and post-concept maps were scored using the same rubric, which had a maximum of 16 points. The rubric was collaboratively designed by teachers and researchers prior to implementation in the science curriculum (
Table 2).
The rubric included categories of meaningful propositions (content knowledge), meaningful cross-links (synthesis of content and personal experiences), hierarchies (level of thinking), and concepts invoked by the prompt. The first three categories were adapted from the work of Novak and Gowin [
12]. However, the fourth category (concepts invoked by the prompt) emerged from the concept maps during a second round of qualitative analysis [
32]. Similar to Kinchin, Hay, and Adams [
14] concept map analysis approach for conceptual development, this category allowed us to ascertain if students repeated or reorganized the information given in the prompt, or if they demonstrated a deeper level of understanding that was not cued for. This helped to increase the rubric’s trustworthiness and support its validity.
Gains, if any, between pre- and post-concept map scores were calculated by subtracting students’ pre-score from their post-score. A positive gain score represented growth in the knowledge and/or understanding of ecosystem interactions. Gain scores are most reliable as indicators in an ANOVA when there is high correlation between two measures [
33]. Before running an ANOVA, a correlation statistic was generated to account for differences in the pre-test scores. A Pearson product-moment correlation coefficient was computed to assess the relationship between pre- and post-concept map scores at the 0.01 significance level. SPSS was then used to conduct a one-way ANOVA to determine if there was a statistically significant difference in the gain scores between ELA and GT students. Assumptions of independence, normality, and homogeneity of variance (HOV) were checked and all were met.
Individual student interviews were conducted to validate researcher interpretations and to determine whether students were able to extend their knowledge to concepts not specifically cued for in the prompt. Specifically, ELA and GT students were asked the following questions after completing the pre- and post-concept maps: “What do you think are the most important parts of your concept map? How do you feel about concept maps?” We intended for interview data to support quantitative evidence of learning gains as well as to clarify questions related to our interpretation and scoring of students’ concept maps. These interviews also provided an opportunity to probe students’ perceptions of concept maps and to obtain feedback for teachers regarding the suitability of concept maps in the EFS science curriculum. By allowing students to explain their concept maps, we were able to determine if their responses typified rote learning. This approach is not typical in such studies, and it added further depth to our exploration of student learning independent of their GT or ELA status.
6. Findings
Computing the bivariate correlation between pre- and post-scores revealed a positive correlation, and more than half of the variation in post scores is accounted for in pre-score status (
r = 0.74,
n = 27,
p < 0.001;
Table 2). Comparing means illustrates student gain scores increasing from pre- to post-across both student groups with slight deviation around the mean (
Table 3).
Results from ANOVA showed ELA students’ gain scores increasing an average of 1.92 points from pre- to post- (
M = 1.92,
SD = 1.44), while gain scores of GT students increased an average of 1.8 points from pre to post (
M = 1.80,
SD = 2.07; see
Table 4). This may be attributed to differences in pre-test scores and students’ knowledge prior to the start of the eight-week curriculum.
To test for homogeneity of variance in the ANOVA, Levene’s Test statistic was run to determine if HOV was significant and the groups have equal variances. The Levene’s Test statistic yielded results at the 95% confidence level, indicating that the HOV assumption was met. An ANOVA test of between-subject effects (
Table 5) showed no significant difference between gain scores for students who were in either ELA or GT programs (
F(1) = 27.63,
p = 0.870). In other words, change in gain scores were equivalent across ELA and GT students.
To further examine the difference between students’ pre- and post-concept map scores, the normalized gain (
G) score was calculated [
34]. The maximum normalized gain is 1, which indicated that the student gained as much possible, whether from 15 to 16 or from 1 to 16. This is due to the gain score being normalized by the amount of possible gain (max possible score-pre). The average
G from scores was 0.270, which is considered a fairly low normalized gain [
34]. This result indicates both ELA and GT students were not increasing their score substantially between pre- and post-concept maps. Thus, there is no statistical difference between ELA and GT students’ gain scores from pre- to post- and the scores themselves did not change significantly.
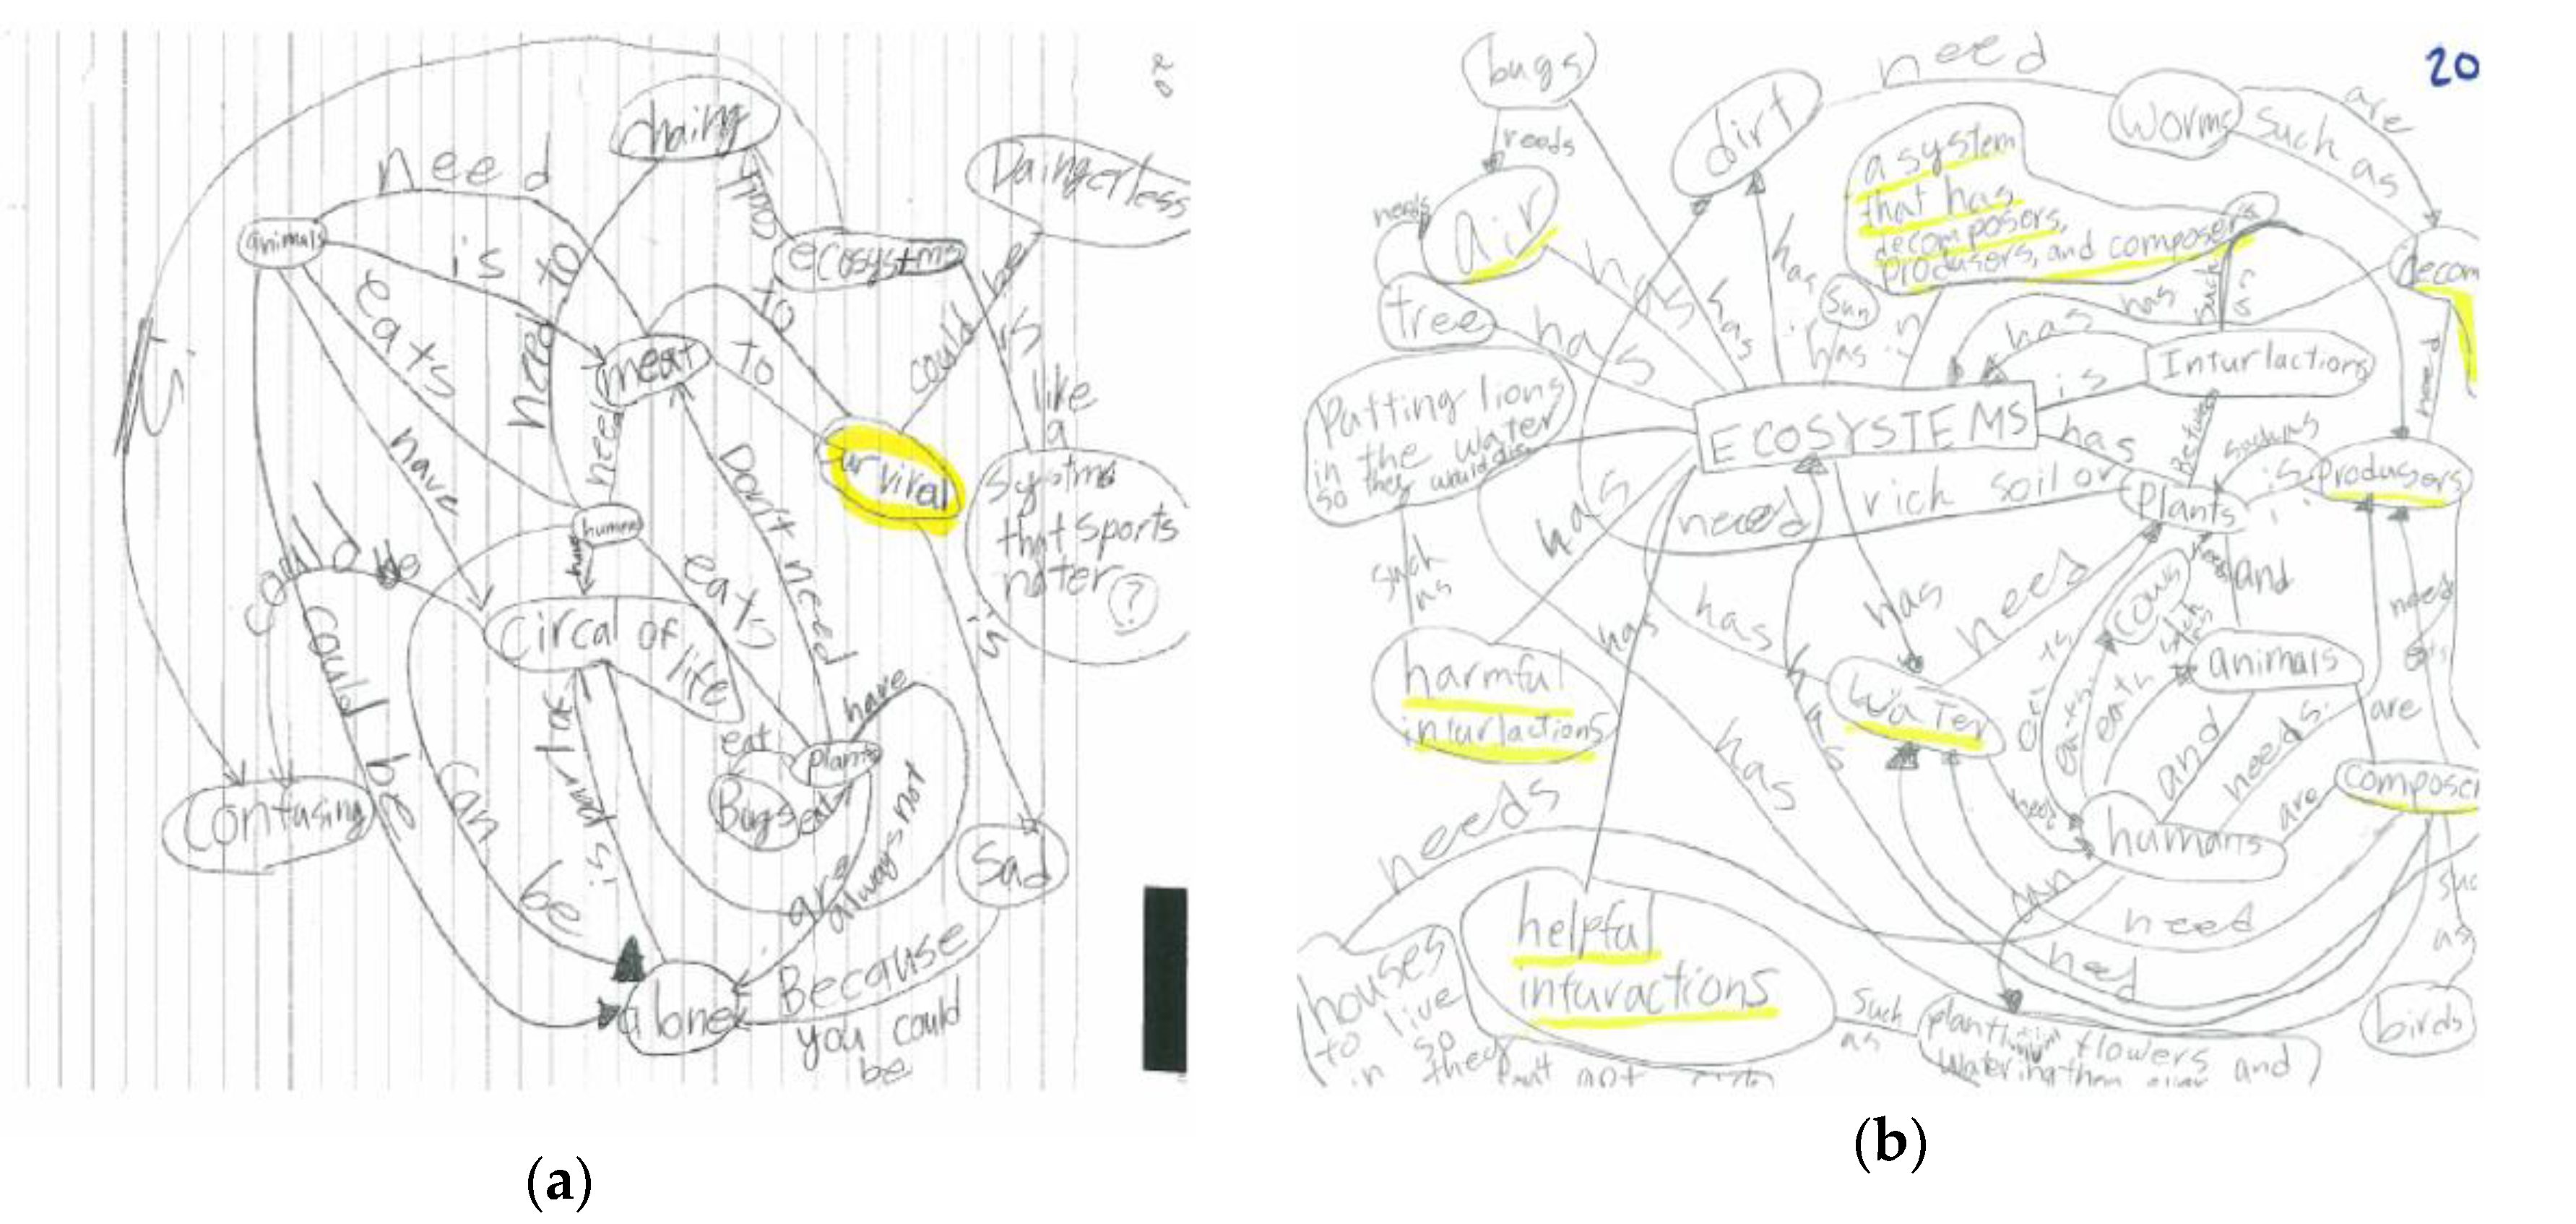
Students’ interview responses substantiated their gain scores, particularly highlighting conceptual understanding which was not captured quantitatively. Sample pre- and post-concept maps for one ELA (
Figure 2) and one GT student (
Figure 3) are presented below.
The concept maps for this ELA student demonstrates growth in cognitive schema and increased use of science terminology relevant to ecosystem interactions. Additionally, this student moved from showing basic relationships (e.g., “circle of life”) cued for in the prompt, to more complex interactions (e.g., “consumers”) and higher-level thinking (e.g., “what all things, including humans, need to survive”). When asked to highlight the most important parts of the concept map during the interview, this student identified meaningful connections between ecosystem concepts.
Interviewer: What would you highlight as the most important parts of your concept map?
ELA Student: I would highlight helpful interactions and harmful interactions because like getting lions to eat foxes. If lion is the prey then…nothing else could eat it except for like disease could kill it, but there’s not that much disease in ecosystems then it will be prey.
This GT student shows prior knowledge and application of new information from pre- to post-concept map (
Figure 3). Such interviews with students indicated that post concept maps were not representing rote learning, but a deeper understanding of ecosystem interactions. The complexity of students’ thoughts was not necessarily obvious when first examining their concept maps but this became apparent in the student interviews, and it further illustrated the importance of these conversations.
Specifically, words that were used in the pre-concept map now have key terms about ecosystems applied to them. For instance, water, food, shelter, and space are now identified as “resources”. As a concept, “resources” is refined further into “plentiful” and “limited” then applied to “survival”. This GT student provided further evidence of reasoning when asked to identify the most important parts of the concept map in the interview.
Interviewer: What do you think are the most important parts of your concept map?
GT Student: I think the plentiful resources and limited resources because if they are plentiful, it would be a good year for animals. And if they are limited, it could hurt the animals because they might not be able to reproduce.
Most students, whether ELA or GT, were able to specify key concepts and the interactions (via cross links) between concepts. True to the holistic nature of EFS, several students were able to extend or apply scientific knowledge to a real-world scenario or situation that was not specifically presented during classroom instruction. For example, when explaining her choice for the most important concepts in her map, an ELA student describes schools as “a big part of our ecosystem because they help kids learn, get a good education for their lives, and get jobs.” This student is tapping into the affective dimensions that are crucial elements of the EFS curriculum and school culture. Another student exhibited a similar sentiment when he described ecosystems in the following way.
Interviewer: What do you think are the most important parts of your concept map?
ELA Student: It’s important for ecosystems for people to care about each other. If someone gets hurt, they can help each other out.
For this student, humans play a role in ecosystem interactions through their relationships with each other and how they treat one another. Several other students demonstrated attention to the affective domain of learning by using value statements and descriptive words/phrases like ‘harm’, ‘hurt’, ‘get along’, ‘community’, ‘alone’, and ‘sad’. Both teachers were pleased to see these aspects emerge from the interviews as they had intentionally designed the science curriculum to support learning around equity and social justice, which is another unique aspect of EFS.
Students generally held positive views of concept maps. Two ELA and one GT student changed from having negative feelings prior to instruction to having positive feelings after instruction. These students cited similar reasons for their initial negative outlook. For instance, not knowing enough about ecosystems proved to be challenging when creating their concept maps.
Interviewer: How do you feel about concept maps?
ELA student: Sometimes [concept maps] are fun. Sometimes they are not. You have to use your memory when you don’t know it.
For this student, her frustration with concept mapping also reveals how memory tends to be called upon for science learning in schools. This can be a challenge for ELA students whose capacity for memorization may be supported or hindered by linguistic fluency.
7. Discussion
That there was not a significant statistical difference between ELA and GT students’ gain scores is an important finding from this study. It suggests that concept maps equitably elicit science understandings and promote learning in elementary science. Specifically, concept maps allow young children with different mental models and linguistic/academic abilities to effectively learn science in the same classroom. Put another way, relying solely on standardized measures of science learning or ones that emphasize how much students know (e.g., memorization of facts) rather than what they know (e.g., relationships between concepts), may favor one type of learner over another in our definitions of success in school science. By de-emphasizing ‘right’ answers, concept maps encourage students to think outside the proverbial box, and to extend their learning beyond the science classroom. This is an especially critical skill for children to develop in their early years as complex environmental problems require creative, holistic minds to understand and solve them. As we noted earlier, it is possible that no statistical differences were found because ELA and GT students were not entirely familiar with the use of concept maps, thus negating any significant gains for either population. The fact that this group did have a little more ‘training’ on the use of concept maps prior to data collection does not detract from the reality that assessments in science typically emphasize rote learning. This is why we conducted follow-up interviews with each student, to try and ascertain if their concept maps were indeed a representation of holistic understandings about ecosystem interactions. While very helpful in this regard, interviews are also time consuming for teachers as well as students, and may not easily translate into standardized learning outcomes for schools. Further research into the practicalities of such an approach in science education would be helpful.
Interestingly, we found the pre-concept maps captured more instances of students drawing on personal experiences outside of school to describe their understandings about ecosystems. This is likely due to students having less scientific knowledge prior to instruction, thus they supplemented their concept maps with personal knowledge. Conversely, their post-concept maps included fewer personal experiences and more instances of vocabulary specific to ecosystem interactions. This is not surprising when we consider that students’ knowledge about ecosystems likely increased to the point that they were more confident expressing that knowledge in their concept maps. It is also possible, however, that students felt the need to provide ‘right’ answers, perhaps at the expense of what they might have considered ‘irrelevant’ to the task at hand—their personal experiences. If so, that would be indicative of an education system that tends to privilege factual over personal (subjective) knowledge, particularly in science where objectivity lends credibility to scientific knowledge. How students build on and apply personal experiences in science as they progress through a curricular model (EFS) that emphasizes human–environment relationships, warrants further investigation.
As visual road maps of cognitive structures, concept maps help us appreciate the meaning-making process in science education. We do not think about mental models but rather, we reason with them [
35]. In that sense, concept maps encourage us to reflect upon what we know about a given topic, and how we arrived there. Both teachers, for example, drew their concept maps of ecosystem interactions in order to construct the rubric used in this study. This exercise afforded these teachers a valuable opportunity for introspection (self-assessment) and potentially sensitized them to preconceived ideas or knowledge gaps. While useful in the context of teacher professional development, concept mapping in EFS is challenging because it does not conform to state-approved measures of student achievement in science. For example, concept map scores are specific to the assignment and to its learning objectives. It also takes time to scaffold students’ experiences using concept maps and for teachers to understand how to effectively read/score them. Teacher training for concept maps is critical and forces us to rethink our priorities in science education research, particularly the notion of ‘getting the most for our buck’. For example, we might consider shifting our emphasis on funding one-time workshops for more teachers toward providing ongoing professional development for fewer teachers so that in the long term “they can overcome obstacles associated with instructional change and develop new understandings” [
36] (p. 83). We are not suggesting that all teachers use concept maps all the time as we appreciate the realities of increased testing, accountability, and responsibilities in schools today. Concept maps are also not relevant for all subject areas and not suitable for every learning style. We do hope, however, that science teachers consider concept maps as one approach to (a) help students understand and appreciate human–environment relationships, and (b) create equitable learning opportunities.


