1. Introduction
Bangladesh as an independent country has traveled a long way since its birth in 1971 following nine months of war that ravaged the economy with technically no infrastructure left behind. Once dubbed a bottomless basket country in its infancy, it is now gradually moving from an agrarian economy towards an industrial economy and is considered today as an emerging/developing economy. The government of Bangladesh, Non-Governmental Organizations (NGO), various donor agencies, and countries are all trying to create a favorable investment environment through introducing new economic policies, incentives for investors, promoting privatization, etc. Although there has been a significant improvement in the living standard of the people since 1971, much needs to be done to lift millions of people out of poverty in both urban and rural areas.
In the last decade, the country has recorded GDP growth rates above 5 percent due to development of the microcredit and garment industries. The provisional estimate for Bangladesh’s Gross Domestic Product (GDP) growth in the financial year (FY) 2015 (ended 30 June 2015) is higher than the 6.1% recorded in FY 2014 and projected in the Asian Development Outlook (ADO) 2015 [
1].
Table 1 presents some important statistical information about Bangladesh.
According to classical and neo-classical economic theory, economic growth depends on the supply of capital as well as the supply of labor and technology. Developing countries like Bangladesh face capital shortages that put a limit on investment and therefore growth, which can be balanced with an inflow of funds from foreign private or public sector. Since the beginning of the 1990s foreign direct investment (FDI) has become the most important source of foreign capital for emerging market economies (EMEs) and research has shown that foreign direct investment (FDI) is an important catalyst for economic growth in accelerating the economic accomplishment and wealth of a country; however, from the mid-1990s, the supply of public funds from developed to developing countries has been diminishing all over the world, while the inflow of foreign private capital (foreign direct investment) gained momentum over the decade and countries like Bangladesh compete with countries like India, Indonesia, Vietnam, Brazil, Venezuela, Laos, and many others to attract foreign capital.
The contribution of FDI is necessary in the enhancement of a country’s economic growth. Yet, almost one-third of Bangladesh’s 160 million people live in extreme poverty. The country has very high population density and scarce resources. As a result, poverty is a big problem. It will be impossible to lift such a huge number of people out of poverty without steady growth of the economy; therefore, emphasis should be placed on investment and trade.
In this study, we investigate the significant role of foreign investment in the process of economic growth of Bangladesh. We examine the critical relationship between the GDP per capita growth (annual %), Trade (% of GDP) and Foreign Direct Investment (% of GDP) with the help of co-integration analysis and Vector Error Correction (VEC) framework.
We find evidence of a long-term relationship between these variables, which indicates the critical role played by trade liberalization and foreign investment policies in the economic development of Bangladesh. This study would contribute to the literature in two areas. First, this paper examines the effect of FDI on the Bangladesh economic growth and trade as FDI has enormous positive externalities. FDI inflows also tend to boost growth in the medium to long term. Second, the results would provide new insights that could have a positive impact on the economic growth and may lead to the formulation of new policies for capital attraction as it plays a crucial role in the long-term economic growth of the country. In addition, the study has employed methodologies that distinguish it from previous studies on Bangladesh extant in the literature.
Following the introduction in
Section 1, the paper is organized as follows:
Section 2 presents the literature review, while
Section 3 discusses the data, model speciation, and methodology.
Section 4 reports and discusses the empirical results, and
Section 5 concludes the study.
2. Literature Review
The relationship between Foreign Direct Investment (FDI) and economic growth has long been a subject of great interest in the field of international development and has resulted in a huge amount of empirical literature focusing on both developed and developing countries. The FDI and economic growth literature has long focused on the role of governments’ effectiveness in attracting FDI, and in establishing reasons for foreign investors and firms. FDI is said to have a huge effect on host countries in terms of economic growth and development. Foreign direct investment (FDI) plays an important role in the economic growth of developing countries. It influences the employment scenario, production, prices, income, imports, exports, general welfare of the recipient country, and balance of payments and serves, as one of the vital sources of economic growth. Adams (2009) [
2] stated that there are two main theoretical viewpoints that have been used to demonstrate the influences of FDI on developing countries. Similarly, Ilgun, Koch and Orhan (2010) [
3] paper empirically investigates the relation between growth and Foreign Direct Investment (FDI) in Turkey. The authors state that there are mixed conclusions about the impact of FDI on growth and the literature includes many studies where FDI has negative, positive and no significant effects on growth. They provide empirical support to bi-directional causality between FDI and growth.
Nwaogu and Ryan (2015) [
4] investigated how foreign direct investment (FDI), foreign aid, and remittances impact the economic growth of 53 African and 34 Latin American and Caribbean countries and found that, for Latin America and the Caribbean, foreign aid and remittances affect growth when estimated separately, while remittances affect growth when they are estimated simultaneously. Their results also show that both regions’ results confirm that spatial interdependence is important. Sun and Anwar (2016) [
5] study uses panel data on six Chinese manufacturing industries over the period 2005–2007 to explore the interrelationship between foreign presence, domestic sales, and export intensity of local firms. They found that domestic sales and exports are complementary for local firms in China’s pharmaceutical industry, whereas in the case of the textile, transportation equipment, beverage, communication equipment, and general equipment manufacturing industries, domestic sales and exports are substitutes.
Agrawal (2015) [
6] examined the relationship between foreign direct investment (FDI) and economic growth in the five BRICS economies over the period 1989–2012 and found that foreign direct investment and economic growth are co-integrated at the panel level, indicating the presence of a long-term equilibrium relationship between them. Tang (2015) [
7] study examines the foreign capital flow effects on the European Union (EU) economic growth during 1987–2012 and found that the higher foreign direct investment (FDI) and portfolio investment (FPI) triggered by the European Monetary Union (EMU) have not contributed to growth. The lack of the FDI effect is surprising as they bring enormous benefits.
Acaravci and Ozturk (2012) [
8] analyzed the long-term relationship between Foreign Direct Investment, Export, and Economic Growth rate using the ADRL and Granger causality test with quarterly data from 1994 to 2008. The countries included in the sample are: Bulgaria, the Czech Republic, Estonia, Hungary, Latvia, Lithuania, Poland, Romania, Slovakia, and Slovenia. They found that the three variables have long-term co-integration in four countries (the Czech Republic, Slovakia, Poland, and Latvia). The authors pointed out that Foreign Direct Investment seemed to be a more important factor in driving economic growth than export in these countries. Aga (2014) [
9] study employs time series techniques to analyze the effect of foreign direct investment on economic growth in Turkey over the period 1980–2012 and concluded that there is no long-term relationship between foreign direct investment and economic growth in Turkey; he inferred that there is no Granger causal relationship between FDI and economic growth by means of a Granger Causality (GC) test.
Anwar and Nguyen (2014) [
10] study focuses on the impact of FDI and FDI-generated spillovers on total factor productivity (TFP) growth of manufacturing firms located in all eight regions of Vietnam. They found that the impact of FDI and FDI spillovers on the TFP of Vietnam’s manufacturing firms varied across regions. Anwar and Sun (2014) [
11] study aimed to extend the existing literature on foreign direct investment (FDI), which has mainly focused on its benefits, by examining the issue of heterogeneity as well as nonlinearity in the spillovers. The empirical analysis, based on firm level panel data over the period 2000–2007, reveals that productivity spillovers arising from FDI from Hong Kong, Macau, and Taiwan exhibit not only heterogeneity but also curvilinearity. The size of the spillovers depends on firm age, capital intensity, and ownership structure. They also find that FDI-related spillovers from the rest of the world are heterogeneous but not curvilinear and the size of productivity spillovers depends on firm size and product quality. Chen
et al. (2013) [
12] examined the horizontal and vertical export spillovers of foreign direct investment (FDI) on China’s manufacturing domestic firms by using firm-level census data over the period 2000–2003 They found that FDI has had a positive impact on the export value of domestic firms mainly through backward technology spillovers and a positive impact on the export-to-sales ratio of domestic firms through horizontal export-related information spillovers.
Hossain, A. and Hossain, M.K (2012) [
13] study examines co-integration and the causal relationship between Foreign Direct Investment (FDI) in both the long and short term in Bangladesh, Pakistan, and India. They found co-integration between them in both the short and long term in Pakistan. Conversely, GC results suggest that there is no causality relationship between GDP and FDI for Bangladesh and a unidirectional relationship was found for Pakistan and India, which means FDI caused economic output in Pakistan. Tabassum and Ahmed (2014) [
14] examined the relationship between foreign direct investments and economic growth of Bangladesh during the period 1972–2011. The results indicate that domestic investments exert a positive influence on economic growth whereas foreign direct investments and openness of trade are less significant. On the other hand, Shawa and Amoro (2014) [
15] study investigates how foreign direct investment (FDI) relates to the host country’s GDP growth, domestic investment, and export to Kenya from 1980 to 2013 using co-integration and the Granger Causality test. The co-integration test results indicate that there is a long-term relationship among the four variables being analyzed in this study.
Alfaro
et al. (2009) [
16] examined the relationship between foreign direct investment, the level of development of the financial sector, and economic growth. The authors found that an increase in the share of foreign direct investment led to higher additional economic growth rate in countries with a more advanced/developed financial sector, which highlights the necessity of a well-functioning financial system that can channel the surplus savings into the most productive investment. Allen and Aldred (2013) [
17] studied the regulatory and institutions’ quality effect on both FDI inflows and economic growth in the Eastern European countries that had joined the EU recently. They found that some of these countries have been able to attract FDI and post strong economic growth.
Umoh, Jacob, and Chuku (2012) [
18] investigated the empirical relationship between economic growth rate and FDI in Nigeria between 1970 and 2008. Their results suggest that there is a positive causal relationship between growth rate and FDI. Miankhel, Thangavelu, and Kalirajan (2009) [
19] performed a comparative analysis for the causality relationship among GDP, export, and FDI for six countries, namely India, Pakistan, Malaysia, Thailand, Chile, and Mexico. The results from comparative analysis of this study are not the same for all countries since each country is at a different level of development and followed different policies to attain their present level of development. In the case of South Asian countries, the export growth hypothesis holds either in the short or long term. However, it is GDP growth that attracts FDI in India in the long run. On the other hand, GDP has led to export growth in Pakistan. However, in Thailand there is a bidirectional relationship between GDP and FDI, which means that GDP attracts FDI and FDI further stimulates the growth of GDP.
Agrawal and Khan (2011) [
20] used a linear multiple regression model covering the period of 17 years from 1993 to 2009. This study examines the impact of foreign direct investment on the economic growth rate of India and China and found that the economic growth in India is less affected by FDI than in China, since the latter can utilize FDI better than India. Samad (2009) [
21] investigated the direction of a causal link between FDI and economic growth measured by GDP in 19 developing countries of South East Asia and Latin America using the co-integration technique, a Granger causality test, and an Error Correction Model (ECM). In the case of Bangladesh, the study found that there is a unidirectional short-term link running from GDP to FDI, which implies that GDP growth of Bangladesh provides market and attracts foreign investment. Hansen and Rand (2006) [
22] analyzed the casual relationship between FDI and GDP in a sample of 31 developing countries. Using estimators for heterogeneous panel data, they found a unidirectional causality between FDI and GDP, implying that FDI causes growth.
Dritsaki
et al. (2004) [
23] investigated the relationship between trade, FDI, and economic growth for Greece over the period 1960–2002. Their co-integration analysis suggests that there is a long-term equilibrium relationship. A similar study regarding the relationship between FDI and economic growth for Cyprus, 1976–2002 was examined by Feridun (2004) [
24] using the methodology of Granger causality; strong evidence emerged that economic growth as measured by GDP in Cyprus is caused by FDI, but not
vice versa. Athukorala (2003) [
25] examined the relationship between FDI and GDP using time series data from the Sri Lankan economy. The econometric results showed that FDI inflows do not exert an independent influence on economic growth. In addition, the direction of causation is not from FDI to GDP growth but from GDP growth to FDI.
De Mello (1997) [
26] states that if the determinants have strong links with growth in the host country, growth may be found to cause FDI, while output may grow faster when FDI takes place in other circumstances. Karimi and Yusop (2009) [
27] also state that there is no long-term relationship between FDI and GDP in Malaysia. Shimul, Abdullah and Siddiqua (2009) [
28] argued that there is no long-term relationship between FDI and GDP of Bangladesh by using time series data for 1973–2007. Khawar (2005) [
29] examined the impact of contemporaneous foreign direct investment on growth and found that foreign direct investment is significantly and positively correlated with growth as well as domestic investment. The population growth rate, initial GDP, and political instability variables were negatively correlated with growth, which is in keeping with the findings in the empirical growth literature.
3. Sample Data and Methodology
We used annual data for Bangladesh obtained from the World Bank online database (World Development Indicators), which covers the period 1973 to 2014. The study examines the short-term and long-term relationships between GDP per capita growth (annual, %) and Foreign Direct Investment (% of GDP) by applying the Johansen procedure and the associated Error Correction Model (ECM). As a result, we can represent the system in a VAR framework as U = (GDP, INF, TRADE). In order to test for the unit roots of concerned time series variables, several popular techniques have been used: the Dicky–Fuller (DF, 1979) test [
30], the Augmented Dickey–Fuller (ADF, 1981) test [
31], and the Phillips–Perron (PP, 1988) test [
32]. We report the result of the ADF and PP tests. Tests have been performed in the levels of three variables, namely, GDP per capita growth (annual %), Foreign Direct Investment (% of GDP), and trade (% of GDP).
If the two time series are integrated and of the same order then the estimation of the following co-integration regressions has been considered:
In the second stage, the Error Correction Model (ECM) is employed to see whether the economy is approaching equilibrium in the long term or not and to investigate the short-term dynamics of the co-integrated time series variables. The ECM is internally consistent if the two time series variables are co-integrated in the same order or if they are stationary (Greene, 2003) [
33]. To determine the non-stationary property of these two time series variables both in the levels and in the first difference, at first, the relevant DF and ADF tests have been employed with and without a time trend. The DF test is based on the following model:
The ADF test is a modification of the DF test and the lagged values of the dependent variables are added in the estimation of Equation (5), which is as follows:
Since it is generally believed that the ADF tests do not consider the cases of heteroscedasticity and non-normality frequently revealed in raw data of economic time series variables, the PP test for unit root has been used in the empirical analysis. Moreover, it has an advantage over the ADF test when the concerned time series has serial correlation and there is a structural break. Therefore, the PP test provides robust estimates over the ADF tests and is based on the following form of equation:
Both the ADF and PP test yield similar conclusion.
The appropriate critical values of the
t-statistic for the null hypothesis of non-stationarity are given by MacKinnon (1991) [
34]. Engle and Granger (1987) [
35] show that if two variables are co-integrated,
i.e., there is a valid long-term relationship, and then there exists a corresponding short-term relationship. This is popularly known as Granger’s Representation Theorem. Hendry’s (1979 [
36], 1995 [
37]) general-to-specific approach has been applied in this case, where the model (
i.e., ECM) is used in the following form:
where, ∆ stands for the first difference operator,
are the error correction terms,
is the random disturbance terms, and s, q and n are the number of lag lengths determined by several selection criteria. Finally,
should hold for the series to converge to the long-term equilibrium relation. According to this approach, one of both of the explanatory and dependent variables and one lag of the residual from the co-integrating regression have been included.
4. Empirical Results
We present the summary statistics and correlation coefficient of the key variables included in the study in
Table 2 (Panels A and B). We find that the average GDP per capita growth rate (% per year) was 2.6%, trade as % of GDP was 28%, and Foreign Direct Investment (% of GDP) was 0.31% during the period under consideration. Panel B of
Table 2 shows that the GDP and trade variables had a correlation of 0.61 and GDP and Foreign Investment had a correlation of 0.58; the correlation between Trade and Foreign Investment variable was 0.90.
Bangladesh has been liberalizing foreign investment and trade for the last couple of decades at a regular pace. Foreign investment has surged in the Ready Made Garments (RMG) and Export Processing Zones (EPZ) as well as other sectors of the economy; most of the outputs in these two sectors are meant for trade to foreign countries. The high correlation between foreign investment and trade is an outcome of these developments.
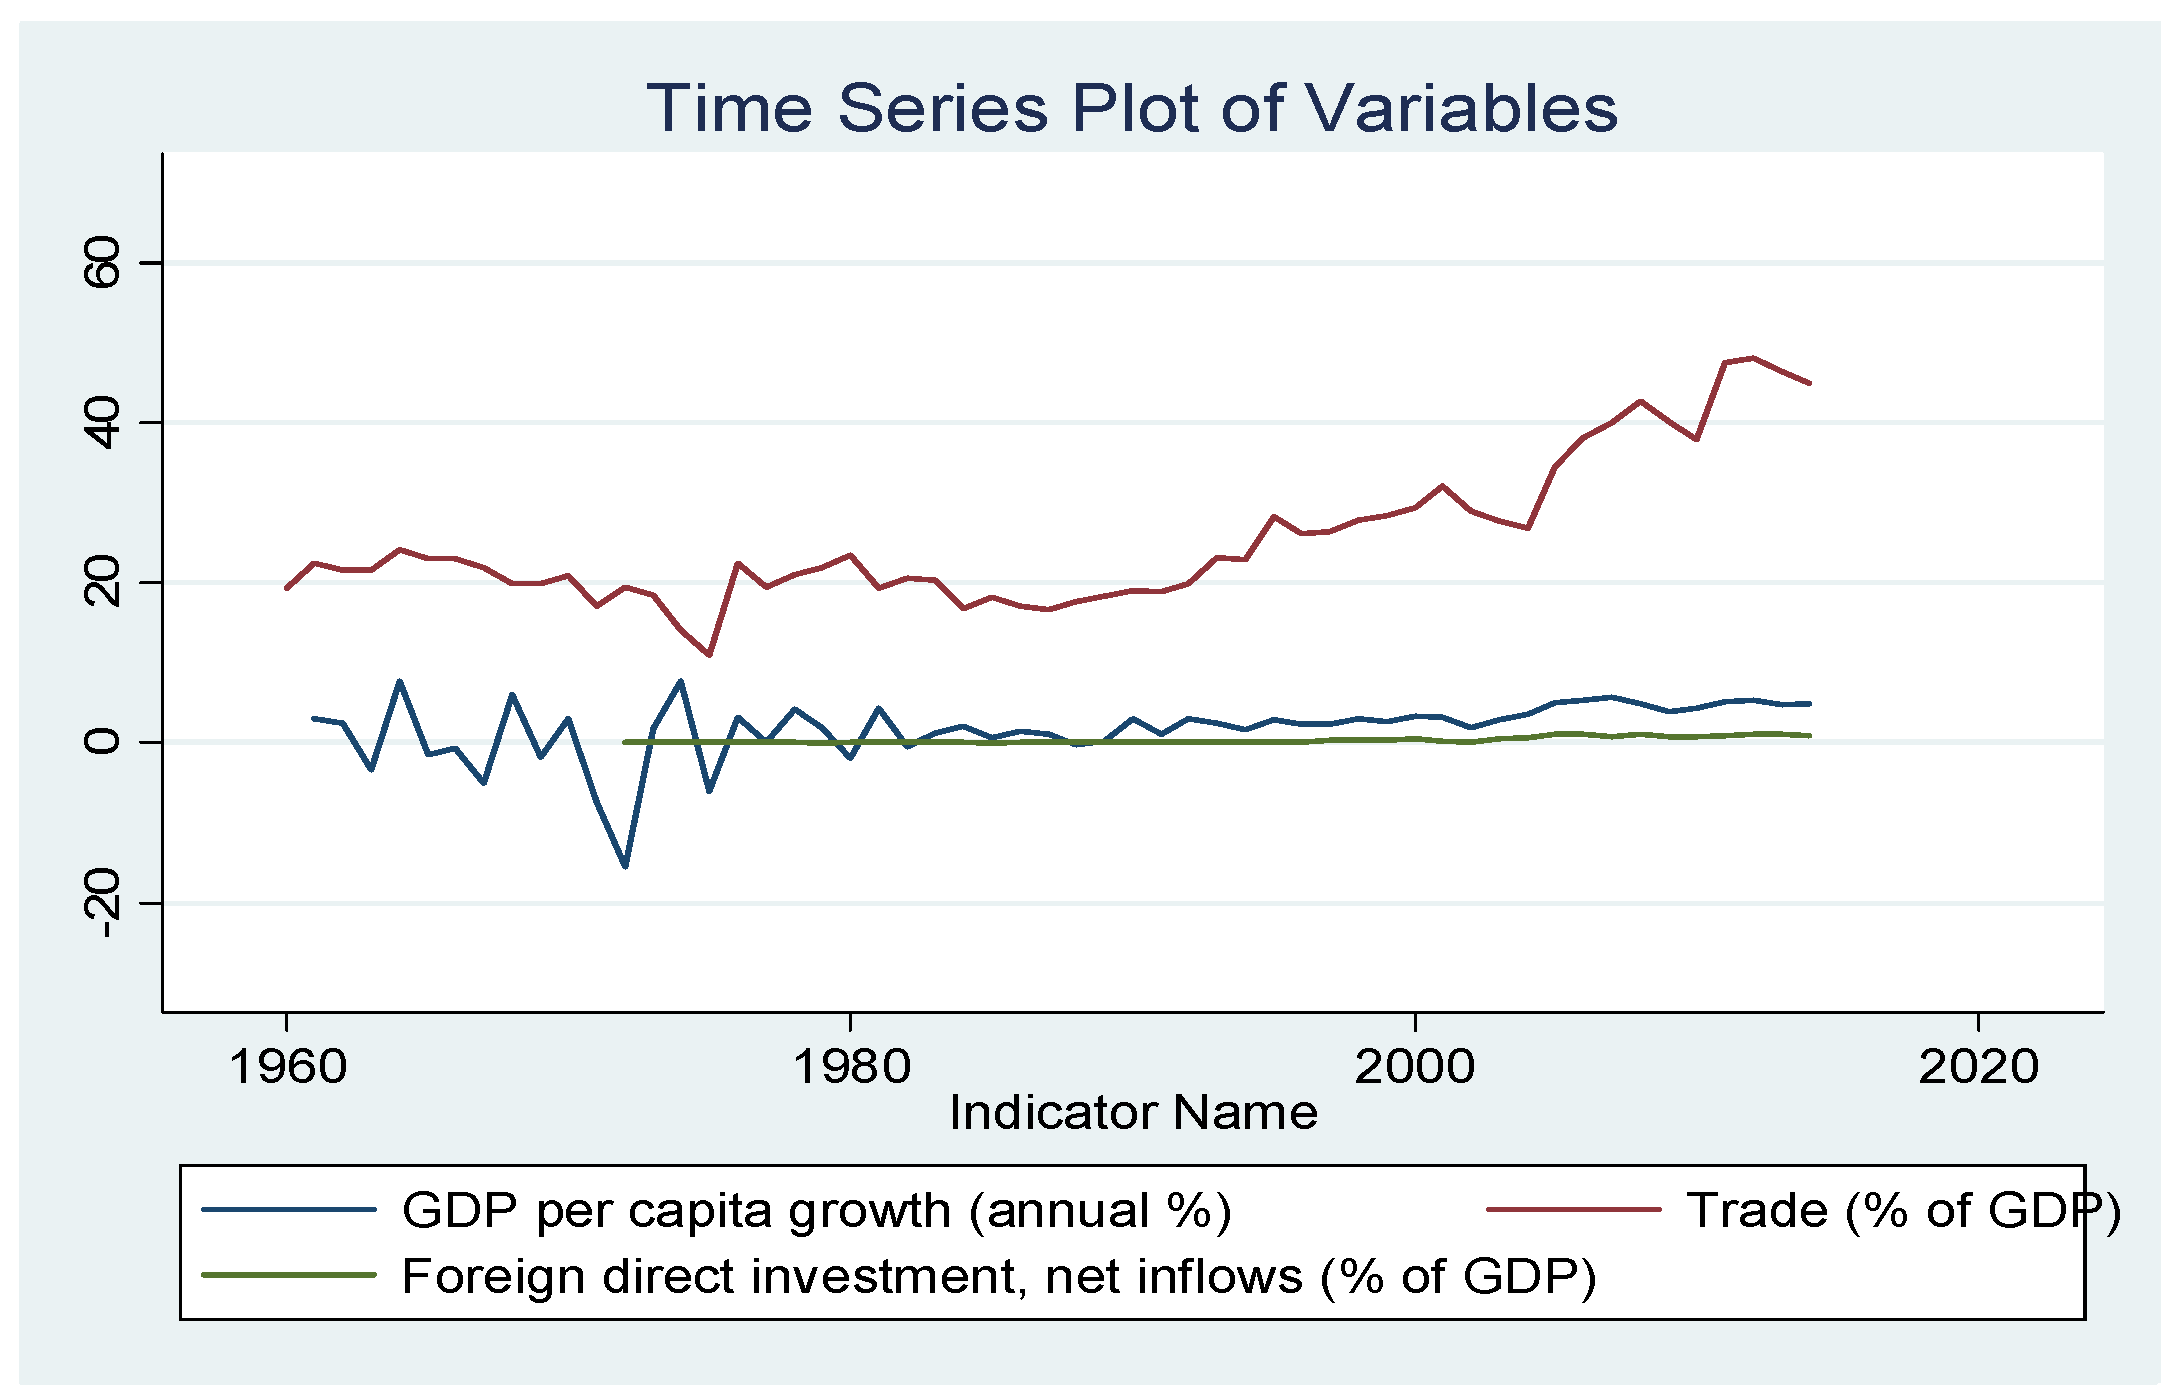
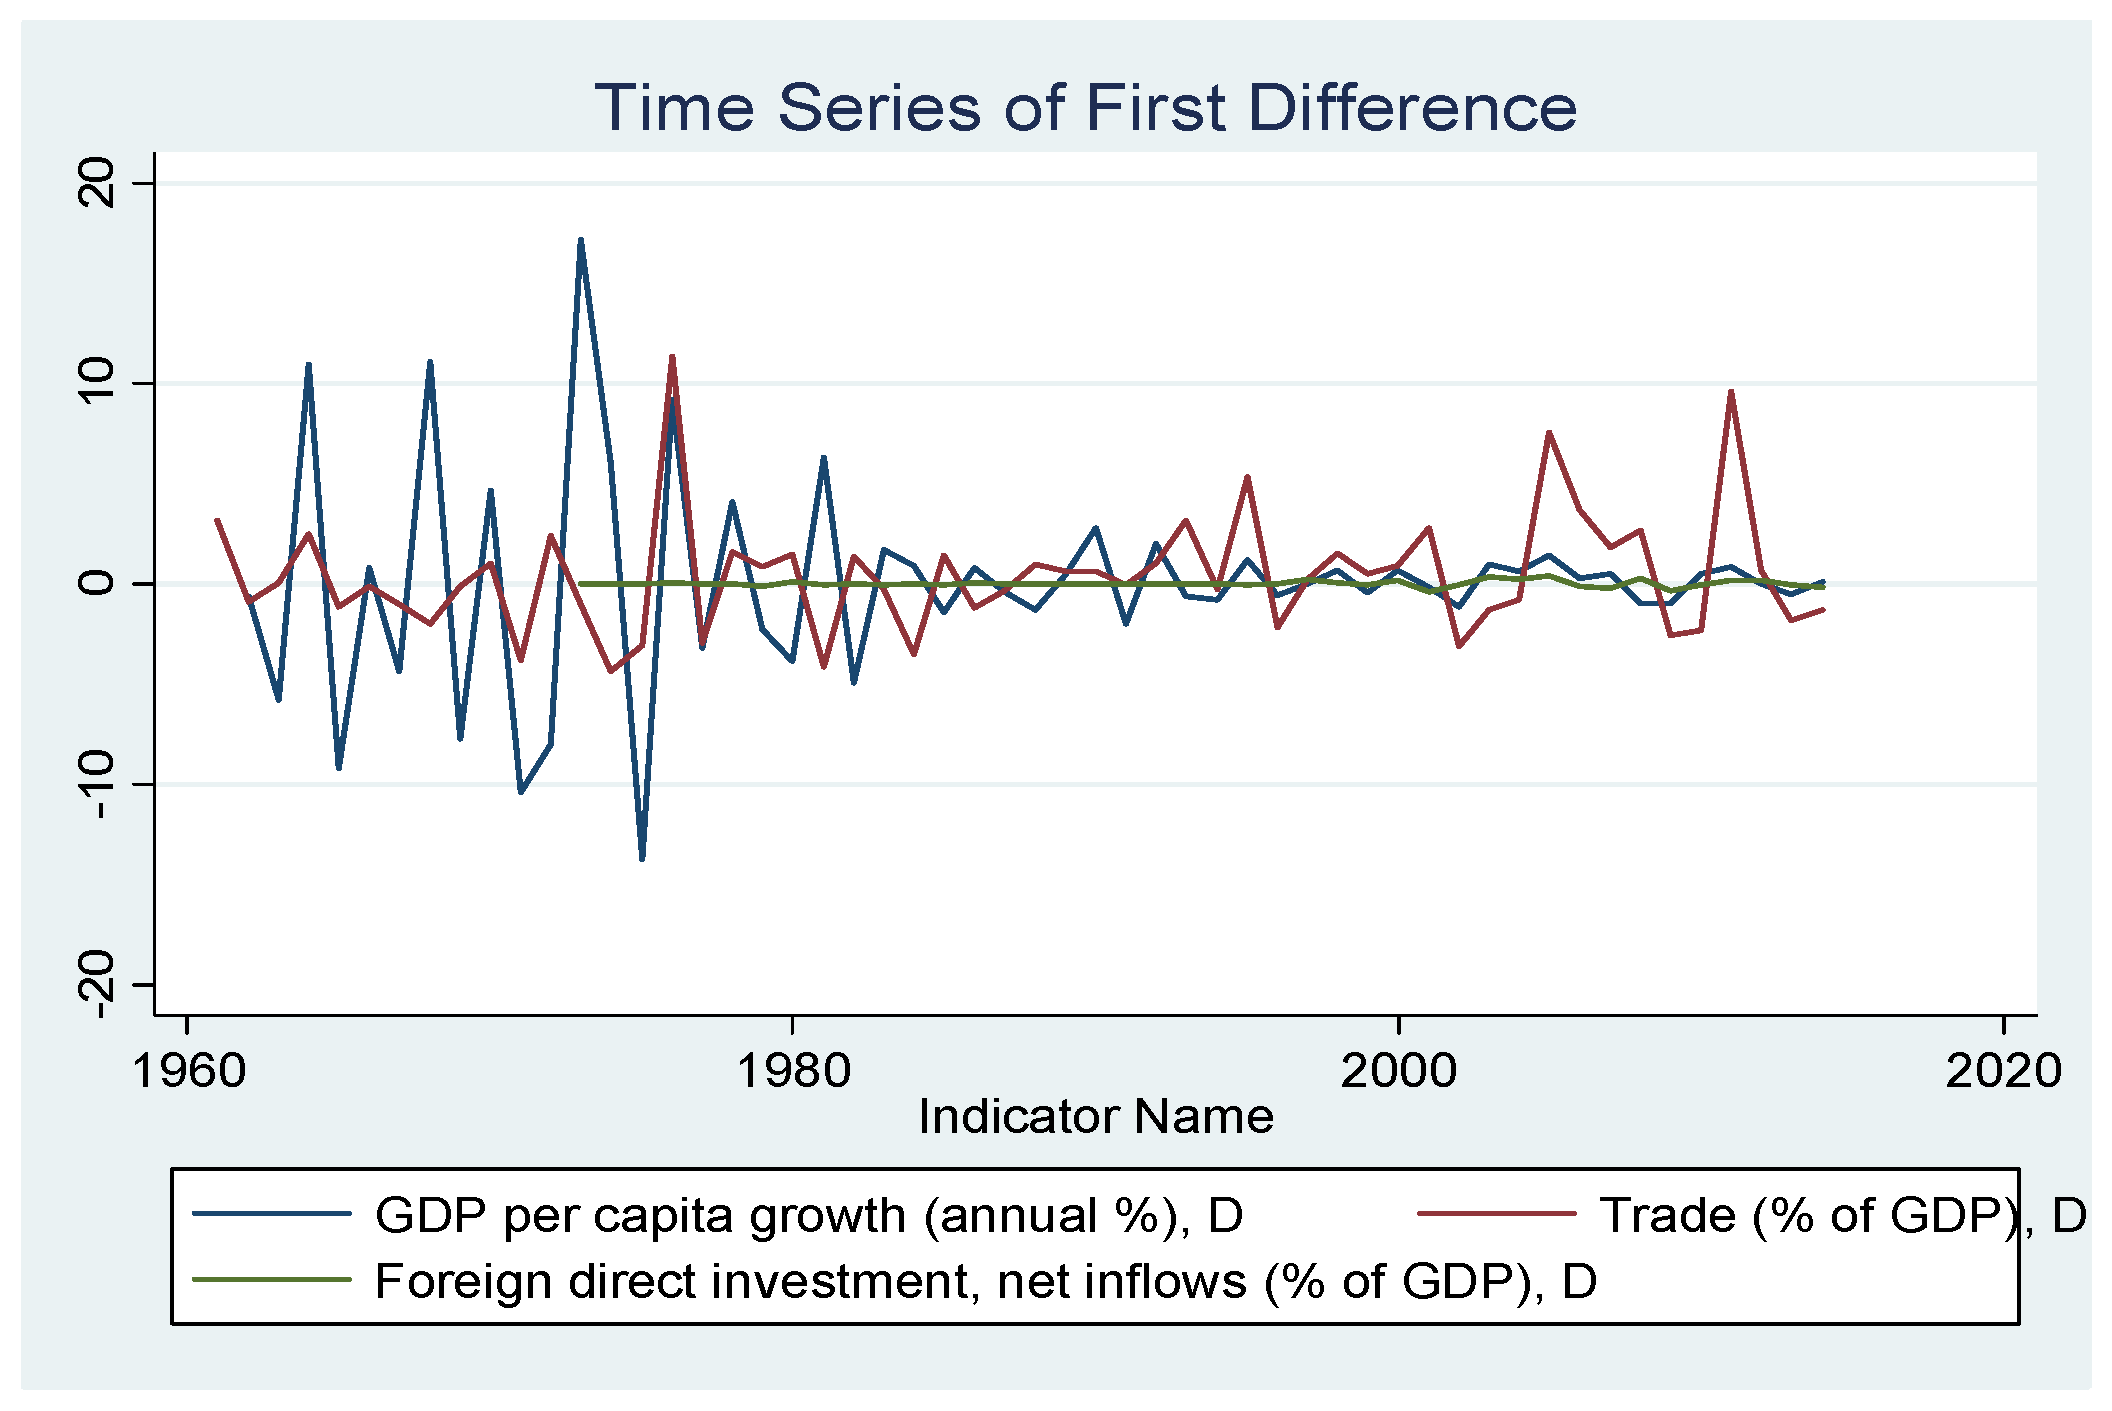
We plotted the time series of the three variables included in the study. Trade (% of GDP) showed long-term growth. The annual % growth rate of GDP and Foreign Direct Investment as % of GDP do not show significant growth over time (these two series are stationary). Plotting the levels and differences of the three variables suggests that the data are nonstationary in levels (
Figure 1), but stationary in differences (
Figure 2).
Plotting the differences of the three variables suggests that the data are stationary in terms of differences. This graph is shown below.
In the next step, we conduct Augmented Dickey–Fuller and Phillips–Perron unit root tests for the three variables for different model specifications and lag lengths. This is shown in
Table 3 below. We select lag one for all variables with constant and trend based on minimum AIC. We find that the annual growth rate series is stationary (reject the null hypothesis that the series has a unit root or the series is non-stationary) but the other two series have a unit root (these variables are not stationary).
However, a Dickey–Fuller test on the first difference (several variations with constant, trend, and different lag lengths) of these two series showed that they are stationary. We also conducted Augmented Dickey–Fuller (ADF) and Phillips–Perron (PP) tests and found similar result. The results given in
Table 3 show the results with constant, trend, and one lag for each of the three variables included in this study. The test is based on the null hypothesis that the variable contains a unit root, and the alternative is that the variable was generated by a stationary process. If the calculated test statistics are less than the critical value of the test statistics, then the null hypothesis will be rejected.
Table 3 shows that the null is rejected for the foreign investment and trade variables. We fail to reject the null hypothesis for the growth rate per capita (% annual) variable. Panel b of
Table 3 shows similar results for the PP test. Based on the results of this test and
Figure 1 and
Figure 2, we proceed to the next step of the analysis.
In the upper panel of
Table 4 we do the Johansen test [
38] of co-integration. The null hypothesis for the row with rank 0 is that there is no co-integration. The trace statistics are larger than the critical value in this row, implying rejection of the null hypothesis. We test the hypothesis with rank 1 (there is one co-integration) and reject the null hypothesis. For rank 2 (there are two co-integrations) row, we find that in this row the trace statistics are smaller than the critical value. Thus, we failed to reject the null hypothesis that there are two co-integrations (the * in trace statistics column occurs when the rank is 2); that is, the variables have a long-term association or they are moving together in the long run. We next ran the VECM model. If the variables were not co-integrated, we would run the VAR model. When we redo the tests with maximum statistics in the lower panel of the table, we got a similar result for rank two. As evidence of a long-term relationship among these variables, we estimated the VECM model. Conducting the appropriate lag length test, we found the use 1 lag of the variables in the VECM model. The results of VECM are in
Table 5.
We checked the sign and significance of the error correction term and found that there was long-term causality running from trade and foreign investment to the growth rate of GDP per capita. We also checked the short-term causality of the growth rate of GDP per capita with the lags of the export and the lag of foreign investment variable in a Granger causality format and found that there was short-term causality running from export and foreign investment to economic growth rate. In the next phase, we conducted a diagnostic check with the Lagrange Multiplier Test to decide whether we had serial auto-correlation or not with two lags and found no auto-correlation in any lag.
We checked the residual normality (if the residuals of the equation are normally distributed or not) with the Jarque–Bera test and found that the residuals were normally distributed.
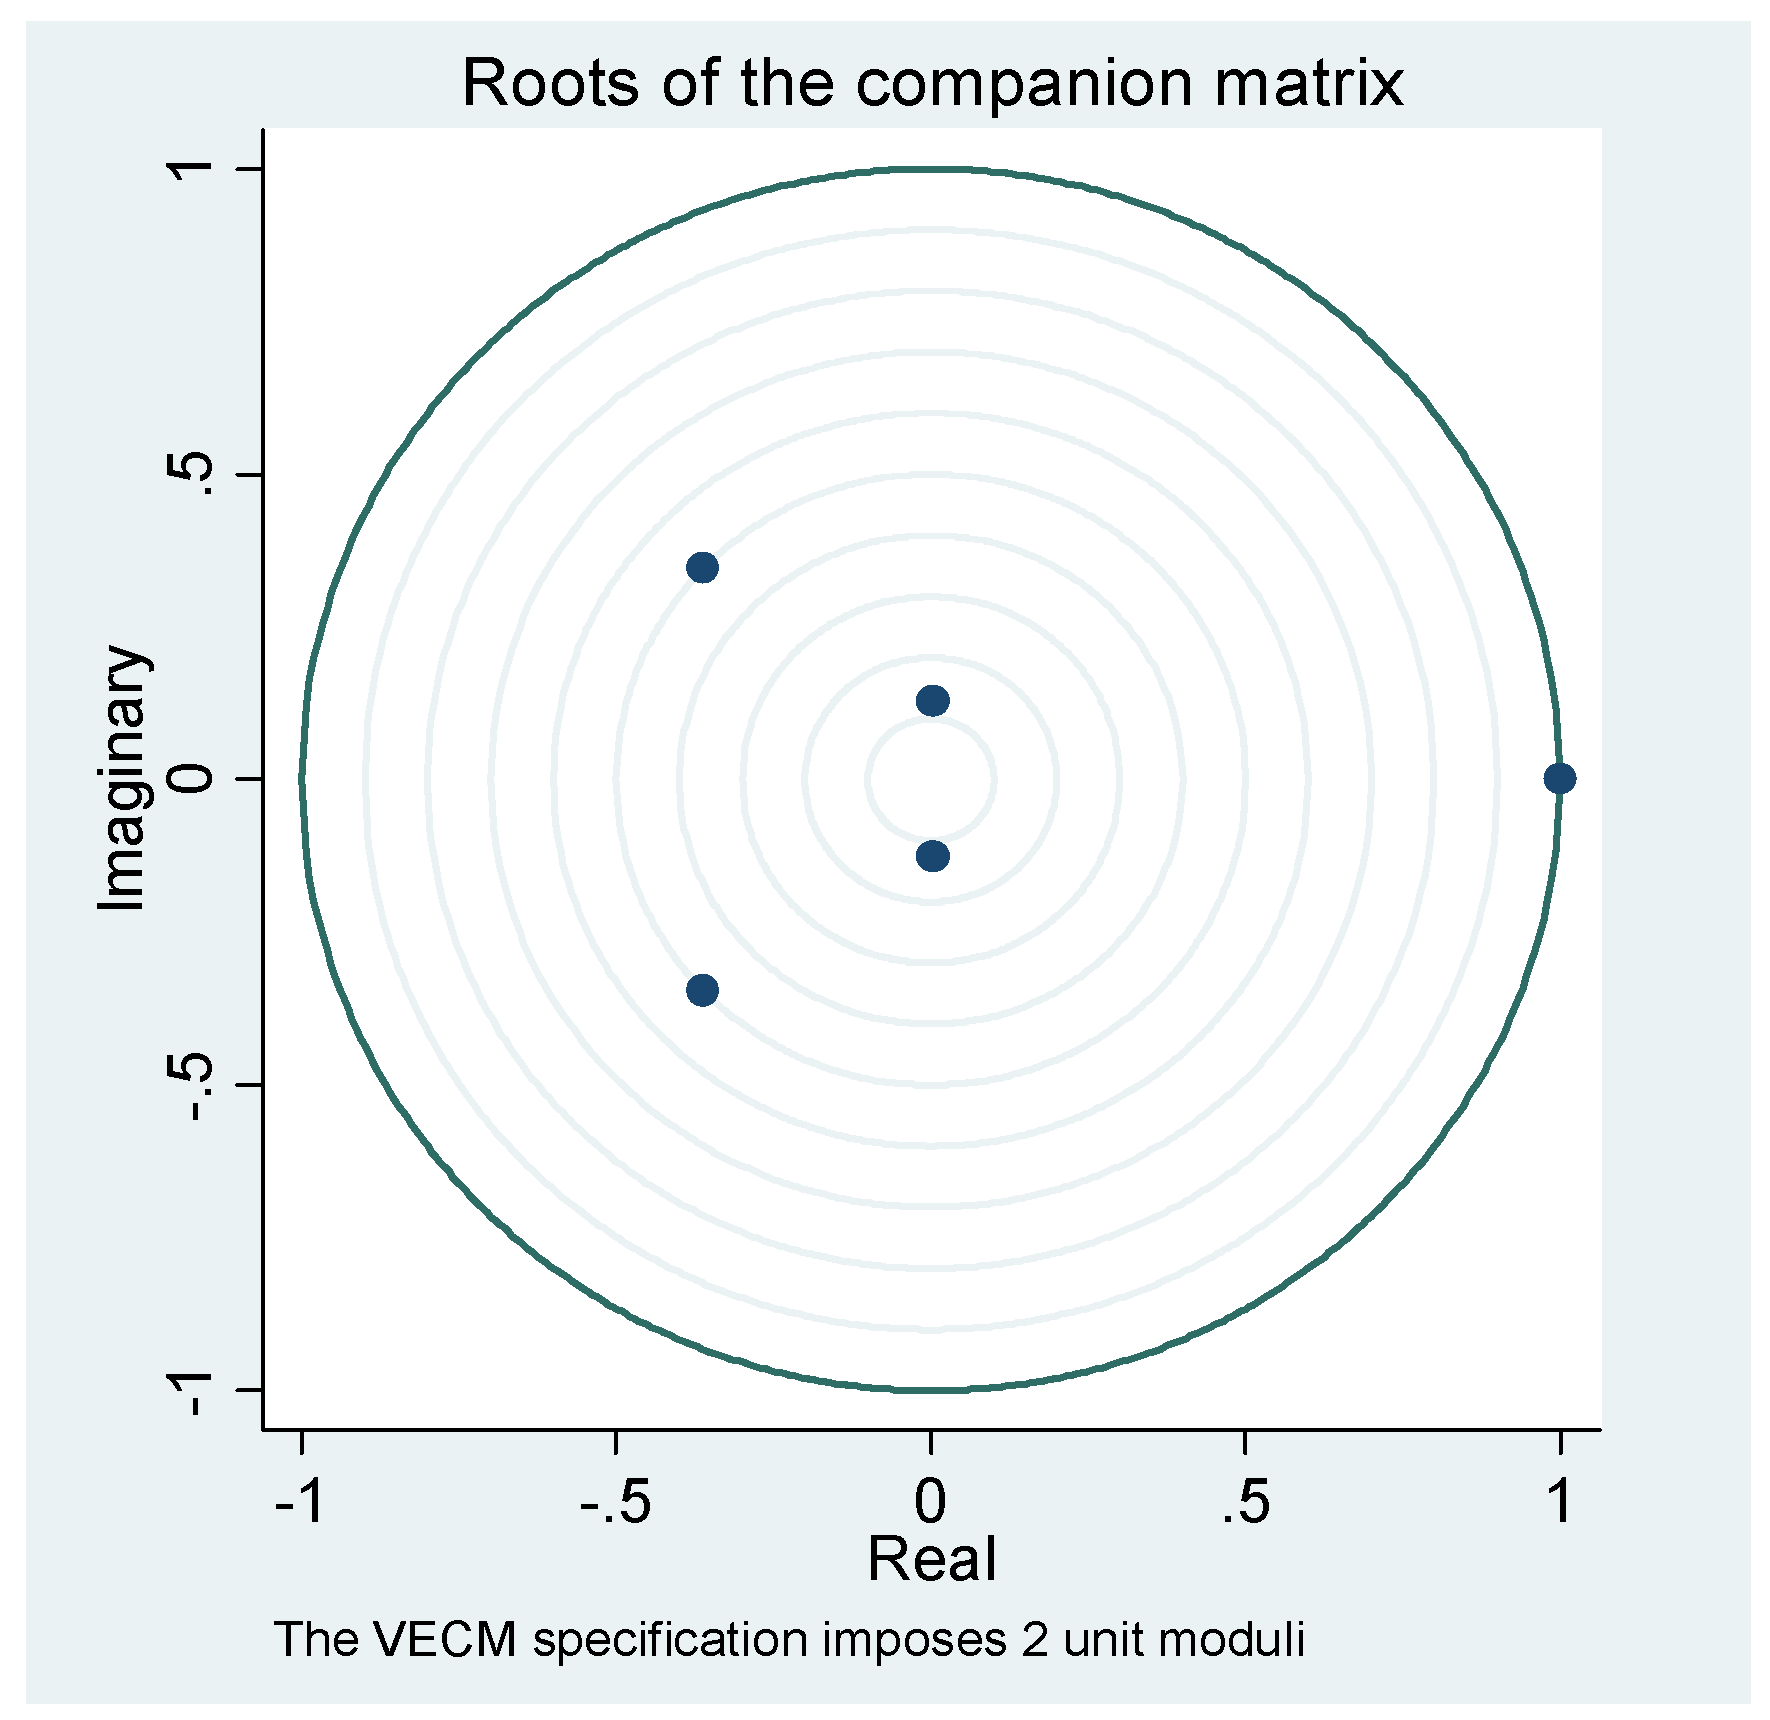
A stability result test with Eigenvalue showed that the system was stable. This showed that the VECM were desirable (
Figure 3).
Overall the results of
Table 5,
Table 6 and
Table 7 show that there is a long-term relationship between the three variables. Also the roots of the companion matrix showed that the system was desirable. In the next step, based on our findings for the ADF and PP tests and the VECM model, we proceeded to perform the ARDL model with bound tests as described by Pesaran, Shin and Smith (2001) [
39]. Here are our ADRL specifications:
where, β
0,
t, θ
0, θ
1, θ
2 are the relevant parameters. Error term is represented by e.
The value of our
F-statistic is 13.09 when we check that the three coefficients of the three variables (GDP, TRADE, and FDI) on the right hand side are jointly zero. We have (
k + 1) = 3 variables (GDP, TRADE, and FDI) in our model. So, when we go to the Bounds Test tables of critical values, we have
k = 2. The results of the regression are presented in
Table 8.
Table CI (iii) on p.300 of Pesaran
et al. (2001) [
39] is the relevant table for us to use here. We have not constrained the intercept of our model, and there is no linear trend term included in the ECM. The lower and upper bounds for the
F-test statistic at the 10%, 5%, and 1% significance levels are [3.14, 4.14], [3.79, 4.85], and [6.84, 7.84], respectively.
We found that the value of our F-statistic exceeded the upper bound at the 5% significance level, so we concluded that there is evidence of a long-run relationship between the two time-series (at this level of significance or greater).
In addition, the
t-statistic on lag of GDP is −2.78. When we look at Table CII (iii) on p. 303 of Pesaran
et al. (2001) [
39], we find that the I(0) and I(1) bounds for the
t-statistic at the 10%, 5%, and 1% significance levels are [−2.57, −3.21], [−2.86, −3.53], and [−3.93, −4.10], respectively. At least at the 10% significance level, this result reinforces our conclusion that there is a long-term relationship between GDP and both FDI and TRADE.
When we link the findings of
Table 5 and
Table 8, we can confirm that there is a long-term relationship between the three macroeconomic variables.
5. Conclusions
We found that there is a relationship between foreign direct investments, trade, and growth rate of per capita GDP for Bangladesh with the help of annual time series data for 1973 to 2014. The VECM model analysis showed that there is a long-term relationship between these variables. The trade and foreign investment variables have a significant impact on the growth rate of GDP per capita. To check the validity of the VECM model, we did a few post-estimation diagnostic tests, and found that the residuals of the regressions have normal distribution and do not show any auto-correlation.
Since a long-term relationship exists from the VECM model, we suggest that it is very important for Bangladesh to create trade promotion and foreign investment-friendly policies. These policies play a crucial role in the long-term economic growth of the country. The living standard of the people (which is indicated by the annual growth rate of GDP per capita) depends on trade and foreign investment. Also it needs to take an aggressive policy of promoting the trade sector by securing tariff-free access to the markets of developed countries.
The government can do much more to develop these areas and create a favorable environment so the private sector (both domestic and foreign) can then come forward. Given the abundance of comparatively cheap labor available in the country, Bangladesh should exploit it to the fullest extent possible to generate opportunities. The core of the development plan should focus (as it has done in the past) on poverty alleviation. Since FDI and trade are two important components of economic growth in Bangladesh, it is imperative to frame policies that will promote growth; in addition to eliminating the barriers to capital flows, comprehensive investment provisions ought to be incorporated into the laws, and would be more effective in boosting the FDI. When FDI’s flow increases, employment, income, and output would promote the long-term growth that will help raise millions out of poverty. Another crucial aspect for a development plan to succeed is political stability. Many studies have shown that improvement of law and order, establishment of an investment-friendly environment, and improvement of infrastructure play a key role in attracting foreign investment. For further research on Bangladesh’s economic growth and political stability, we leave it to future researchers to study this critical relationship.


