Temperature Variability of Poisson’s Ratio and Its Influence on the Complex Modulus Determined by Dynamic Mechanical Analysis


1
MEtRiCS-UMinho, University of Minho, Campus Azurem, 4800-058 Guimaraes, Portugal
2
CMEMS-UMinho, University of Minho, Campus Azurem, 4800-058 Guimaraes, Portugal
*
Author to whom correspondence should be addressed.
Technologies 2018, 6(3), 81; https://doi.org/10.3390/technologies6030081
Submission received: 20 July 2018
/
Revised: 20 August 2018
/
Accepted: 21 August 2018
/
Published: 23 August 2018
Abstract
:Dynamic mechanical analysis (DMA) is the usual technology for the thermomechanical viscoelastic characterization of materials. This method monitors the instant values of load and displacement to determine the instant specimen stiffness. Posteriorly, it recurs to those values, the geometric dimensions of the specimen, and Poisson’s ratio to determine the complex modulus. However, during this analysis, it is assumed that Poisson’s ratio is constant, which is not always true, especially in situations where the temperature can change and promote internal modification in the specimens. This study explores the error that is imposed in the results by the determination of the real values of complex moduli due to variable Poisson’s ratios arising from temperature variability using a constant frequency. The results suggest that the evolution of the dynamic mechanical analysis should consider the Poisson’s ratio input as a variable to eliminate this error in future material characterization.
1. Introduction
Studying the dynamic behavior of materials is a fundamental process in understanding their viscoelastic mechanical behavior and determining their ability to dissipate energy under cyclic loading. In practical terms, these characteristics may be dependent on the time, frequency, and temperature [1,2]. From the first dynamic experiments performed by Poynting in 1909 [3], there has been a constant evolution in the technology of measuring the dynamic performance of materials [4,5,6], and many researchers focused their work on the experimental study of viscoelasticity [7,8].
Currently, one of the most common techniques for performing this kind of test is dynamic mechanical analysis (DMA). This kind of equipment evolved into a configuration that allows a user-friendly environment to perform the dynamic testing of materials. It is able to monitor internal friction, glass transitions, and other relaxation processes in terms of load, displacement, frequency, and temperature [9]. To perform this test, the equipment generates an electromagnetic current that is able to move a rigid rod with a sinusoidal motion. These movements are then monitored by a displacement measuring device, either by a linear variable differential transformer (LVDT) or optical encoder.
Due to the overall high stiffness of the instrument, its deformations are negligible when compared with the tested specimen. Thus, the very high resolution and precision of these equipment are able to characterize the viscoelastic behavior of materials. As a given load is applied to a specimen, the equipment is able to monitor the delay that such specimen presents in terms of deformation, allowing the determination of phase lag. Thus, their dynamic response will be dependent on their intrinsic elastic behavior, internal friction, and exterior stimuli such as temperature and load variation [10].
In their experimental procedure, the DMA equipment use a formulation based on these fundamental principles, and they measure two basic variables: the specimen stiffness (Ks = load/displacement) and the phase lag (δ) [11]. By the association of these variables with the specimen’s geometrical parameters, test configuration (e.g., shear, tensile, cantilever, etc.), and Poisson’s ratio (ν), an algorithm is applied to determine the material complex modulus (E*) [12].
Although the input data remains the same throughout the experimental testing, this may not be true for the intrinsic characteristics of the tested specimen. For example, it is known that Poisson’s ratio has a relevant role in the dynamic properties of materials [13,14,15,16,17,18] and is sensible to any temperature changes in the material [19,20]. Such fact is even more relevant when this change occurs at relatively low temperature, e.g., glass/rubbery transition in polymers.
This study intended to evaluate the effect of the change in Poisson’s ratio on the complex modulus (E*) experimental results using DMA. Additionally, the error obtained by considering a constant Poisson’s ratio was discussed and quantified. Finally, an example of epoxy resin was analyzed to interpret the real application of the findings.
2. Methodology
2.1. Materials
A solvent-free structural epoxy (S&P® Clever Reinforcement Company 220 epoxy adhesive, Seewen, Switzerland) was used to produce rectangular beams (chemical composition and specimen dimensions in Table 1). These specimens were cured for five days at 20 °C to allow a complete polymerization.
2.2. Tensile Testing
Specimens (five in total) were produced and tensile-tested according to EN ISO 527-1:2012 recurring to an INSTRON 8874 universal testing equipment. The specimens were pulled with a testing speed of 1 mm/min in deformation control until fracture occurred. The instant values of load and strain from the load cell and mechanical strain-gauge, respectively, were recorded to plot the specimen’s stress–strain curve. Additionally, a second mechanical strain gauge was placed in the transverse direction to determine the specimen’s Poisson’s ratio.
2.3. Dynamic Mechanical Analysis
Specimens (five in total) were tested using dynamic mechanical analysis (TA Q800) with a single cantilever configuration. One clamp was completely fixed and the other clamp applied a constant amplitude of 5 μm in the vertical direction with a frequency of 1 Hz, while the other directions had their displacement restrained. A temperature ramp of 1 °C/min until 120 °C was implemented during the experimental testing to analyze the influence of temperature on the complex modulus of the specimens, and to generate a variation in Poisson’s ratio.
During the DMA tests, the overall stiffness (Ks) as a function of temperature (K = f(T)) was monitored by the recording of the instant values of load (L) and constant amplitude (d = 5 μm). The phase angle (δ) was also determined to calculate the instant values of internal friction (tan(δ)).
2.4. Finite Element Analysis
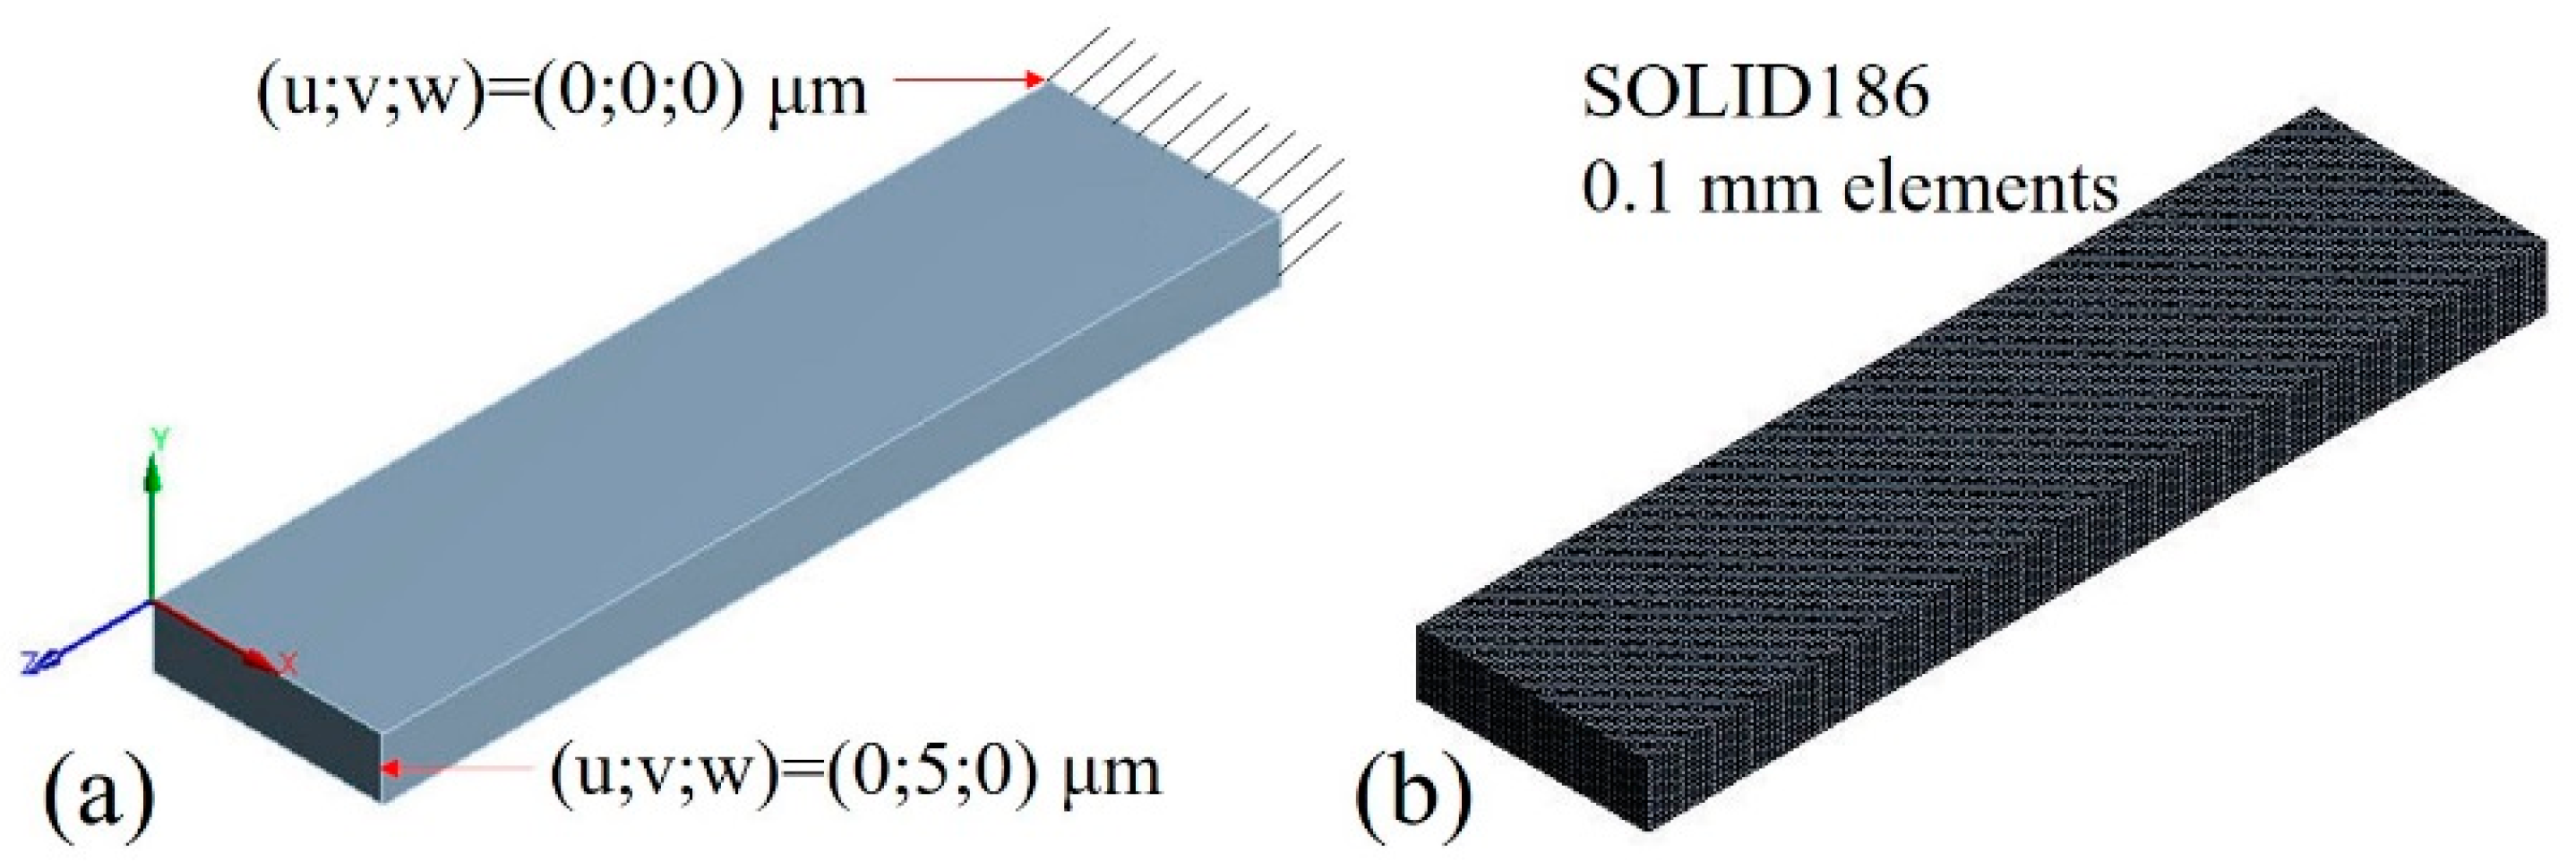
A specimen in a cantilever configuration was modeled (Figure 1a) and subjected to a static structural simulation by finite element analysis (FEA) using ANSYS 17. A fundamental rectangular beam had one end fixed, while a deformation of 5 μm in the vertical (YY) axis was imposed on the other end. To ensure the same boundary conditions of the experimental analysis, it was imposed that the displacements in the XX and ZZ axes were restrained. As the outputs for the simulated results, the values of maximum stress and width strain due to Poisson’s effect were monitored. A representation of the used mesh may be observed in Figure 1b.
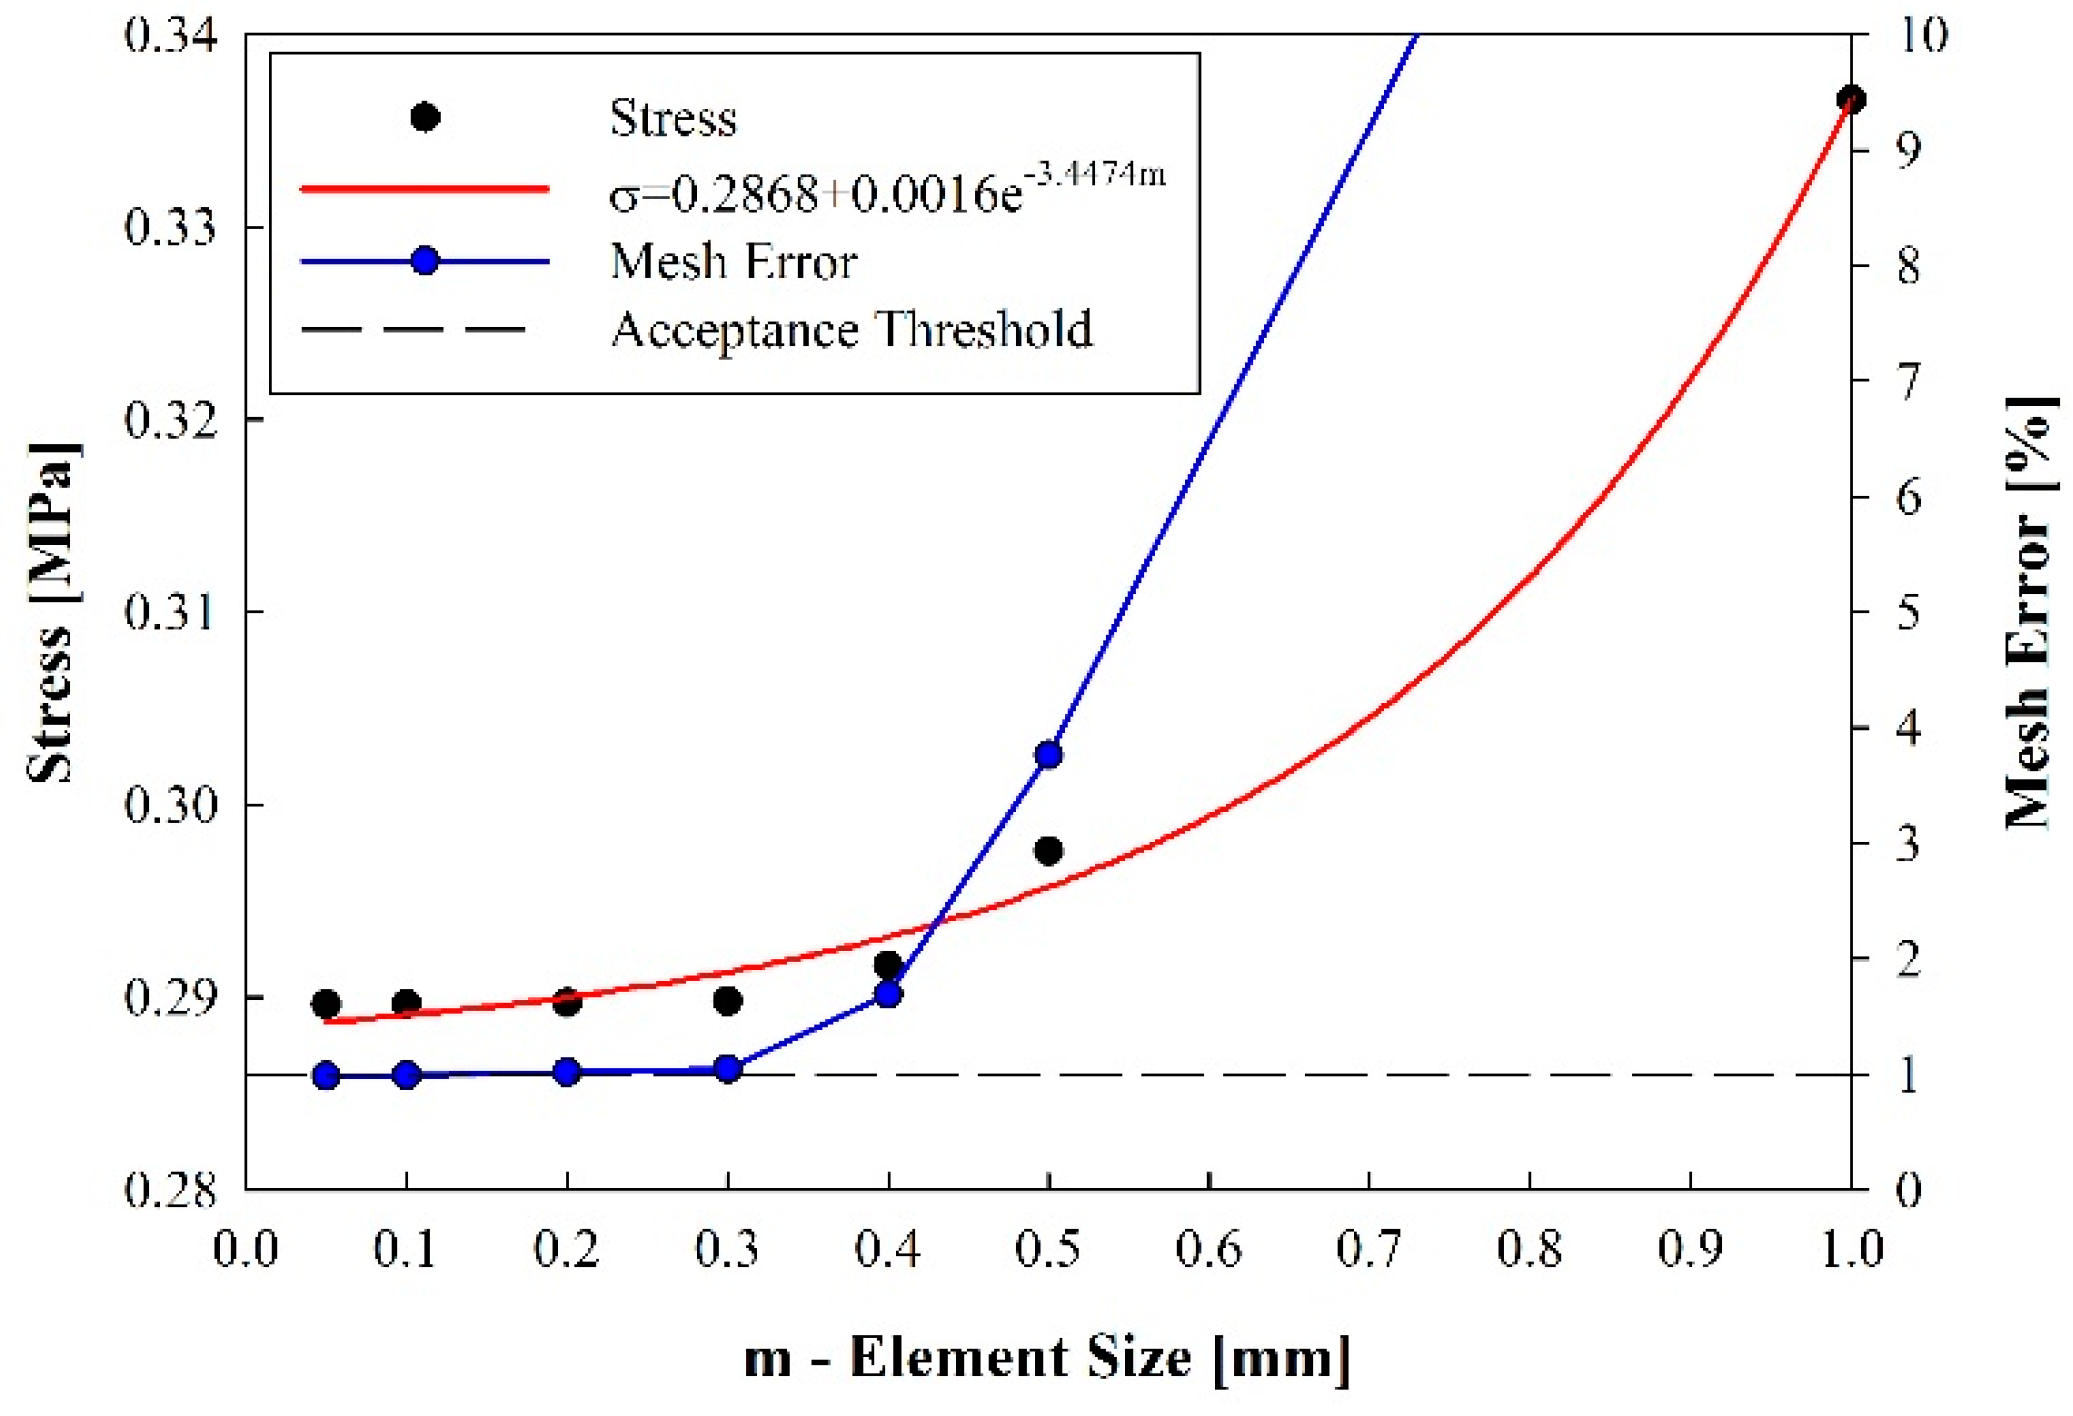
The element size displayed in Figure 1b was selected from a mesh convergence analysis where the element size was changed and the consequent specimen stress was monitored (Figure 2). According to such analysis, the value of stress increased on an exponential function when the mesh was refined. It may be observed that such function had a base value of σ = 0.2868 MPa, and, from this value, the instant mesh error may be calculated. Thus, an acceptance threshold was defined as the value where the mesh error was lower than 1%, corresponding to an element size of 0.1 mm.
An isotropic linear elastic approach was used due to the small deformation that was imposed in the specimen; thus, the overall analysis implied the definition of the complex modulus (E* ≈ E) for the imposed strains and Poisson’s ratio (ν). However, the base material properties definition had two different approaches: (i) using a constant value of Poisson’s ratio, as a regular DMA experimental procedure; (ii) using the real instant value of Poisson’s ratio, according to the suggested method.
3. Results
3.1. Theoretical Modeling
Given the configuration of the DMA equipment, the fundamental magnitudes that were monitored during test were the loads (L) and displacements (d) that were applied in the specimens. Thus, the fundamental procedure for the determination of the viscoelastic properties of the specimens started with the monitoring of the instant values of stiffness (Ks = F/d).
The DMA equipment then processed these instant values to determine the complex modulus (E*), as a function of the specimen geometry and Poisson’s ratio (ν). For example, on a single-cantilever configuration and using a rectangular-beam specimen (L—length × t—thickness × w—width), this process is performed by the use of Equation (1), where I is the moment of inertia (I = t3w/12) and F is a geometric factor described by Equation (2) [21].
Interpreting Equation (1), it may be seen that Poisson’s ratio has a predominant role in the determination of the complex modulus (E*) from the specimen stiffness (Ks). More importantly, this formulation considers that it presents a constant value, i.e., it remains stable during the experimental test. In fact, it is known that this is not true, and the value of Poisson’s ratio may change, especially due to temperature-dependent changes in the internal structure of the material.
By manipulating Equation (1) to a differential configuration due to the linear change of Poisson’s ratio, a variation on the complex modulus as a function of specimen stiffness may be determined using Equation (3).
From the classic theory of elasticity, it is known that Poisson’s ratio may assume values between −1 and 0.5 for a three-dimensional isotropic body (although, for two dimensions, this range is −1 to 1 [22]); thus, it may established that, in these conditions, the variation in Poisson’s ratio (Δν) may change between −1.5 and 1.5. Even though many materials are not isotropic, this approach was used to simplify the analysis. Figure 3 shows a plotting of Equation (3) for different values of width (w), Poisson’s ratio variation (Δν), and specimen length aspect ratio (a = L/t).
According to these results, it may be observed that the changes may have a profound effect on the variation of the complex modulus, especially for situations where Poisson’s ratio increases and the length of the beam is preponderant to the other dimensions. This is frequent in DMA experiments where polymers that experience glass transition are tested, and thus, the following subsections explore the testing and discussion of this case using an epoxy resin as a study case.
3.2. Experimental Tensile Testing
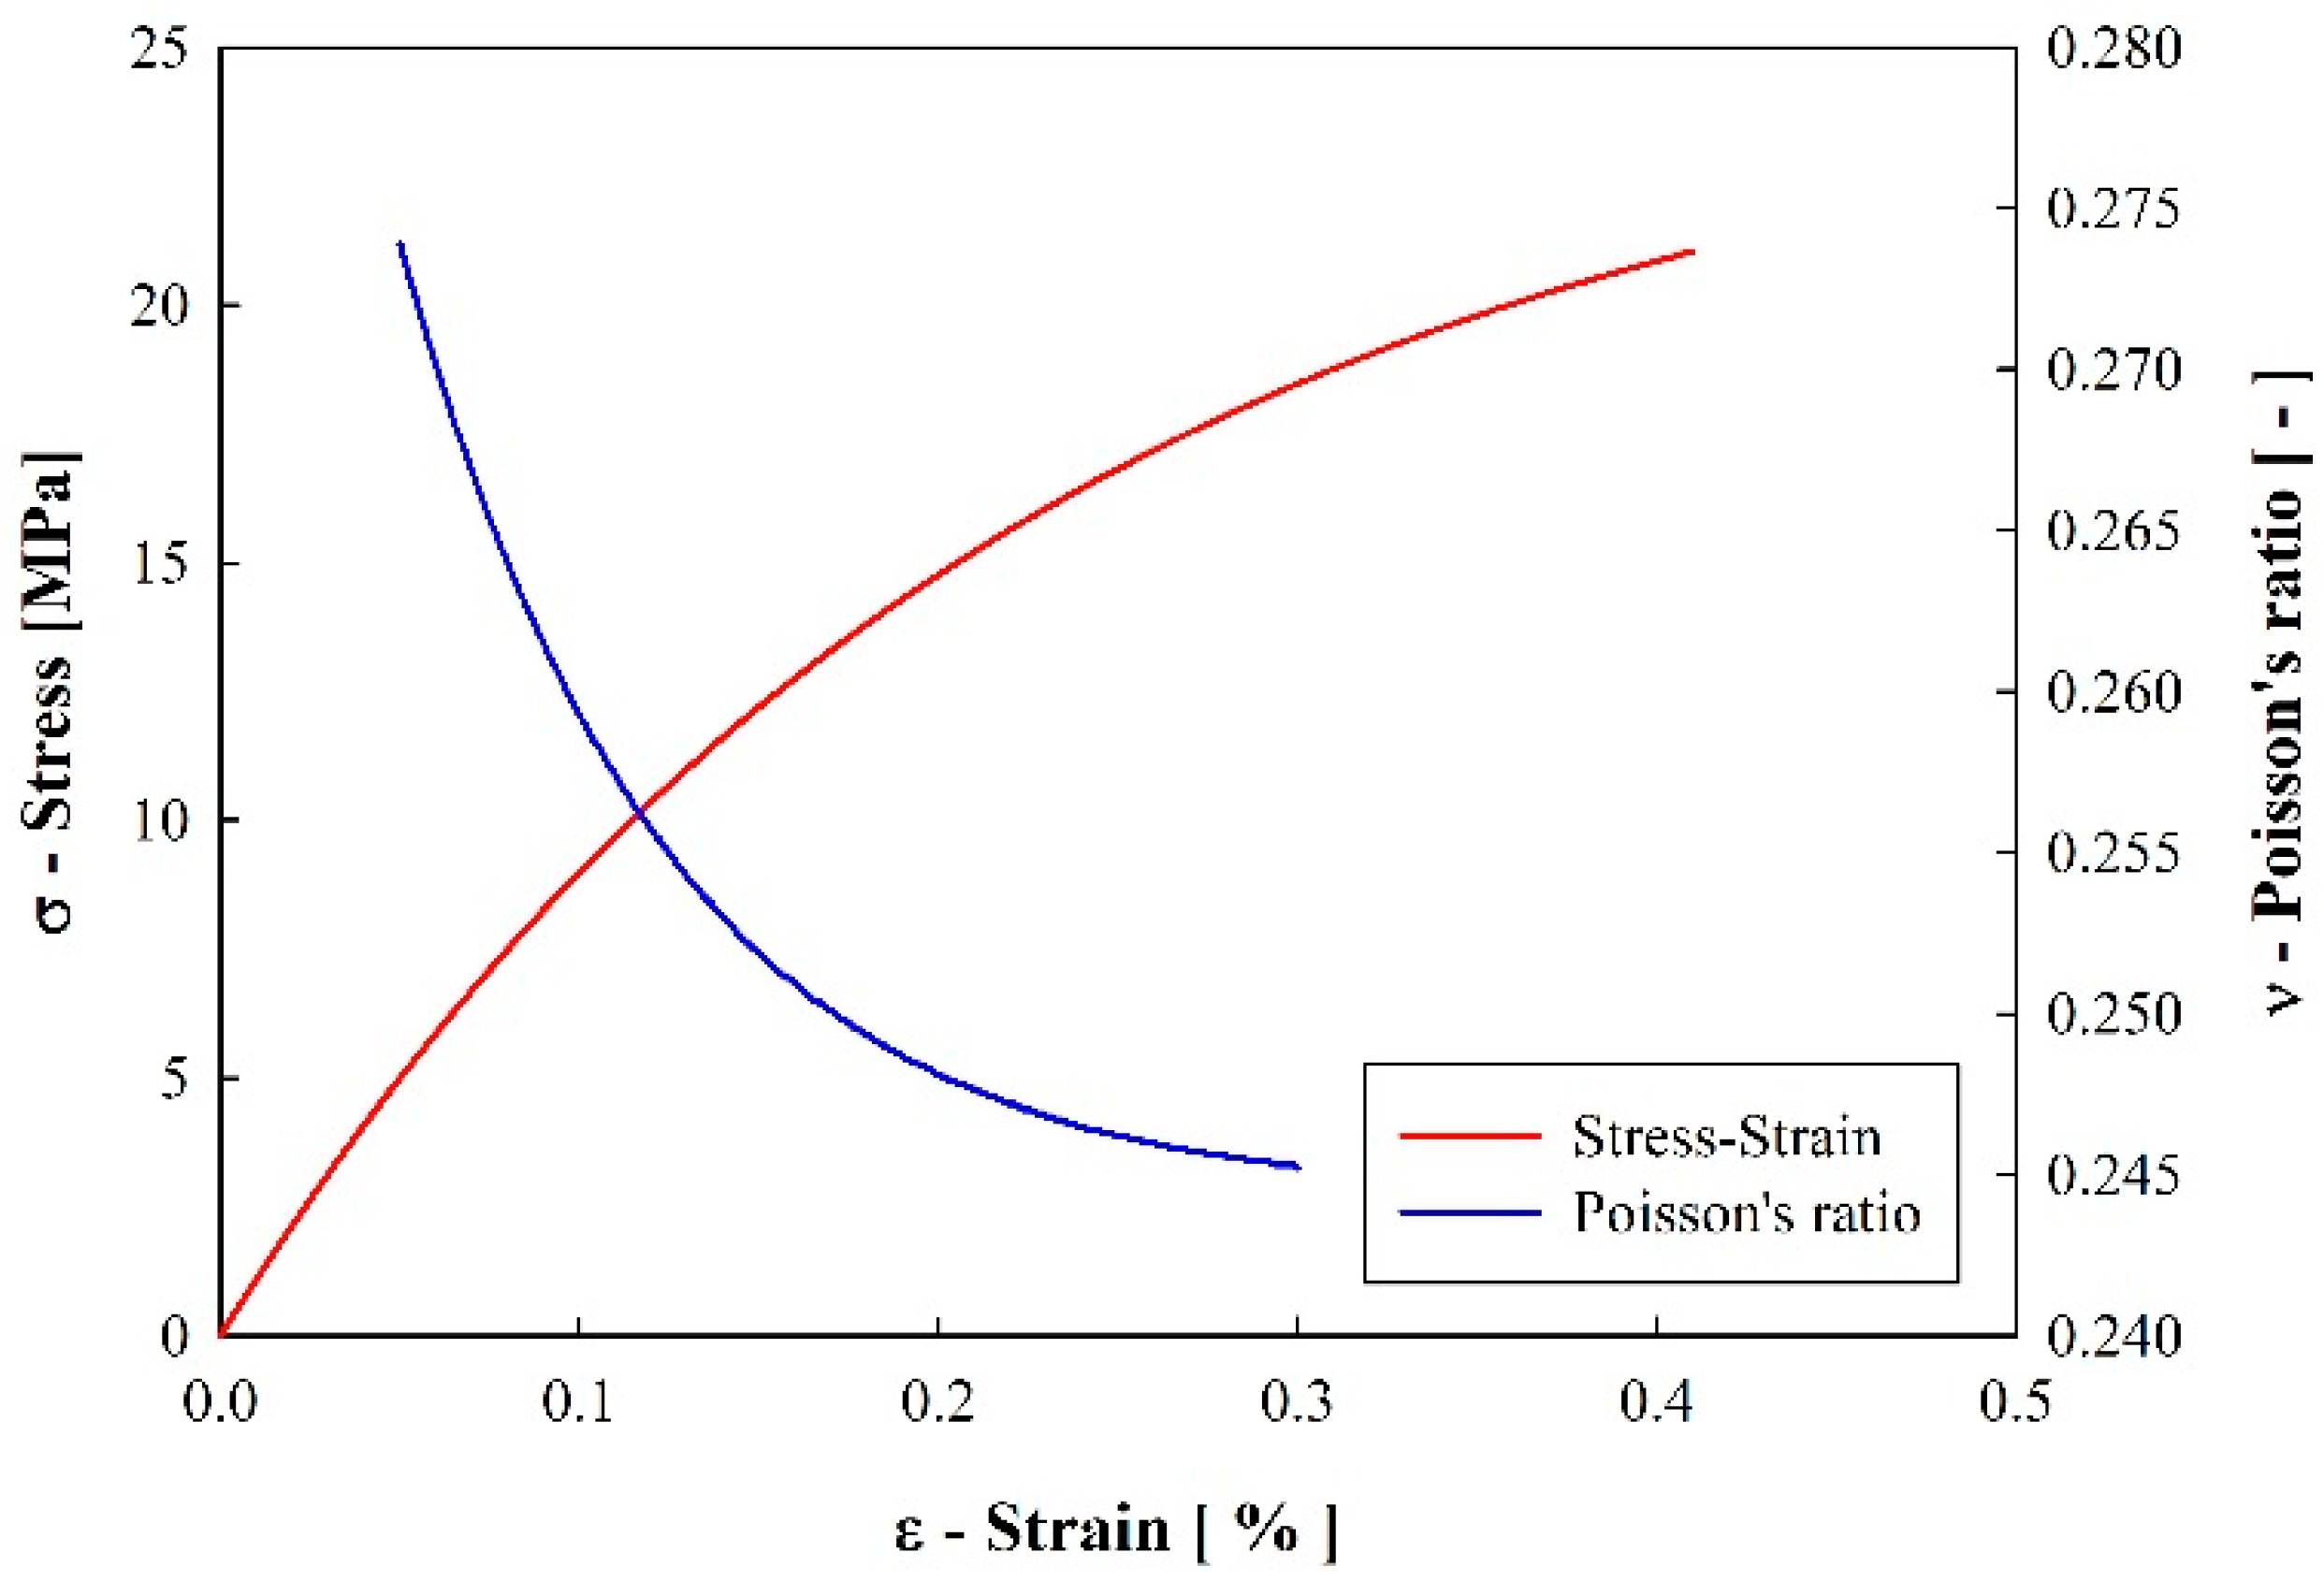
Figure 4 shows the average results of the experimental tensile tests, in the form of a stress–strain curve and instant Poisson’s ratio. It is shown that the structural epoxy displays a non-linear behavior typical of these materials, where a static complex modulus (E* = 7.15 ± 0.12 GPa) was determined using the tangent method. Additionally, it is shown that Poisson’s ratio (ν) changes slightly with the applied stress; however, for the corresponding applied strains in the DMA testing, it was defined as 0.27 (±0.04).
3.3. Dynamic Mechanical Analysis
Figure 5 displays the average results of DMA testing, namely the variation of the output values of complex modulus (E*) and internal friction (tan(δ)) with temperature (T). The determination of the complex modulus was performed by the monitoring of the instant values of stiffness (Ks), and using Equation (1) with a constant value of Poisson’s ratio from the tensile test (ν = 0.27). From this analysis, it may be observed that the increase in temperature was able to promote the changes in the internal structure based on glass transition (Tg) from the severe decrease in stiffness. From the maximum internal friction peak method, it was determined that the average glass transition temperature (Tg) was 78.7 (±1.24) °C. This method implies a deviation relative to other methods (e.g., storage modulus inflection or loss modulus peak); however, it is commonly used in research dynamic mechanical analysis [23].
Changes in internal friction are related to a modification in the material hysteretic damping, and they correspond to the energy that is dissipated as heat during the subsequent deformation cycles. In this case, the epoxy thermal transition by free volume changes and relaxation was due to the large-scale motions in the amorphous polymeric chains. From these variations, the material was transformed into a rubbery state, and consequently, Poisson’s ratio also changed for the specimen to display a near-isochoric behavior (ν ~ 0.5) [19,20].
3.4. Finite Element Analysis
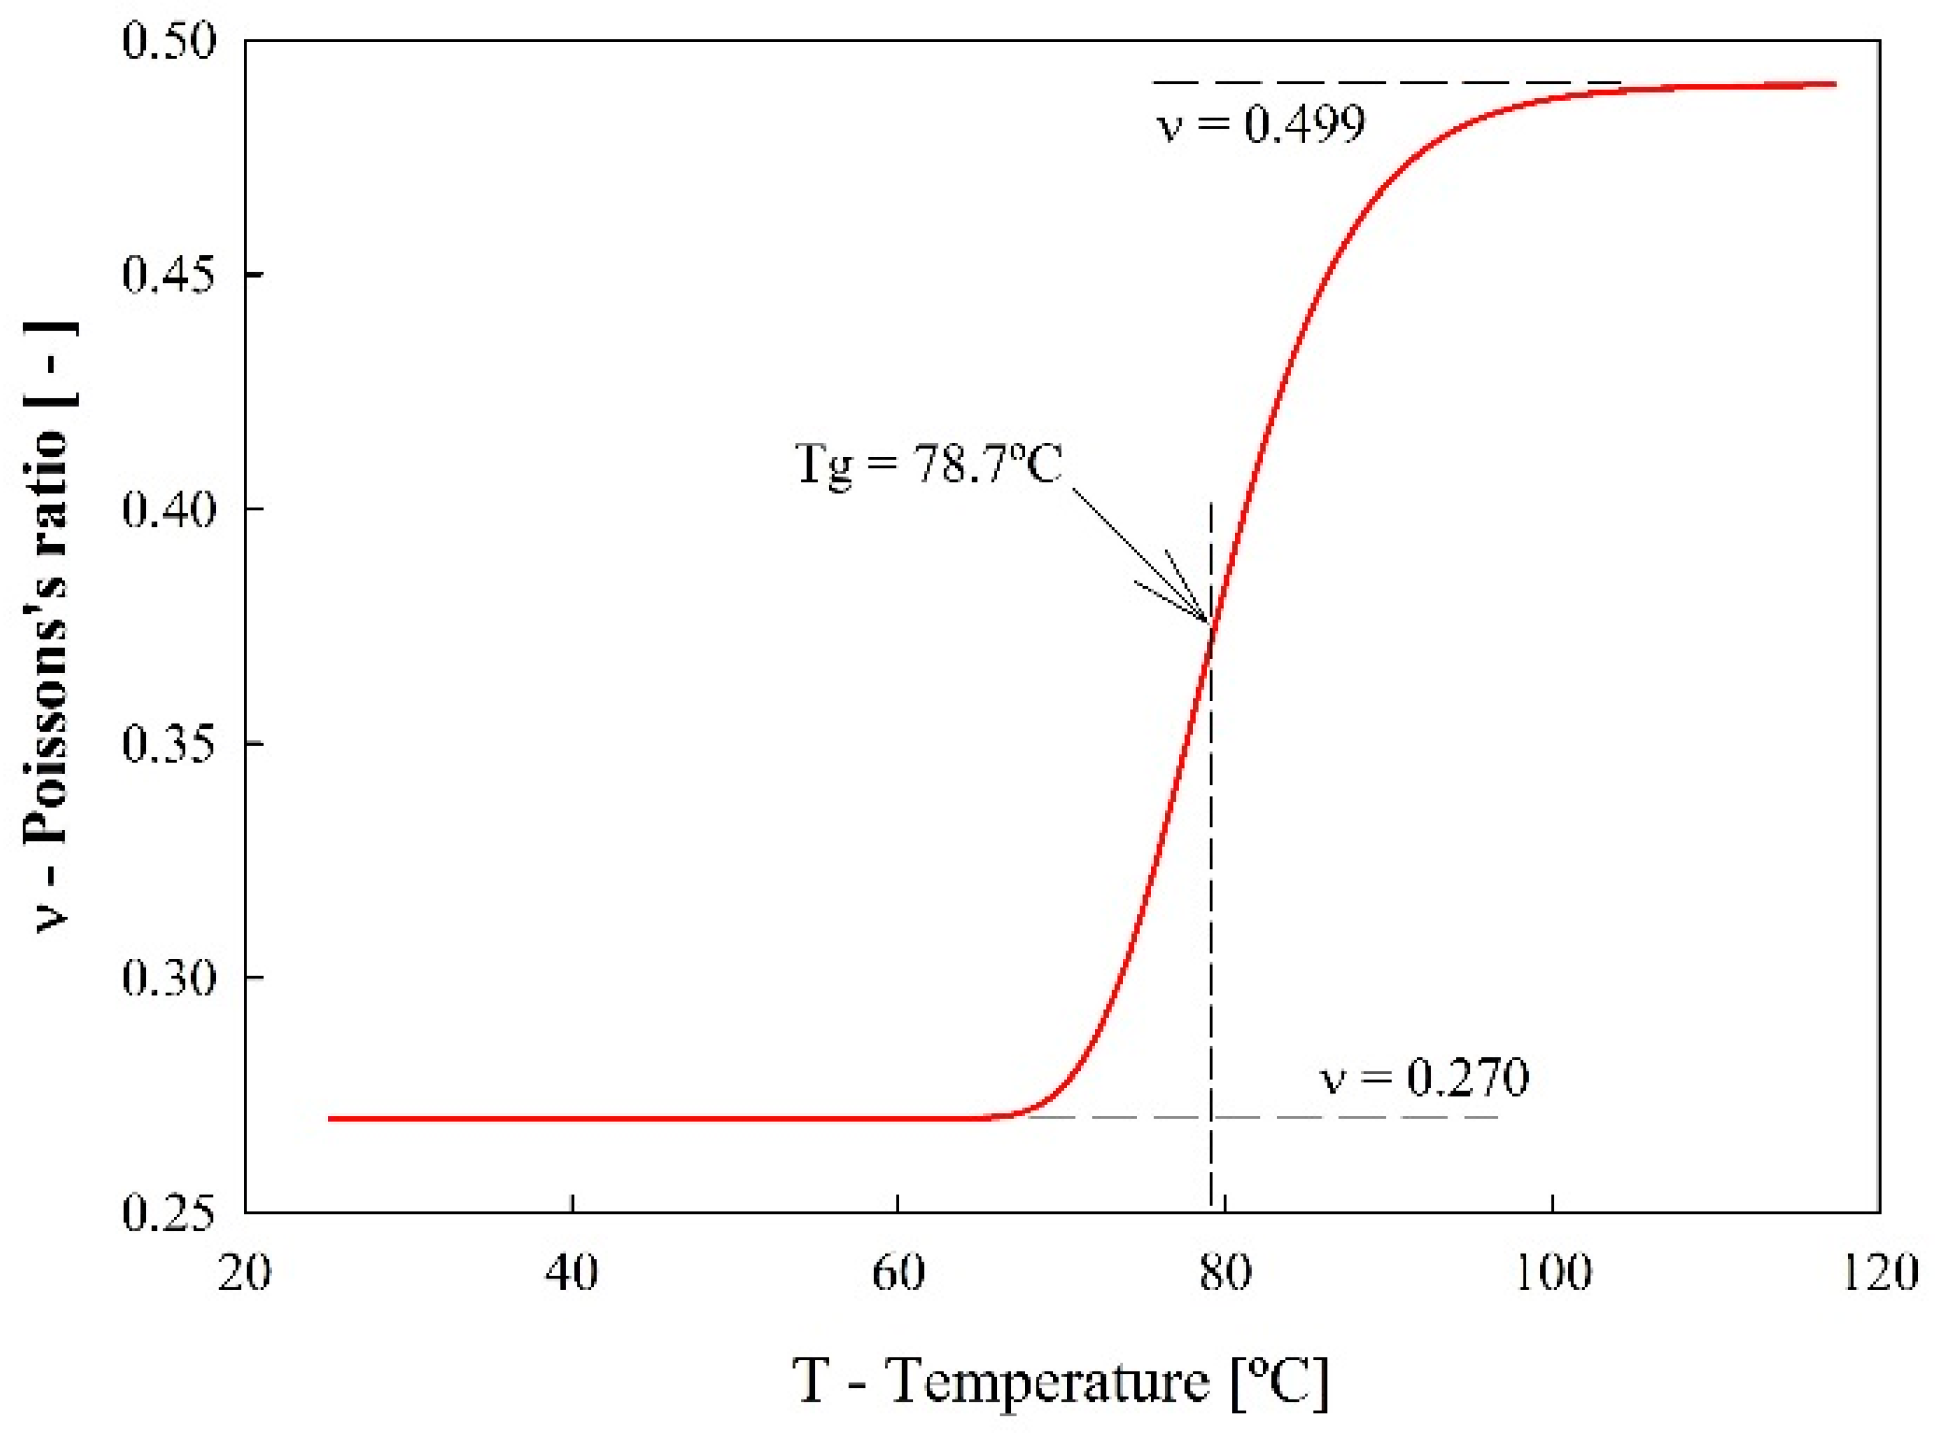
Given the temperature dependence of Poisson’s ratio, the value for this elastic constant at room temperature (ν = 0.27), and the fact that, during the rubbery state, the material had a near-isochoric behavior (ν ~ 0.5), the input of the FEA Poisson’s ratio was modeled according to Figure 6. The smooth transition was shaped according to the instantaneous slope values of internal friction that were determined using DMA.
According to the established FEA methodology, the results monitored the maximum values of width change due to Poisson’s effect (Figure 7a) and the maximum stress value (Figure 7b).
Figure 8 is a plot that compares the FEA results considering a constant Poisson’s ratio as a classic DMA experiment would be performed, and a variable Poisson’s ratio (Figure 6) according to the proposed model.
It may be observed that there was a small increase in stress values when a variable Poisson’s ratio was considered. However, the change in width strain was relevant, especially in the imposed shape deformations to accommodate the isochoric behavior of the specimen.
4. Discussion—Influence of Poisson’s Ratio
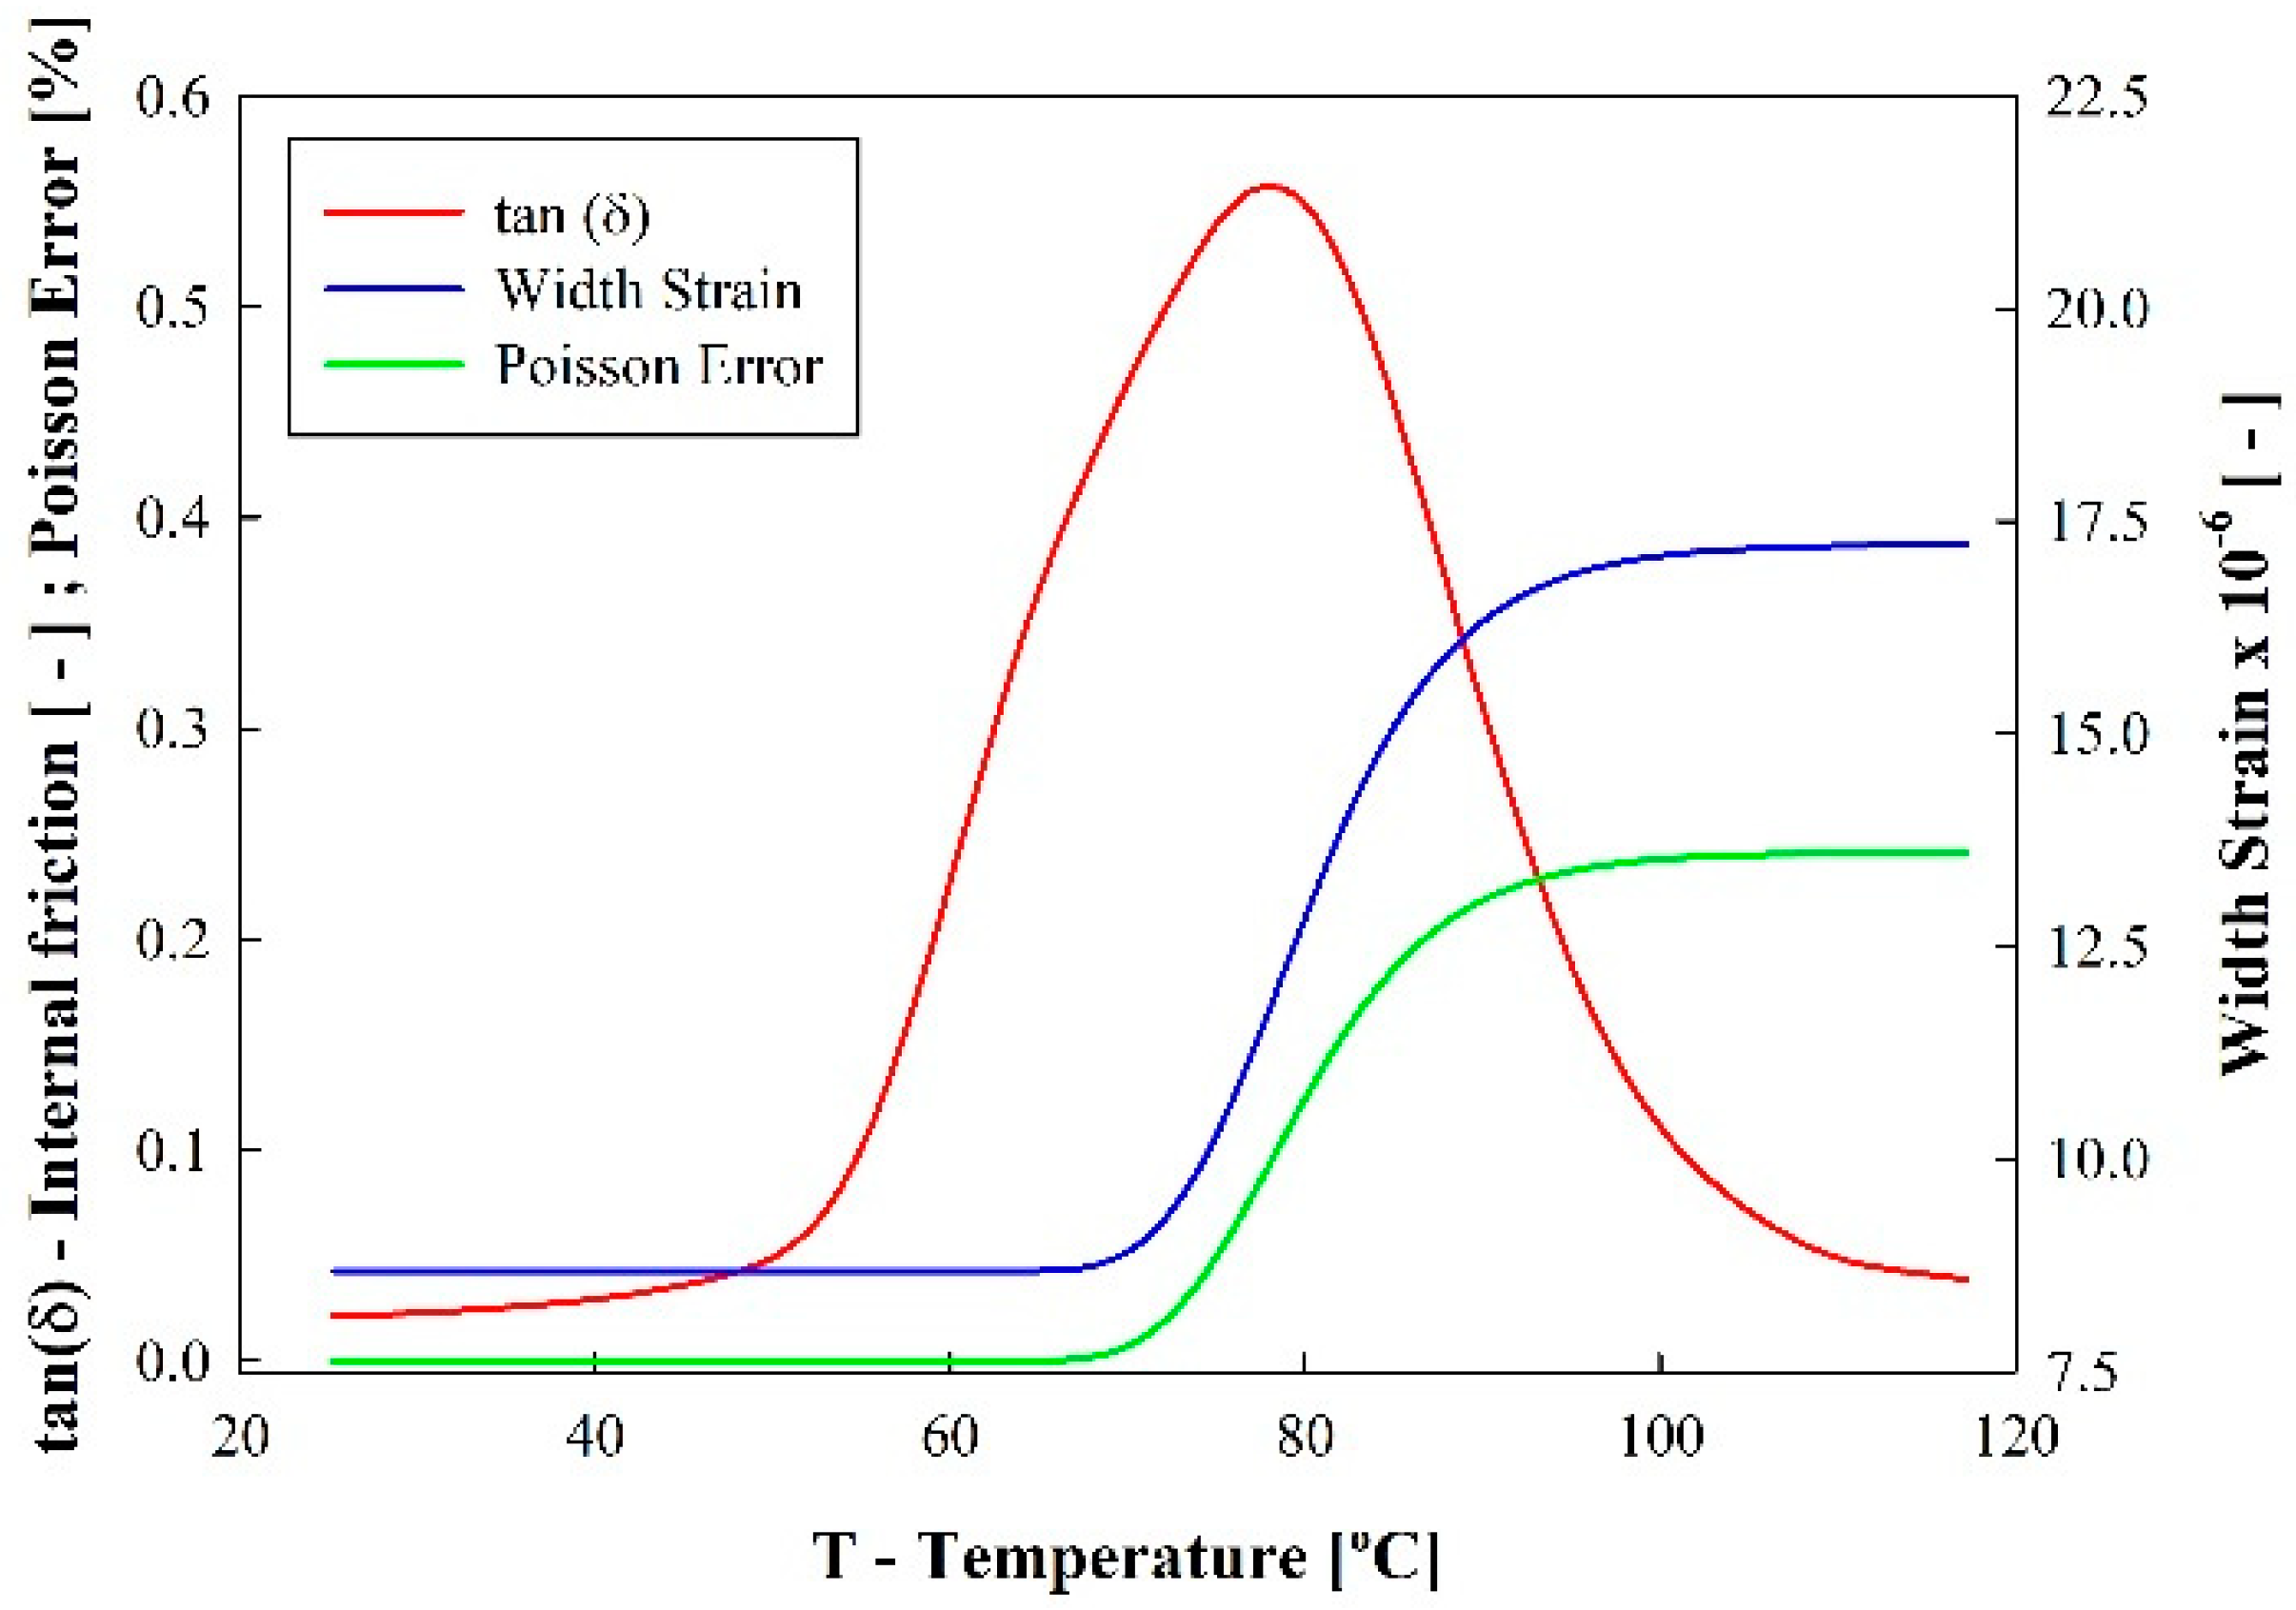
According to the established results, the different values for the error in Poisson’s ratio may be determined by comparing the values of complex modulus considering a constant and variable Poisson’s ratio (Equation (4)).
These results are plotted in Figure 9 and compared with the values of width strain and internal friction. Given the relationship between the Tg transition shown by the internal friction peak, there is a consequent extreme dimensional change in width strain due to the increase in Poisson’s ratio.
Considering that the classic DMA procedure uses Poisson’s ratio as an input value that remains constant during the experimental testing, it is suggested by this analysis that there is a small error when the values of complex modulus are acquired during such a procedure (Poisson’s error ~0.25%). These changes may, however, be higher if the dynamic changes in Poisson’s ratio are more elevated.
Based on this analysis, it may be stated that the values of Poisson error are relatively low, and that these changes are more concerned with polymeric materials. However, given the limits of Poisson’s ratio allowed by the theory of elasticity and the current development of materials with negative Poisson’s ratios [24,25], and the strong positive–negative transition that was observed in hard-body systems [26] and experimentally in phase-changing gels [27], such errors may be much more significant in future analyses.
5. Conclusions
Dynamic mechanical analysis was performed by considering Poisson’s ratio of the specimen as constant. This study explores the influence of a variable Poisson’s ratio on the final results of this procedure. Considering the modification of this elastic property, the following conclusions were drawn:
- -
- Given that the Poisson’s ratio may change due to external stimulation (e.g., temperature, loading, time, etc.) there is an error associated with the consideration of its value as constant during the DMA test;
- -
- The error is more prominent in situations where Poisson’s ratio increases significantly, and is attributed to shape variations in the specimen, especially in conditions where the final Poisson’s ratio approximates an isochoric (ν ~ 0.5) behavior;
- -
- It is suggested that the evolution of this technology should consider Poisson’s ratio as a variable to eliminate this error in future material characterization.
Author Contributions
Both authors contributed equally to this work. Investigation, V.H.C.; Methodology, V.H.C. and H.P.; Writing–original draft, V.H.C.; Writing–review & editing, H.P.
Funding
This work is supported by the research doctoral grant PD/BD/114096/2015 and post-doctoral grant SFRH/BPD/76680/2011 through Portuguese National Funding Agency for Science (FCT). Also, this work is supported by FCT with the reference project UID/EEA/04436/2013 and by FEDER funds through the COM-PETE 2020 with the reference project POCI-01-0145-FEDER-006941.
Conflicts of Interest
The authors declare no conflicts of interest.
References
- Tschoegl, N.W.; Knauss, W.G.; Emri, I. Poisson’s Ratio in Linear Viscoelasticity—A Critical Review. Mech. Time-Depend. Mater. 2002, 6, 3–51. [Google Scholar] [CrossRef]
- Lakes, R.S.; Wineman, A. On Poisson’s Ratio in Linearly Viscoelastic Solids. J. Elast. 2006, 85, 45–63. [Google Scholar] [CrossRef]
- Poynting, J.H. On Pressure Perpendicular to the Shear Planes in Finite Pure Shears, and on the Lengthening of Loaded Wires When Twisted. Proc. R. Soc. Lond. Ser. A 1909, 82, 546–559. [Google Scholar] [CrossRef] [Green Version]
- Murayama, T. Dynamic Mechanical Analysis of Polymeric Material; Elsevier Scientific Pub. Co.: Amsterdam, The Netherlands, 1978; ISBN 0-444-41684-6. [Google Scholar]
- Read, B.E.; Dean, G.D. The Determination of Dynamic Properties of Polymers and Composites; Halsted Press: Ultimo, Austrilia, 1978; ISBN 0-470-26543-4. [Google Scholar]
- Dealy, J.M. Rheometers for Molten Plastics: A Practical Guide to Testing and Property Measurement; Van Nostrand Reinhold Company: New York, NY, USA, 1982; ISBN 0-442-21874-5. [Google Scholar]
- Chen, D.-L.; Yang, P.-F.; Lai, Y.-S. A review of three-dimensional viscoelastic models with an application to viscoelasticity characterization using nanoindentation. Microelectron. Reliab. 2012, 52, 541–558. [Google Scholar] [CrossRef]
- Wineman, A. Nonlinear Viscoelastic Solids—A Review. Math. Mech. Solids 2009, 14, 300–366. [Google Scholar] [CrossRef]
- Chartoff, R.P.; Menczel, J.D.; Dillman, S.H. Dynamic Mechanical Analysis (DMA). In Thermal Analysis of Polymers; Wiley-Blackwell: New York, NY, USA, 2008; pp. 387–495. ISBN 978-0-470-42383-7. [Google Scholar]
- Menard, K.P. Dynamic Mechanical Analysis: A Practical Introduction; CRC Press: Boca Raton, FL, USA, 2008; ISBN 1-4200-5313-2. [Google Scholar]
- Madeira, S.; Carvalho, O.; Carneiro, V.H.; Soares, D.; Silva, F.S.; Miranda, G. Damping capacity and dynamic modulus of hot pressed AlSi composites reinforced with different SiC particle sized. Compos. Part B Eng. 2016, 90, 399–405. [Google Scholar] [CrossRef]
- McAninch, I.N.; Palmese, G.R.; Lenhart, J.L.; Scala, J.J.L. DMA testing of epoxy resins: The importance of dimensions. Polym. Eng. Sci. 2015, 55, 2761–2774. [Google Scholar] [CrossRef]
- Chen, C.P.; Lakes, R.S. Dynamic wave dispersion and loss properties of conventional and negative Poisson’s ratio polymeric cellular materials. Cell. Polym. 1989, 8, 343–359. [Google Scholar]
- Chen, C.P.; Lakes, R.S. Micromechanical analysis of dynamic behavior of conventional and negative Poisson’s ratio foams. J. Eng. Mater. Technol. 1996, 118, 285–288. [Google Scholar] [CrossRef]
- Ruzzene, M.; Scarpa, F.; Sorana, F. Wave beaming effects in two-dimensional cellular structures. Smart Mater. Struct. 2003, 12, 363–372. [Google Scholar] [CrossRef]
- Kolat, P.; Maruszewski, B.M.; Wojciechowski, K.W. Solitary waves in auxetic plates. J. Non-Cryst. Solids 2010, 356, 2001–2009. [Google Scholar] [CrossRef]
- Dinh, T.-B.; Long, V.C.; Wojciechowski, K.W. Solitary waves in auxetic rods with quadratic nonlinearity: Exact analytical solutions and numerical simulations. Phys. Status Solidi B 2015, 252, 1587–1594. [Google Scholar] [CrossRef]
- Sobieszczyk, P.; Majka, M.; Kuzma, D.; Lim, T.-C.; Zielinski, P. Effect of longitudinal stress on wave propagation in width-constrained elastic plates with arbitrary Poisson’s ratio. Phys. Status Solidi B 2015, 252, 1615–1619. [Google Scholar] [CrossRef]
- Carneiro, V.H.; Capela, P.; Teixeira, J.C.; Teixeira, S.; Cerqueira, F.; Macedo, F.; Ribas, L.; Soares, D. Influence of Copper Layer Content in the Elastic and Damping Behavior of Glass-Fiber/Epoxy-Resin Composites. Appl. Compos. Mater. 2016, 23, 1219–1228. [Google Scholar] [CrossRef]
- May, C. Epoxy Resins: Chemistry and Technology; CRC Press: Boca Raton, FL, USA, 1987; ISBN 0-8247-7690-9. [Google Scholar]
- TA Q800 Manual: DMA Modulus Equations. TA Instruments. Available online: http://www.tainstruments.com (accessed on 22 June 2018).
- Wojciechowski, K.W. Remarks on “Poisson Ratio beyond the Limits of the Elasticity Theory”. J. Phys. Soc. Jpn. 2003, 72, 1819–1820. [Google Scholar] [CrossRef]
- Michels, J.; Widmann, R.; Czaderski, C.; Allahvirdizadeh, R.; Motavalli, M. Glass transition evaluation of commercially available epoxy resins used for civil engineering applications. Comps. Part B Eng. 2015, 77, 484–493. [Google Scholar] [CrossRef]
- Carneiro, V.H.; Meireles, J.; Puga, H. Auxetic materials—A review. Mater. Sci.-Poland 2013, 31, 561–571. [Google Scholar] [CrossRef]
- Greaves, G.N.; Greer, A.L.; Lakes, R.S.; Rouxel, T. Poisson’s ratio and modern materials. Nat. Mater. 2011, 10, 823–837. [Google Scholar] [CrossRef] [PubMed]
- Tetriakov, K.V.; Wojciechowski, K.W. Monte Carlo simulation of two-dimensional hard body systems with extreme values of the Poisson’s ratio. Phys. Status Solidi B 2005, 242, 730–741. [Google Scholar] [CrossRef]
- Hirotsu, S. Softening of bulk modulus and negative Poisson’s ratio near the volume phase transition of polymer gels. J. Chem. Phys. 1991, 94, 3949–3957. [Google Scholar] [CrossRef]
Figure 1.
Representation of the finite element analysis (FEA): (a) boundary conditions, and (b) mesh.
Figure 1.
Representation of the finite element analysis (FEA): (a) boundary conditions, and (b) mesh.

Figure 2.
Mesh convergence analysis.

Figure 3.
Plotting of complex modulus variation as a function of specimen dimensions, stiffness, and Poisson’s ratio variation.
Figure 3.
Plotting of complex modulus variation as a function of specimen dimensions, stiffness, and Poisson’s ratio variation.
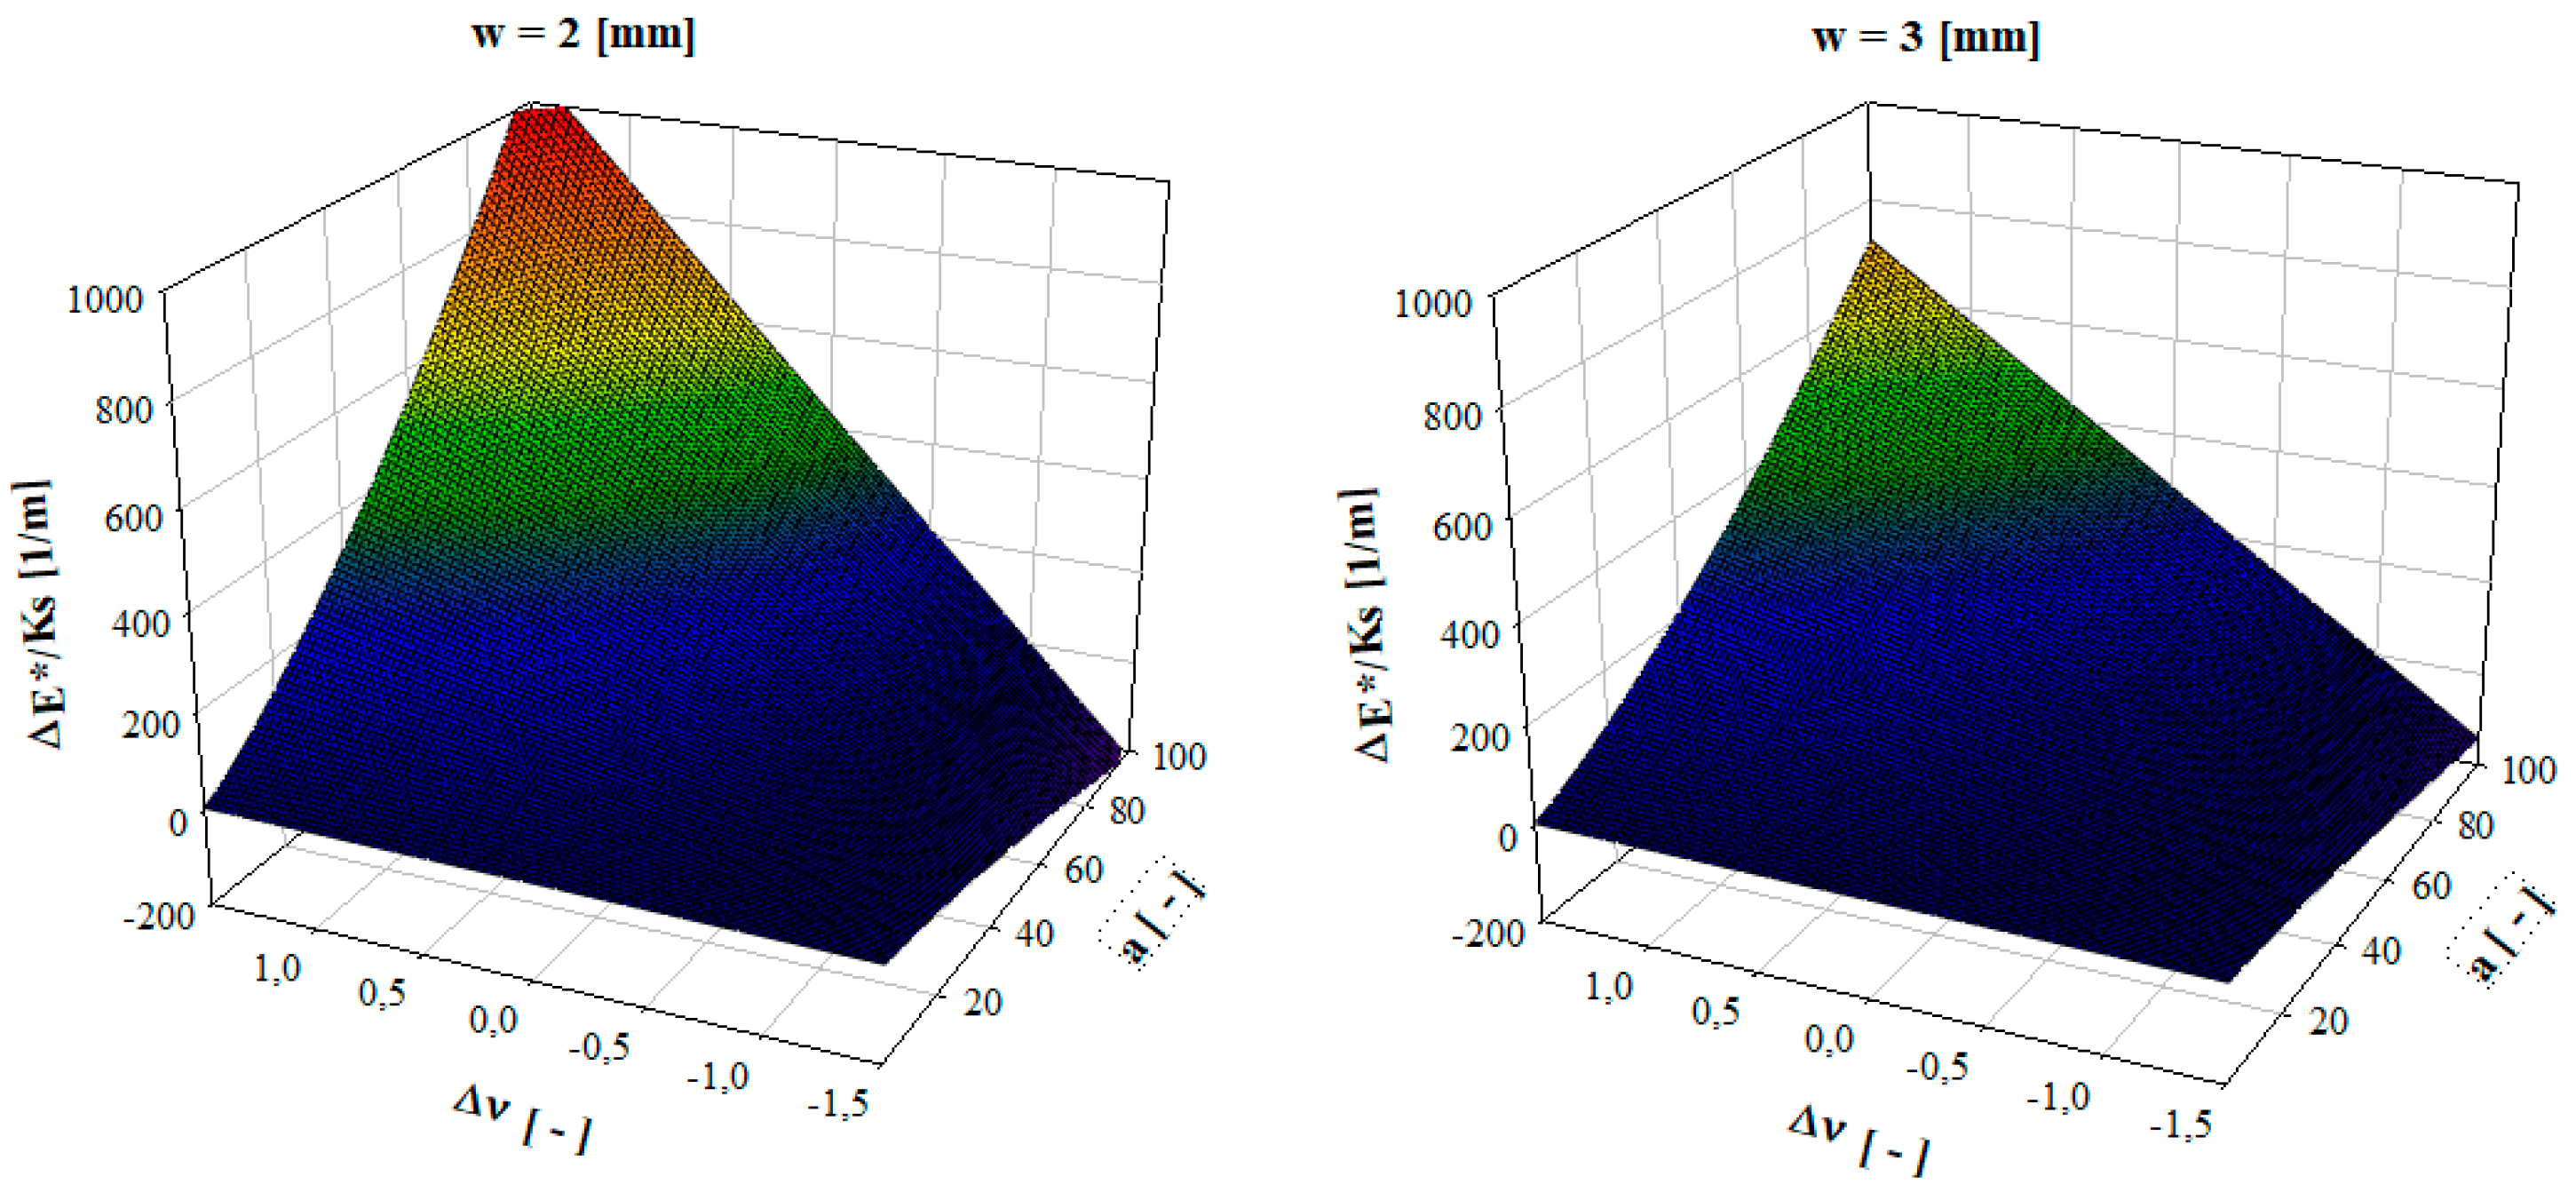

Figure 4.
Average results of experimental tensile testing.

Figure 5.
Average results of DMA testing.

Figure 6.
Poisson’s ratio as a function of temperature input for the FEA.

Figure 7.
Representation of FEA results in terms of width deformation and stress. (a) Deformation; (b) Equivalent Stress.
Figure 7.
Representation of FEA results in terms of width deformation and stress. (a) Deformation; (b) Equivalent Stress.
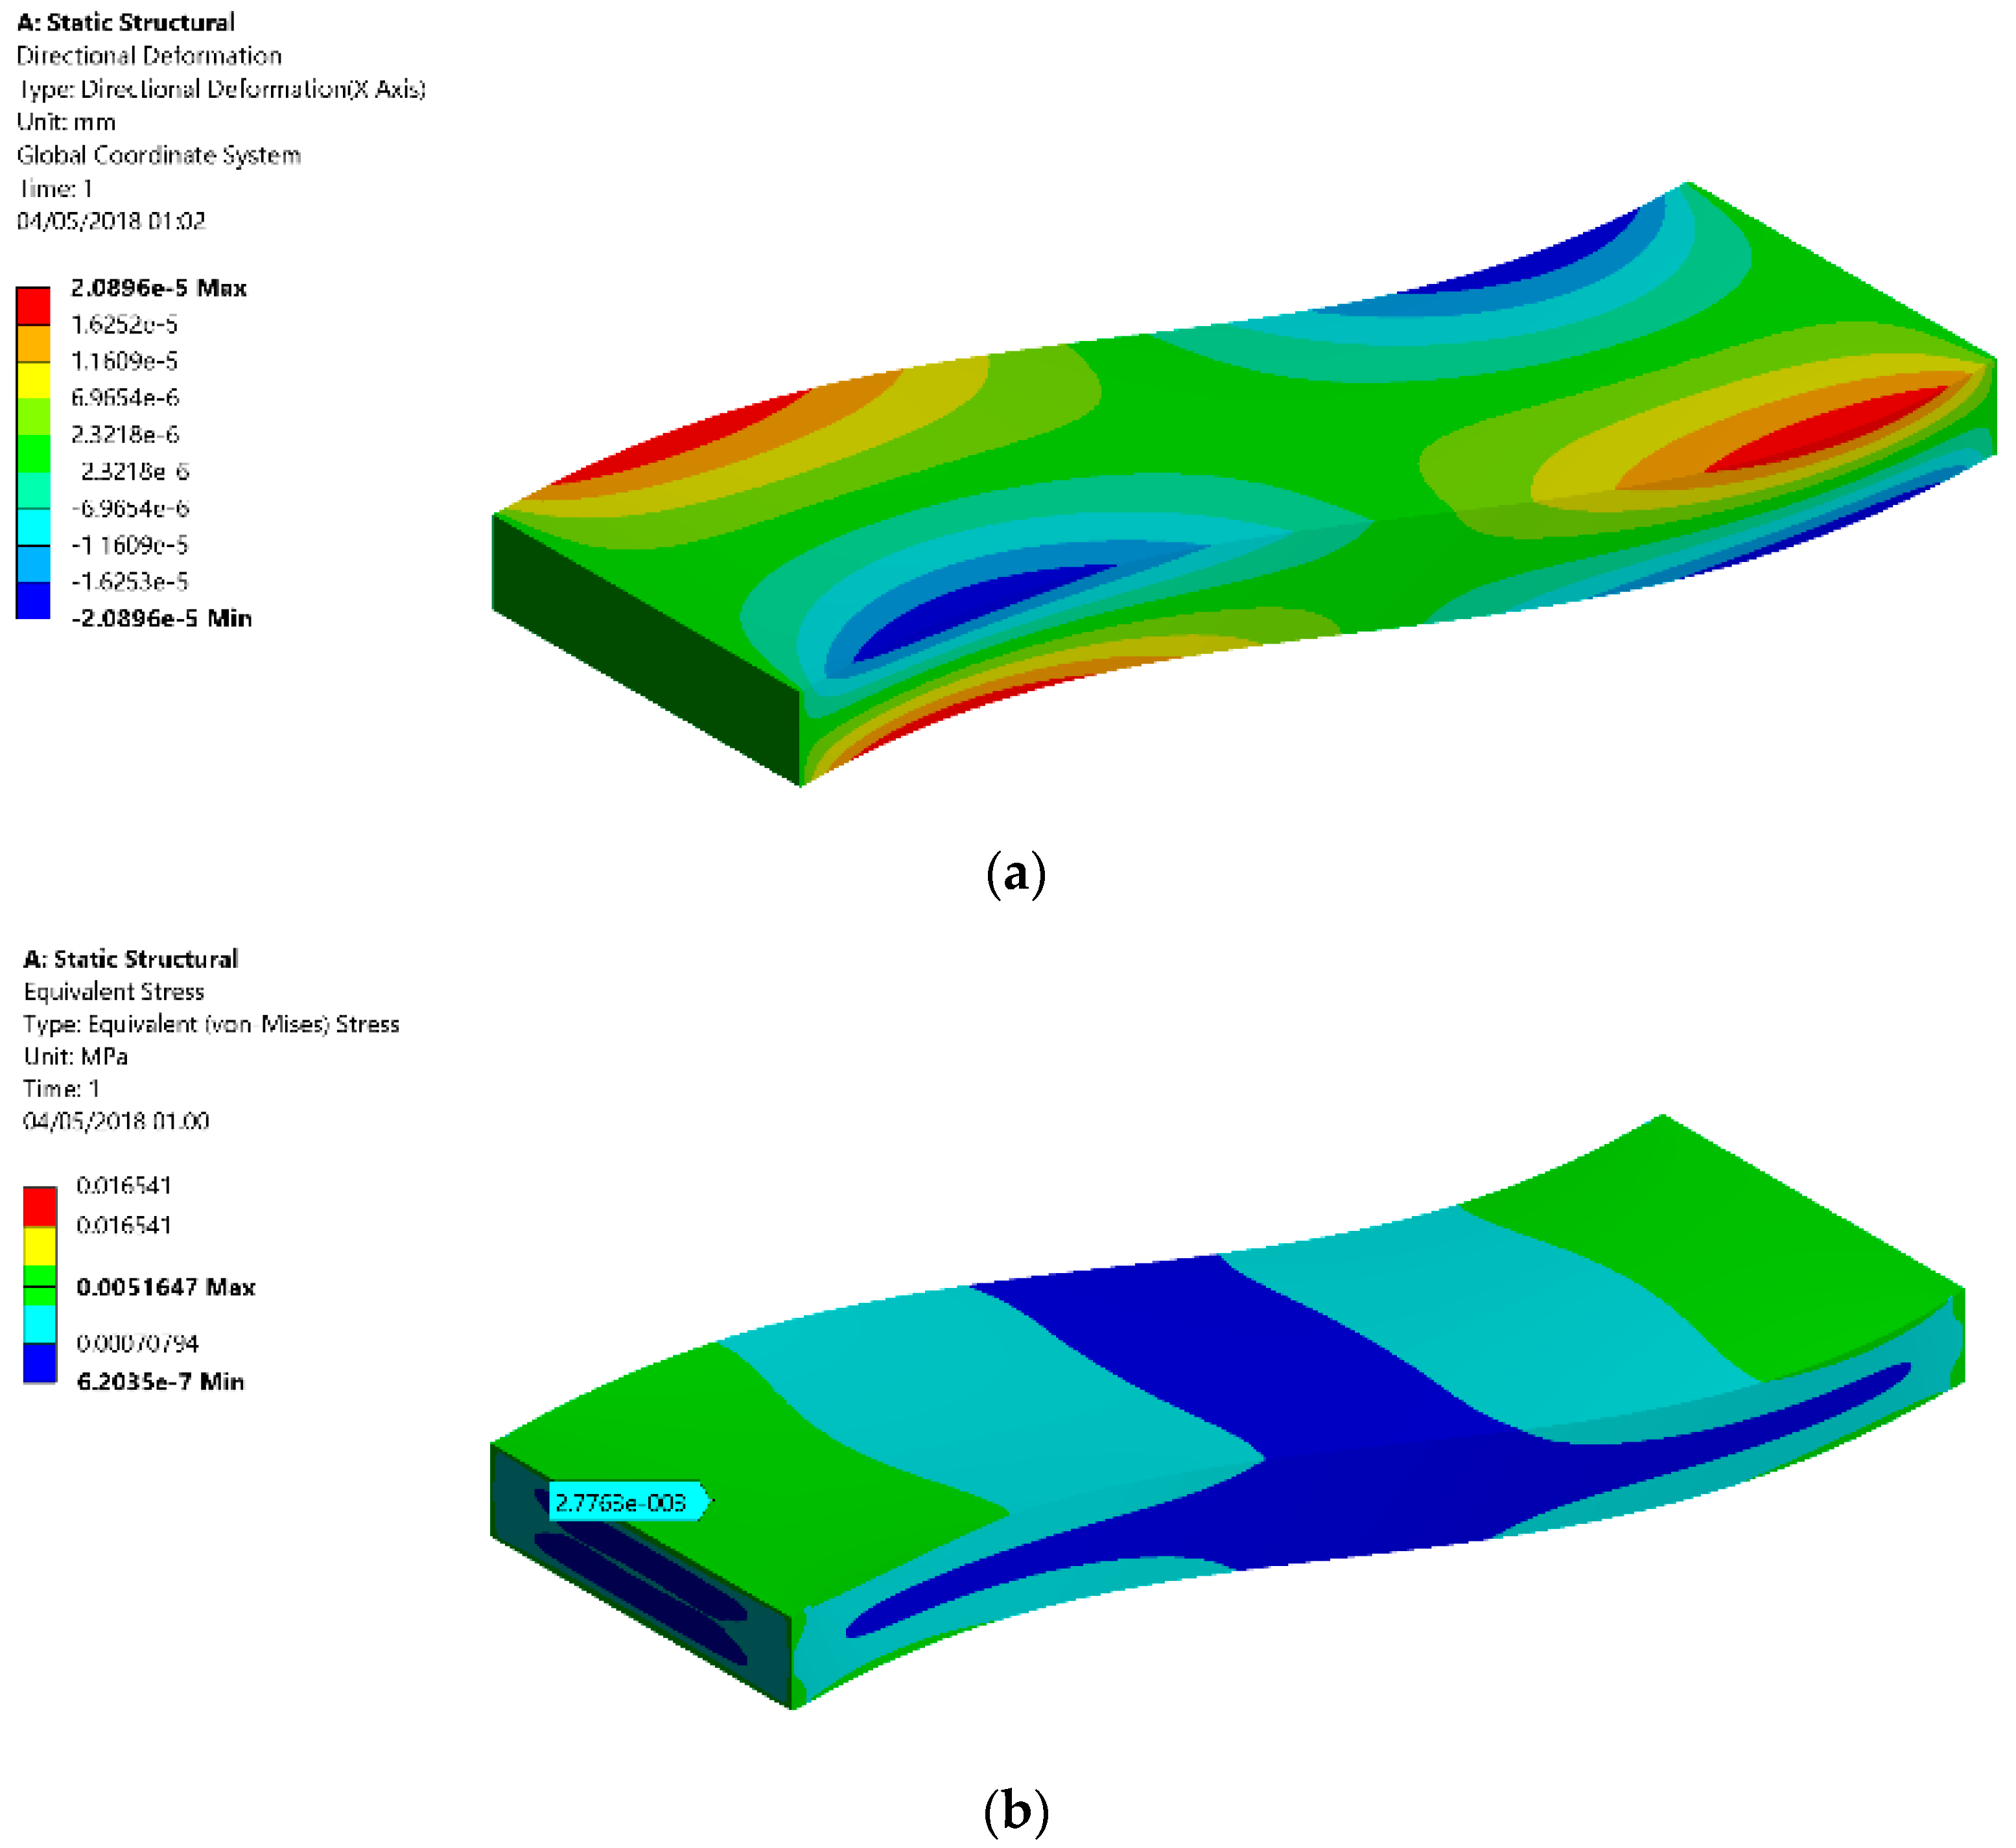
Figure 8.
Comparison of results considering a constant and variable Poisson’s ratio.
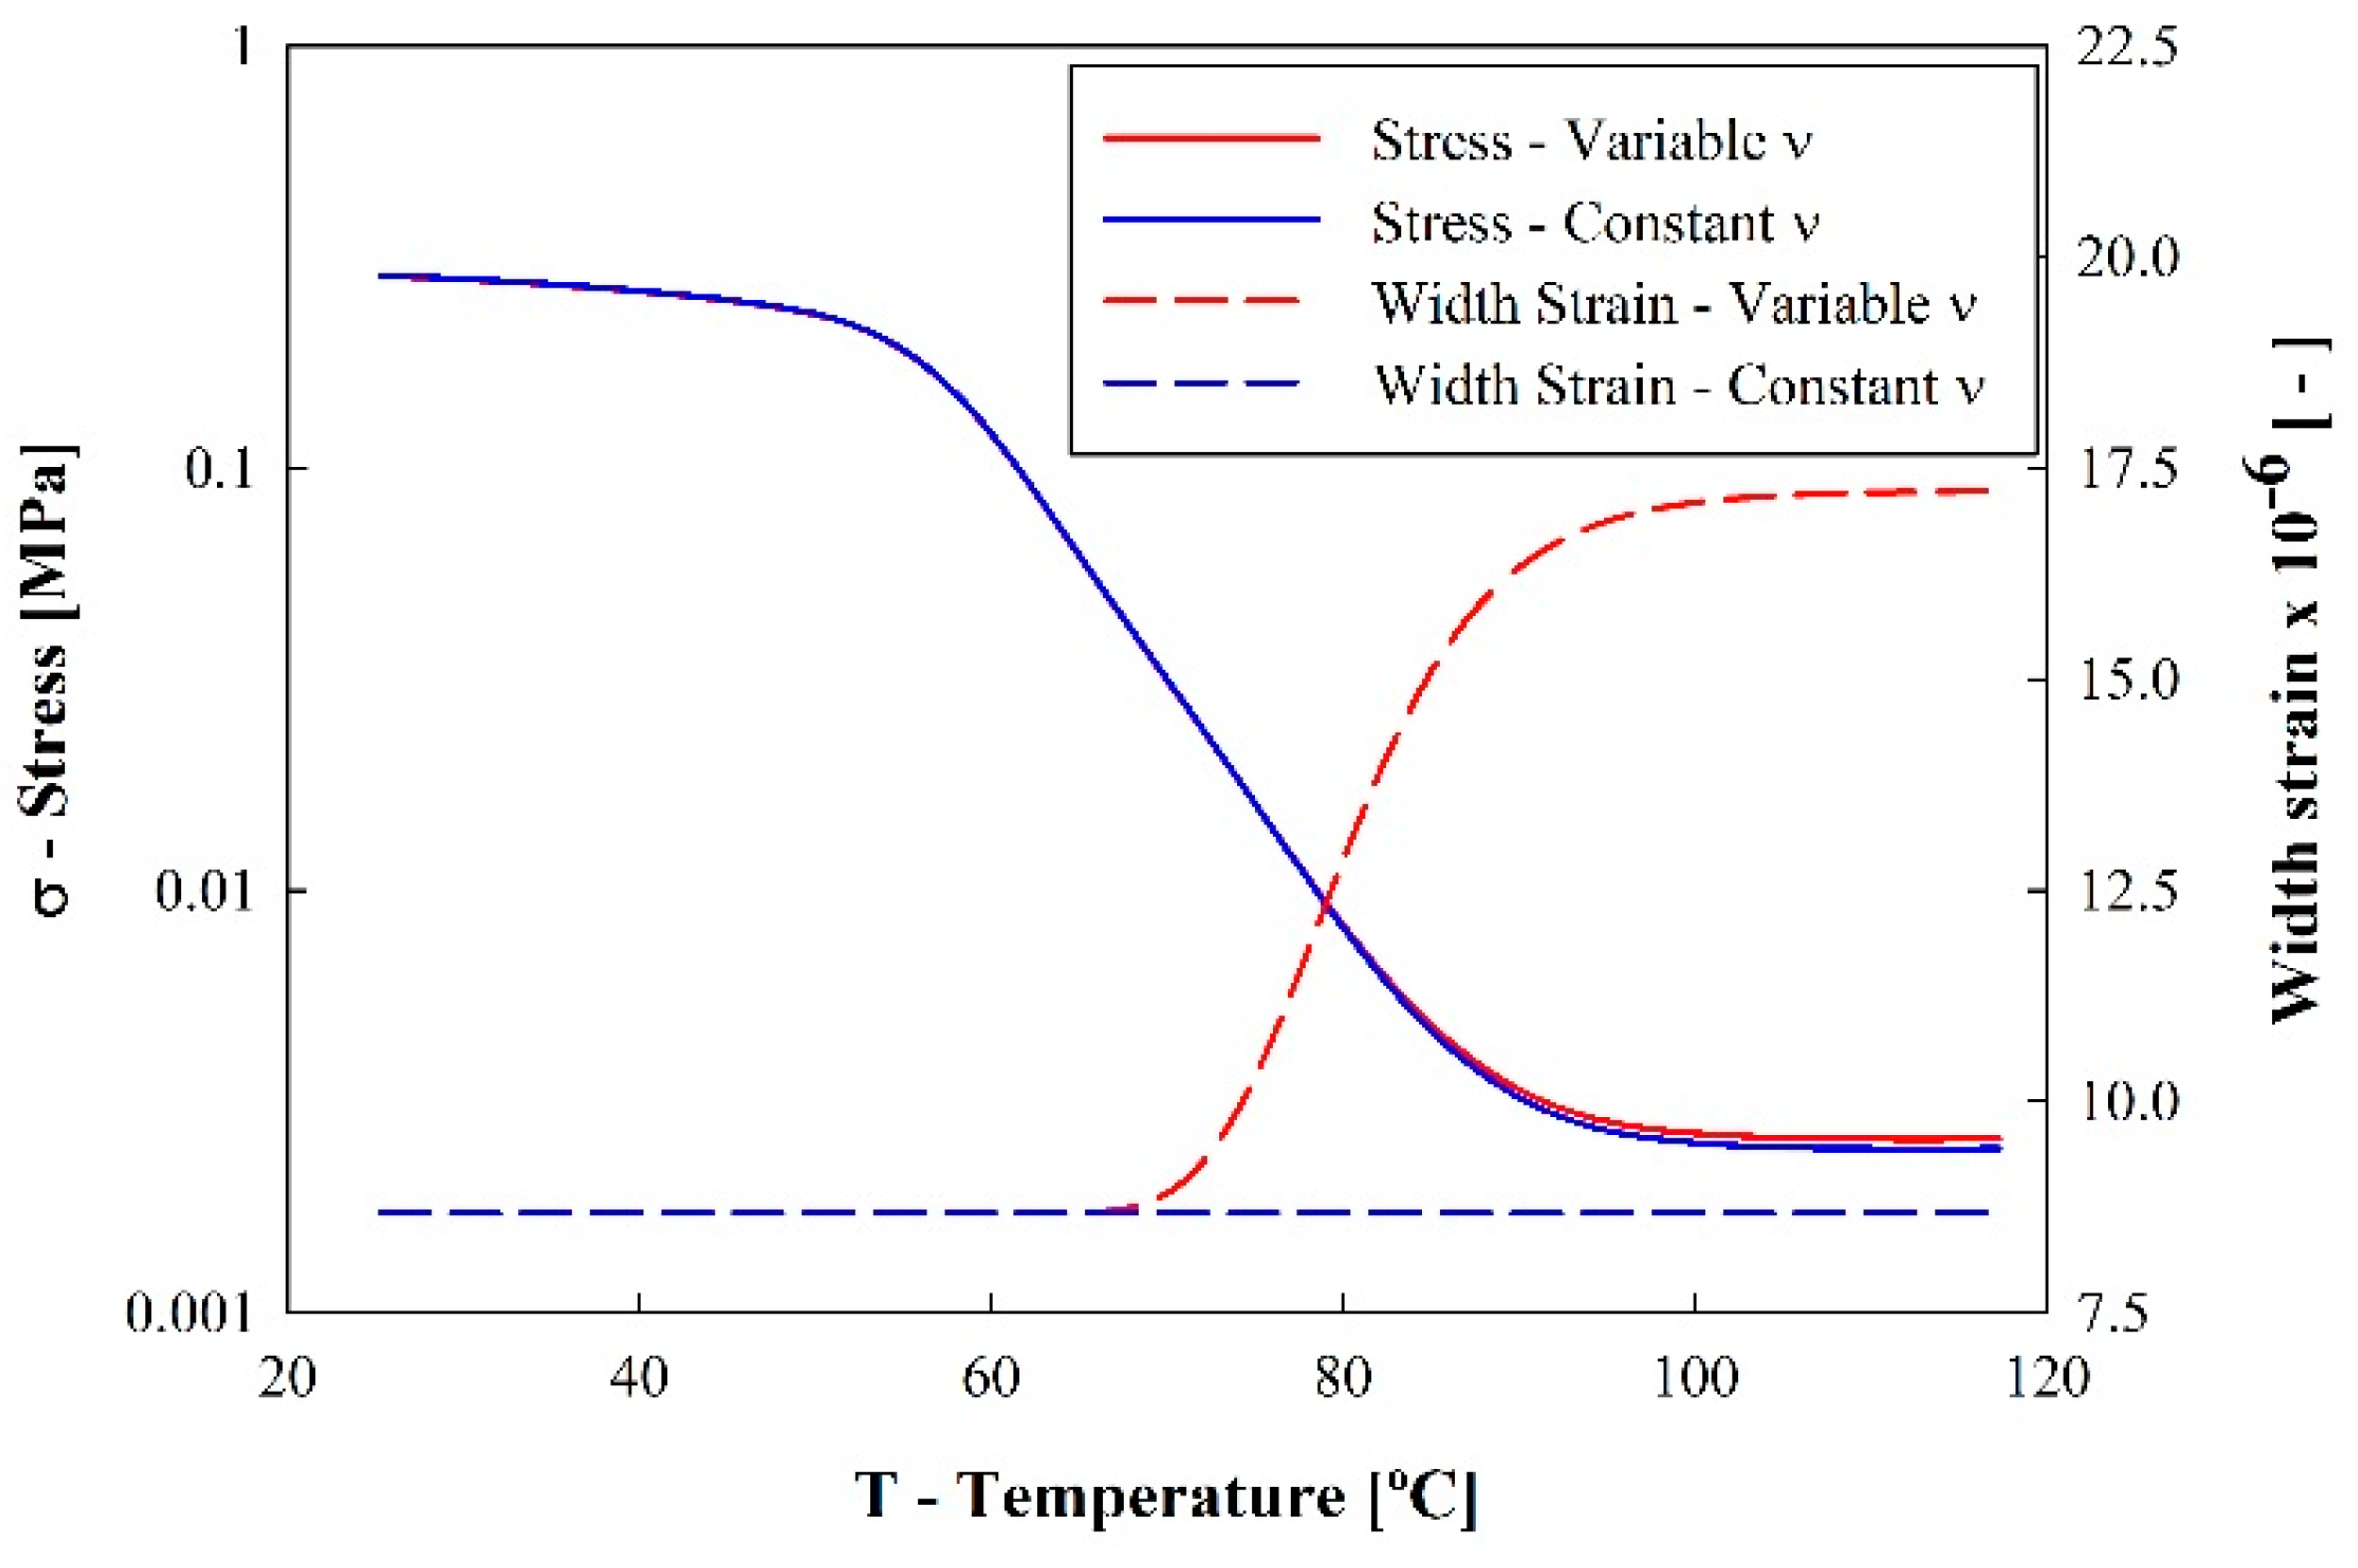
Figure 9.
Graphical representation of results discussion.

Table 1.
Composition and dimensions of tested specimens.
| Chemical Composition | Specimens | |||
|---|---|---|---|---|
| Component A (Resin) |
| Dimension | Value (mm) | SD (mm) |
| Thickness | 1.23 | 0.08 | ||
| Component B (Hardener) |
| Width | 4.51 | 0.08 |
| Length | 30.20 | 0.11 | ||
© 2018 by the authors. Licensee MDPI, Basel, Switzerland. This article is an open access article distributed under the terms and conditions of the Creative Commons Attribution (CC BY) license (http://creativecommons.org/licenses/by/4.0/).
Share and Cite
MDPI and ACS Style
Carneiro, V.H.; Puga, H. Temperature Variability of Poisson’s Ratio and Its Influence on the Complex Modulus Determined by Dynamic Mechanical Analysis. Technologies 2018, 6, 81. https://doi.org/10.3390/technologies6030081
AMA Style
Carneiro VH, Puga H. Temperature Variability of Poisson’s Ratio and Its Influence on the Complex Modulus Determined by Dynamic Mechanical Analysis. Technologies. 2018; 6(3):81. https://doi.org/10.3390/technologies6030081
Chicago/Turabian StyleCarneiro, Vitor H., and Helder Puga. 2018. "Temperature Variability of Poisson’s Ratio and Its Influence on the Complex Modulus Determined by Dynamic Mechanical Analysis" Technologies 6, no. 3: 81. https://doi.org/10.3390/technologies6030081
Note that from the first issue of 2016, this journal uses article numbers instead of page numbers. See further details here.