Structural Formation of Cyclic Olefin Copolymer (COC) Films as Revealed by Real Time Retardation Measurements during Fast Stretching Process


1
Department of Polymer Science & Engineering, Graduate School of Organic Materials Science, Yamagata University, 4-3-16 Jonan, Yonezawa, Yamagata 992-8510, Japan
2
Toyo Seiki Seisaku-syo, Ltd., 4-23, Ukima 5-chome, Kita-ku, Tokyo 115-0051, Japan
*
Author to whom correspondence should be addressed.
Technologies 2018, 6(3), 60; https://doi.org/10.3390/technologies6030060
Submission received: 11 June 2018
/
Revised: 23 June 2018
/
Accepted: 26 June 2018
/
Published: 29 June 2018
(This article belongs to the Special Issue Smart Systems)
Abstract
:This work reports on an experimental study of the fast stretching of a cyclic olefin copolymer (COC) film. We measured the stress retardation of the polymer film during fast stretching and identified a relationship between stress and birefringence. This relationship indicates that the film obeys the stress optical rule (SOR) at the onset of stretching. At slower stretching speeds, the stress optical constant (SOC) settles at a certain value. With faster stretching speeds, SOC values approach the photo-elastic constant (PEC). Our study also investigated the effects of stretching temperatures and stretching modes for both uniaxial stretching and biaxial stretching. We applied techniques of thermal analysis to evaluate higher order structures after fast stretching.
1. Introduction
Recently optical films were developed for applications in healthcare products, optical devices, electronics, and packaging. These films were also demanded on high functionality, thinner, and high engineering properties such as mechanical, heat resistance, and chemical resistance. The molecular orientation of these optical films is designed and controlled to enhance their properties.
As a unique characteristic, polymers offer the potential to control molecular orientation by controlled stretching. One important aspect of stretched films involves improving mechanical properties by altering the orientation of molecular chains in the film plane and controlling planar orientation based on a balance between properties in machine and transverse directions. We can evaluate this behavior by examining optical retardation during film stretching.
Stretching speeds in film processing have increased for polypropylene (PP), polyethylene terephthalate (PET) and other polymers. For industrial processes, stretching speeds now range up to 400 to 500 m/min. However, such fast stretching can generate crystallization and other sudden structure formation, narrowing the suitable processing window for stretching. Industry response to date has been based on trial and error. The conditions point to the need for on-line structure evaluations under fast stretching conditions as close to possible as the actual industrial processes in which the stretching is being carried out.
The stress optical rule (SOR), or the linear relationship between birefringence and stress, is often associated with development of higher order structures. Ryu et al. [1] have shown that SOR does not hold at low temperatures close to Tg or at high strain rates due to the contributions of glassy stress and photo-elastic constant, typically at room temperature. Hassan et al. [2,3,4] discuss on-line measurements of birefringence and the development of higher order structures in investigations of mechano-optical behavior of PET films during stretching, reporting that SOR continues to apply up to the onset of strain hardening. Studies evaluating the control of strain-induced crystallinity in PET films with different deformation modes, including linear (generally assumed as the standard), exponential, logarithmic, and sigmoidal profile [5], indicate differences in crystallinity behavior. Focusing on fast strain rates, Mahendrasingam et al. [6] investigated conditions associated with draw ratio and temperatures for PET film stretching in which oriented crystallization can occur, evaluating relaxation rates and finding that strain-induced crystallinity decreases below a critical threshold. Polymer films other than PET films, including polystyrene and low-density polyethylene, have also been studied with on-line birefringence measurements during stretching, including detailed studies of physical properties that correlate with orientation and crystallinity [7].
Kikutani et al. [8] examined the retardation of PET running filaments at higher strain rates of up to 1 m/s in investigations of the relationship between birefringence and stress/temperature. Studies of PP film deformation behavior under fast stretching by Tokihisa et al. [9] focus on uniformity of thickness as another important quality of stretched films. Hong and White [10] investigated the birefringence of cyclo olefin polymer (COP) filaments under melt spinning and their mechanical properties.
While few reported studies have examined the behavior of films under high stretching rates, such investigations will expand our understanding of the conditions under which SOR holds. For the purposes of this study, to measure the retardation of polymer films with fast stretching processes, we designed equipment that would allow polymer film stretching at speeds of up to 60 m/min; research to date has been limited to 25 m/min. Our study examined the effects on the retardation of cyclic olefin copolymers (COC) of stretching speeds, stretching temperatures, and stretching modes, including uniaxial free width/constrained width and simultaneous biaxial stretching.
2. Experiment
2.1. Materials
We examined COC (TOPAS® 8007F-04) in this study. COC is amorphous, transparent copolymers based on cyclic olefins and linear olefins. Typical properties of COC includes; low density, high transparency, low water absorption, high rigidity, etc. Density is 1.02 g/cm3. The glass transition temperature (Tg) of used COC is 78 °C. We applied the single screw extrusion process to produce cast film measuring 250 µm in thickness. The extruder used was equipped with a screw size of φ20 mm L/D = 25, to which a coat hanger die measuring 150 mm in width was attached. The chill rolls were placed close to the die to reduce the neck-in phenomenon. The temperature was set to 240 °C for the extruder and die and to 80 °C for the chill rolls. The take-up speed was set to 1 m/min.
2.2. Stretching Process
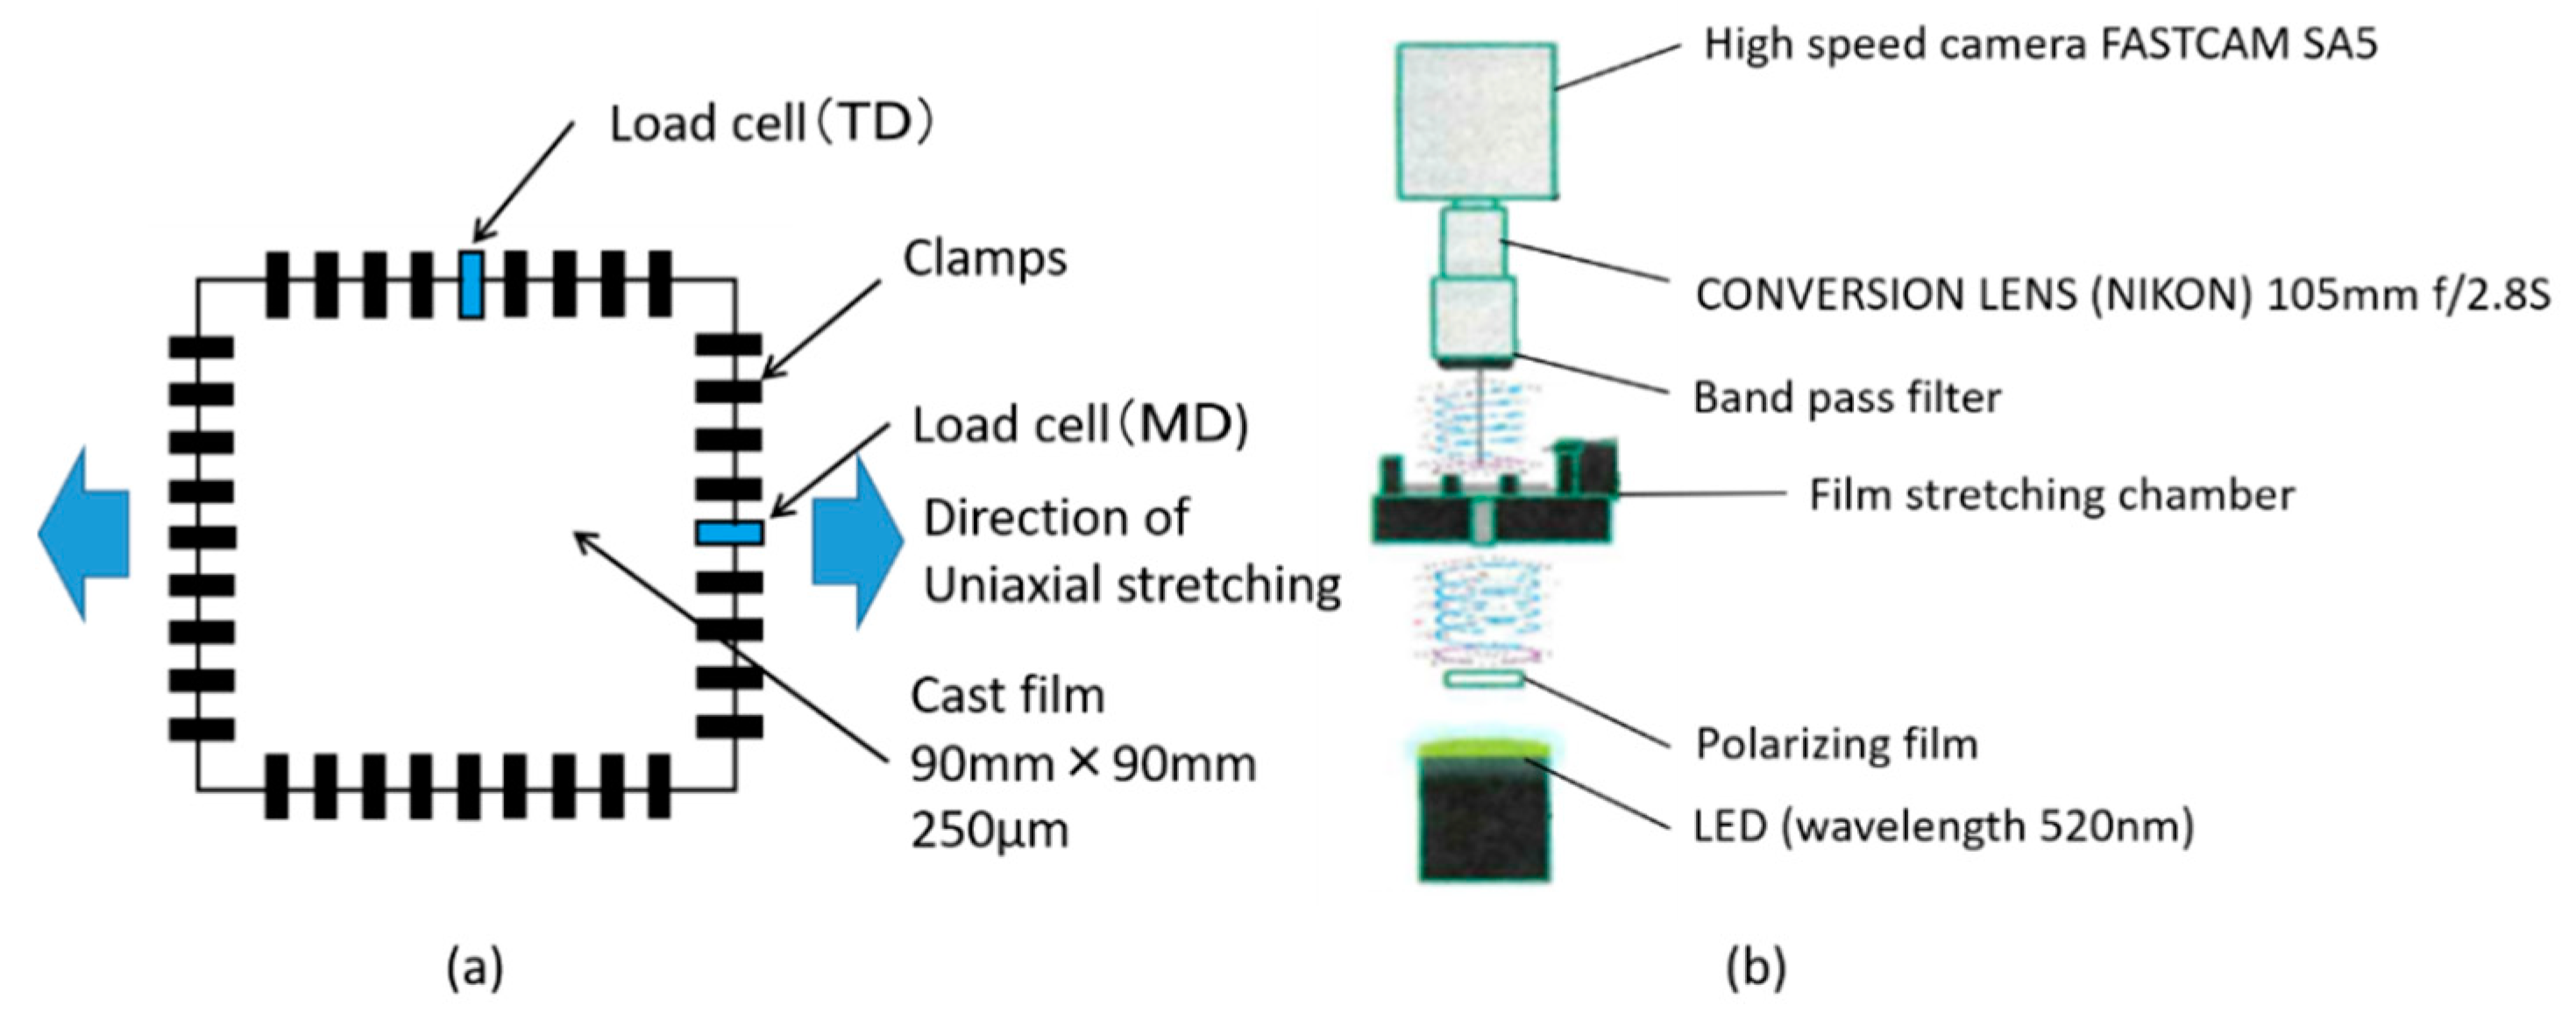
Figure 1 shows a schematic diagram of the film stretcher (Toyo Seiki Seisaku-syo, Ltd., Tokyo, Japan, EX10-S6).
The COC film sample was cut into 90 mm × 90 mm square for stretching process. The film stretcher is equipped with clamping grips, and a load cell is installed on each side of the machine direction (MD) and transverse direction (TD) for stress-strain measurements. We calculated the sectional area during stretching by measuring the thickness of the stretched film at different draw ratio and calculated true stress by dividing the stretching force by sectional area.
The samples were moved to the clamping position in the chamber by a pneumatic device. The chamber was controlled to settle to equilibrium temperatures of 90 °C and 105 °C. Stretching was performed after 3 min of preheating. The sample was stretched at 1, 10, and 60 m/min until draw ratio reaches 3.0. Stretching modes performed include free and constrained uniaxial stretching and simultaneous biaxial stretching. After stretching, the film was immediately air-cooled to room temperature and removed from the chamber. Variability on the quality of stretched film such as thickness uniformity, bowing phenomenon, etc., was carefully considered in this experiment, especially at temperature near Tg. The experiment was designed to be reproducible avoiding unnecessary variability by monitoring the temperature distribution in the chamber including clamping grips, to make sure that temperature is in equilibrium.
2.3. Retardation Measurement
We deployed a high-speed camera (Photron Limited, Tokyo, Japan, FASTCAM SA5) on the stretcher for real-time retardation measurements at high stretching speeds (Figure 1b). Monochromatic light at 520 nm wavelength was emitted from beneath the chamber and directed up toward the film, with a polarizing film interposed along the path. Using a high-speed camera capable of graphically recording in-plane distribution of retardation by using designated software (Photron Limited, Tokyo, Japan, PhotronFrameWork, Rev.1.0.1.7), we observed retardation at the center of the film.
For off-line measurement, we examined the films after stretching using a polarizing microscope (Olympus Corporation, Tokyo, Japan, BX51-P). The relationship between birefringence Δn and retardation R is given by:
where d is thickness and nMD and nTD are refractive indices in MD and TD, respectively. Stress optical constant (SOC) is given by:
where σ is the true stress.
Δn = |nMD − nTD| = R/d,
SOC = Δn/σ,
2.4. Thermal Analysis
2.4.1. Differential Scanning Calorimetry (DSC)
We evaluated glass transition temperature (Tg) of COC by DSC (TA Instruments, New Castle, DE, USA, Q200) at 30–130 °C at a heating rate of 10 °C/min on the first heating.
2.4.2. Dynamic Mechanical Analysis (DMA)
To examine the effects of fast stretching on Tg and modulus, we measured viscoelasticity of the stretched films using a dynamic mechanical analyzer (TA Instruments, New Castle, DE, USA, RSA III) at 40–120 °C at a heating rate of 2 °C/min.
2.4.3. Thermal Mechanical Analysis (TMA)
We measured dimensional changes using a thermal mechanical analyzer (TA Instruments, New Castle, DE, USA, Q400 TMA) at 30–110 °C, at a heating rate of 5 °C/min, and 0.02 N of applied force.
2.5. Mechanical Property Measurements
After preparing the specimen according to DIN 53504-S3, we used a tensile testing machine (Toyo Seiki Seisaku-syo, Ltd., Tokyo, Japan, Strograph VG) to perform engineering stress-strain measurements of the stretched films at room temperature. The strain rate was 5 mm/min. Engineering stress was calculated from the thickness of the stretched films.
3. Results and Discussion
3.1. Differential Scanning Calorimetry
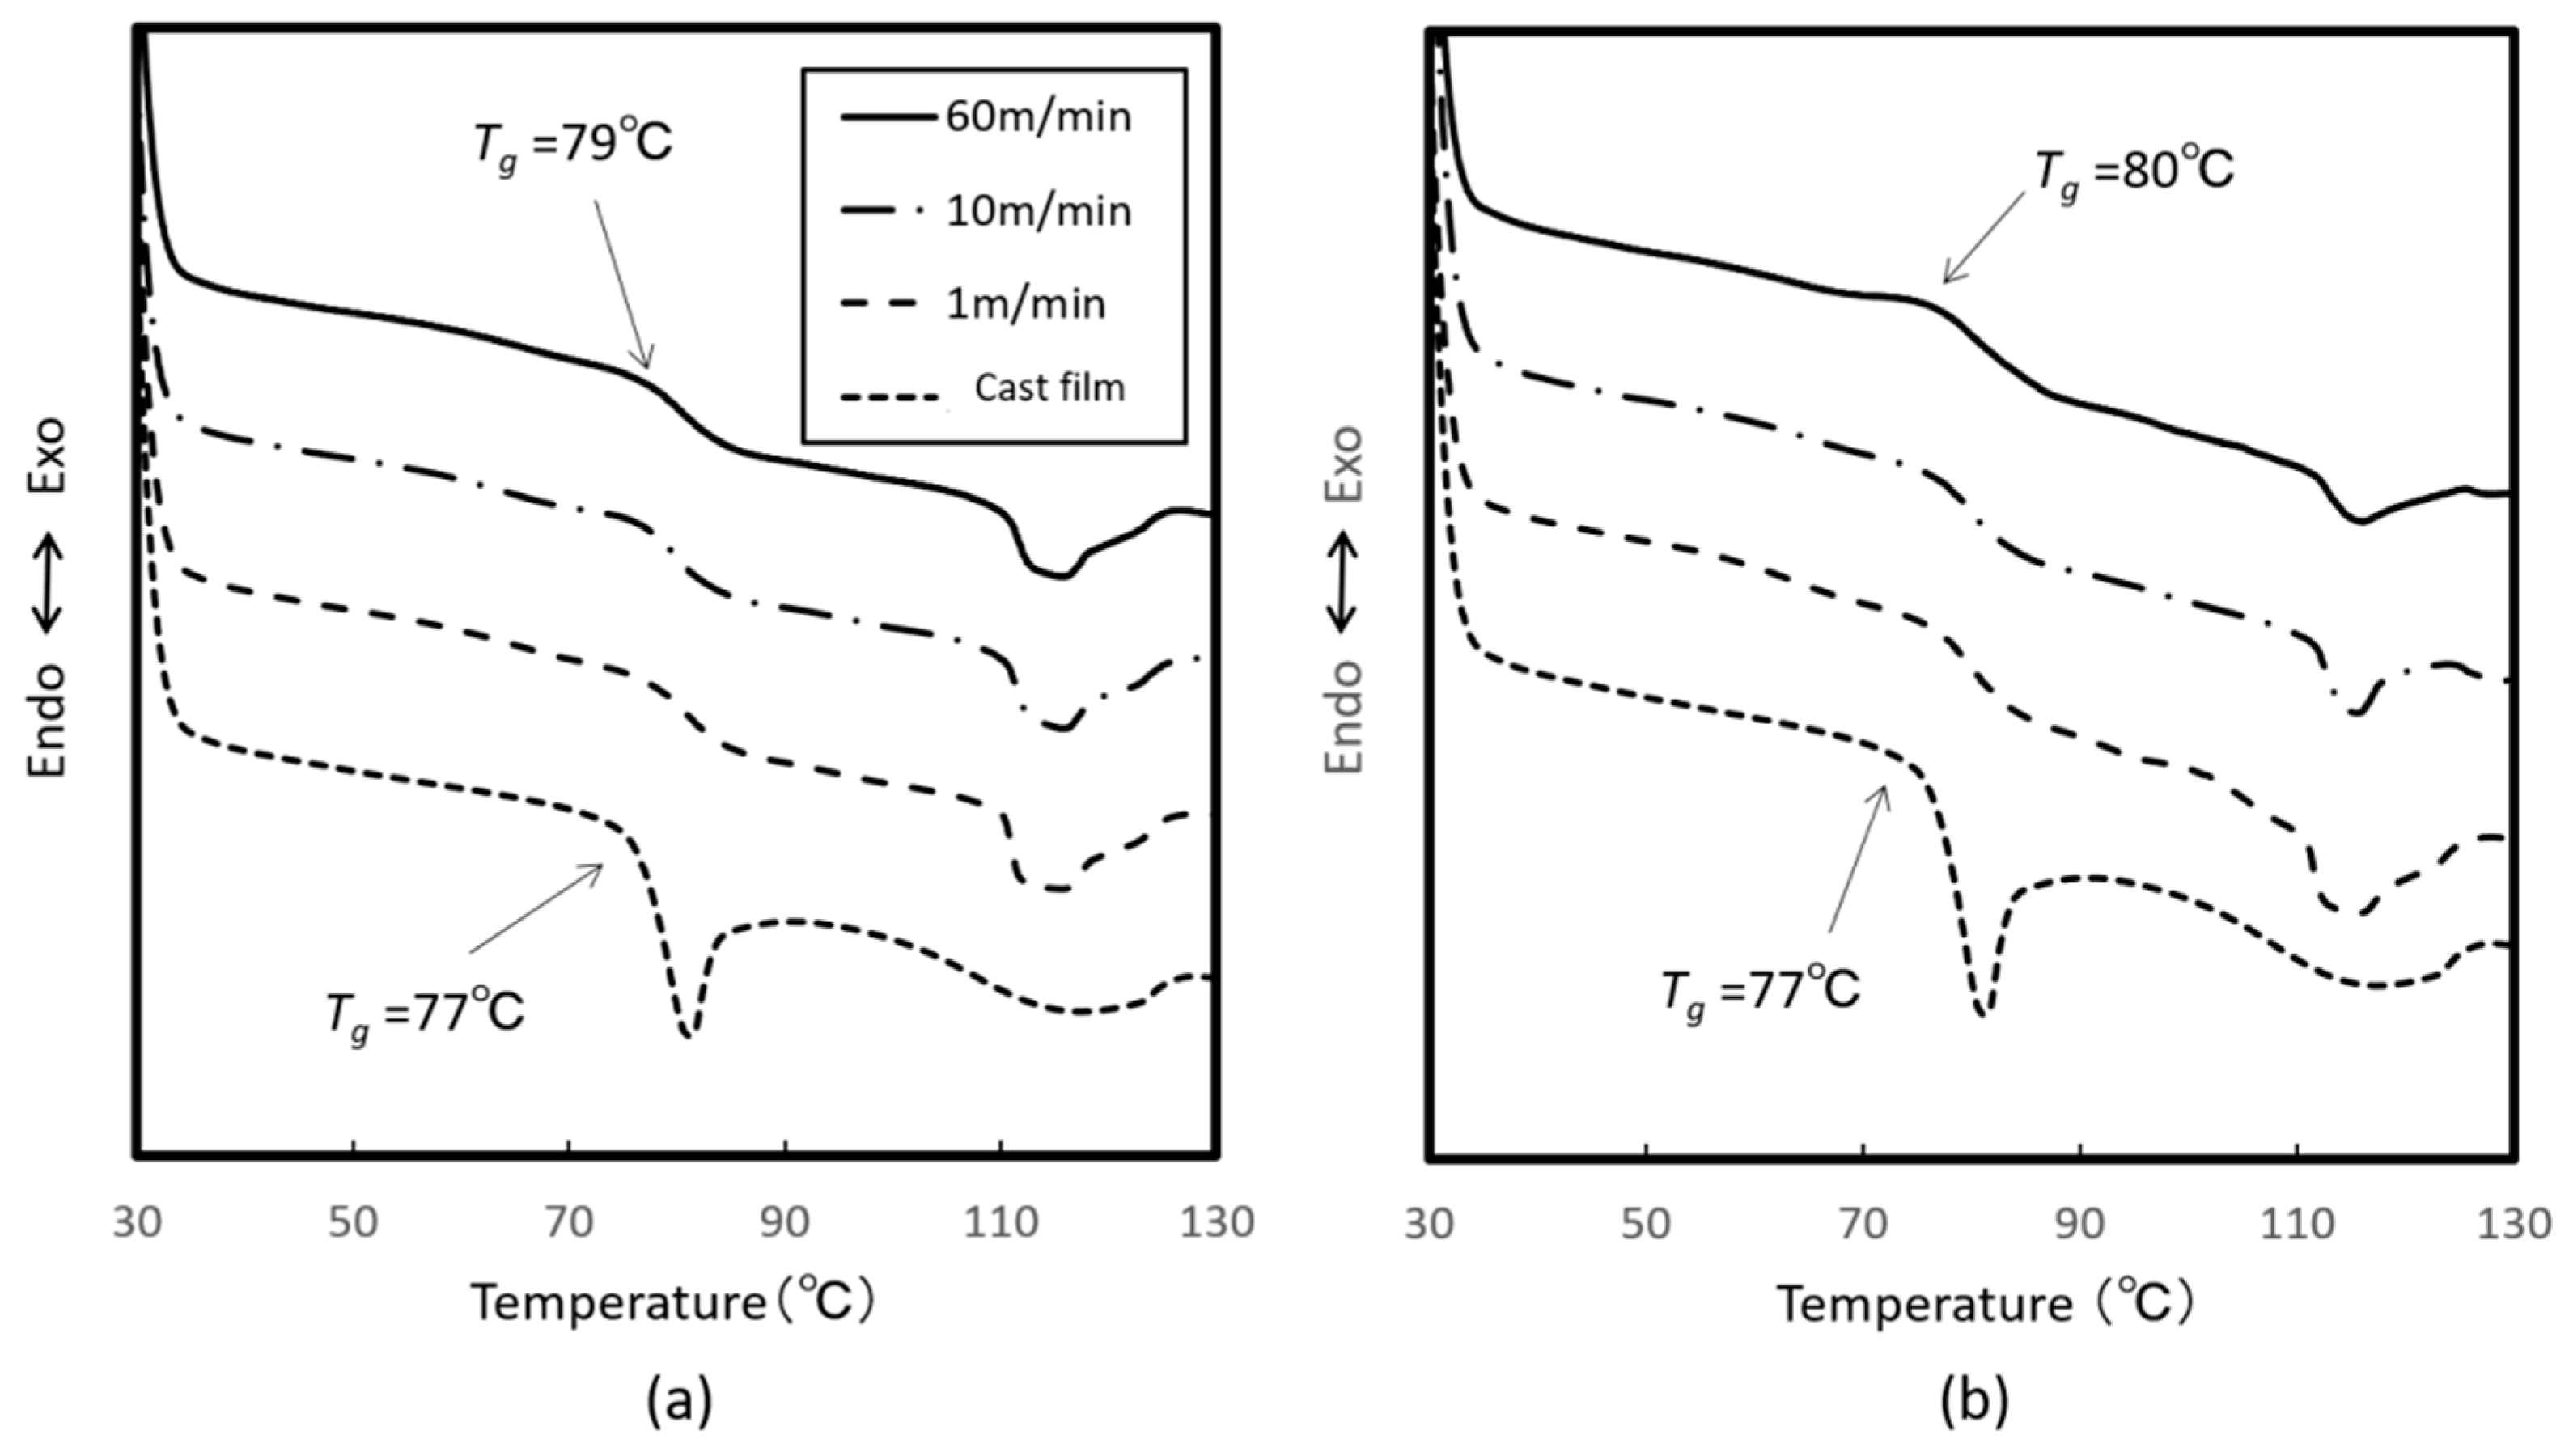
As a fundamental character of stretched films, Figure 2 shows DSC scans of the films stretched at each speed and different stretching mode at 105 °C. Stretching temperature of 105 °C was chosen as a practical choice made to allow the film to be stretched at fast speed of 60 mm/min in both stretching modes. Tg of the cast film was 77 °C. Results show a slight shift upward in Tg as stretching speeds increase in both uniaxial and biaxial stretching. Stretched film usually exhibits unstable state due to molecular orientation, allowing molecular chains to gain mobility at lower temperature, which tends to show lower Tg. However, the results contradict this nature of Tg shift, which we find unclear in this study. Further thermal analysis by different experiment will be discussed later in other thermal analysis.
3.2. Retardation Measurements
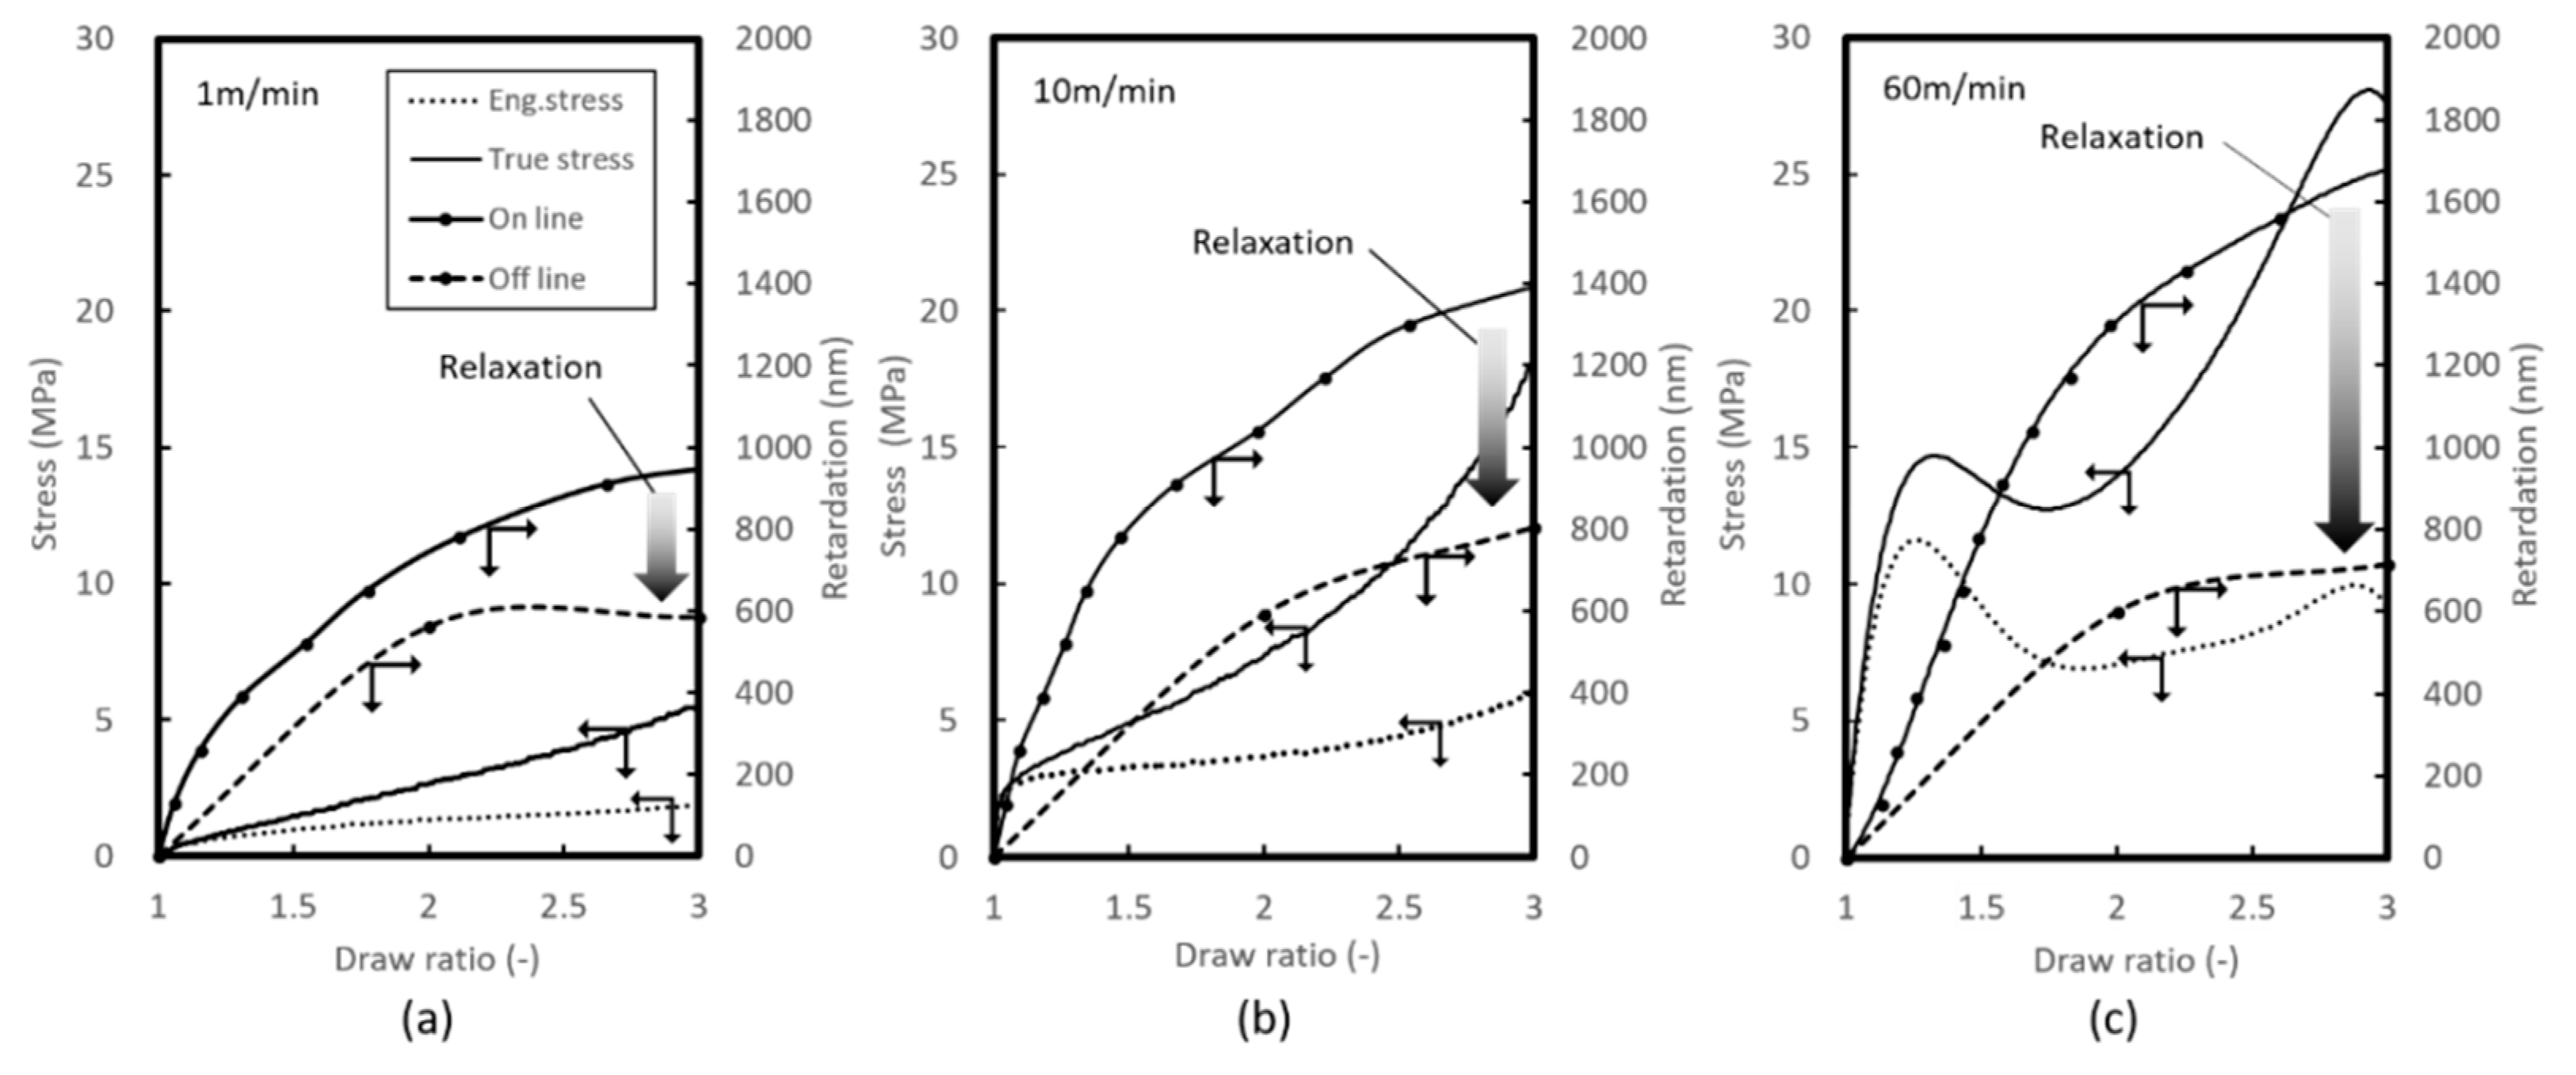
Figure 3 shows the stress-strain curves and retardation behavior of uniaxial free width stretching for each stretching speed at 90 °C. We calculated true stress by dividing engineering stress by instantaneous sectional area, based as in other studies on the assumption of incompressible volumes. As this result shows, faster stretching speeds were found to result in higher rates of change in retardation as well as higher retardation values at the end of stretching. However, comparing real-time measurements to off-line measurements appear to show that retardation relaxes after the stretching process, with ultimately no significant difference between slow and fast stretching speeds.
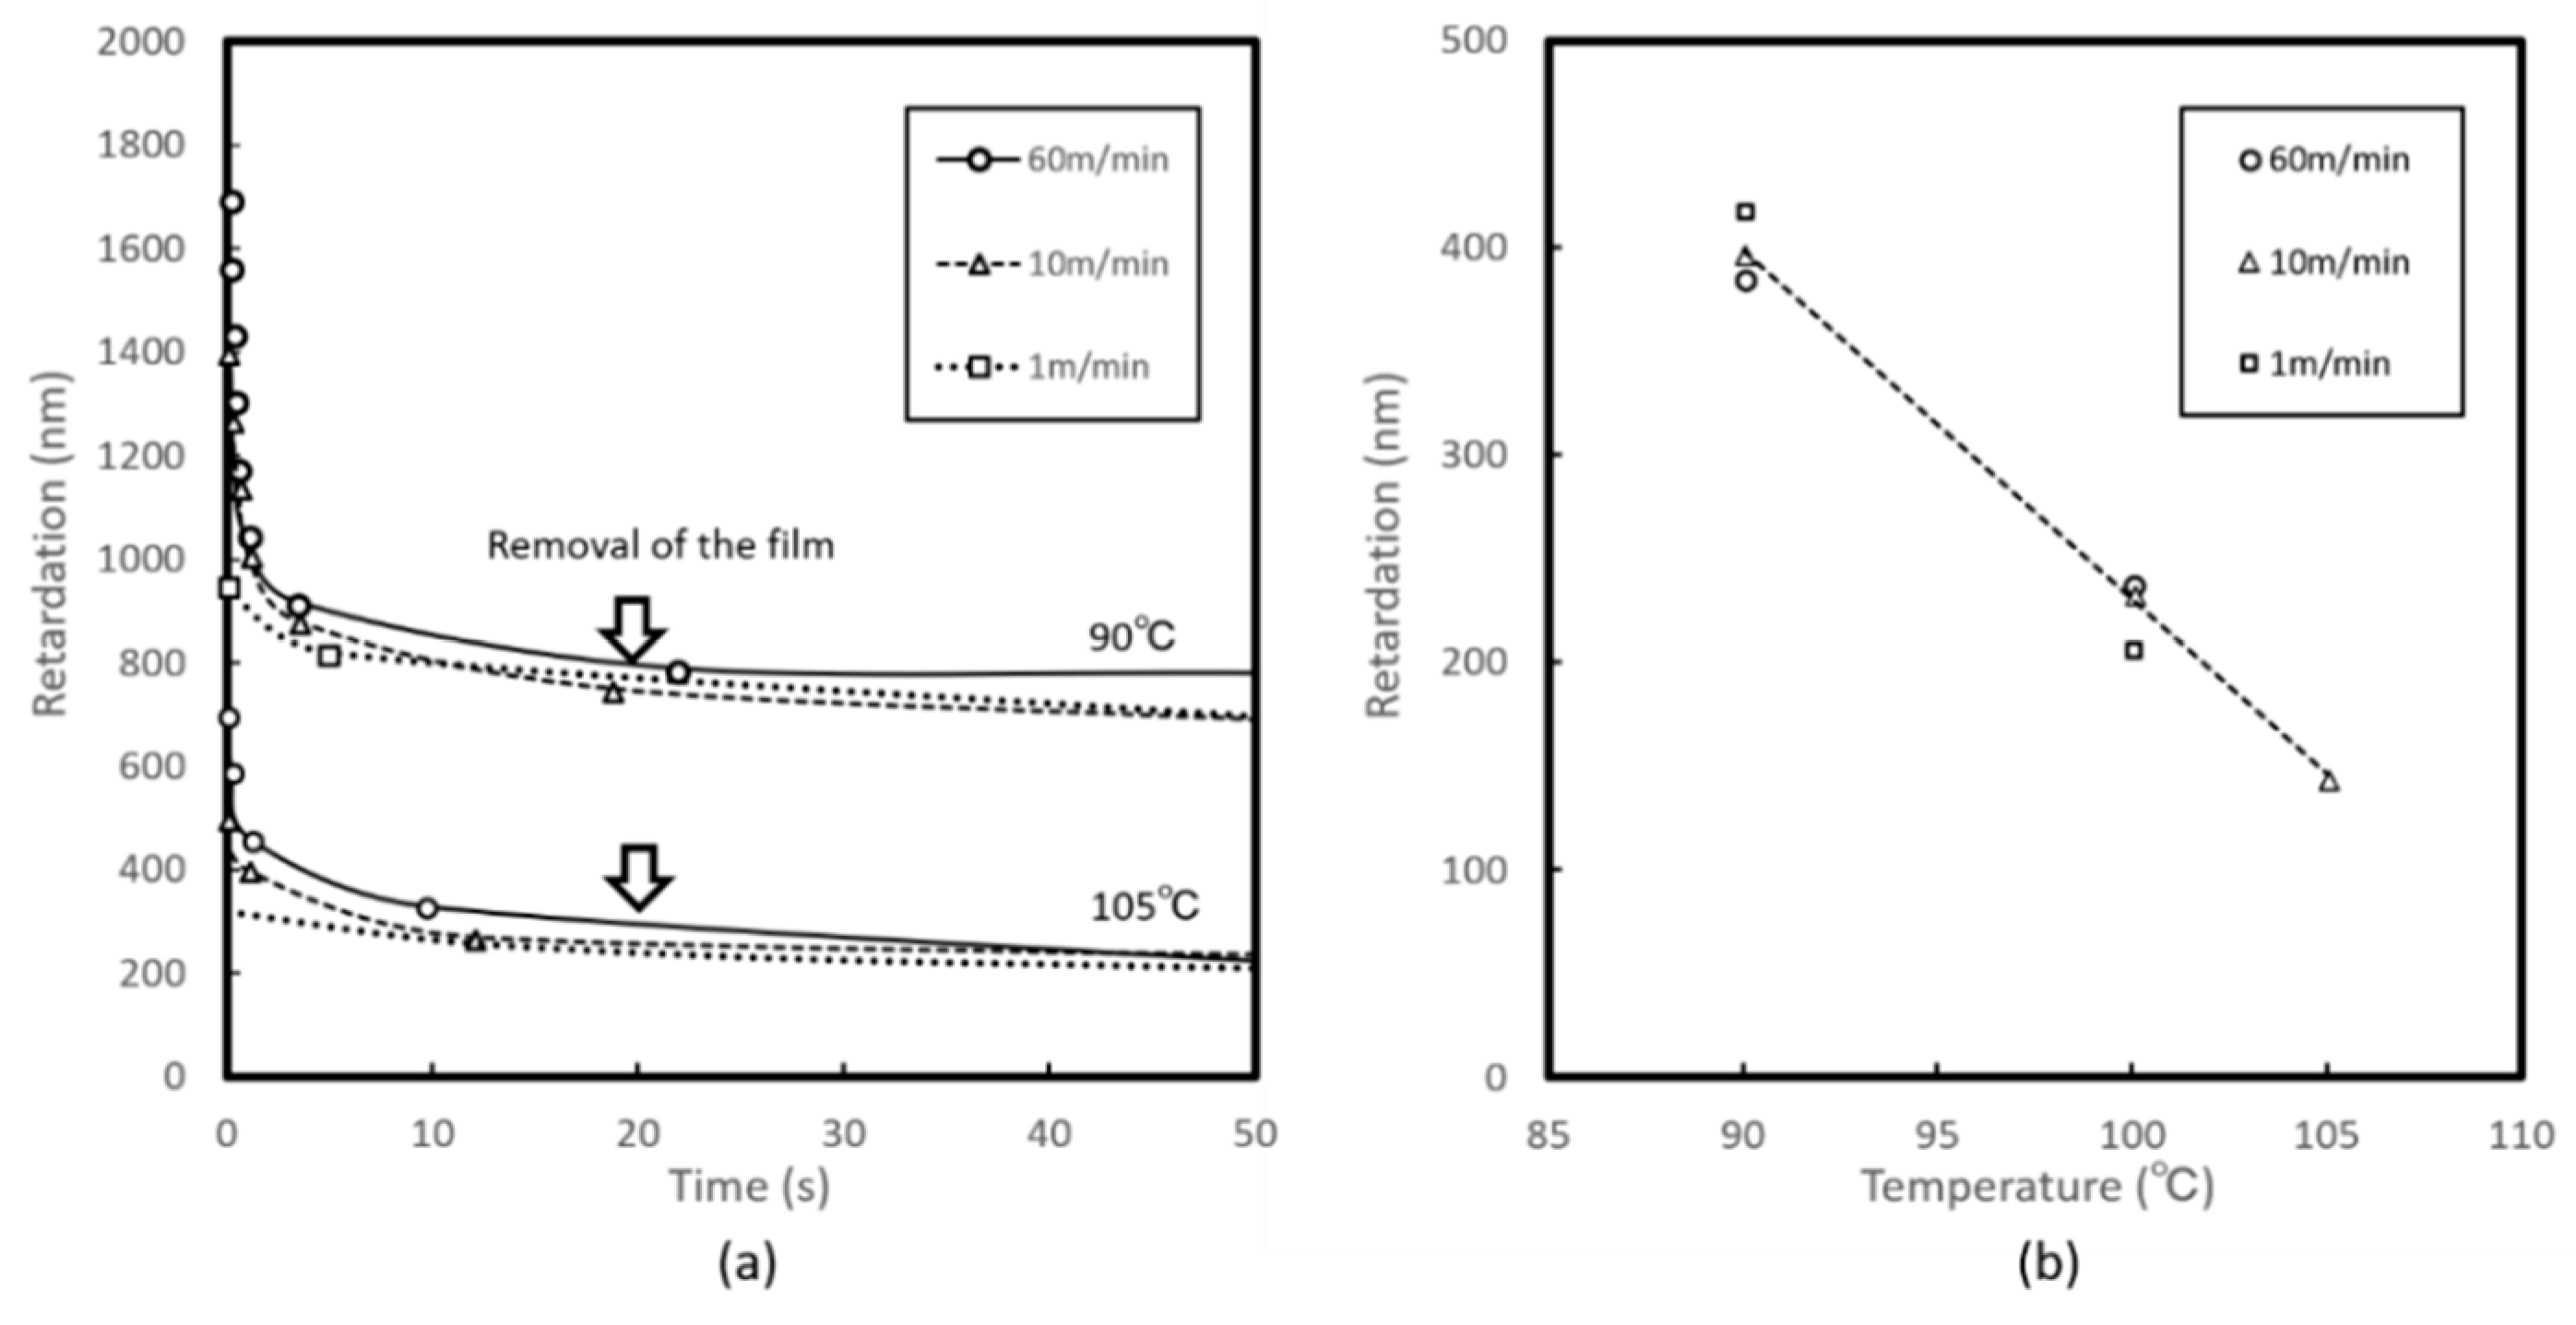
To verify this inconsistency in differences between real-time and off-line retardation measurements, we tracked the retardation of the films after the end of stretching, as shown in Figure 4a. Soon after stretching ends, we see that retardation decreases rapidly, despite stretching speed, and settles within seconds to a value close to the value obtained in the off-line measurement. With lower temperatures, the retardation value after relaxation remains higher, as shown by comparing values at 90 °C and 105 °C. In this experimental procedure, 20 s is elapsed before the film is removed from the chamber, and the result is in good agreement with off-line measurements. We should note that holding for an extended period after stretching allows further relaxation; while this study does not address this long-term relaxation behavior. We attempted stretching under the added condition of 100 °C and plotted off-line retardation measurement values, as shown in Figure 3b. This indicates that retardation after relaxation correlates with stretching temperature, but not explicitly with stretching speed.
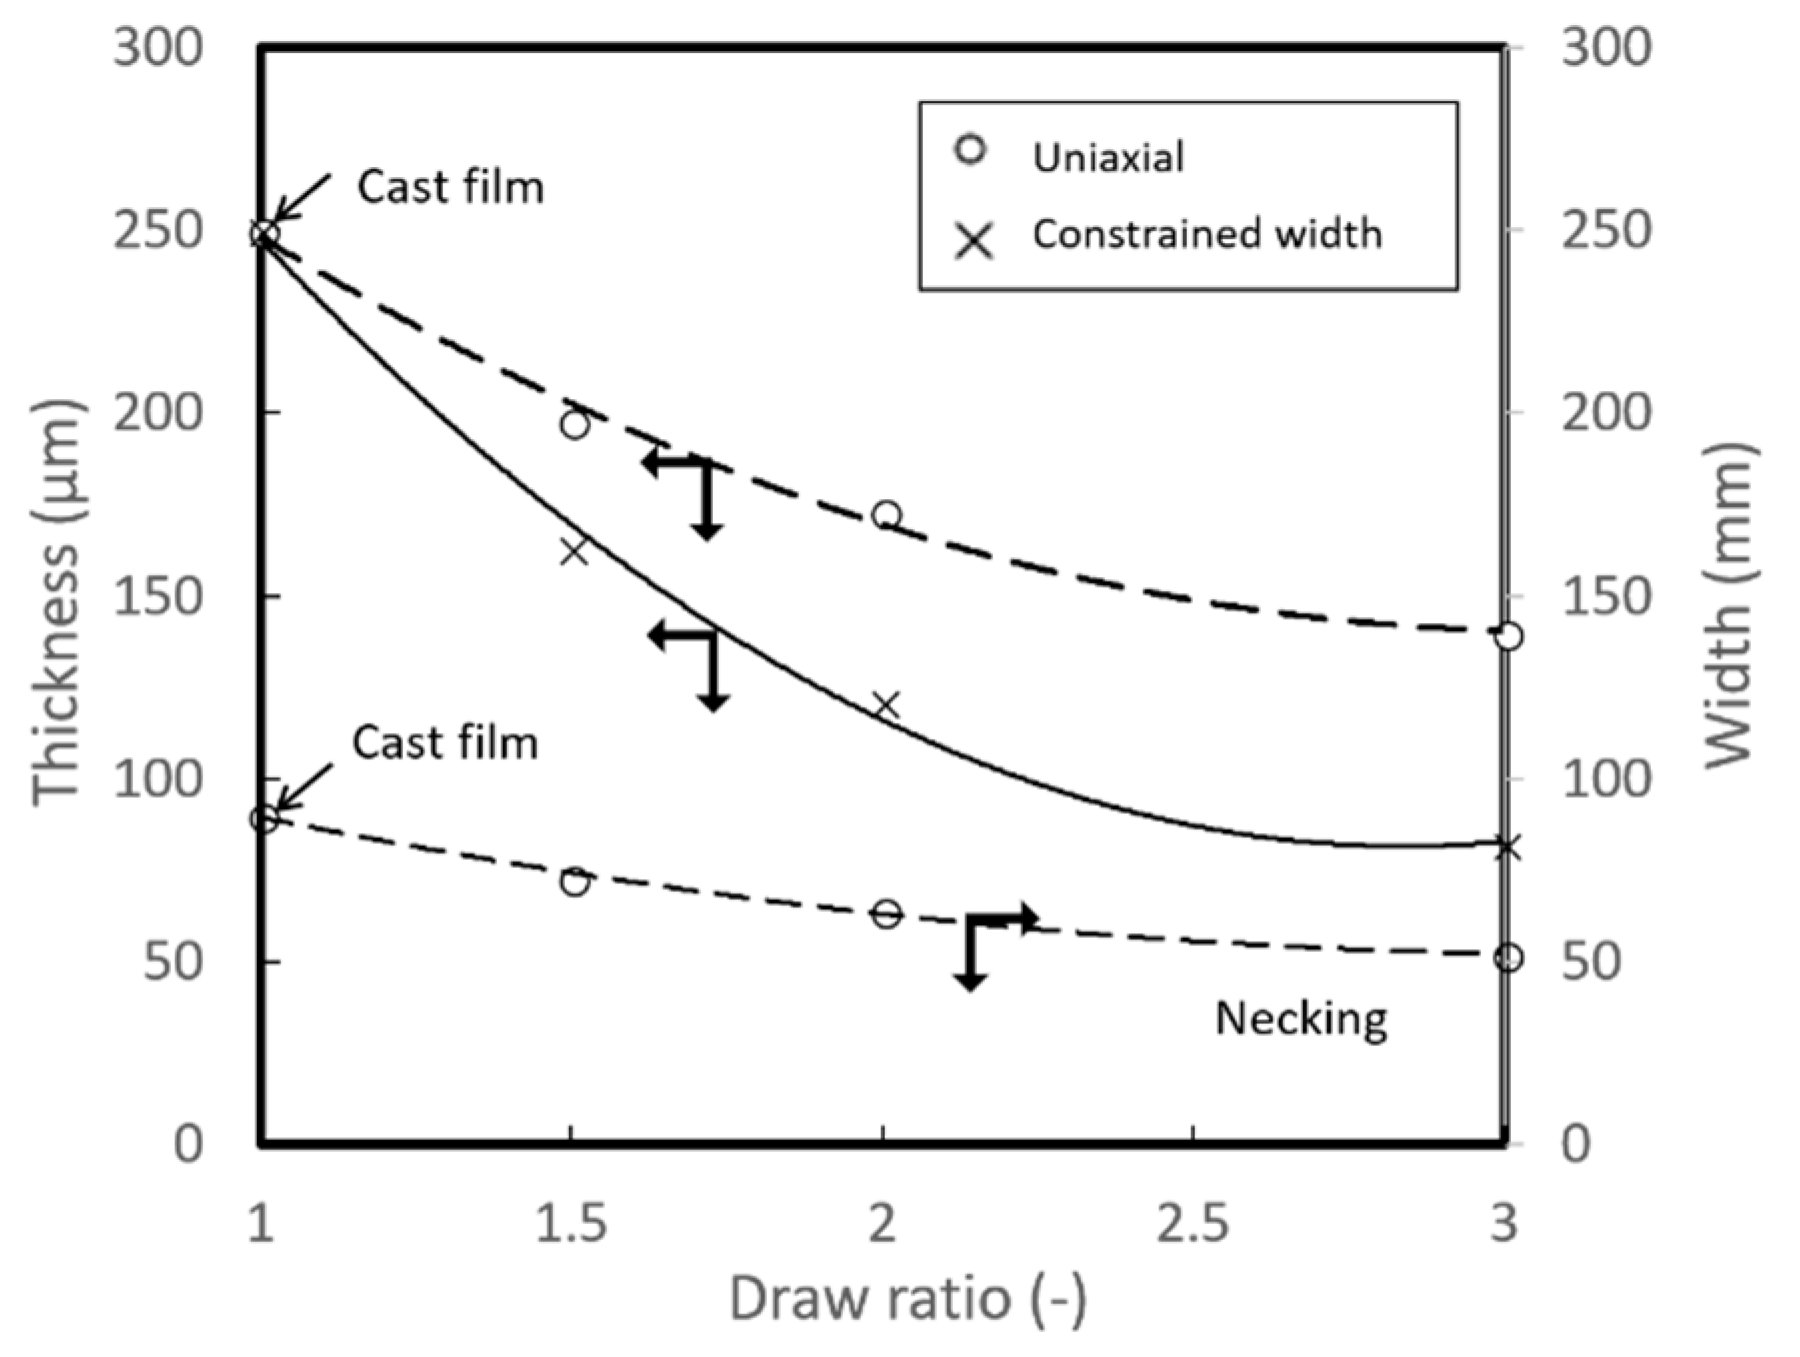
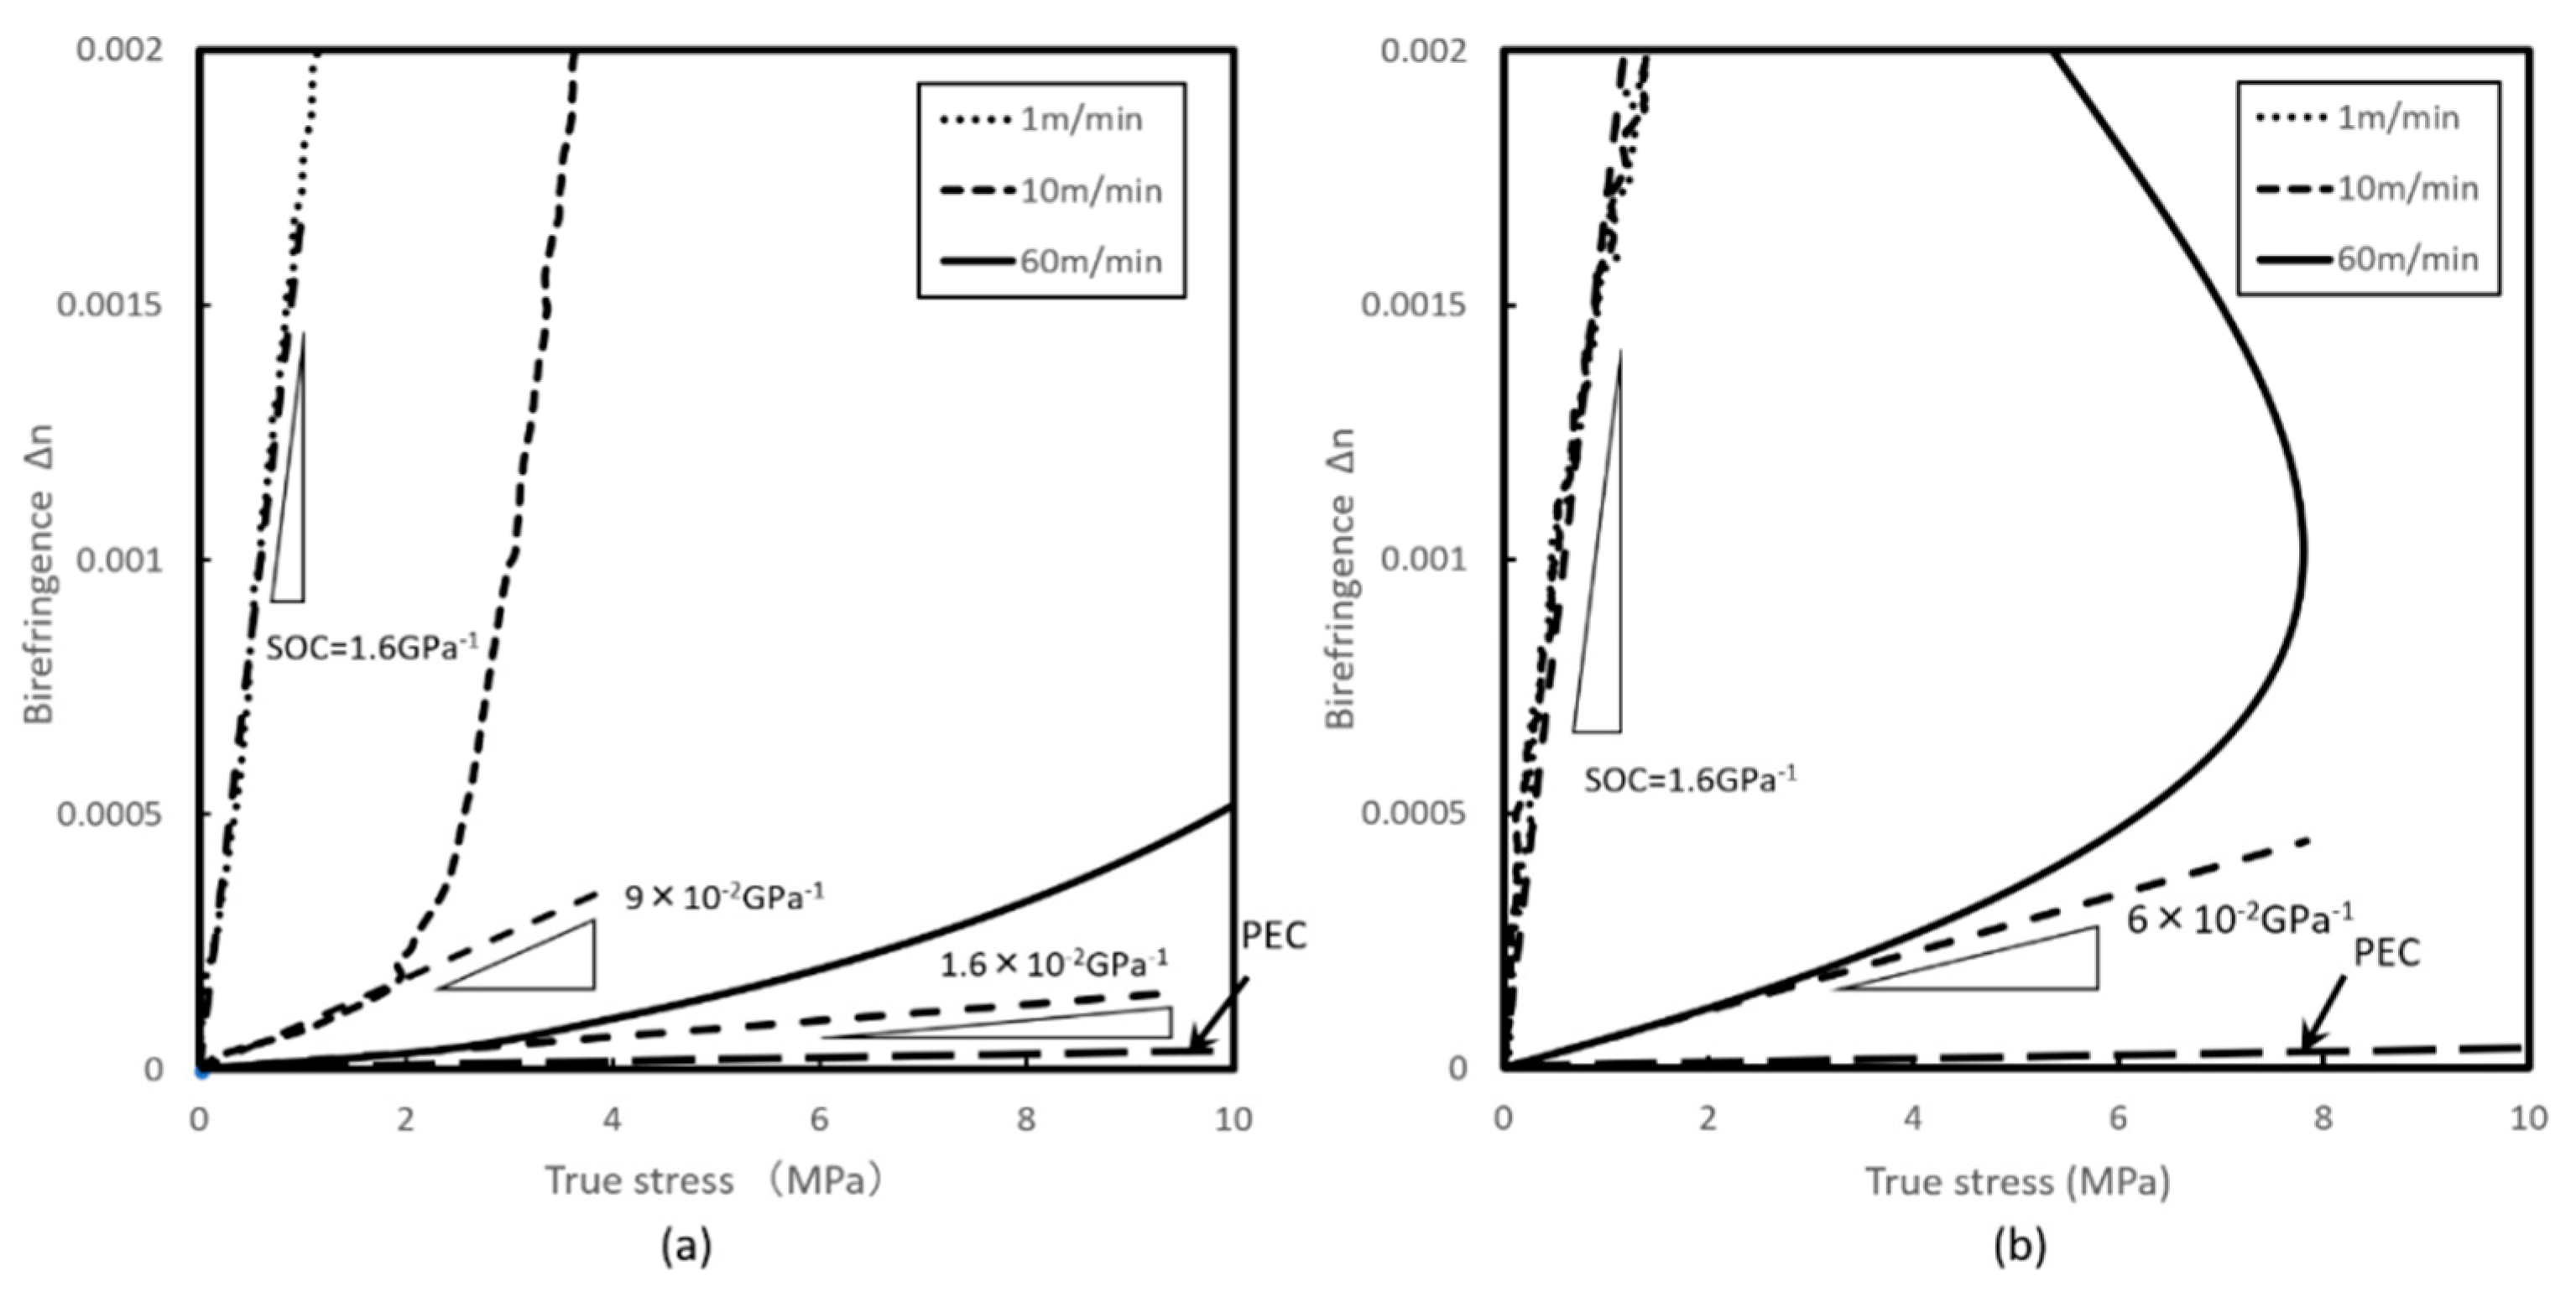
Figure 5 shows thickness and width of uniaxially stretched films measured at each draw ratio; lines are drawn to show approximate expression. This result agrees well with constant volume assumption, that the total volume of the film remains constant by stretching and is used to evaluate true stress and birefringence according to Equation (1). Figure 6 shows the relationship between birefringence and true stress with uniaxial free width stretching. At 90 °C and a stretching speed of 1 m/min, Equation (2) gives SOC = 1.6 GPa−1. This agrees well with the results of studies by Hong and White [10] (p. 58). As stretching speed increases, SOC decreases and approaches the PEC for solid state, which is of the order of 10−3 GPa−1 [11]. At 105 °C, SOC = 1.6 GPa−1 was obtained when stretching speed is extended to 10 m/min, suggesting that increasing the temperature is equivalent to slowing down the stretching speed controlling its stress-birefringence relationship. We can see that stress-birefringence relationship varies between SOC at solid and melt state, both of which corresponds to photo-elastic coefficient for strain-induced birefringence and stress-optical coefficient for flow birefringence. Coefficient changes whether material undergoes glassy or rubbery behavior. The result indicates that increasing temperature from 90 to 105 °C, threshold of stretching speed at which exhibits deviation from rubbery behavior has become higher, that only 60 m/min showed different stress-birefringence relationship.
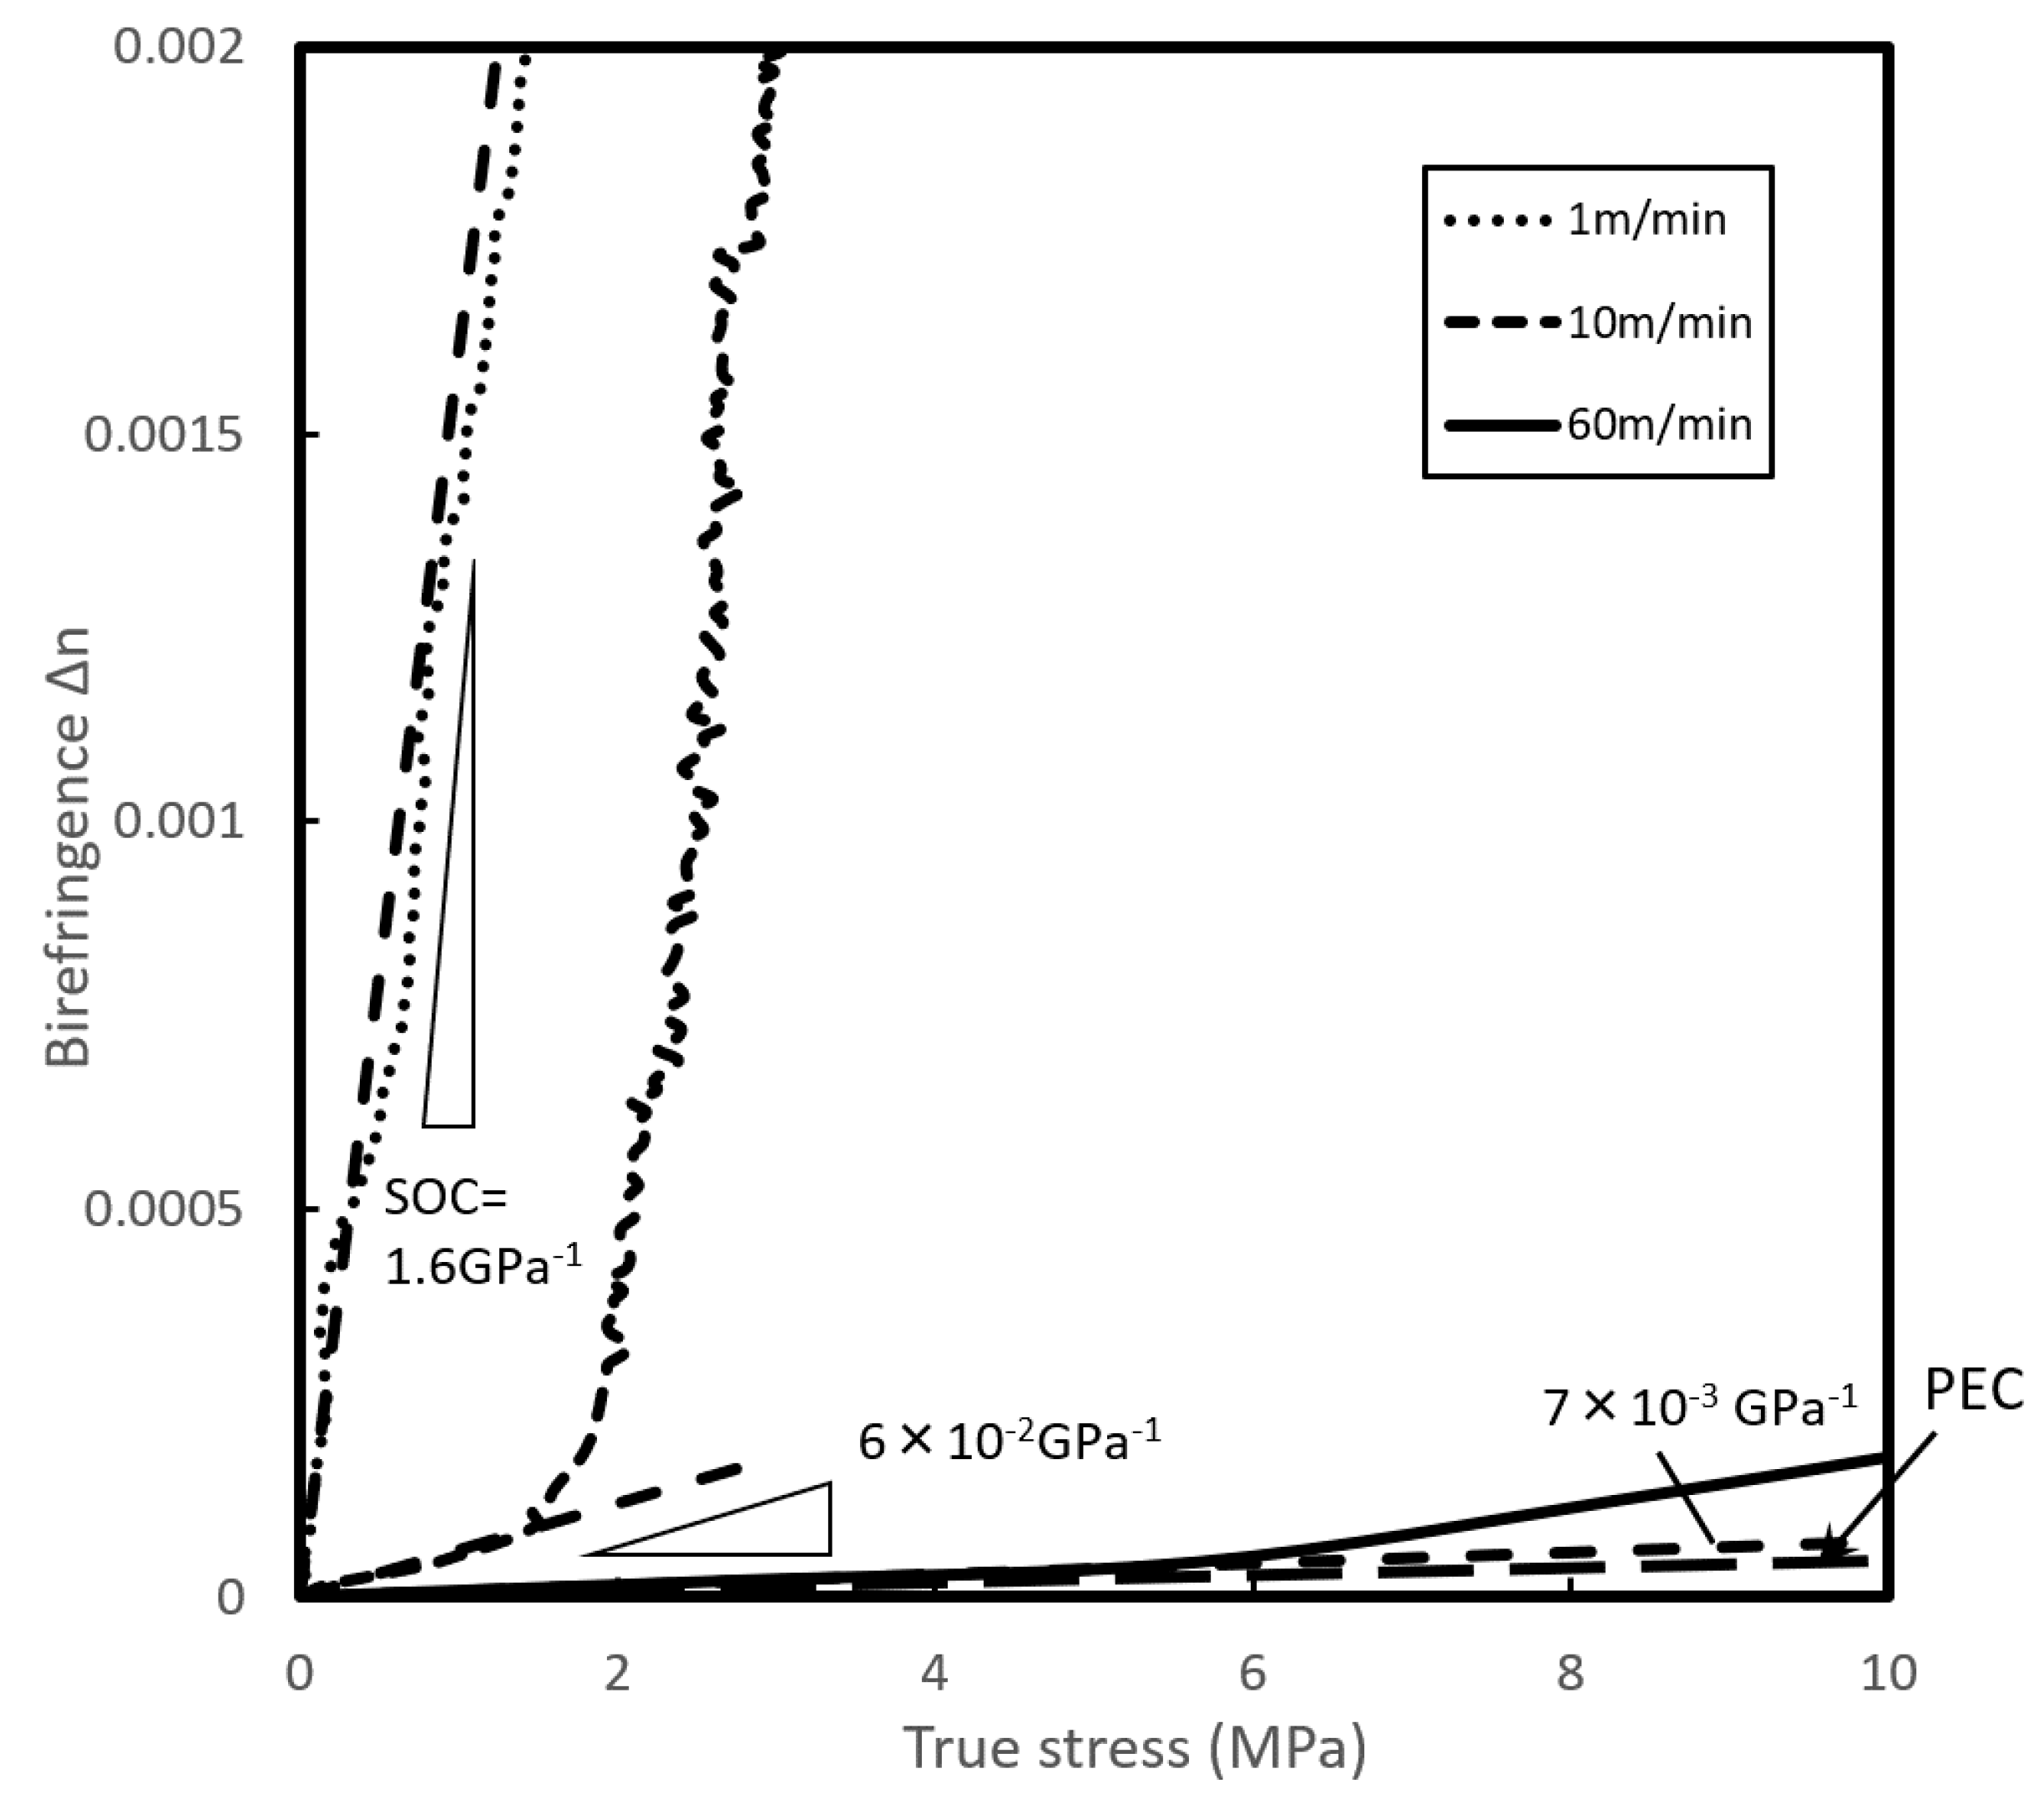
Figure 7 and Figure 8 show the results for uniaxial constrained width stretching at 90 °C. Since the film is constrained in TD, the molecular orientation in MD can be observed to be smaller, as retardation values are smaller as compared to free width stretching. SOC was evaluated to be the same result; SOC = 1.6 GPa−1 at 1 m/min as in the case of free width stretching. At higher stretching speeds, SOC decreases rapidly toward the PEC.
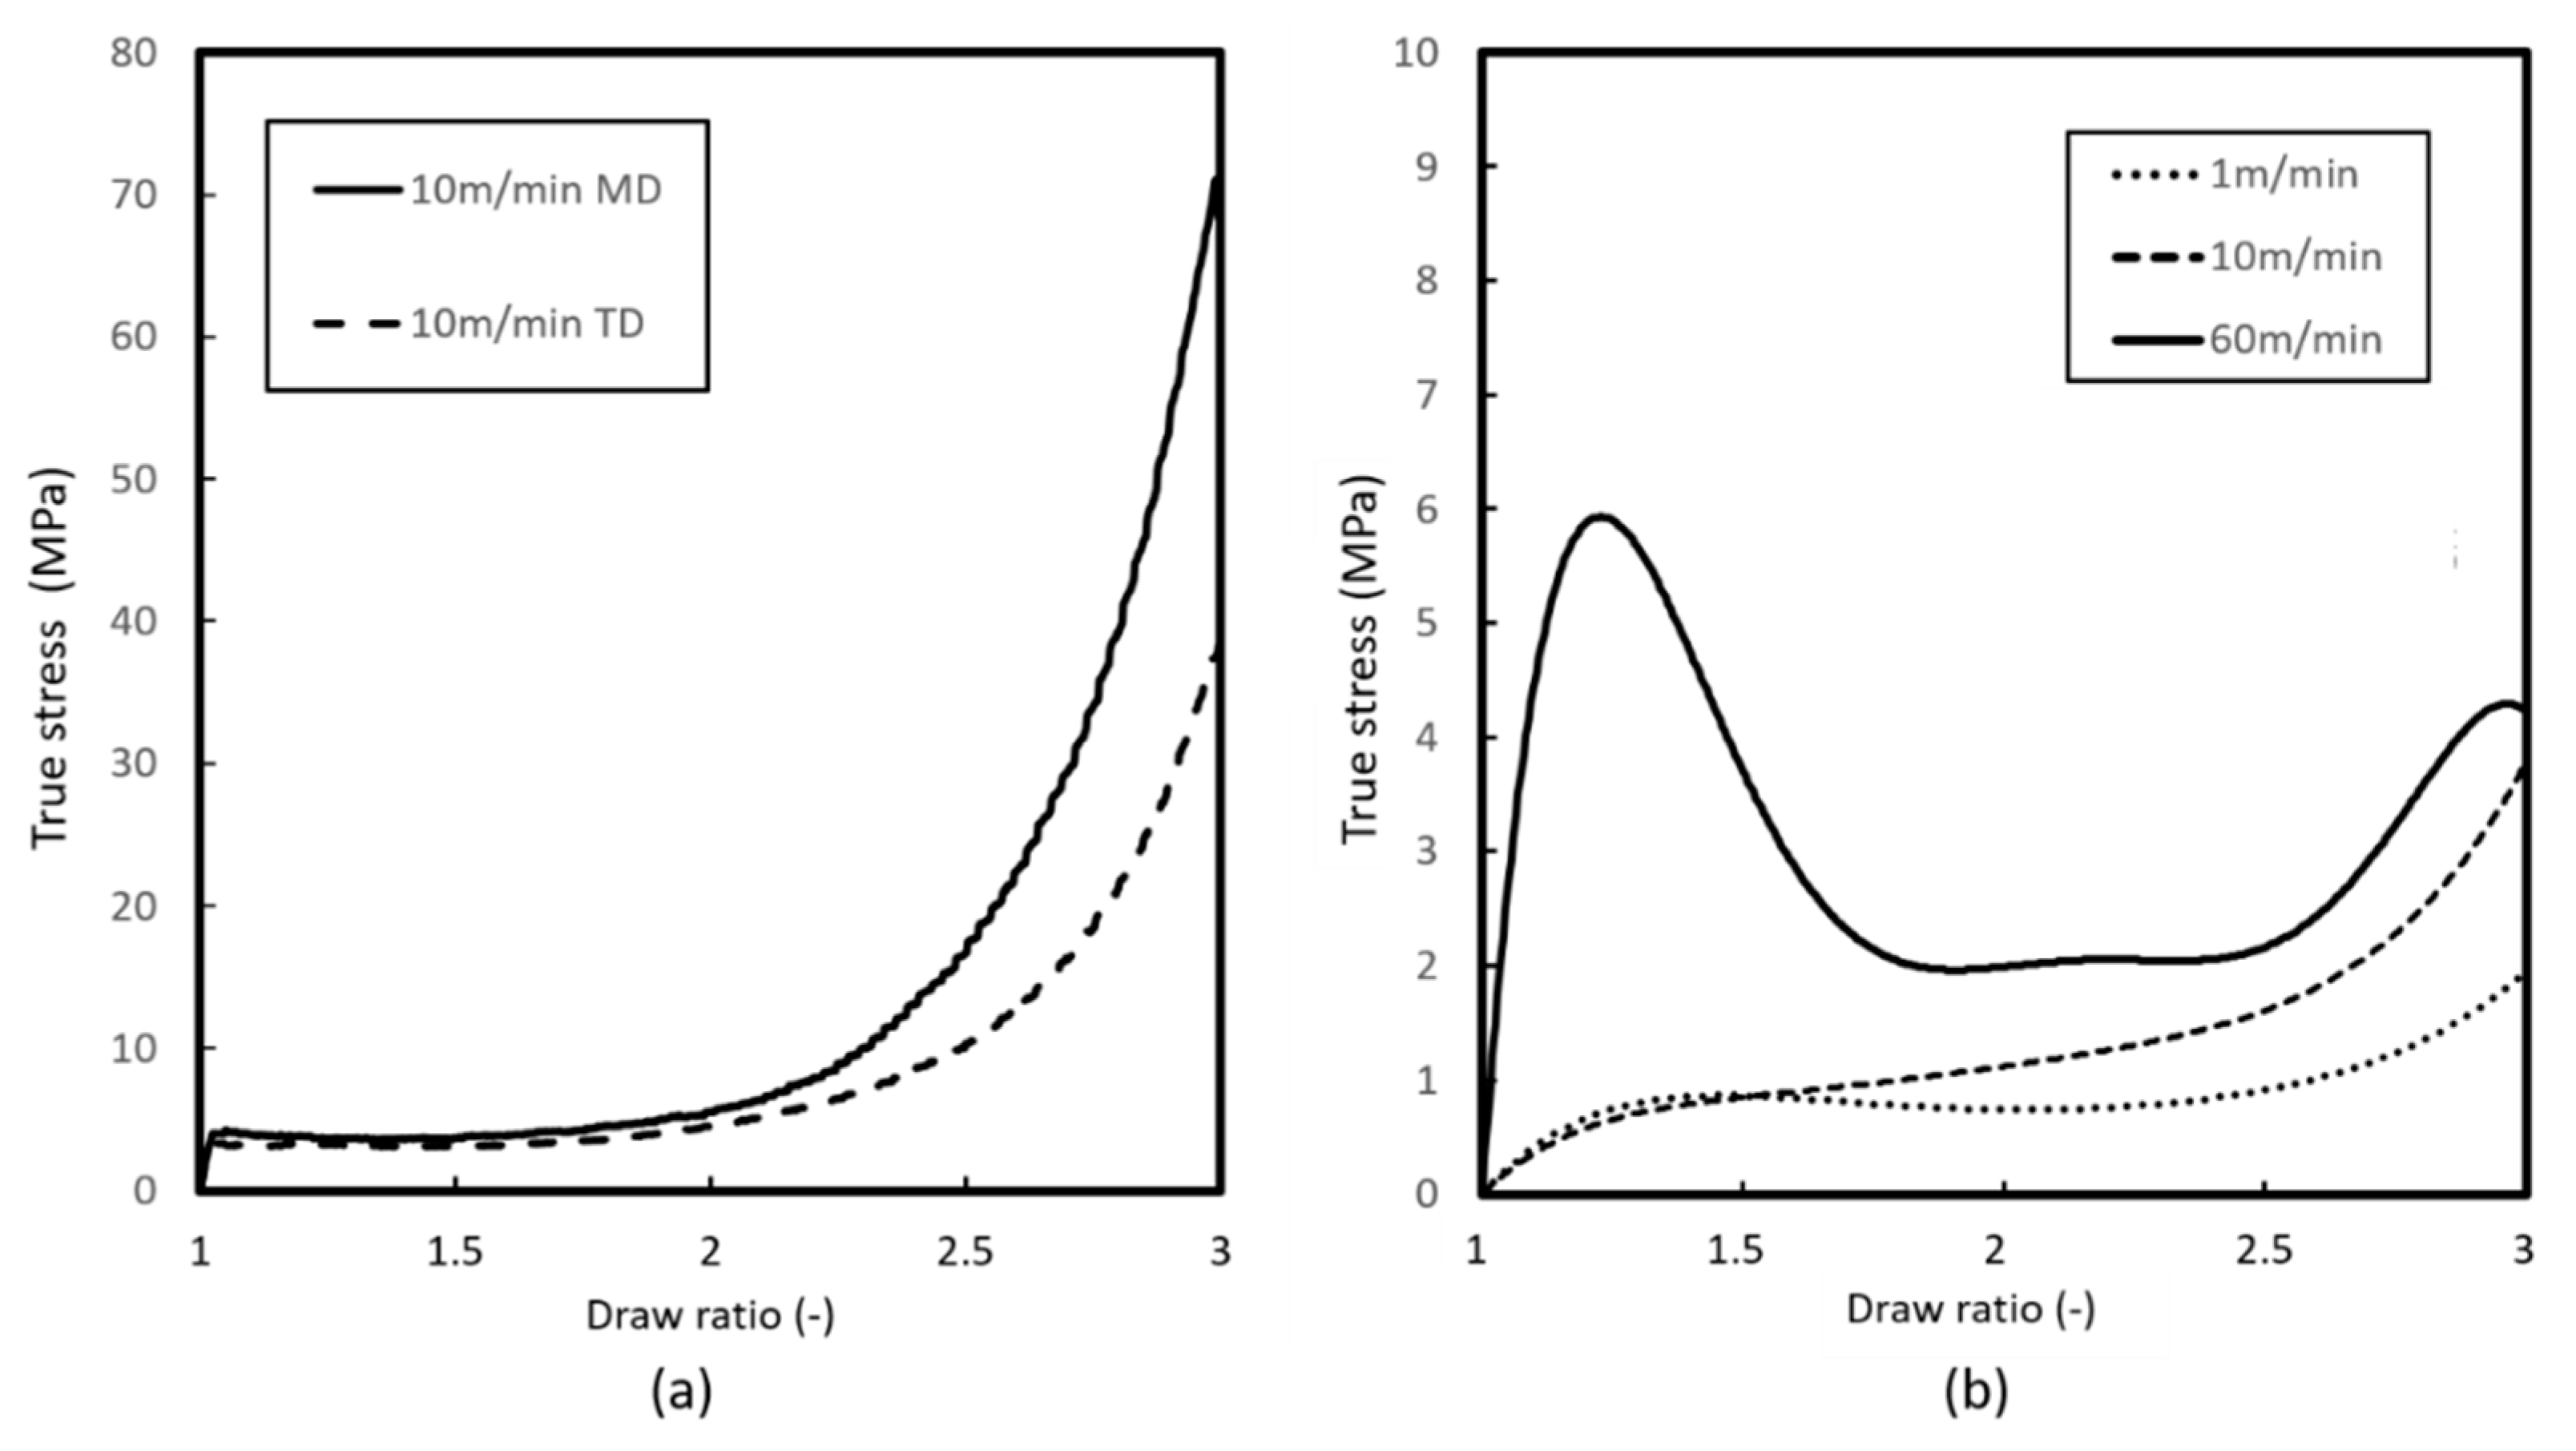
Figure 9 shows stress-strain curves of simultaneous biaxial stretching. Since the film is stretched in MD and TD simultaneously, retardation remains almost zero, showing no optical anisotropy; thus, the graph omits retardation values. Stretching at 90 °C shows isotropic stress in MD and TD at 1 m/min. At 10 m/min, we observed void generation as the stretched film being opaque, also showing anisotropy in stress beyond draw ratio of 2.0, as shown in Figure 7a. Stretching at 90 °C, 10 m/min was the maximum stretching speed at which stretching was successful without film breakage. For stretching at 105 °C, the stress-strain curve indicated strain hardening at 60 mm/min.
3.3. Thermal Analysis
3.3.1. Dynamic Mechanical Analysis (DMA)
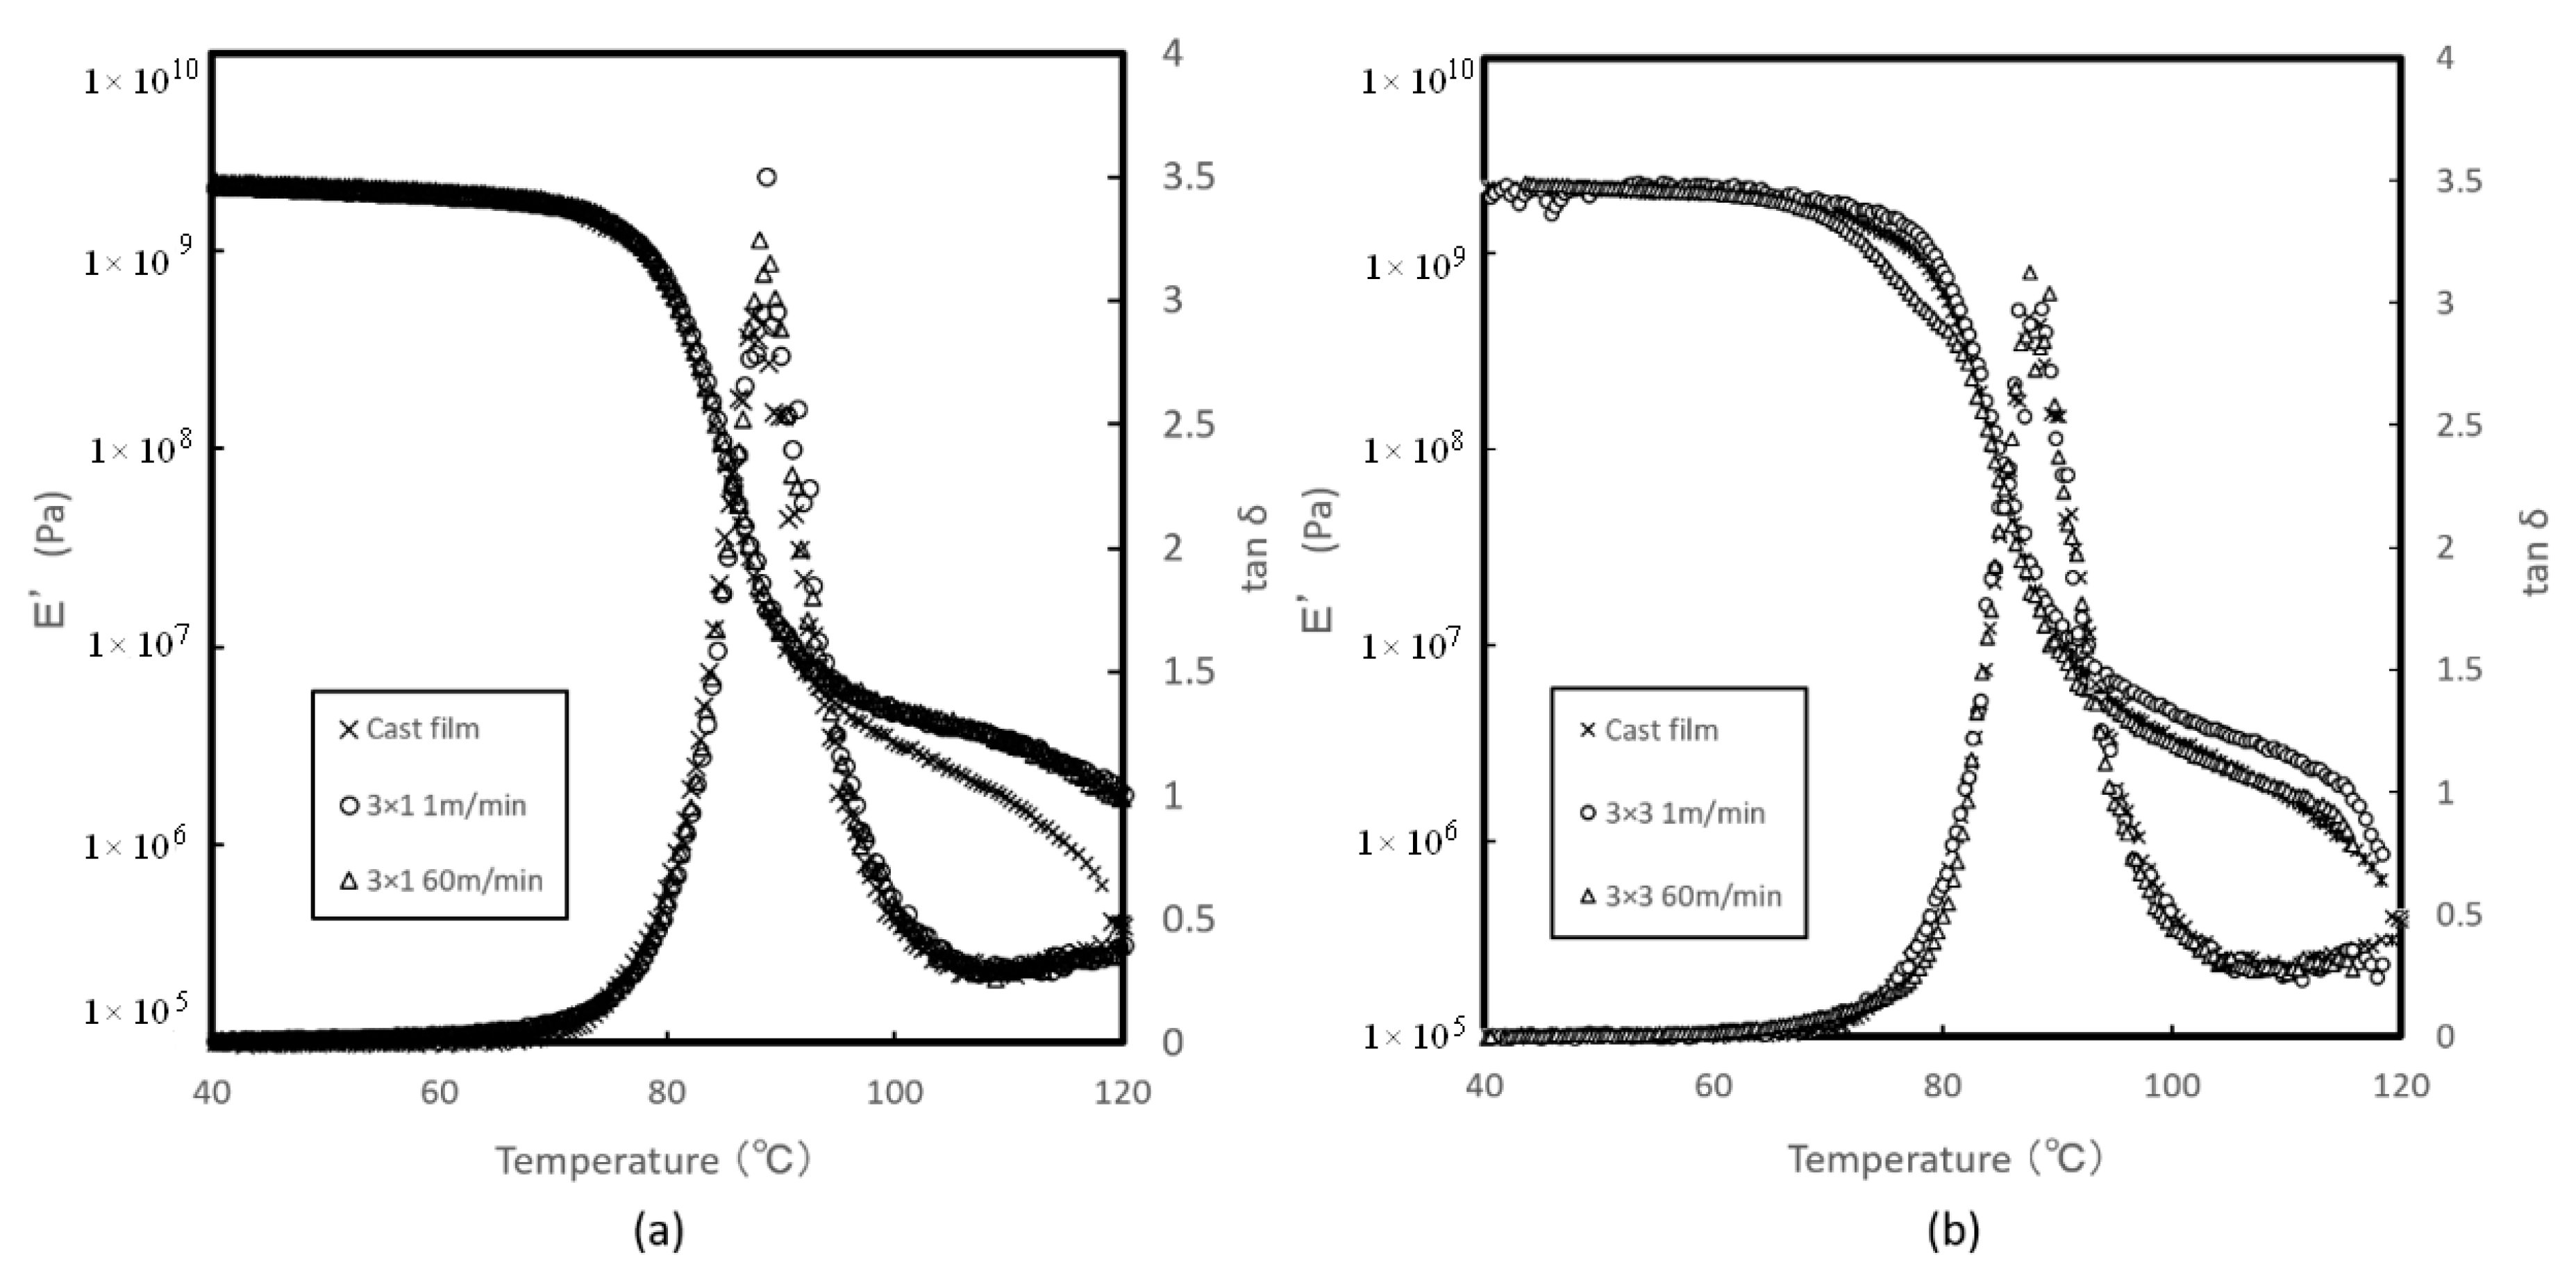
Figure 10 shows the results of damping factor tan δ and storage modulus E’. tan δ appears to have the same peak point, with no significant differences. However, E’ for fast stretching at 60 m/min showed temperature at which E’ starts to decline shifts toward lower temperature. This result can be attributed to the nature of higher degree of molecular orientation. However, value of Tg, obtained by peak point of tan δ curve showed no significant differences, as in the results of DSC scans. We can see that stretching temperature close to Tg, is more sensitive to E’ which can affect the variability on the quality of stretched films.
3.3.2. Thermal Mechanical Analysis (TMA)
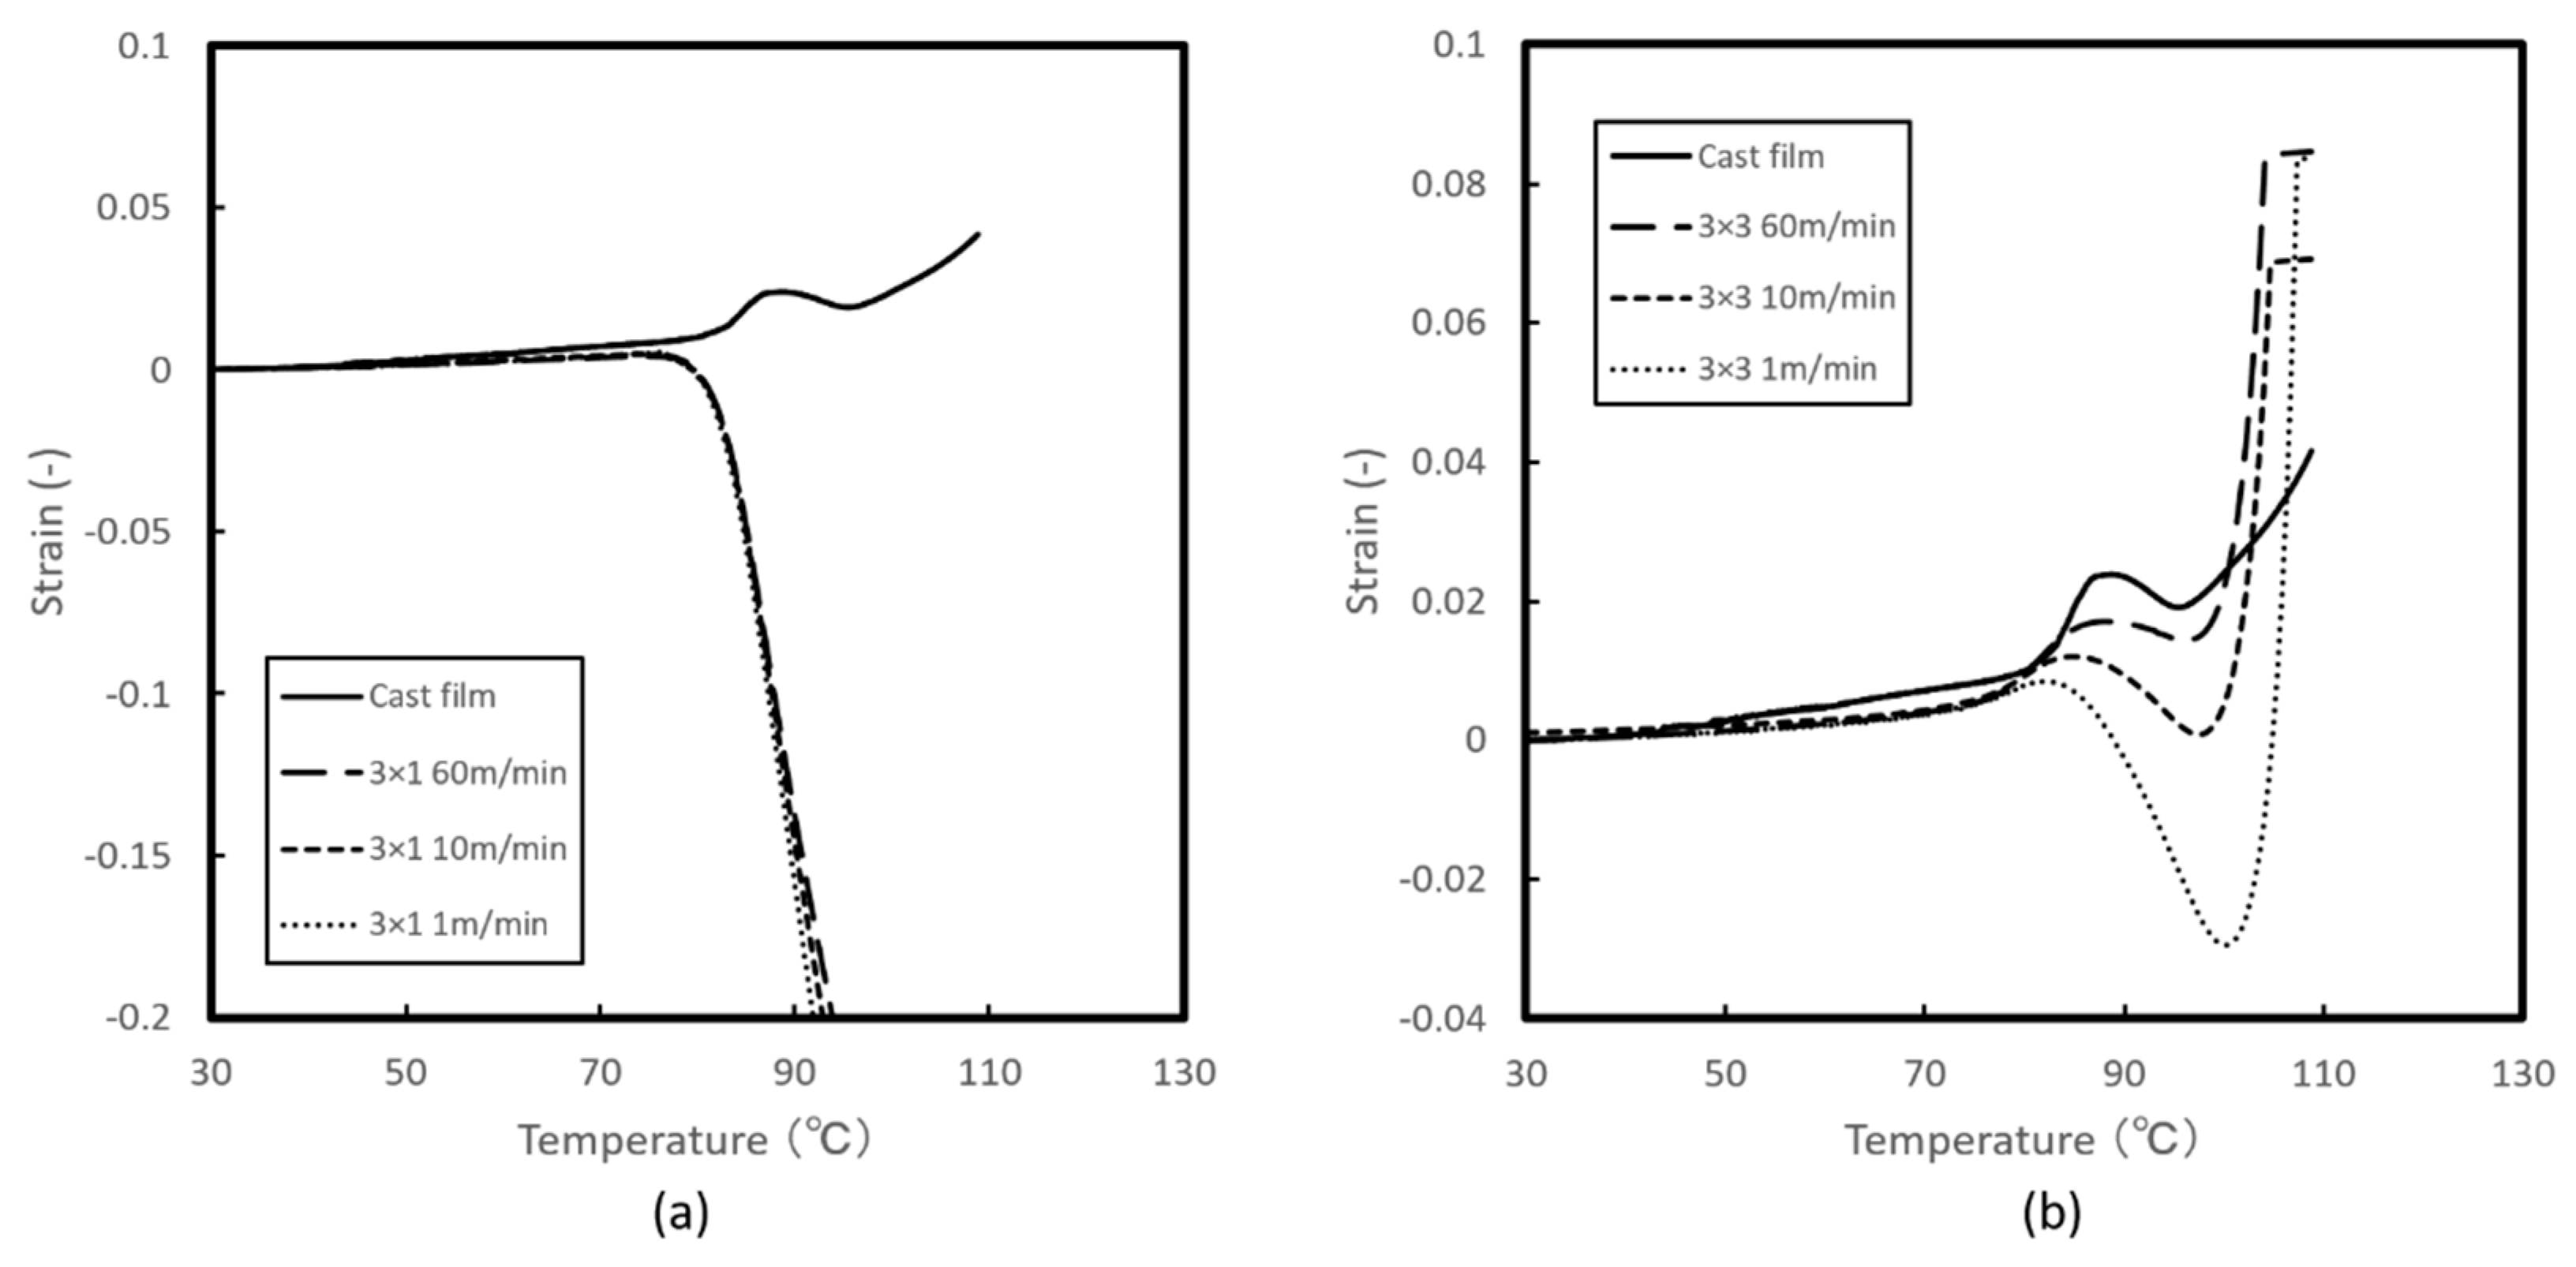
Figure 11 shows the dimensional changes for uniaxially and biaxially stretched films. For uniaxial stretching, the film begins to shrink rapidly at Tg due to the molecular orientation of uniaxially stretched polymer films. However, biaxially stretched films exhibited clearly different behavior. Above Tg, the observed shrinkage is less at higher stretching speeds. We can posit that fast stretching powerfully constrains molecular chains to a planar orientation and a resulting loss of elasticity, as shown by DMA analysis.
3.4. Tensile Tests
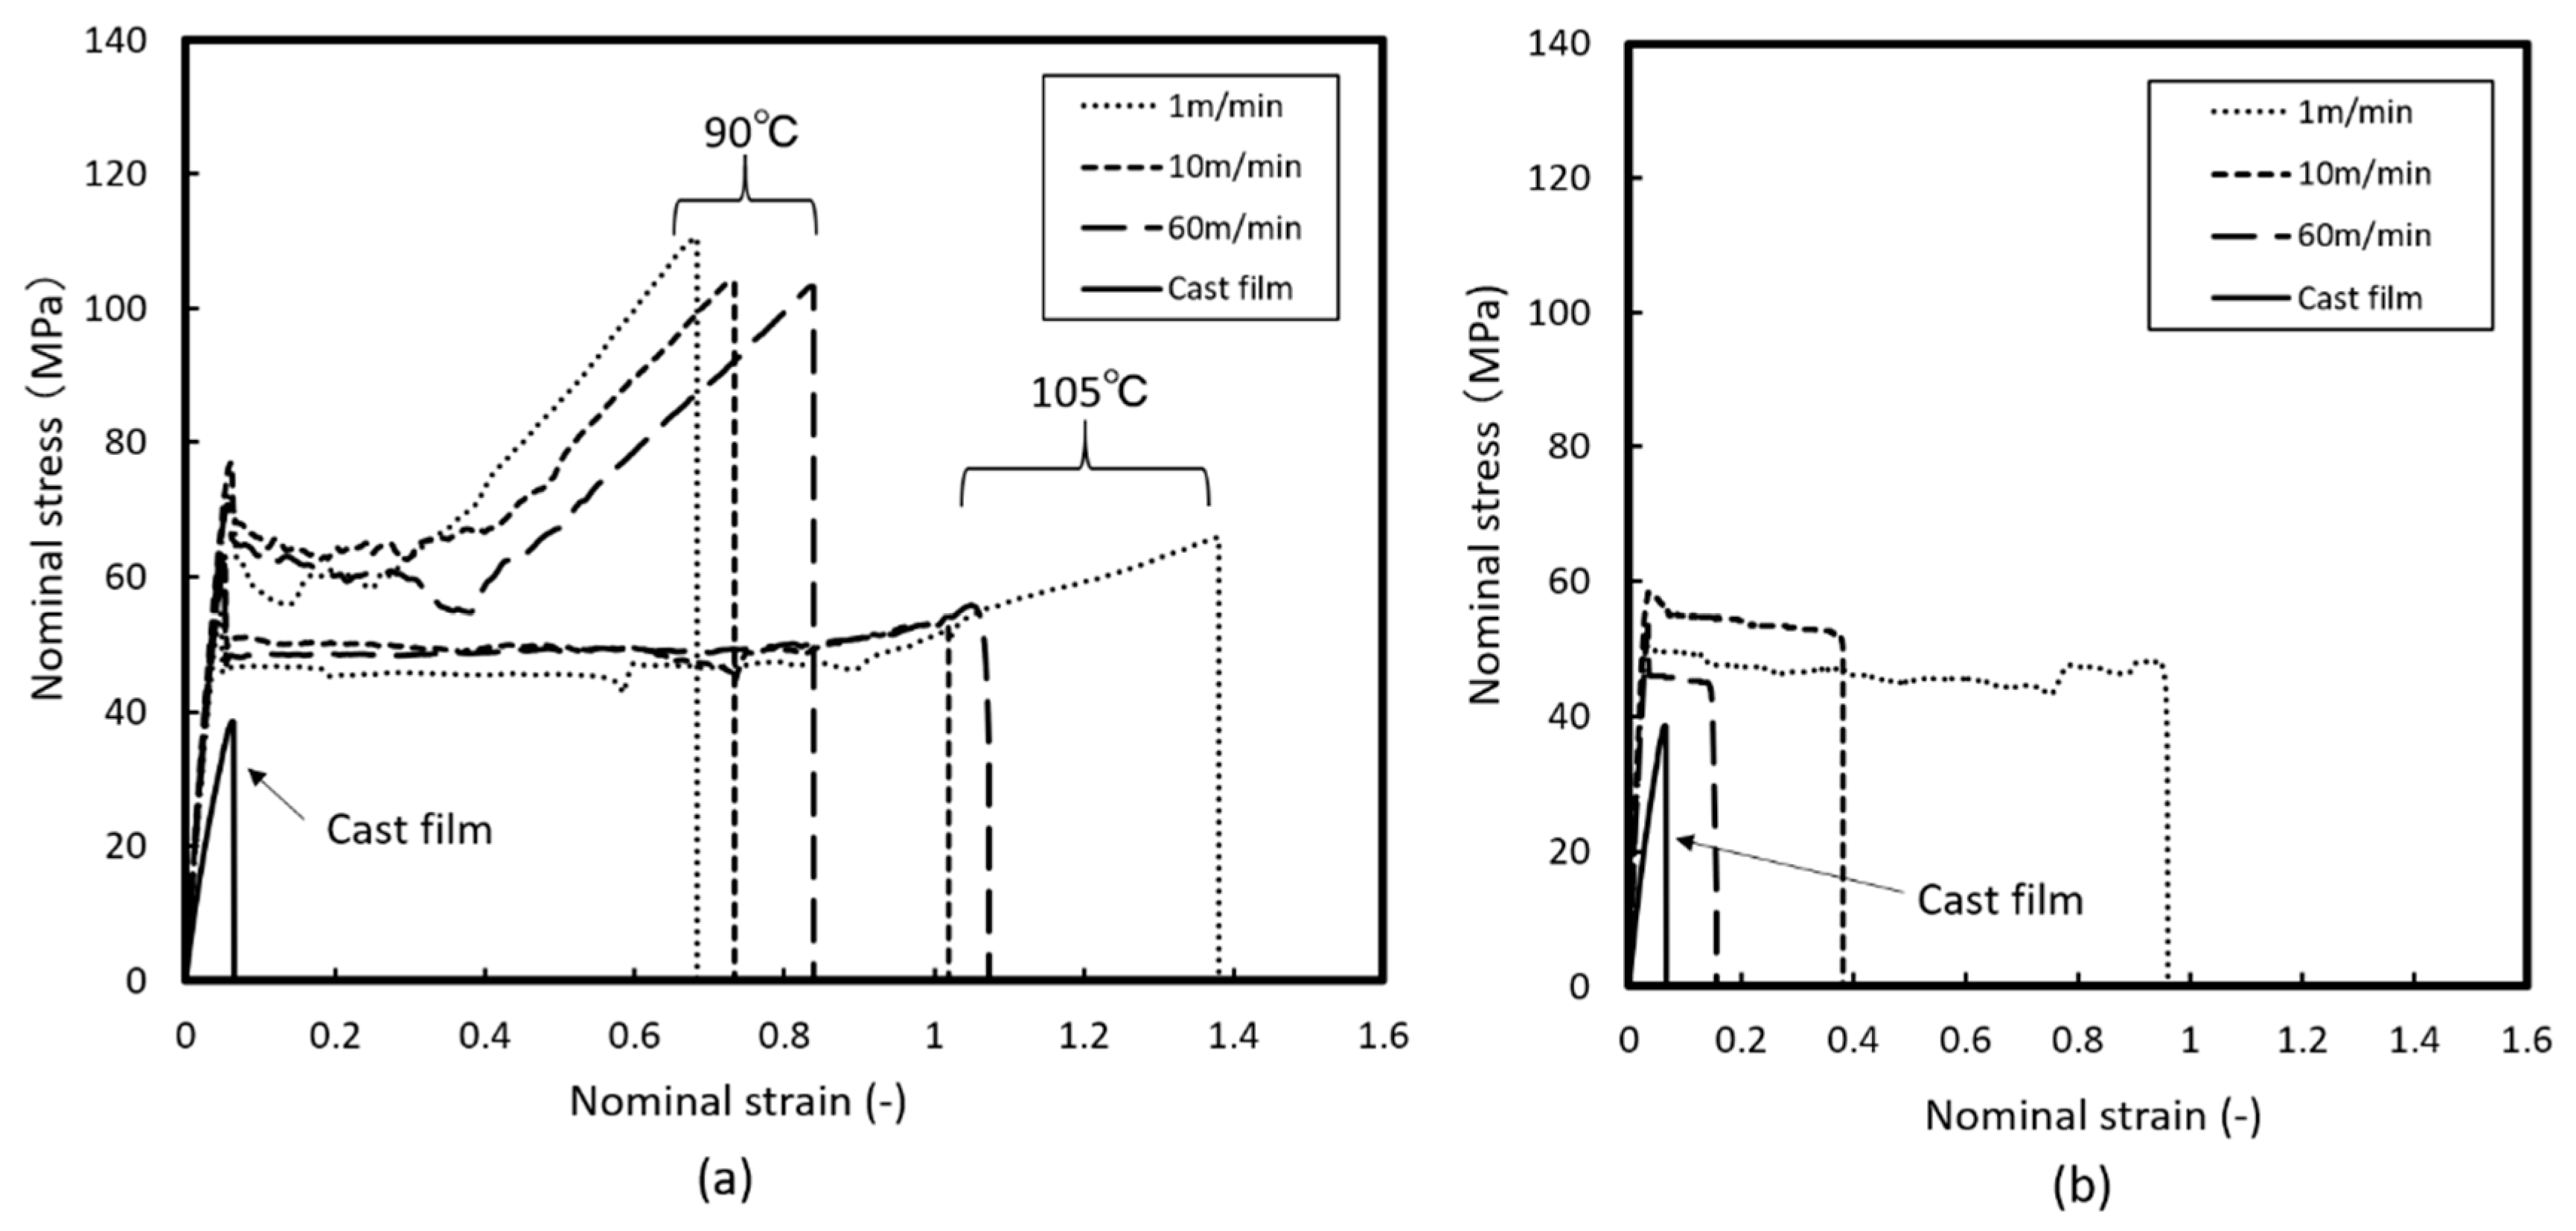
Figure 12 shows the tensile test results. Thickness of the films were checked according to Figure 5. For the cast film, yield strength was 40 MPa with brittle breakage. In uniaxially and biaxially stretched films, yield strength and modulus increased by 230% and 280%, respectively. Stretching rendered the films ductile, especially when stretched at 105 °C. Tensile tests in TD showed sudden failure at a stress of around 50 MPa with the same modulus of MD. In biaxially stretched films, breaking strains showed significant dependence on stretching speed. Despite approximately equal yield strengths, stretching at higher speed lowers the breaking strain. Fast stretching appears to result in a molecular orientation without relaxation, as mentioned in the thermal analysis. Stress relaxation generally acts to prevent brittle fracture and stress concentrations; thus, preventing relaxation with fast stretching results in brittle behavior in tensile testing. In contrast, slow stretching allows stress relaxation to proceed as well, resulting in reduced orientation.
4. Conclusions
Our results show that this novel system is capable of measuring retardation during fast stretching at speed of 60 m/min, significantly faster than in conventional research processes. Our evaluation of the SOC of COC for uniaxially constrained stretching confirm the result obtained for uniaxial free width stretching, which is in close agreement with the measurement from previous studies. With fast stretching speed, SOC values get closer to the photo-elastic constant at solid state. Effect of stretching temperature was also investigated, indicating that high stretching temperature is equivalent to lower stretching speed, showing there is converging value of SOC = 1.6 GPa−1 independent of stretching conditions. Thermal analysis indicated fast stretching constrains polymer chain structures to certain oriented configurations.
Author Contributions
Conceptualization, Y.H. and H.I.; Methodology, Y.H.; Formal Analysis, Y.H.; Writing-Original Draft Preparation, Y.H.; Supervision, H.I.
Funding
This research received no external funding.
Conflicts of Interest
The authors declare no conflict of interest.
References
- Ryu, D.S.; Inoue, T.; Osaki, K. A birefringence study of polymer crystallization in the process of elongation of films. Polymer 1998, 39, 2515–2520. [Google Scholar] [CrossRef]
- Cakmak, M.; Hassan, M.; Unsal, E.; Martins, C. A fast real time measurement system to track in and out of plane optical retardation/birefringence, true stress, and true strain during biaxial stretching of polymer films. Rev. Sci. Instrum. 2012, 83, 123901. [Google Scholar] [CrossRef] [PubMed]
- Hassan, M.K.; Cakmak, M. Mechano optical behavior of polyethylene terephthalate films during simultaneous biaxial stretching: Real time measurements with an instrumented system. Polymer 2013, 54, 6463–6470. [Google Scholar] [CrossRef]
- Hassan, M.K.; Cakmak, M. Mechanisms of structural organizational processes as revealed by real time mechano optical behavior of PET film during sequential biaxial stretching. Polymer 2014, 55, 5245–5254. [Google Scholar] [CrossRef]
- Martins, C.I.; Cakmak, M. Control the strain-induced crystallization of polyethylene terephthalate by temporally varying deformation rates: A mechano-optical study. Polymer 2007, 48, 2109–2123. [Google Scholar] [CrossRef]
- Mahendrasingam, A.; Martin, C.; Fuller, W.; Blundell, D.J.; Oldman, R.J.; Harvie, J.L.; MacKerron, D.H.; Riekel, C.; Engstro¨m, P. Effect of draw ratio and temperature on the strain-induced crystallization of poly (ethylene terephthalate) at fast draw rates. Polymer 1999, 40, 5553–5565. [Google Scholar] [CrossRef]
- Ajji, A.; Zhang, X. Biaxial Orientation Characterization On-line and Off-line and Structure Properties Correlations in Films. Macromol. Symp. 2002, 185, 3–14. [Google Scholar] [CrossRef]
- Kikutani, T.; Nakao, K.; Takarada, W.; Ito, H. On-line Measurement of Orientation Development in the High-Speed Melt Spinning Process. Polym. Eng. Sci. 1999, 39, 2349–2357. [Google Scholar] [CrossRef]
- Tokihisa, M.; Kushizaki, Y.; Tomiyama, H.; Umeda, Y.; Yamada, T. The Deformation Behavior of Polypropylene Film under High Strain Rates. Polym. Eng. Sci. 2013, 39, 2349–2357. [Google Scholar] [CrossRef]
- Hong, M.-H.; White, J.L. Birefringence and Mechanical Property Development in Melt Spinning Cyclopolyolefin Filaments. Int. Polym. Process. 2002, 17, 53–59. [Google Scholar] [CrossRef]
- TOPAS Advanced Polymers. Available online: https://topas.com/sites/default/files/files/optical_e.pdf (accessed on 11 June 2018).
Figure 1.
Schematic diagram of: (a) film stretcher and (b) high speed camera for real time retardation measurement.
Figure 1.
Schematic diagram of: (a) film stretcher and (b) high speed camera for real time retardation measurement.

Figure 2.
Differential Scanning Calorimetry (DSC) measurement results of: (a) uniaxial free width and (b) biaxial stretching at 105 °C.
Figure 2.
Differential Scanning Calorimetry (DSC) measurement results of: (a) uniaxial free width and (b) biaxial stretching at 105 °C.

Figure 3.
Draw ratio vs. retardation and stress of uniaxial free width stretching at 90 °C with stretching speed of: (a) 1 m/min; (b) 10 m/min; and (c) 60 m/min.
Figure 3.
Draw ratio vs. retardation and stress of uniaxial free width stretching at 90 °C with stretching speed of: (a) 1 m/min; (b) 10 m/min; and (c) 60 m/min.

Figure 4.
Residual retardation of uniaxial free width stretched films after relaxation expressed by: (a) time dependence and (b) stretching temperature.
Figure 4.
Residual retardation of uniaxial free width stretched films after relaxation expressed by: (a) time dependence and (b) stretching temperature.

Figure 5.
Thickness and width of uniaxially stretched films measured at each draw ratio.

Figure 6.
True stress vs. birefringence of uniaxial free width stretching at: (a) 90 °C and (b) 105 °C.
Figure 6.
True stress vs. birefringence of uniaxial free width stretching at: (a) 90 °C and (b) 105 °C.

Figure 7.
Draw ratio vs. true stress of uniaxial width constrained stretching at 90 °C with stretching speed of: (a) 1 m/min; (b) 10 m/min; and (c) 60 m/min.
Figure 7.
Draw ratio vs. true stress of uniaxial width constrained stretching at 90 °C with stretching speed of: (a) 1 m/min; (b) 10 m/min; and (c) 60 m/min.

Figure 8.
Birefringence vs. true stress of uniaxial width constrained stretching at 90 °C.

Figure 9.
Stress-strain curve of simultaneous biaxial stretching at: (a) 90 °C and (b) 105 °C.

Figure 10.
tan δ and E’ of: (a) uniaxial free width and (b) simultaneous biaxial stretched films at 105 °C.
Figure 10.
tan δ and E’ of: (a) uniaxial free width and (b) simultaneous biaxial stretched films at 105 °C.

Figure 11.
Dimension change of: (a) uniaxial free width and (b) simultaneous biaxial films stretched at 105 °C.
Figure 11.
Dimension change of: (a) uniaxial free width and (b) simultaneous biaxial films stretched at 105 °C.

Figure 12.
Tensile test results of: (a) uniaxially free width stretched films and (b) simultaneously biaxial stretched films.
Figure 12.
Tensile test results of: (a) uniaxially free width stretched films and (b) simultaneously biaxial stretched films.

© 2018 by the authors. Licensee MDPI, Basel, Switzerland. This article is an open access article distributed under the terms and conditions of the Creative Commons Attribution (CC BY) license (http://creativecommons.org/licenses/by/4.0/).
Share and Cite
MDPI and ACS Style
Hashimoto, Y.; Ito, H. Structural Formation of Cyclic Olefin Copolymer (COC) Films as Revealed by Real Time Retardation Measurements during Fast Stretching Process. Technologies 2018, 6, 60. https://doi.org/10.3390/technologies6030060
AMA Style
Hashimoto Y, Ito H. Structural Formation of Cyclic Olefin Copolymer (COC) Films as Revealed by Real Time Retardation Measurements during Fast Stretching Process. Technologies. 2018; 6(3):60. https://doi.org/10.3390/technologies6030060
Chicago/Turabian StyleHashimoto, Yoshinori, and Hiroshi Ito. 2018. "Structural Formation of Cyclic Olefin Copolymer (COC) Films as Revealed by Real Time Retardation Measurements during Fast Stretching Process" Technologies 6, no. 3: 60. https://doi.org/10.3390/technologies6030060
Note that from the first issue of 2016, this journal uses article numbers instead of page numbers. See further details here.