Article

Tribological Behavior of Spark Plasma Sintered Aluminum-Graphene Composites at Room and Elevated Temperatures

1
Plasma Forming Laboratory, Department of Mechanical and Materials Engineering, Florida International University, Miami, FL 33174, USA
2
School of Mechanical and Aerospace Engineering, Oklahoma State University, 218 Engineering North, Stillwater, OK 74078, USA
*
Author to whom correspondence should be addressed.
Technologies 2017, 5(1), 4; https://doi.org/10.3390/technologies5010004
Submission received: 6 August 2016 / Revised: 12 November 2016 / Accepted: 24 December 2016 / Published: 3 January 2017
(This article belongs to the Special Issue Spark Plasma Sintering of Materials)

Abstract

:
This study examines the role of Graphene nanoplatelets (GNPs) as a solid lubricant additive to aluminum. Pure Al and Al-2 vol % GNP pellets are sintered by Spark Plasma Sintering (SPS). Their tribological properties are evaluated by a ball-on-disk tribometer at room temperature (RT) and high temperature (200 °C). Al-2 vol % GNP composite displayed poor densification (91%) and low hardness, resulting in poor wear resistance as compared to pure Al. However GNP addition resulted in a lower coefficient of friction (COF) as compared to pure aluminum at both temperatures. The results demonstrated that GNPs contribute to reducing COF by forming a protective tribolayer. GNPs also play a unique role in reducing oxygen ingress at 200 °C. It is concluded that the packing density of a starting powder blend of Al-GNP needs to be improved by using irregular shaped aluminum powder mixed with both larger and smaller GNPs. This would result in greater densification and improve wear rate while maintaining low COF.

1. Introduction

Overcoming friction in engine systems can significantly improve the fuel efficiency of automobiles [1,2,3]. Novel aluminum alloys and composites [4,5,6], surface engineering techniques [7], and solid lubricant additives [8] have been explored to reduce friction in automotive systems. In recent years, graphene has emerged as an excellent solid lubricant additive [9,10]. Graphene nanoplatelets (GNPs), which consist of 20–30 graphene sheets, have revealed very low coefficients of friction, high flexibility, and wear resistance. In addition, GNPs also demonstrated a high ability to be dispersed into a matrix without losing 2D or mechanical properties [11]. GNP addition in an Ni3Al matrix demonstrated 30% improvement in the coefficient of friction (COF) for temperatures between 25°C and 400 °C [12]. Si is another matrix in which GNP improved the COF by 20% compared to that for pure Si [13]. Magnesium matrix with at 1, 2 and 5 vol % GNP content had a COF that is half of pure Mg. The wear rate was 1.5 times lower for 5 vol % GNP as compared with pure Mg [14]. Moghadam et al [15] compared two self-lubricated aluminum alloy nanocomposites with 3 and 5 wt % GNP addition. Their results indicated a decreased wear rate (~68.7%) for Al-3 wt % GNP with respect to pure Al, while 5 wt % GNP composite doubled the wear rate in comparison with the baseline material. In contrast, GNPs have also shown a decrease in the hardness and tensile strength (~18% less than pure Al) in Al nanocomposites formed by milling, hot isostatic pressing, and hot extrusion, due to the formation of aluminum carbide [16]. The structure of GNPs works by absorbing the energy generated by compression and shear during contact [17]. The ability to easily slip provides a source of stress dissipation and allows GNPs to create a protective layer while sliding [12]. Hence GNPs present unique flexibility and mechanical stiffness under the application of loads. Tabandeh et al [18] reported a lower COF upon increasing the normal load, which was attributed to the formation of the tribolayer.
The objective of this study is to investigate the role of GNPs as a solid lubricant additive to a pure aluminum matrix and compare its tribological behavior at room temperature and 200 °C. Wear mechanism is elucidated based on the microstructural examination of the wear surface, including sub-surface analysis using a focused ion beam.

2. Materials and Methods

2.1. Powder Preparation

Spherical aluminum powder (H3), with an average particle size of 2–10 μm and purity greater than 99.7%, was obtained from Valimet Inc. (Stockton, CA, USA), while Graphene nanoplatelets (GNPs) were obtained from XG Sciences (Lansing, MI, USA). GNPs have an average thickness of 6–8 nanometers and a diameter of about 10–15 μm; 2 vol % of GNP were added to Al powder. The powder mixture was added to acetone and ultrasonicated for 90 min. Subsequently, the Al-2 vol % GNP powder mixture was dried in an oven at 75 °C for 24 h.

2.2. Spark Plasma Sintering (SPS)

Dried Al-2 vol % GNP powder was consolidated using a Spark Plasma Sintering 10-3 model (Thermal Technology, Santa Rosa, CA, USA). The consolidation was carried out in a 20 mm diameter graphite die using a holding pressure of 50 MPa. The maximum temperature used during sintering was of 500 °C with a holding time of 10 min. These parameters were selected based on experience with previous study [19]. A heating rate of 50 °C/min in a vacuum was used. The consolidated samples were cooled in the furnace. A pure Al sample was also consolidated under similar conditions as a control sample.

2.3. Microstructural Characterization

The density of the sintered pellets was measured using AccuPyc II 1340 Helium Pycnometer (Micromeritics Instrument Corporation, Norcross, GA, USA). To understand the phase formation during sintering and wear, X-ray diffraction (XRD) was carried out using a D5000 Diffractometer (Siemens, Dresden, Germany) at an operating voltage of 40 kV and current of 35 mA. The radiation used is Cu Kα, which has a wavelength of 1.542 Å. Scanning electron microscopy (JEOL JSM-6330 F, Tokyo, Japan) was also used to characterize the powders and wear surfaces. A JEOL-JIB 4500 Multi Beam Focused Ion Beam (FIB) (JEOL, Tokyo, Japan) was used to machine the wear track for sub-surface analysis as shown in Figure 1. Vickers microhardness (VHN) was obtained under a 100 gram-force for a hold time of 15 s.

2.4. Tribologial Tests

The tribological tests were conducted in the rotative mode (ASTM G99) using a ball-on-disk Nanovea tribometer (Nanovea, Irvine, CA. USA). The top surfaces of the sintered pellets were subjected to a 1 N normal load against a 3 mm diameter Al2O3 ball as the counter surface, at a speed of 100 RPM (linear speed 29.3 mm/s). The test was conducted for 30 min at RT and 200 °C in dry sliding conditions. The roughness for the two materials is comparable: Al, Ra; 0.64 µm: Al-GNP, Ra; 0.69 µm. High temperature tests were conducted at 200 °C to simulate gasoline operated engines [20,21]. For high temperature conditions a furnace surrounding the sample was preheated until it reached 200 °C and subsequently wear tests were started. A Nanovea PS50 Optical Profilometer (Nanovea, Irvine, CA. USA) was used to scan the wear surface to obtain 2D wear profile and wear depths of each track. A Scanning Probe Image Processor (SPIP) (Image Metrology A/S, Hørshlom. Denmark) and Origin 6.0 (Origin Lab Corporation, Northampton, MA, USA.) were used to convert 2D wear profiles to 3D profiles and compute wear volume. XRD experiments were also performed on the wear surface to obtain information about chemical reactions and phase formation in tribofilm. Energy-dispersive Spectroscopy (EDS) of the wear track was carried out using a JEOL JIB 4500 (JEOL, Tokyo, Japan).

3. Results and Discussion

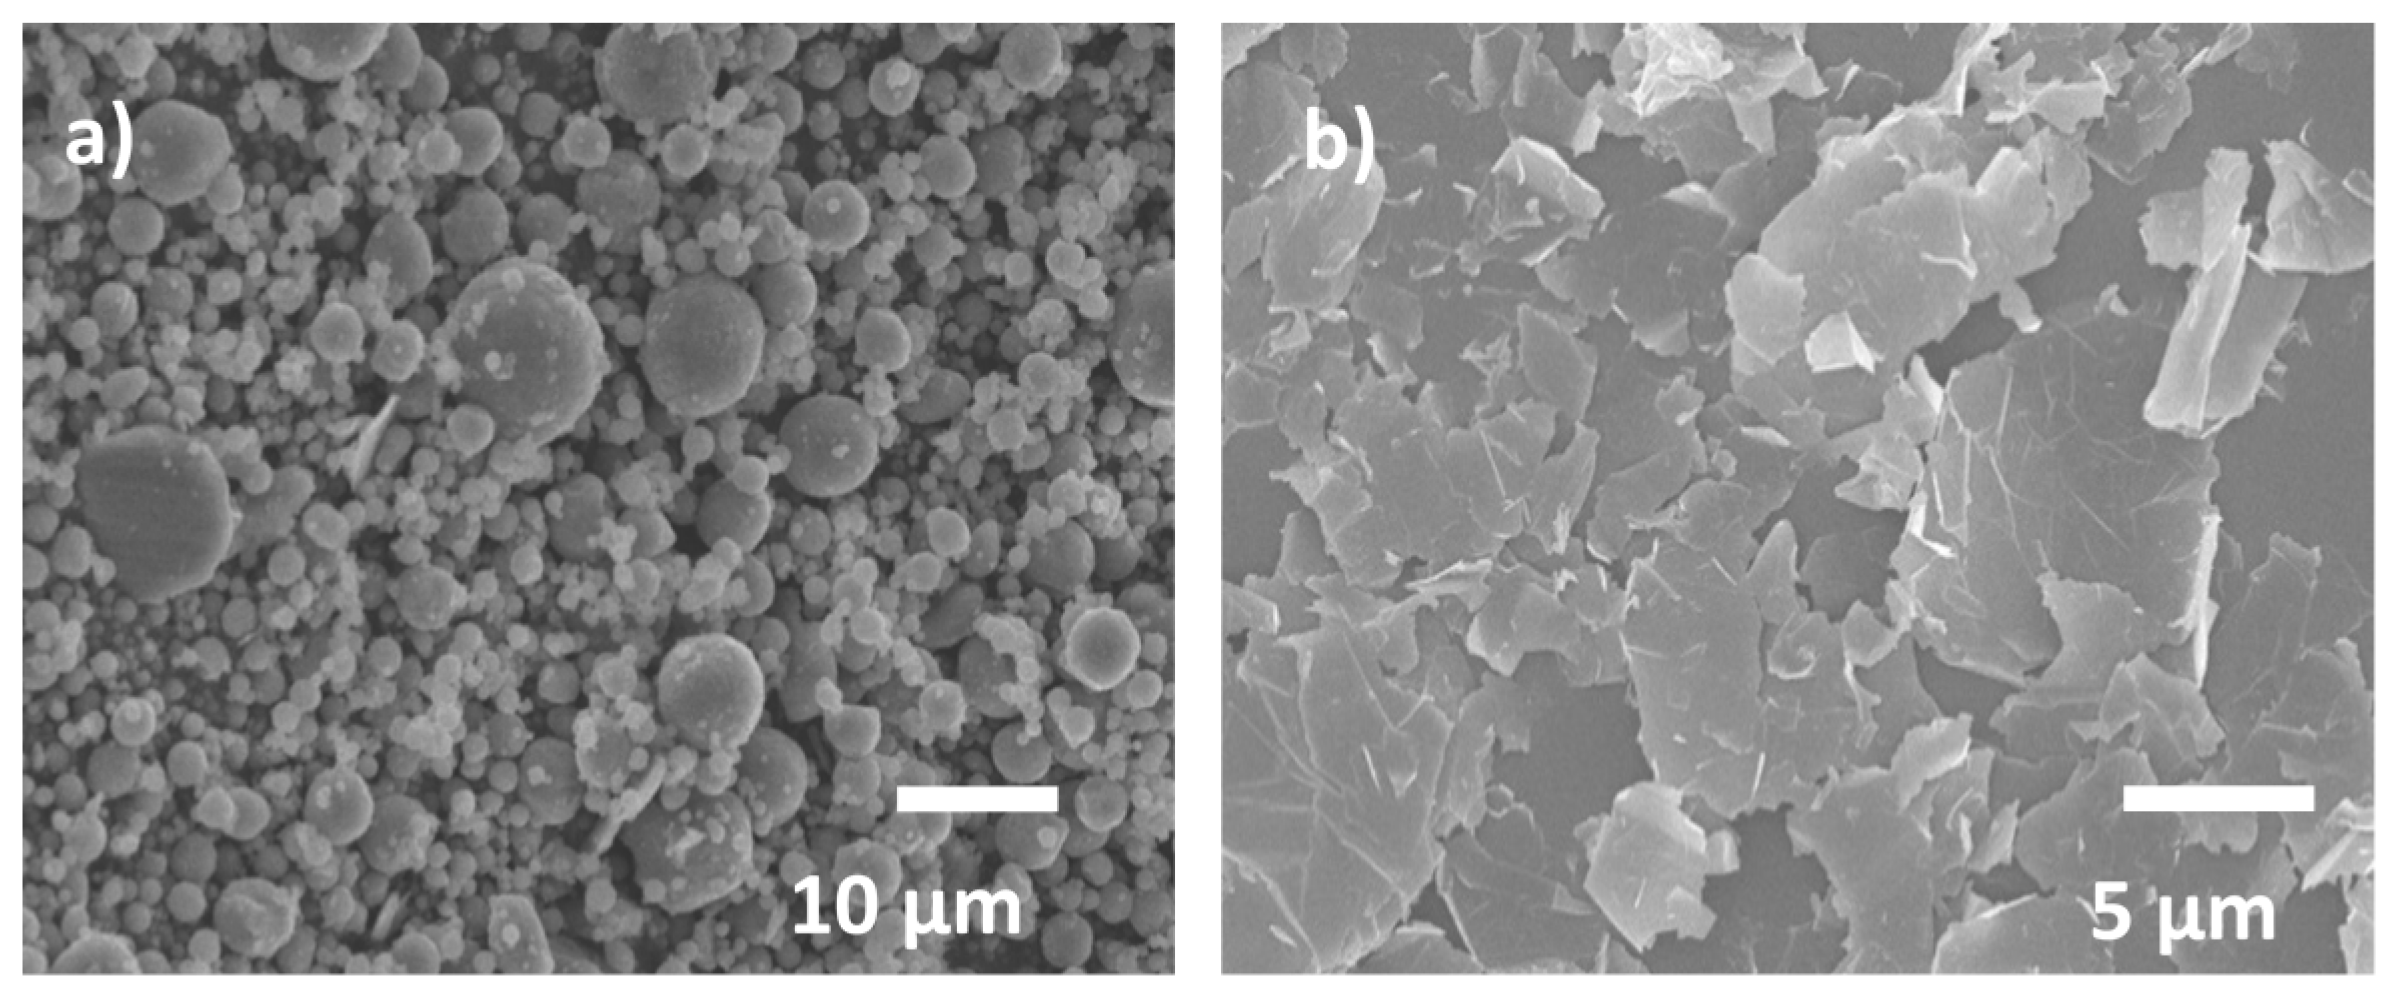
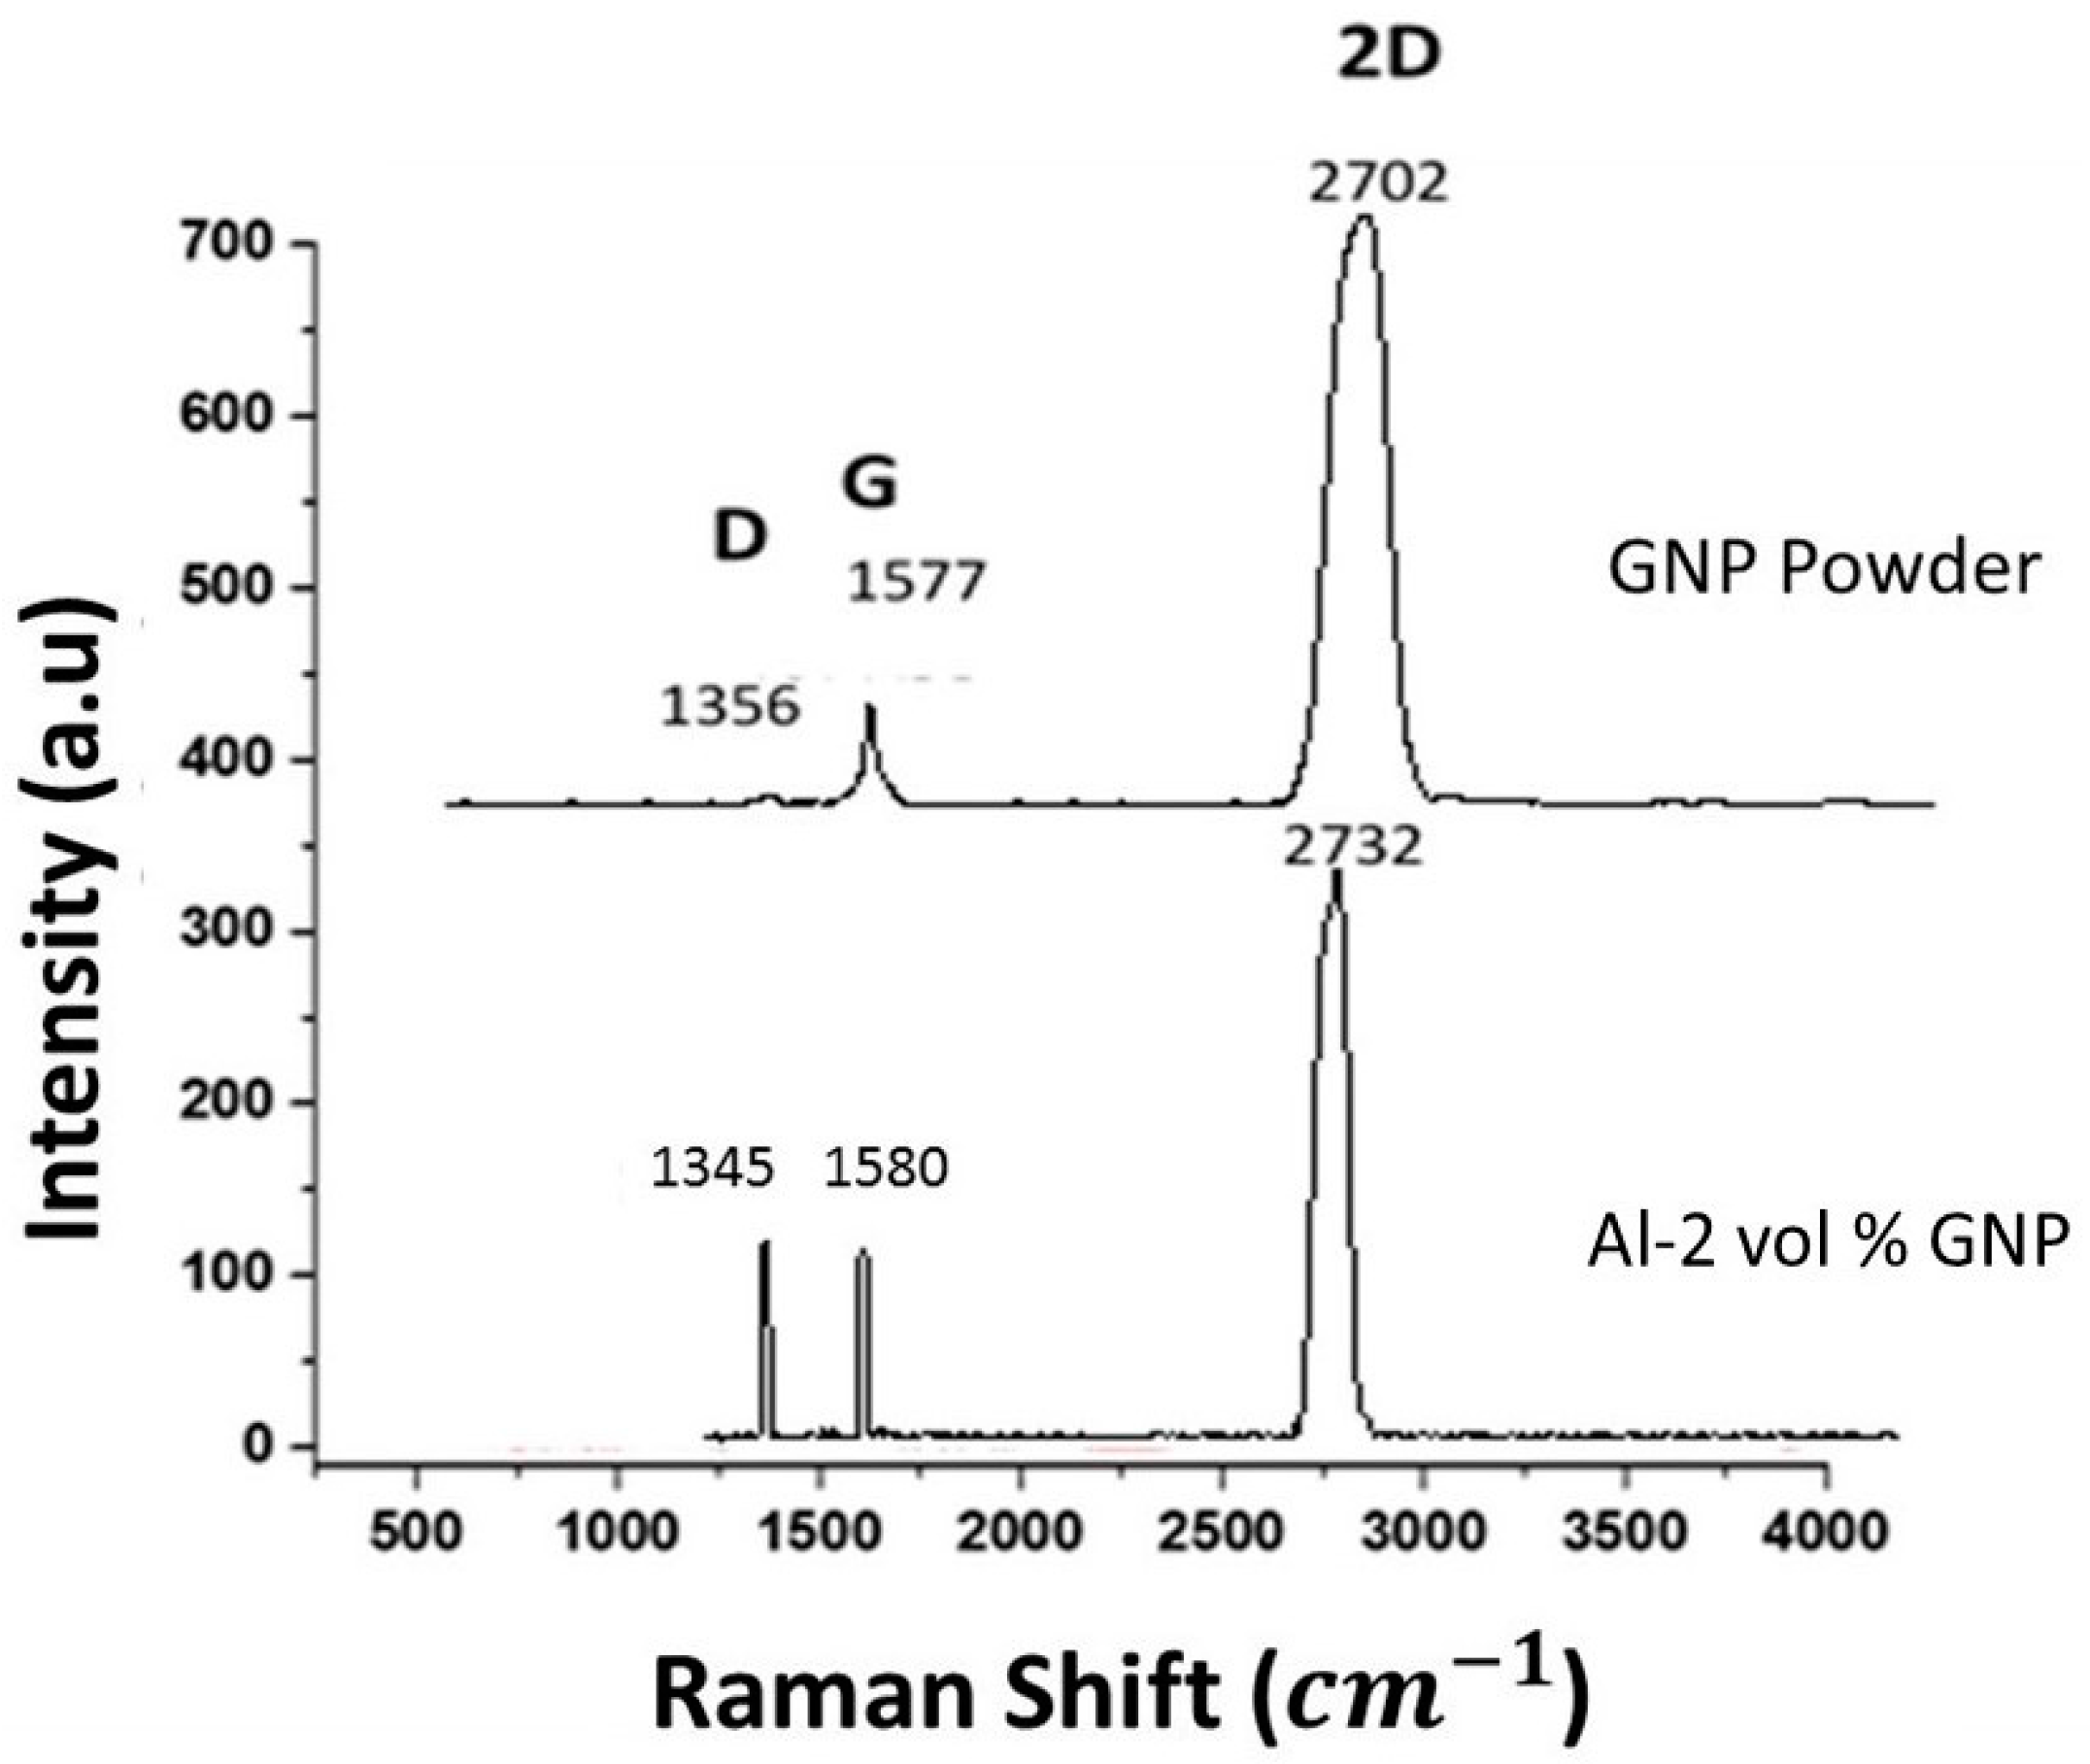
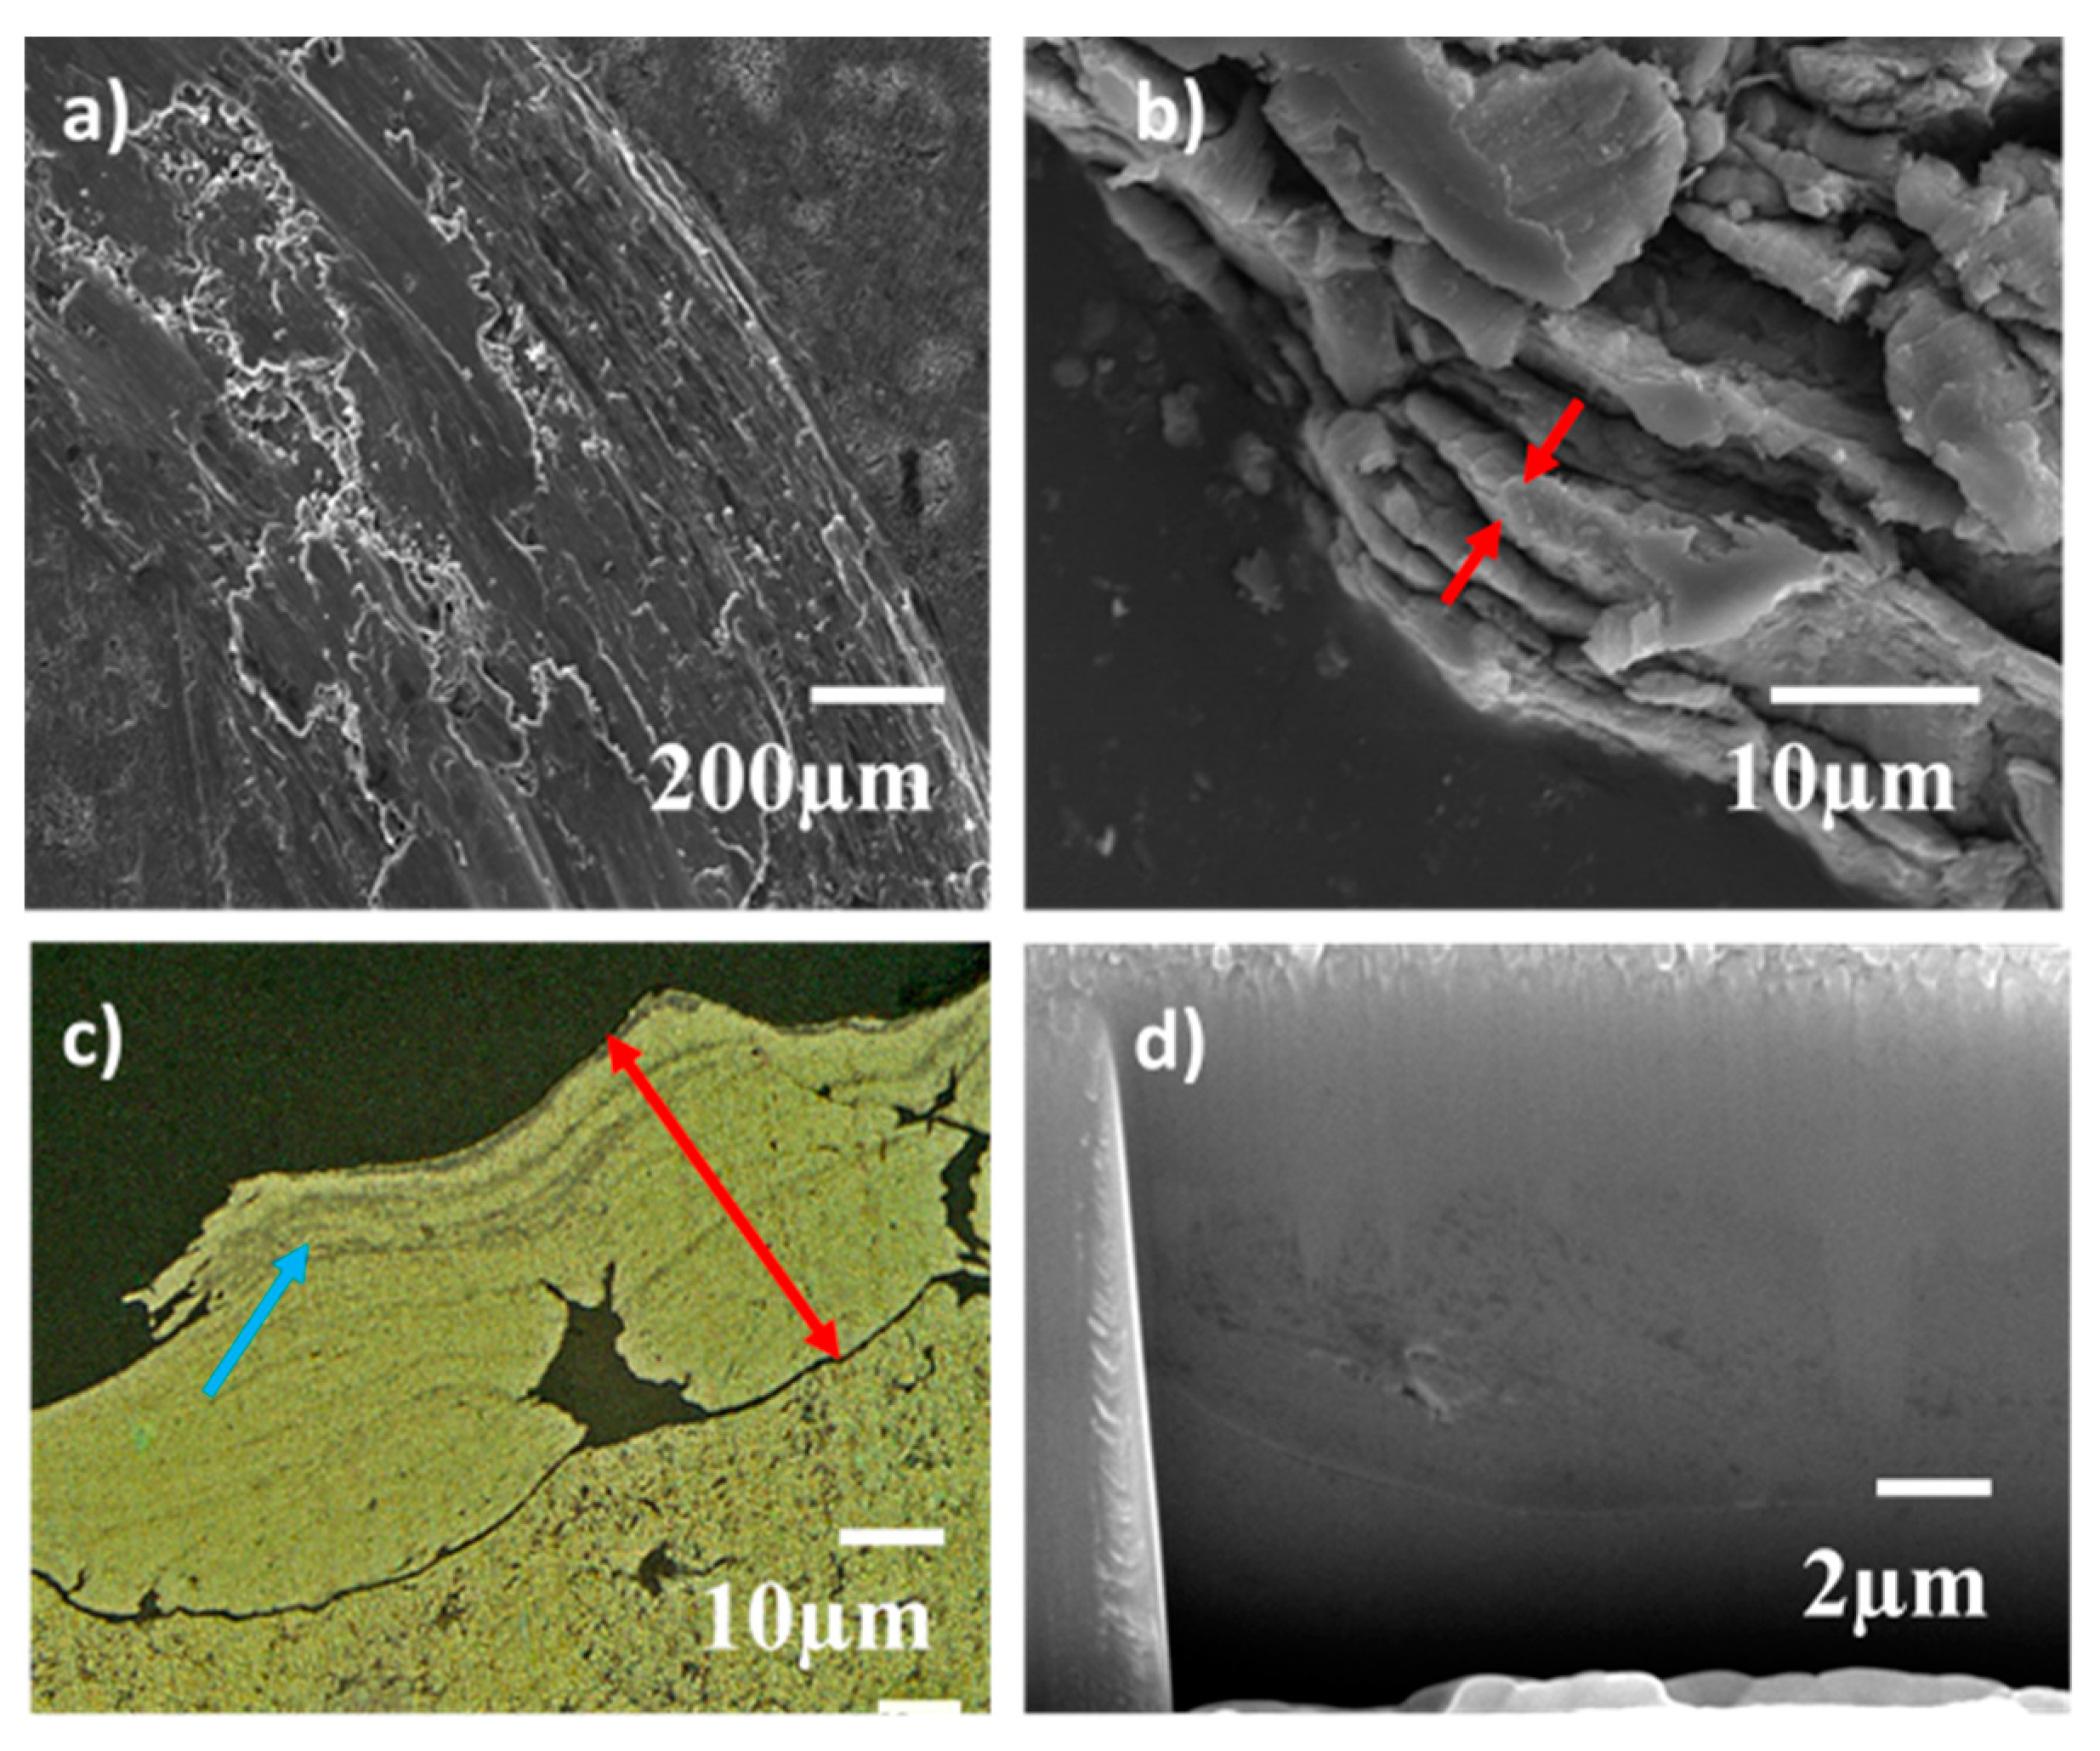
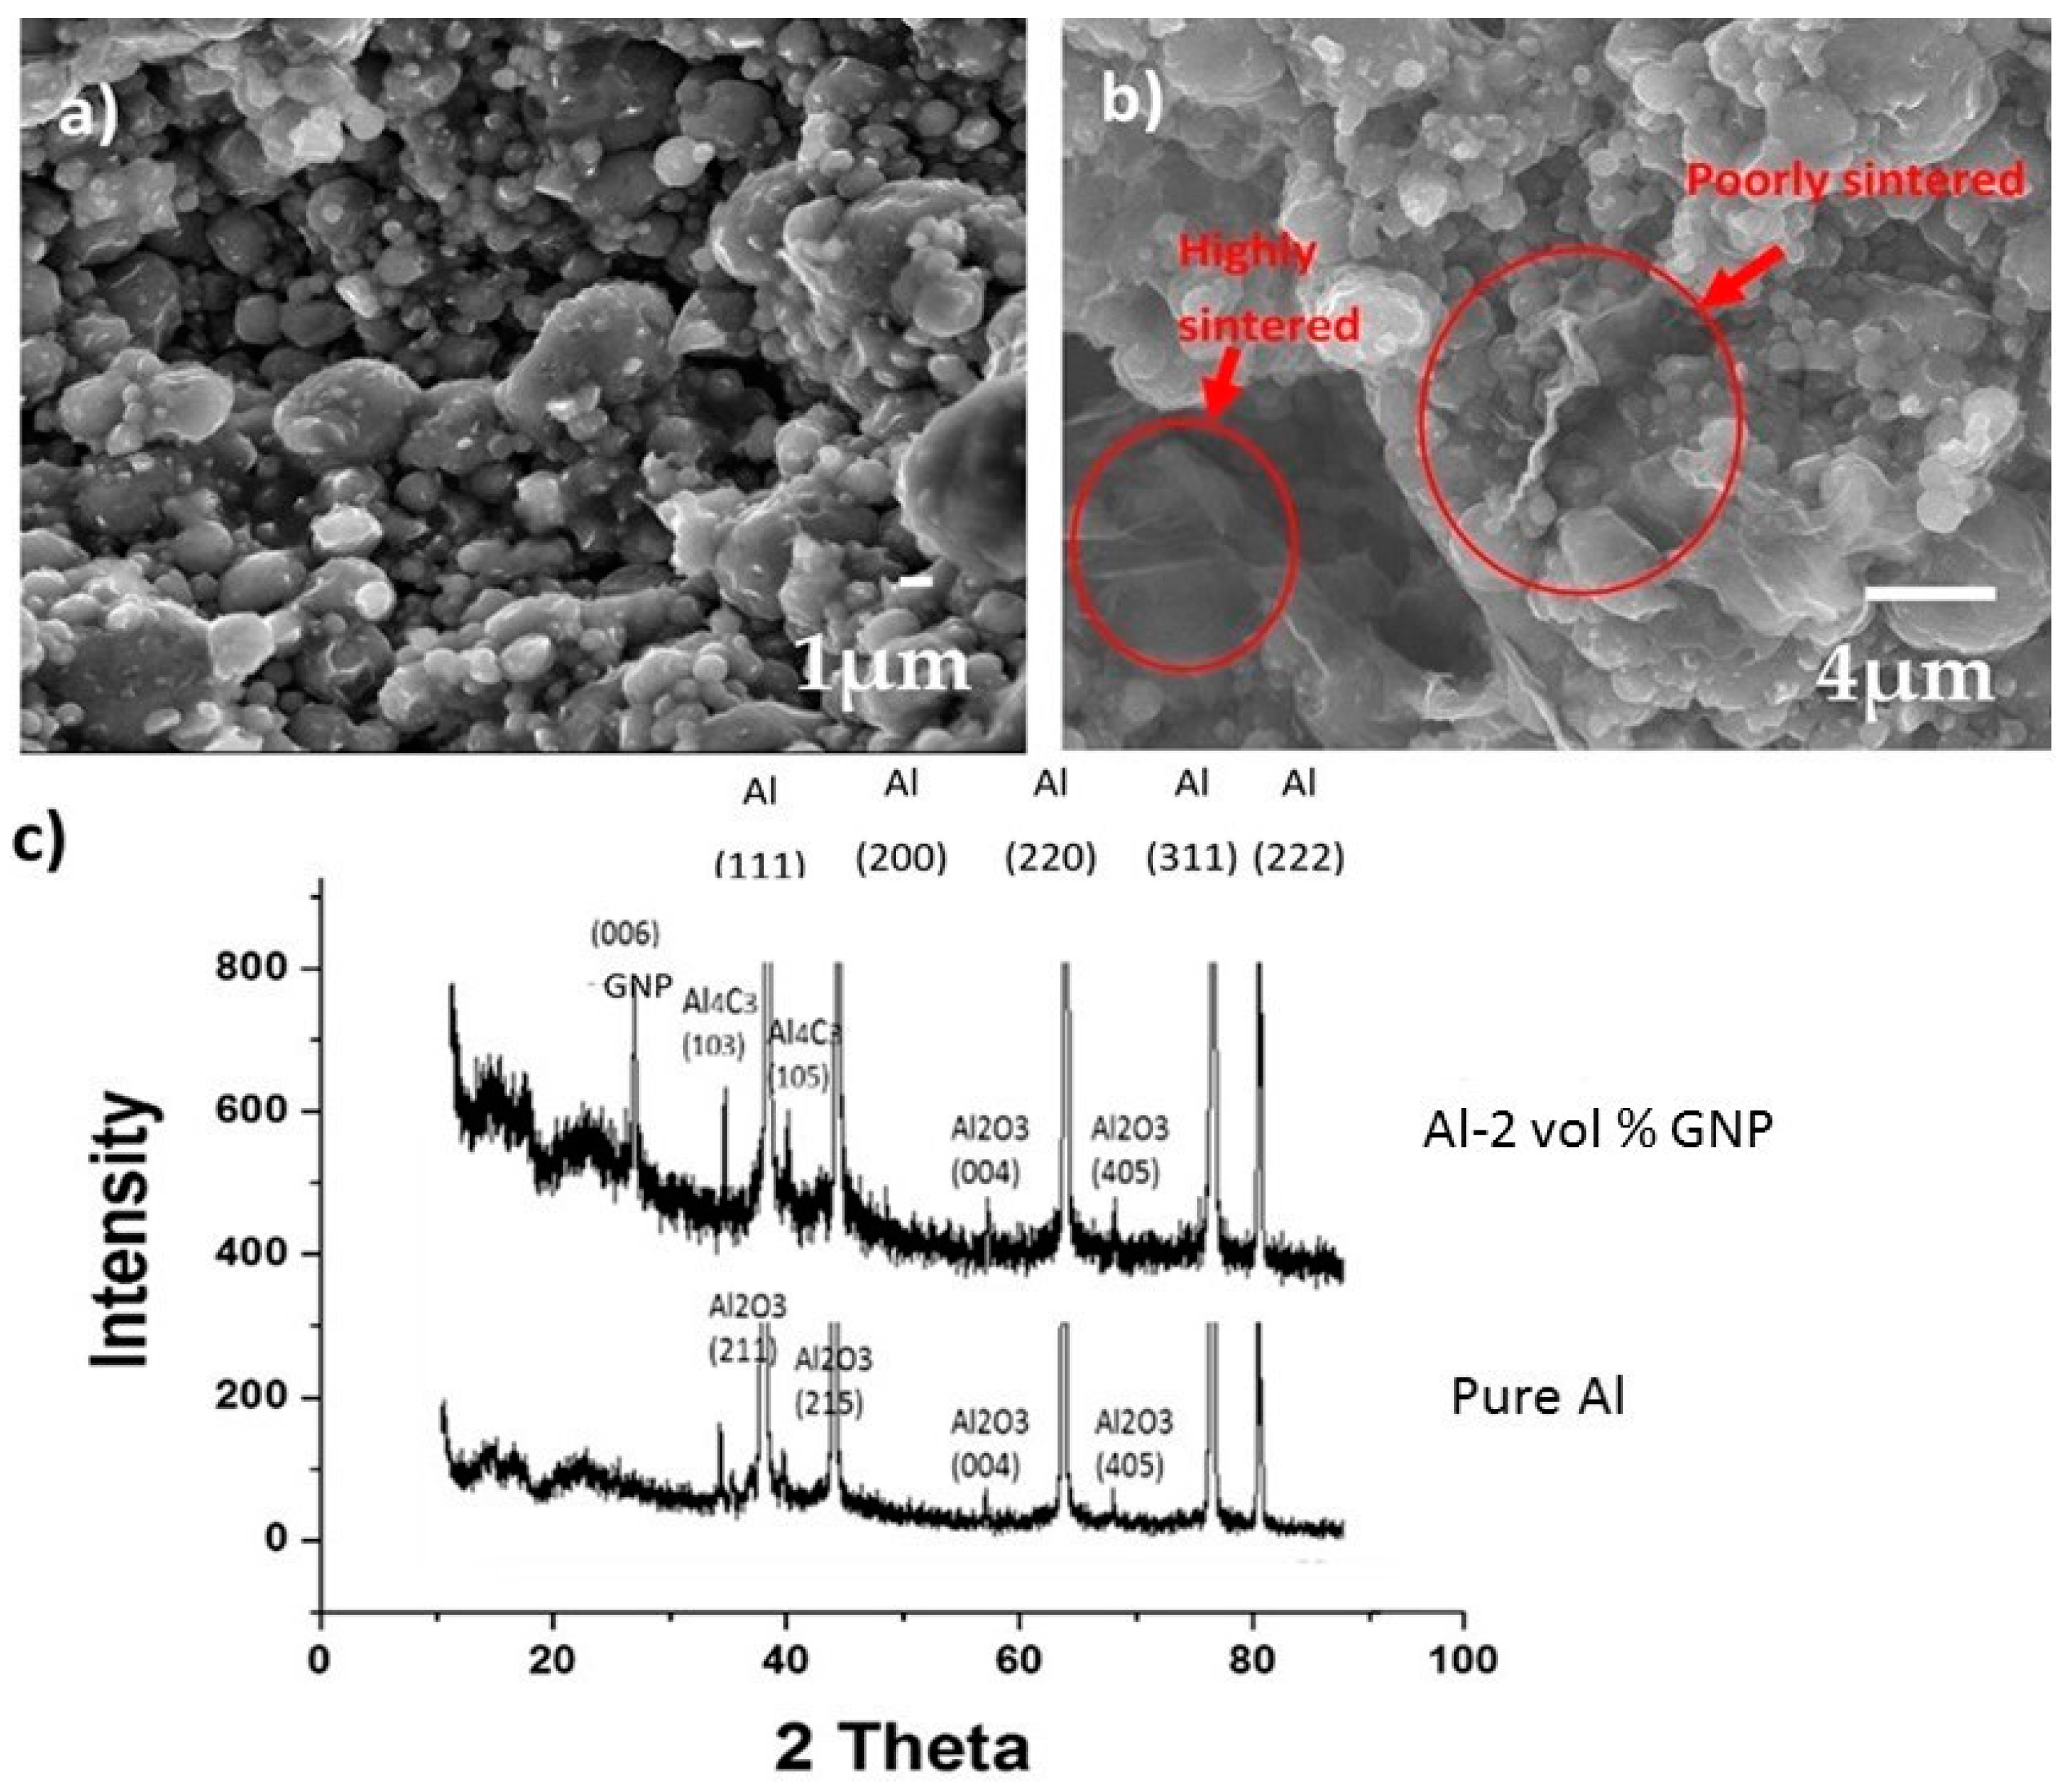
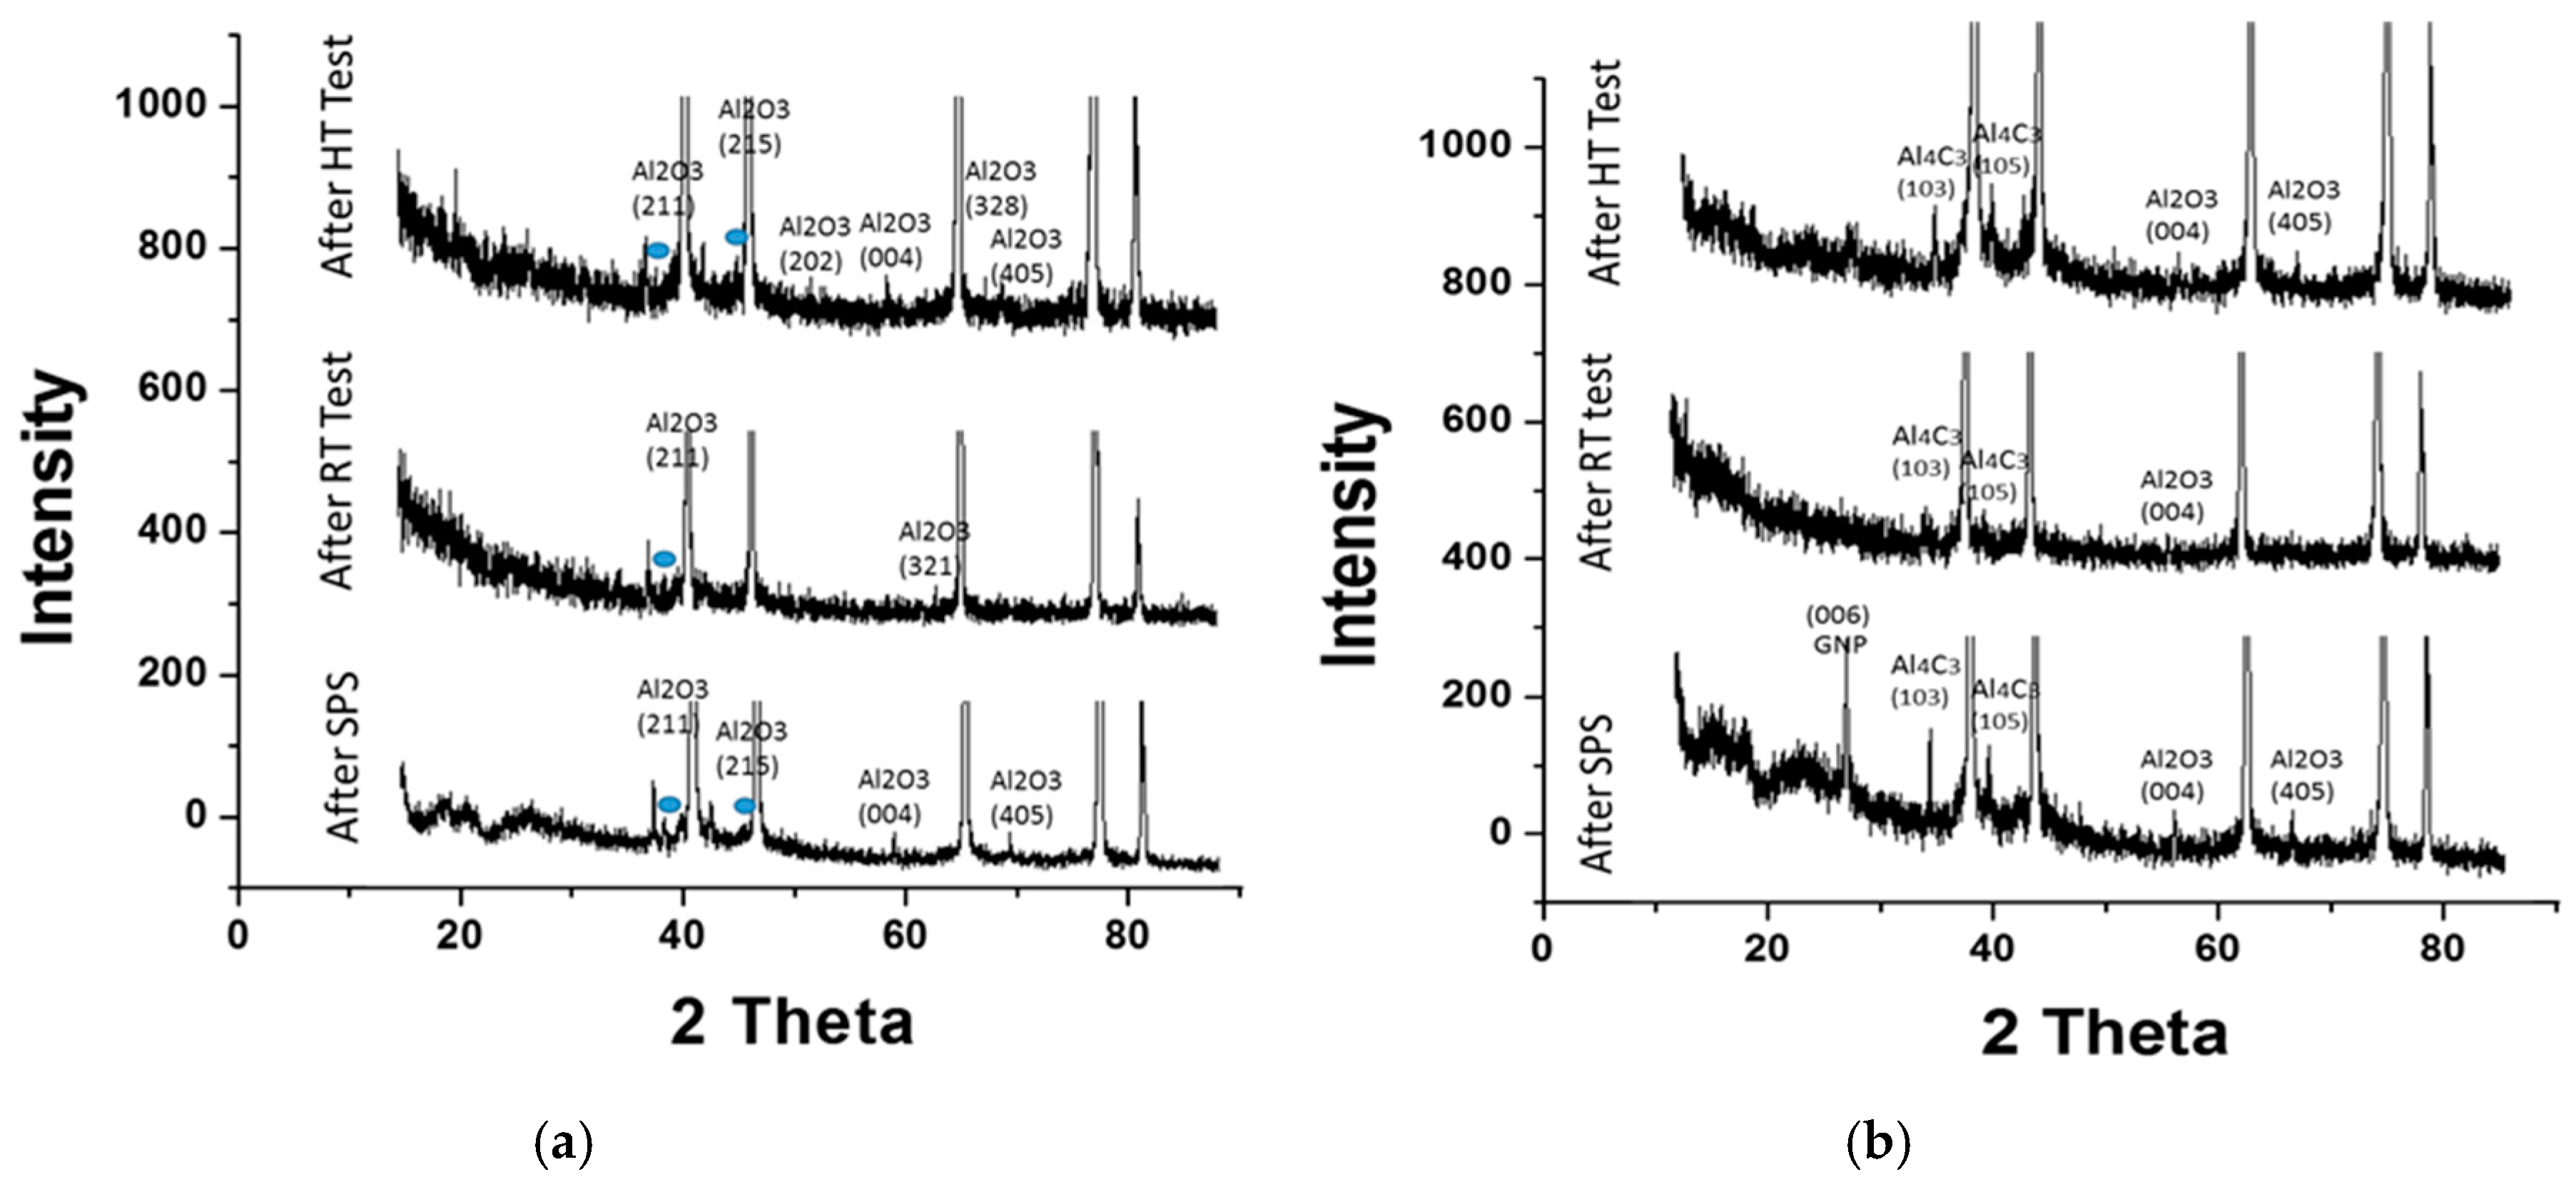
3.1. Microstructure and Phases

Figure 2a shows the starting Al powder, which is spherical with diameter ranging 2–10 μm. Figure 2b shows the starting GNPs with an average diameter of 10–15 μm.
SEM images of the fractured structure of sintered Al and Al-2 vol % GNP pellets are shown in Figure 3a,b, respectively. Figure 3a shows aluminum spherical particles with a moderate level of densification. Figure 3b shows an agglomerated GNP stringer surrounded by poorly sintered aluminum particles. The GNPs are wrinkled and agglomerated. The density of the pure Al sample was 96%, whereas Al-2 vol % GNP had a poor density of 91% due to the agglomeration of GNPs. The microhardness of a sintered Al pellet is 59 HV, which marginally reduces to 55 HV for Al-2 vol % GNP. It has been known that GNPs tend to agglomerate and restack, allowing the formation of porosity [12]. X-ray diffraction of sintered pellets was carried out to observe if any new phase(s) were formed during sintering. All major peaks representing pure Al are located at 2θ equals to 38.74°, 44.96°, 65.29°, 78.29°, and 82.81° in both samples. Pure Al also shows trace amounts of Al2O3 formation. The Al-2 vol % GNP sample resulted in the formation of trace amount of Al2O3 and Al4C3 phases. In addition, the main peak representing the retention of carbon-based material can be observed for the (006) plane.
In order to have a better understanding of the retention of the 2D structure of the GNP lubricants after SPS, the Raman spectroscopy was performed on the starting powder and sintered pellet. Figure 4 shows Raman spectra from the starting GNP powder and sintered Al-2 vol % GNP pellet. Three representative peaks of carbon are known as D, G, and 2D and are located around 1336 cm−1, 1583 cm−1, and 2702 cm−1, respectively. Raman scattering provides information about the number of graphene layers present in the structure [22]. The number of graphene layers is determined by the observation of the band’s width (2D peak), the sharper the peak, the fewer layers the structure has [22,23]. The intensity ratio between the 2D and G bands (I2D/IG) is a measure of graphitic vs. graphene nature. An I2D/IG ratio of less than 1 indicates graphite. I2D/IG ratio for the as-received GNP is ~5.5, indicating fewer graphene layers (Figure 4). The I2D/IG ratio for the sintered Al-2 vol % GNP composite is ~2.85, which shows that more graphene layers are present in the GNP’s structure in the composite. This could be due to the stacking of several GNPs under the high pressure of the SPS. Some agglomeration of the GNPs after SPS was observed in the fracture surface (Figure 3b). From Figure 4, the ratio ID/IG for starting GNP is ~0.11, which increases to 1.19 in the composite, showing that defects have increased due to the sintering process. Hence it can be established from Raman Spectroscopy that GNP structure is retained with some damage after SPS consolidation.

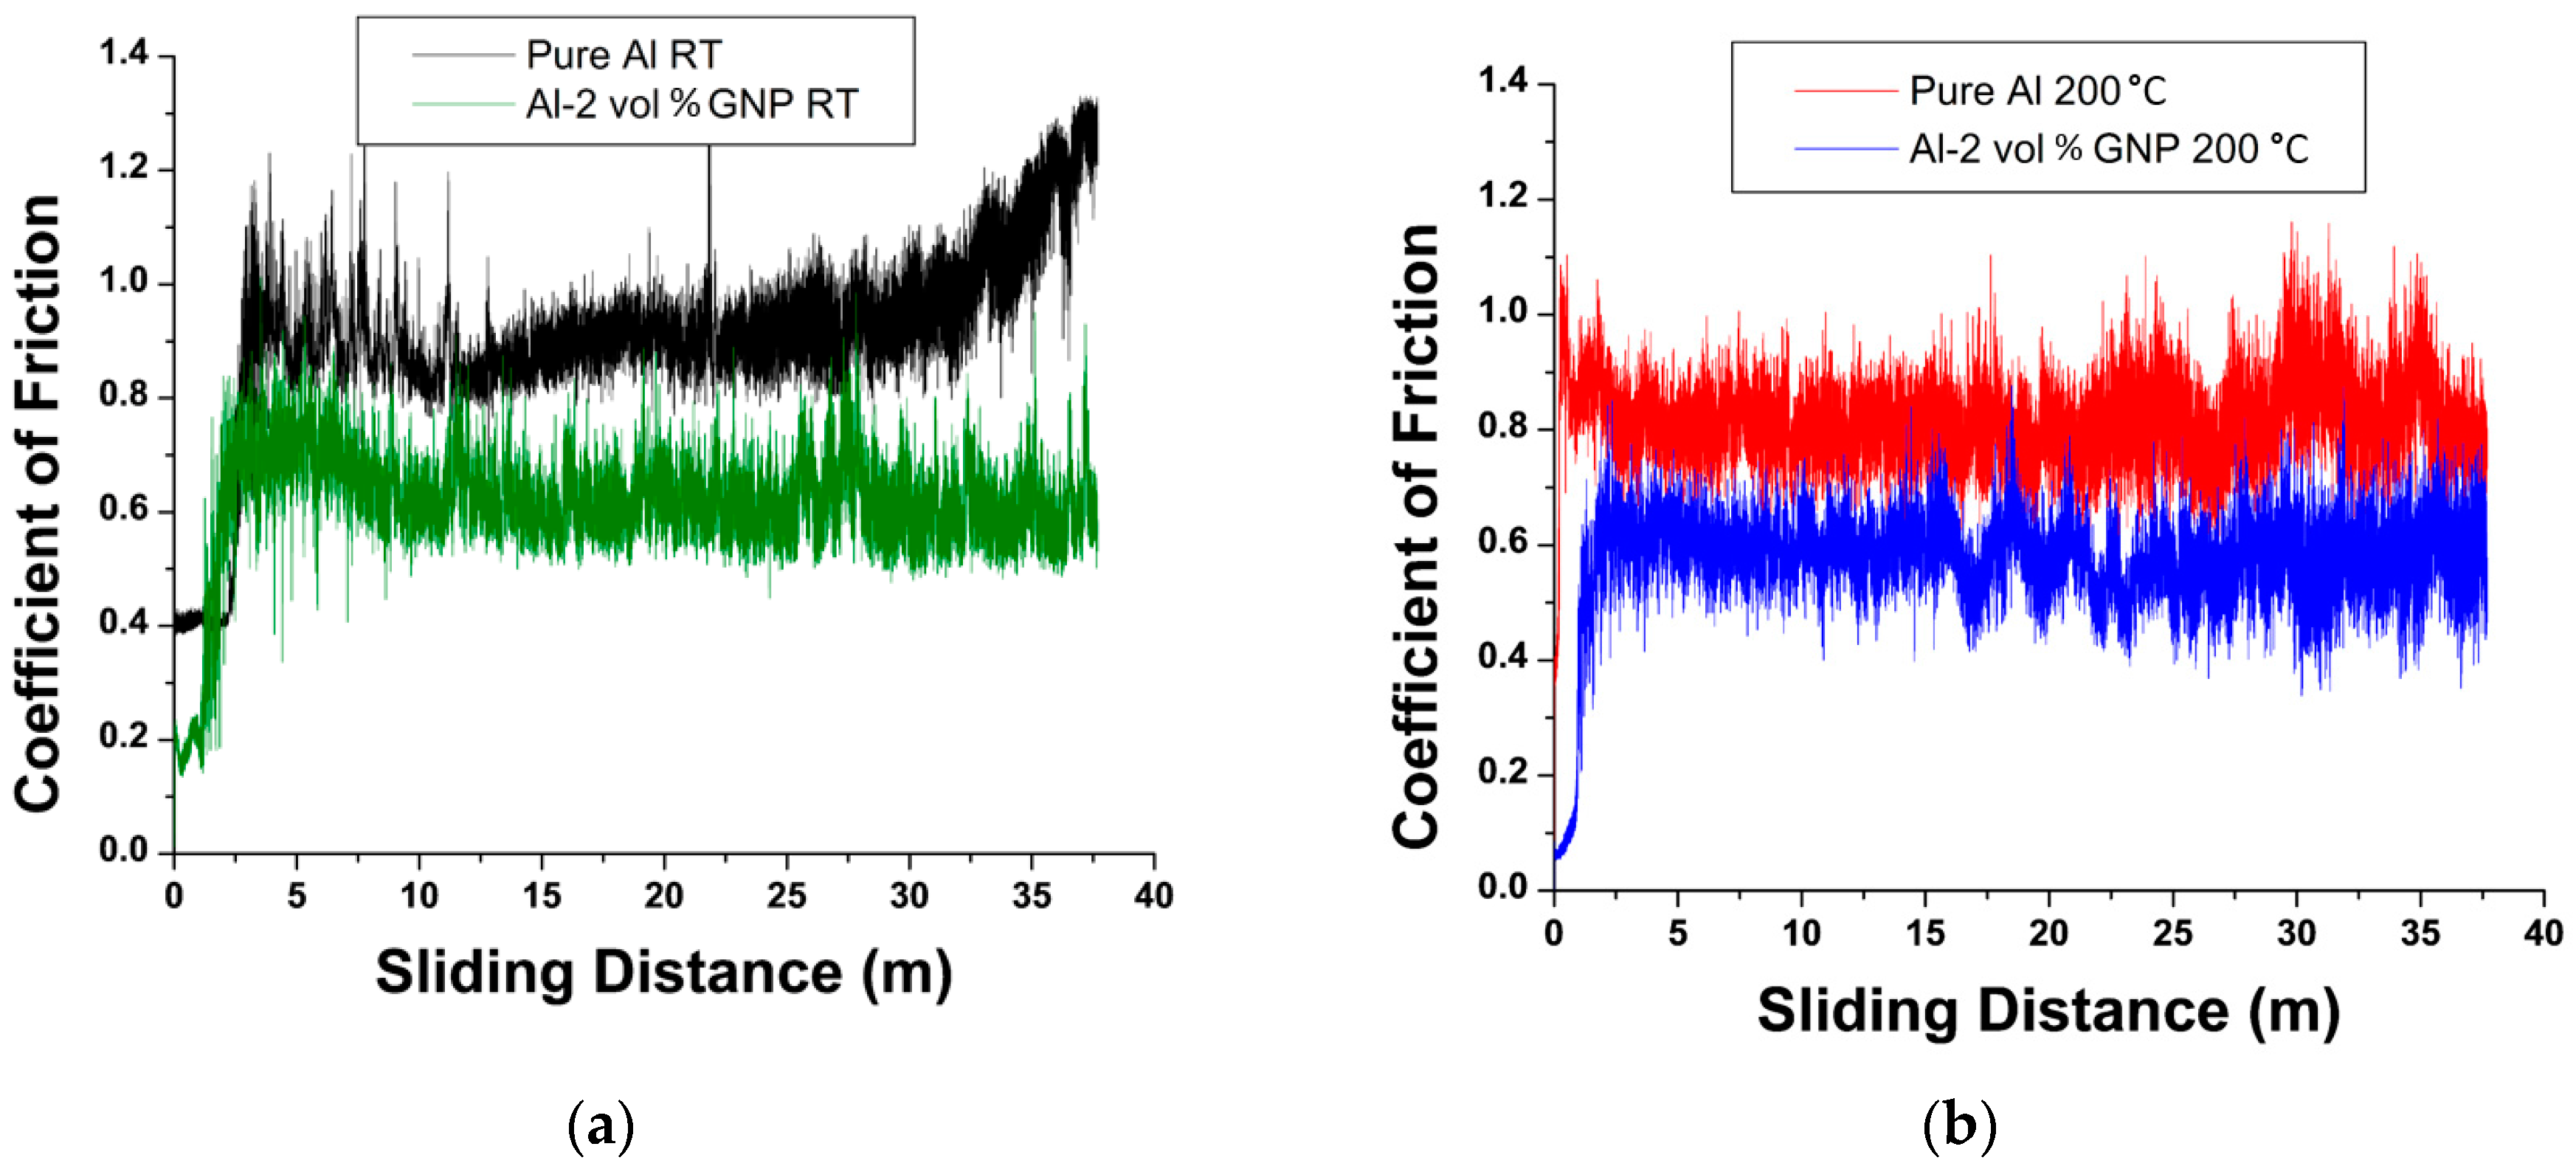
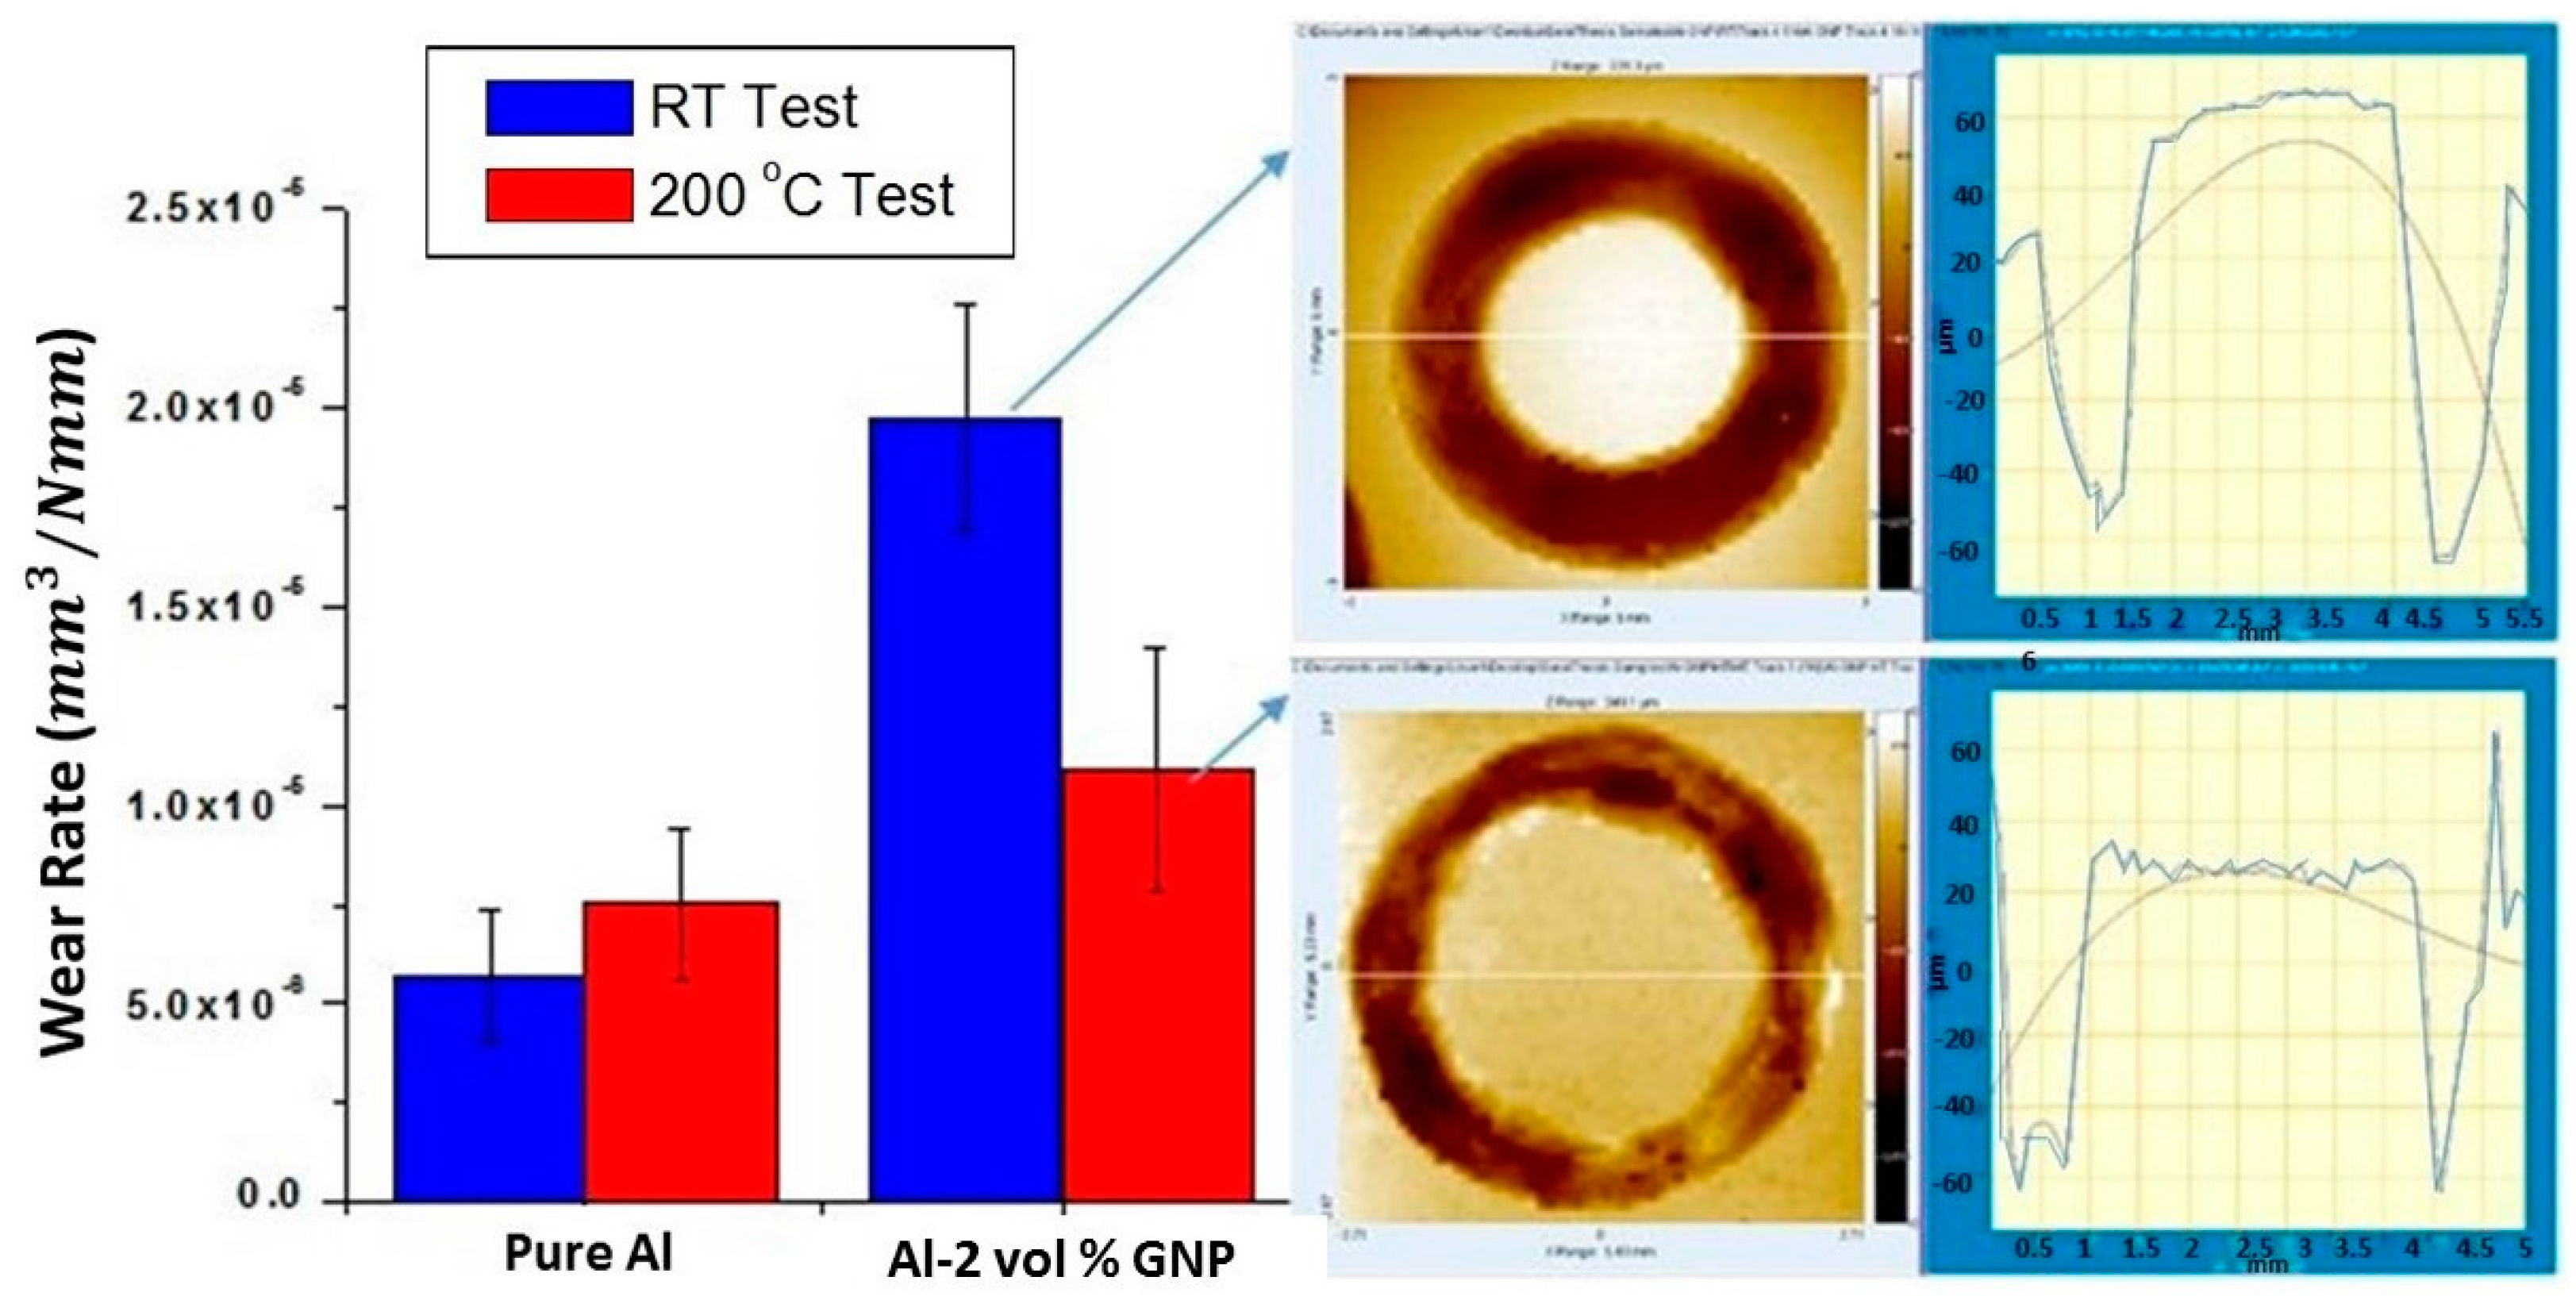
3.2. Wear Rate and Coefficient of Friction

Wear resistance of pure Al and Al-2 vol % GNP is characterized in terms of wear rate ( V S * P ), which is expressed as volume loss (V) divided by the sliding distance (S) and applied normal load (P). Wear track is scanned using an optical profilometer, which provides wear depth and cross-sectional area of the track to enable estimation of wear volume (Figure 5). The wear rates at room temperature and 200 °C are also presented as bar chart in Figure 5. The data for wear rates is also presented in Table 1.
It was observed that Al-2 vol % GNP shows a higher wear rate at both RT and 200 °C, as compared to pure Al. The higher wear rate of Al-2 vol % GNP is attributed to low densification (91%) and low hardness. Archard’s equation illustrates that the harder the material, the better the wear resistance will be [24]:
d V = k P H   d x
In Equation 1, dV is the wear volume loss, P and H are the load and the hardness respectively, k is called the wear resistance factor, and dx is the wear distance. It is well known that materials become softer at higher temperatures, resulting in more wear. However the GNP-containing sample displayed contrary behavior at the high temperature, where the wear rate of Al-2 vol % GNP sample was reduced by 42% at 200 °C when compared to RT. This unique behavior is explained by two phenomenon; (i) localized sintering and densification of 91% dense Al-GNP sample at 200 °C, and (ii) the ability of GNPs to act as sealers against oxygen, which contributes to improving wear [22]. GNPs prevent oxygen ingress into areas located between underlying Al grains and prevent further oxidation. In addition to the wear rate, the coefficient of friction (COF) is the critical parameter to obtain an indirect measurement of energy efficiency in automotive materials.
Figure 6 shows the coefficient of friction (COF) variation during wear. It is observed that aluminum has the highest average COF (0.87) at room temperature. A similar trend is observed for average COF at 200 °C; however COF values are lower than those obtained at room temperature (Table 1). It is worth noting that Al-2 vol % GNP presents an improvement in COF in comparison with pure Al, in spite of having the highest wear rate. This is largely due to the presence of GNP sheets, which act as solid lubricant and contribute to reducing friction.

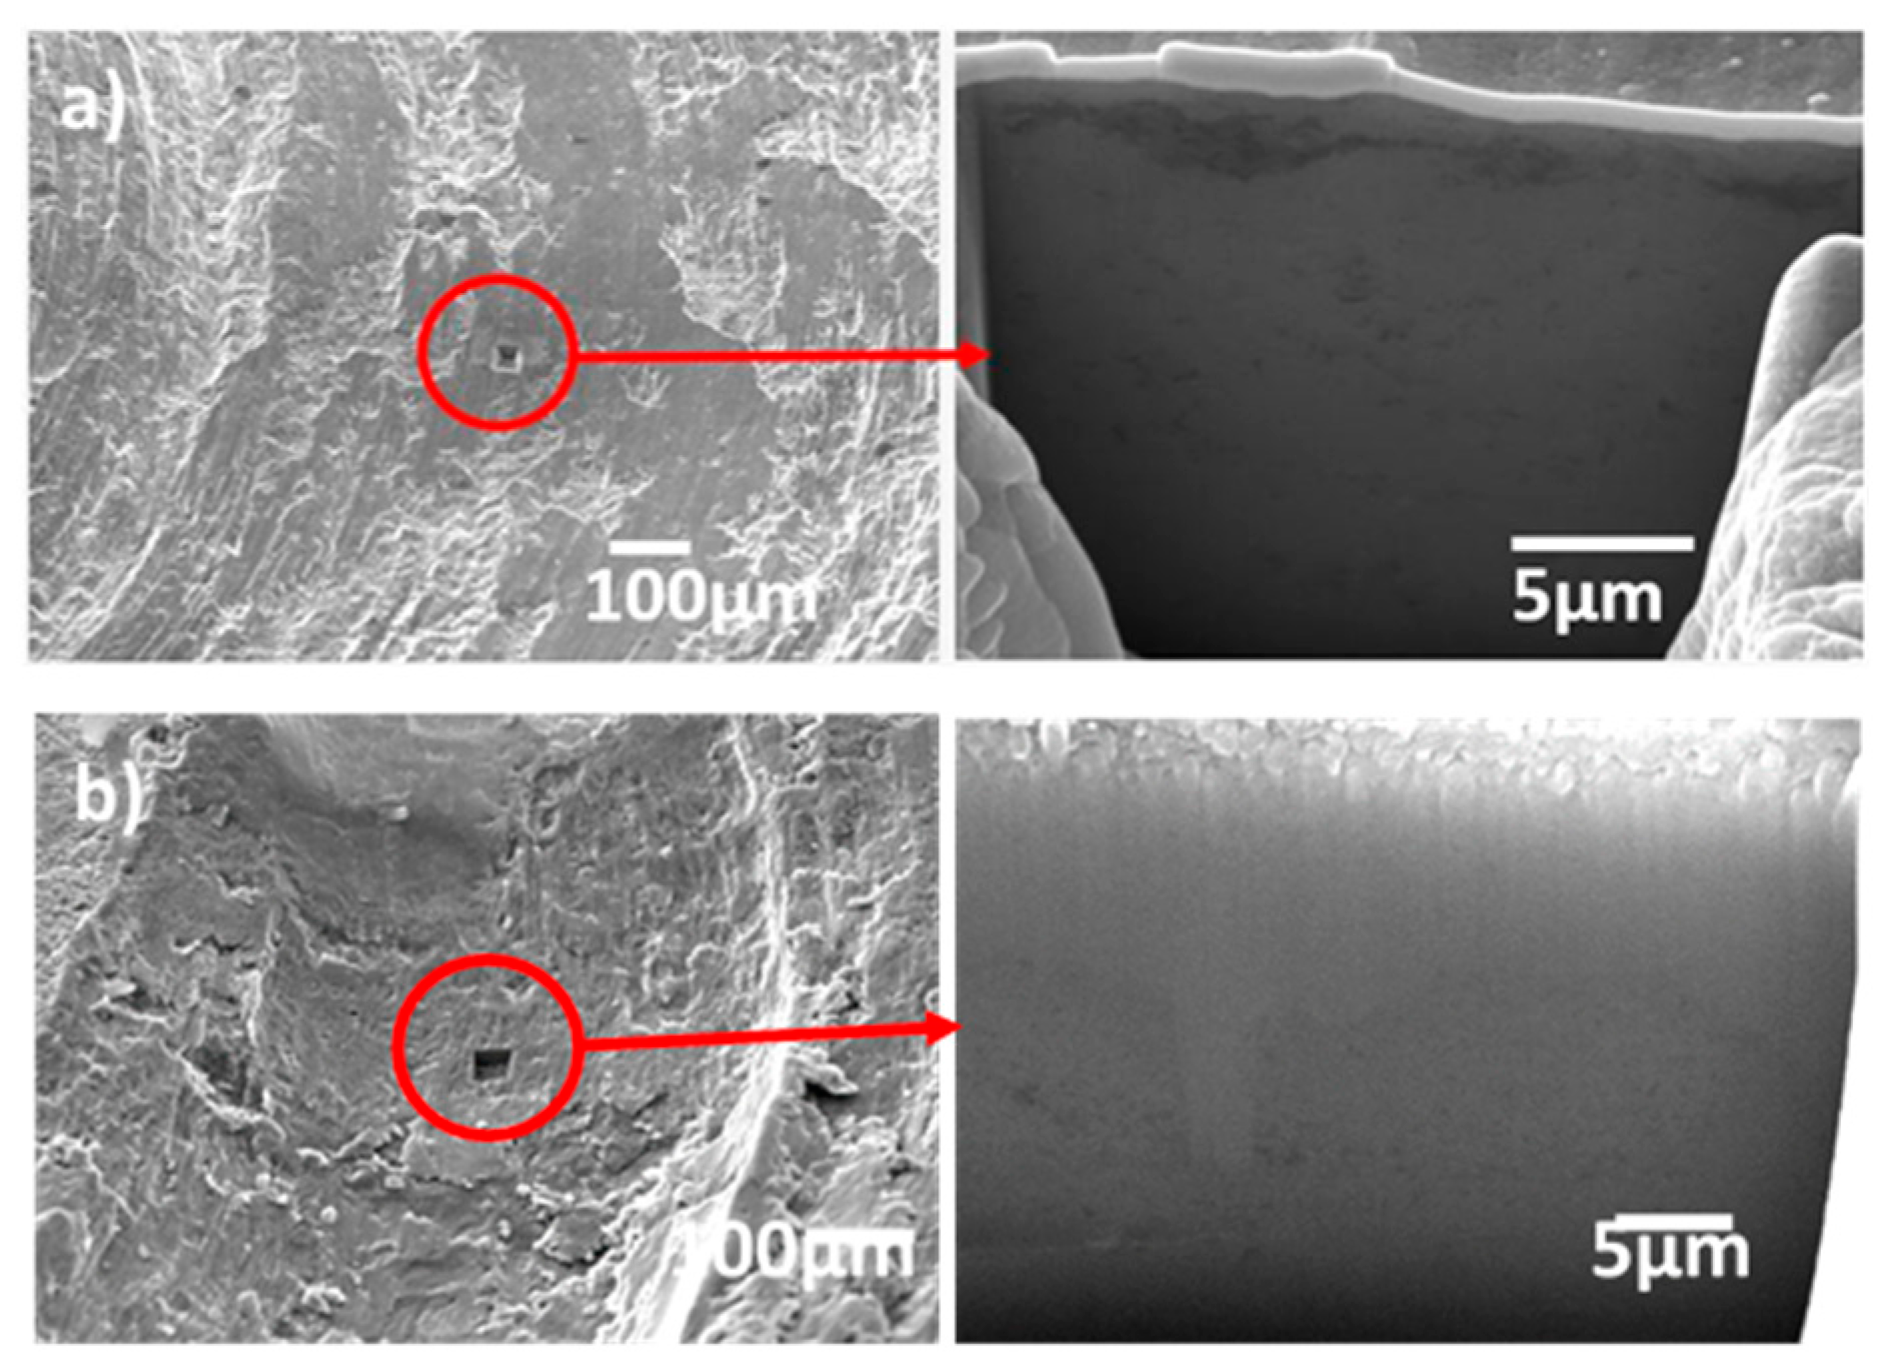
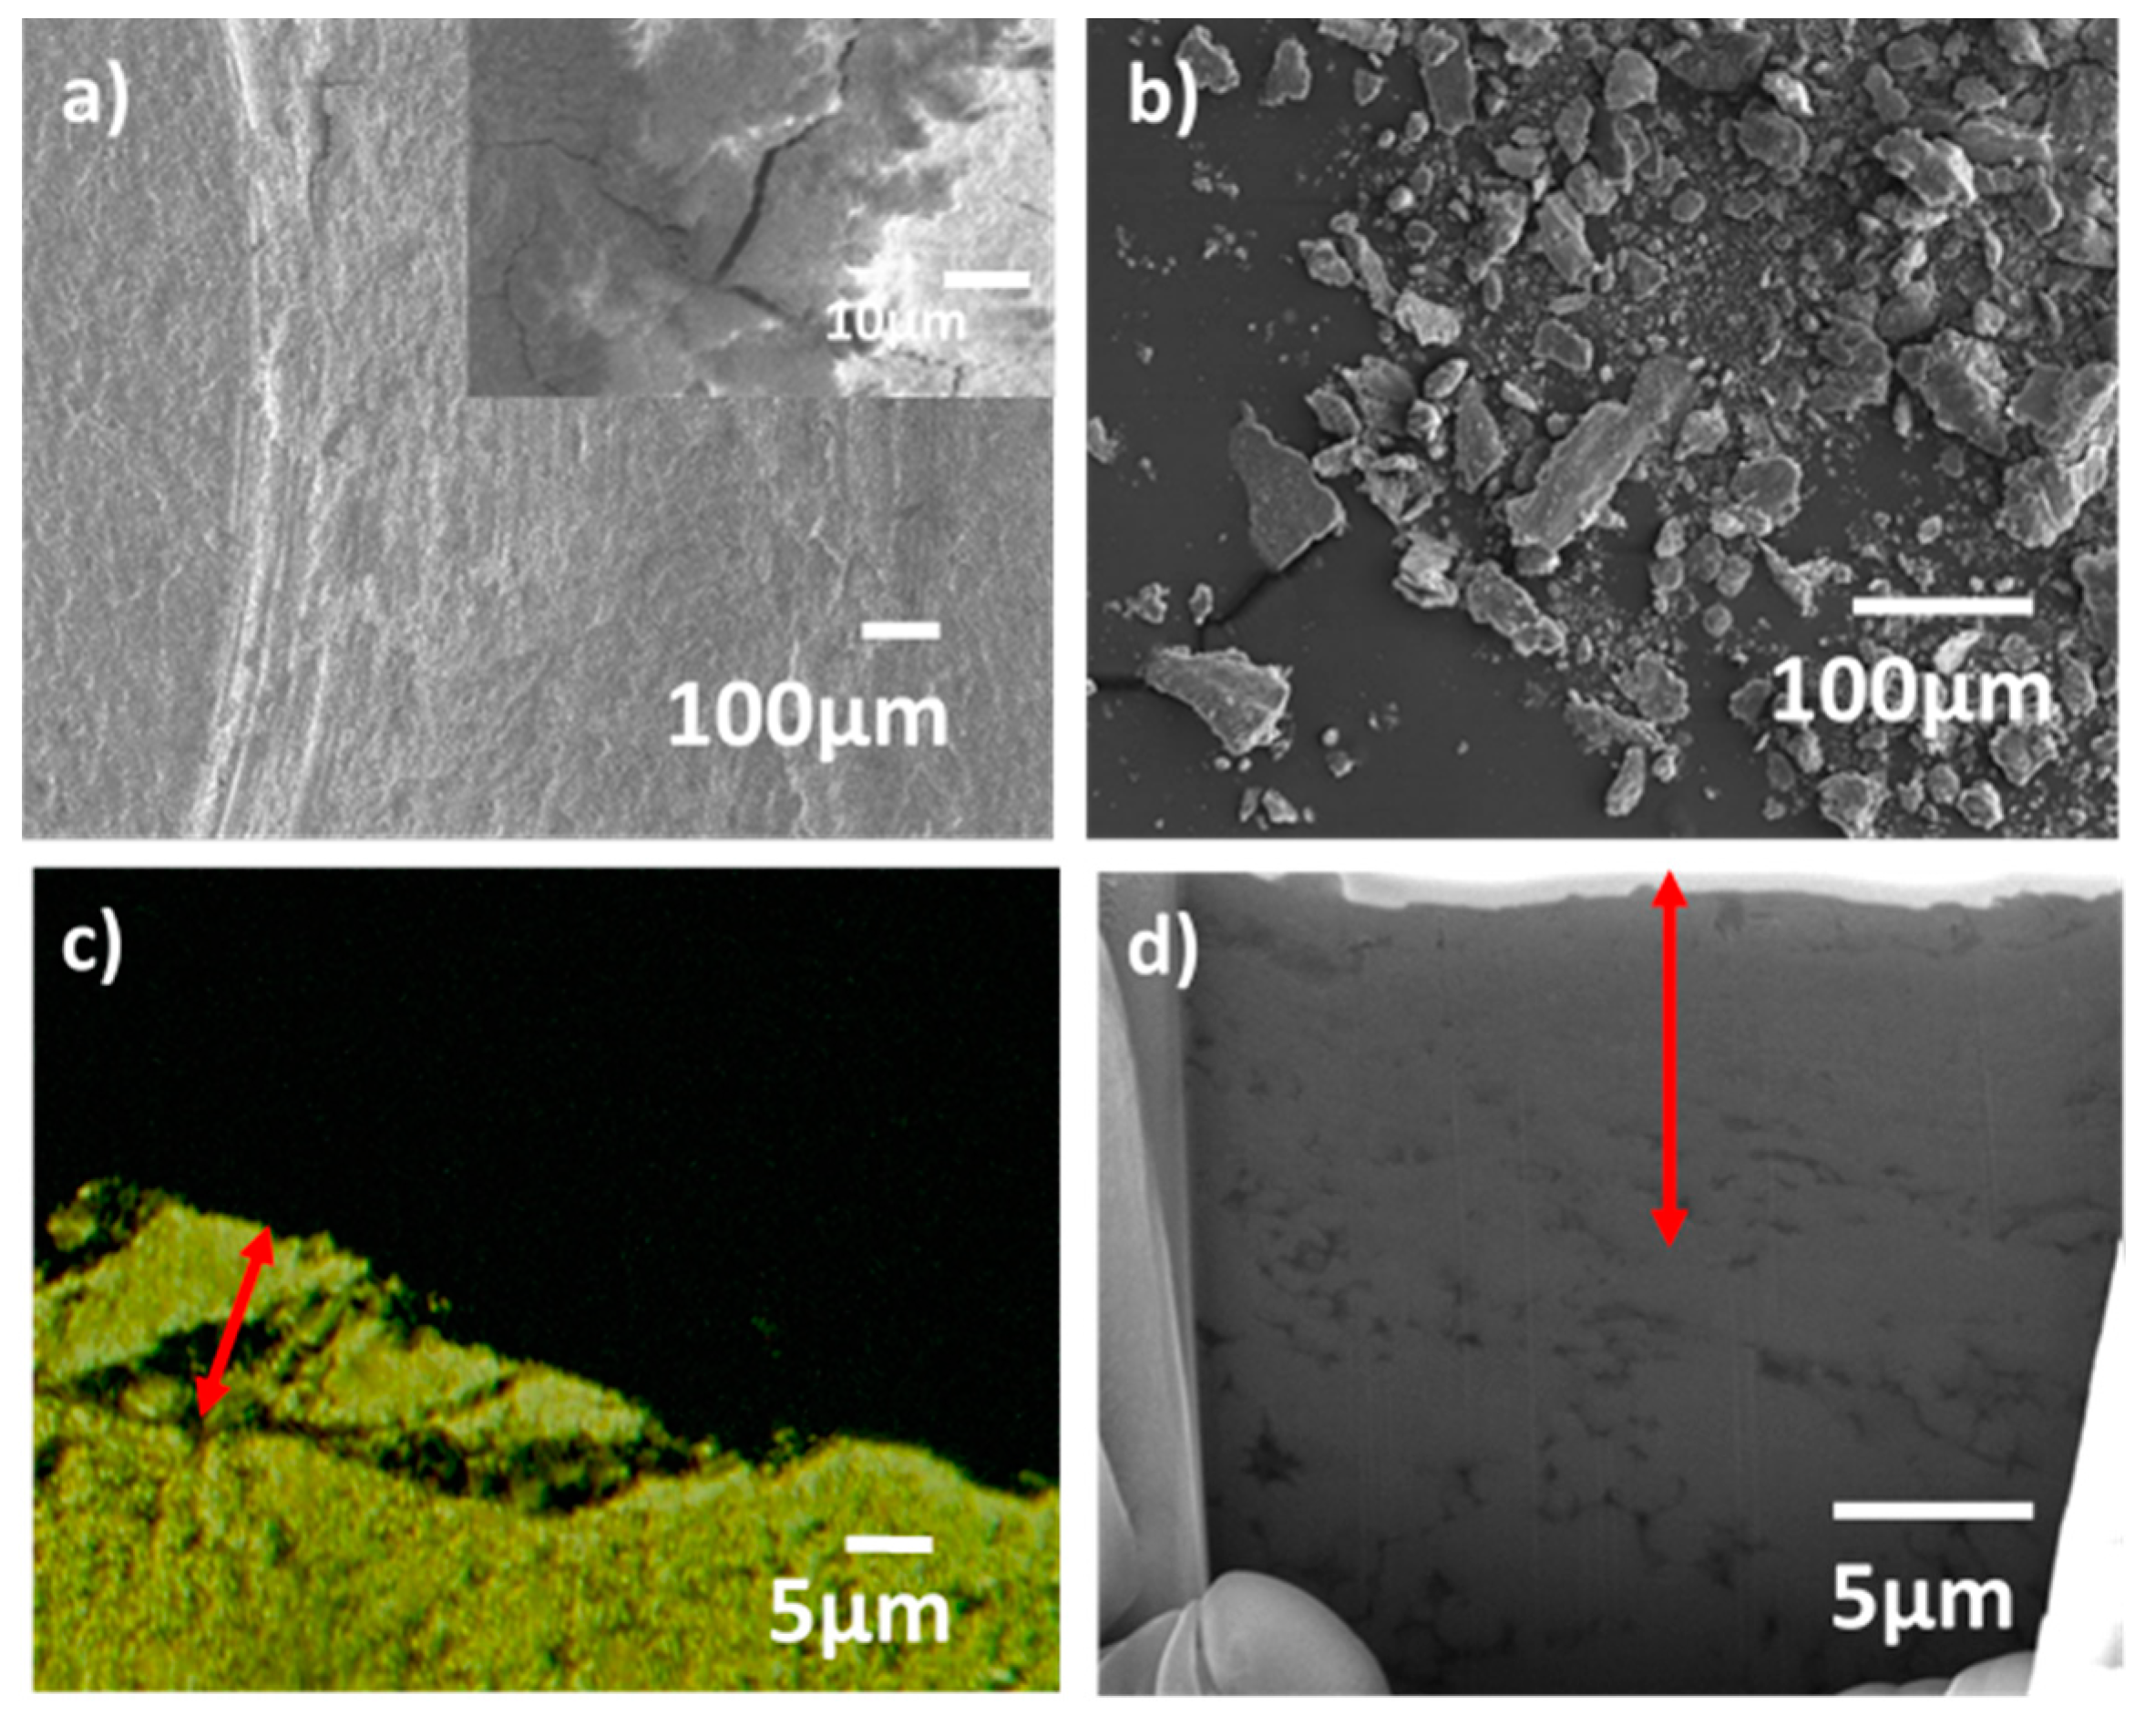
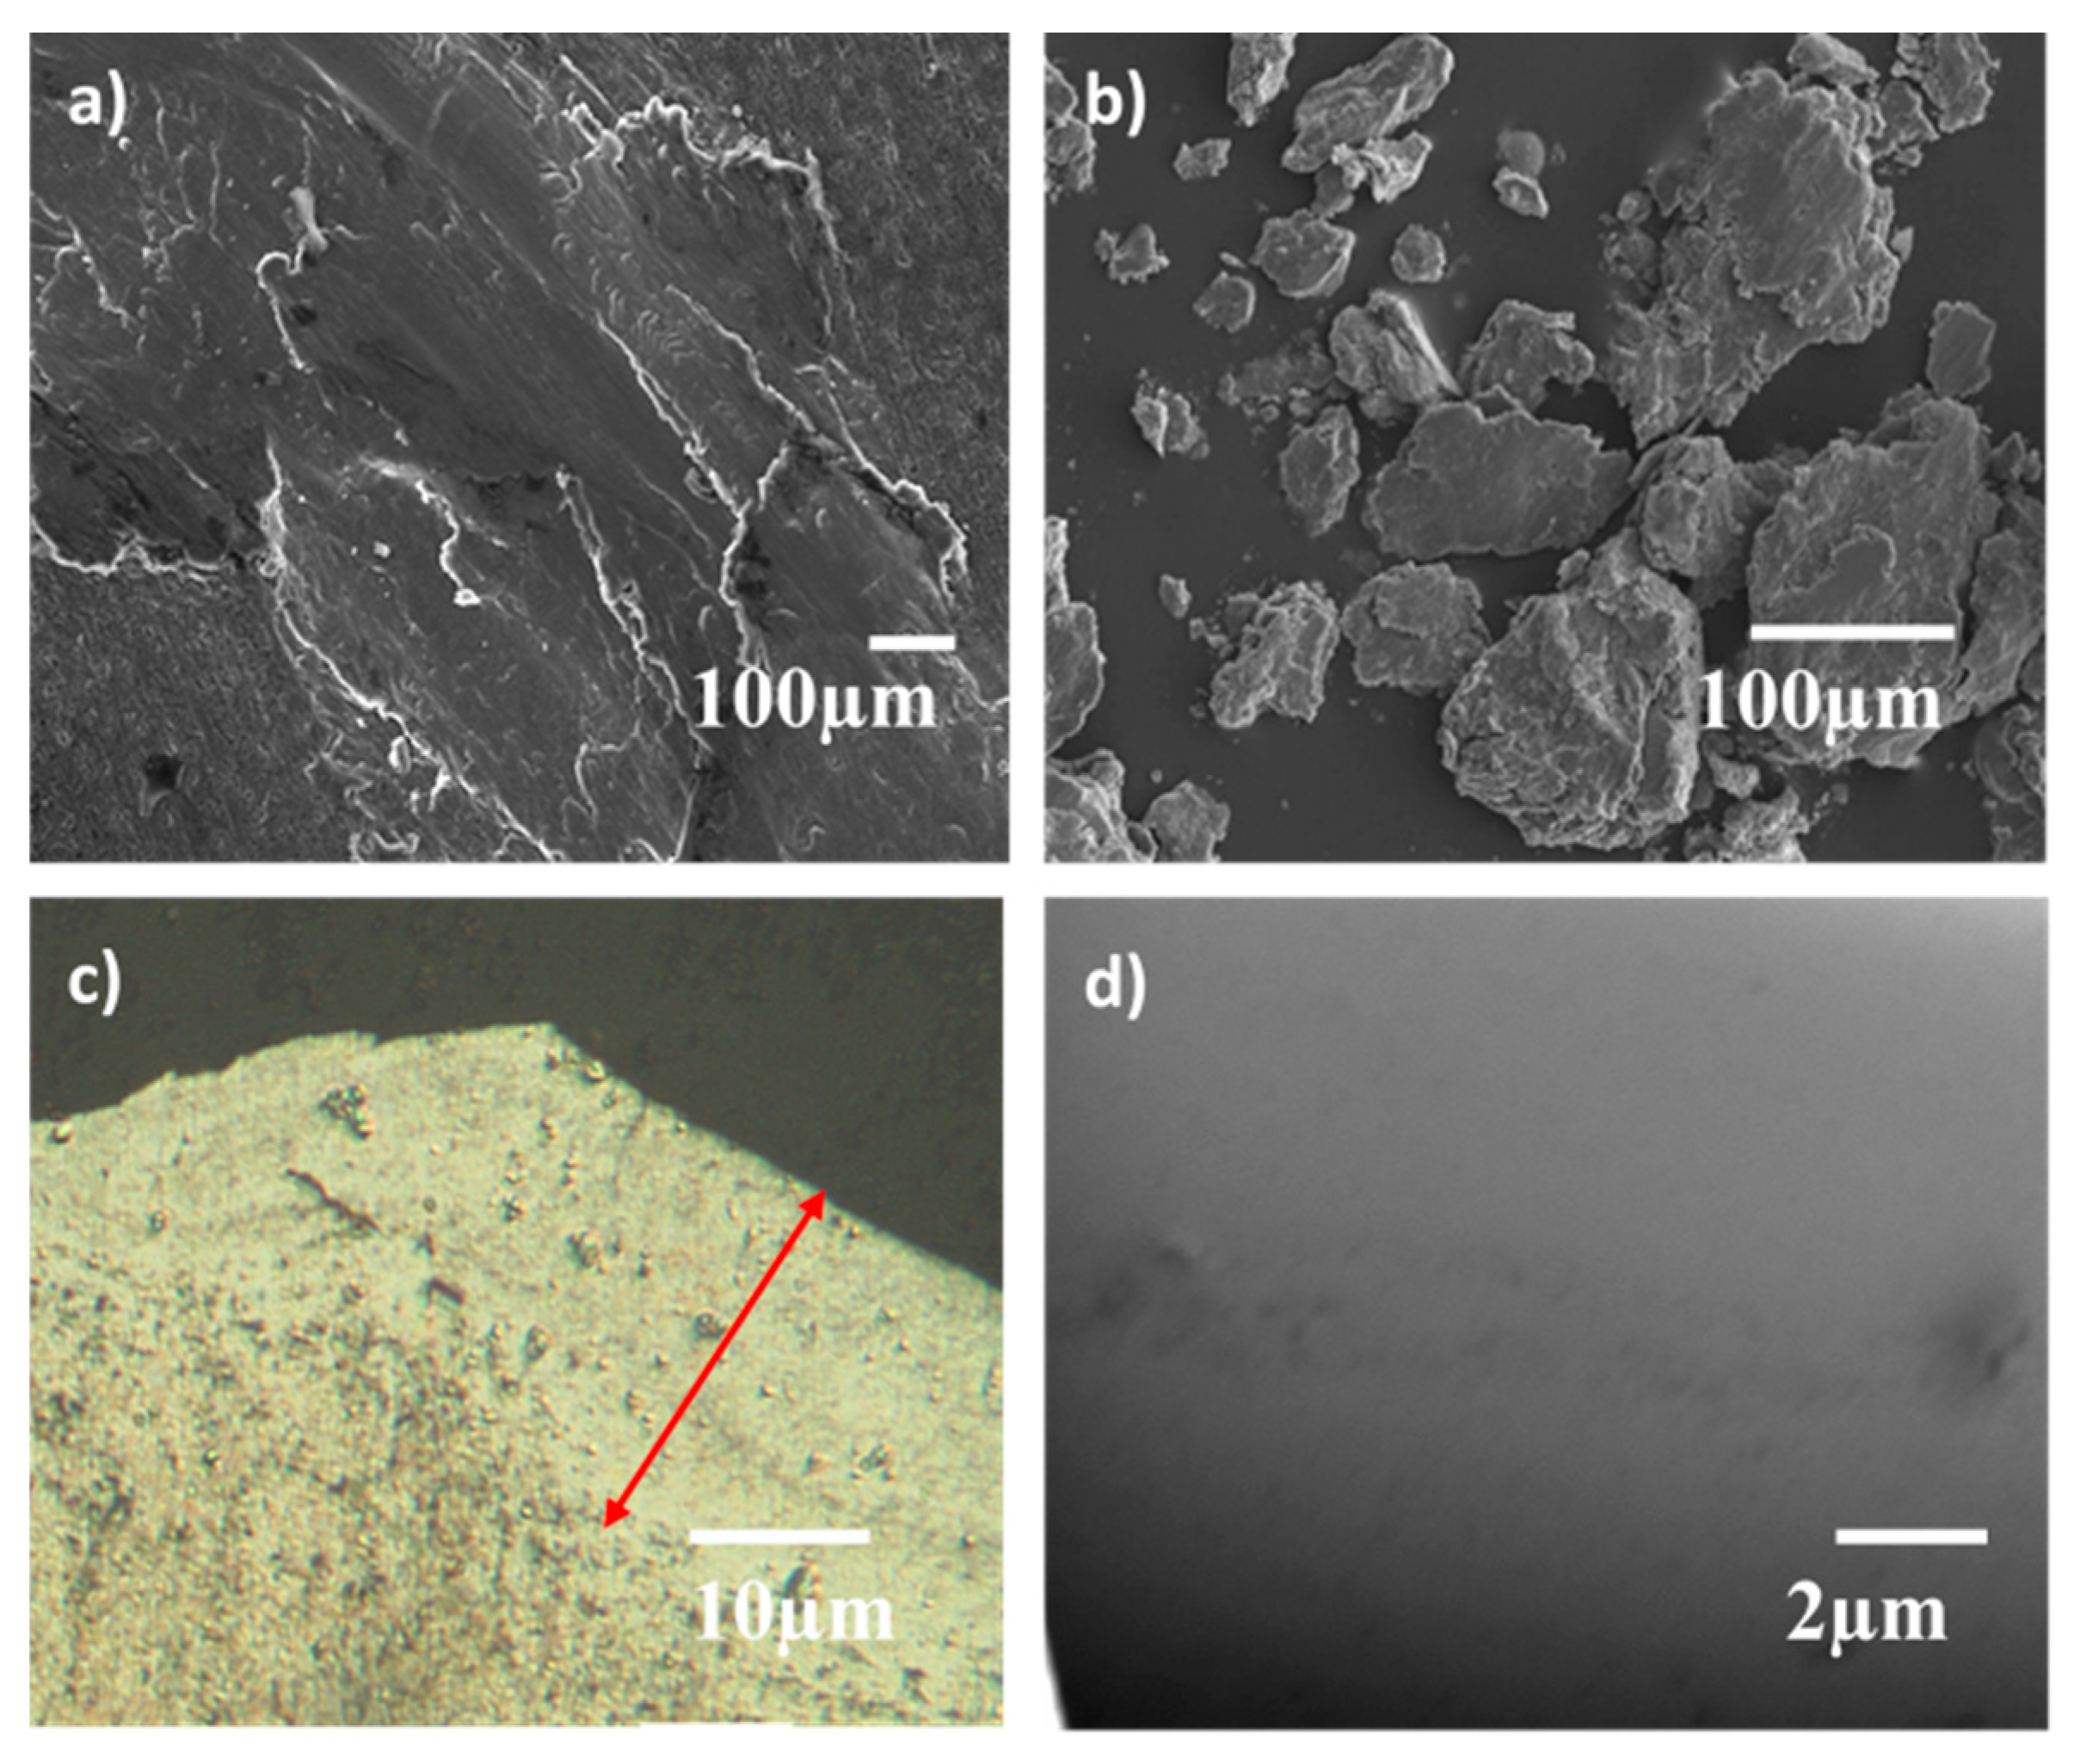
3.3. Wear Mechanism at Room Temperature

A common type of wear in pure Al is adhesive wear [24,25], which occurs when two surfaces are initially rubbed against each other. However, due to localized heating and oxygen diffusion, the surface forms an Al2O3 layer, which is brittle in nature and undergoes abrasive wear. It is expected that the hard and brittle Al2O3 phase will generate large particles of wear debris, thus increasing wear rate and the COF. Figure 7a shows the wear track of pure Al, which is very rough and presents the formation of cracks. The surface of the wear track reveals crack formation and the EDS shows a high amount (31.4 wt %) of oxygen. The brittle Al2O3 surface layer generates a large amount of wear debris (Figure 7b). These wear debris present an average bimodal size distribution of 20 µm and 60 µm. These big detachments reveal adhesive wear for pure Al [25,26], whereas finer debris is indicative of a mixed nature due to presence of brittle Al2O3. Adhesive wear also results in the formation of a tribofilm on the wear surface. The thickness of the tribofilm is in a range of 5–8 µm, as indicated by the red arrow.
The addition of GNPs to an Al matrix is expected to promote the formation of lubricious tribofilm that will reduce the COF of Al composites [27,28]. Figure 8a shows the wear track of Al-2 vol % GNP. The smooth region indicates formation of a tribofilm. However this tribofilm is not homogeneous and contains rough regions, indicating large wear and debris (Figure 8b). The red arrow marks the thickness of the tribofilm, which is ~5 µm (Figure 8c,d). Figure 8c also shows the crack and the beginning of the new tribofilm, formed by deflection as pressure from the counterball is exerted. This tribofilm consists of Al2O3 and Al4C3 in addition to a smooth region of grapheme, as indicated in x-ray diffraction pattern of wear surface (Figure 9). Homogeneous detachments are found as wear debris with an average size of 60 µm (Figure 8b). The GNPs are detached from the surface by delamination and crack propagation (Figure 8c,d). These GNPs undergo high contact stress under the wear counter face and form a tribofilm (Figure 8a). Weak interlayer forces between graphene layers enable sliding or layer buckling to reduce the stress [29]. Hence COF for Al-2 vol % GNP is lower than pure Al.

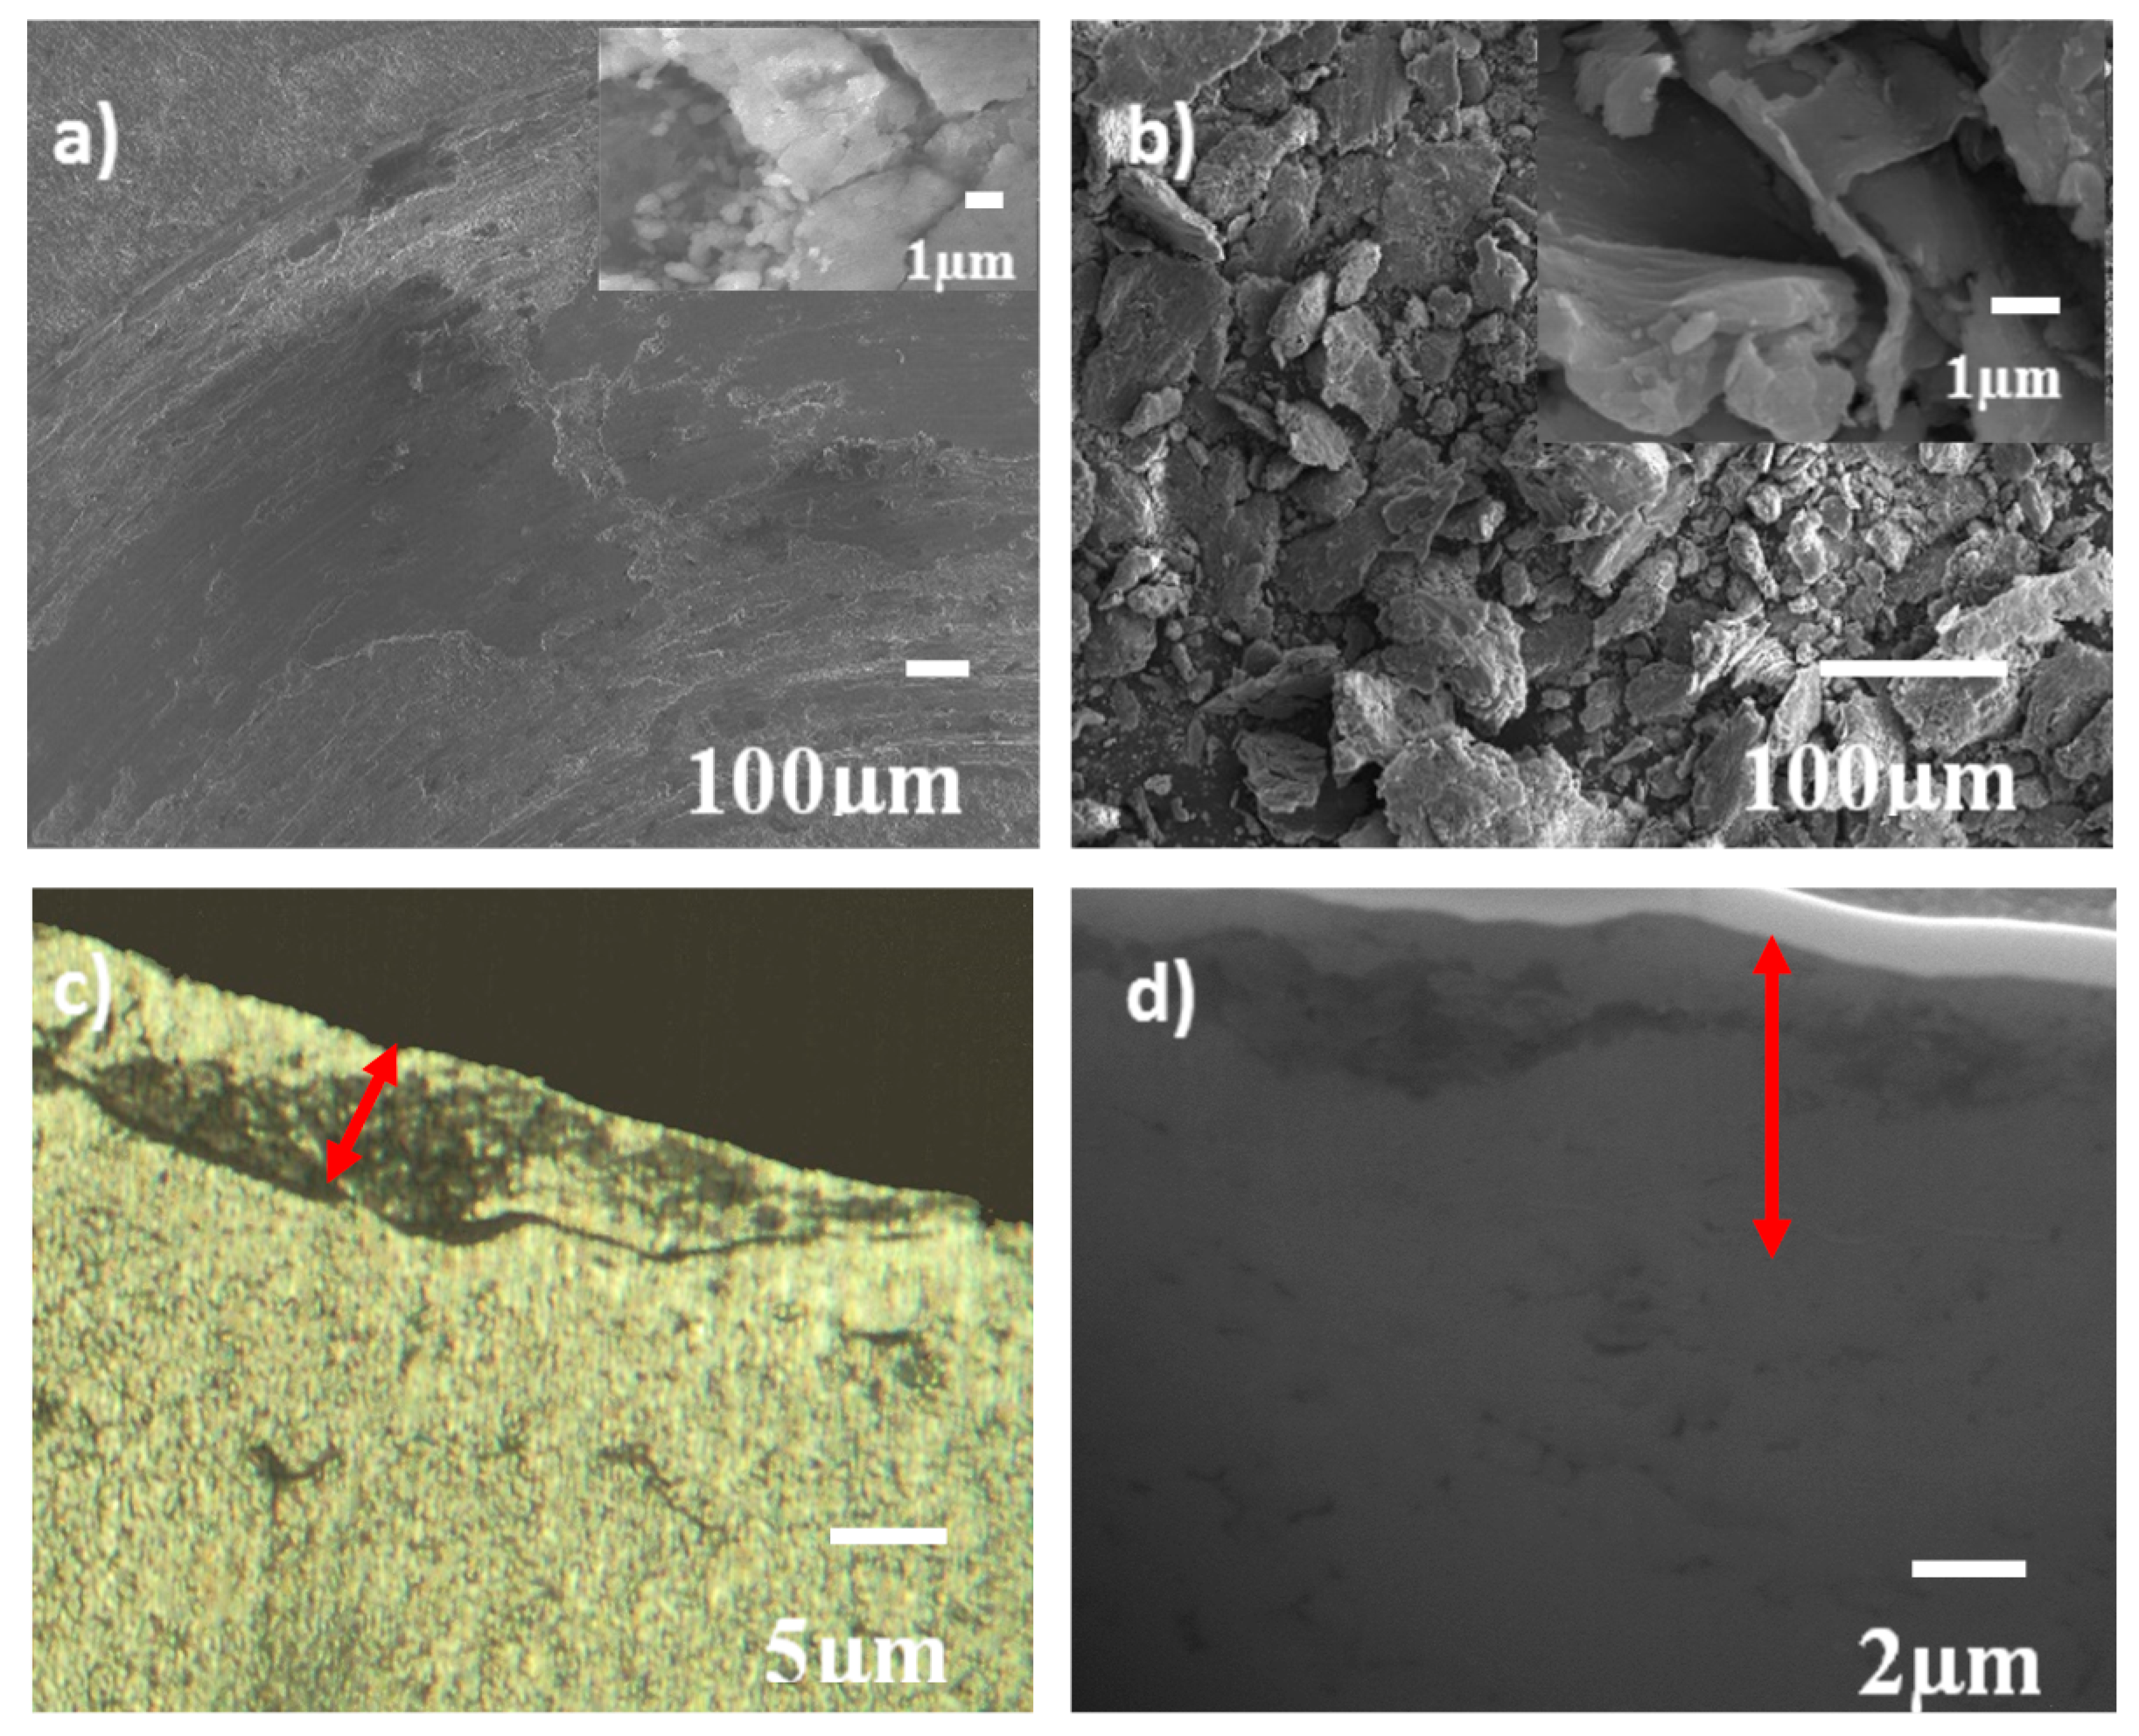
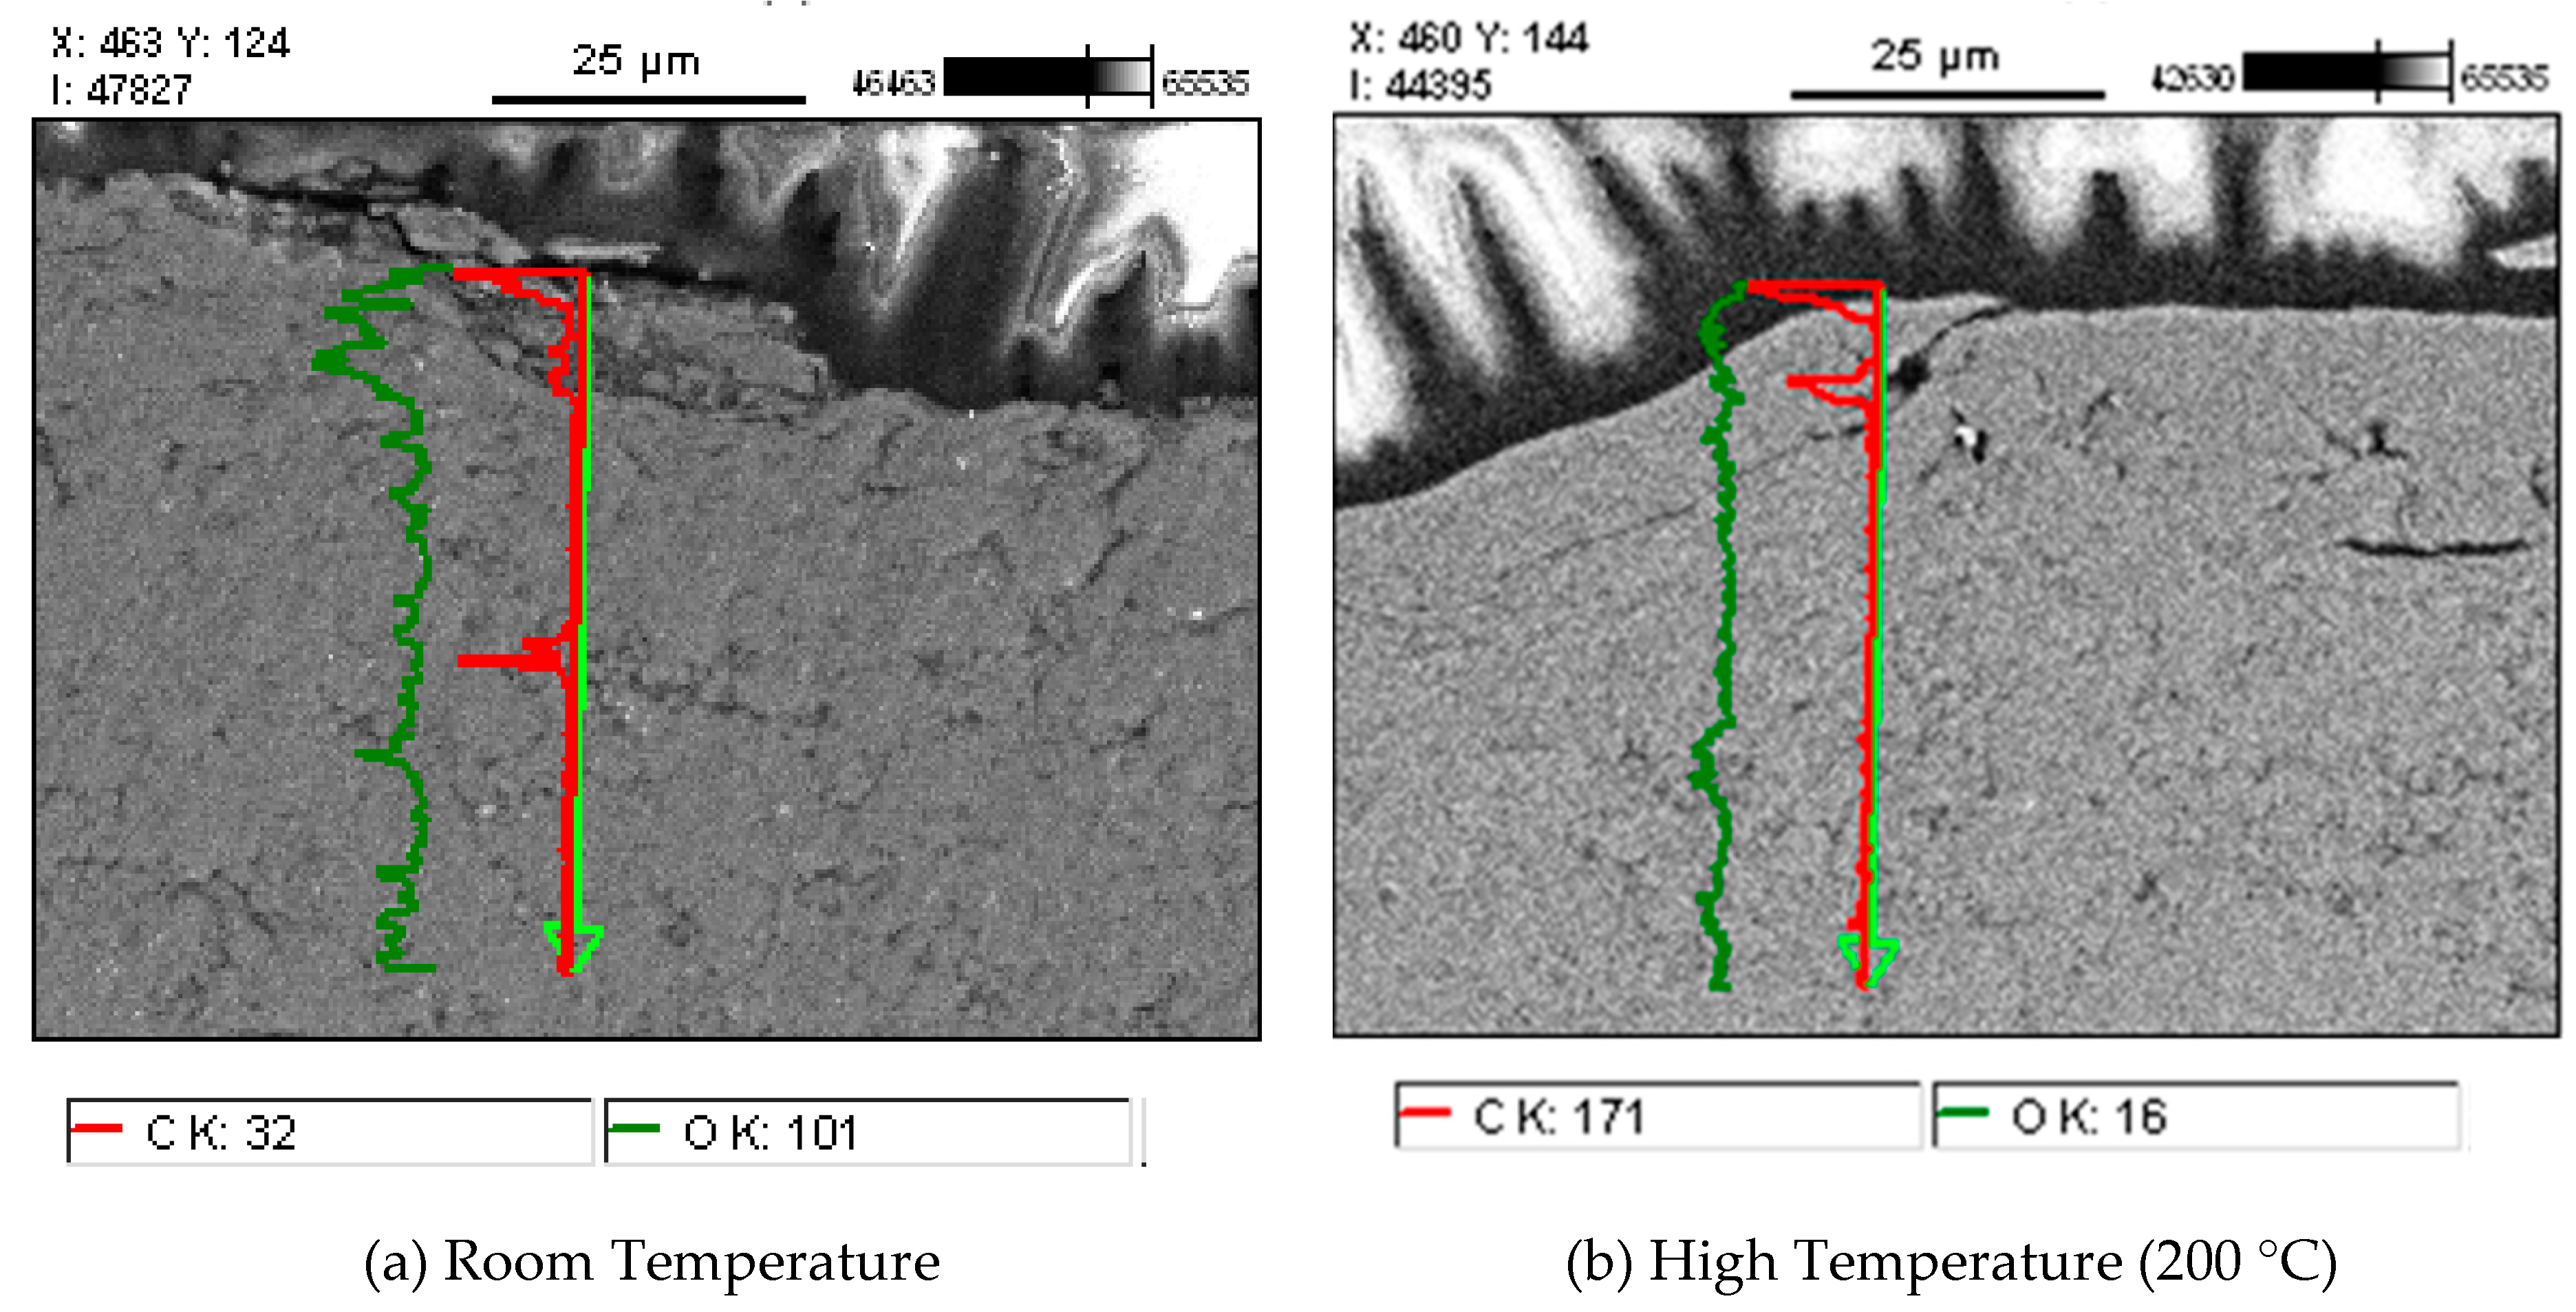
3.4. Wear Mechanisms at 200 °C

It is expected that high temperatures would result in aggressive wear, which is also reflected by the wear rate of pure Al shown in Table 1. Figure 10a shows a smooth wear surface of pure Al, which is due to softening at 200 °C. The wear debris presents some small particles but predominantly is composed of big particles with an average size of ~100 µm. The thickness of the tribofilm is ~15 µm, as pointed out by the red arrow in Figure 10c. The large thickness of the deformed film demonstrates high plastic deformation at 200 °C. No grains or cracks are observed in the higher magnification image of the sub-surface obtained from FIB (Figure 10d). The tribological behavior for the Al-2 vol % GNP at 200 °C showed a lower wear rate as compared to RT (Table 1), which is attributed to role of GNPs as sealers, preventing oxygen diffusion through the grain boundaries [30]. EDS analysis shows that a higher oxygen content (31.2 wt. %) is present on the wear surface of Al-2 vol % GNP, as compared to pure Al (19.6 wt. %).
Figure 11a shows the wear track of Al-2 vol % GNP after a wear test at 200 °C. A smooth surface with mixed layered morphology is observed. The wear debris presents a sheet-like layered structure, allowing it to slip upon the movement of the shear stress (Figure 11b). Thick tribofilm is formed by Al2O3 and Al4C3 phases (Figure 9) that are wrapped by GNP sheets. The thickness of the tribofilm is ~20 µm (Figure 11c), which is the largest observed in this study and it is pointed out by the red arrow. This figure reflects the ability of GNPs (which are the grey lines pointed out by the blue arrow) to act as sealers, being located parallel to the sliding motion.
Figure 12a,b presents the distribution of carbon and oxygen through the cross section of the wear track of Al-2 vol % GNP at RT and 200 °C respectively. It can be clearly seen that oxygen concentration (green line) shows high intensity peaks in the RT sample at greater depth. However the oxygen concentration line is relatively flat in the 200 °C sample, indicating a reduced diffusion of oxygen, which is prevented by the graphene present in the tribofilm. This ability to acti as inhibitors of oxygen helps to reduce wear rate at 200 °C as well as to reduce porosity due to counterball compression.

4. Conclusions

The addition of GNP to Al resulted in the lowering of the coefficient of friction but also lead to poor wear resistance at both RT and 200 °C. Poor wear resistance was attributed to poor densification due to the agglomeration of GNPs, which resulted in insufficient sintering of spherical aluminum powder. However GNPs from the wear debris form a tribofilm on the surface, resulting in a lower COF as compared to pure Al. This is possible due to the slippage of interlayers of GNP, which makes the surface more slippery and, thus, lower in friction. It is recommended that the packing density of the starting powder blend of Al-GNP could be improved by using irregular shaped aluminum powder and both larger and smaller GNPs. This would result in greater densification and improve wear rate while maintaining a low COF.

Acknowledgments

Authors thank Advanced Materials Engineering Research Institute at Florida International University for providing characterization facilities.

Author Contributions

Arvind Agarwal conceived the idea and designed the experiments; Sara Rengifo, Cheng Zhang and Sandip Harimkar performed the experiments; Sara Rengifo, Arvind Agarwal and Benjamin Boesl analyzed the data; Sara Rengifo and Cheng Zhang wrote the paper and Arvind Agarwal revised and edited the text. All authors have read and approved the final manuscript.

Conflicts of Interest

The authors declare no conflict of interest.

References

  1. Holmberg, K.; Andersson, P.; Erdemir, Ali. Global energy consumption due to friction in passenger cars. Tribol. Int. 2012, 47, 221–234. [Google Scholar] [CrossRef]
  2. Evans, C. Strategy for energy conservation through tribology. Amer. Soc. Mech. Engrs. 1977, 6, 170–172. [Google Scholar] [CrossRef]
  3. Blau, P.J. Fifty years of research on the wear of metals. Tribol. Int. 1997, 30, 321–331. [Google Scholar] [CrossRef]
  4. Jirang, C.U.I.; Roven, H.J. Recycling of automotive aluminum. Trans. Nonferrous Met. Soc. China 2010, 20, 2057–2063. [Google Scholar]
  5. Miller, W.S.; Zhuang, L.; Bottema, J.; Wittebrood, A.J.; De Smet, P.; Haszler, A.; Vieregge, A. Recent development in aluminum alloys for the automotive industry. Mater. Sci. Eng. A 2000, 280, 37–49. [Google Scholar] [CrossRef]
  6. Cole, G.S.; Sherman, A.M. Lightweight materials for automotive applications. Mater. Charact. 1995, 1, 3–9. [Google Scholar] [CrossRef]
  7. Hu, Y.-Z.; Ma, T.-B. Tribology of nanostructured surfaces. In Comprehensive Nanoscience and Technology, 1st ed.; Academic Press: Cambridge, MA, USA, 2011; pp. 383–418. [Google Scholar]
  8. Menezes, P.; Nosonovsky, M.; Ingole, S.P.; Kailas, S.V.; Lovell, M.R. Tribology for Scientists and Engineers: From Basics to Advanced Concepts; Springer: Berlin, Germany, 2013. [Google Scholar]
  9. Whitener, K.E.; Sheehan, P.E. Graphene synthesis. Diam. Relat. Mater. 2014, 46, 25–34. [Google Scholar] [CrossRef]
  10. Filleter, T.; McChesney, J.L.; Bostwick, A.; Rotenberg, E.; Emtsev, K.V.; Seyller, T.; Horn, K.; Bennewitz, R. Friction and dissipation in epitaxial graphene films. Phys. Rev. Lett. 2009, 102, 086102. [Google Scholar] [CrossRef] [PubMed]
  11. Bastwros, M.; Kim, G.-Y.; Zhu, C.; Zhang, K.; Wang, S.; Tang, X.; Wang, X. Effect of ball milling on graphene reinforced Al6061 composite fabricated by semi-solid sintering. Composites 2014, 60, 111–118. [Google Scholar] [CrossRef]
  12. Zhai, W.; Shi, X.; Wang, M.; Xu, Z.; Yao, J.; Song, S.; Wang, Y. Grain refinement: A mechanism for graphene nanoplatelets to reduction friction and wear of Ni3Al matrix self-lubricating composites. Wear 2014, 310, 33–40. [Google Scholar] [CrossRef]
  13. Porwal, H.; Tatarko, P.; Saggar, R.; Grasso, S.; Manid, M.K.; Dlouhý, I.; Dusza, J.; Reece, M.J. Tribological properties of silica-graphene nano-platelet composites. Ceram. Int. 2014, 40, 12067–12074. [Google Scholar] [CrossRef]
  14. Das, A.; Harimkar, S.P. Effect of graphene nanoplate and silicon carbide nanoparticle reinforcement on mechanical and tribological properties of spark plasma sintered magnesium matrix composites. J. Mater. Sci. Technol. 2014, 30, 1059–1070. [Google Scholar] [CrossRef]
  15. Moghadam, A.D.; Omrani, E.; Menezes, P.L.; Rohatgi, P.K. Mechanical and tribological properties of self-lubricating metal matrix nanocomposites reinforced by carbon nanotubes (CNTs) and graphene—A review. Composites 2015, 77, 402–420. [Google Scholar] [CrossRef]
  16. Bartolucci, S.F.; Paras, J.; Rafiee, M.A.; Rafiee, J.; Lee, S.; Kapoor, D.; Koratkar, N. Graphene–aluminum nanocomposites. Mater. Sci. Eng. A 2011, 528, 7933–7937. [Google Scholar] [CrossRef]
  17. Pu, J.; Wan, S.; Zhao, W.; Mo, Y.; Zhang, X.; Wang, L.; Xue, Q. Preparation and tribological study of functionalized graphene nanocomposite ultrathin lubrication films on si substrates. J. Phys. Chem. C 2011, 115, 13275–13284. [Google Scholar] [CrossRef]
  18. Tabandeh-Khorshid, M.; Omrani, E.; Menezes, P.L.; Rohatgi, P.K. Tribological performance of self-lubricating aluminum matrix nanocomposites: Role of graphene nanoplatelets. Int. J. Eng. Sci. Technol. 2016, 19, 463–469. [Google Scholar] [CrossRef]
  19. Nieto, A.; Bisht, A.; Zhang, C.; Lahiri, D.; Agarwal, A. Graphene reinforced metal and ceramic composites—A Review. Int. Mater. Rev. 2016. [Google Scholar] [CrossRef]
  20. Priest, M.; Taylor, C.M. Automobile engine tribology—approaching the surface. Wear 2000, 241, 193–203. [Google Scholar] [CrossRef]
  21. Priest, M.; Dowson, D.; Taylor, C.M. Predictive wear modelling of lubricated piston rings in a diesel engine. Wear 1999, 231, 89–101. [Google Scholar] [CrossRef]
  22. Donnet, C.; Erdemir, A. Historical developments and new trends in tribological and solid lubricant coatings. Surf. Coat. Technol. 2004, 180–181, 76–84. [Google Scholar] [CrossRef]
  23. Sandoz-Rosado, E.J. The Tribological Behavior of Graphene and Its Role as a Protective Coating. Ph.D. Thesis, Columbia University, New York, NY, USA, 2013. [Google Scholar]
  24. Archard, J.F. Contact and rubbing of flat surfaces. J. Appl. Phys. 1953, 8, 981–988. [Google Scholar] [CrossRef]
  25. Deuis, R.L.; Subramanian, C.; Yellup, J.M. Dry sliding wear of aluminum composites-A review. Compos. Sci. Technol. 1997, 57, 415–435. [Google Scholar] [CrossRef]
  26. Stachowiak, G.W.; Batchelor, A.W.; Stachowiak, G. Experimental Methods in Tribology; (Tribology Series) Elsevier: Amsterdam, Netherlands, 2004. [Google Scholar]
  27. Ratoi, M.; Niste, V.B.; Walker, J.; Zekonyte, J. Mechanism of action of WS2 lubricant nanoadditives in high preassure contacts. Tribol. Lett. 2013, 52, 81–91. [Google Scholar] [CrossRef]
  28. Iwai, Y.; Yoneda, H.; Honda, T. Sliding wear behavior of Sic whisker-reinforced aluminum composite. Wear 1995, 181–183, 594–602. [Google Scholar] [CrossRef]
  29. Kuo, W.-S.; Tai, N.-H.; Chang, T.-W. Deformation and fracture in graphene nanosheets. Composites 2013, 51, 56–61. [Google Scholar] [CrossRef]
  30. Nieto, A.; Kumar, A.; Lahiri, D.; Zhang, C.; Seal, S.; Agarwal, A. Oxidation behavior of graphene nanoplatelets reinforced tantalum carbide composites in high temperature plasma flow. Carbon 2014, 67, 398–408. [Google Scholar] [CrossRef]
Figure 1. FIB image of trench on the wear track and subsurface of Al-2 vol % GNP after (a) RT Test and (b) 200 °C Test.
Technologies 05 00004 g001
Figure 2. SEM micrograph showing (a) starting spherical Aluminum powder and (b) Graphene nanoplatelets (GNPs).
Technologies 05 00004 g002
Figure 3. SEM images of the fracture surface of sintered (a) pure Al and (b) Al-2 vol % GNP. (c) X-ray diffraction of the sintered pellets.
Technologies 05 00004 g003
Figure 4. Raman scattering spectrum of the as-received GNP and sintered Al-2 vol % GNP pellets.
Technologies 05 00004 g004
Figure 5. Wear rate at room temperature and 200 °C for all samples.
Technologies 05 00004 g005
Figure 6. Coefficient of friction (COF) for pure Al and Al-2 vol % GNP at (a) RT and (b) 200 °C.
Technologies 05 00004 g006
Figure 7. SEM images of the pure Al (RT): (a) wear track and (b) wear debris, (c) Optical micrograph of the sub-surface of the wear track, (d) FIB image of the sub-surface of the wear track.
Technologies 05 00004 g007
Figure 8. SEM images of the Al-2 vol % GNP (RT) (a) wear track and (b) wear debris, (c) Optical micrograph of the sub-surface of the wear track, (d) FIB image of the sub-surface of the wear track.
Technologies 05 00004 g008
Figure 9. XRD after SPS, RT Test and HT Test for (a) Pure Al, (b) Al-2 vol % GNP.
Technologies 05 00004 g009
Figure 10. SEM images of the pure Al sample (200 °C): (a) wear track and (b) wear debris, (c) Optical micrograph of the sub-surface of the wear track, (d) FIB image of the sub-surface of the wear track.
Technologies 05 00004 g010
Figure 11. SEM micrographs of the Al- 2 vol %GNP sample (200 °C), showing (a) wear track and (b) wear debris, (c) Optical micrograph of the sub-surface of the wear track, (d) FIB image of the sub-surface of the wear track.
Technologies 05 00004 g011
Figure 12. Cross sectional SEM image and Energy Dispersive Spectroscopy (EDS) analysis showing carbon and oxygen distribution below the wear track of Al-2 vol % GNP sample: (a) RT and (b) 200 °C.
Technologies 05 00004 g012
Table 1. Wear Rate and Coefficient of Friction (COF) of Sintered Pellets at RT and 200 °C.
SampleWear Rate*-RTWear Rate*-200 °CCOF-RTCOF-200 °C
Pure Al5.7 ± 1.67.5 ± 1.90.87 ± 0.040.82 ± 0.03
Al-2 vol % GNP19 ± 0.211 ± 0.30.79 ± 0.090.69 ± 0.10
* Units of Wear rate are (mm3/Nmm) × 10−6.

