Article

Characterization of a Large, Low-Cost 3D Scanner

1
Department of Computer Science, University of North Dakota, 3950 Campus Road, Stop 9015, Grand Forks, ND 58202, USA
2
Department of Mechanical Engineering, University of North Dakota, 243 Centennial Drive, Stop 8359, Grand Forks, ND 58202, USA
*
Author to whom correspondence should be addressed.
Technologies 2015, 3(1), 19-36; https://doi.org/10.3390/technologies3010019
Submission received: 18 August 2014 / Revised: 30 December 2014 / Accepted: 16 January 2015 / Published: 30 January 2015

Abstract

:
Imagery-based 3D scanning can be performed by scanners with multiple form factors, ranging from small and inexpensive scanners requiring manual movement around a stationary object to large freestanding (nearly) instantaneous units. Small mobile units are problematic for use in scanning living creatures, which may be unwilling or unable to (or for the very young and animals, unaware of the need to) hold a fixed position for an extended period of time. Alternately, very high cost scanners that can capture a complete scan within a few seconds are available, but they are cost prohibitive for some applications. This paper seeks to assess the performance of a large, low-cost 3D scanner, presented in prior work, which is able to concurrently capture imagery from all around an object. It provides the capabilities of the large, freestanding units at a price point akin to the smaller, mobile ones. This allows access to 3D scanning technology (particularly for applications requiring instantaneous imaging) at a lower cost. Problematically, prior analysis of the scanner’s performance was extremely limited. This paper characterizes the efficacy of the scanner for scanning both inanimate objects and humans. Given the importance of lighting to visible light scanning systems, the scanner’s performance under multiple lighting configurations is evaluated, characterizing its sensitivity to lighting design.

1. Introduction

Three-dimensional (3D) scanning allows objects in the real world to be digitized for use within or by computer software. Multiple approaches to 3D scanning exist, including laser- and imagery-based scanning techniques. Laser-based systems are available from numerous vendors; however, their cost is significant. Imagery-based systems are also available and range between low-cost and generally low-quality and expensive, higher-quality units. Many of the low-cost solutions require an operator to move the scanner around an object (or individual), making them unsuitable for applications that require quick imaging or where a subject is not willing to, not aware of the need to or not able to remain in a stationary position. Prior work [1] presented a freestanding and low-cost, imagery-based 3D scanner that was constructed using approximately 50 Raspberry Pi computer boards, mounted to a chassis. This system, producible for a parts cost of about $5000, provides capabilities that rival, in regards to multiple characteristics, the performance of systems in the $200,000 or greater range. It generates 250 megapixels of scan data and can capture a scan of a large object in seconds. The prior work that discussed the design and construction of the scanner, however, presented an extremely limited assessment of the scanner’s performance.
This paper begins the process of assessing the performance of the 3D scanner and, based on this, its efficacy for various applications. To this end, the utility of the scanner for characterizing both inanimate objects and humans is assessed. Its accuracy of digital object model creation is assessed qualitatively, for both inanimate objects and humans, and multiple scan examples are presented, facilitating visual qualitative assessment. For inanimate objects, key dimensions of the object are measured and compared to real-world measurements. For human scans, arbitrary points were selected (and marked) to facilitate the comparison of scanner and real-world point-to-point distance values. This work demonstrates the scanner’s prospective viability for a wide variety of applications. Due to the paramount importance of lighting to visible light scanning, the impact of multiple lighting conditions is assessed. This work demonstrated the impact of lighting on scanner performance and the ease of altering lighting to achieve suitable performance. In addition to informing future work with lighting condition impact information, this work facilitates the assessment of the efficacy of the use of the system in environments with particular pre-existing (and non-changeable) lighting conditions. Based on the characterization of scanner accuracy and quality performed, the paper concludes with a discussion of potential uses for the scanner and its efficacy for each.

2. Background

The work presented in this paper draws from significant prior work in multiple areas. This section discusses relevant work related to three topics. First, an overview of three-dimensional scanning, in general, and a brief discussion of prospective application areas for it is presented. Next, the types of 3D scanning hardware available are discussed. Finally, prior work on the assessment of 3D scanning is reviewed.

2.1. Three-Dimensional Scanning and Its Application Areas

Three-dimensional scanning is regularly performed at multiple scales. These can be loosely divided into those objects significantly larger than a human (i.e., buildings), human-sized objects and objects that are significantly smaller than a human (i.e., tools, body parts). Each will now be discussed, in turn.
Objects larger than humans that scanning has been demonstrated to be effective for include assessment for mining [2], creating real estate virtual walkthroughs [3], tunnel inspection [4], acoustic imaging [5] and concrete slab assessment [6]. Scanning can also be utilized to capture scenes, instead of objects, facilitating its use in road design [7] and urban planning [8]. Both types of imaging (object and scene) can be used to facilitate the electronic recording of historical sites [9] and for archeological purposes [10,11].
Scanning of humans and human-sized objects has also been an area of significant prior work (and is the focus of the scanner that is assessed herein). The utility of the technology for medical applications, such as the assessment of the shape of scoliosis patients’ backs and the evaluation of cosmetic products on large areas, has been demonstrated [12]. The technology has also been extensively used for clothing design [13,14]. Companies, such as Miller’s Oath, Astor and Black and Alton Lane, have created custom clothing using the technology [15], while Brooks Brothers and Victoria’s Secret have used it for tailoring and making product recommendations, respectively [16]. Specially-sized swimsuits [17] and other sportswear [18] have also been produced from scans. It has also been used to assess first responders’ clothing [19] and for military uniform sizing [20]. It has found use in research, such as for assessing exercise impact [21], perceptions of attractiveness [22] and lifetime skeletal structure changes [23]. Clothing sizing surveys (used to assess body size change trends) have also been carried out with governmental support in the United States and mainland Europe [24,25] and privately in the United States [26], Australia [27] and the United Kingdom [28,29].
Scanning of smaller-than-human objects has also been conducted extensively. This includes scanning of parts of the human body, as well as other objects. Human body part scanning has been utilized to measure, for example, facial expressions [30] and human feet [31]. It has also been utilized for medical engineering purposes, where body structures were scanned for assessment and, in some cases, replication purposes [32]. Objects have been scanned for reverse engineering purposes [33,34], quality assurance [35], creating object repositories (e.g., [36]), preserving historical artifacts [37] and assessing turbine blades [38] and concrete slabs [6].

2.2. Three-Dimensional Scanner Hardware

When Daanen and van de Water [39] provided an overview of 3D scanners in 1998, prices ranged from $50,000 to $410,000, and the $50,000 Telmat scanner imaged only “frontal and lateral” areas. In the late 1990s and early 2000s, work started on creating lower-cost scanners. Borghese et al. [40] developed a limited system that used two video cameras and a manually-held and -moved laser pointer. This system, while light (15 kg plus the weight of a laptop) and portable, required an extensive amount of time to scan due to the manual laser movement process. Rocchini et al. [41] developed a less-portable system, also with the goal of cost reduction (unfortunately, the cost is not specified, but it is characterized as “low cost” compared to $100,000 scanners). This system utilized a camera, six lights and a projector; its performance was not specified, but it was characterized as being sufficient for capturing 3D scans of statues.
When Daanen and Harr revisited the survey in 2013 [42], the price range had dropped to $10,000 to $240,000, scan times had (on average) decreased and a larger number of the scanners that they surveyed supported color scanning. While the scanners selected for the two surveys are not perfect analogs, the juxtaposition of the two highlights a trend towards increased functionality and lower cost, as is typical of electronic devices. Even lower cost, but functionally-limited solutions (utilizing a Microsoft Kinect), are available for certain applications at price points below $1000. However, these solutions cannot image an entire object at once (as the Kinect senses from a single vantage point), requiring either the object/individual or Kinect to be moved. In prior work [1], fourteen scanners were surveyed, ranging from $300 to $240,000. It was asserted, based on this survey data, that the scanner constructed (which is characterized herein and had a parts cost of approximately $5000) had characteristics similar to those in the $200,000 to $240,000 range.
Efforts to create low-cost scanners are ongoing. Vezzetti and Violante [43] suggest the use of magnetic angular rate gravity (MARG) sensors for augmenting other low-cost sensors with accurate position and movement vector correction data in the context of a moving 3D scanner. This technology was incorporated into a prototype handheld scanner [44], which was characterized to have an average error level just below 2 mm (which appears comparable to several of the fixed scanners presented in [39,42]. Prior work [1] presented a low-cost 3D scanner using visible light sensing created from a network of Raspberry Pi units, which is discussed in Section 3 and characterized in subsequent sections.

2.3. Assessment of 3D Scanning

For a 3D scanner to be useful for many applications, its accuracy must be characterized. This requires a comparison between the model created from the scanner’s sensing and the real object or individual that has been scanned. This section reviews prior work in this area.
Prior work on 3D scanner characterization has taken several forms. Galantucci et al. [45] have proposed a four-step process for scanner verification, including analyzing operator error, the reproducibility of error, error from a control system and error from the scanning system. While their work dealt with a 3D scanning system that collects data from a limited number of closely-located cameras (thus imaging only a subset of a presented object) and utilized a calibration target designed for this scenario and face-front masks for assessment, the work’s utility for other systems lies in its identification of multiple error sources to assess. Problematically, the approach that they proposed requires a so-called “gold standard” system for comparison purposes, which may make the approach unusable for experimenters that are unable to procure or access a more expensive system to validate a prospective low-cost one.
Rocchini et al. [46] also discuss the evaluation of the 3D scanning of objects. They identify several different metrics to assess, including the number of images captured, processing time (including multiple processing phases, in their application) and imagery-to-geometry mapping (including model accuracy, image registration accuracy, local registration accuracy and visual accuracy). Regrettably, they fail to define techniques for this assessment or to perform it relative to their own system. Bruno et al. [47] take a simpler approach for their assessment of an underwater 3D scanning technique and its assessment by comparison to non-water scanning. They measure the number of points acquired and geometric error.
An alternate approach used (separately) by Tikuisis, Meunier and Jubenville [48] and Yu and Xu [49] was to scan an object of known size and other characteristics and report on the scanner’s accuracy from this. Problematically, given the multitude of things that can impact a scanner’s performance, measurements from one object may not accurately reflect scanning accuracy for other object types or human imaging.
Polo et al. [50] discuss the utility of creating scanning targets for the characterization of scanner (in this case, a 3D terrain scanner) performance. They conducted scans of a purpose-built target, identified features on this target (excluding other objects due to distance from the imaging system) and measured the error of distance measures from the object centroid to detected points. They also analyzed the angles between the points.
Human scanning presents a more interesting challenge, for several reasons. Humans have features that are more complex than many objects, and they may make (even unknowingly and unintentionally) minor movements, making comparative assessment techniques problematic. Fourie et al. [51] sought to compare multiple techniques and their relevance to human scanning and did so using cadaver heads (solving the movement issue). The heads were scanned and processed using multiple techniques, and these scanned models were compared to manual measurements of 21 distances between 15 facial features. The use of features can be problematic, as Kouchi and Mochimaru [52] demonstrated, due to difficulty in re-identifying the same point. Error levels as high as 10.4 mm were reported by their study. Given that this was based on re-identifying the same point (either by the same individual or a second one) on the same individual, it would seem likely that error between a physical human and on-screen model would be even higher.
The use of humans as a mechanism for evaluating a scanner is also problematic due to the fact that distances between features change based upon pose. Lu, Wang and Mollard [53] demonstrated that bust-to-bust breadth and posterior chest breadth changed due to hand position (in addition to a less pronounced impact on the scanning accuracy). This finding is echoed by Lu and Wang [54], who demonstrated that the repeatability of measurements is lower with human subjects than with mannequins. The scanned measurements were also found to be more accurate, making the use of the less accurate, manually-collected measurements as a basis for scanner evaluation problematic. Ma et al. [55] also compared identifier-to-identifier accuracy and found that the error was as high as 3% for some segments, while most were below 2%.
The Civilian American and European Surface Anthropometry Resource (CAESAR) project [56] compared accuracy between 3D scanners and found that, even with the use of the same marked individuals moving from one scanner/scanning team to the other, the error rate performance was not consistent (with the team with more recent practice performing generally better than the team that had completed their primary work a period of time before the comparison study). They did note, however, that both teams, in most cases, were able to get measurements that were better than the maximum acceptable error level dictated by the U.S. Army Anthropometric Survey (ANSUR), standards. ANSUR maximum allowable error levels range from 2 mm for foot breadth (the mean value of data collected was 103.6 mm) to 11 mm for chest height (mean value: 1302.6). Of the 26 maximum allowable error levels, 19 allow error levels of 5 mm or greater.

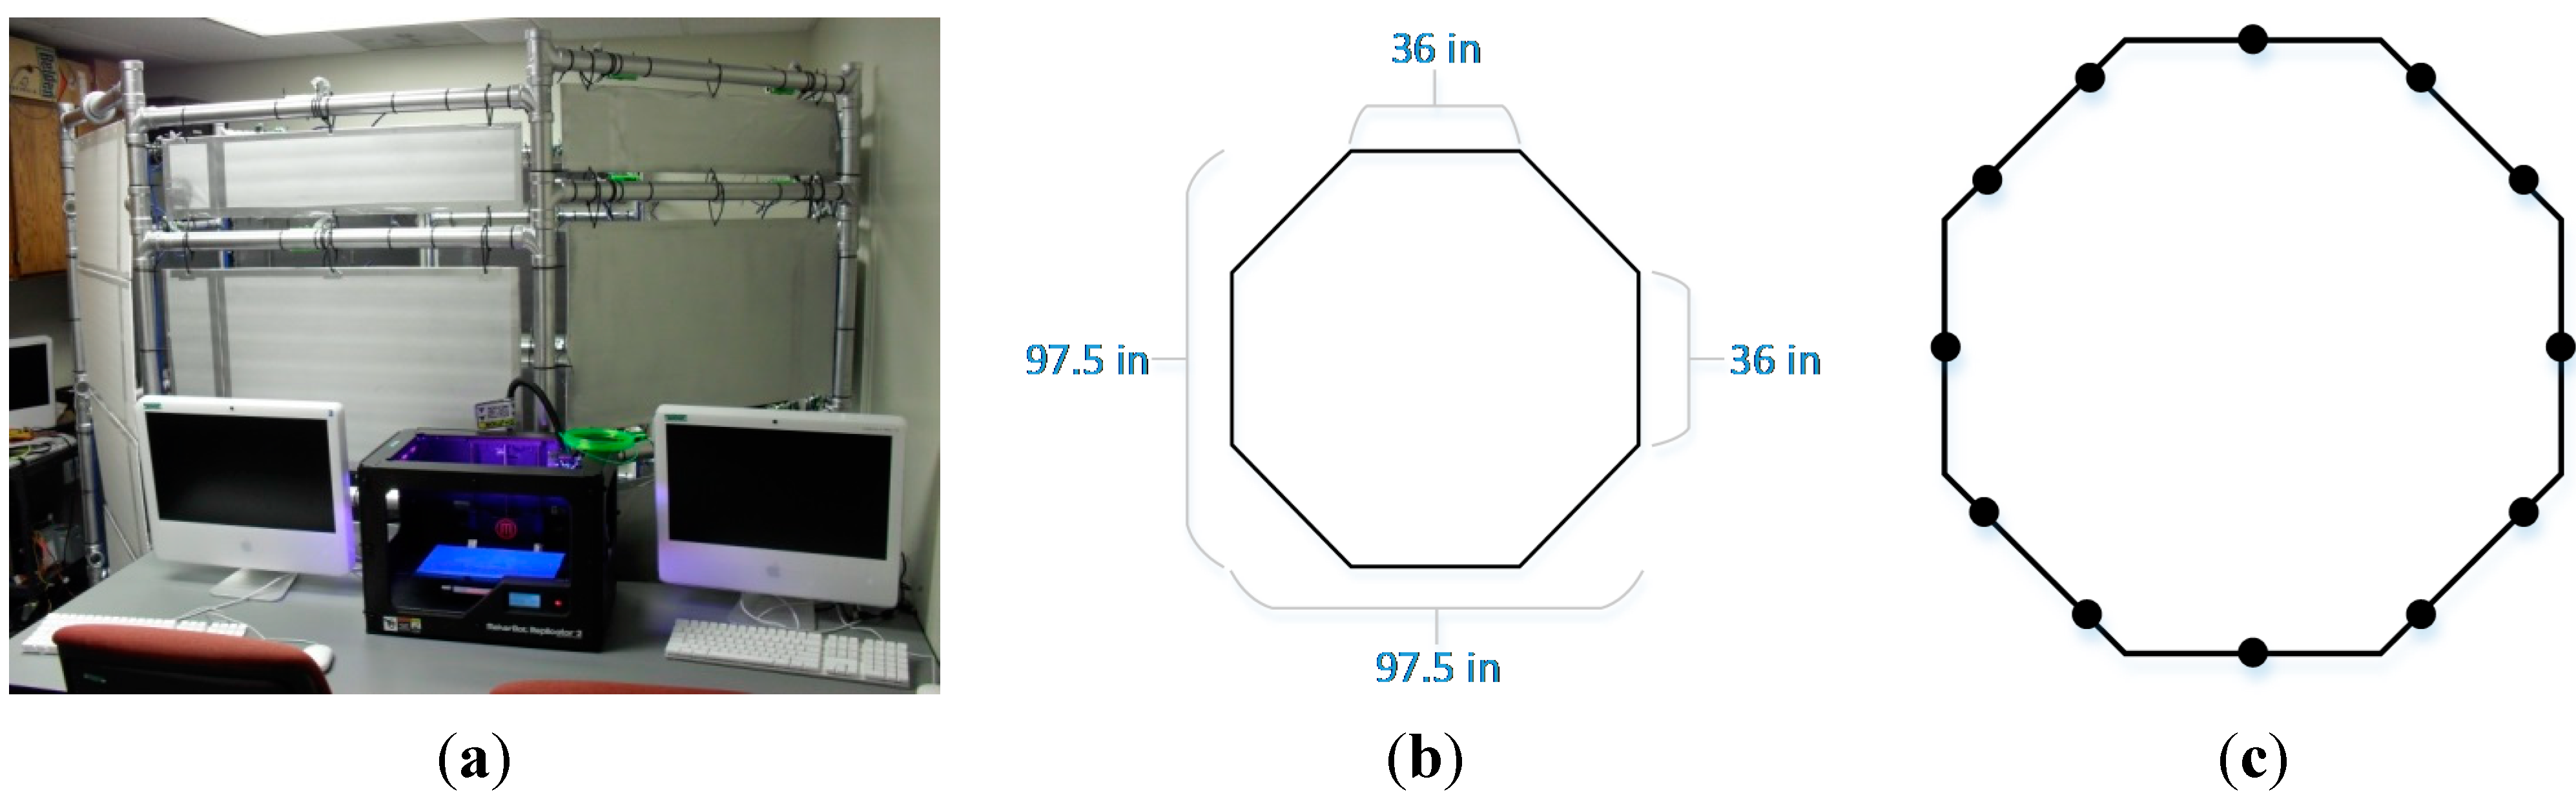
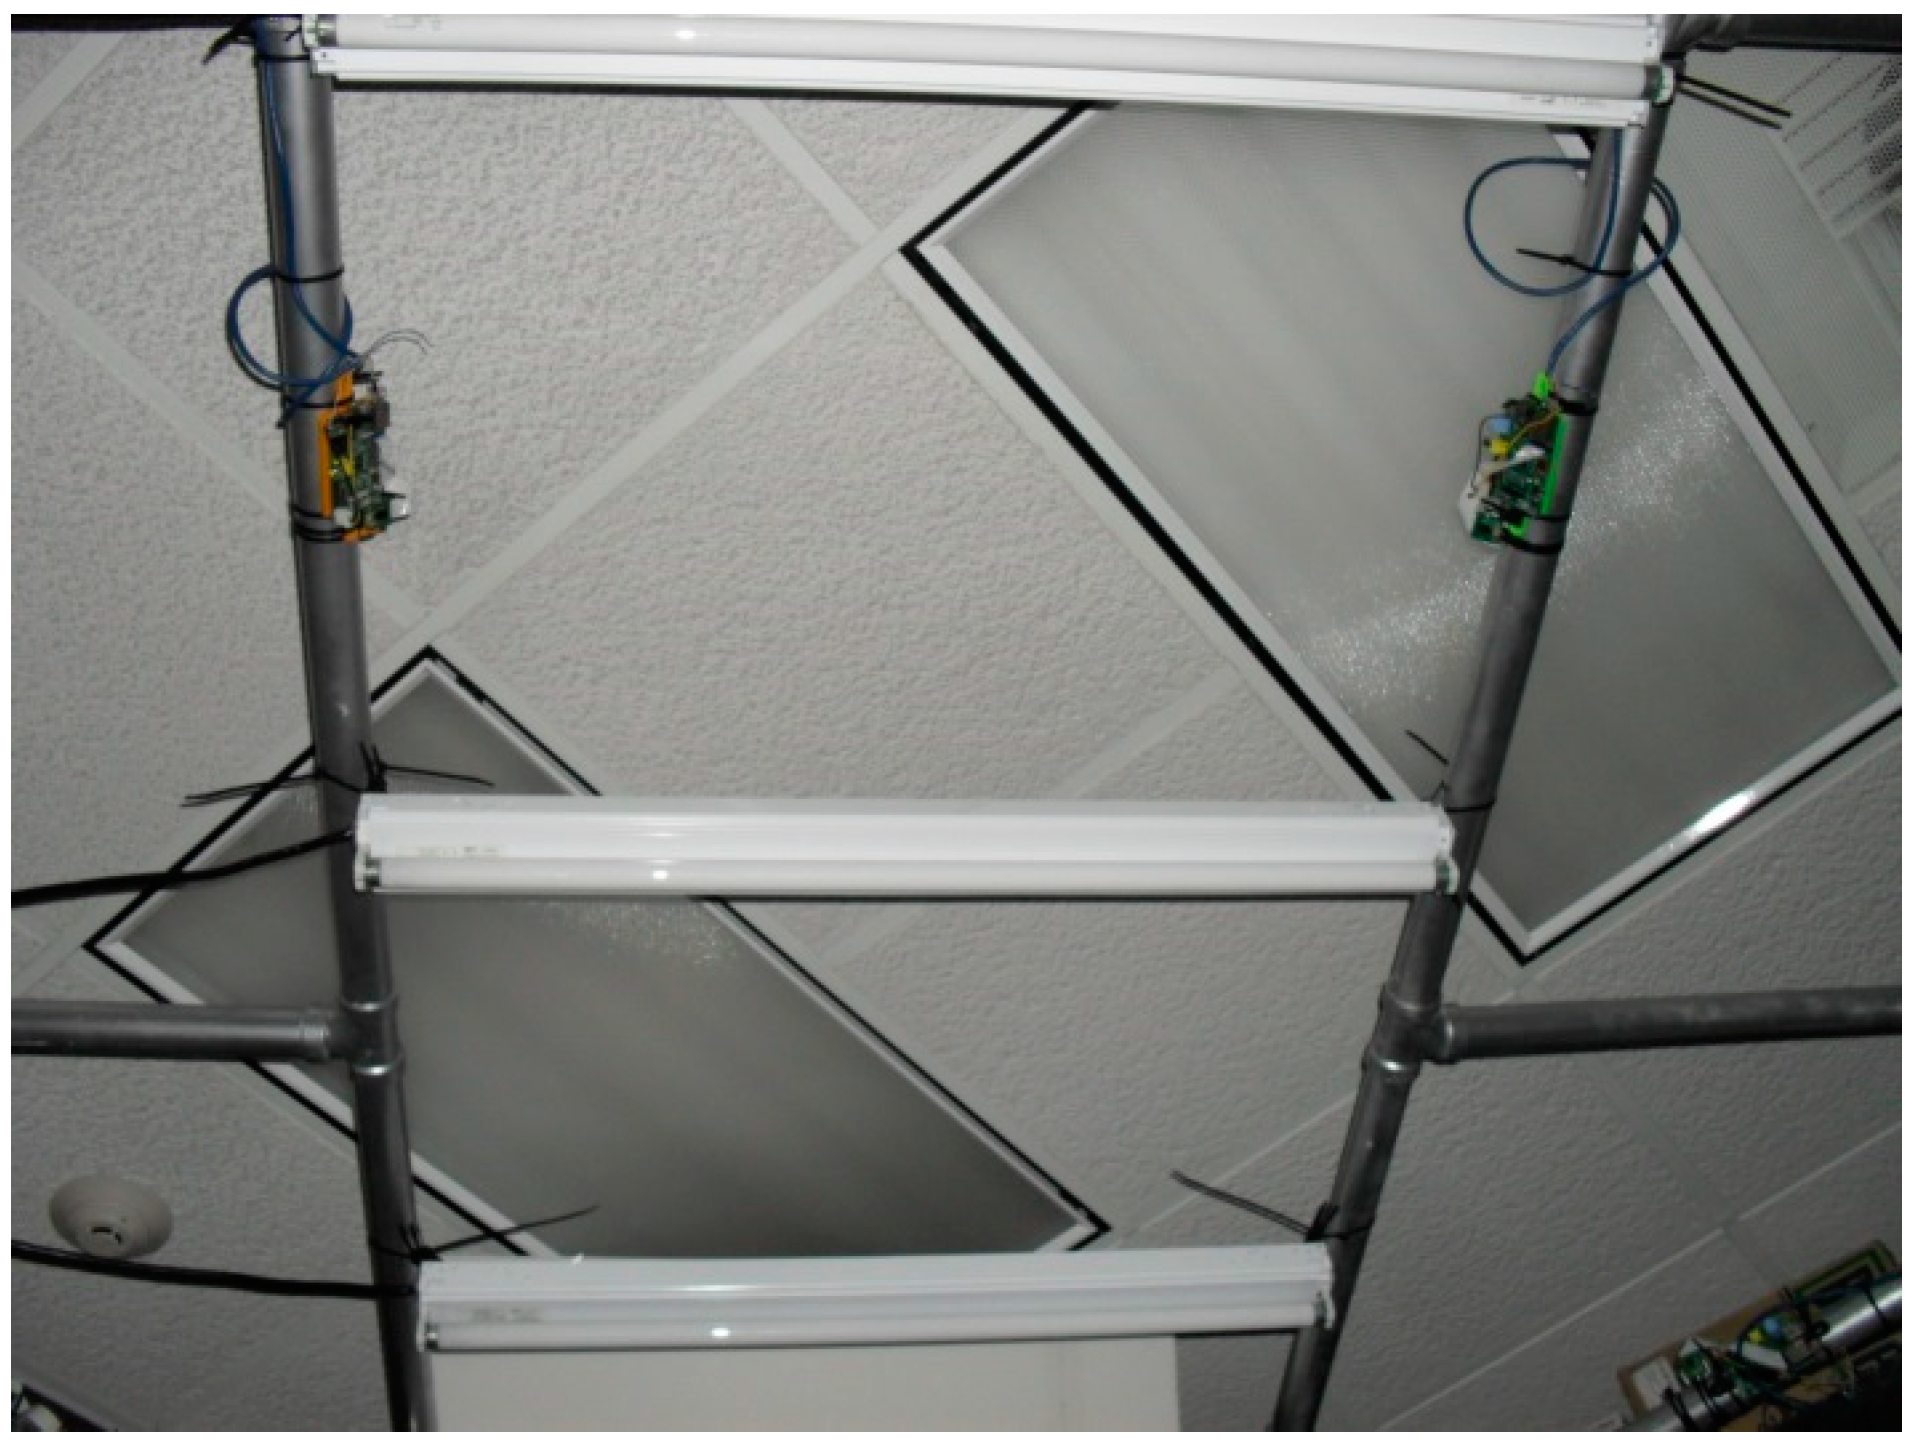
3. Overview of the 3D Scanner

This section provides an overview of the 3D scanner, which was presented and is described in greater detail in [1]. Figure 1a–c depicts the 3D scanner. Figure 1a shows the assembled scanner in the laboratory. Figure 1b provides the approximate dimensions of the scanner, while Figure 1c demonstrates camera placement. Notably, camera placement was widened slightly for the doorway area (this is not shown on the figure). Two overhead cameras were added later and are also not depicted, but are shown in Figure 2.
Figure 1. (a) Picture of the assembled 3D scanner [1]; (b) dimensions of the scanner [1]; (c) camera locations [1].
Technologies 03 00019 g001
Figure 2. Cameras mounted on top of the scanner and the lighting configuration.
Technologies 03 00019 g002
The scanner works by capturing fifty concurrent images from four height levels at the positions shown in Figure 1c and two overhead locations (shown in Figure 2). This process is triggered by a multicast network message sent from the server to all Raspberry Pi units, which then capture their images at nearly the same moment in time and upload the images on to the server. Software is then utilized to create a computer-aided design (CAD) model from this imagery. Two commercial software packages have been utilized, Autodesk Recap 360 and AgiSoft PhotoScan. The work in this paper was performed with Agisoft PhotoScan.
Since the work presented in [1], significant effort has been undertaken to solve issues with imaging of objects at the top of the scanner’s chamber area (such as the head of a scanned human). Several changes have been made to the scanner to accomplish this. First, the top cameras (shown in Figure 2) have been added, as planned. Second, lighting has been repositioned (relative to the object or individual being photographed) to produce enhanced results. Figure 3a shows the problems that lighting and camera positioning were causing, prior to these changes being made. Figure 3b,c shows a high-quality wireframe (b) and colored mesh (c) created from a scan taken after the changes were completed. The images in the remainder of this paper utilize this updated configuration.
Figure 3. (a) Render from images taken before changes; (b,c) top-down view of the wireframe and mesh from the scan after the changes.
Technologies 03 00019 g003
The fifty images captured by the scanner are processed via Agisoft PhotoScan in several phases. PhotoScan is used at the current phase of development, to allow verification of the hardware-software system used for image capture. The development of a software module to create the mesh and models serves as a subject for future work. Initially, a point cloud is generated by matching points between images from different angles, allowing them to be positioned in three-dimensional space. Figure 4a shows the initial point cloud for a scan.
Figure 4. (a) 3D scan results, showing the light point cloud; (b) 3D scan results, showing the dense point cloud; (c) 3D scan results showing the network.
Technologies 03 00019 g004
Once this light point cloud is generated, a more robust point cloud can also be generated. This so-called dense point cloud for the same scan is shown in Figure 4b. From this, a mesh is generated. It is also possible to generate a mesh directly from the light point cloud; however, this will not have the same level of detail as one generated from the dense point cloud. An example mesh is shown in Figure 5a. Figure 4c shows the underlying wireframe network that was used to create this mesh. For applications, such as 3D printing, the mesh is the point that one can stop at. This mesh can be exported from the software and imported into software that will prepare it for printing. However, other applications that involve manipulating the scan on screen can benefit from additional steps. The mesh can be colored, as shown in Figure 5b, and a texture, from the original source imagery, can be applied, as shown in Figure 5c.
Figure 5. (a) 3D scan results, showing the mesh; (b) 3D scan results, showing the colored mesh; (c) 3D scan results showing the textured mesh.
Technologies 03 00019 g005

4. Experimental Design, Methods and Data Collected

The goal of this work is to characterize scanner performance, relative to the real-world object that is being imaged. This section describes the process of collecting the data that was used for this purpose. Several different experiments were conducted. Each is now discussed.

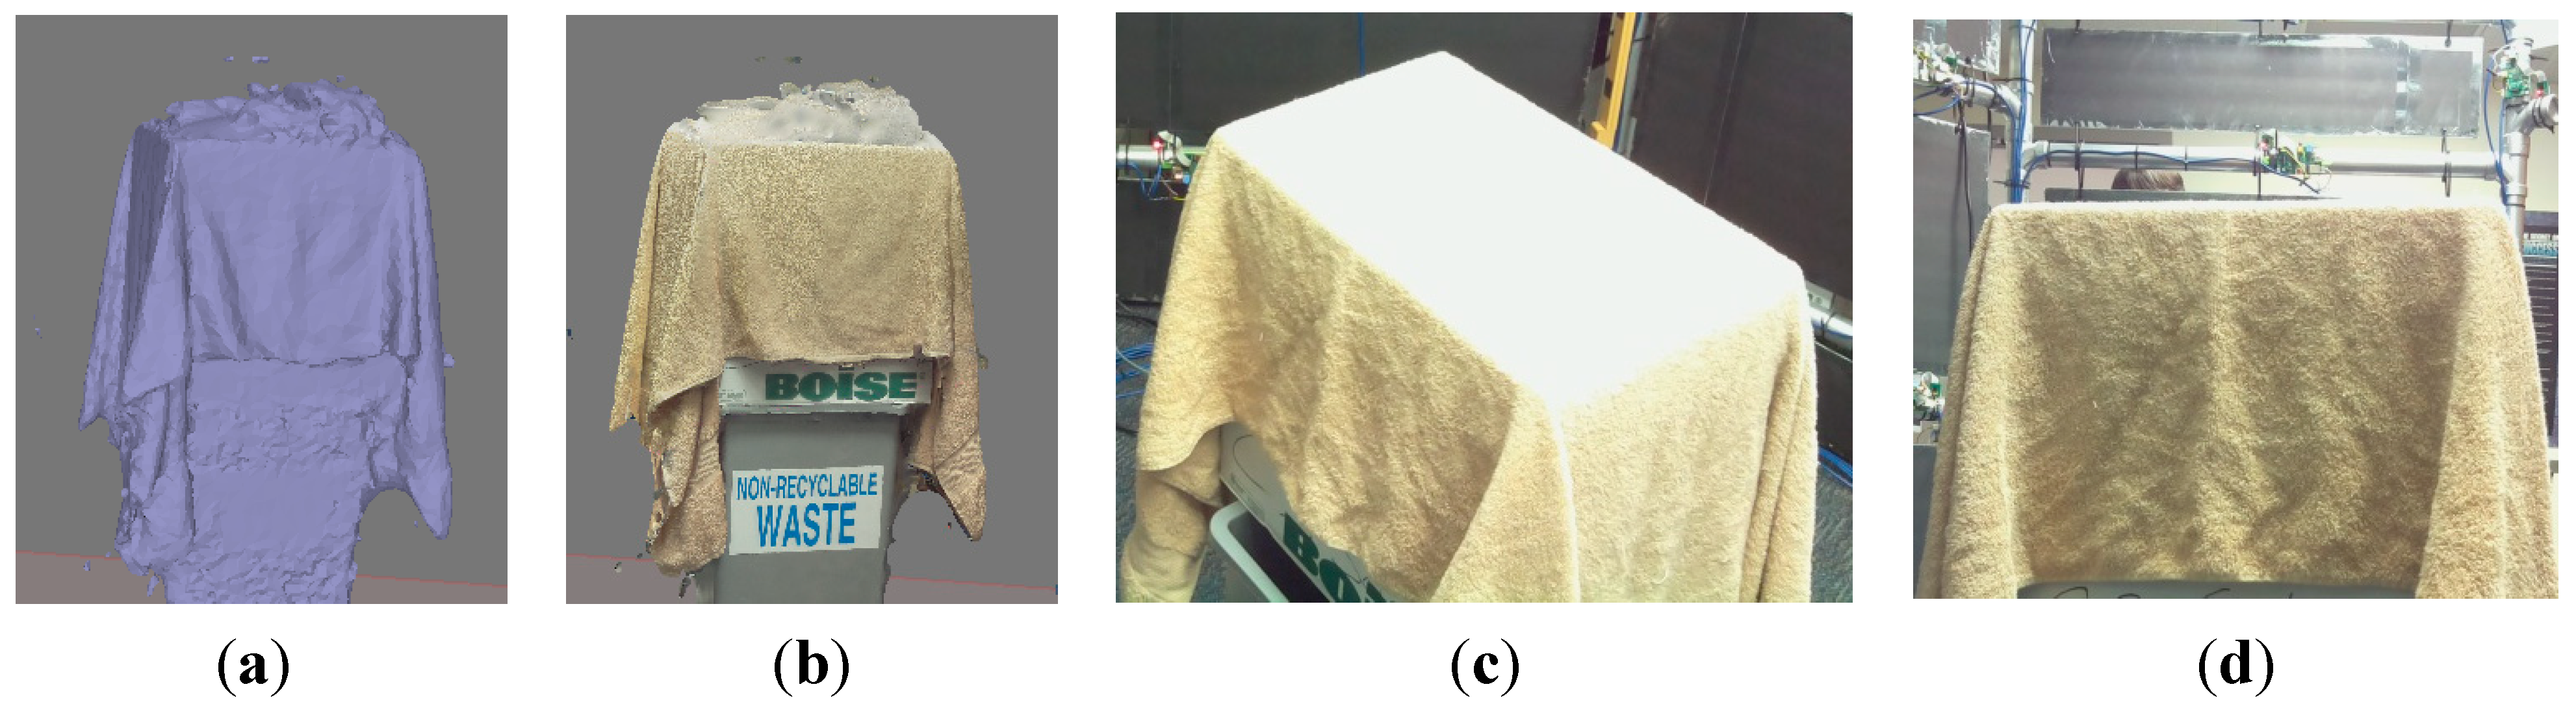
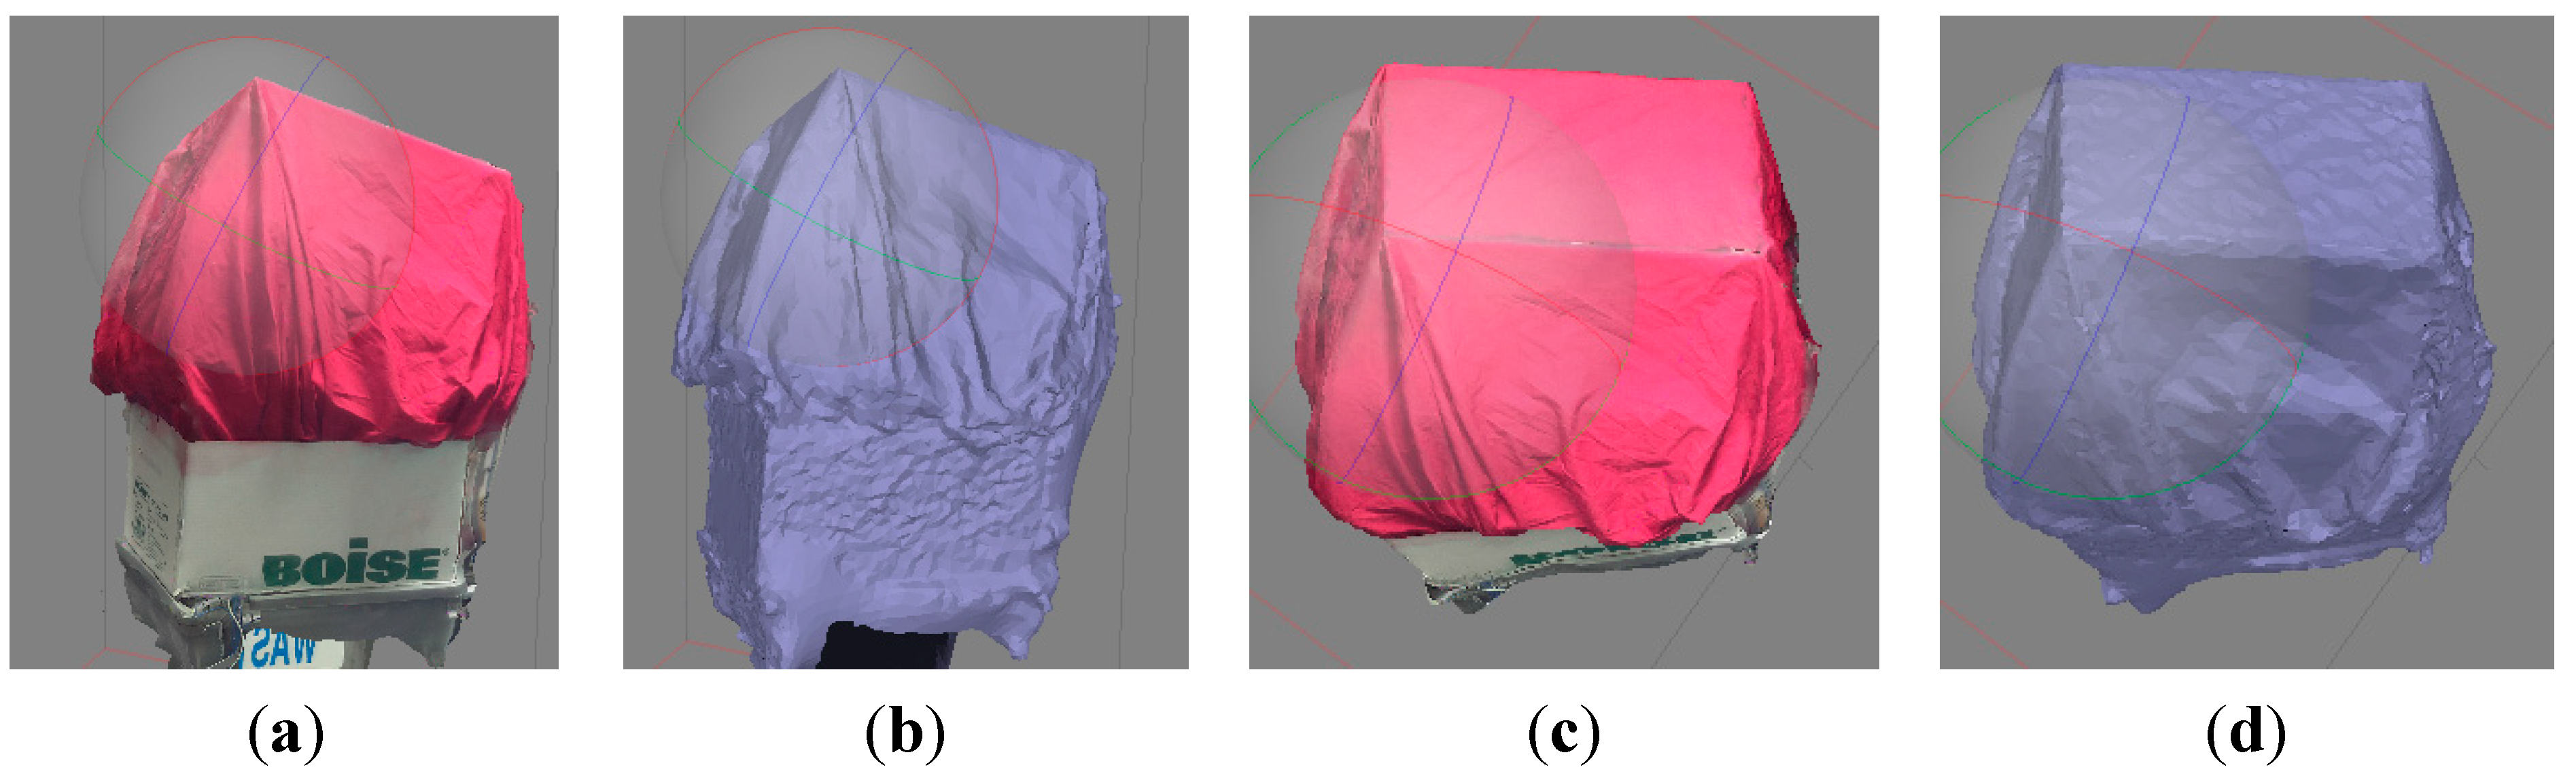
4.1. Characterization of Object Scanning

To facilitate accurate initial characterization measurement, an inanimate object was used instead of a human. In this case, first two and then three empty photocopier paper boxes were stacked on top of a garbage can. As has been previously noted, lighting can have a significant impact on scanner performance, and objects with large flat surfaces (like boxes), while easy to measure, can be problematic to scan.
In the first test, the boxes were scanned using both the scanner’s florescent lights and the overhead florescent lights (which are covered by diffusor panels). This imagery was unusable. For the second test, only the overhead lighting was utilized; this performed better, but still failed to provide measurable imagery. In the third test, beige fabric was placed over the boxes. The model produced from this is shown as Figure 6; the model with a mapped texture is shown in Figure 6b. Two images of this experiment from system cameras are shown as Figure 6c,d. Figure 6c shows the glare coming from the top of the box, which causes this distortion. Figure 6d shows that the top of the box is flat and not as rendered in Figure 6a,b. While the sides for this are suitable for potential measurement, the top (which was flat) is modeled with incorrect mountain range-like protrusions.
Figure 6. (a) Mesh of the box showing the mapped texture; (b) model of the box with the mapped texture showing the impact of light reflection; (c) actual picture of the box from the system camera showing light glare; (d) actual picture of the box from the system camera showing that the surface is flat.
Technologies 03 00019 g006
A darker piece of maroon fabric was next utilized; for this experiment a third box was used to store the excess fabric and still allow it to cover the initial two boxes. This model is shown in Figure 7a with a mapped texture and as an uncolored mesh in Figure 7b. While the reflection-caused glare artifacts have been reduced, there are still several peaks towards the right side of the box. Additional manual removal of points from the point cloud could potentially reduce this somewhat. This is unlike the lighter color fabric shown in Figure 6a–d, where removal of these mountain-range-style points actually removed the box’s top surface.
Figure 7. (a) Box with a maroon cloth showing the mapped texture; (b) box with a maroon cloth’s mesh model without texture.
Technologies 03 00019 g007
Given that the problems shown in Figure 6a–d and Figure 7a,b seem to be most prevalent on the surface normal to the incidence of the light, the box was now tilted to remove this normal surface. Figure 8a–d depicts this. Figure 8a shows the texture-applied model of the boxes; Figure 8b shows the uncolored mesh. Figure 8c,d shows the same for the top of the box, respectively. Notably, there is no significant ridge and only minor discoloration on the front edge.
All of these images required some manual removal of erroneous points. These were identified by being away from the object (with a visible space in between the object and the points) or from their incorrect coloration. Facilitating automated removal of these points, potentially through changing the walls of the imaging chamber, will serve as a subject for future work.
Figure 8. (a) Box with a maroon cloth at an angle showing the mapped texture; (b) angled box with a maroon cloth’s mesh model without texture; (c) top view with the mapped texture; (d) top view without texture.
Technologies 03 00019 g008
Table 1 presents the measurements of the boxes, as well as the values obtained from the CAD software. For the purposes of this work, the average of the actual measurements and the average of the scanned measurements was used to scale all of the CAD measurements. Without calibration, the scanner is not able to sense the scale of the object that it is imaging (resulting in models having arbitrary units), so a scaling factor must be applied. While global calibration is prospectively possible, the (calibrate-on-use) scaling approach is desirable for multiple reasons. First, it prevents unnoticed camera movement from inadvertently impairing data accuracy. Second, it allows the scanner to be reconfigured for different applications without having to perform a detailed calibration process. Third, it mitigates the potential for a calibration that is well suited to one type or size of object being inadvertently applied to objects for which it is not well suited. The use of a calibration procedure, conversely, could eliminate the need for making manual measurements and also possibly increase scanner accuracy, if an object with precisely known dimensions was available for use as a calibration target. Comparative assessment of the relative efficacy of the calibrate-on-use and calibration procedure approaches remains a subject for future work. These scaled values are also presented, and, in the far right column, the level of error is presented.
The data presented in Table 1 characterize the performance of the scanner for measuring dimensions of an object with sharp corners and edges. The error levels of 0.14 in to 0.30 in are well within the usable range for many applications and range from between 0.8% to 1.7% of the dimension measured.
Table 1. Measurement data from the CAD models of the boxes presented in Figure 9 and actual measurements.
CAD Model ValuesScaled Values (in)Actual MeasurementAbsolute Error
Model 1Model 2Model 3Model 1Model 2Model 3Model 1Model 2Model 3
Short Side 10.881.050.9311.6911.9111.3911.750.060.160.36
Short Side 20.871.000.9511.5711.3311.6111.750.180.420.14
Long Side 11.331.541.4417.6817.4817.5717.750.070.270.18
Long Side 21.341.591.4617.8318.0717.8317.750.080.320.08
Diagonal 11.591.901.7421.0521.5421.1821.000.050.540.18
Diagonal 21.611.851.7221.3820.9221.0421.000.380.080.04
Average Error 0.140.300.16

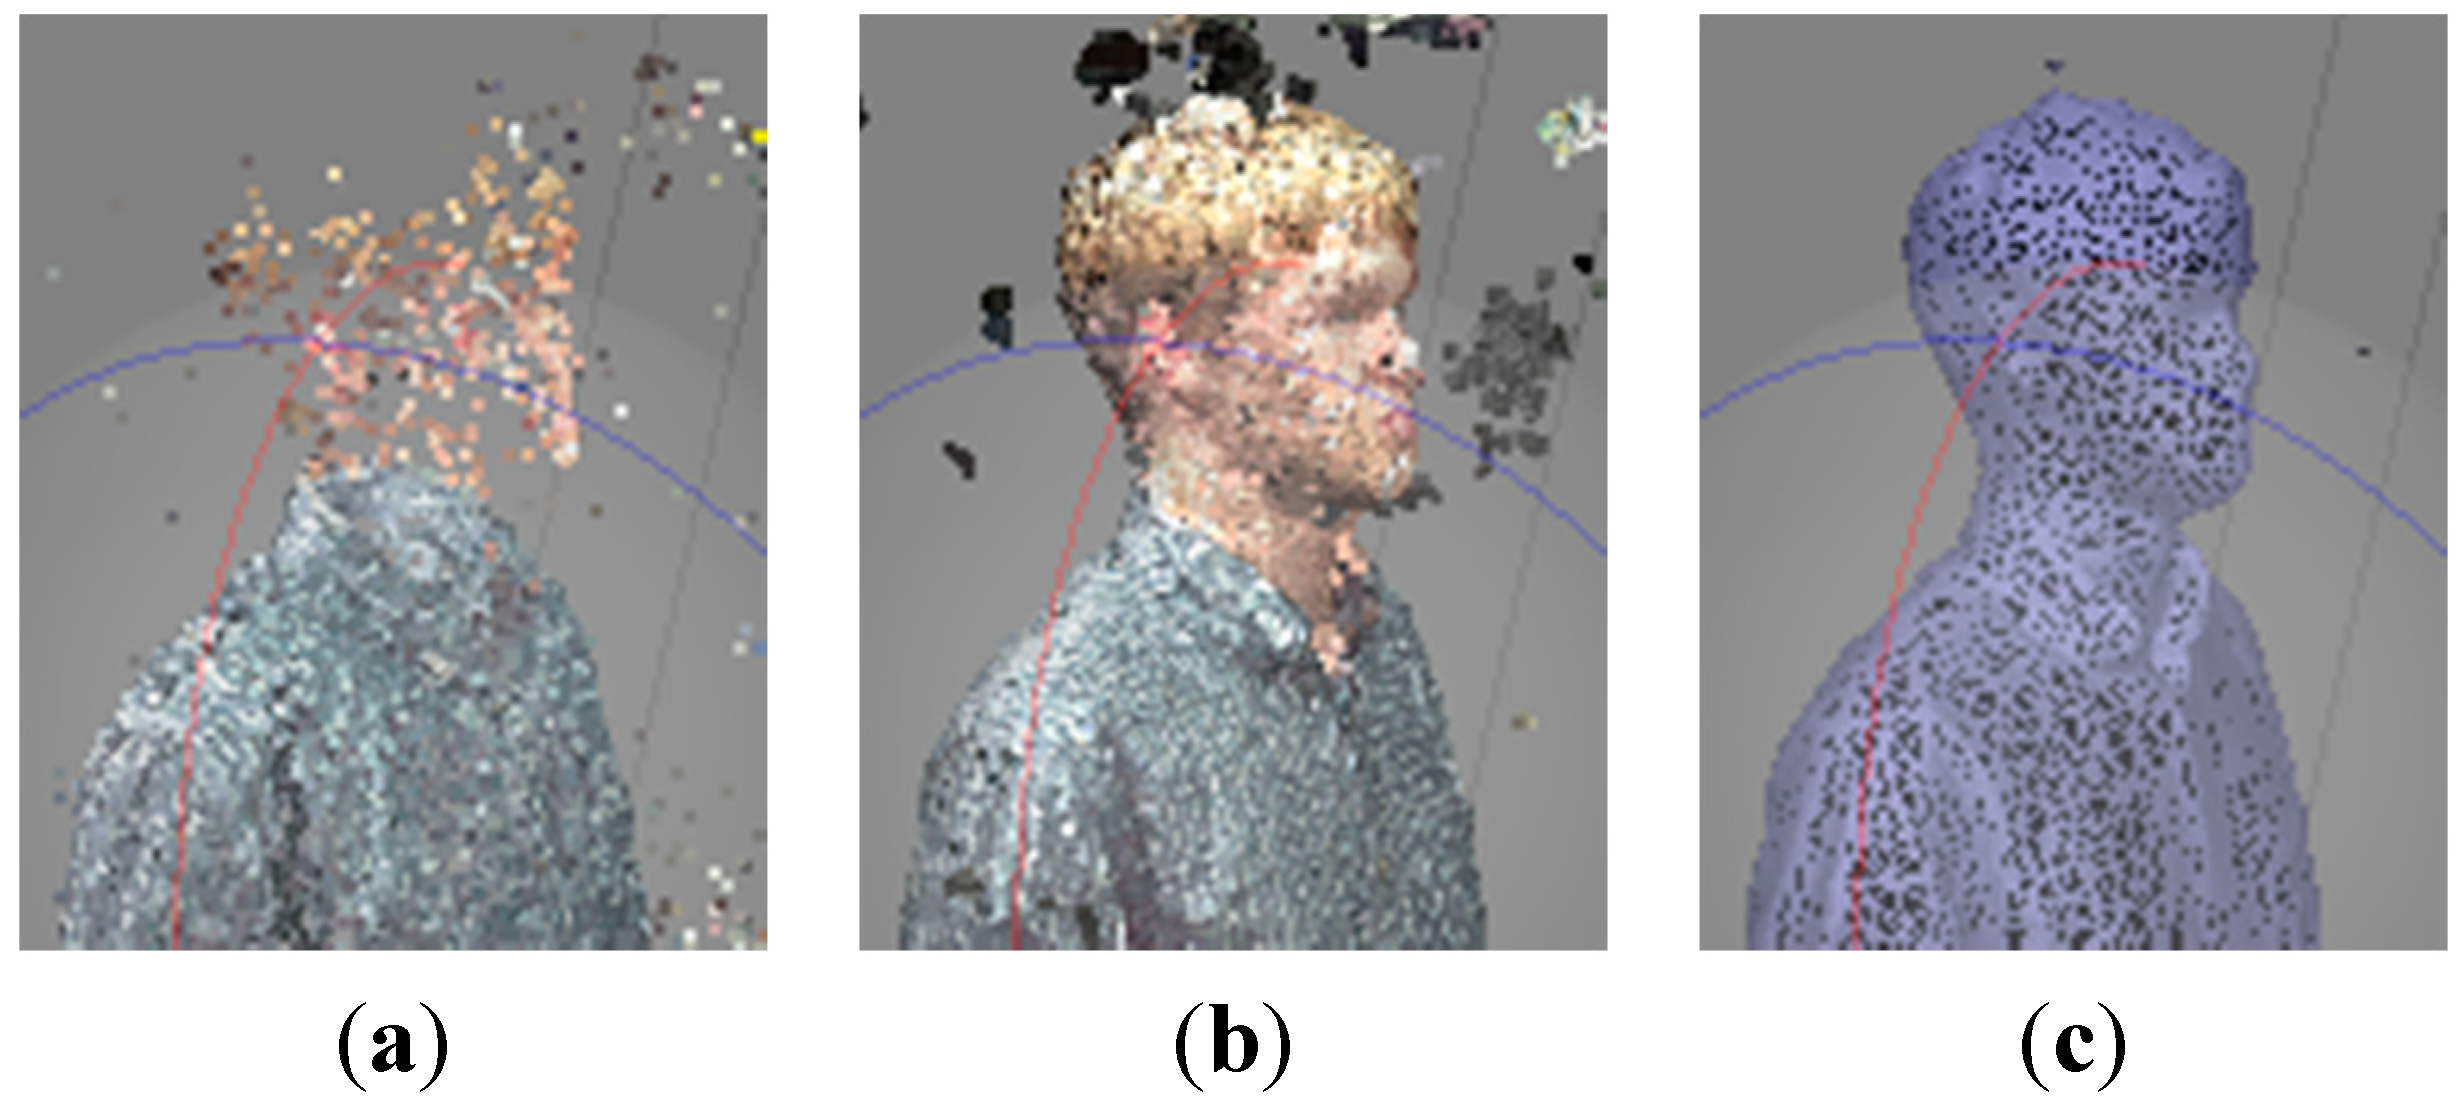
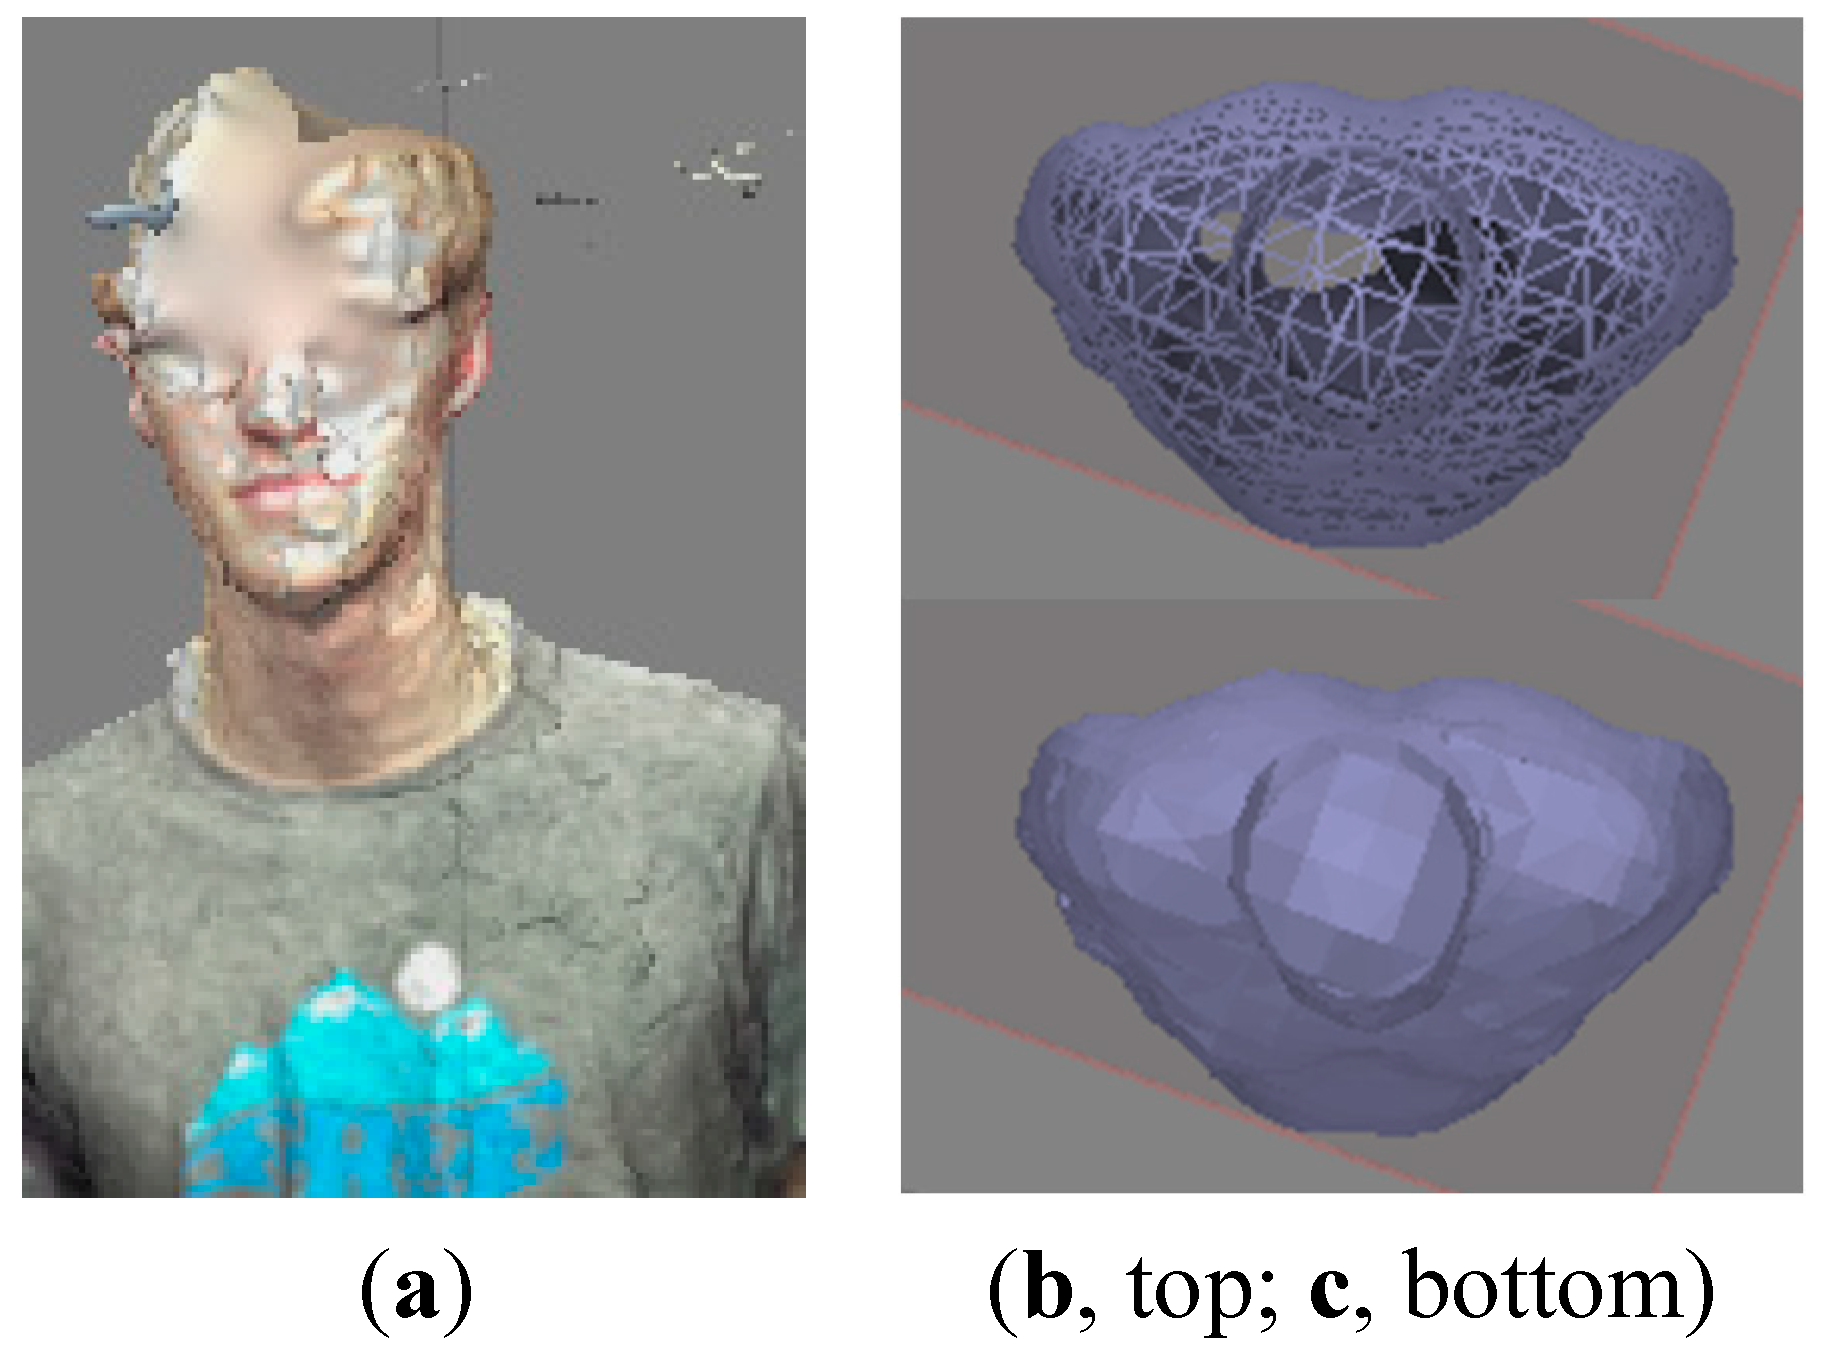
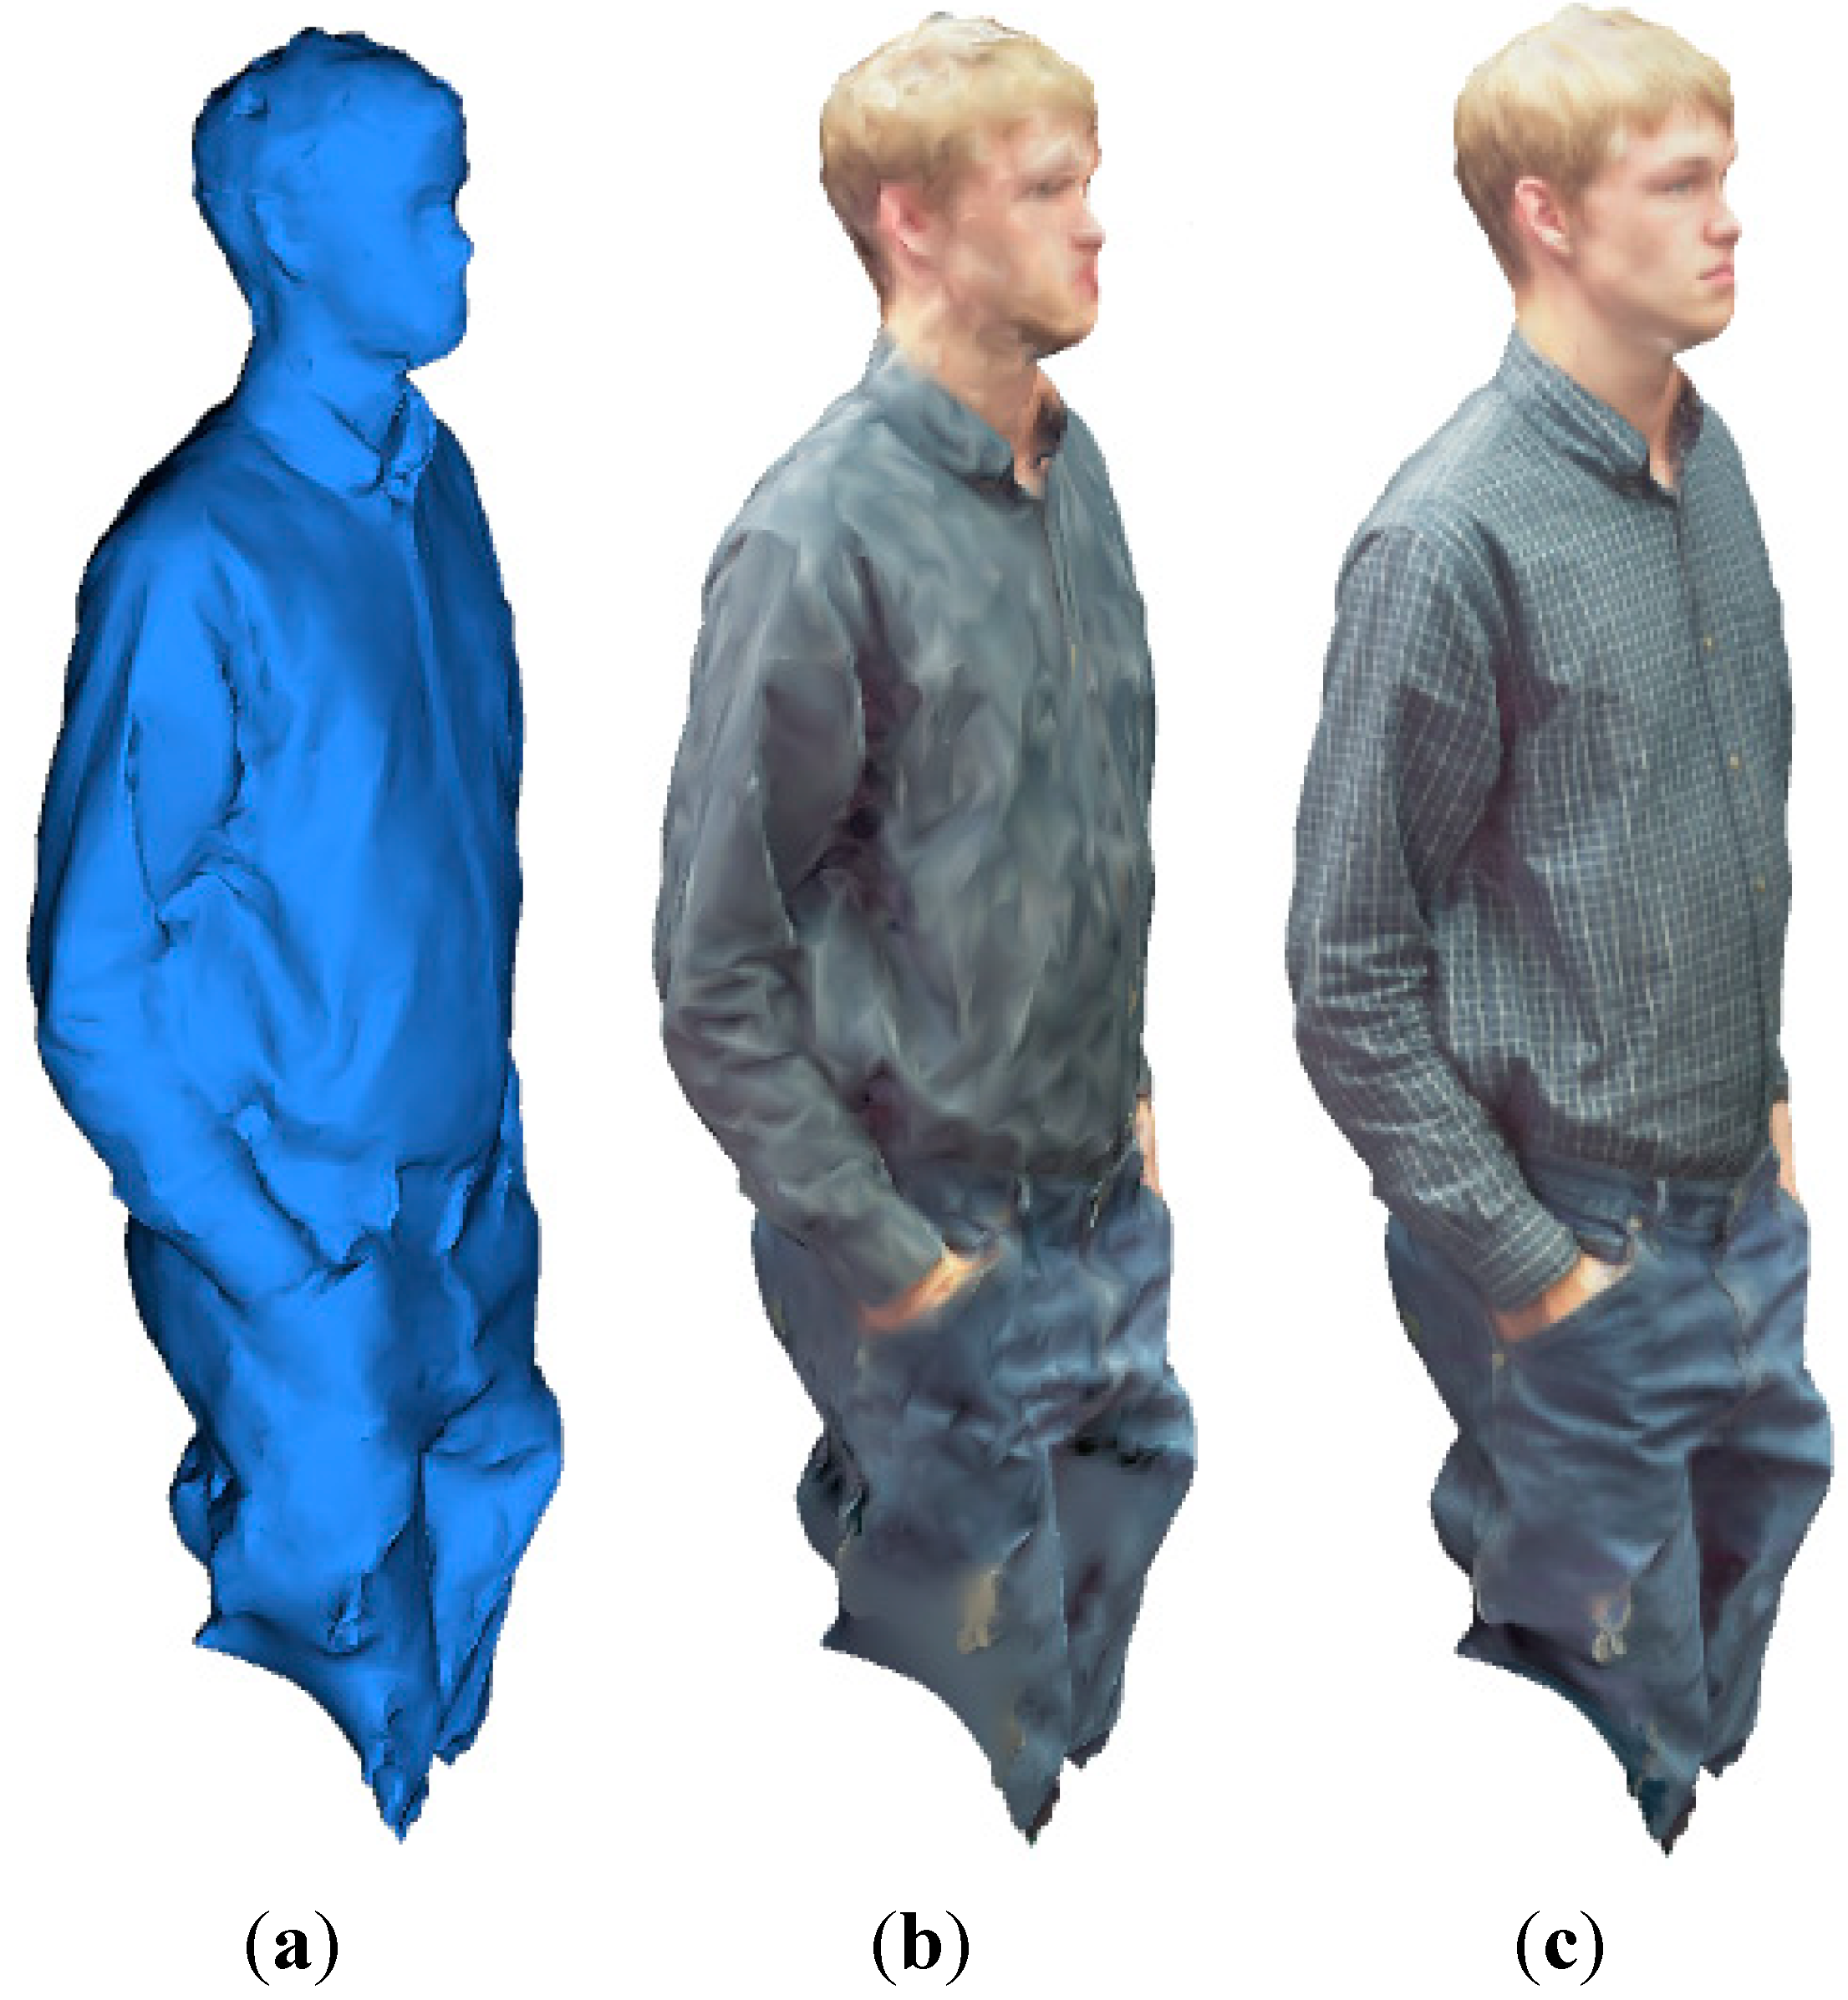
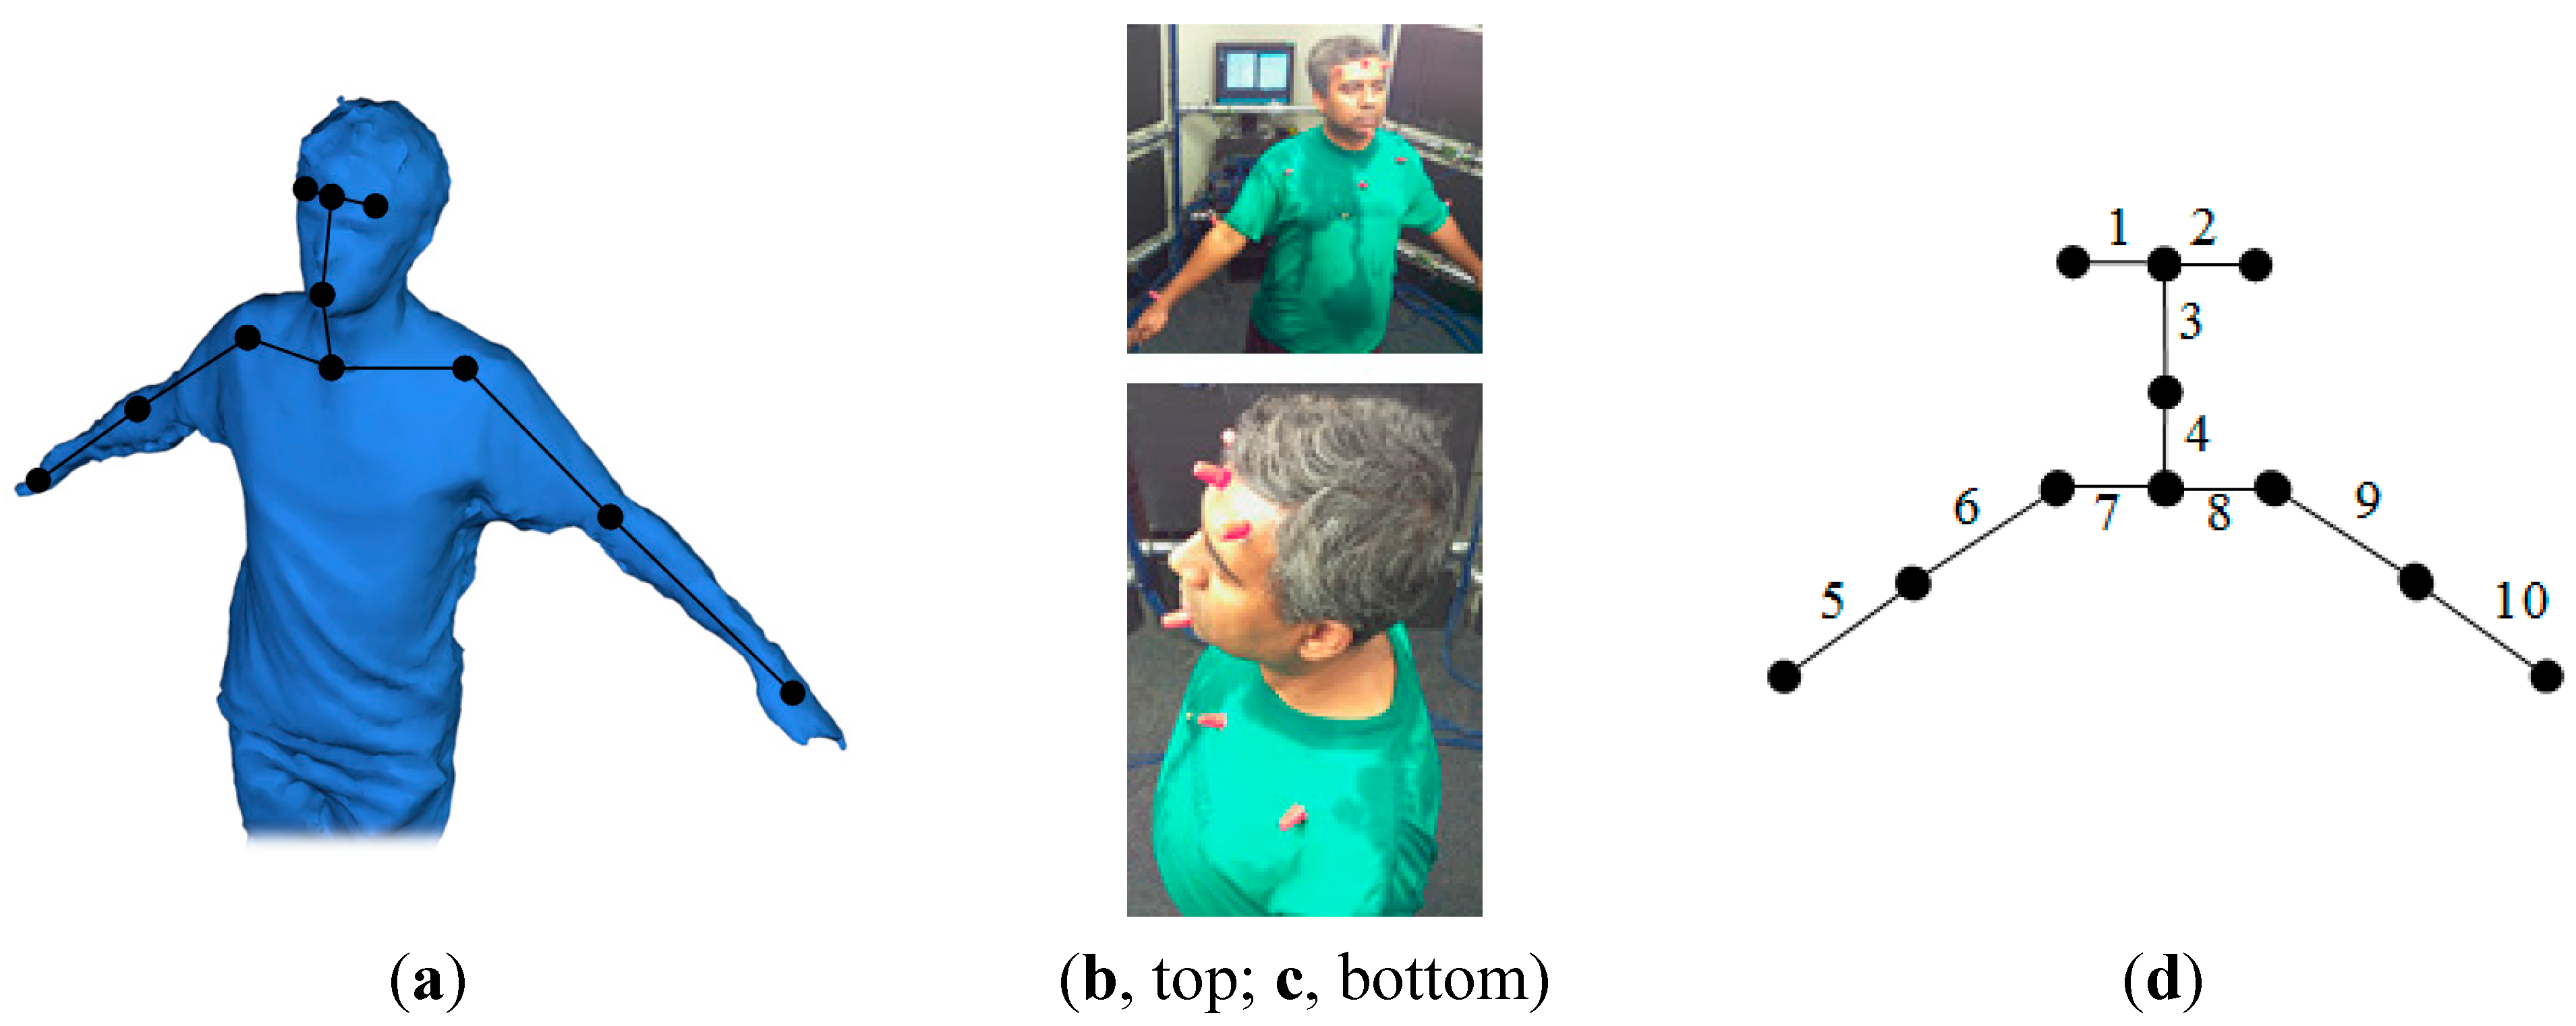
4.2. Characterization of Human Scanning

An experiment performed to characterize the performance of the scanner in scanning a human is now discussed. Many of the techniques discussed in prior work (see Section 2) were somewhat invasive and characterized the actual physiology of an individual. However, for the purposes of characterizing the performance of the hardware, this is not necessary, and consequentially, the use of arbitrary points was selected. This benefited from a lack of need to identify specific points on the body of the individual scanned and match them up to points in the model. Instead, orange markers were affixed at arbitrary points and the distances between these points measured. Each measurement was conducted from the middle of the marker to the middle of the adjacent markers. Figure 9 shows the approximate placement of the markers, and Figure 9b,c show the actual marker placement.
Figure 9. (a) Diagram of the location of the points; (b,c) images of the data collection using points (note that the discoloration of the shirt is due to rainwater and demonstrated that the scanner is robust to different colorations and reflectance levels); (d) diagram of the segment locations (the numbers correspond to Table 2).
Technologies 03 00019 g009
The same points were then measured in CAD software, based on the model produced from the scanner. Table 2 presents the data collected. Again, the average was used for scaling. The segment labels correspond to those depicted in Figure 9d. The actual measurements are presented in the second column. The CAD measurements (in arbitrary units) are presented in the third column; the forth column presents scaled values, as discussed. The last column calculates the discrepancy between the actual and scaled measurements.
Problematically, measurement accuracy and movement may confound the actual measurement error. A limited amount of error may be attributed to the accuracy of the manual measurement process, which utilized a tape measure accurate to 1/16 of an inch. More problematic, however, is the potential for small movements by the individual to whom the points were affixed.
The average error, 0.37 in, is within a range acceptable for many applications. Problematically, this may understate the actual accuracy of the scanner, which, as shown in Figure 9a, is sensitive enough to detect small wrinkles in a shirt, for example. This work did, however, demonstrate the efficacy of the scanner for human scanning and demonstrate that gross error (the error detected is only 0.35% of the x- and y-dimensions of the scanning chamber) did not occur for human scanning.
Table 2. Manual measurements, CAD model measurements, scaled CAD measurements (to real-world units) and discrepancy. CAD units are arbitrary, and all other columns are presented in inches.
Measurement (in)CADScaled (in)Discrepancy
Segment 13.000.2112.5630.44
Segment 22.630.1631.9770.65
Segment 36.880.5576.7500.12
Segment 46.000.5096.1670.17
Segment 510.000.86410.4750.48
Segment 69.600.8109.8220.22
Segment 78.000.6157.4510.55
Segment 86.130.5346.4730.35
Segment 910.000.8149.8670.13
Segment 1010.000.86710.5120.51
Average7.220.59512.1480.37

4.3. Characterization of the Impact of Lighting

Finally, as lighting is critical to the operation of a visible light 3D scanning system, work was conducted to assess the impact of changing lighting on the scanning process. Experiments were conducted to identify lighting characteristics that resulted in optimal performance, identifying the best lighting approach for conducting scans using a system of this type and providing direction for future work (which could assess other factors, possibly improving on the performance of this identified best-performing approach). The performance of the scanning under varied lighting conditions informs the assessment of the efficacy of the scanner for applications where a lighting configuration pre-exists scanner incorporation. This can be used to assess scanner suitability in an environment where lighting cannot be changed and defines lighting best practices for applications where light can be configured to enhance scanner performance.
In Section 3, the impact of a lighting configuration on the image generated of a human head was already discussed (and shown in Figure 3a–c). In this section, the overall lighting (based on the new positioning of the lights that does not create the melting-like problem shown in Figure 3a) conditions were varied. Lighting for the scanner is created by two separate lighting systems. First, there is the normal room lighting, and this has three potential modes: one bulb per fixture, two bulbs per fixture or three bulbs per fixture engaged (there are three fixtures in the room, and two directly illuminate the scanner). These bulbs are located behind standard commercial diffusor panels. Additionally, three florescent lights were mounted in the scanner: one is directly above the person or object being scanned, and one is located both in front and behind the person or object. These 25-watt, 3-ft florescent tubes are independently controlled.
An individual remained stationary for all six tests while the lighting conditions were altered and scans were taken. The scanner’s lighting configuration is depicted in Figure 2. Six tests were conducted (labeled as Test 1 to Test 6 in Table 3 and Table 4). Table 3 presents the lighting combinations for each test, and Table 4 presents the model completion levels that were generated using them (with the configuration for a given test number in Table 3 corresponding to the data presented for the same test number in Table 4). Because the software utilizes arbitrary units (which may vary from scan to scan), it was necessary to normalize the volume data. A normalization factor was computed by dividing the measured shoulder width of the individual scanned in each test by the average width across all tests. All volumes were multiplied by the cube of this factor.
Table 3. Test lighting configurations.
Overhead 1Overhead 2FrontMiddleBack
Test 1 X X
Test 2 XXX
Test 3X XXX
Test 4XXXXX
Test 5XX
Test 6 XXXX
Table 4. Test results and normalized volume.
Shoulder WidthVolumeNormalization FactorNormalized Volume
Test 11.4272.958 × 10−70.9002.158 × 10−7
Test 21.4283.3420.8992.430
Test 30.9570.9431.3422.280
Test 41.1471.6871.1202.371
Test 51.4823.4440.8672.241
Test 61.2662.1571.0152.253
The data presented in Table 4 demonstrates the impact of different lighting configurations on object completeness. It demonstrates the importance of sufficient lighting: test 1, for example, exhibited the worst results and had the lowest lighting levels. It also demonstrates the importance of lighting consistency: tests 2 and 4 exhibited the best and second-best performance, respectively, and both were the cases with the most consistent lighting. While proper lighting is essential and consistent lighting is beneficial, the tests also demonstrated that the technology is at least somewhat resilient to less consistent (but sufficiently bright) lighting, as the performance of less consistent tests was not dramatically lower than those with the most consistent lighting.

5. Discussion of Data Collected

The data presented demonstrates the utility of the scanner for imaging objects of multiple types. It also demonstrates the critical impact of proper lighting on the performance of the scanner. The work has demonstrated the ability to collect data that is sufficiently accurate for many applications, including many measurements relevant to characterizing humans. Given its low cost and performance, the scanner could prospectively allow access to the use of 3D scanning technology by projects that would otherwise not be able to afford access to it (or allow owned access, as opposed to having to rent time on service provider scanning equipment, which is available in some larger cities). Lowered costs also facilitate the use of the technology by small businesses and for student projects. The resiliency to various lighting conditions demonstrated suggests that the deployment of camera clusters into everyday spaces (such as entryways to buildings or on freestanding poles) could be effective, as long as the areas were sufficiently well lit. This, prospectively, could allow visible light 3D scanning to be utilized for numerous applications.

6. Conclusions and Future Work

The work presented herein begins to characterize the accuracy of a large, low-cost, visible light 3D scanner. This scanner, which is designed to be a research tool for wide use at the University of North Dakota, can prospectively be utilized directly (i.e., for data collection), as well as a platform to support additional 3D scanner technology development. With a cost of approximately $5000, it is designed to enable significant additional research capabilities. This work has shown that the scanner can produce data within the requirements of many human scanning applications and also characterized the error of its performance with regards to inanimate objects with sharp corners (a distinctly different type of object from human-like ones). Work has also been performed identifying superior and inferior lighting conditions, which provides operating guidance, as well as aiding in the assessment of the scanner’s utility for applications based on the type of lighting that might be present in the environment. It has demonstrated that both insufficient lighting, as well as over lighting produce undesirable results. Typical room ambient light levels seem to produce the best results, with the caveat that these levels must be consistent across the entire object or human being scanned (making existing room lighting unsuitable for this in many cases). Surfaces normal to the camera and lighting source (which reflect the light back as glare to the camera) were shown to be particularly problematic. Additional assessment, to characterize if performance may, in some cases, exceed measurement capabilities, remains a subject for future work. The design developed should be able to be replicated by others without significant difficulty.
Since this type of scanner is capable of capturing a 360-degree snapshot of an object within its imaging chamber, it has numerous prospective applications. A scanner of this type could support triage within or as part of the entrance to a hospital emergency ward. In this capacity, it could collect data on patient movement patterns and detect visible injuries, having this data available to the intake nurse. The scanner could also be used to produce a model of a wound’s exterior conditions. This could be utilized to track a condition over time, to aid diagnosis or for archival purposes. A chiropractor could utilize this type of 3D scanner for a similar purpose. Scanners can, similarly, facilitate performance optimization and tracking of athletes. Numerous other uses for scanning technologies exist, and thus, being able to build a complete body scanner for under $5000 enables its use in applications that could not previously support the cost of scanner procurement. The flexible camera positioning of this approach also facilitates integrating 3D scanning capabilities into existing rooms, entry ways and similar spaces. This work has demonstrated the scanner’s utility, in terms of accuracy, for many of these applications, as well as demonstrating the importance and characteristics of suitable lighting. The exploration of the use of this scanner design for these applications, as well as the identification and exploration of new applications for which this particular type of scanner is well suited will serve as a key goal of future work.

Acknowledgments

Thanks is given to undergraduate students Cameron Peterson, Jiaoni Wang and Pann Ajjimaporn who devoted significant time to scanner construction in Computer Science Course (CSCI) 297 and to Computer Science Office Manager Nancy Rice for ordering and/or going to purchase scanner parts. Funds for the 3D scanner hardware were provided by the University of North Dakota Summer Programs and Events Council (SPEC). Funding for the 3D printer that was instrumental in camera and Raspberry Pi mount fabrication was provided by North Dakota EPSCoR (NSF Grant # EPS-814442). Facilities, equipment, staff support and other resources were provided by the UND Department of Computer Science.

Author Contributions

Jeremy Straub wrote the majority of this paper and also participated significantly in the experimental design and data collection and analysis. He was also responsible for the development of the 3D scanner hardware and software system. Benjamin Kading participated in the construction of the 3D scanner hardware, as well as in experimental design and data collection. He also performed elements of the analysis of the data using computer-aided design software and made limited contributions to the text of the paper. Atif Mohammad participated in the experimental design and data collection. He also made contributions to the text of the paper. Scott Kerlin participated in the experimental design for this study, as well as the design of the 3D scanner. He was also responsible for financial management of the project.

Conflicts of Interest

The authors declare no conflict of interest.

References

  1. Straub, J.; Kerlin, S. Development of a large, low-cost, instant 3D scanner. Technologies 2014, 2, 76–95. [Google Scholar] [CrossRef]
  2. Gu, F.; Xie, H. Status and development trend of 3D laser scanning technology in the mining field. 2013. [Google Scholar] [CrossRef]
  3. Mahdjoubi, L.; Moobela, C.; Laing, R. Providing real-estate services through the integration of 3D laser scanning and building information modelling. Comput. Ind. 2013, 64, 1272–1281. [Google Scholar] [CrossRef]
  4. Laurent, J.; Fox-Ivey, R.; Dominguez, F.S.; Garcia, J.A.R. Use of 3D scanning technology for automated inspection of tunnels. In Proceedings of the 2014 World Tunnel Congress, Iguazu Falls, Brazil, 9–15 May 2014.
  5. Legg, M.; Bradley, S. Automatic 3D scanning surface generation for microphone array acoustic imaging. Appl. Acoust. 2014, 76, 230–237. [Google Scholar] [CrossRef]
  6. Bindean, I.; Stoian, V. Determination of the remaining bearing capacity of an existing slab using 3D scanning technology. In Recent Advances in Civil and Mining Engineering, Proceedings of the 4th European Conference of Civil Engineering and the 1st European Conference of Mining Engineering, Antalya, Turkey, 8–10 October 2013; WSEAS—World Scientific and Engineering Academy and Society: Stevens Point, WI, USA, 2013; pp. 136–140. [Google Scholar]
  7. Nas, S.; Jucan, S. Aspects regarding 3D laser scanning surveys for road design. Agric. Agric. Pract. Sci. J. 2013, 85, 140–144. [Google Scholar]
  8. Shih, J.; Lin, T. Fusion of image and laser-scanning data in a large-scale 3D virtual environment. Proc. SPIE 2013. [Google Scholar] [CrossRef]
  9. Dawson, P.C.; Bertulli, M.M.; Levy, R.; Tucker, C.; Dick, L.; Cousins, P.L. Application of 3D laser scanning to the preservation of Fort Conger, a historic polar research base on Northern Ellesmere Island, Arctic Canada. Arctic 2013, 66, 147–158. [Google Scholar] [CrossRef]
  10. Nesi, L. The Use of 3D Laser Scanning Technology in Buildings Archaeology: The Case of Måketorpsboden in Kulturen Museum, Lund. Master’s Thesis, Lund University, Lund, Sweden, 2013. [Google Scholar]
  11. Burens, A.; Grussenmeyer, P.; Guillemin, S.; Carozza, L.; Leveque, F.; Mathé, V. Methodological developments in 3D scanning and modelling of archaeological French heritage site: The bronze age painted cave of “LES FRAUX”, Dordogne (France). Int. Arch. Photogramm. Remote Sens. Spat. Inf. Sci. 2013, 40, 131–135. [Google Scholar] [CrossRef]
  12. Ares, M.; Royo, S.; Vidal, J.; Campderrós, L.; Panyella, D.; Pérez, F.; Vera, S.; Ballester, M.A.G. 3D scanning system for in-vivo imaging of human body. In Fringe 2013; Springer: New York, NY, USA, 2014; pp. 899–902. [Google Scholar]
  13. Filipescu, E.; Salistean, A.; Filipescu, E.; Olaru, S.; Niculescu, C. Software solution to assess morphological body through 3D scanning results. In Proceedings of the 2013 “eLearning and Software for Education” (eLSE), Bucharest, Romania, 25–26 April 2013; pp. 391–397.
  14. D’Apuzzo, N. 3D body scanning technology for fashion and apparel industry. Proc. SPIE 2007. [Google Scholar] [CrossRef]
  15. Helmore, E. Menswear’s Young Bloods Kick It Old School. Wall Street Journal, 12 February 2011. [Google Scholar]
  16. Crease, R.P. Invasion of the Full-Body Scanners. Wall Street Journal, 7 January 2010. [Google Scholar]
  17. King, R. 3D Imaging Spreads to Fashion and Beyond. BloombergBusinessweek, 6 October 2008. [Google Scholar]
  18. Chowdhury, H.; Alam, F.; Mainwaring, D.; Beneyto-Ferre, J.; Tate, M. Rapid prototyping of high performance sportswear. Procedia Eng. 2012, 34, 38–43. [Google Scholar] [CrossRef]
  19. DeMatto, A. 5 Ways Body Scanners Could Make Fitting Rooms Obsolete. Popular Mechanics, 29 June 2010. [Google Scholar]
  20. Anonymous. US Coast Guard Uses Body Scanners in Measurement of Uniforms. Fibre2fashion, 12 June 2008. [Google Scholar]
  21. Treleaven, P.; Wells, J. 3D body scanning and healthcare applications. Computer 2007, 40, 28–34. [Google Scholar] [CrossRef]
  22. Brown, W.M.; Price, M.E.; Kang, J.; Pound, N.; Zhao, Y.; Yu, H. Fluctuating asymmetry and preferences for sex-typical bodily characteristics. Proc. Natl. Acad. Sci. USA 2008, 105, 12938–12943. [Google Scholar] [CrossRef] [PubMed]
  23. Stephan, C.N.; Guyomarc’h, P. Quantification of perspective-induced shape change of clavicles at radiography and 3D scanning to assist human identification. J. Forensic Sci. 2014, 59, 447–453. [Google Scholar]
  24. Burnsides, D.; Boehmer, M.; Robinette, K. 3-D landmark detection and identification in the CAESAR project. In Proceedings of the 2001 International Conference on 3D Digital Imaging and Modeling, Quebec City, QC, Canada, 28 May–1 June 2001; pp. 393–398.
  25. Robinette, K.M.; Daanen, H.; Paquet, E. The CAESAR project: A 3-D surface anthropometry survey. In Proceedings of the Second International Conference on 3-D Digital Imaging and Modeling, Ottawa, ON, Canada, 4–8 October 1999; pp. 380–386.
  26. [TC]2 SizeUSA. Availiable online: http://www.sizeusa.com/ (accessed on 10 August 2014).
  27. News Limited Target offers 3D body scanner to measure customers. Availiable online: http://www.news.com.au/technology/body-scanner-targets-right-fit/story-e6frfro0-1226335908818 (accessed on 10 August 2014).
  28. University of the Arts London SizeUK—Results from the UK National Sizing Survey. Availiable online: http://www.arts.ac.uk/research/research-projects/completed-projects/sizeuk-results-from-the-uk-national-sizing-survey/ (accessed on 10 August 2014).
  29. Shape GB What is Shape GB? Availiable online: http://www.shapegb.org/what_is_shape_gb (accessed on 10 August 2014).
  30. Stuyck, T.; Vandermeulen, D.; Smeets, D.; Claes, P. HR-Kinect-High-Resolution Dynamic 3D Scanning for Facial Expression Analysis. Availiable online: http://www.student.kuleuven.be/~s0200995/paper.pdf (accessed on 10 August 2014).
  31. Sarghie, B.; Costea, M.; Liute, D. Anthropometric study of the foot using 3D scanning method and statistical analysis. In Proceedings of the 2013 International Symposium in Knitting and Apparel, Iasi, Romania, 21–22 June 2013.
  32. Ciobanu, O.; Xu, W.; Ciobanu, G. The use of 3D scanning and rapid prototyping in medical engineering. Fiability Durab. 2013, 2013 (Suppl. 1), 241–247. [Google Scholar]
  33. Javed, M.A.; Won, S.P.; Khamesee, M.B.; Melek, W.W.; Owen, W. A laser scanning based reverse engineering system for 3D model generation. In Proceedings of the IECON 2013—39th Annual Conference of the IEEE Industrial Electronics Society, Vienna, Austria, 10–13 November 2013; pp. 4334–4339.
  34. Peterka, J.; Morovič, L.; Pokorný, P.; Kováč, M.; Hornák, F. Optical 3D scanning of cutting tools. Appl. Mech. Mater. 2013, 421, 663–667. [Google Scholar] [CrossRef]
  35. Voicu, A.; Gheorghe, G.I.; Badita, L. 3D measuring of complex automotive parts using video-laser scanning. Sci. Bull. VALAHIA Univ. 2013, 11, 174–178. [Google Scholar]
  36. Groenendyk, M. A Further Investigation into 3D Printing and 3D Scanning at the Dalhousie University Libraries: A Year Long Case Study; Canadian Association of Research Libraries: Ottawa, ON, Canada, 2013. [Google Scholar]
  37. Bogdanova, G.; Todorov, T.; Noev, N. Digitization and 3D scanning of historical artifacts. Digit. Present. Preserv. Cult. Sci. Herit. 2013, 3, 133–138. [Google Scholar]
  38. Brozović, M.; Avsec, A.; Tevčić, M. Dimensional control of complex geometry objects using 3D scanning technology. In Proceedings of the 14th International Scientific Conference on Production Engineering-Cim, Biograd, Hrvatska, 19–22 June 2013.
  39. Daanen, H.M.; van de Water, G.J. Whole body scanners. Displays 1998, 19, 111–120. [Google Scholar] [CrossRef]
  40. Borghese, N.A.; Ferrigno, G.; Baroni, G.; Pedotti, A.; Ferrari, S.; Savarè, R. Autoscan: A flexible and portable 3D scanner. IEEE Comput. Graph. Appl. 1998, 18, 38–41. [Google Scholar] [CrossRef]
  41. Rocchini, C.; Cignoni, P.; Montani, C.; Pingi, P.; Scopigno, R. A low cost 3D scanner based on structured light. In Computer Graphics Forum; Wiley Online Library: Hoboken, NJ, USA, 2001; Volume 20, pp. 299–308. [Google Scholar]
  42. Daanen, H.; Ter Haar, F. 3D whole body scanners revisited. Displays 2013, 34, 270–275. [Google Scholar] [CrossRef]
  43. Grivon, D.; Vezzetti, E.; Violante, M.G. Development of an innovative low-cost MARG sensors alignment and distortion compensation methodology for 3D scanning applications. Robot. Auton. Syst. 2013, 61, 1710–1716. [Google Scholar] [CrossRef]
  44. Grivon, D.; Vezzetti, E.; Violante, M. Study and development of a low cost “OptInertial” 3D scanner. Precis. Eng. 2014, 38, 261–269. [Google Scholar] [CrossRef]
  45. Galantucci, L.M.; Lavecchia, F.; Percoco, G.; Raspatelli, S. New method to calibrate and validate a high-resolution 3D scanner, based on photogrammetry. Precis. Eng. 2014, 38, 279–291. [Google Scholar] [CrossRef]
  46. Rocchini, C.; Cignoni, P.; Montani, C.; Scopigno, R. Acquiring, stitching and blending diffuse appearance attributes on 3D models. Vis. Comput. 2002, 18, 186–204. [Google Scholar] [CrossRef]
  47. Bruno, F.; Bianco, G.; Muzzupappa, M.; Barone, S.; Razionale, A. Experimentation of structured light and stereo vision for underwater 3D reconstruction. ISPRS J. Photogramm. Remote Sens. 2011, 66, 508–518. [Google Scholar] [CrossRef]
  48. Fourie, Z.; Damstra, J.; Gerrits, P.O.; Ren, Y. Evaluation of anthropometric accuracy and reliability using different three-dimensional scanning systems. Forensic Sci. Int. 2011, 207, 127–134. [Google Scholar] [CrossRef] [PubMed]
  49. Kouchi, M.; Mochimaru, M. Errors in landmarking and the evaluation of the accuracy of traditional and 3D anthropometry. Appl. Ergon. 2011, 42, 518–527. [Google Scholar] [CrossRef] [PubMed]
  50. Lu, J.; Wang, M.J.; Mollard, R. The effect of arm posture on the scan-derived measurements. Appl. Ergon. 2010, 41, 236–241. [Google Scholar] [CrossRef] [PubMed]
  51. Lu, J.; Wang, M. The evaluation of scan-derived anthropometric measurements. IEEE Trans. Instrum. Measur. 2010, 59, 2048–2054. [Google Scholar] [CrossRef]
  52. Ma, Y.; Kwon, J.; Mao, Z.; Lee, K.; Li, L.; Chung, H. Segment inertial parameters of Korean adults estimated from three-dimensional body laser scan data. Int. J. Ind. Ergon. 2011, 41, 19–29. [Google Scholar] [CrossRef]
  53. Robinette, K.M.; Daanen, H.A. Precision of the CAESAR scan-extracted measurements. Appl. Ergon. 2006, 37, 259–265. [Google Scholar] [CrossRef] [PubMed]
  54. Tikuisis, P.; Meunier, P.; Jubenville, C. Human body surface area: Measurement and prediction using three dimensional body scans. Eur. J. Appl. Physiol. 2001, 85, 264–271. [Google Scholar] [CrossRef] [PubMed]
  55. Yu, W.; Xu, B. A portable stereo vision system for whole body surface imaging. Image Vis. Comput. 2010, 28, 605–613. [Google Scholar] [CrossRef] [PubMed]
  56. Polo, M.; Felicisimo, A.M.; Villanueva, A.G.; Martinez-del-Pozo, J. Estimating the uncertainty of Terrestrial Laser Scanner measurements. IEEE Trans. Geosci. Remote Sens. 2012, 50, 4804–4808. [Google Scholar] [CrossRef]

