Article

Crustal Strain Observation Using a Two-Color Interferometer with Accurate Correction of Refractive Index of Air

1
National Institute of Advanced Industrial Science and Technology, 1-1-1, Umezono, Tsukuba, Ibaraki 305-8563, Japan
2
Earthquake Research Institute, University of Tokyo, 1-1-1, Yayoi, Bunkyo-ku, Tokyo 113-0032, Japan
*
Author to whom correspondence should be addressed.
Technologies 2014, 2(3), 115-128; https://doi.org/10.3390/technologies2030115
Submission received: 30 April 2014 / Revised: 23 June 2014 / Accepted: 24 June 2014 / Published: 4 July 2014
(This article belongs to the Special Issue Precision Measurements and Metrology Using Lasers)

Abstract

:
A highly accurate two-color interferometer with automatic correction of the refractive index of air was developed for crustal strain observation. The two-color interferometer, which can measure a geometrical distance of approximately 70 m, with a relative resolution of 2 × 10⁻⁹, clearly detected a change in strain due to earth tides in spite of optical measurement in air. Moreover, a large strain quake due to an earthquake could be observed without disturbing the measurement. We demonstrated the advantages of the two-color interferometer in air for geodetic observation.

1. Introduction

For geophysical observations, various methods are used to measure crustal deformation, such as global positioning system (GPS), interferometric synthetic aperture radar (InSAR), satellite laser ranging (SLR), electronic distance meter (EDM), and very long baseline interferometry (VLBI) [1,2,3,4,5]. In addition to these methods, long-baseline strainmeters (otherwise known as extensometers) have been used in more sensitive geodetic and seismic observations to measure the distance between two reference points on the basis of a stable rod, fiber-optic strain sensor or a wavelength of laser light as a measurement reference [6,7,8,9]. Fiber-optic strain sensors based on optical response to strain of an optical fiber are sometimes used for short-baseline strain measurements [9]. A laser strainmeter measures the long distance directly using a laser interferometer with light of the stable wavelength as a reference. Owing to the use of a highly frequency stabilized laser, the laser strainmeter has excellent performance such as high resolution, low drift, wide dynamic range and rapid response, which are required for geodetic and seismic observations [10]. A laser strainmeter with a 100 m baseline in vacuum was constructed at an underground site in Kamioka mine, and accurate strain observation was achieved with a sensitivity of ~10−12 [11,12]. Expandability of the baseline length in the laser strainmeters is another advantage of enhancing the strain sensitivity; however, it is practically difficult to construct a very long strainmeter (e.g., 100 m to several km) or to construct a number of even shorter strainmeters as an observation network, mainly because of the cost of the vacuum system. Hence, a laser interferometer without a vacuum system, whose optical paths are in air, will be very useful provided the required measurement accuracy can be attained.
The refractive index of air strongly affects the sensitivity of a laser interferometer in air. The refractive index of air can be used to correct a laser interferometer in the laboratory because the air conditions can be measured exactly in a small space. The temperature, pressure, humidity, and carbon dioxide density are required to calculate the refractive index of air. Among these parameters, the temperature and pressure strongly affect the refractive index of air. The pressure can be measured easily and precisely because of its high uniformity even over a large area. However, the temperature varies with the location. Thus, a large number of thermometers would be required along the baseline for a long laser strainmeter in air.
As the absolute value of the refractive index of air and its relative change with respect to the environmental parameters depend on the wavelength of light, an interferometer using two light sources of different wavelengths can measure a geometrical distance without measuring the environmental parameters of the air. This interferometer is called a “two-color interferometer”, and many studies have been performed on such interferometers [13,14]. A similar principle has been employed in GPS for the correction of ionospheric delays. However, the precision of the measured distance is generally one or two orders of magnitude worse than that of a single-wavelength interferometer, which can perform high-accuracy environmental measurements. This is due to the following reason in the two-color measurement. The correction value originates from the product of the difference between the optical distances and A-constant in a two-color interferometer. This constant is decided from two wavelengths of the light sources, and it lies in the range of 50–150. In other words, the precision of two-color interferometer measurement is worse than the difference between the measured optical distances by a factor of A-constant. It is difficult to measure optical distances with A-constant times higher resolution because the interference fringes change rapidly and by large amounts due to disturbance of the air flow. Otherwise, the difference between the optical distances changes slowly and by small amounts. Therefore, in our developed system, the difference was measured directly. The direct measurement of the difference using two nonlinear optical crystals generating second-harmonic light has been reported [15].
The principle of two-color correction, the interferometer system and demonstration of its operation in a shallow tunnel in our campus (National Institute of Advanced Industrial Science and Technology: AIST) and at a deep underground site in Kamioka mine are described.

2. Refractive Index of Air

The changes in the refractive index of air with respect to temperature and pressure are approximately −1 ppm/°C and 0.3 ppm/hPa, respectively, in the range of visible and near IR light. Edlen [16] and Ciddor [17] proposed an equation for the refractive index of air. In both equations, the refractive index of air is calculated as a function of the temperature, pressure, humidity, and carbon dioxide density of the air and the wavelength of the light source.
Here, we consider the equation proposed by Ciddor. The wavelength of the light and the temperature, pressure, humidity and carbon dioxide density of the air are denoted by λ, T, P, h, and xc, respectively, and the refractive index of air is denoted by n(λ, T, P, h, xc), which is expressed by the following functional formula:
n(λ, T, P, h, xc) − 1 = {naxs (λ) −1} · F (T, P, h, xc) + {nws (λ) −1} · W (T, P, h, xc)
where naxs(λ) is a function of the refractive index for standard air, whose parameters are T = 15 °C, P = 101,325 Pa, h = 0% and xc = 450 ppm. F(T, P, h, xc) depends on the air conditions and is unity for the standard air. The second term, on the right side in Equation (1), is the correction function for water vapor. nws(λ) is the correction value for the standard air conditions, which are defined as a temperature of 20 °C and a partial vapor pressure of 1333 Pa. When the humidity is 0%, W(T, P, h = 0, xc). In this case, Equation (1) becomes:
n(λ, T, P, h = 0, xc) − 1 = {naxs (λ) −1} · F (T, P, h = 0, xc)
The right side of this formula is the product of two functions, one depending on only the wavelength and the other depending on only the environmental parameters.

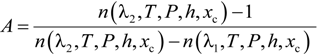
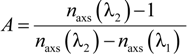
3. Principle of Two-Color Measurement

First we define the two terms “geometrical distance” and “optical distance”. The geometrical distance is the spatial distance between two points. The optical distance is the distance measured using light. The relationship between the geometrical distance L(Geo) and the optical distance L(Opt) is:
L(Opt) = L(Geo) · n(λ, T, P, h, xc)
Hereafter, the optical distance is denoted by L(Opt)(λ) because we use two wavelengths to measure the same geometrical distance in the same environment.
When we measure a separation between two points using two interferometers with light sources of different wavelengths, the geometrical distances are obviously the same, while the optical distances are different because of the different refractive indices. As the paths of the two light sources are the same, the environmental parameters determining the refractive index of air, i.e., the temperature, pressure, humidity, and carbon dioxide density, are exactly the same. Thus, the geometrical distance is given by the following equations in two-color measurement:
L(Geo) = L(Opt)2) − A · {L(Opt)2) − L(Opt)1)}
Technologies 02 00115 i001
where the two wavelengths are λ1 and λ2. If the air in the optical path is dry air, i.e., h = 0, then from Equation (2), Equation (5) becomes:
Technologies 02 00115 i002
Because naxs(λ) is a refractive index of the standard air, A is independent of environmental parameters such as temperature and pressure. This means that we can obtain the geometrical distance from the two wavelengths and the measured interference fringes without measuring the environmental parameters of air.
If the air is not dry, A depends on the environmental parameters. However, because its dependence is weak, coarse measurements of the environmental parameters are sufficient for the correction.

4. Two-Color Interferometer

4.1. Optical Configuration

The two-color interferometer that we developed is shown in Figure 1. Its light source is the fundamental wavelength of a Nd:YAG laser (λ1 = 1064 nm) and the second-harmonic of the laser (λ2 = 532 nm). The ratio of the two wavelengths in vacuum is exactly two because the second-harmonic light is generated from the fundamental light using a nonlinear optical crystal. The interferometers are heterodyne interferometers for each wavelength. The laser beams with the fundamental and second-harmonic wavelengths are separately delivered by two polarization-maintaining fibers to the interferometer from the light source, whose frequency is stabilized by iodine molecular absorption. The two beams are combined by a harmonic beam splitter which transmits the beam of the fundamental wavelength and reflects the beam of the second-harmonic wavelength. The combined laser beam travels to a beam splitter, where it is divided into a reference path and a measurement path. An acoustic optical modulator (AOM) is inserted in the reference path. The heterodyne frequencies are generated by the AOM which applies frequency shifts to the diffracted beams. Because the diffraction angle is proportional to the wavelength of the laser beam, the angle of the first-order diffracted beam with the fundamental wavelength and the angle of the second-order diffracted beam with the second-harmonic wavelength are the same. The frequency of light of the first-order diffracted beam is shifted by the driving frequency of the AOM, whereas the frequency of light of the second-order diffracted beam is shifted by twice the driving frequency of the AOM. As we used a frequency of 65 MHz to drive the AOM, the heterodyne reference frequency of the fundamental wavelength (f1(Ref)) is 65 MHz and that of the second-harmonic wavelength (f2(Ref)) is 130 MHz in this experiment. Both diffracted beams travel on the same reference path and are recombined by another beam splitter with the beams from the measurement path. The interference beams are divided by a harmonic separator into beams of each wavelength, which are detected by photodetectors. The photodetectors for the fundamental and second-harmonic wavelengths output electric signals with frequencies of f1(If) and f2(If), respectively, which are related to the heterodyne interference signals. f1(If) and f2(If) equal f1(Ref) and f2(Ref), respectively, when the measurement path is not changing.
Figure 1. Diagram of the optical layout and the electrical signal processing. All oscillators are synchronized by the connection of their frequency reference.
Technologies 02 00115 g001
Here, we consider the case that the reflector in the measurement path moves with a velocity of V in vacuum. Because the laser beams travel a round-trip of the measurement path because of their reflection, f1(If) and f2(If) undergo frequency shifts of 2V/λ1 and 2V/λ2, respectively. The signs of the frequency shifts depend on the direction of the velocity and on the polarity of the diffraction by the AOM. If the f1(If) becomes f1(Ref) + 2V/λ1, f2(If) becomes f2(Ref) + 2V/λ2. Since f2(Ref) =2 × f1(Ref) and λ1 = 2 × λ2, we obtain the following equation:
f2(If) − 2 × f1(If) = 0
Although we are considering measurement in vacuum, Equation (7) is applicable to our measurement in air because the displacement is relatively small compared with the measurement distance.
Next, we consider the case that the reflector does not move but the environmental parameters change along the measurement path in air. While the refractive indices of air for the fundamental and second-harmonic wavelengths change at rates of 1 and 2, respectively because of temperature or pressure changing, f1(If) and f2(If) undergo frequency shifts of 2L(Geo)11 and 2L(Geo)22, respectively. Thus, the frequencies of the heterodyne interference signals are f1(IF) = f1(Ref) + 2L(Geo)1 / λ1 and f2(IF) = f2(Ref) + 2L(Geo)2 / λ2. We obtain the following equation from Equation (3):
Technologies 02 00115 i003
The phase difference between the frequency-doubled heterodyne interference signal for the fundamental wavelength and the heterodyne interference signal for the second-harmonic wavelength is obtained by integrating the left side of Equation (8). The integration of both sides of the Equation (8) gives:
Δφ = 2{L(Opt)2) − L(Opt)1)} /λ2

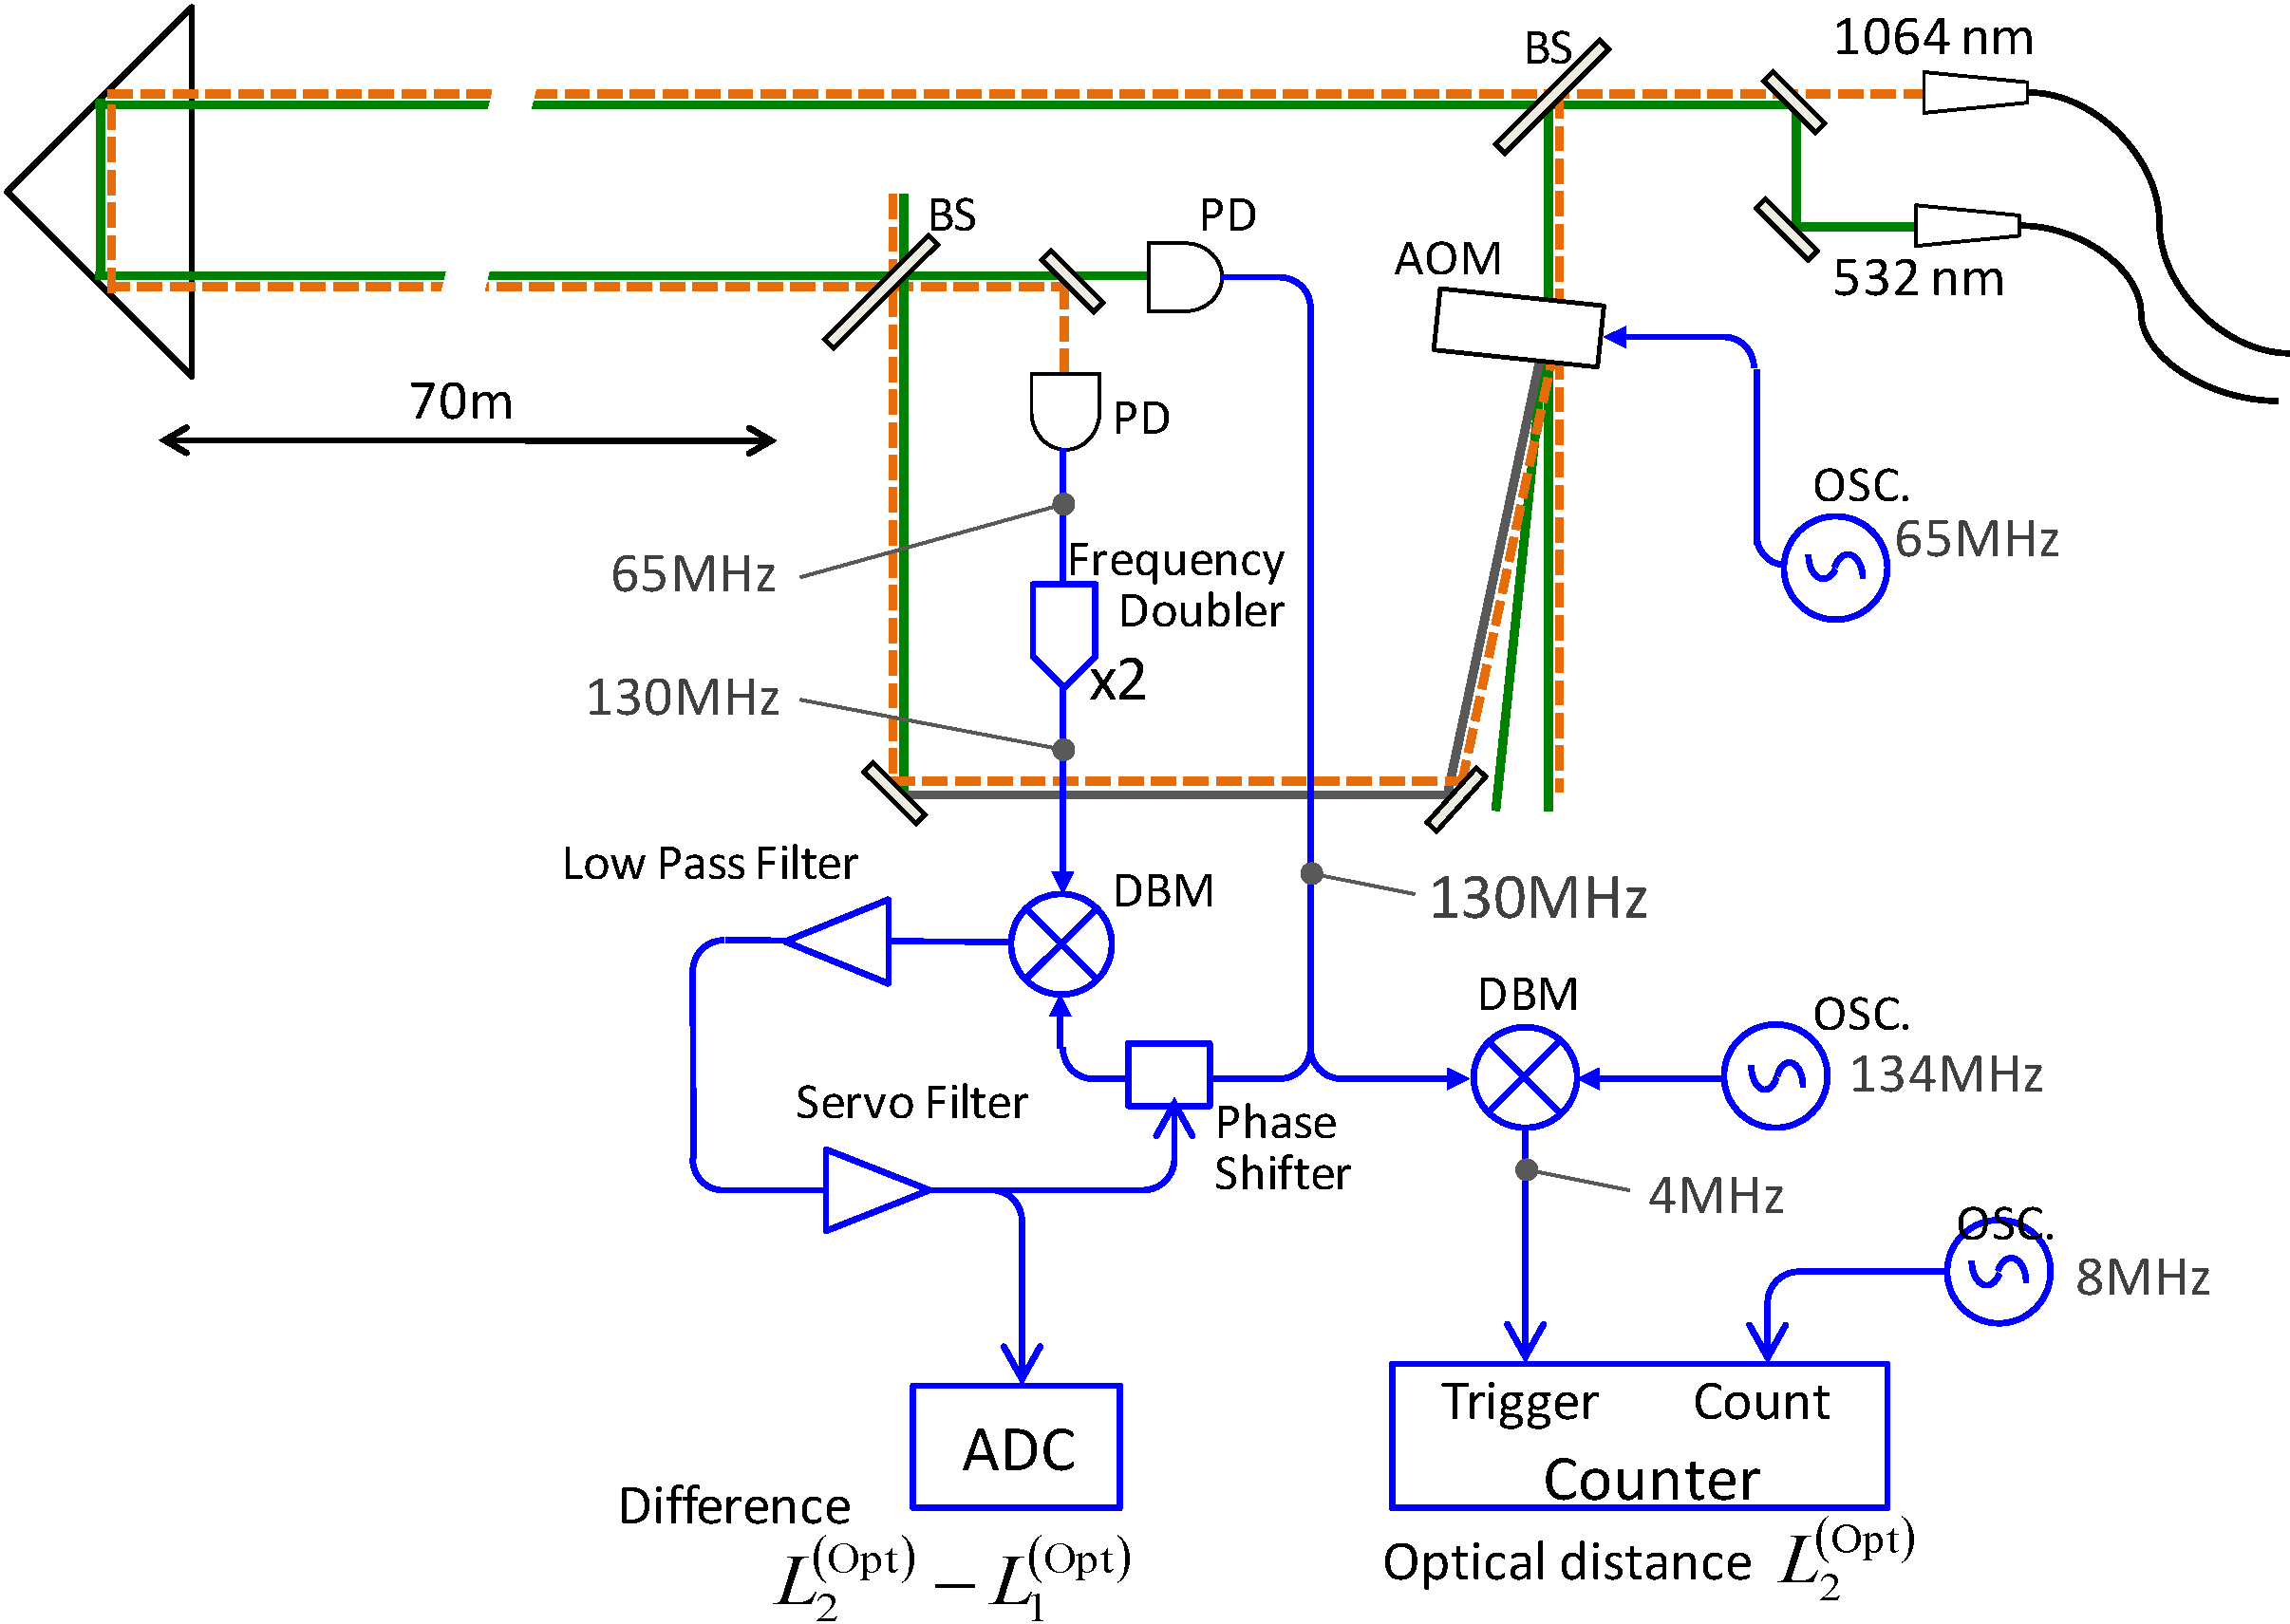
4.2. Measurement System
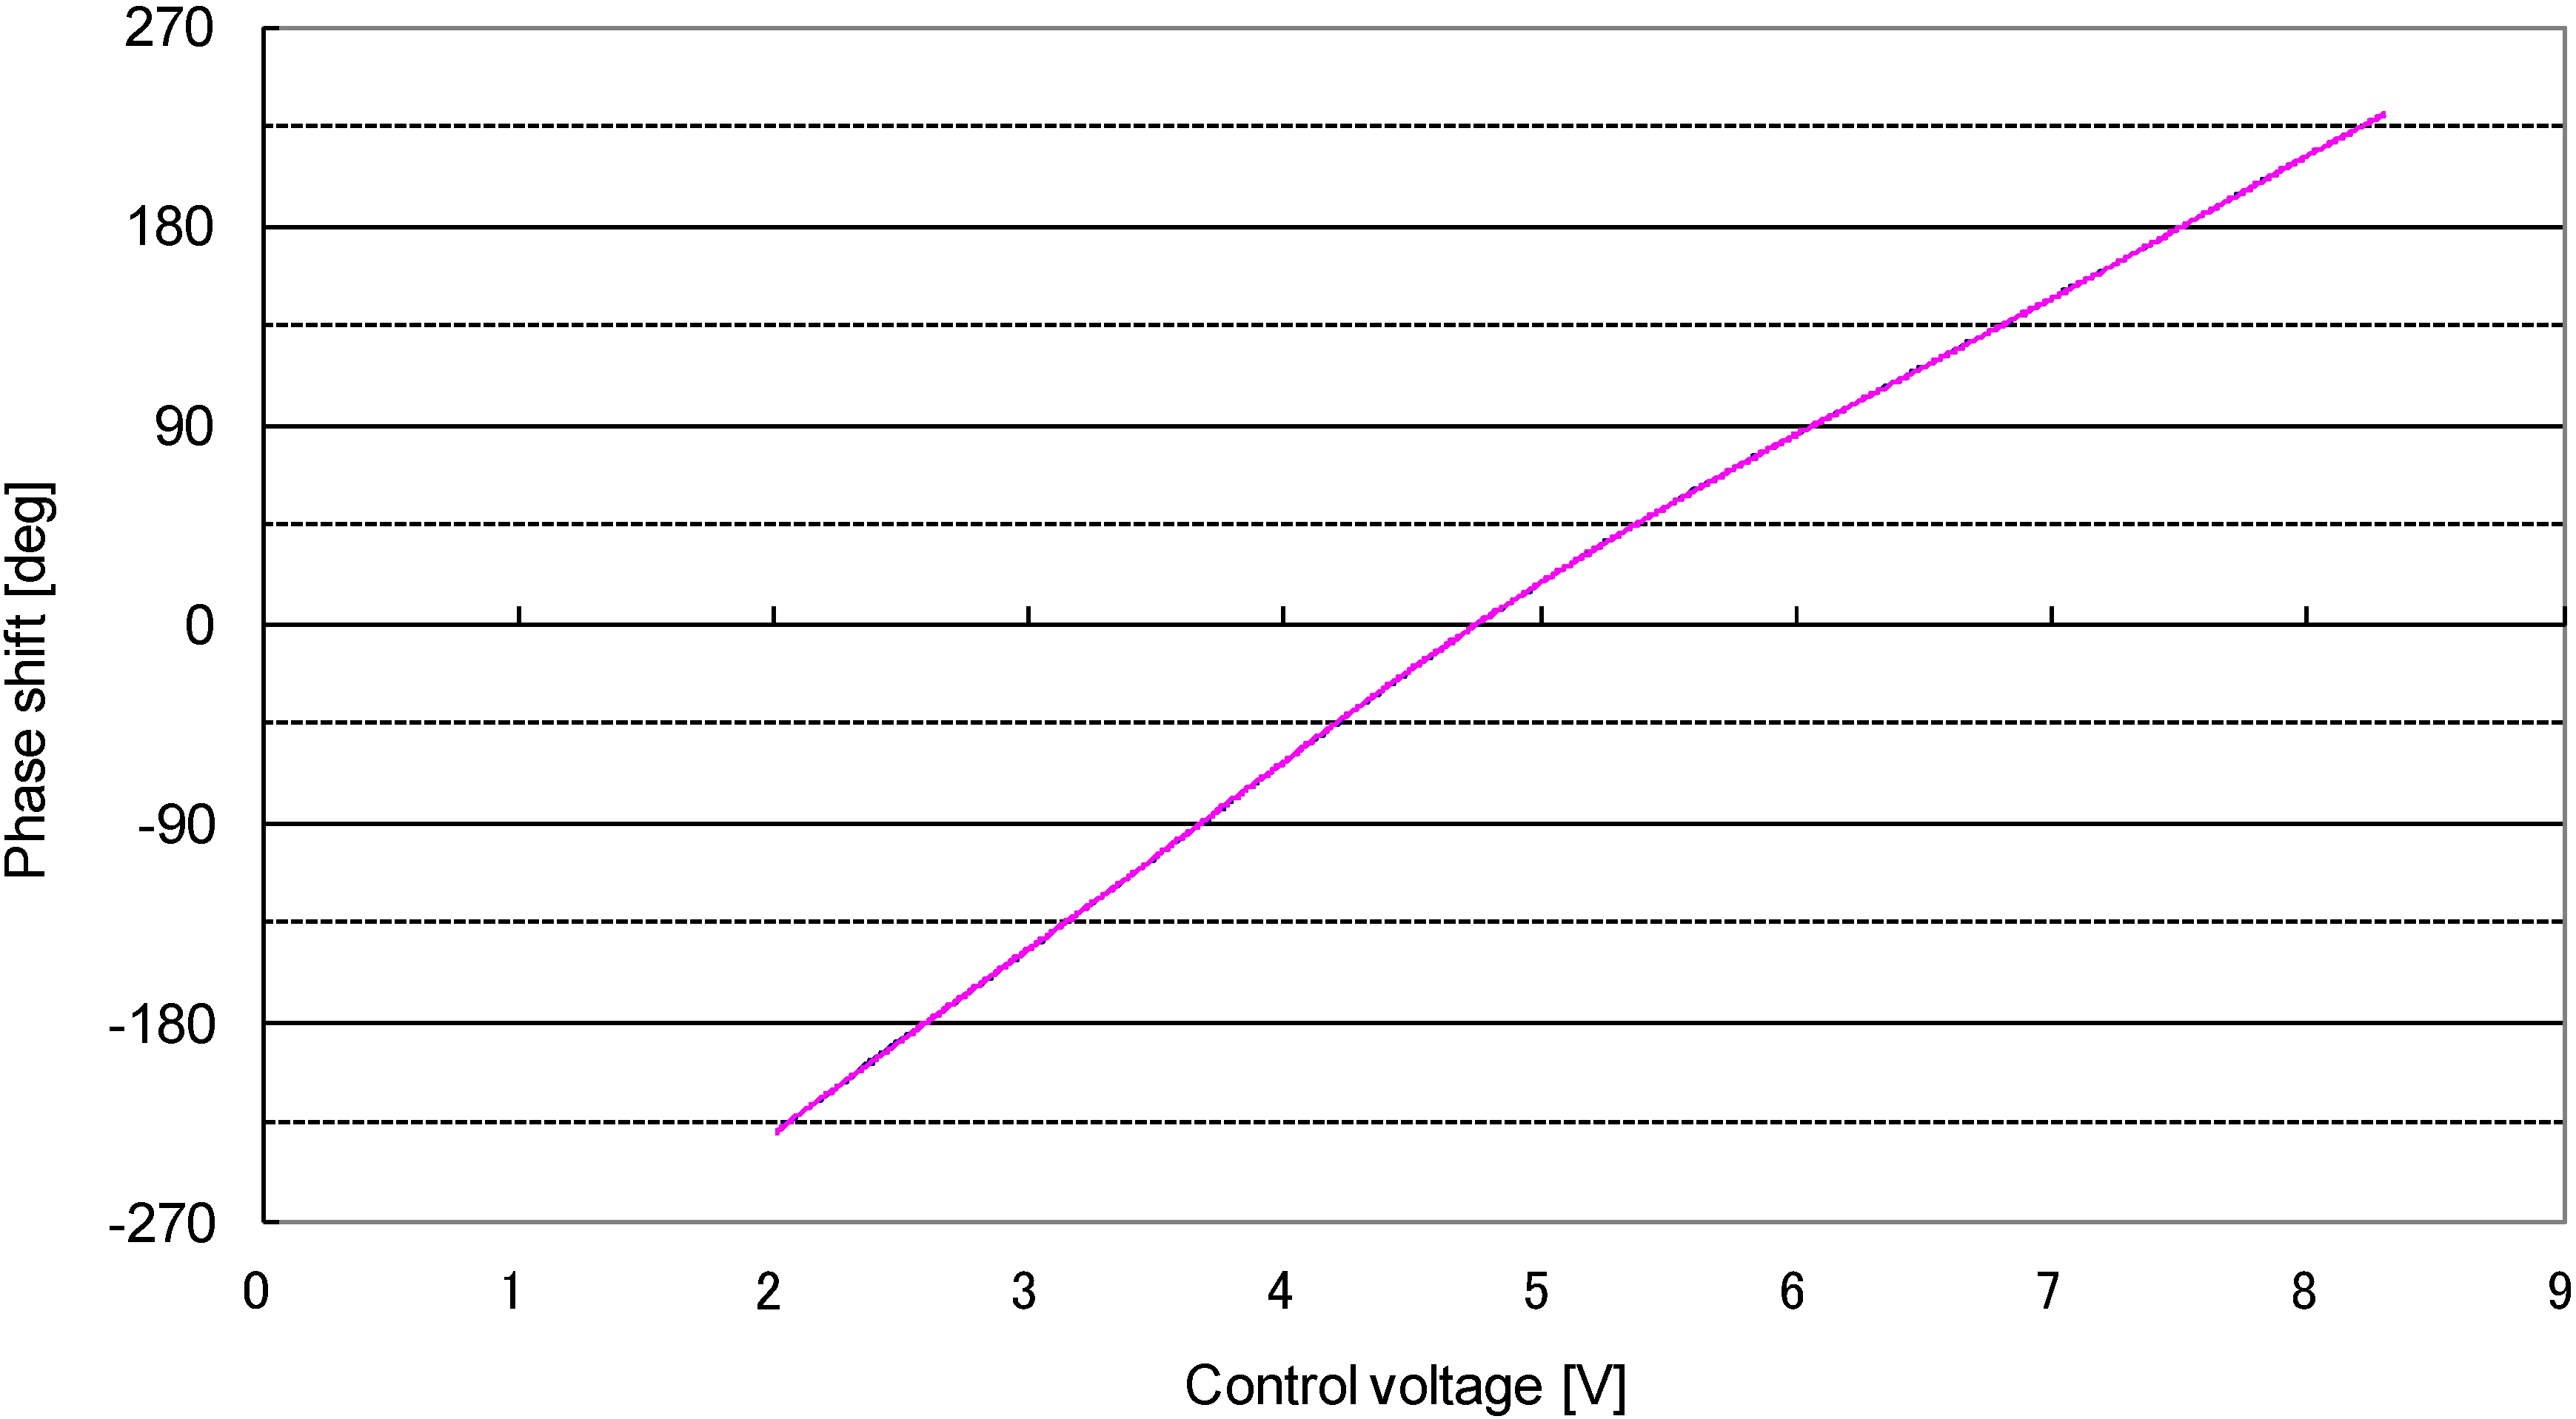
In order to obtain the Δɸ signal, the output signal of the photodetector for the second-harmonic wavelength and the doubled-frequency signal of the output of the photodetector for fundamental wavelength were mixed by a double balanced mixer (DBM) and then the DBM output signal was passed through a low-pass filter. This electrical signal is sinusoidal with respect to Δɸ. The signal changes slowly, but its phase needs to be measured with high precision. We used a feedback method to measure the phase. The signal with the second-harmonic wavelength is applied to the DBM through a voltage-controlled analog phase shifter, while the doubled-frequency signal with the fundamental wavelength is applied directly to the DBM. The former signal applied to the DBM is feedback-controlled using the phase shifter to maintain a quadrature phase with the latter signal. From the control voltage of the phase shifter, the original phase difference between the signals, i.e., Δɸ, is detected. The calibration of the phase shifter to the control voltage is described in the next section. A digital signal processor (DSP) was used for feedback control in this system. It is easy to reset the feedback control using a DSP when the controlled phase exceeds ±180°. The hysteresis of thresholds was included in the feedback control; the feedback control is switched off at a phase of +210° then switched on again with the phase controlled at approximately −150°. With this control, no chattering between +180° and −180° was observed.
The optical distance, i.e., L(Opt)2), is also required to be measured in order to obtain the geometrical distance in the two-color interferometer from Equation (4). Quadrature phase detection is usually used for signal processing on a heterodyne interferometer as the phase difference between the heterodyne interference signal and the heterodyne reference signal is proportional to the optical distance. However, in the two-color interferometer, a resolution of the optical distance L(Opt)2) of one fringe or a fraction of a fringe is sufficient because of the poor resolution of A·{L(Opt)2) − L(Opt)1)}. For this reason, the heterodyne interference signal and heterodyne reference signal are simply counted simultaneously using counters to obtain the optical distance. In this way, the difference between the two counts corresponds to the optical distance including polarity. The frequency of the signals of around 130 MHz is down-converted to around 4 MHz by mixing with 134 MHz signals generated by a local oscillator. The distance resolution does not change after this conversion, although the detection range of the mirror velocity becomes smaller; the signal of 4 MHz can cover displacement velocities of up to about 1 m/s, which is sufficient to measure crustal strain even in seismic wave observation.
In order to acquire the counts of both the interference signal and the reference signal by computer simultaneously and continuously, our laboratory-built TTL counter system has a latch-and-buffer system. A trigger signal is generated by the interval of of the counter for the interference signal and the count value of the counter for the reference signal is pushed to the buffer by the trigger signal. The data of the buffer is sent to the computer. The change in the optical distance ΔL during ΔT satisfies, (f2(IF)f2(Ref)) × ΔT = 2 ΔL2. When the trigger interval time is ΔT, i.e., C = f2(IF)ΔT, the counted value of the reference signal, f2(Ref)ΔT, subtracted from C gives the change in the distance corresponding to the resolution of λ2/2. The count value of a sample was acquired in about 3.8 sample/s because we set to be 220 counts and the interference signal was around 4 MHz. As the heterodyne frequency is generated by an oscillator, the down converted heterodyne reference signals of 4 MHz can be directly generated by another oscillator. In this counter system, when the another oscillator generates a signal with a frequency of f3(Ref) instead of 4 MHz, the distance resolution becomes (4 MHz/f3(Ref)) × (λ2/2) because the counted value of the reference signal becomes f3/4 MHz × (C − 2 ΔL/λ2) during ΔT. As we used 8 MHz as the frequency f3(Ref), the resolution of the optical distance was λ2/4, i.e., 133 nm.

5. Calibration

The difference between the optical distances of the two wavelengths should be measured with sufficiently high accuracy. This difference appears as the phase difference between the frequency-doubled interference signal of the fundamental wavelength and the interference signal of the second-harmonic wavelength. The phase difference is measured from the control voltage of the analog phase shifter. Thus, the response function of the voltage to the phase of the analog phase shifter should be calibrated with high accuracy. Calibration reference signals generated by local oscillators are applied instead of the signals from photodetectors. The local oscillators generate the calibration reference signals at 65 MHz and 130 MHz for the fundamental and second-harmonic wavelengths, respectively. Then, the frequency of one of the calibration reference signals is changed slightly, for example, the signal for the fundamental wavelength is changed from 65 MHz to 65 MHz + 0.01 Hz. In this case, the frequency-doubled signal input to the DBM becomes 130 MHz + 0.02 Hz. Because the frequency of the second-harmonic wavelength is 130 MHz, the signal of the DBM output with the low-pass filter changes by 360° in 50 s. This signal, having a definitive phase and rate of change, can be used to calibrate the analog phase shifter including the nonlinearity and the hysteresis by recording the control voltage in a time series. Figure 2 shows the calibration curve of the analog phase shifter obtained by this method.
Figure 2. Calibration curve of the phase shifter. Although two curves were drawn for increasing and decreasing voltage, they cannot be separated due to less hysteresis.
Technologies 02 00115 g002

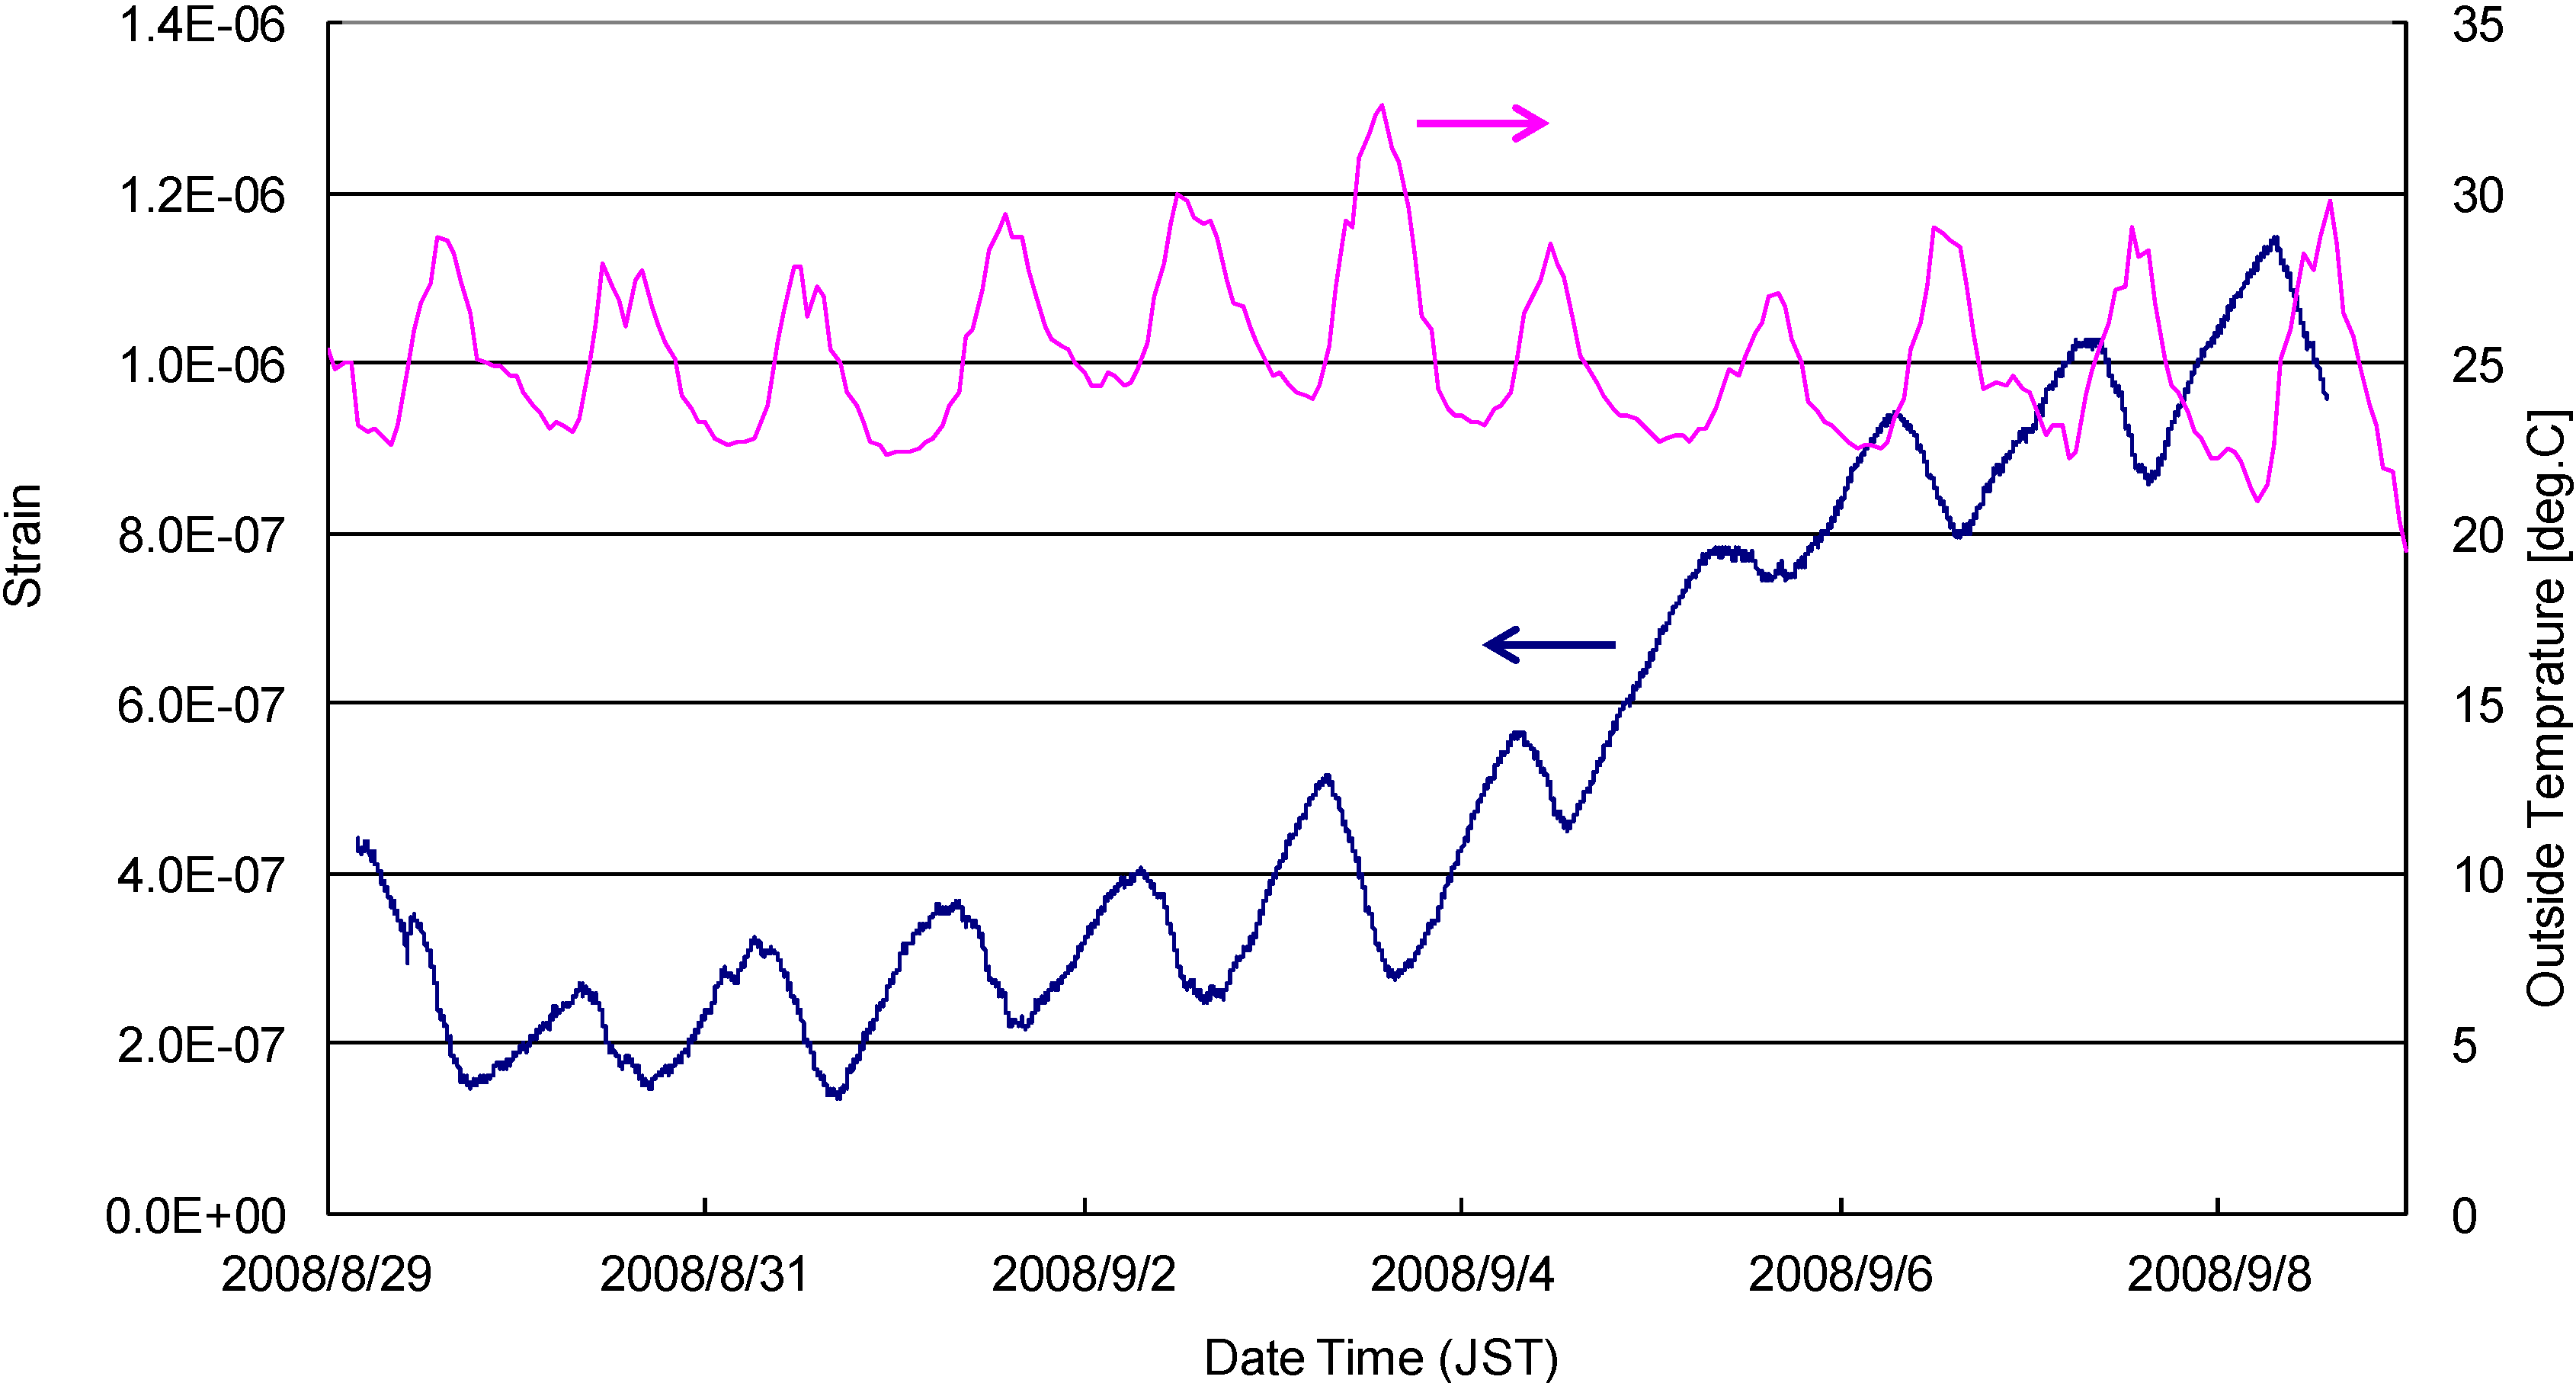
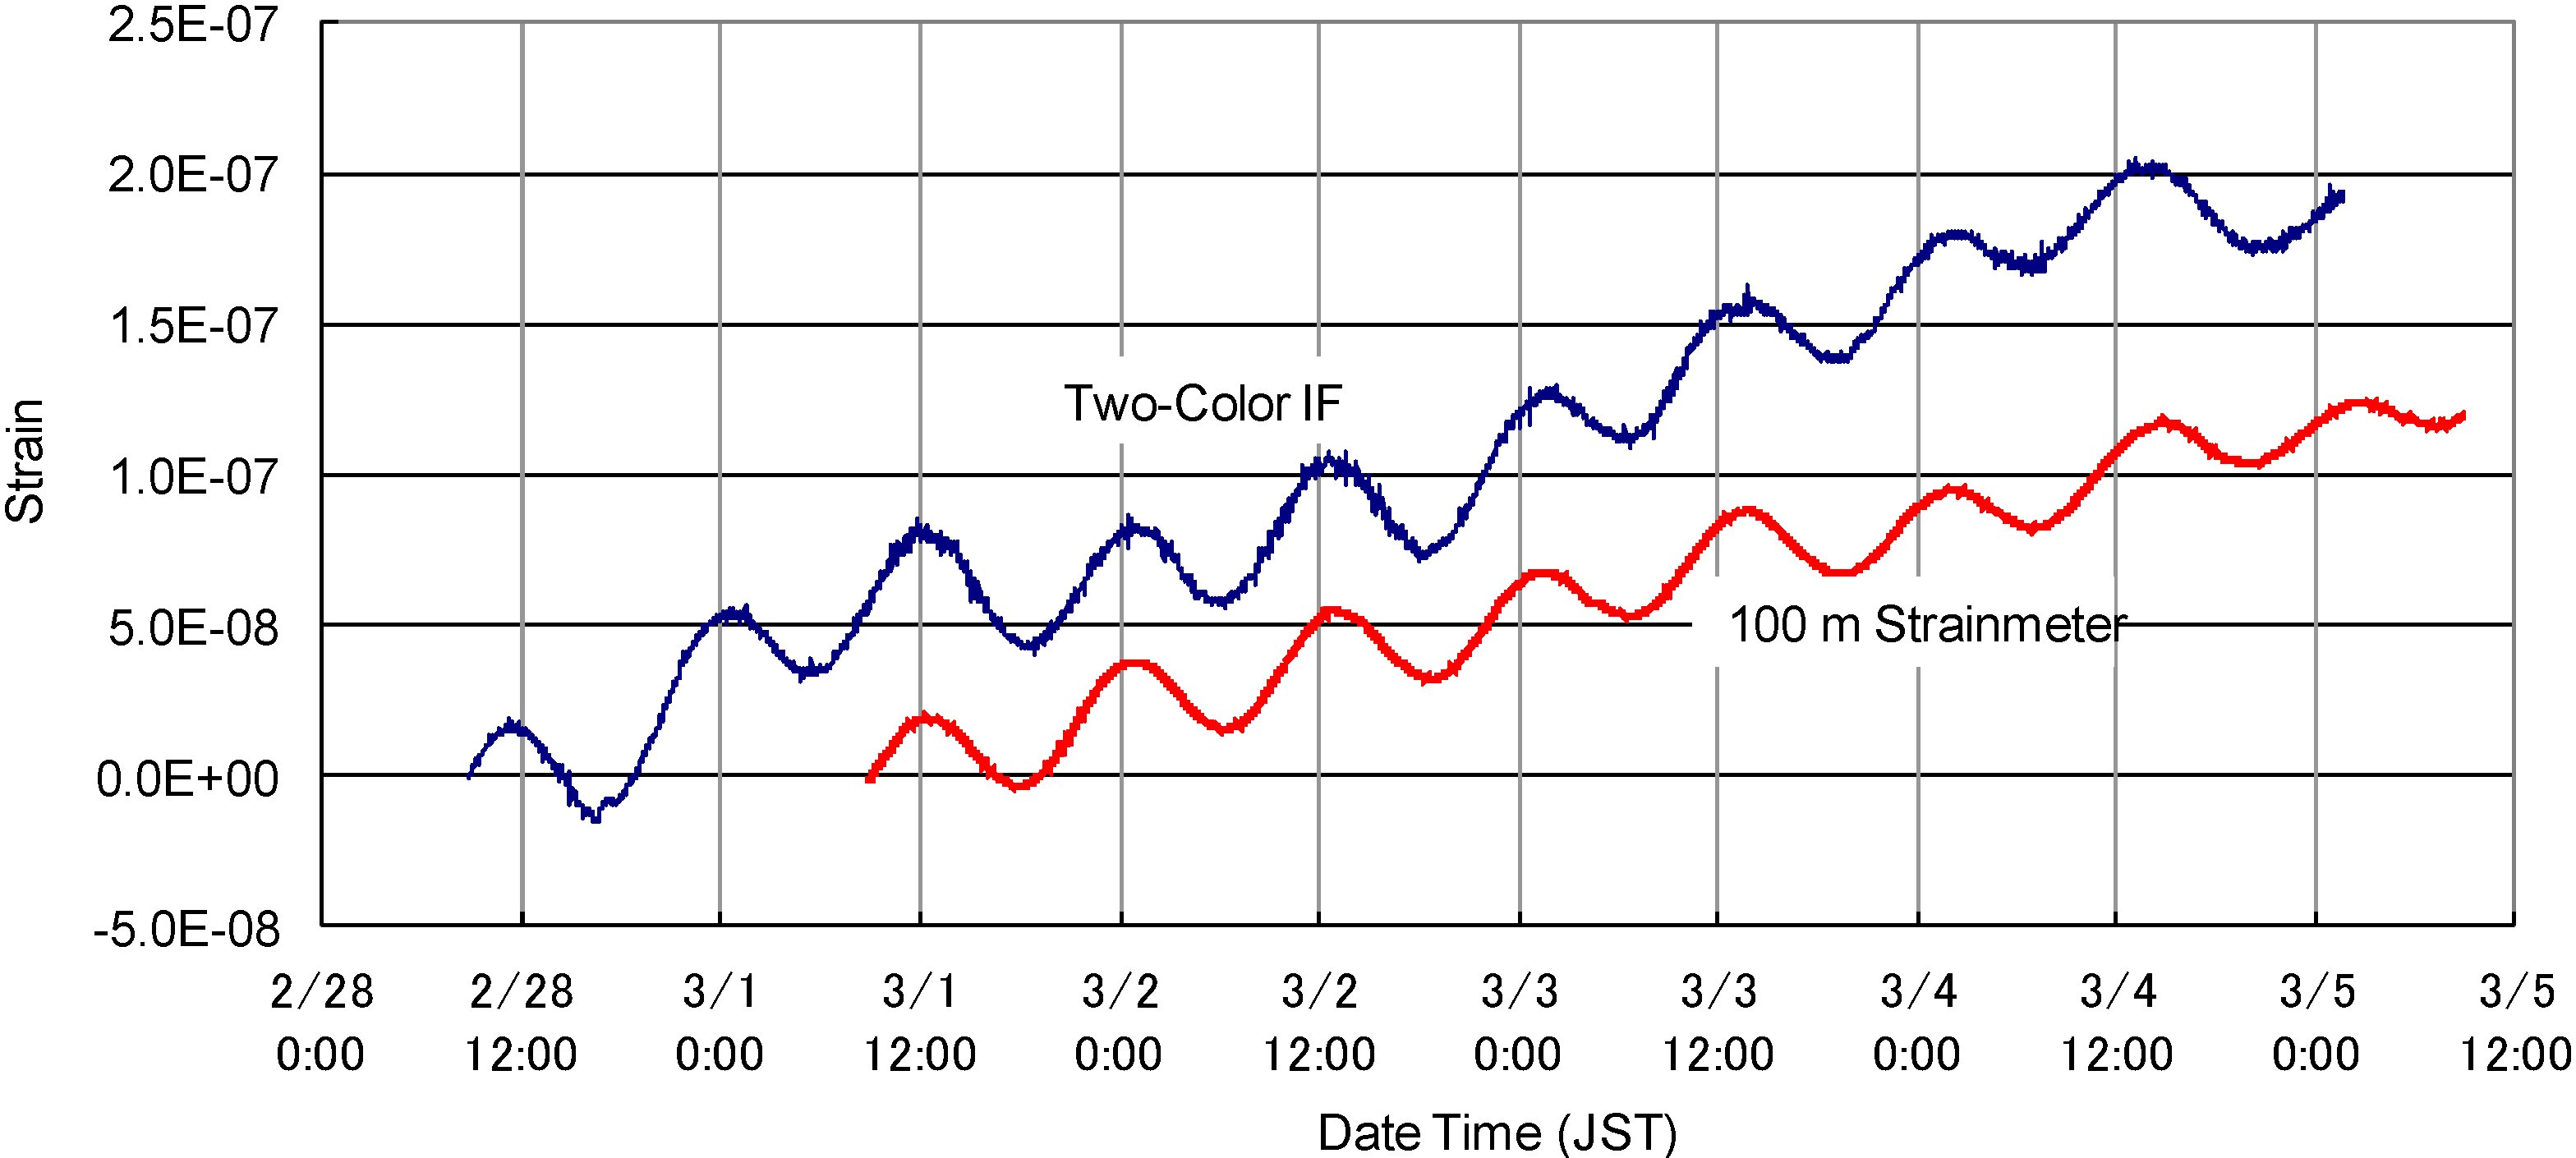
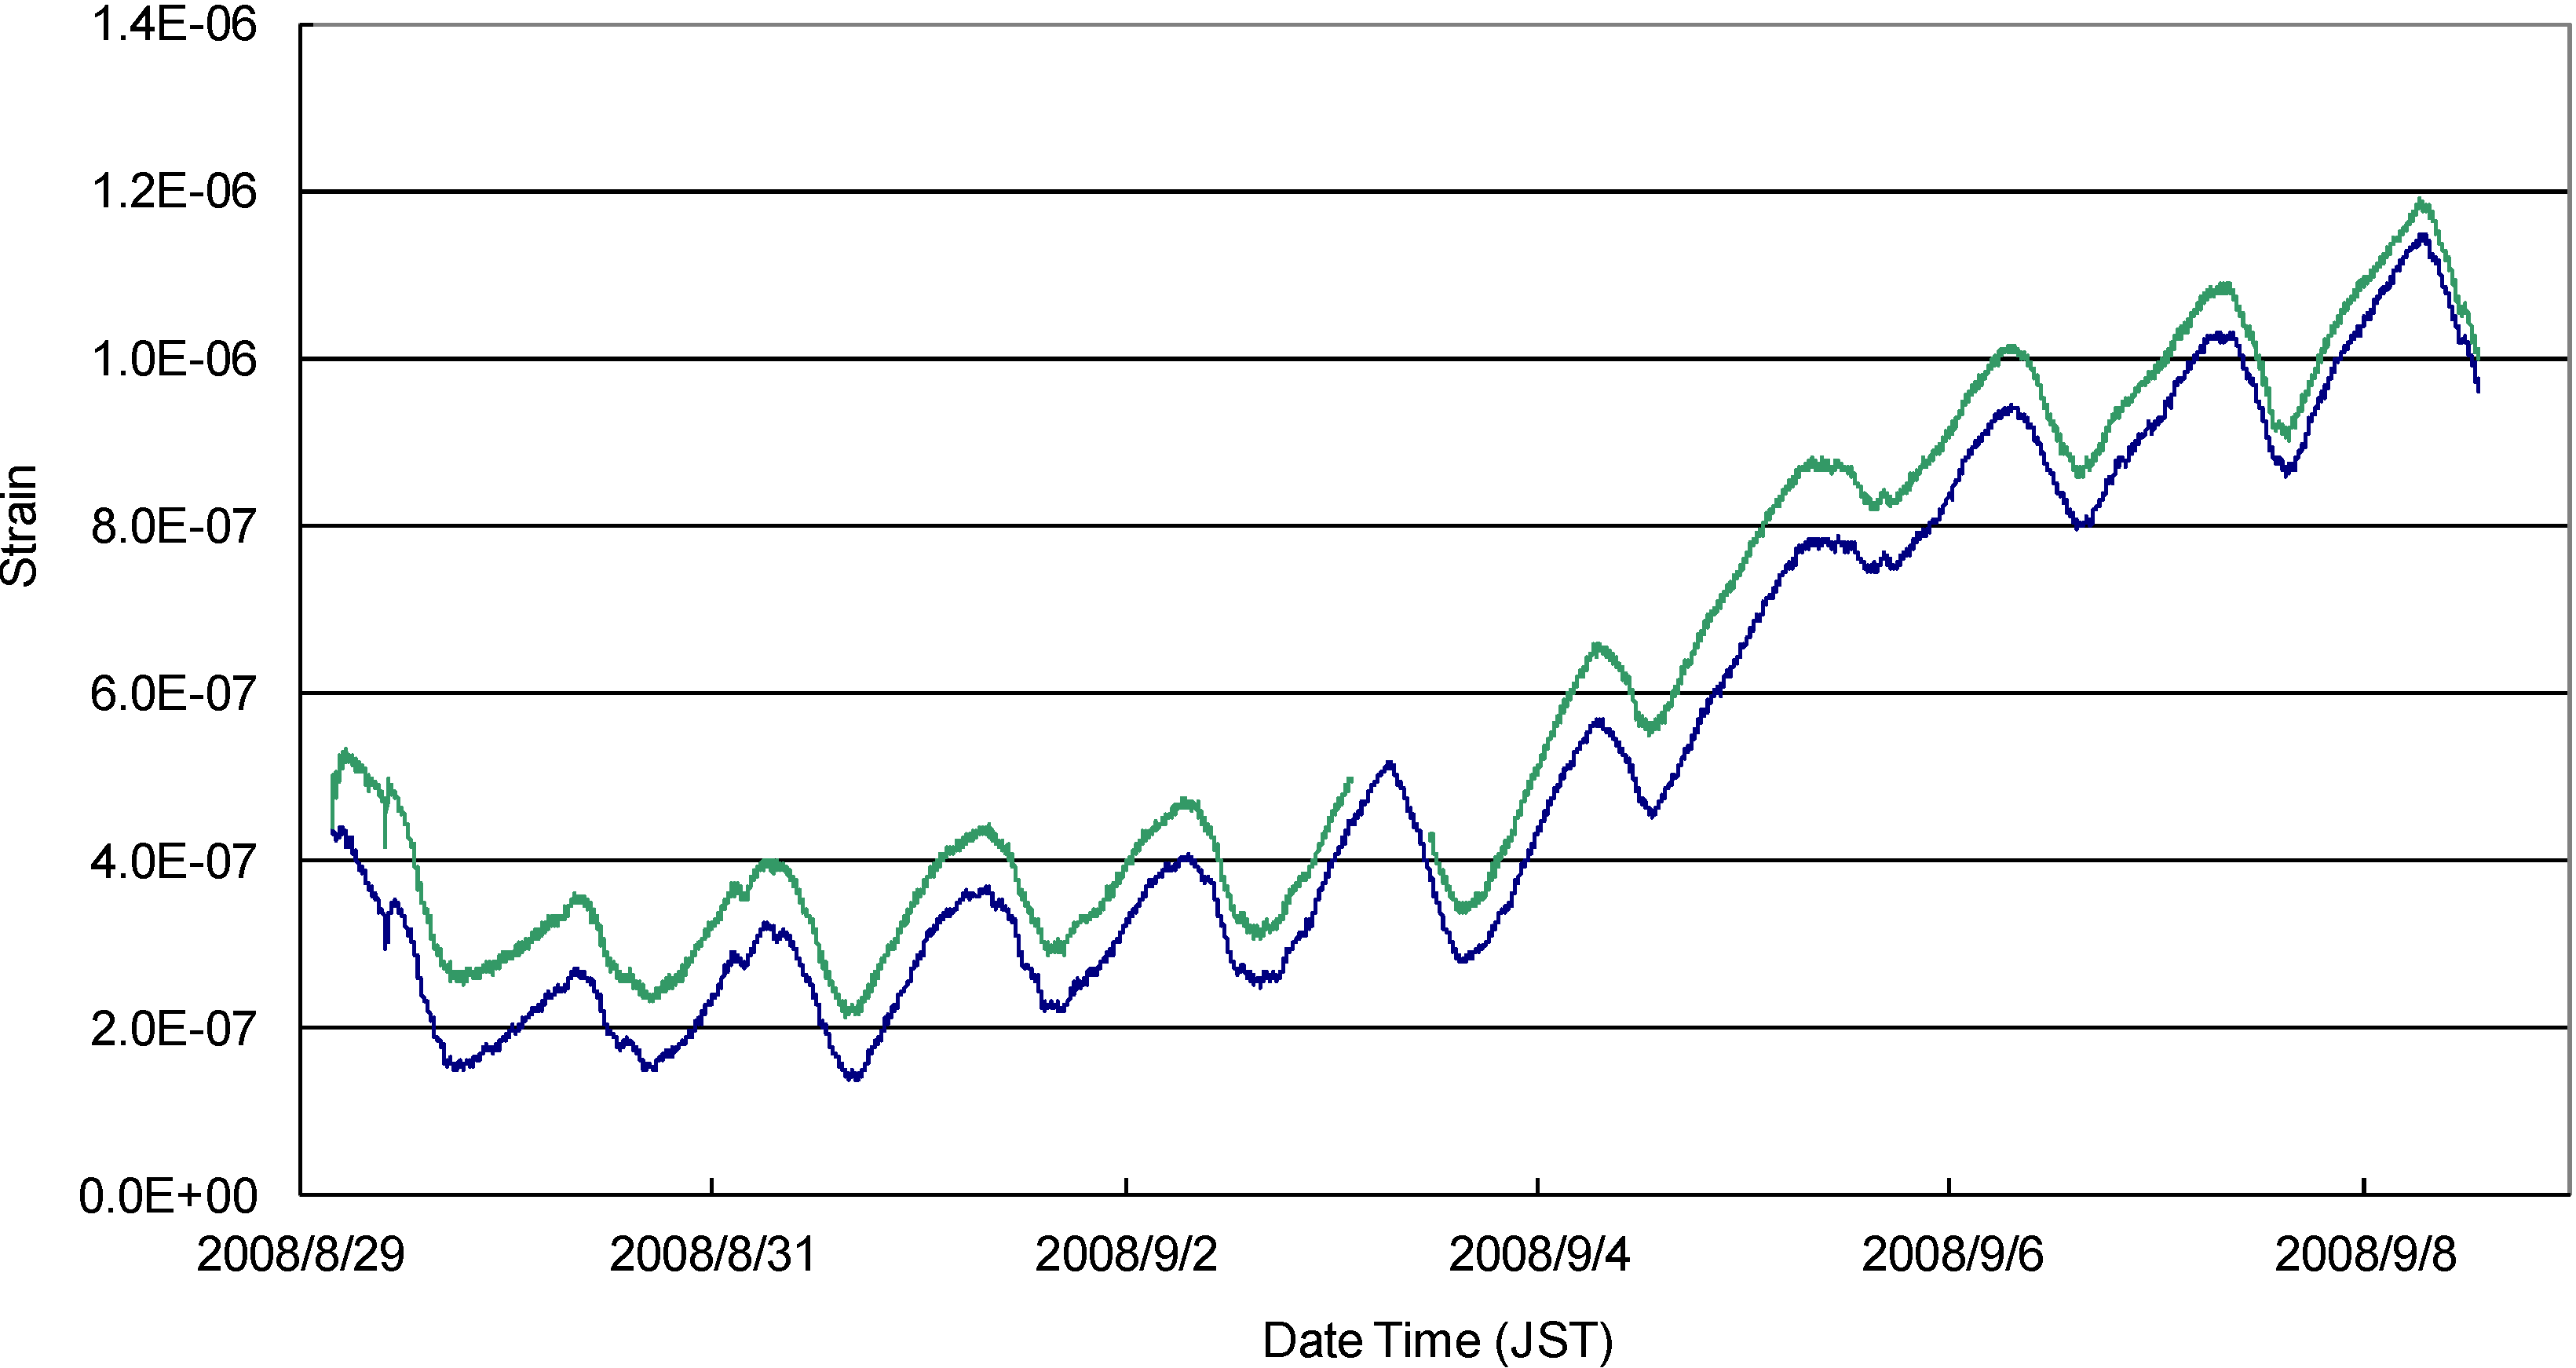
6. Observation in the Shallow AIST Tunnel

We measured a strain with this two-color interferometer in an “optical tunnel” at Tsukuba Central Campus of AIST. The baseline length of the interferometer was 72 m. This is similar to that of the interferometer subsequently constructed in Kamioka mine. The optical tunnel was constructed for metrological experiments on optical length standards and it is covered with soil and 3.5 m below the ground surface. The optical tunnel has a double concrete wall and its length is 310 m. Without any active air conditioning, the temperature in the tunnel varies within only 3 °C in a year, making it suitable for distance measurement. There are also 52 thermometers along the tunnel at intervals of 6 m. The temperature gradient along the tunnel can be obtained from these thermometers. There are also three barometers, three humidity sensors and one densitometer of carbon dioxide, enabling the refractive index of air to be calculated. As the air is not dry in this observation, the A value was calculated by using environmental parameters measured by the supplemental sensors. We compared the geometrical distance measured by the two-color interferometer with that calculated from the optical distance measured with a one-color interferometer corrected with the refractive index of air calculated from values obtained from these sensors.
Figure 3. Displacement measurement in AIST tunnel. The blue line shows the result obtained from the two-color interferometer. The green line shows the result obtained from the one-color interferometer corrected using the refractive index of air calculated from environmental parameters.
Technologies 02 00115 g003
Figure 3 shows the result of the measurement. The blue line shows the result obtained from the two color interferometer and the green line shows that obtained from the one-color interferometer with the second-harmonic light and corrected using the refractive index of air. The agreement shown in the figure indicates that the two-color interferometer that we developed can measure a geometrical distance directly. However, in this observation, we measured the expansion and shrinkage of the tunnel, which is about ten times larger than the strain due to earth tides. To confirm its origin, a commercially available interferometer with a He-Ne laser source was used to measure the distance between the same points. In this measurement, the geometrical distance changed similarly. By comparing changes in the displacement and the surface temperature as shown in Figure 4, it was inferred that the surface temperature affected the strain of the optical tunnel, as reported previously [18]. The outside temperature was obtained from Japan Meteorological Agency at the nearest available point to the optical tunnel.
Figure 4. Coincidence between the displacement of the tunnel and the outside temperature. The blue line shows the displacement of the tunnel and the pink line shows the outside temperature.
Technologies 02 00115 g004

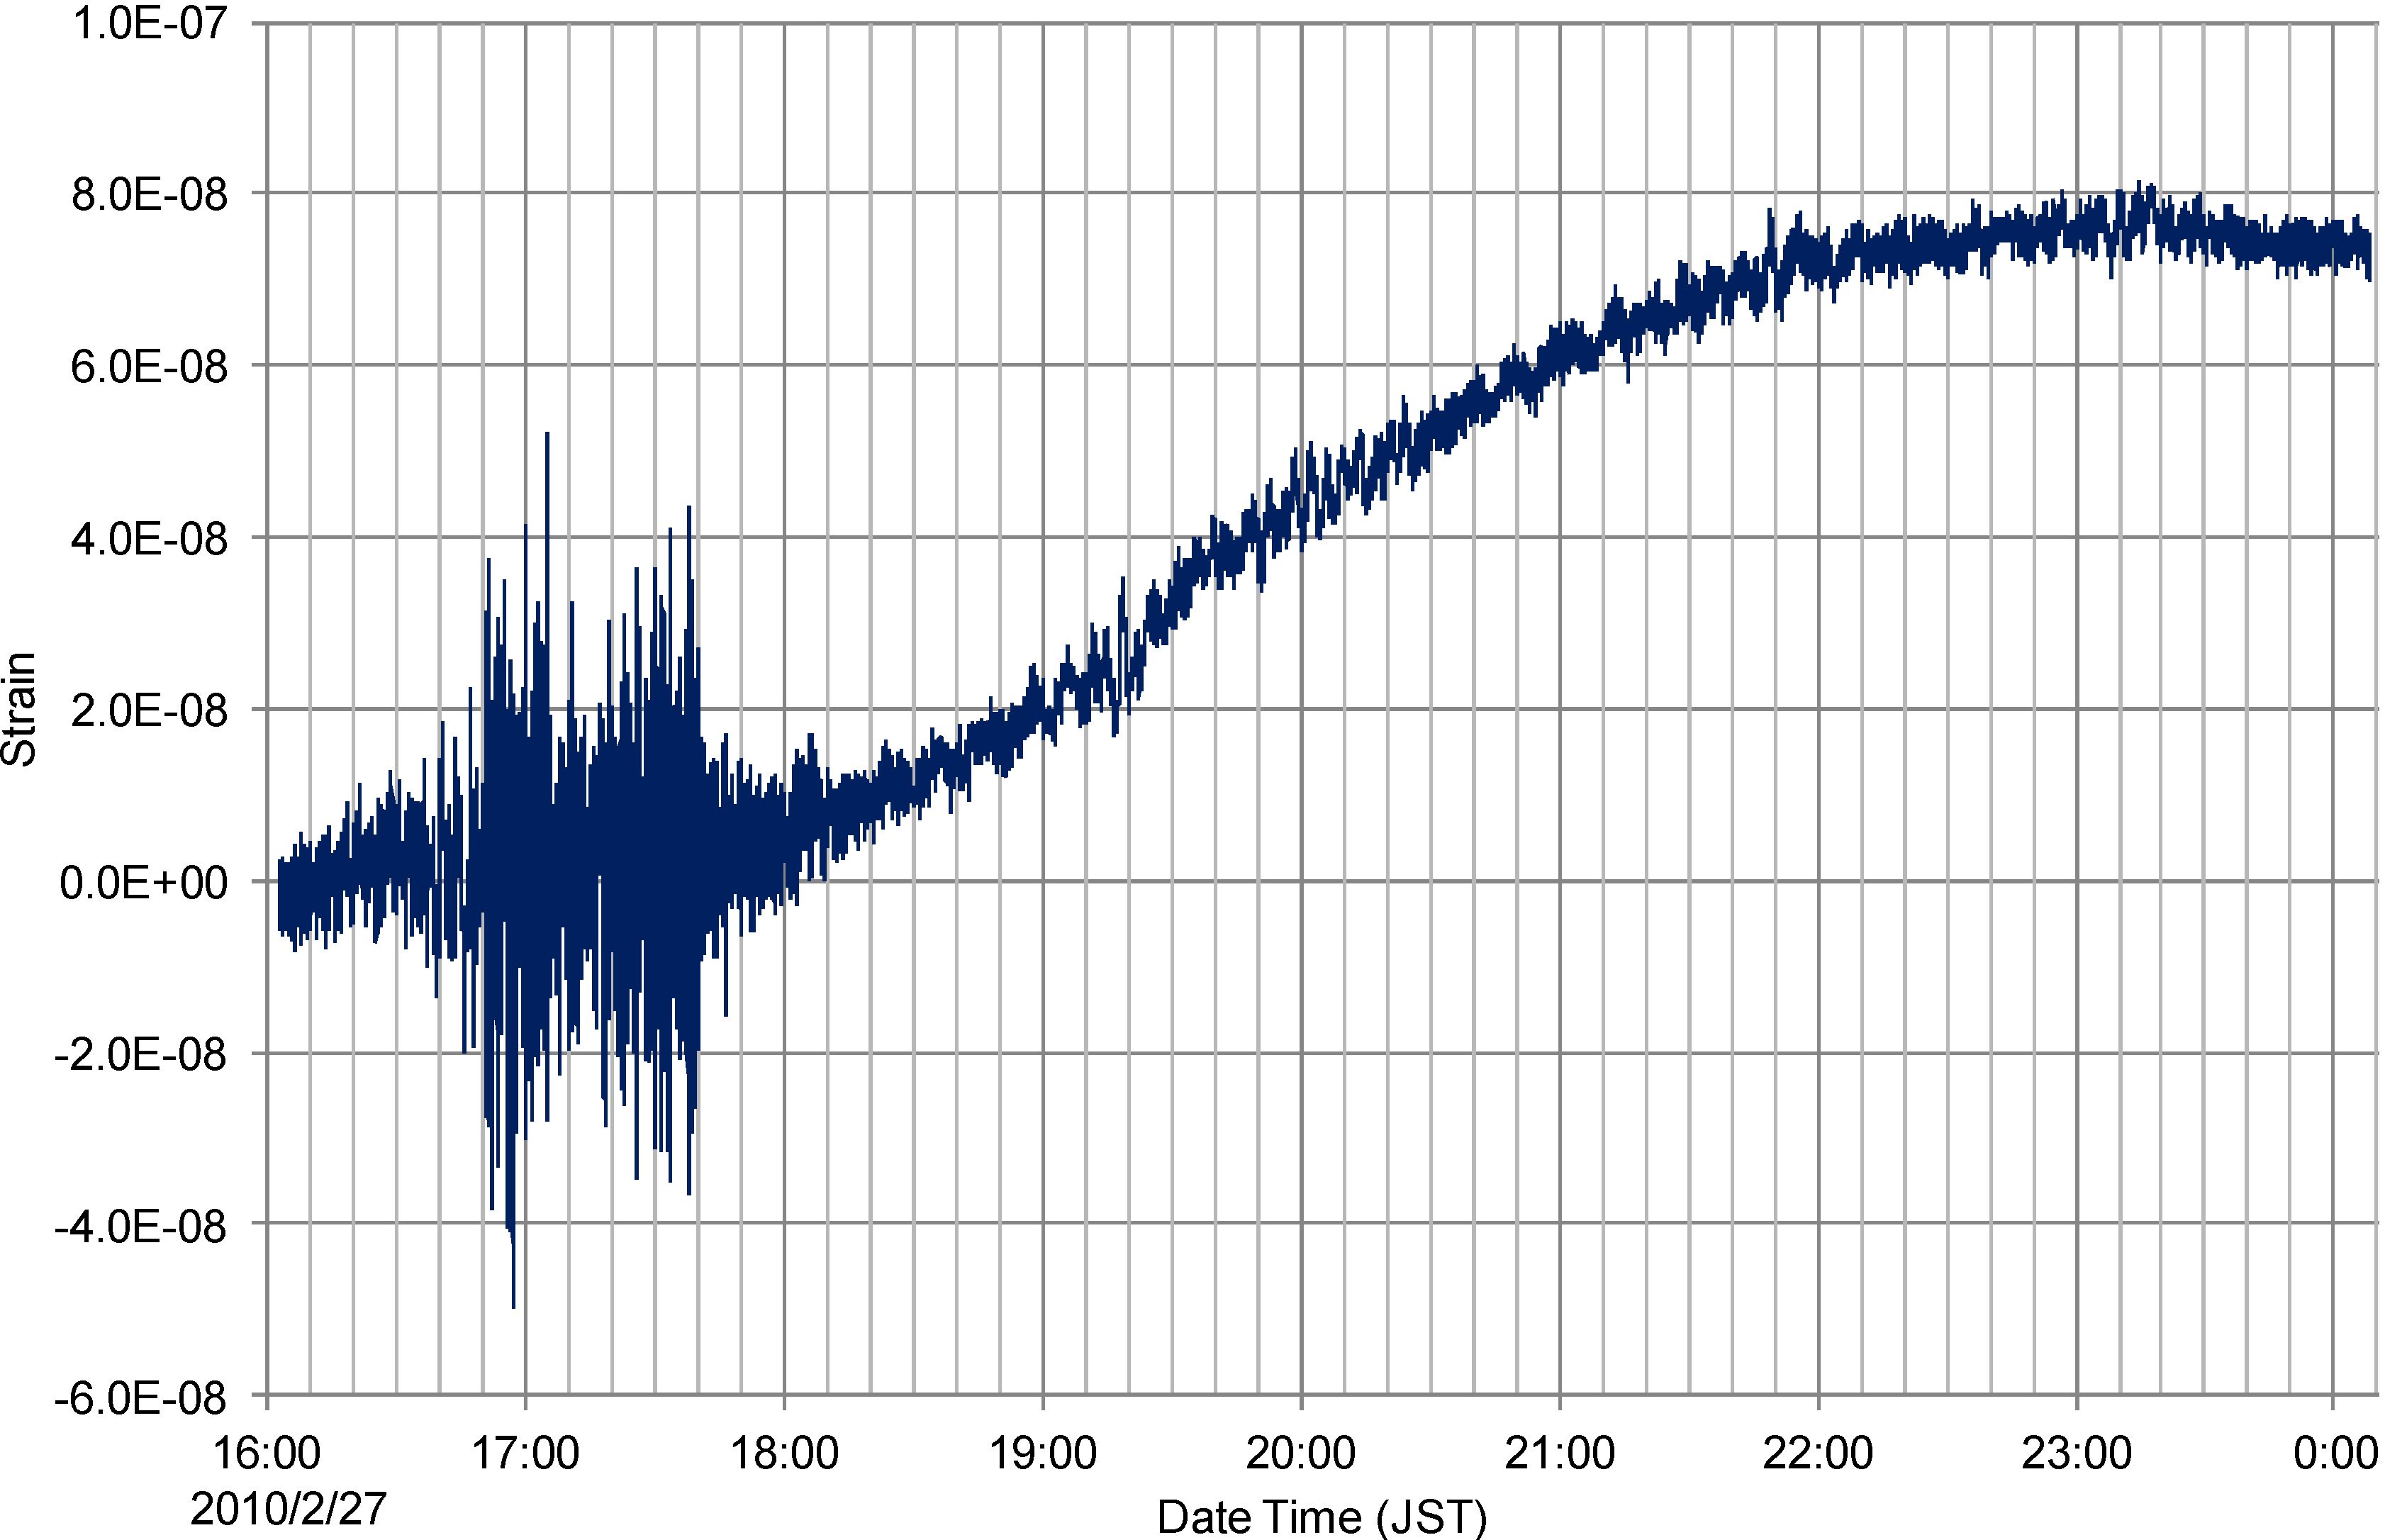
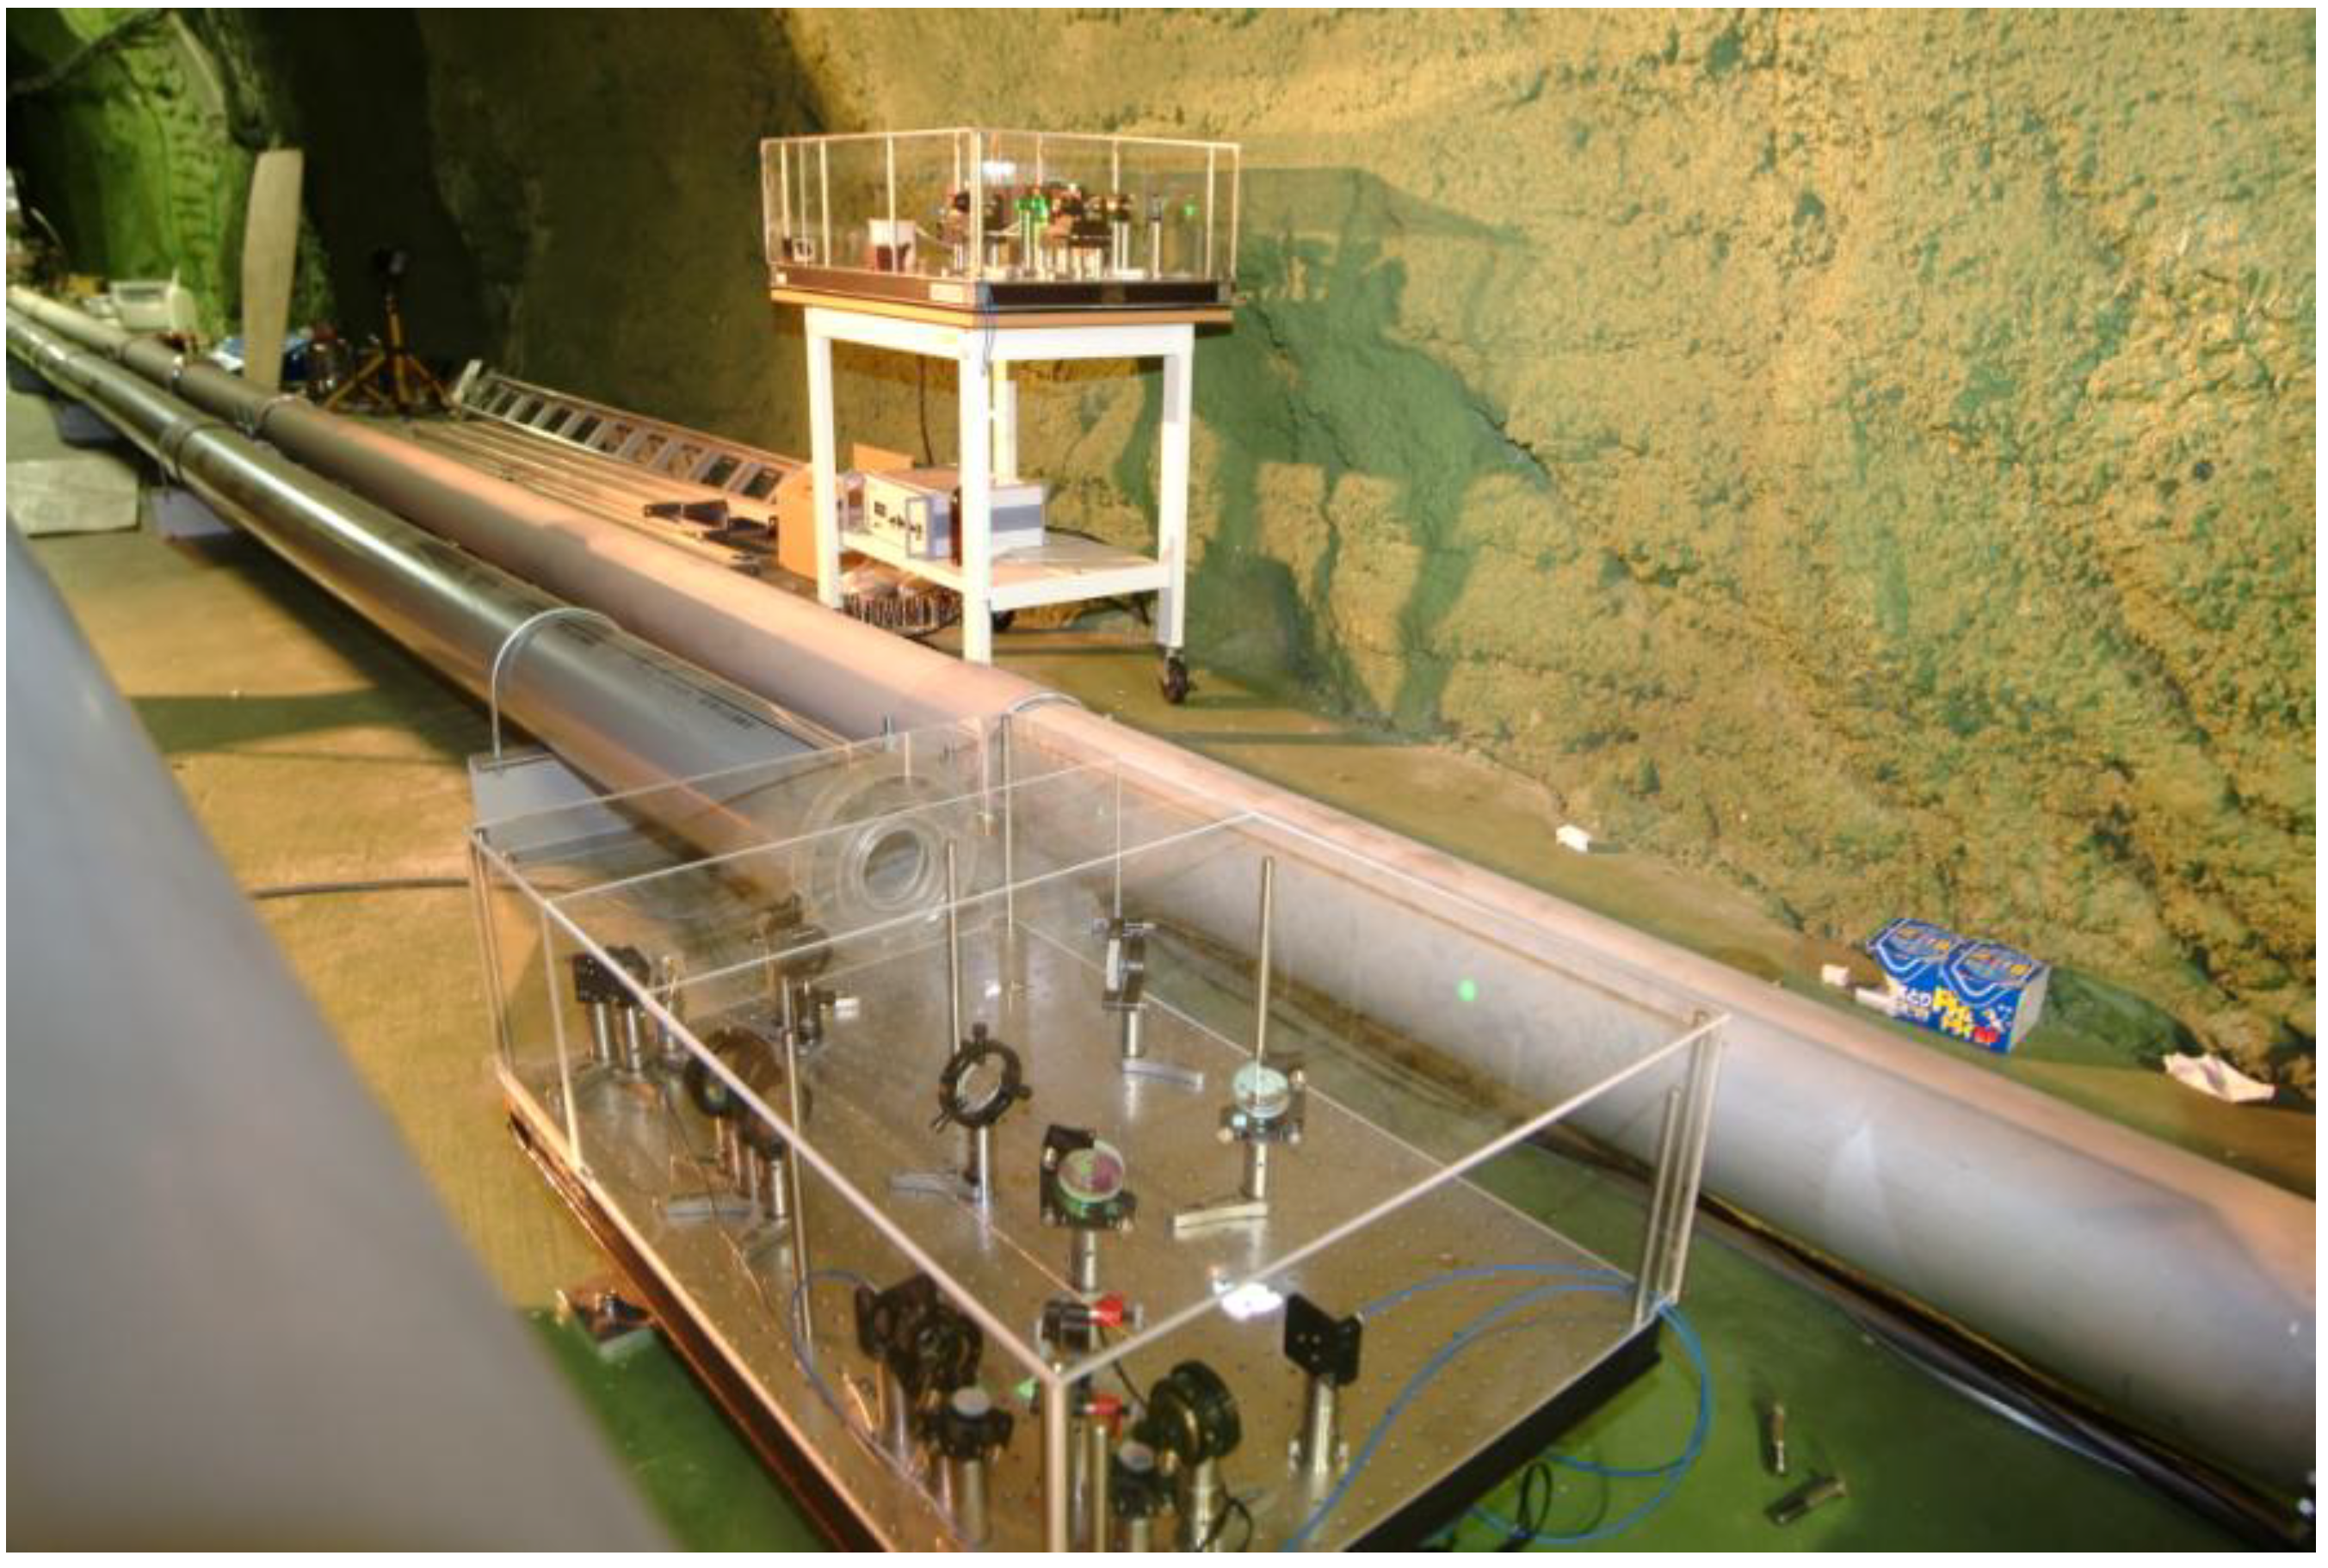
7. Observation at a Deep Underground Site in Kamioka

After performing measurements in the optical tunnel, the two-color interferometer was moved to Kamioka tunnel to measure changes in crustal strain. There are a number of scientific facilities, such as the neutrino detectors Super-Kamiokande and KamLAND, located in Kamioka mine [19,20]. Another facility is gravitational wave detector CLIO, which is an L-shaped laser interferometer located 1000 m underground, whose baseline length is 100 m [21,22]. Geophysical laser strainmeters with a baseline length of 100 m are located along CLIO [11]. They include Michelson interferometers and a Fabry-Perot cavity in vacuum [23]. We reconstructed the two-color interferometer along one of the arms of the strainmeter and evaluated its performance; the baseline of the two-color interferometer was 70 m. A photograph of the two-color interferometer and the 100 m strainmeter with vacuum pipes is shown in Figure 5. The optical path of the two-color interferometer is in air through polyvinyl chloride (PVC) pipes, which are used to reduce the disturbance to the laser beam path due to the flow of air. A thermometer, a barometer and a humidity sensor were set up in the PVC pipes, which were used to calculate the A constant. The observation result obtained with the two-color interferometer is shown in the Figure 6. According to these data, the two-color interferometer could clearly observe the strain due to earth tides.
Because this two-color interferometer has a rapid response and a wide dynamic range for geometrical distance measurements, even large shaking waveforms after an earthquake can be accurately observed. Figure 7 shows the change in strain quake after the Chile earthquake (M8.8) that occurred on 27 February 2010. Rapid strain changes from a number of earthquakes could not disturb the operation of the two-color interferometer. The proposed interferometer is very useful for observing ground strain of wide time scale phenomena, such as seismic waves, earth tides, and tectonic crustal deformation.
Figure 5. Photograph of setup used for observations. The interferometer part of the 70 m two-color interferometer is set on the front optical table. The light source of the two-color interferometer is set on the back optical table. A PVC pipe extends from the front optical table. The pipe behind the PVC pipe is a vacuum pipe for the 100 m strainmeter.
Technologies 02 00115 g005
Figure 6. Strain data observed by the two-color interferometer and the 100 m strainmeter. Changes in strain due to the earth tides were clearly recorded. And changes in strain caused by small earthquakes were also recorded by two-color interferometer because of its high sampling frequency of 3.8 Hz. The high frequency components are not visible in the curve of 100 m strainmeter record because it is taken by averaging in 1 min data.
Technologies 02 00115 g006
Figure 7. Changes in strain observed by the two-color interferometer when vibrations from a major earthquake in Chile arrived at Kamioka mine.
Technologies 02 00115 g007

8. Discussion and Conclusions

We confirmed that there was only a small difference between the geometrical distance measured by the two-color interferometer and that measured by the one-color interferometer with correction of the refractive index of air in the optical tunnel experiment in AIST (Figure 3). A major reason for the small difference is considered to be the positions of the thermometers. The light path used for the interferometer was 40 cm above the floor, while the thermometers used to calculate the refractive index of air were located 2 m above the floor; the thermometers were installed at the construction of the optical tunnel about 30 years ago. Thus, we could not obtain the actual temperature in the optical path. The diurnal change with a strain amplitude of 10−7 is correlated with the surface temperature. Considering the very small changes in temperature in the tunnel and the results of previous research, we could reasonably suppose that the diurnal change originated from not instrumental error but ground strain due to external meteorological, probably thermal, effects.
In Kamioka mine, we could clearly observe a change in strain due to earth tides using the two-color interferometer. However, a small difference could be seen between results obtained from the two-color interferometer and those obtained from the 100 m strainmeter in vacuum (Figure 6). The vacuum chambers confining the retro mirrors in the 100 m strainmeter were installed on granite bases attached to the bedrock at the time of tunnel construction. On the other hand, the mirrors of the two-color interferometer were set up on optical tables fixed on the concrete floor of the tunnel. As ballast was sandwiched between the concrete floor and the bedrock, the motion of the optical table on the floor may not fully reflect the actual ground motion. Moreover, the concrete floor itself was subject to humidity. This may explain the small differences between the two sets of observation data.
We set the resolution of the optical distance measurement to be one quarter of the wavelength of second-harmonic light, i.e., 133 nm, because smaller resolution than this did not improve the total accuracy which seemed 2 × 10⁻⁹ for the baseline of 70 m. The 133 nm resolution of the optical distance obtained by a digital counter, therefore its standard deviation is determined as 38 nm ( Technologies 02 00115 i004), due to the continuous uniform distribution. This resolution corresponds to temperature measurements with 2 mK accuracy, if conventional one-color interferometer is used. Measurements of the temperature with such high accuracy are practically impossible in long-distance measurements. If we construct a longer two-color interferometer, the displacement resolution will have little dependence on the baseline, therefore the accuracy of the strain measurement will improve. The baseline can easily be extended because of the in-air optical path with low-cost guide pipes. This is a major advantage of using the two-color interferometer in geophysical applications to form a number of long-baseline strainmeters as a sensitive observation network. The long-baseline system also provides a long-distance standard in metrological application.

Acknowledgments

We are thankful to W. Morii for providing the data by the 100 m strainmeter. This study was partially supported by a Grant-in-Aid for Scientific Research (A) (18204039) from Japan Society for the Promotion of Science and by the Earthquake Research Institute Cooperative Research Program (2006-B-04).

Author Contributions

Souichi Telada designed and constructed the optical and electrical configuration of the two-color interferometer and drafting of the manuscript. Akito Araya constructed the baseline at a deep underground site in Kamioka mine and revised lots of the manuscript. Akiteru Takamori checked the data based on his judgment of geophysical study and revised the manuscript.

Conflicts of Interest

The authors declare no conflict of interest.

References

  1. Murray-Moraleda, J. GPS: Applications in Crustal Deformation Monitoring. In Extreme Environmental Events; Meyers, R.A., Ed.; Springer: New York, NY, USA, 2011; pp. 589–622. [Google Scholar]
  2. Graham, L.C. Synthetic interferometer radar for topographic mapping. Proc. IEEE 1974, 62, 763–768. [Google Scholar] [CrossRef]
  3. Seeber, G. Satellite Geodesy, 2nd ed.; Walter de Gruyter Inc.: Berlin, Germany, 2003. [Google Scholar]
  4. Bergstrand, E. Distance measuring by means of modulated light. Bull. Geod. 1952, 24, 243–249. [Google Scholar] [CrossRef]
  5. Tomasi, P.; Rioja, M.J.; Sarti, P. The European VLBI Network activity in geodesy: Crustal deformation in Europe. New Astron. Rev. 1999, 43, 603–607. [Google Scholar] [CrossRef]
  6. Benioff, H. Fuzed quartz extensometer for secular, tidal, and seismic strains. Geol. Soc. Am. Bull. 1959, 70, 1019–1032. [Google Scholar] [CrossRef]
  7. Berger, J.; Lovberg, R. Earth strain measurements with a laser interferometer. Science 1970, 170, 296–303. [Google Scholar]
  8. Vali, V.; Bostrom, R.C. One thousand meter laser interferometer. Rev. Sci. Instrum. 1968, 39, 1304–1306. [Google Scholar] [CrossRef]
  9. Liu, Q.; Tokunaga, T.; He, Z. Sub-Nano resolution fiber-optic static sensor using a sideband interrogation technique. Opt. Lett. 2012, 37, 434–436. [Google Scholar]
  10. Araya, A.; Kunugi, T.; Fukao, Y.; Yamada, I.; Suda, N.; Maruyama, S.; Mio, N.; Moriwaki, S. Iodine-stabilized Nd:YAG laser applied to a long-baseline interferometer for wideband earth strain observations. Rev. Sci. Instrum. 2001, 73, 2434–2439. [Google Scholar]
  11. Takemoto, S.; Araya, A.; Akamatsu, J.; Morii, W.; Momose, H.; Ohashi, M.; Kawasaki, I.; Higashi, T.; Fukuda, Y.; Miyoki, S.; et al. A 100 m laser strainmeter system installed in a 1 km deep tunnel at Kamioka, Gifu, Japan. J. Geodyn. 2004, 38, 477–488. [Google Scholar] [CrossRef]
  12. Araya, A.; Morii, W.; Hayakawa, H.; Takamori, A.; Uchiyama, T.; Ohashi, M.; Yamada, I.; Telada, S.; Takemoto, S. Broadband observation with laser strainmeters and a strategy for high resolution long-term strain observation based on quantum standard. J. Geod. Soc. Jpn. 2007, 53, 81–97. [Google Scholar]
  13. Matsumoto, H.; Honda, T. High-accuracy length-measuring interferometer using the two-color method of compensating for the refractive index of air. Meas. Sci. Technol. 1992, 3, 1084–1086. [Google Scholar] [CrossRef]
  14. Zeng, L.; Telada, S.; Seta, K.; Matsumoto, H.; Iwasaki, S. A weight average method to improve the uncertainty of length measurement in a two-color interferometer. Opt. Commun. 2001, 187, 295–299. [Google Scholar] [CrossRef]
  15. Fujima, I.; Xie, G.; Seta, K. Precise measurement of the difference of the air refractive indices between visible and near-infrared wavelength using two-color interferometer. Proc. SPIE 1999, 3897, 767–772. [Google Scholar] [CrossRef]
  16. Edlen, B. The refractive index of air. Metrologia 1966, 2, 71–80. [Google Scholar] [CrossRef]
  17. Ciddor, P.E. Refractive index of air: New equations for the visible and the near infrared. Appl. Opt. 1996, 35, 1566–1573. [Google Scholar] [CrossRef]
  18. Ohishi, T.; Seino, S.; Sakurai, Y. Vacuum-pipeless laser earth strainmeter. Appl. Opt. 1981, 20, 1329–1332. [Google Scholar] [CrossRef]
  19. The Super-Kamiokande Collaboration. The Super-Kamiokande detector. Nucl. Instrum. Meth. 2003, A501, 418–462. [Google Scholar]
  20. Araki, T.; Enomoto, S.; Furuno, K.; Gando, Y.; Ichimura, K.; Ikeda, H.; Inoue, K.; Kishimoto, Y.; Koga, Y.; Koseki, Y.; et al. Experimental investigation of geologically produced antineutrinos with KamLAND. Nature 2005, 436, 499–503. [Google Scholar] [CrossRef]
  21. Ohashi, M.; Kuroda, K.; Miyoki, S.; Uchiyama, T.; Yamamoto, K.; Kasahara, K.; Shintomi, T.; Yamamoto, A.; Haruyama, T.; Saito, Y.; et al. Design and construction status of CLIO. Class. Quantum Grav. 2003, 20, S599–S608. [Google Scholar] [CrossRef]
  22. Uchiyama, T.; Miyoki, S.; Telada, S.; Yamamoto, K.; Ohashi, M.; Agatsuma, K.; Arai, K.; Fujimoto, M-K.; Haruyama, T.; Kawamura, S.; et al. Reduction of thermal fluctuations in a cryogenic laser interferometric gravitational wave detector. Phys. Rev. Lett. 2012, 108, 141101. [Google Scholar] [CrossRef]
  23. Araya, A.; Takamori, A.; Morii, W.; Hayakawa, H.; Uchiyama, T.; Ohashi, M.; Telada, S.; Takemoto, S. Analyses of far-field coseismic crustal deformation observed by a new laser distance measurement system. Geophys. J. Int. 2010, 181, 127–140. [Google Scholar] [CrossRef]

