Article

Influence of the Academic Library on US University Reputation: A Webometric Approach

1
EC3 Research Group, Institute of Design and Manufacturing (IDF), Polytechnic University of Valencia (UPV), Camino de Vera s/n, Valencia 46022, Spain
2
Palmer School of Library and Information Science and Department of Computer Science and Management Engineering, Long Island University, 520 Northern Blvd., Brookville, NY 11552, USA
*
Author to whom correspondence should be addressed.
These authors contributed equally to this work.
Technologies 2013, 1(2), 26-43; https://doi.org/10.3390/technologies1020026
Submission received: 18 July 2013 / Revised: 23 August 2013 / Accepted: 10 September 2013 / Published: 16 September 2013

Abstract

:
A previous study conducted through a survey of academic libraries at 100 US universities with the highest total expenditures on academic libraries according to data presented by the National Center for Education Statistics (NCES). The results pointed out an unexpectedly weak correlation among web variables, concluding that the complex online structure of US academic libraries was the main driver of this effect. The present study replicates this research applying the same web indicators but at the university level, to check whether the weak compactness among web indicators persists. Additionally, the percentage (in terms of web data) of academic libraries at universities is analyzed. Finally, the correlation among web and economic indicators (research expenditures, student population, and reputational rank position) for universities is calculated to check for a possible relationship. Results confirm a strong correlation among university web indicators. Otherwise, the strength of academic libraries at universities is moderate in terms of page count, but weak in terms of visits. Finally, the correlation among university web indicators and research expenditures depends on student population.

1. Background and Review of the Literature

The methodology used in most global and domestic university rankings pays most attention to research and teaching activities, and only a few methods integrate other variables such as services and facilities such as the academic library [1]. In terms of libraries’ influence on university rankings, online platforms (such as the Centre for Higher Education CHE ranking in Europe [2], and the McLean personalized university ranking tool [3] in Canada) that allow users to select the indicators they want to use to rank universities and where libraries are among the variables should be considered.
In the case of the United States, the Assessment of Research-Doctorate Programs in the United States, performed in 1982 by the National Academy of Sciences in collaboration with the National Research Council, should be discussed [4]. In this report, among other types of reputational indicators, the size of the academic library is considered. In addition, the Princeton Review’s Annual College Rankings [5] gives the participants the chance to rate academic libraries within the “Academic/Administration” category. Except for these cases (and other domestic rankings outside the United States), the use of academic libraries’ performance to help rank US universities is limited.
Thus, studying the influence of academic libraries on the ranking achieved by universities in this type of educational product and a possible correlation among library and university indicators is difficult. These correlations are otherwise difficult to obtain and measure because they rely on economic variables, which are hard to measure directly with rankings based primarily on research and teaching-oriented data. In any case, the dependence between these two institutions (in terms of performance) seems clear and has been recently demonstrated both within the US system [6,7] and outside [8,9].
Although this limitation persists, in 2004 a new university ranking that can help mitigate this problem to some extent appeared [10]. The “Ranking of World Universities” [11] is based on webometric methods that consider the documentation published and accessible via the Internet, specifically the size (page count) and impact (external inlinks). In this way, all institutions at the university level (understood as a complex online system) contribute content to the general performance of the university (measured through its official website), and this contribution can be quantified.
Recently, Regazzi [6] pointed out the increase in electronic expenditures in academic libraries (which is thought to be reflected in more online resources). Moreover, the large amount of electronic content stored on library websites (scientific papers in repositories, digital collections, and so on) can include a wide range of digital assets. Due to these reasons, the contribution of the academic library to the web performance of the corresponding university should be elevated. However, studies that apply webometric methods within the US academic system are scarce.
Webometric methods have been widely applied in Europe [12,13], and to a lesser extent in other continents such as Africa [14], Asia [15], and Australia [16], although one country-focused studies are prone to give more accurate results due to the greater likelihood that individual nation-states will have similar forms or contents of academic information, as previous findings have proved [17,18].
Moreover, some studies have found that web-visibility indicators could function as proxy measures of non-web university rankings, such as Aguillo et al. [19] and Lee and Park [20], proving the importance of web performance on reputational and research-focused university rankings.
In the United States and Canada, Ortega and Aguillo [21] analyzed interlinking patterns among universities. Particular university units (such as departments) have been also explored by Arakaki and Willet [22] and Chu, He, and Thelwall [23], among others.
Nonetheless, research on US academic libraries under a webometric perspective has received limited attention. Tang and Thelwall [24] conducted an analysis of link patterns from and to the websites of a set of 100 US academic and public libraries, finding a significant relation between visibility (number of external links) and page count (number of files), and also a little interaction between US universities and public libraries.
Otherwise, other web units emerge within academic library websites with the purpose of storing and making available large amounts of digital contents (mainly online catalogs, digital collections and repositories), widely analyzed in the literature but not still treated as regards their contribution, under webometric terms, in the overall university website performance, less in the US academic system.
The first step for getting strong findings about the relationship of US academic libraries and universities (and indirectly university rankings) was provided by a previous study carried out by Orduña-Malea and Regazzi [25], who conducted a survey of library homepages, institutional repositories, digital collections, and online catalogs at 100 US universities with the highest total expenditures on academic libraries according to data from the National Center for Education Statistics (NCES), including web (page count, external links, and visits) and economic (total expenditures, expenditures on printed and electronic books, and gate count) variables.
The main results of that research confirmed the following:
(a)
The compactness among web data indicators is very low. The correlation between page count indicators and URL mentions is significant, but the link indicators do not correlate with any other type of web indicator.
(b)
No correlation was found among institutional and web data. The best results are those that correlate a library’s “total expenditures” with URL mentions measured by Google (r = 0.57) and visits (r = 0.57).
Among the possible explanations for the low correlations obtained, the lack of appropriate web policies and the limitations of some webometric sources were exposed.
From these results, a new research question arises: Does the low correlation among web indicators persist in larger units of analysis, such as the university?
A higher degree of compactness among web indicators at the university level compared to that at the library level would enhance the conclusions regarding bad practices and limitations for academic library websites, which are needed in the understanding of the influence of library websites on university websites.
Thus, the main objectives of this research are to analyze the correlation of web data (using the same set of institutions and indicators employed in the research by Orduña-Malea and Regazzi) at the university level and to check if this is higher or lower than at the library level.
Gathering web information at the university level provides the opportunity to get additional insight into the degree of influence of academic libraries on the total web performance of universities and the relationship with university offline variables, where university size (in terms of number of students) may play an important role as an external variable. Thus, the following are the secondary goals:
-
To determine the degree to which an academic library contributes to the general web performance of the university (and therefore, its position in web rankings).
-
To understand the relationship between web data variables and university economic variables.
-
To analyze the effect of university size on web data performance.

2. Methodology and Research Design

To ensure accuracy and consistency from the previous study and other webometric research efforts, the same data sample and procedure Orduña-Malea and Regazzi previously employed was used in this study [25]. Thus, all data for the academic libraries are taken from that research, whereas the data for the universities is described as follows: first, the process for selecting universities for the sample is described; second, the analysis of the sample with web and economic variables is explained, and third, the data is analyzed statistically.

2.1. Gathering Data

A sample of 100 universities was selected in terms of the total expenditure on academic libraries in 2008 (the most recent data available). This data was extracted from the survey Documentation for the Academic Libraries Survey: Public Use Data File. Fiscal Year 2008 [26].
For each university, the official academic website was examined. If a university had more than one valid URL (for example, University of Illinois at Urbana–Champaign has two official URLs: uiuc.edu and illinois.edu), then all URLs were considered. University systems were not included. For example, <tennessee.edu> and <universityofcalifornia.edu> are websites for all campuses that are part of a specific system, but only the URL for each campus (treated as an independent unit) was selected.
Additionally, information of academic libraries belonging to the sample of 100 universities was gathered. Since other services and subunits (suited to storing large amounts of online documents) are commonly created under different domains within the academic library website, we established that the term “academic libraries” also considers the following services/products/institutions:
-
Library (general, branches, or for specific schools or faculties)
-
OPAC or online catalog and searcher
-
Institutional repositories
-
Digital collections
The identification of each of these institutions (and their corresponding URLs) was achieved by browsing and searching the websites of each of the previously listed 100 universities. This process was carried out in December 2011. Only units with a sub-domain within the academic website (<xxx.academicdomain.edu>) were considered; this limitation was necessary in order to proceed with an accurate link analysis.

2.2. Measuring the Sample

In this section, the indicators and sources used to measure the units obtained in the previous section are described.

2.2.1. Institutional and Economic Data

For the 100 universities that formed the sample, the Total research expenditure in 2008 variable was obtained, retrieved from The Top American Research Universities. 2009 Annual Report [27]. For each university, its position in the university rankings was also obtained.
Due to the impossibility of gathering information for all 100 universities in global university rankings (such as ARWU or THE), the rankings of only North American universities are considered, in this case, the following (2011 edition, the most recent available):
-
US News and World Report (National University Ranking) [28]
-
Forbes (America’s Top Colleges) [29]
Although all university rankings have advantages and shortcomings in their methodologies, the consideration of these two rankings is due to the following reasons:
-
They provide information about all 100 universities of the sample.
-
They provide data not only regarding research activity but other university missions.
-
Forbes also provides data about university population, which were gathered for all 100 universities.
-
Finally, two rankings (instead of only one) are considered in order to reinforce the ranking positions achieved by institutions.

2.2.2. Web Data

Table 1 shows the various web indicators (grouped into categories) used, the sources used to obtain the indicators, and the commands employed in each source.
Table 1. Summary of categories, indicators, sources, and commands used for web measures.
CategorySizeMentionImpactUsage
IndicatorTotalPDFURL MentionInlinksDmRVisits
SourceYahoo!GoogleYahoo!GoogleYahoo!MAJESTICOSEOSECompete
Commandsite:domain.edusite:domain.edu filetype:pdf“domain.edu”—site:domain.eduDirectDirectDirectDirect
The web indicators used are explained below:
Size
Size refers to the number of files in the web domain studied. In this case, we considered two specific indicators:
-
Total: total number of files within a web domain.
Google, despite currently being the search engine with the highest coverage in the world, has flaws in retrieving total page count, due to the elimination of pseudo-duplicates (files that seem the same, but are different), and it has a deficiency in working with non-friendly dynamic URLs [30]. For this reason, only Yahoo! was used.
-
PDF: total number of PDF files.
Employed because this format is the main vehicle for publishing final intellectual works, such as books, papers, and so on [31]. In this case, both Google and Yahoo! were used. Google provides more results and it is more reliable. Yahoo! was taken into account in order to have comparative data.
Mention
This category refers to the number of times that the object of analysis (in this case, each web unit) is mentioned in any other online file. In this case, we considered the two main mention indicators: external inlinks and URL mentions.
-
External inlinks: the number of links that come from external websites.
At the moment of research, only Majestic [32] and Open Site Explorer [33] provide this metric (Ahrefs Site Explorer [34] still has low coverage). In the past, Yahoo Site Explorer was the main tool, but it was disabled in 2011.
-
URL mentions: the number of times that the URL is mentioned in any online content.
At present, some research is being pursued on the validity of this indicator as a predictor of external links [35]. Although there are some problems, Google and Yahoo! provide the best and most reliable results.
Impact
This category refers to the power of each website through a metric which takes into account not only the quantity but also the quality of the external inlinks received. For example, PageRank (PR) is such an impact indicator. In this case, only Domain MozRank (DmR) was used, because it is free, the tool has coverage for all institutions analyzed, and the power of discrimination is better than PR (only from 0 to 10).
-
DmR (Domain MozRank)
Offered by Open Site Explorer tool, it reflects the importance (from 1 to 100 points) of any given web domain on the Internet. This metric quantifies the popularity of a given domain compared to all other domains on the web in a similar fashion as PageRank does, evaluating the links that point from one unique web domain to another.
Usage
This category counts the number of visits to a website.
-
Unique visitors: total number of different users who visited the webpage in a period of time.
In this case, data was extracted from Compete6, due to its good coverage of US institutions, and because it is free. Neither Alexa [36] nor other services provided more accurate data.
Webometrics analysis was carried out manually in December 2011, jointly with the library-level analysis, to avoid differences in the sample due to the web exploration period. The URL mentions were gathered following Thelwall and Sud’s findings [35].

2.3. Analyzing the Sample

All data gathered were exported to an Excel spreadsheet for analysis. Additionally, XLStat was used to perform the correlation analysis among the variables. The Spearman coefficient was also used because the web data was distributed non-linearly; thus, Pearson is not recommended.

3. Results

First, the institutional data for the universities is provided (ranking position, student population and research expenditures), describing the main figures obtained and showing the correlation between the indicators used. Second, the same procedure is followed to display the web data from the universities (page count, mention, impact, and usage indicators). Finally, a correlation between the institutional and web data is provided.

3.1. University Institutional Data

The John Hopkins University has the highest expenditures by far on Research ($1,680,927,000; shown in Annex A) in the period analyzed, followed by the University of Wisconsin-Madison ($881,777,000) and the University of Michigan-Ann Arbor ($876,390,000). However, eight universities did not provide this indicator. For the corresponding position in university rankings, all 100 universities are ranked in the Forbes college rankings, but five universities (Wayne State University, University of Houston, University of Nevada-Las Vegas, Nova Southeastern University, and University of North Texas) are not positioned in the US News and World Report ranking.
There is a wide statistical range in student population between the smallest-ranked university (Rice University, with 5,576 students) and the largest-ranked university (Arizona State University at the Tempe Campus, with 68,064). Apart from the latter, only four other universities—within the sample—surpass 50,000 students (very big universities): Ohio State University-Main Campus (55,014), University of Minnesota-Twin Cities (51,659), the University of Texas at Austin (50,995), and the University of Florida (50,691). After eliminating universities without data in any of the four institutional parameters, a correlation matrix is obtained (Table 2).
Table 2 clearly shows a high correlation between rankings (r = 0.92) and a lower correlation between rankings and the remaining variables (research expenditures and student population). This effect could be easily explained because the two rankings used employ many indicators (not only research-oriented), so that ranking is determined by not only research performance but also influence. Negative correlations showed are due to the fact that top positions in ranking are the best.
Table 2. Correlation between institutional data.
Rank (US News and World Report)Rank (Forbes)Research ExpendituresStudent Population
Rank (USN)1
Rank (FORBES)0.923 *1
R. Expenditures−0.467 *−0.332 *1
Student population0.368 *0.380 *0.314 *1
* Significant values (except diagonal) at the level of significance alpha = 0.050 (two-tailed test).
In any case, the high correlation between the US News and World Report and Forbes rankings should be examined carefully. If the rankings are compared, important differences are found: within the top 50 universities in the US News and World Report ranking, up to 11 universities have a difference of more than 100 positions in the Forbes ranking, such as the University of Southern California (23rd on US News and World Report and 165th on Forbes), the University of Wisconsin-Madison (42nd on US News and World Report and 165th on Forbes), and the University of Texas-Austin (45th on US News and World Report and 185th on Forbes). Going down the table, the differences increase even more. An explanation of these discrepancies can be found in the methodological differences in the rankings. Moreover, in the US News and World Report rankings, there are ties (for example, first place is shared by Harvard University and Princeton University, and no university is ranked second). This procedure affects the statistical calculation of the correlations. Otherwise, the total student population is weakly correlated with the remaining indicators, especially with research expenditures (r = 0.31). The sample analyzed is composed of the top 100 universities with higher expenditures on academic libraries, not the top total research expenditures or the top total student population.

3.2. University Web Data

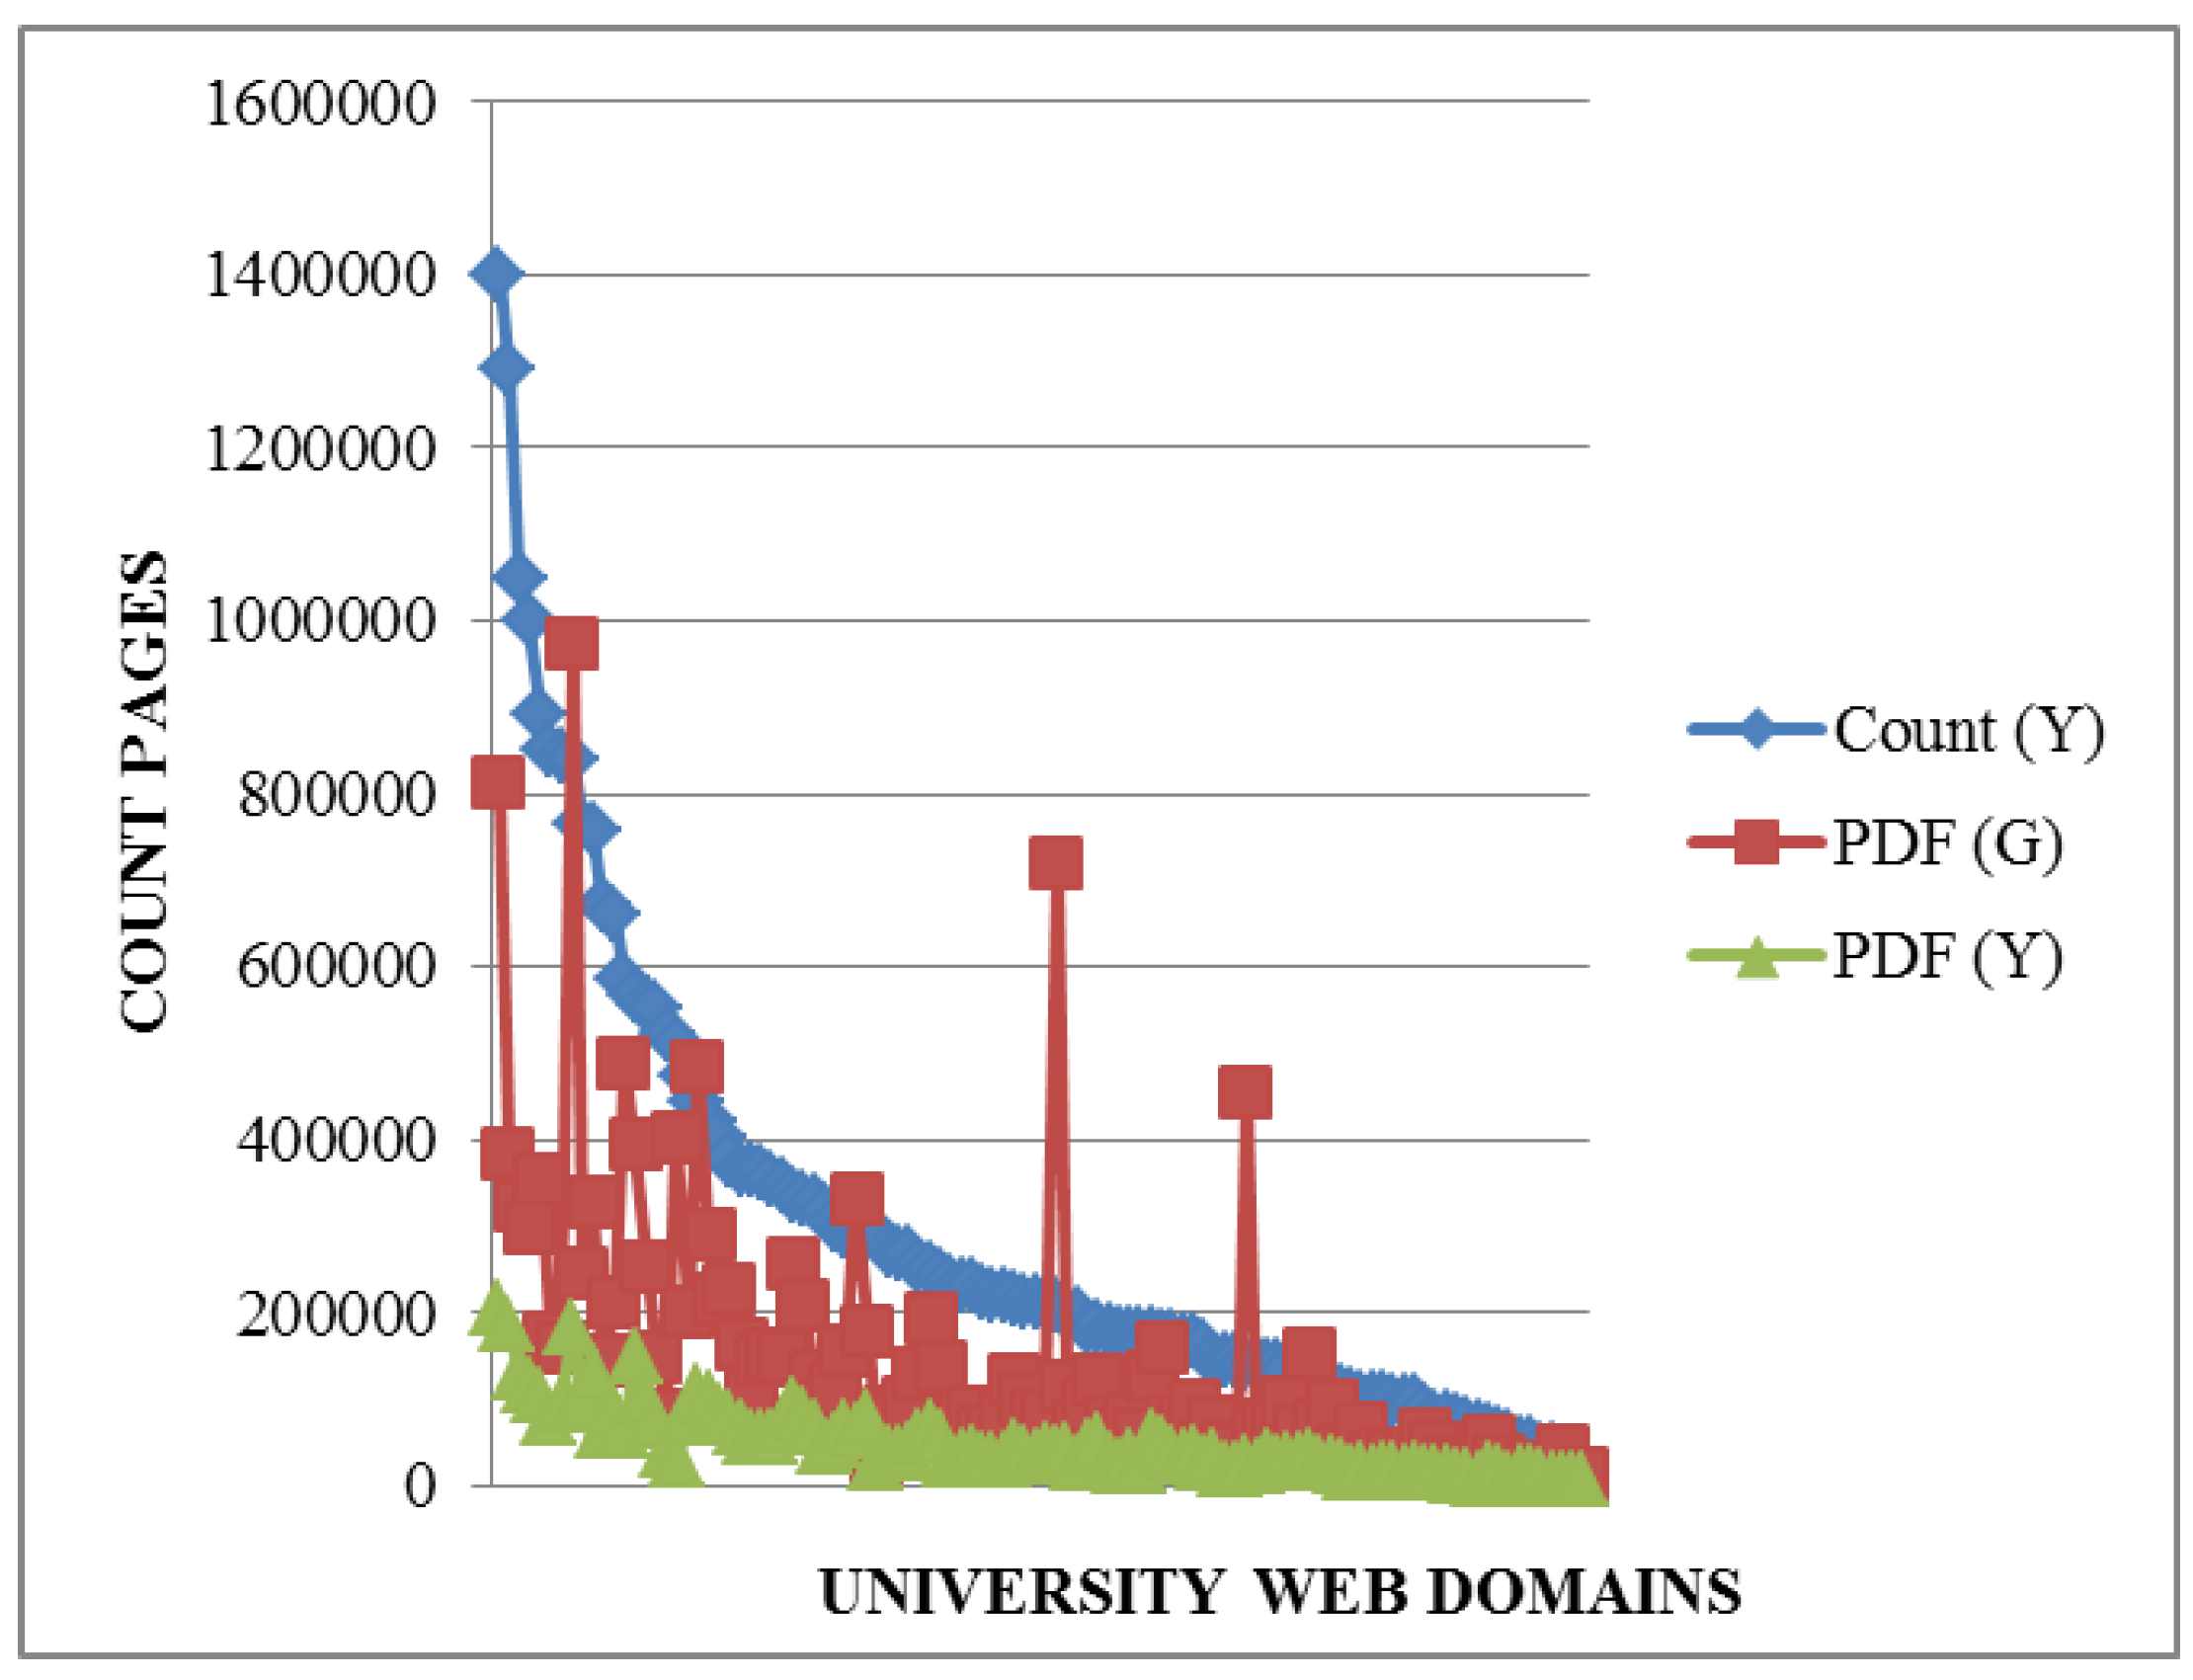
A total of 104 URLs were gathered from the sample because four universities maintain two active web domains: University of Illinois at Urbana-Champaign (uiuc.edu; illinois.edu), Ohio State University-Main Campus (osu.edu, ohio-state.edu), Southern Illinois University Carbondale (siuc.edu, siu.edu), and Stony Brook University (stonybrook.edu, sunysb.edu). All URLs with all values gathered for each indicator are available in Annex B. The web domains with the highest page counts are the following: psu.edu (Pennsylvania State University, 1,400,000 pages), stanford.edu (Stanford University, 1,290,000 pages), umich.edu University of Michigan-Ann Arbor, 1,050,000 pages), and harvard.edu (Harvard University, 1,000,000 pages). No other university surpass 1,000,000 pages in the period analyzed.
If the number of URL mentions (Yahoo!) is considered, there are slight differences in the universities’ rankings. For example, psu.edu moves from first place on the page count list (Yahoo!) to 21st position in URL mentions; and umich.edu moves from second place to 11th. However, Stanford University (6,030,000 mentions) and MIT (5,810,000 mentions) become the two universities with more URL mentions.
External links provide other interesting results. The web domain that has the most links is purdue.edu (Purdue University-Main Campus, 16,584,698 links), followed by psu.edu (11,797,997 links) and cornell.edu (Cornell University, 11,195,178 links). Regarding total visits, the data shows that only 11 websites received more than 10,000,000 total visits during the month considered in the study. The most visited website, by far, was umn.edu (University of Minnesota-Twin Cities, 3,826,259 visits), followed by Purdue University (2,103,405 visits) and Harvard University (1,639,311 visits).
Despite some differences in the top rankings (due to statistical noise, especially in the low positions), a high similarity is obtained between the results of the different indicators, as the correlation analysis shows (Table 3). The fact that university web indicators may be strongly related to size (and other organizational characteristics) may account for their compactness. For that reason, all web data indicators were divided by student population (marked as “p”) in order to additionally calculate correlations using this ratio instead of the raw values.
Table 3. Correlation among web data at university level (raw data and normalized by population).
Count (Y)PDF (G)PDF (Y)URL (G)URL(Y)Links (M)Links (O)DmRVisits (C)
Count (Y)1
PDF (G)0.847*1
PDF (Y)0.917*0.908*1
URL (G)0.840*0.778*0.854*1
URL (Y)0.753*0.727*0.759*0.759*1
Links (M)0.856*0.752*0.832*0.788*0.765*1
Links (O)0.767*0.673*0.781*0.698*0.659*0.816*1
DmR0.914*0.819*0.900*0.893*0.777*0.883*0.769*1
Visits (C)0.903*0.844*0.896*0.783*0.734*0.836*0.751*0.871*1
Count (Y)/pPDF (G)/pPDF (Y)/pURL (G)/pURL(Y)/pLinks (M)/pLinks (O)/pDmRVisits (C)/p
Count (Y)/p1
PDF (G)/p0.767*1
PDF (Y)/p0.895*0.848*1
URL (G)/p0.869*0.759*0.853*1
URL (Y)/p0.742*0.706*0.765*0.742*1
Links (M)/p0.836*0.687*0.804*0.758*0.711*1
Links (O)/p0.675*0.519*0.688*0.628*0.621*0.813*1
DmR0.729*0.636*0.733*0.693*0.621*0.715*0.602*1
Visits (C)/p0.866*0.774*0.851*0.823*0.730*0.821*0.622*0.692*1
* Significant values (except) at the level of significance alpha = 0.050 (two-tailed test). p: Student population. Source: Forbes.
The elevated correlation values obtained show coherence among web-oriented indicators in the analyzed sample, regardless the type of indicator or the source, both for non-normalized values and normalized by student population.
As regards raw data, the lowest results values were detected for links measured with Open Site Explorer (with a lower coverage than Majestic), specifically when compared with the URL mentions for Google (r = 0.698) and Yahoo! (r = 0.659). This coherence among web indicators also shows that some could be used as substitutes for the others. For example, PDF Count by Google can be used instead of PDF Count by Yahoo! (less coverage) or Global Count by Yahoo! (less accurate). Likewise, links measured by Majestic can substitute links from Open Site Explorer (less coverage) and URL mentions (less accurate). Finally, unexpectedly, a high correlation was found between Count (Y) and DmR (0.914) and Visits (0.903).
If web data weighted by student population is considered, the correlation values are slightly lower but still statistically significant, showing similar patterns, specifically the great correlation of Count (Y) and Visits (C) with the remaining indicators, and the lower correlation achieved by Links (O). These results reinforce the high coherence among different university web indicators with independence of size.
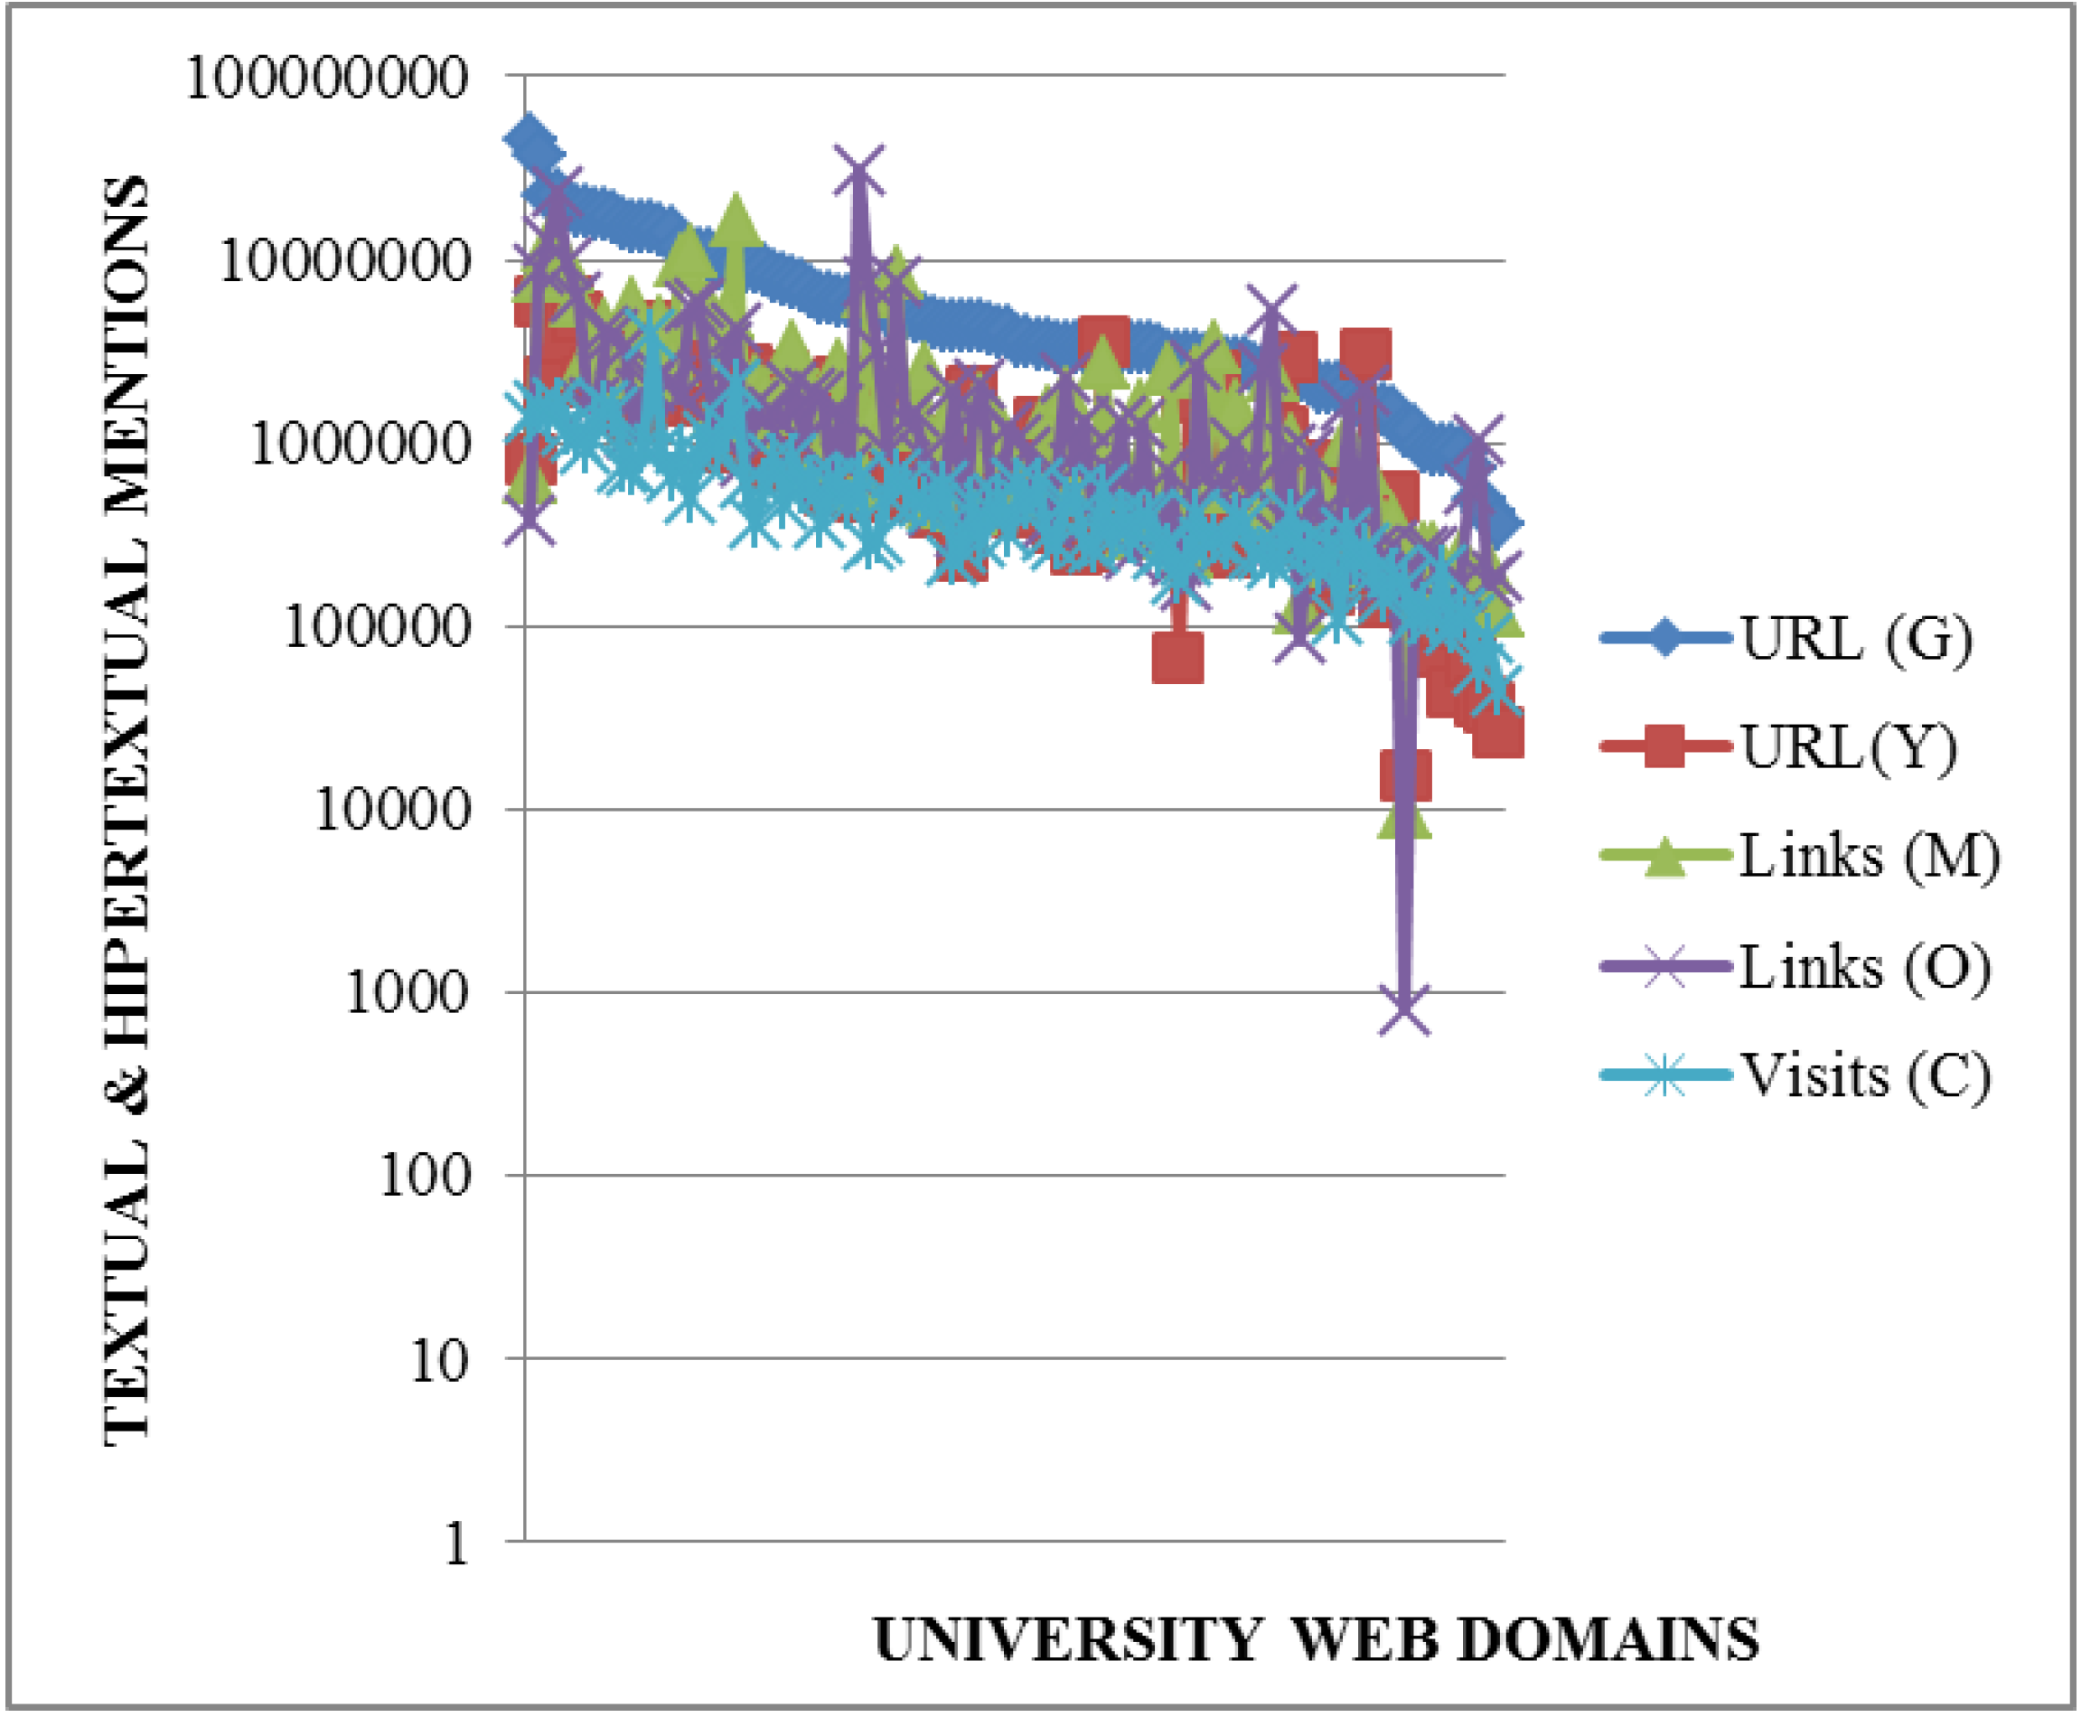
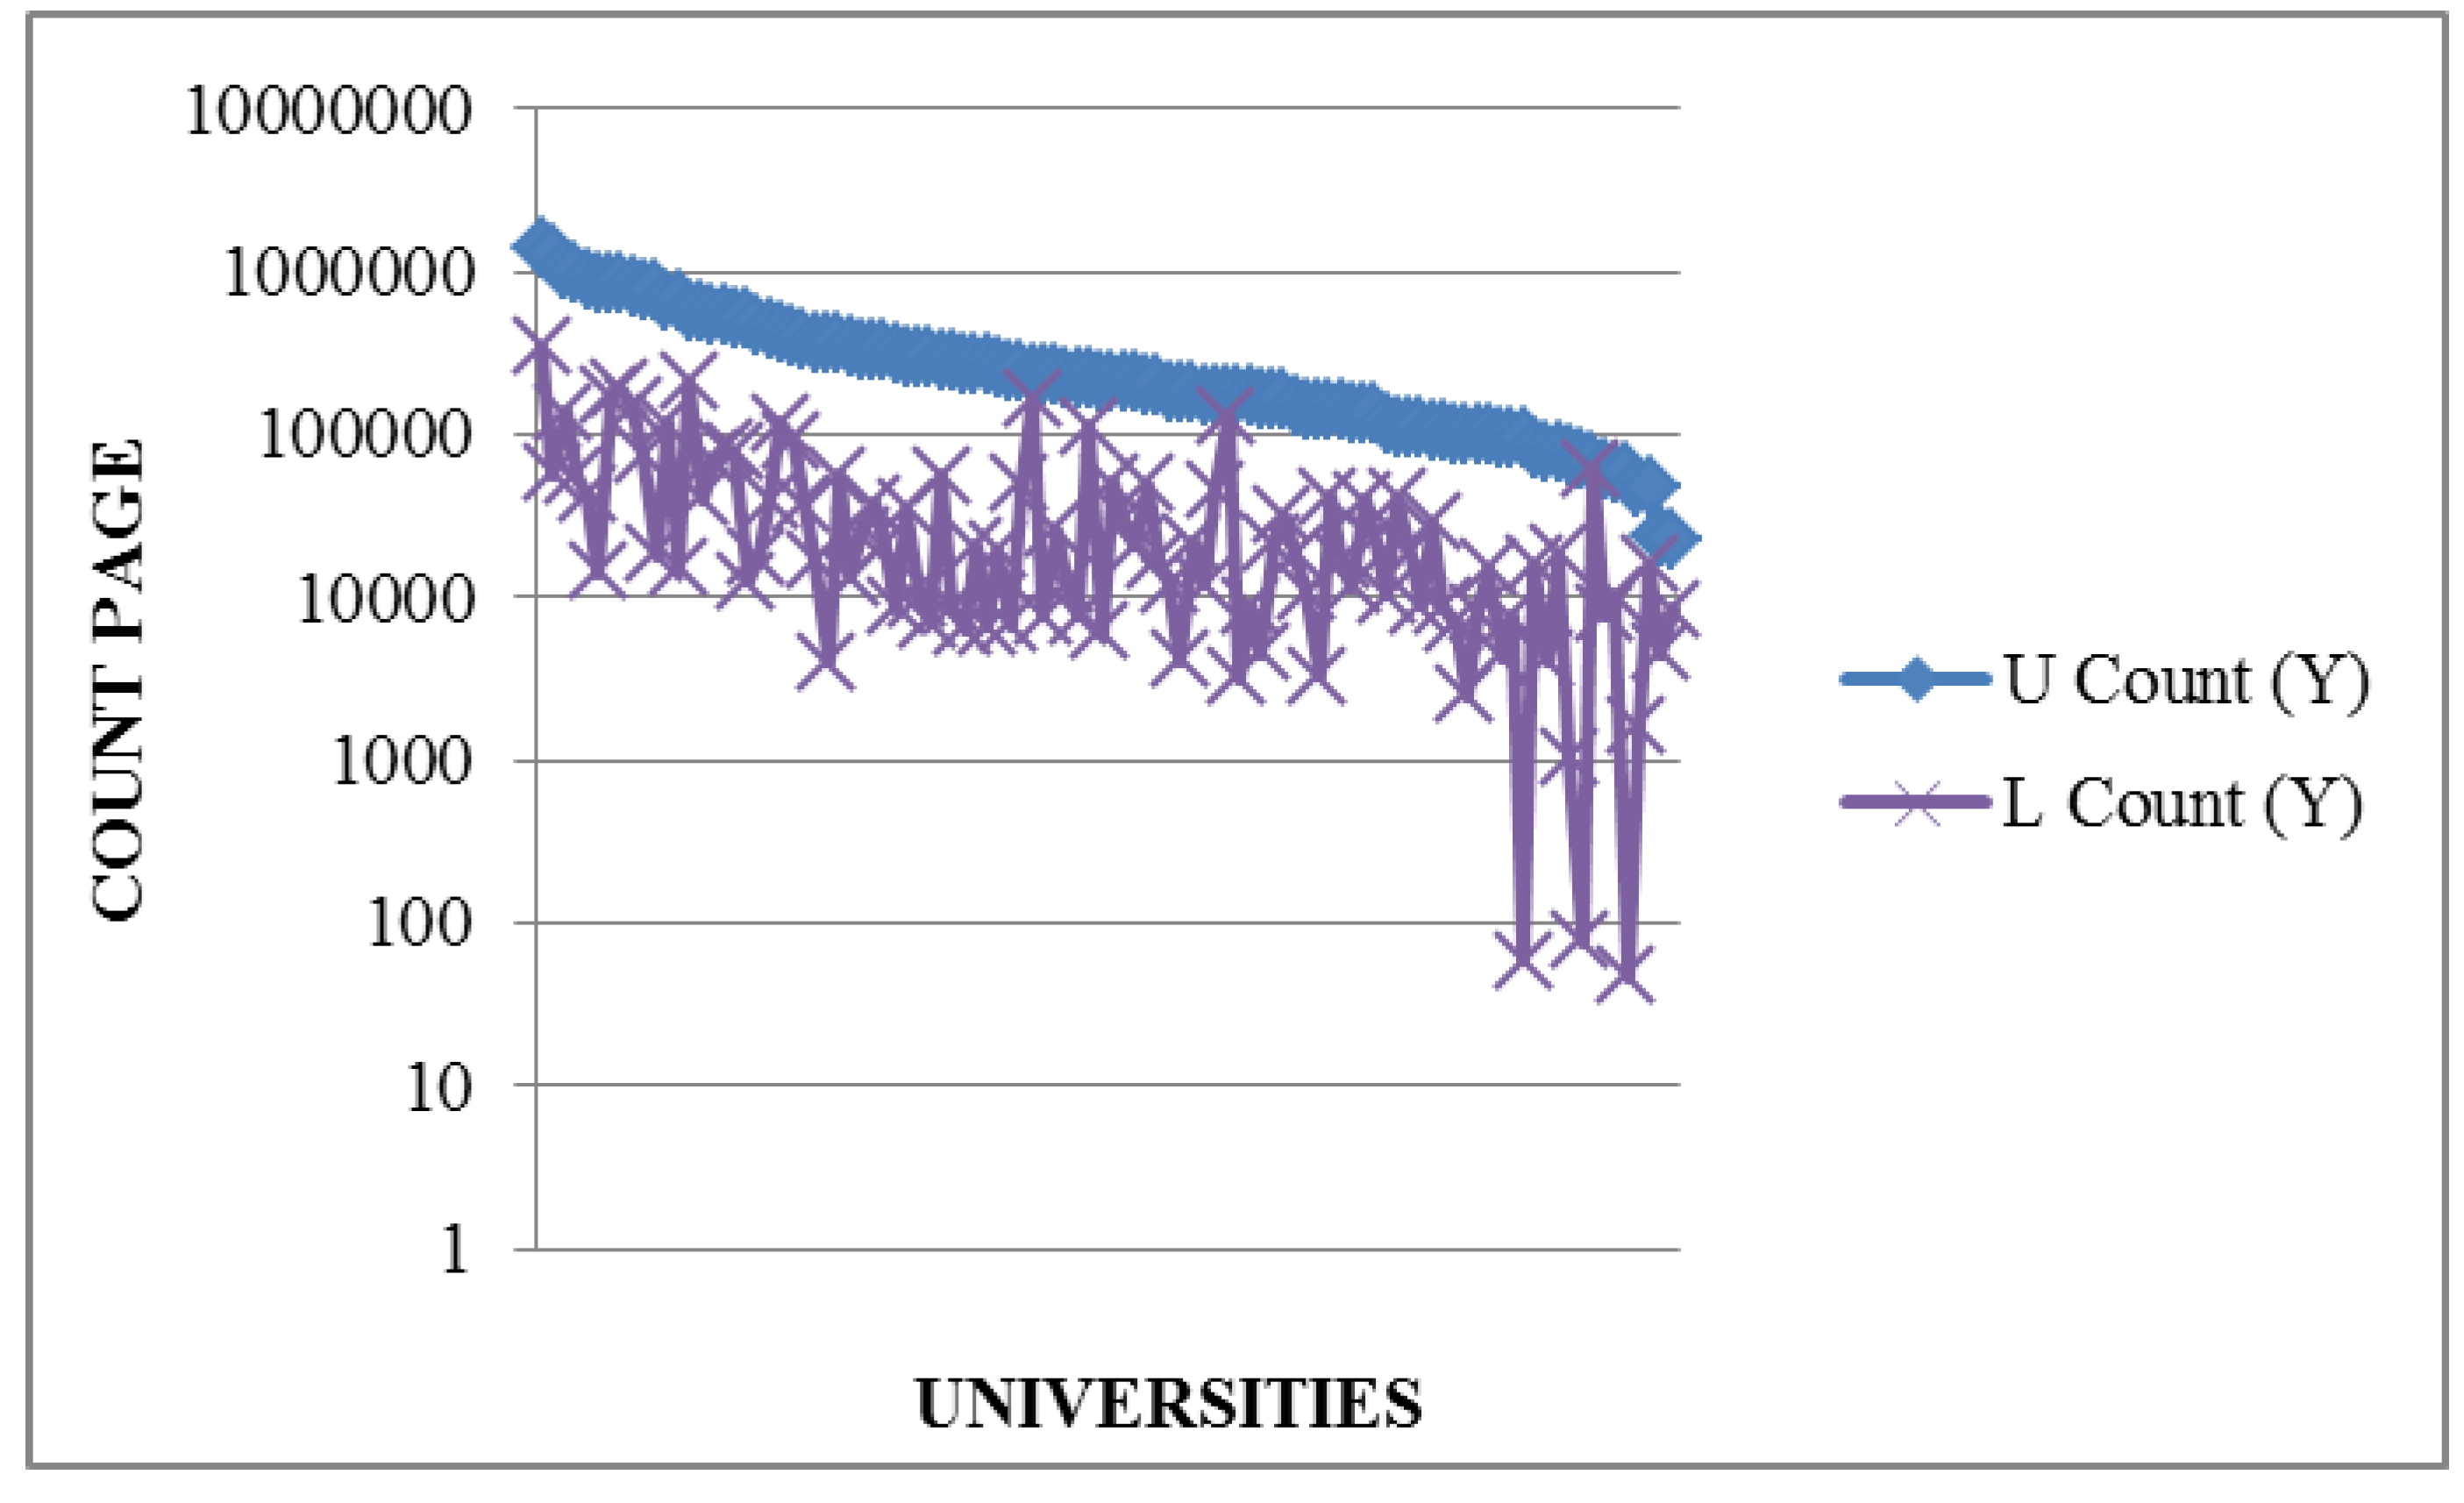
Figure 1 shows the performance distribution for count-like indicators, whereas Figure 2 focuses on impact indicators (mentions and links). In general, the correlation among the indicators is well reflected, except for some URLs that show unexpected high or low values. For example, for the Count (Google) indicator, psu.edu, mit.edu, uiowa.edu, and uoregon.edu show elevated values if compared with the remaining count-like indicators.
Figure 1. Distribution of page count indicators for URLs.
Technologies 01 00026 g001
Figure 2. Distribution of impact indicators for URLs.
Technologies 01 00026 g002
Regarding impact (shown in logarithmic scale to facilitate the display), a high value for buffalo.edu and a low value for manoa.hawai.edu are identified for Links (Open Site Explorer). Likewise, a low value for URL mentions (Yahoo!) is detected for bc.edu, for links (Open Site Explorer), among other inconsistencies. In addition, there are generally low values for audience in terms of mentions and links indicators (Figure 2).

3.3. Correlation among Institutional and Web Data for Universities

After the descriptive analysis of the universities was conducted, a correlation among the institutional and web indicators was calculated and is shown in Table 4.
Table 4. Correlation among institutional and web data (university level).
Count (Y)PDF (G)PDF (Y)URL (G)URL (Y)Links (M)Links (O)Visits (C)
Rank (US News)−0.51*−0.27*−0.34*−0.50*−0.46*−0.59*−0.38*−0.35*
Rank (Forbes)−0.46*−0.20−0.3*−0.45*−0.39*−0.54*−0.28*−0.30*
R. Expenditures0.75*0.66*0.73*0.72*0.61*0.62*0.60*0.75*
Student population0.34*0.42*0.47*0.34*0.24*0.21*0.31*0.47*
Count (Y)/pPDF (G)/pPDF (Y)/pURL (G)/pURL (Y)/pLinks (M)/pLinks (O)/pVisits (C)
Rank (US News)−0.79*−0.59*−0.71*−0.81*−0.64*−0.78*−0.61*−0.71*
Rank (Forbes)−0.74*−0.52*−0.66*−0.76*−0.59*−0.72*−0.51*−0.66*
R. Expenditures0.58*0.53*0.60*0.57*0.50*0.50*0.45*0.57*
Student population−0.22*−0.13−0.15−0.20−0.15−0.17−0.13−0.17
* Significant values at the level of significance alpha = 0.050 (two-tailed test).
Considering raw data, a high-moderate correlation was detected between research expenditures and web performance, especially with Global Count (r = 0.75), and total visits (r = 0.75), and a lower correlation for URL mentions and external links. Up to three separate zones are identified: the first is university reputation, the second is student population, and the third is web data.
If weighting by student population is applied, the correlations show unexpectedly results. On one hand, ranking positions (US News and Forbes) improve notably their correlation with web data; on the other hand both university research expenditures and student population achieve lower correlation values. These results could imply that financial data (expenditures) and size (number of students) have a direct effect in the creation of more web pages, the generation of links and the increasing of online visits to university websites whereas universities in the first ranking positions are those with more ratio of web contents, with independence of size.

3.4. Universities versus Academic Libraries

A total of 374 URLs related with academic libraries were retrieved from the 100 selected universities, using the gathering process described in the method section. All web data for all these URLs are available online [37]. Next is provided the correlation analysis among web indicators corresponding with universities and academic libraries, and after this, the proportion of the latter respect to the former is calculated.

3.4.1. Correlation among University Web Indicators

The correlation values at the web level for universities and academic libraries are available, both for non-normalized and normalized by student population data, in Table 5.
Table 5. Correlation among university web data.
University LevelLibrary Level
Count (Y)PDF (G)PDF (Y)URL (G)URL (Y)Link (M)Link (O)Visits (C)
Count (Y)0.57*0.49*0.50*0.69*0.53*0.34*0.43*0.64*
PDF (G)0.51*0.56*0.56*0.65*0.50*0.32*0.35*0.58*
PDF (Y)0.54*0.51*0.54*0.68*0.50*0.32*0.38*0.59*
URL (G)0.50*0.47*0.45*0.62*0.46*0.33*0.40*0.55*
URL (Y)0.44*0.50*0.39*0.55*0.47*0.40*0.43*0.53*
Link (M)0.48*0.39*0.40*0.62*0.48*0.38*0.45*0.52*
Link (O)0.43*0.33*0.43*0.54*0.44*0.24*0.36*0.44*
Visits (C)0.55*0.49*0.51*0.67*0.52*0.34*0.43*0.68*
Count (Y)/pPDF (G)/pPDF (Y)/pURL (G)/pURL (Y)/pLink (M)/pLink (O)/pVisits (C)
Count (Y)/p0.61*0.38*0.38*0.68*0.58*0.39*0.45*0.68*
PDF (G)/p0.55*0.48*0.43*0.61*0.50*0.39*0.39*0.61*
PDF (Y)/p0.58*0.42*0.41*0.68*0.56*0.44*0.45*0.63*
URL (G)/p0.58*0.35*0.32*0.61*0.51*0.45*0.49*0.61*
URL (Y)/p0.47*0.41*0.28*0.52*0.49*0.45*0.45*0.55*
Link (M)/p0.51*0.27*0.29*0.61*0.57*0.40*0.46*0.57*
Link (O)/p0.44*0.22*0.34*0.49*0.45*0.26*0.36*0.43*
Visits (C)/p0.62*0.39*0.40*0.65*0.57*0.44*0.47*0.75*
* Significant values at the level of significance alpha = 0.050 (two-tailed test).
Important results include the relatively good correlation achieved by URL mentions at the academic library level with almost all university-level indicators, and the low values achieved among link indicators. For example, for Link (Majestic) for libraries, r = 0.376 with Link (Majestic) for universities.
Figure 3. Distribution of page counts for universities (U) and academic libraries (L).
Technologies 01 00026 g003
In the case of data normalized by student population, the results are obviously quite similar, because both levels (university and library) are equally normalized, and size effect is softened. In any cases, the results for PDF (G) and PDF (Y) are lower whereas for Count (Y), URL (Y), Link (O) and Visits (C) the correlations are higher. In all cases correlations are moderate.
In any case, the existence of outliers in the distribution may affect the correlations calculated. Figure 3 shows -only for illustrative purpose- the performance for universities and academic libraries for page count indicator, were some specific outliers can be visualized.

3.4.2. Correlation among Library Web Indicators

Table 6 shows for the Top 20 universities with higher page counts the percentage of the global page count that academic libraries represent for universities. The proportion of total visits is also shown. For universities and libraries, the values are obtained by adding the various URLs for each unit. In the case of libraries, as mentioned in Orduña-Malea and Regazzi [25], these values correspond to library homepages, repositories, OPACs, and digital collections. The data shows that for page count, four universities account for more than 20% of the content, a high figure, taking into account the size and diversity of the universities. Among these universities should be highlighted Pennsylvania State University (24.20%), due to the CiteseerX repository mainly, and the University of Pennsylvania (20.72%), MIT (22.54%), and the University of Minnesota (36.88%), due to their library homepage.
Table 6. Percentage of library web data of total university web data.
Web DomainPage Count (Yahoo)Use Visits (Compete)
UniversityLibrary%UniversityLibrary%
Pennsylvania State University-Main Campus1,400,00033,880124.201,329,323108,7458.18
Stanford University1,290,00057,1824.431,552,73351,1463.29
University of Michigan-Ann Arbor1,050,000134,89312.851,371,841176,87212.89
Harvard University1,000,00056,2795.631,639,31170,4004.29
University of Washington-Seattle Campus891,00042,3004.751,132,89183,5457.37
Columbia University in the City of New York852,00014,3621.691,072,02317,4821.63
University of Pennsylvania842,000174,43020.72902,811235,80926.12
Massachusetts Institute of Technology840,000189,32822.541,247,43125,5962.05
University of Illinois at Urbana-Champaign801,000146,00818.231,339,04478,8875.89
Cornell University764,00074,0989.701,585,049207,86713.11
University of California-Berkeley759,00018,3642.421,456,08889,5426.15
University of North Carolina at Chapel Hill673,000117,79317.50721,50498,62113.67
University of California-Los Angeles659,00014,9612.27707,46224,5913.48
University of Minnesota-Twin Cities565,000208,37036.883,826,259101,3932.65
Michigan State University555,00040,6007.32909,89852,1155.73
North Carolina State University at Raleigh552,00068,94012.49642,61970,01210.89
Ohio State University–Main Campus528,00080,60015.271,064,75235,2623.31
University of Virginia–Main Campus523,00077,60114.84895,39276,1718.51
Johns Hopkins University509,00012,4192.44489,51419,8804.06
University of Arizona473,00017,7273.75843,68341,6544.94
In the case of total visits, the percentages are lower, and only five universities have more than 10% of the visits in the same month. Again, the University of Pennsylvania (26.12%) achieves a remarkable percentage. In contrast, several important universities, such as the University of California-Los Angeles (3.48%), Stanford University (3.29%), MIT (2.05%), and Columbia University (1.63%) had low percentages.

4. Discussion

The economic variables considered for universities shared a generally weak correlation. The two university rankings used (US News and World Report and Forbes) have high correlation (r = 0.923) but low correlation with all other indicators. Neither research expenditures nor total student population has a strong correlation with rankings, which can be explained by the methodological procedures used for each ranking. The weak correlation between research expenditures and population (r = 0.314) also follows this pattern, and may be a result of the sample corresponding with only the 100 academic libraries with the highest total expenditures.
In contrast, the web data shows a great compactness among indicators, suggesting that universities with higher page counts are those with more mentions, visits, and external links (with some exceptions). A lower value is obtained among URL mentions and links (measured with Open Site Explorer). Although not all URL mentions become hyperlinks, this correlation if it would have been higher as expected, then such an effect could be attributed partially to the relatively low coverage and accuracy of Open Site Explorer as a source for gathering links.
If institutional and web data are compared, the results are show an important correlation among web data and research expenditures, specifically with page count (r = 0.752) and visits (r = 0.749). A possible explanation of these values is that the more students who attend a university, the more users likely to visit the corresponding website, and indirectly, the more pages that are created, and more times the pages are linked, although clearly not all page visits can be attributed to students and not all university pages are created for academic programs.
The influence of academic libraries on universities was also studied in terms of web data variables. The web indicators used at the university level show a moderate, but not significant, correlation with the web indicators at the library level. The data shows a specific relation among these two groups of indicators, where URL mentions can act as a gateway. Page counts and visits have an interesting relation, but link indicators present an absence of correlation among all other indicators.
Finally, the influence of university size (in terms of student population) on web data has been also studied, which constitutes a novelty in web analysis under webometric methods. The size parameter seems to be more evident among institutional and web data (especially university research expenditures) than among web indicators. In any case, the effect is detected and should be taken into account in future research.

5. Conclusions

Finally, the main conclusions of this research, with particular reference to its key objectives, are as follows:

Offline versus Online

Research expenditures have a strong correlation with web variables for the sample when university size component is not considered. This finding opens up a way of illustrating how research and the promotion of research efforts can affect the reputation brand attributes, web behaviors, and economics of a university website, especially in small universities. This is important as otherwise, overall position in the reputation rankings correlates with web variables if student population is considered to normalize web data.

Influence

The percentage of the academic libraries’ page count of the universities’ total page count is moderately and potentially important, especially for some universities. This effect is assumed is associated with the existence of big platforms and institutional repositories, such as CiteseerX, so that their influence on university web rankings seems a logical result. The low percentages detected on other universities with big online platforms is attributed to inconsistent naming and other bad practices in web structure and URL syntaxes, corroborating the effects of these web policies on web impact, found previously by Orduña-Malea and Regazzi [25].
Regarding online visits, the relationship is low to moderate, except for some universities. This issue seems to be logical, because the access to library websites are more delimited to students and researchers of each university whereas the university websites are focused to a wider target. Moreover, library holdings use to be closed to external users by means of private intranets. For that reason, it is necessary the usage of webmaster tools (such as Google or Bing webmaster tools, among other applications) in order to get more reliable data about this indicator. Unfortunately, both university and library website usage data is not usually public, and the tools employed are those available for external users of all websites under study. Notwithstanding, this issue should be further analyzed due to the importance in ensuring reliable data for academic website access.

Compactness of Web Variables

The high compactness among web variables found for universities contrasts with the weak compactness found previously by Orduña-Malea and Regazzi for academic libraries. This reinforces the hypothesis that the complexity of the online structure of academic libraries underrepresents their performance on the web (leading to a weak correlation among web indicators) and their influence on the universities’ global figures.
One explanation of this difference might be that universities are publishing original content related to their activities whereas libraries are not, and this original content attracts more web activity and reputational brand awareness. In any case, this systemic web behavior should be pursued in future research.

Influence of University Student Population

The effect of size among web data indicators (both for university and library level) is detected, but its effect is small, so that the compactness among web indicators is elevated independently of size.
Otherwise, the correlation among ranking position and web data improves when size is controlled. Taking into account that the rankings considered (US News and Forbes) do not apply any web indicator in their rankings, this result reinforces the previous findings about the good correlation of web indicators with non-web university rankings, independently of university size.
Finally, the correlation among university research expenditures and web data decreases when size is controlled. This result implies that research expenditures correlate with web data only in big universities

Acknowledgements

The authors want to acknowledge the work done by the reviewers, who have helped greatly to improve the final version of this paper.

Conflicts of Interest

The authors declare no conflict of interest.

References

  1. Rauhvargers, A. Global University Rankings and Their Impact; European University Association: Brussels, Belgium, 2011. [Google Scholar]
  2. Centre for Higher Education (CHE). Available online: http://www.che.de (accessed on 5 July 2013).
  3. Macleans.ca. Available online: http://tools.macleans.ca/ranking2013/selectindicators.aspx (accessed on 5 July 2013).
  4. Jones, L.V.; Lindzey, G.; Goggshall, P.E. An Assessment of Research-Doctorate Programs in the United States: Social & Behavioral Sciences; National Academic Press: Washington, DC, USA, 1982. [Google Scholar]
  5. The Princeton Review. Available online: http://www.princetonreview.com/college-rankings.aspx (accessed on 5 July 2013).
  6. Regazzi, J.J. Constrained? An analysis of US academic libraries and shifts in spending, staffing and utilization, 1998–2008. Coll. Res. Libr. 2012, 73, 449–468. [Google Scholar]
  7. Regazzi, J.J. Comparing academic library spending with public libraries, public K-12 schools, higher education public institutions, and public hospitals Between 1998–2008. J. Acad. Librariansh. 2012, 38, 205–216. [Google Scholar] [CrossRef]
  8. Oppenheim, C.; Stuart, D. Is there a correlation between investment in an academic library and a higher education institution’s ratings in the Research Assessment Exercise? Aslib Proc. 2004, 56, 156–165. [Google Scholar] [CrossRef]
  9. Noh, Y. The impact of university library resources on university research achievement outputs. Aslib Proc. 2012, 64, 109–133. [Google Scholar] [CrossRef]
  10. Ranking Web of Universities. Available online: http://www.webometrics.info (accessed on 5 July 2013).
  11. Aguillo, I.F.; Ortega, J.L.; Fernández, M. Webometric ranking of world universities: Introduction, methodology, and future developments. High. Educ. Eur. 2008, 33, 234–244. [Google Scholar]
  12. Aguillo, I.F.; Ortega, J.L. Mapping world-class universities on the web. Inf. Proc. Manag. 2009, 45, 272–279. [Google Scholar] [CrossRef]
  13. Thelwall, M.; Zuccala, A. A university-centred European Union link analysis. Scientometrics 2008, 75, 407–420. [Google Scholar] [CrossRef]
  14. Adecannby, J. Web link analysis of interrelationship between top ten African universities and world universities. Ann. Libr. Inf. Stud. 2011, 58, 128–138. [Google Scholar]
  15. Qiu, J.; Cheng, J.; Wang, Z. An analysis of backlinks counts and web impact factors for Chinese university websites. Scientometrics 2004, 60, 463–473. [Google Scholar] [CrossRef]
  16. Smith, A.; Thelwall, M. Web impact factors for Australasian universities. Scientometrics 2002, 54, 363–380. [Google Scholar] [CrossRef]
  17. Park, H.W.; Thelwall, M. Web science communication in the age of globalization. New Media Soc. 2006, 8, 629–650. [Google Scholar] [CrossRef]
  18. Barnett, G.A.; Park, H.W.; Jiang, K.; Tang, C.; Aguillo, I.F. A multi-level network analysis of web-citations among the world’s universities. Scientometrics 2013. [Google Scholar] [CrossRef]
  19. Aguillo, I.F.; Granadino, B.; Ortega, J.L.; Prieto, J.A. Scientific research activity and communication measured with cybermetric indicators. J. Am. Soc. Inf. Sci. Technol. 2006, 56, 1296–1302. [Google Scholar]
  20. Lee, M.S.; Park, H.W. Exploring the web visibility of world-class universities. Scientometrics 2012, 90, 201–218. [Google Scholar] [CrossRef]
  21. Aguillo, I.F.; Ortega, J.L. North America Academic Web Space: Multicultural Canada vs. the United States Homogeneity. In Proceedings of the ASIST & ISSI Pre-Conference Symposium on Informetrics and Scientometrics. Thriving on Diversity—Information Opportunities in a Pluralistic World, Vancouver, BC, Canada, 6–11 November 2009.
  22. Arakaki, M.; Willet, P. Webometric analysis of departments of librarianship and information science: A follow-up study. J. Inf. Sci. 2009, 35, 143–152. [Google Scholar] [CrossRef]
  23. Chu, H.; He, S.; Thelwall, M. Library and information science schools in Canada and USA: A webometric perspective. J. Educ. Libr. Inf. Sci. 2002, 43, 110–125. [Google Scholar]
  24. Tang, R.; Thelwall, M. A hyperlink analysis of US public and academic libraries’ web sites. Libr. Q. 2008, 78, 419–435. [Google Scholar] [CrossRef]
  25. Orduña-Malea, E.; Regazzi, J.J. US academic libraries: Understanding their web presence and their relationship with economic indicators. Scientometrics 2013. [Google Scholar] [CrossRef]
  26. Phan, T.; Hardesty, L.; Sheckells, C.; George, A. Documentation for the Academic Libraries Survey (ALS) Public-Use Data File: Fiscal Year 2008 (NCES 2010-310); National Center for Education Statistics, Institute of Education Sciences, US Department of Education: Washington, DC, USA, 2009.
  27. Capaldi, E.D.; Lombardi, J.V.; Abbey, C.W.; Craig, D.C. The Top American Research Universities. 2009 Annual Report; Center of Measuring University Performance: Tempe, AZ, USA, 2009. [Google Scholar]
  28. US News and World Report. Available online: http://colleges.usnews.rankingsandreviews.com/best-colleges/rankings/national-universities (accessed on 5 July 2013).
  29. Forbes (America’s Top Colleges). Available online: http://www.forbes.com/top-colleges (accessed on 5 July 2013).
  30. Thelwall, M. Introduction to Webometrics: Quantitative Web Research for the Social Sciences; Morgan & Claypool: San Rafael, CA, USA, 2009. [Google Scholar]
  31. Aguillo, I.F. Measuring the institutions’ footprint in the web. Libr. Hi Tech 2009, 27, 540–556. [Google Scholar] [CrossRef]
  32. Majestic SEO. Available online: http://www.majesticseo.com (accessed on 5 July 2013).
  33. Open Site Explorer. Available online: http://www.opensiteexplorer.org (accessed on 5 July 2013).
  34. Ahrefs Site Explorer. Available online: https://ahrefs.com (accessed on 5 July 2013).
  35. Thelwall, M.; Sud, P. A comparison of methods for collecting web citation data for academic organisations. J. Am. Soc. Inf. Sci. Technol. 2011, 62, 1488–1497. [Google Scholar] [CrossRef]
  36. Alexa: The Web Information Company. Available online: http://www.alexa.com/ (accessed on 5 July 2013).
  37. Complementary Material to Manuscript “US Academic Libraries: Understanding Their Web Presence and Their Relationship with Economic Indicators”. Available online: http://digibug.ugr.es/handle/10481/23758 (accessed on 5 July 2013).

