1. Introduction
Since the 2008 economic crisis, the global system of financial institutions has shown to be able to transmit financial shocks at a rapid speed. The US subprime mortgage crisis initiated a sequence of shock events which rippled through the strongly intertwined economic and financial systems. A global financial crisis and economic recession followed which cumulated in Europe in the sovereign debt crisis. While governments tried to reanimate their economies through quantitative easing and other financial support initiatives, they also had to deal with slumped growth and rising unemployment levels. Sovereign debt levels increased rapidly and widespread austerity measures followed. Many European governments had to cut spending, while at the same time being confronted with increased costs of borrowing. Financial sector developments engraved these circumstances as many banking institutions turned out to be inadequately capitalized when faced with the economic pressure put on their balance sheets. The fragile situation of banks led to the drying up of interbank markets, which quickly began to affect the wider economy. Financial injections and bail-outs on part of sovereign regulators implied additional pressure on already strained public finances and threatened the future of the common currency. A rising awareness of the lack of unified rules for banking supervision and resolution and the implications thereof for the economy as well as the monetary union eventually led to the introduction of far-reaching new regulations with the aim to construct a banking union in an effort to break the feedback loop between banks and sovereigns.
During the crisis years, financial institutions played a key role in passing on financial shock events to sovereigns and the real economy and, thus, constituted both a source and transmission channel for systemic risk. With rising globalization and lacking or inadequate regulation, financial institutions have become more globally intertwined than ever before. A complex and obscure web of over-the-counter transactions, a growing shadow banking system, and information asymmetries on part of regulators help to explain why a comparatively small shock event like the US subprime mortgage crisis could have such large repercussions. In this context regulatory frameworks such as Basel II turned out to be inadequate, which was engraved by the tendency of capital requirements to be pro-cyclical (EEAG [
1]). Furthermore, especially large banks seemed to get away with lower capital buffers while markets were implicitly counting on government back-ups (Haldane [
2]).
Since 2009, European banks have been undergoing regular assessments of their financial stability by the European Banking Authority (EBA). Banks’ capital buffers have been assessed in different economic scenarios under consideration of their assumed risks. In this context, individual results including detailed data on banks’ sovereign debt exposures have been published by the EBA in regular intervals as part of the 2011 stress tests
1, the 2011/2012 capital exercises
2, the 2013 transparency exercise
3 and the most recent stress tests published in October 2014
4. This paper assesses the financial links between European Union (EU) governments and banks holding their sovereign debt by visualizing and analyzing the network that comes about through these financial linkages. Examining this “bank-sovereign network” with the help of network theory sheds light on the role of particular nodes for the stability of the network and the consequences thereof for systemic risk
5 in the EU. Network theory analyses the properties of networks under consideration of their connectedness and the position of the individual nodes. Examining a network under aspects of these characteristics can provide important insights where a macroeconomic approach falls short to distinguish between the different entities. The idea is that nodes are affected by their environments with which they interact and which they influence in turn. In context of this paper, the network approach underlines short-falls in past EBA assessments and the Basel II and III applications by EU authorities. It will be shown that the bank-sovereign network described by the EBA data exhibits characteristics that make it prone to portfolio contagion. It exhibits a core group of 15 banks, which are much stronger invested into European sovereign debt than the rest of the network. This group of banks also received considerable financial support in recent years, thus creating strong financial interdependences between this group of banks and EU governments, such as in the form of implicit and explicit government guarantees and financial support. Part of the problem is current EU regulation, which assigns a zero risk weight to member states’ sovereign debt exposures
6. This alters the amount of risk-weighted assets (RWA) on banks’ balance sheets and, consequently, affects their capital ratios and requirements. Due to the extent of their sovereign debt exposures, these “core” banks are less likely to be able to deal with situations in which a double-strain is put on their capital buffers such as during the recent economic and sovereign debt crises. While new regulatory provisions such as the Bank Recovery and Resolution Directive (BRRD) and the associated bail-in tool and resolution fund will hopefully make government bail-outs less likely, it is in the interest of banks’ creditors and shareholders as well as the overall economy more generally that these circumstances are addressed politically. Under the new regulations adopted in 2014, major shareholders and creditors will be the first to suffer losses to their investments when banks experience financial troubles they are unable to handle. Furthermore, considering the central role of these core banks in the overall economy, it is also in the wider general interest to address the sovereign debt investments and associated assumed risks of these entities.
As public finances have come under pressure, a reassessment of European countries’ creditworthiness has led to increased costs of borrowing for governments. With the widening of the credit spreads, the academic literature has put considerable efforts into assessing their individual determinants. Among Eurozone countries, sovereign debt spreads have diverged to unprecedented levels since the introduction of the common currency (
Figure 1). For years, these countries had enjoyed little diversified spreads, which were found to be mainly determined by what was identified to be a global risk factor rather than country-specific fundamentals (see, e.g., Codogno, Favero and Missale [
5], Geyer, Kossmeier and Pichler [
6]).
Drawing the connection to the bank-sovereign network, this paper proceeds to investigate the effect of relevant banks’ balance sheet characteristics on sovereign debt pricing. Sovereign debt holdings create financial links between banks and sovereign entities, which expose both sides to counterparty risk. Building on the work of Signori and Gençay [
7] who assess counterparty risk in the US supplier-customer network of public companies, the paper applies their network approach to the bank-sovereign network. Here those six banks that are the biggest institutions in terms of their own asset sizes among the banks exposed to the debt of particular issuer are identified. The analysis shows that these banks’ implied volatilities have had a considerable effect on EU countries’ CDS spreads. Furthermore, the role of domestic financial sector variables, including the sector sizes and loans among financial institutions, are considered and found to have affected EU debt pricing.
The paper is structured as follows: The next part lays out the relevant literature concerning the network approach and the structure and dynamics of financial systems. Thereafter, part three of the paper assesses the EBA data and the bank-sovereign network. In the fourth part, special focus is laid on the network’s core banks and the findings are put into context of new EU regulations of the banking sector. This is followed by the regression analysis in part five before the paper concludes part six.
Figure 1.
Selected Eurozone sovereign spreads (five-year credit default swap spreads in basis points). Spreads obtained from Datastream.
Figure 1.
Selected Eurozone sovereign spreads (five-year credit default swap spreads in basis points). Spreads obtained from Datastream.
2. Literature Review
The network approach has its origin in the study of biological, social, and human-created systems. The approach is concerned with the structure and formation of systems of nodes as well as the associated implications. A central premise is here that the characteristics and behavior of a node can only be fully evaluated in view of its connections to the rest of the system. A further aspect is the stability or resilience of the network as a whole, i.e., the extent to which a network remains adequately connected in case of an external shock which leads to the removal of one or more links or nodes.
In financial networks, the nodes are usually financial institutions or similar entities. The links can be anything from the mutual exposures between banks to holding the same kind of risky assets. When agents build connections under consideration of the implied costs and benefits, this process necessarily depends also on their relative position in the network. Likewise, possible externalities (e.g., the risk that a particular financial institution may create in the network) depend on a node’s position and its number of links (Allen and Babus [
8]).
Before the onset of the recent crisis years, the globally interconnected financial sector was considered to be stable because of its ability to diversify risk across the whole network. With the help of a range of new and sophisticated financial instruments risk became a commodity traded without consideration of the side-effects that these added instruments might introduce (Haldane [
2]). This line of thinking was supported by the academic literature. According to Allen and Gale [
9], for example, the more complete a network and the higher the level of connectedness to other areas within the economy, the better a financial crisis could be attenuated. The idea that completeness implies stability predominated also in the early phase of modeling ecosystems, such as food-web structures, but eventually had to be revised (May [
10], Gardner and Ashby [
11])
7. The underlying structures of financial systems often exhibit specific characteristics. Similar to natural or societal networks, financial networks have long-tailed degree distributions, where the degree of a node is the sum of the links attached to and originating from it. Thus, the average number of links a node has, also called the degree of a network, is not necessarily its most likely number of actual connections. These networks often have a few nodes with very many connections, several nodes with a medium number of connections, and a lot of barely connected nodes. The highly connected nodes or “hubs” ensure that the network is well-connected and the average path-length between any two nodes is short. This characteristic makes these networks robust to random disturbances, which are likely to remove a little connected node. At the same time a targeted attack may affect one of the vital hubs, thus seriously disrupting the network as a whole (Albert and Barabasi [
14]). May
et al. [
15] have argued that it is the modularity of a network,
i.e., the degree to which the system can be compartmentalized and the nodes decoupled into relatively discrete components, which leads to its robustness and can avoid incidents of contagion from spreading. The problem with the global financial network is that it is difficult to compartmentalize and the attempt could potentially deteriorate the status quo.
Moreover, financial systems have been found to often exhibit a core component consisting of the most connected nodes being tightly interconnected. Newman [
16] (p. 5) defines such a core as “the set of vertices which can both reach and be reached” from a vertex. Interbank markets and payment systems have been found to have such a core component with a small number of banks strongly trading among each other and being responsible for the majority of transactions and total value of operations. In this “vulnerable cluster” (Gai and Kapadia [
17]), one hub is almost impossible to isolate from another. Thus, 75% of the daily interbank payment flows in the US Fedwire system have been found to be executed by 0.1% of the nodes and 0.3% of the observed linkages (Soramäki
et al. [
18], May
et al. [
15]). Similarly, the three biggest banks in the Dutch interbank payment system are engaged in 52% of all transactions and 63% of the total value transferred. Over longer time frames, only 12% of all possible interbank connections are being used (Pröpper
et al. [
19]).
Furthermore, just as there is evidence of a threshold level for ecosystems, after which higher connectedness leads to less stability, this dynamic seems to hold true for financial systems. This is problematic in context of estimates that claims between entities within the financial system as opposed to with external agents constitute perhaps as much as two thirds of the growth in banks’ balance sheets over the last decades (Haldane and May [
20]). New financial instruments have multiplied extraordinarily without regard for the stability of the sector. It has been argued that the mechanics of Arbitrage Pricing Theory introduce distorted incentives leading banks to supply further financial instruments to already satisfied markets. Consequently, the system’s complexity and dimension increase without further welfare gains as markets are essentially already complete (Caccioli
et al. [
21]). This can reinforce systemic risk. Nier
et al. [
22] found that financial contagion in interbank markets is a non-monotonic function of the number of connections. While a higher average capitalization can serve within limit as a form of buffer, in undercapitalized systems, interbank linkages will transmit shocks rather than absorb them. When the capitalization level falls below a certain threshold, the whole system is likely to break down. Haldane [
2] has dubbed this a “knife-edge” characteristic. A seemingly complex but homogeneous international financial network can absorb shocks within limits, but can reach a tipping point after which it will amplify them. Its homogeneity is due to the nearly identical diversifying strategies pursued over recent years. Its structured interconnectedness made the system prone to contagion, but provided investors with a sense of security. It also allowed for the ensuing losses to be far out of proportion considering the initial shock event.
3. Network Analysis
A bank’s exposure to the sovereign debt of a particular issuer builds a link between the two entities. This link can be modeled following the flow of money from a bank node
and a sovereign issuer
. A link
can simply be taken to be 0 or 1 depending on whether there is such a link
8. Thus, all links between pairs
taken together build the network. It consists of the measurable subset
of the finite links in the larger network. The latter is similar to, for example, interbank networks part of the global financial system. Thus, it is itself a sub-network of a much larger construct which is in constant flux. As with most of the global financial system, the bank-sovereign network is not completely supervised, even though the most recent October 2014 stress test assessed the largest number of banks so far. While keeping this in mind, it is nevertheless possible to gain valuable insights into potential sources of systemic risk in the network.
Among the elementary network properties are the number of nodes
and links
, with the former also being considered to denote the size of a network. The network density, also called connectivity, can be assessed by looking at the existing number of links over the possible number of links. The calculation of the density depends on the type of network. For a directed network where links can run in both directions between nodes, it is given by
.
9 The bank-sovereign network however has the particular characteristic that links are running only from one group of nodes to another. Thus, if
are the nodes of banks and
are the group of sovereigns, then the density is calculated according to
which provides a number between 0 and 1, with 0 describing a state with no connections among nodes and 1 a fully connected network.
The degree of a node is the number of links that are connected to it. Due to the fact that the nodes in the bank-sovereign network can be clearly divided into two distinctive groups of nodes with links running from one group to the other, the network exhibits an in- and an out-component. The former consists of the banks while the latter is made up by the sovereign governments. Therefore, the relevant measures to consider for this network are the out-degrees of the bank nodes and the in-degrees of the sovereign entities. The out-degree of a node, or gregariousness, is the sum of the links that originate from it. It is calculated according to:
where
is a link originating from bank
. Its sum describes the number of sovereign debt issuers in a typical bank’s portfolio. Conversely, the in-degree of a node, or its popularity, is calculated according to:
where
is a link attaching to sovereign
. Thus,
describes here how many banks are on average holding a particular country’s debt in their portfolio.
The degree distribution of nodes allows assessing the structure of a network, its stability, and the possible presence of a systemically important highly connected group of nodes. As mentioned before, financial networks often exhibit long-tail degree distributions. In context of the bank-sovereign network, with its two distinctive components and directed links, the relevant degree distribution to analyze is that of the banks’ weighted out-degrees. Since not only the links but also their strengths (
i.e., the amount of sovereign debt exposure) matter, the weighted out-degree serves as a more meaningful measure here. The weighted out-degree of bank
is calculated according to:
where
is the weight of the link. Accordingly,
is the sum of the weighted links originating from bank
,
i.e., it is the amount of exposure to all sovereign issuers in its portfolio.
All links taken together allow building the adjacency matrix which is the mathematical expression of the map of the graph
of the measurable network. It incorporates all relevant information on the existing links:
If the links were undirected,
would be a symmetric square matrix since
for all links in the network. For a directed network the adjacency matrix is non-symmetric. In the case at hand, it is a rectangular matrix as long as the number of banks considered is unequal to the number of sovereign issuers. Since the entries for
are either 0 or 1 depending on whether there exists a link between the nodes
and
, this implies that the matrix is unweighted. The row entries can also be normalized values over the total connections of each bank. Alternatively, it is possible to build a weighted matrix
where each entry
gives expression to the weight of the link (also here the entries can be normalized over the sum of weights in each row)
10.
Finally, a relevant measure to take into account in the context of sovereign debt holdings is the home bias. Originating from the literature on equity markets, the home bias is the phenomenon that equity portfolios consist, to an unjustifiably high degree, of domestic assets (French and Poterba [
23], Tesar and Werner [
24], and Obstfeld and Rogoff [
25]). With regard to sovereign debt exposures it describes the fact that the fraction of exposures to the respective domestic governments in banks’ portfolios is unproportionally high.
The approach of this paper to model the connections between European banks and sovereigns is certainly not the only one. Other examples of modeling financial linkages can be found, e.g., in Billio
et al. [
3] who measure correlations between asset returns of financial institutions to examine their connectedness through principal components analysis in combination with pairwise Granger-causality tests. Diebold and Yilmaz [
26] build measures of connectedness from variance decompositions from approximating models and apply these to the US network of financial institutions. Vitali
et al. [
27] examine ownership ties through direct and indirect shareholder control in their analysis of trans-national companies and financial institutions. The approach chosen in this paper is used as it is the most straightforward considering the data at hand.
3.1. The Bank-Sovereign Network
One of the main aims behind the stress tests, capital, and transparency exercises and associated policy measures to increase banks’ capital ratios was to reassure markets about the financial stability of the banking sector and disrupt the perceived link between banks’ financial health and sovereign risk (see, e.g., EBA [
28]). For this purpose, the EBA has conducted regular assessments of major European banks between 2009 and 2014. Detailed individual results thereof have been published on the EBA’s website for seven reporting dates: December 2010, September 2011, December 2011, June 2012, December 2012, June 2013, and December 2013 (for the most recent stress tests published in October 2014). In context of these assessments, detailed data on each bank’s sovereign debt exposures sorted according to maturity has been published.
When banks’ sovereign debt exposures build a network of financial linkages between banks and sovereign issuers, this creates avenues for portfolio contagion. Here, potential weakness and even failure of banks can occur simultaneously due to the common exposure to the same debt issuers. Similarly, the feedback effect within the network from fire-sales of assets by distressed institutions can lead to analogous outcomes (Nier
et al. [
22]). Shocks initiating portfolio contagion can include, for example, the down-grading of a sovereign issuer, the re-assessment of country-specific fundamentals or an increase in investors’ risk averseness. The more foreign banks are exposed to risky sovereign debt, the wider the repercussions are likely to spread. Furthermore, sovereign portfolio losses can weaken a bank’s financial standing and increase its risk-assessment by creditors, thus impacting its costs and availability of funding. The immediate impact depends on whether the sovereign debt is held in the bank’s banking book or trading book. A decrease in the value of sovereign debt held in the trading book, where it is marked to market, immediately affects a bank’s profit and loss statement. The sovereign exposures held to maturity in the banking book are listed at par value and losses only become relevant in the case of impaired debt, e.g., due to debt restructuring or sovereign default. However, should investors become concerned about a bank’s financial stability, the sovereign exposures in its banking book may affect its funding conditions already before. Increased sovereign risk can also reduce the value of banks’ collateral used to raise wholesale funding as well as weaken funding benefits derived from implicit and explicit government guarantees. Evidence suggests that sovereign downgrades also tend to negatively affect domestic bank ratings, which in turn increase these banks’ wholesale funding costs (CGFS [
29]).
Figure 2 shows the bank-sovereign network as of December 2013, including 123 banks and 27 EU countries and Iceland
11. The directed links illustrate how portfolio contagion can flow in its most immediate form from a sovereign issuer to a bank holding the asset. Furthermore, the in- and out-components are clearly distinguished. The network is modeled in a circular way with the links not weighted for visual clarity. The network is relatively dense as the portfolio connections between banks and sovereign issuers build a quite tightly knitted web.
Figure 2.
The Bank-sovereign Network as of December 2013 with Unweighted Links. The graph includes 28 European governments and 123 banks, of which four are not exposed to the here-considered sovereign debt. Visualization created with Visone [
30].
Figure 2.
The Bank-sovereign Network as of December 2013 with Unweighted Links. The graph includes 28 European governments and 123 banks, of which four are not exposed to the here-considered sovereign debt. Visualization created with Visone [
30].
Table 1 lists some characteristics of the bank-sovereign network for the seven reporting dates. For the purpose of comparison, the values reported in the table are based on the data of the 57 banks that were assessed on all seven occasions.
12 One can see that there was a temporary decline in the total volumes of sovereign debt held in the network, which reached its lowest point in December 2011. Thereafter, the volumes held increased again and surpassed end-2010 levels in December 2012. The volumes of sovereign debt in an average bank’s portfolio varied between €27.8 billion and €32.5 billion over the time frame considered. The average home bias was with above 60% quite high and increased until mid-2012. The reason for this increase could be, e.g., due to profit considerations or an effort to bind the sovereign closer to the financial sector. Conversely, it could be due to political pressure on banks to invest into national sovereign debt. Indeed, there is evidence supporting all of these hypotheses (see Acharya and Steffens [
31], De Marco and Macciavelli [
32], and Battistini
et al. [
33]).
Table 1.
Network Characterization.
Table 1.
Network Characterization.
| Characteristic | December 2010 | September 2011 | December 2011 | June 2012 | December 2012 | June 2013 | December 2013 |
|---|
| Total volumes | 1,796,213 | 1,705,174 | 1,583,403 | 1,702,595 | 1,796,855 | 1,855,106 | 1,830,571 |
| Av. Volumes | 31,512.51 | 29,915.33 | 27,779.00 | 29,870.09 | 31,523.77 | 32,545.72 | 32,115.28 |
| Av. RWA | 173,495.00 | 171,324.30 | 167,583.28 | 163,202.56 | 157,288.05 | 152,463.18 | 158,864.54 |
| Av. Home Bias | 63.68% | 63.18% | 66.62% | 67.52% | 67.17% | 66.82% | 65.11% |
| Av. Comm. Equity | 14,626.11 | 15,677.97 | 16,166.21 | 17,291.40 | 17,313.96 | 17,596.23 | 17,244.18 |
| Av. Comm. Equity Ratio | 8.84% | 10.14% | 10.31% | 11.09% | 11.14% | 12.13% | 12.12% |
| Av. Tier 1 | 18,522.25 | 19,282.07 | 19,278.54 | 20,106.75 | 20,130.35 | 20,049.04 | 18,760.91 |
| Av. Tier 1 Ratio | 11.09% | 12.33% | 12.32% | 13.17% | 13.18% | 13.85% | 12.89% |
| Network Density | 0.516 | 0.514 | 0.492 | 0.484 | 0.473 | 0.463 | 0.451 |
| Av. Out-degree | 14.44 | 14.59 | 13.79 | 13.68 | 13.32 | 13.04 | 12.63 |
| Av. In-degree | 29.39 | 29.32 | 28.07 | 27.63 | 27.04 | 26.39 | 25.71 |
Furthermore, the table lists a range of balance sheet characteristics, which were reported as part of the EBA assessments. These show that the increase in the average common equity ratios was not only a matter of higher common equity levels but also of fewer RWA held. Nevertheless, the reduced RWA levels can only be partially attributed to banks’ investment decisions and have to be considered in context of the economic downturn and its effect on this measure. The lower RWA were accompanied by higher exposures to sovereign debt, which are not reflected in the common equity ratios due to their zero risk weighting. The average Tier 1 capital levels are higher than the amounts of common equity capital. This is inter alia due to any received financial government support, which would be taken into account in the Tier 1 calculation. The change in both the common equity and Tier 1 capital ratios between June and December 2013 has to be assessed cautiously as the assets qualifying for these measures changed with the introduction of the Fourth Capital Requirements Directive (CRD IV)
13. There does not seem to be a strong change in the capital ratios between the two dates.
Furthermore, the table confirms that the network is quite dense, even though its density decreased steadily since December 2010. The decline is a result of the fact that even though banks increased their investments into European sovereign debt overall, they held more debt of particular governments while they “cut” their links to others. Thus, they reduced the average number of sovereigns in their portfolio but increased the overall volumes held.
3.2. Detection of the Core Group
The degree distribution of a network gives important insights into its stability and the possible presence of a systemically important highly connected component. Indeed, the histogram of the comparative sample of 57 banks indicates a long-tail distribution of nodes (
Figure 3). This also indicates the possible presence of a highly connected core. However, due to its distinctive in- and out-component, the bank-sovereign network is unlikely to exhibit a highly connected core conforming to Newman’s definition [
16], where all nodes are connected in every possible way to all other nodes. An altered and in this context more applicable definition considers those nodes which distinguish themselves from the rest of the network due to the number and strengths of their links to sovereign issuers. Furthermore, they need to be systemically important such that the disappearance of one of these nodes could provide considerable disruption to the network.
Figure 3.
Histogram of the Weighted Out-Degrees. Nodes with smaller weighted out-degrees, i.e., with smaller portfolios of government debt, make up the larger part of the network in terms of absolute numbers. Distributions are overlapped for the seven recording dates.
Figure 3.
Histogram of the Weighted Out-Degrees. Nodes with smaller weighted out-degrees, i.e., with smaller portfolios of government debt, make up the larger part of the network in terms of absolute numbers. Distributions are overlapped for the seven recording dates.
Figure 4 shows the volumes of European sovereign debt held, sorted by the unweighted out-degrees and aggregated as averages for the seven reporting dates. Thus, the figure allows taking the nodes’ unweighted and weighted out-degrees simultaneously into account. Furthermore, a range of banks’ balance sheet characteristics, sorted and aggregated accordingly, have been added. The aim is to investigate the presence of a core group of highly connected nodes, which also distinguish themselves through other balance sheet characteristics and could, therefore, be systemically important for the stability of the network. Indeed one can detect the presence of a group of banks that qualifies as such a core. Those banks that held the debt of 20 or more sovereign issuers distinguish themselves by holding higher volumes of government debt in their portfolios. They also exhibit higher levels of Tier 1 and common equity levels. Especially the latter two measures increase abruptly at the out-degree of 20.
However, at the same time the common equity ratios tend to decrease with higher unweighted out-degrees, indicating larger amounts of RWA held by these banks. For this reason and in context of the strong increase in investment levels of banks with an unweighted out-degree of 20 and more, this group of banks will be examined in the following part. The analysis will show that these banks are indeed systemically important and exhibit balance sheet characteristics making them potential sources or transmitters of systemic risk.
Before proceeding, it should be pointed out that the threshold number of 20 sovereign issuers in a bank’s portfolio is valid in this context here, but may be different in another situation. For example, the analysis does not take into account banks’ sovereign debt exposures to other European states such as Lichtenstein, Switzerland, or Norway
14, which might have altered the threshold. Furthermore, it is not intended to be universally applicable. As the following part will show, it is a means to distinguish a group of highly connected nodes in order to investigate their characteristics in contrast to the rest of the network as well as their role for systemic stability. It will also show some of the financial interdependencies between governments and particular European banks.
Figure 4.
Average Balance Sheet Characteristics and Sovereign Debt Portfolios of Banks per Connectivity Level. Volumes of (gross direct long) sovereign debt exposures, Tier 1 and common equity levels are stated in millions of euros. The common equity ratio was calculated on RWA.
Figure 4.
Average Balance Sheet Characteristics and Sovereign Debt Portfolios of Banks per Connectivity Level. Volumes of (gross direct long) sovereign debt exposures, Tier 1 and common equity levels are stated in millions of euros. The common equity ratio was calculated on RWA.
4. The Core’s Characteristics and Investment Behavior
Those banks that held the debt of 20 or more different sovereign issuers were largely the same group of 15 banks over the sample period. As described above, the more recent stress tests show that banks have again increased their investments into sovereign debt, but kept the number of sovereigns in their portfolios lower. Indeed, there were some banks which held the debt of 20 or more sovereign issuers during the initial EBA assessments, but then limited their investments to fewer sovereigns.To take account of this development, a bank is here considered to belong to the core group if it was holding the debt of 20 or more different sovereigns for at least four out of the seven reporting dates. This approach allows defining a meaningful core, which provides further insights into the structure and dynamics of the bank-sovereign network.
4.1. The Core’s Characteristics
Table 2 shows the previously addressed network and balance sheet characteristics for the core group
15. As in the whole network more generally, the total and average volumes held by the core banks receded until December 2011 before picking up again. However, volumes reached near-2010 levels only in December 2013,
i.e., a year after the network as a whole. Just like in case of the latter, the core banks’ average amounts of RWA decreased steadily after September 2011 and only recently started to increase again. Interestingly, the average common equity ratios were very similar to those of the whole network. These do not account for the fact that these 15 banks held well over 50% of the total sovereign debt volumes in the network over the sample period. This implies that if the common equity and Tier 1 ratios had been calculated over RWA including sovereign debt exposures, the core banks’ capitalization ratios would have been lower than those of the average bank in the network. Furthermore, there was a sudden and pronounced decrease in the average common equity ratio of the core banks in the most recent stress test, dropping from 12.53% to 10.90% in the six months after June 2013. It is reflected in similar developments in the average Tier 1 ratio. This is partially due to an increase in the RWA but also due to lower equity levels. The change from CRD III to CRD IV, with which the methodology of the two capital measures changed, also needs to be kept in mind here. More importantly, however, when considering only December 2013 alone, the average common equity ratio of the core group of banks is considerably lower than that of the network as a whole. Thus, these banks were in the most recent assessment considerably less capitalized than the average bank of the network. The individual Tier 1 ratios of the core banks furthermore show that the average capitalization ratios of all reporting dates significantly increased due to Hypo Real Estate Holding
16. The latter, which experienced considerable financial difficulties during the financial crisis and received capital injections as well as extensive government guarantees, exhibited exceptionally high Tier 1 ratios not only in December 2013 but even more so at earlier reporting dates. Accordingly, other core banks’ Tier 1 ratios were often below those of the average network value.
Table 2.
Network Core Characterization.
Table 2.
Network Core Characterization.
| Characteristic | December 2010 | September 2011 | December 2011 | June 2012 | December 2012 | June 2013 | December 2013 |
|---|
| Total Volumes | 1,065,334 | 994,076 | 910,577 | 955,399 | 988,946 | 1,015,264 | 1,055,921 |
| Of Total Network | 59.31% | 58.30% | 57.51% | 56.11% | 55.04% | 54.73% | 57.68% |
| Av. Volumes | 71,022.27 | 66,271.73 | 60,705.13 | 63,693.27 | 65,929.73 | 67,684.27 | 70,394.73 |
| Av. RWA | 354,909 | 363,720 | 356,685 | 347,673 | 332,932 | 323,857 | 345,582 |
| Av. Home Bias | 46.08% | 45.93% | 46.97% | 47.29% | 47.48% | 47.29% | 46.70% |
| Av. Comm. Equity | 31,401.33 | 33,528.00 | 34,431.53 | 37,362.87 | 37,394.40 | 37,890.53 | 35,923.13 |
| Av. Comm. Equity Ratio | 9.59% | 10.14% | 10.31% | 11.23% | 11.87% | 12.53% | 10.90% |
| Av. Tier 1 | 39,939.07 | 40,678.00 | 40,193.60 | 42,660.67 | 43,451.80 | 43,347.80 | 39,832.60 |
| Av. Tier 1 Ratio | 12.81% | 12.58% | 12.52% | 13.30% | 14.25% | 14.81% | 12.01% |
| Network Density | 0.831 | 0.829 | 0.807 | 0.824 | 0.798 | 0.786 | 0.783 |
| Av. Out-degree | 23.27 | 23.20 | 22.60 | 23.07 | 22.33 | 22.00 | 21.93 |
| Av. In-degree | 12.46 | 12.43 | 12.11 | 12.36 | 11.96 | 11.78 | 11.75 |
The core had a very high density with an average of 0.808 over the time period examined, which shows how much more connected the core was to European sovereigns. Furthermore, in contrast to the network as a whole, its density temporarily increased in June 2012, which was due to banks’ higher portfolio diversification. Thereafter, the density started to decline again and reached its lowest level of 0.783 in December 2013. Also the in- and out-degrees reached their lowest values at the end of that year. They confirm that also the core banks were of late exposed to the debt of fewer sovereign issuers while the overall volumes of exposures increased. Over the whole time frame, the home bias remained at steady levels around an average of 46.82%. This is lower than the network average, but given the absolute volumes of sovereign debt exposures of these 15 banks, the core group can be considered to be strongly linked to what are some of the biggest EU economies.
Figure 5 shows a visualization of the core as of December 2010. The earlier date was chosen as it shows the holdings of government debt more towards the beginning of the sovereign debt crisis. The weighted links clearly demonstrate the home bias in banks’ portfolios. The figure also displays the financial links to the peripheral states, which are colored in orange to emphasize how shock events were transmitted to banks’ portfolios during the sovereign debt crisis. One should keep in mind that by end-2010 the banks had likely already reduced their investments into the sovereign debt of these countries. Indeed, the stress test data for the following years indicates an effort on part of the core banks to get rid of certain peripheral sovereign debt (further discussed below).
Figure 5.
The highly connected core with weighted links in December 2010. The links amounted to €1065.3 billion, which was almost 60% of the sovereign debt in the assessed bank-sovereign network. Peripheral sovereign debt exposures (Greece, Ireland, Italy, Portugal, and Spain) are marked in orange. Visualization created with Visone [
30].
With the core banks being exposed to almost all EU governments, these banks are highly vulnerable to simultaneous shock events such as a row of downgradings among the issuing countries. Due to the density of the core, a financial stress impulse of this kind immediately affects the core in its entirety. The consequence is portfolio contagion among those banks on which EU sovereigns depend most to buy their debt. Furthermore, given that the core banks exhibit roughly twice as much RWA on their balance sheets than the average bank in the here assessed network, this indicates their importance for European economies as a whole. Consequently, it should not come as a surprise that the majority of these banks were financially supported by their respective governments over recent years, be it through financial injections, bailouts, or government guarantees.
Table 3 lists some of these financial support measures, including certain payments which can be considered to be direct or indirect financial support of US American origin. Thus, a number of banks benefited from AIG compensations, which could only be paid after the insurance company had been bailed out by the American government.
Table 3 supports the idea that these banking institutions were at least to some extent relying on government back-up when undertaking risky investments.
Table 3.
List of Major Financial Support Measures received by Core Banks.
Table 3.
List of Major Financial Support Measures received by Core Banks.
| Name of Core Bank | Country | |
|---|
| Erste Group Bank AG | AU | |
| (Österreichische Volksbanken AG *) | AU | Nationalization of subsidiary Kommunalkredit Austria AG in 2008 €1 billion recapitalization in 2009 (Austrian state received participation capital) €480 million capital injections in 2012 (of which €250 million from Austrian government); 70% write-off of previous recapitalization; €100 million asset guarantees; state ownership of 43.3%
|
| (Dexia N.V. *) | BE | €6.4 billion state aid and €150 billion asset guarantees in 2008 (Belgium, France, Luxembourg), guarantees in 2009 reduced to €100 billion €4 billion in 2011 (Belgium acquires local bank arm) €90 billion state guarantees (Belgium, France, Luxembourg) in 2011 €5.5 billion state aid in 2012 and almost full control takeover by France and Belgium
|
| KBC Group N.V | BE | |
| Commerzbank AG | DE | €8.2 billion (German bail-out program Soffin); debt securities of €15 billion, both in 2008 €10 billion in 2009 (silent participation and ordinary shares; 25% + 1 shares in state ownership) partial repayment in 2011 and 2013; 17% state ownership as of August 2014
|
| Deutsche Bank AG | DE | |
| DZ Bank AG | DE | |
| Hypo Real Estate Holding AG | DE | |
| BNP Paribas | FR | |
| Groupe BPCE | FR | |
| Société Générale | FR | |
| Intesa Sanpaolo S.p.A. | IT | |
| Unicredit S.p.A. | IT | |
| ING Bank N.V. | NE | |
| Barclays plc | UK | |
| HSBC Holdings plc | UK | |
| Royal Bank of Scotland Group plc | UK | £15 billion for 58% state ownership in 2008 £25.5 billion and state ownership of 70% in 2009 (down to 62% by end 2014) £163.84 billion emergency loans (British and US), repaid in 2012 $0.7 billion AIG compensation
|
The list also puts the Tier 1 equity ratios in
Table 2 into perspective. The financial support measures these banks received allowed them to increase these capital ratios. They were also included in the Core Tier 1 measure, which was used as the point of reference in the risk scenarios of the EBA capital exercises and stress tests (before 2014) to decide about their financial stability
17. This undermined the idea behind these assessments. Additionally, while impairments of sovereign exposures in the form of haircuts have been considered in past assessments, only banks’ trading books were taken into account
18. However, it has been found that over 80% of both the general exposures to sovereign debt and to the respective national governments is held in banking books (Blundell-Wignall and Slovik [
37], CGFS [
29]).
4.2. The Core’s Investment Behavior
Table 4 shows the aggregated sovereign debt portfolios of the core banks over time. As touched upon before, the portfolios show a decrease in peripheral debt. The considerable reduction of Greek, Portuguese, Spanish, and Italian sovereign debt gives reason to suspect fire-sales on part of the core banks despite many of them being in financially strained positions. With regard to Italy the trend seems to have reversed in December 2012. Furthermore, with regard to the reduction of Greek debt the haircut in 2012 has to be taken into account.
The Table also shows a significant increase in investments into Austrian and German sovereign debt, as well as to a lesser extent into East European countries such as the Czech Republic, Hungary, Poland, Romania, and Slovakia. Even Icelandic sovereign debt can again be found in the core banks’ portfolios at the end of 2013, surpassing the amount of Greek debt. The considerable reduction in French sovereign debt holdings until June 2013 could indicate a temporary loss in trust in the financial situation of the Republic, which was downgraded in January 2012 and again in November 2013. A similar dynamic does not seem to apply to Austria and Belgium, which were downgraded at the beginning of 2012 and the end of 2011, respectively.
As this part of the paper has shown, the structure of the bank-sovereign network with its core group of nodes makes the system susceptible to financial shocks and the spreading of portfolio contagion. The core banks are not only potential risk spreaders but also a compelling source of systemic risk themselves. Over the last years their inadequate capital buffers immediately affected the financial positions of their domestic governments which had to back them up. Since the volumes held by the core group of banks amount to over half of the sovereign debt in the assessed network, this implies a strong collective dependency by European governments on these banks. At the same time, these banks’ balance sheets remain unprepared to deal with a double-strain on their portfolios of RWA and sovereign exposures. While there has been a reduction in the density of the network and of the core in combination with reduced exposures to the peripheral countries, this cannot necessarily be interpreted as a reduction of systemic risk in the bank-sovereign network. Systemic risk arises due to the interplay of a range of different factors and while less connectivity can be considered to reduce systemic risk, lower capitalization levels still make the key nodes in the network prone to become the source or transmitter of the same. Furthermore, the reduced density can also be seen as the result on an outbreak of systemic risk during the financial and sovereign debt crises, which led to efforts by banks to reduce their holdings of risky sovereign debt. While some banks have interrupted their financial links and exposures to particular sovereign issuers, there is no reason to expect that this implies a permanently lower degree of connectivity in the network. Even if this was the case, when considering, e.g., an instance of portfolio contagion due to the downgrading of an issuing country, the reduced network density would only mean reduced proneness to systemic risk if the debt of one of those issuers was concerned to which banks have already reduced their exposures. In fact, other potential channels of portfolio contagion could turn out to be wider than a few years before due to changes in the investment behavior of the core banks.
Table 4.
Aggregated Sovereign Debt Portfolios of Core Banks without Home Bias (values in millions of euros).
Table 4.
Aggregated Sovereign Debt Portfolios of Core Banks without Home Bias (values in millions of euros).
| Issuer | December 2010 | September 2011 | December 2011 | June 2012 | December 2012 | June 2013 | December 2013 |
|---|
| Austria | 19,447 | 19,047 | 22,649 | 26,034 | 30,267 | 31,530 | 32,741 |
| Belgium | 51,183 | 55,857 | 50,596 | 58,195 | 54,080 | 54,812 | 52,543 |
| Czech Republic | 23,639 | 24,765 | 24,606 | 27,351 | 28,491 | 27,768 | 26,182 |
| Denmark | 2,309 | 3,801 | 2,628 | 5,776 | 2,902 | 2,053 | 1,450 |
| Finland | 4,257 | 6,615 | 5,380 | 6,034 | 8,359 | 7,223 | 7,375 |
| France | 67,841 | 69,329 | 55,570 | 59,135 | 50,042 | 49,982 | 73,293 |
| Germany | 115,569 | 111,482 | 110,563 | 108,274 | 128,166 | 129,171 | 120,979 |
| Greece | 20,518 | 15,539 | 15,304 | 1,197 | 224 | 109 | 213 |
| Hungary | 10,496 | 13,709 | 10,027 | 11,745 | 11,118 | 11,852 | 11,363 |
| Iceland | 175 | 146 | 80 | 41 | 0 | 20 | 337 |
| Ireland | 4,453 | 3,561 | 2,898 | 2,406 | 3,370 | 3,693 | 7,568 |
| Italy | 111,678 | 85,111 | 72,547 | 70,796 | 73,254 | 79,588 | 77,918 |
| Netherlands | 29,095 | 34,081 | 23,532 | 29,897 | 29,109 | 30,665 | 31,058 |
| Poland | 30,654 | 25,939 | 24,978 | 26,217 | 26,922 | 28,535 | 28,341 |
| Portugal | 10,069 | 7,907 | 6,788 | 5,366 | 4,982 | 5,114 | 3,929 |
| Romania | 11,311 | 7,608 | 7,366 | 7,339 | 9,350 | 9,250 | 11,774 |
| Slovakia | 11,406 | 10,620 | 10,262 | 11,774 | 12,402 | 13,265 | 12,458 |
| Spain | 43,554 | 34,694 | 28,222 | 24,951 | 24,083 | 22,514 | 25,445 |
| Sweden | 4,372 | 3,191 | 1,837 | 2,250 | 1,932 | 2,790 | 2,654 |
| UK | 15,211 | 11,173 | 12,305 | 13,070 | 12,417 | 13,480 | 15,234 |
| Other * | 7,893 | 5,878 | 6,302 | 6,877 | 6,299 | 6,160 | 8,760 |
4.3. Regulatory Changes and Considerations
In 2014 the EU adopted the Bank Recovery and Resolution Directive (BRRD), which was part of a series of new regulations to weaken the perceived link between banks and sovereigns and reduce the negative feedback loop experienced during the financial and sovereign debt crisis. The directive was created as part of the Single Resolution Mechanism (SRM), which will lead to a convergence of supervisory rules and standards and a more integrated approach to the direct supervision of relevant banks. The BRRD is to provide the member states with a set of tools to aid banks in financial difficulties without resorting to bail-outs at the tax-payers’ expense. These tools include the usage of prepared recovery plans by banks, the early intervention by supervisory entities, and the so-called bail-in tool. In a resolution case the latter allows to write down a bank’s debt to its shareholders and creditors or to convert it into equity. Only after at least 8% of a bank’s total liabilities, including own funds, have been bailed in, the bank can access a resolution fund, which will be financed via levies on the banking sector. It can be accessed up to a maximum amount of 5% of total liabilities including own funds. It is expected to become a single European Fund in the course of eight years. Bail-outs and recapitalization with public funds will only be possible at the end of this process. Even though it was by EU standards a comparatively rushed initiative, the overall expectation is that the BRRD and more generally the Single Supervisory Mechanism (SSM) and the SRM are important steps not only towards a banking union but also towards stabilizing the European banking sector, improving supervision, and breaking the vicious circle between the two sectors (Abascal
et al. [
38]
19, Constâncio [
39]). While the eventual effectiveness of the new regulations can only be seen over time and when faced with a situation of substantial economic and financial stress in the banking sector, the framework gives reason to believe that the nexus between banks and sovereigns will be eased. The framework is much more forward looking and preventative than the previous reactive approach and bail-outs. Research indicates that it promises to entail considerable advantages. Thus, using an agent-based model, Klimek
et al. [
40] find that neither under favorable nor unfavorable economic conditions publicly funded bail-outs can outperform a bail-in with private sector involvement. Furthermore, the associated effects of further financial integration have historically also played a positive role for economic growth (Maudos and Fernández de Guevara [
41]). With regard to the extensive bail-outs and government support measures which the core group of banks received over recent years, these new regulations are certainly a welcome development regardless of its potential shortcomings
20. Other related regulations will also allow supervisors to require banks to hold higher capital levels when they deem it relevant. A prudent and long-term approach would take the high sovereign debt exposures of the core banks into account when calculating banks’ risk weighted assets and establishing these capital requirements. This would strengthen the preventative nature of the framework. It would also be in the interest of major shareholders and creditors, who in the future will be the first required to suffer potential write-downs and equity conversions. Indeed, this potential transmission channel of systemic risk to the real economy should be taken just as seriously.
Developments such as the Basel Committee’s higher absorbency requirement for global systemically important banks, which was established in 2011 and implemented through CRD IV, is likely to be a step in the right direction in this regard. It requires particular banks to keep higher levels of capital for loss absorbency and is to be phased in from January 2016. The assessment is based not only on a bank’s size but also their interconnectedness measured through intrafinancial system assets and liabilities as well as securities outstanding
21. However, the measure is again based only on exposures to conventional RWA. Taking the sovereign exposures in banks’ portfolios into account would certainly assure a more thorough approach to accounting for all assumed risks.
5. A Network Approach to Assessing Sovereign CDS Spreads
A broad stream of the academic literature has tried to identify the determinants of the sharply diversified EU CDS spreads over recent years. Especially the Eurozone countries have gained attention here. What effectively had been an underestimation of Eurozone public debt quickly became the opposite, especially for the peripheral European states. However, countries that continued to be relatively “safe bets”, such as Germany, France, and the Netherlands, seem to continue to experience spreads not fully reflecting their country fundamentals (Beirne and Fratzscher [
47]). The common risk factor,
i.e., investors’ risk appetite, still plays a role in determining European debt pricing (Sgherri and Zoli [
48], Longstaff
et al. [
49]). However, a range of other country-specific factors have been found to affect EU and Eurozone debt spreads. Rapidly rising debt-to-GDP ratios have given considerable reason for concern as countries’ abilities to repay their debt were questioned. Investors did not seem to share these concerns with regard to stand-alone countries with similar high debt-to-GDP ratios, such as the UK (De Grauwe and Ji [
50]). Other country-specific fundamentals have been found to be influential, such as real GDP growth and a positive fiscal balance (Beirne and Fratscher [
47]) as well as forecasted GDP growth and fiscal projections (Heinz and Sun [
51]). Dieckman and Plank [
52] find that the volatility of a country’s terms of trade and the volatility of the domestic stock market lead to an increase in debt spreads. Liquidity within the bond market (Sgherri and Zoli [
48]) as well as exchange rates and currency reserves (Longstaff
et al. [
49]) are additional factors, which have been found to be explanatory.
The causality between financial sector developments and sovereign credit risk can potentially run both ways. Evidence suggests that financial sector health impacts sovereign credit spreads but that the reverse channel is also important. Through the latter the financial standing of the sovereign can have an impact on the situation of domestic financial institutions (Demirgüç-Kunt and Huisinga [
53]). Evidence suggests that sovereign downgrades also tend to negatively affect domestic bank ratings, in turn increasing the latter’s wholesale funding costs. Furthermore, in addition to the spillovers from a country to foreign banks through the direct exposures of their portfolios, indirect contagion through the sovereign debt markets and as a result of cross-border interbank exposures is also possible (CGFS [
29]). Manzo and Picca [
54] find that sovereign systemic shocks have a larger and more persistent impact on the probability of a collective banking default than
vice versa. Angeloni and Wolff [
55] document high correlations in banking and sovereign risk in the Eurozone. Furthermore, while Greek, Italian and Irish debt in banks’ portfolios affected the market value of banks in the second half of 2011, the location of banks mattered for their market valuation as well, underlining the governmental role in upholding the viability of the economic and financial systems. Although the causal relationships between sovereigns and banks and their financial and non-financial linkages can act separately, they can develop into a feedback loop through which problems in one of the sectors amplify the links and negative effects and result in a “twin” crisis with serious repercussions for the aggregate economy (Correa and Sapriza [
56]).
Reinhart and Rogoff [
57,
58] find from the historical sequence of events that banking crises tend to accompany but in most cases precede sovereign debt crises. Investigating a sample of 70 countries over 200 years, the authors find that irrespective of the sample period or estimation strategy, systemic banking crises in global financial centers (such as the US and UK) can help to explain domestic banking crises. These in turn allow explaining a number of historical cases of sovereign default. Agliardi
et al. [
59] find through their approach based on consistent tests for stochastic dominance efficiency that higher sovereign risk among emerging markets can be mainly attributed to financial factors. Hence, reducing sovereign risk would necessitate improved domestic financial institutions. With regard to the European Union, the presence of a channel of private-to-public risk transfer has been documented as market participants take into account possible financial sector bailouts and associated financial pressure on public balance sheets. Furthermore, CDS spreads of the Economic and Monetary Union (EMU) show higher sensitivities to financial sector health (Dieckman and Planck [
52]). Indeed, Sgherri and Zoli [
48] show that the CDS spreads of Eurozone countries were considerably affected by the expected default probabilities of domestic financial institutions during the height of the economic and financial crisis. Ang and Longstaff [
60] find that in Eurozone countries systemic sovereign risk seems to be strongly related to financial market variables, such as stock returns, rather than to common macroeconomic fundamentals. Furthermore, both systemic and country-specific risk in these countries seems to be to a considerable degree determined by corporate credit conditions, reflecting another indirect channel through which financial sector dynamics could affect sovereign debt pricing.
5.1. A Network Approach to Assessing CDS Spreads
A consequence of the dynamics of the bank-sovereign network with its long-tail distribution and core group of banks is the possibility of counterparty risk affecting sovereign debt pricing. To assess the role of this kind of counterparty risk over recent years, the following regression analysis of sovereign CDS spreads builds on the work of Signori and Gençay [
7]. The two authors have established a way to integrate the network approach into a linear regression analysis in order to assess counterparty risk in US supplier-customer relationships of public companies and its effect on corporate credit spreads. Counterparty risk is the potential that the other party to an agreement will fail to meet its financial obligations according to the agreed conditions. When the counterparty may have to defer or default on a payment, the risk of default depends on the size of the financial connection, e.g., a contract to trade and the credit standing of the other contracting party. Moreover, strong economic ties expose a company also to the uncertainties of the other company’s business and market. The authors investigate the effect of leverage, implied volatility and jump risk as proxies for counterparty risk over a five-year period. They find that, in line with Merton’s work [
61], according to which higher leverage leads to increases in corporate debt pricing, a company’s main customers’ leverage and jump risk are among those factors which lead to an increase in its credit spreads.
Signori and Gençay [
7] use the adjacency matrix, which is a linear operator on vectors of node characteristics, as a
Network Lag Operator (NLO) to include these characteristics into a linear regression analysis. If
is a
-dimensional vector of nodes’ characteristics, where
is associated to node
, then
can be multiplied by the
×
matrix
. Signori and Gençay [
7] use a
Network Autoregressive Moving Average (NARMA) process of order
. They define it as a stochastic process
on a network (and therefore indexed by the nodes of the latter) that follows the data generating process
where
is a
×
dimensional vector of node characteristics to be included,
is the adjacency matrix and
is an
×
vector of disturbance terms. Moreover,
can also be a matrix of exogenous characteristics of dimension
×
in which case
is a 1 ×
vector of real parameters.
The adjacency matrix can here be used in different ways to serve as the NLO. Thus, it can be taken to be an (unweighted) adjacency matrix or a stochastic weighted adjacency matrix (where the sum of the non-negative real numbers of each row equals one).
22 The third usage and the one relevant to the following regression is where
is a row normalized adjacency matrix. Thus,
for an undirected network with a symmetric
where
means that node
is such that node
is connected to it and
is the number of neighbor nodes
to which
connects.
Signori and Gençay [
7] use the weighted averages of the relevant counterparty variables, updated in regular intervals, to construct their NLO. As the data of the EBA assessments is only available for the last seven reporting dates, regularly updating the NLO here means to shorten the analysis to a very limited time frame which would not cover the critical early crisis years. For this reason, a slightly different approach is chosen. The adjacency matrix is used to detect the six main counterparty banks of each sovereign for the time frame of December 2010 until December 2013. It is a matrix whose entries are averages of the seven reporting dates and normalized over each row. The main counterparty banks are then chosen in descending order according to their own average asset size over the time frame. The focus on the six main counterparties in terms of their asset sizes instead of the amount of their sovereign debt exposures is chosen because if counterparty risk affects sovereign debt pricing, then it should have a greater effect the bigger the size of the bank. These banks are considered to be the main counterparties over the extended period of the following regression analyses. With regard to the countries included into the regression, the six biggest counterparty banks (in descending order by asset size) are: HSBC Holdings plc, Deutsche Bank AG, BNP Paribas S.A., Crédit Agricole, Barclays plc, and the Royal Bank of Scotland Group plc. Since the bank-sovereign network is a directed network with links running between the components only in one direction, the NLO has to be the transpose of the normalized adjacency matrix of relevant banks in order to include their balance sheet characteristics into the regression of sovereign CDS spreads.
The following is a regression analysis of the five-year CDS spreads of 14 EU countries over the period from April 2008 until January 2014. The specification is given by:
where
are the monthly observations of the five-year CDS spreads
23 of country
at time
and
is its lagged value. The coefficient
is a constant,
i.e., the premium. The counterparty banks’ balance sheet characteristics included into the regression are the Tier 1 ratio as a proxy for banks’ leverage and, furthermore, their implied volatility. A bank’s implied volatility is here the average of the continuous call and put implied volatility of an option with 60 days to expiry. Both the Tier 1 ratios and the implied volatilities of the six banks were aggregated to equally weighted averages. Furthermore, a range of variables was added to hold constant for country-specific fundamentals and market characteristics.
is a vector of country characteristics, which includes the debt-to-GDP ratio and the slope of the yield curve. For the debt-to-GDP ratio a slope dummy is included to take account of the beginning of the sovereign debt crisis at the end of 2009. Based on the IMF Global Financial Stability Report [
62], November 2009 is used as the starting date of this period. The yield curve is often considered to reflect market participants’ economic outlook and their expectations about the general business climate. Therefore, it is considered to be a good predictor of future economic activity as well as of impeding economic downturn. It is calculated as the difference between the 10-year and six-month CDS contracts of the respective sovereign issuer. Furthermore,
is a vector of market variables. It includes the Vstoxx as a measure of market expectations of near to long-term volatility, which serves here as a proxy for the global risk factor. Moreover, the Itraxx reflects credit conditions of European firms. Due to the strong home bias in the bank-sovereign network, two variables describing the domestic banking sectors were added in the vector
. The first is the size of the respective domestic financial sector in terms of total assets and liabilities with respect to GDP. When testing the effect of the domestic financial sector size, the variable is lagged to test the direction of causality. Furthermore, as a proxy for liquidity in the financial sector, total loans among monetary and financial institutions (excluding central banks) are included. Finally,
is an error term.
5.2. Data Sources
The six-month, five-year and 10-year CDS spreads, as well as the Itraxx series and banks’ implied volatilities were obtained from Datastream. Historical data of the Vstoxx index was taken from the Stoxx website. Aggregated data on the EU’s national financial sectors is available on the ECB’s Statistical Data Warehouse, while the debt-to-GDP values are from Eurostat. The Tier 1 ratios of the counterparty banks were taken from their interim and annual reports. Since the data is only available on a quarterly basis, the values have been linearly interpolated. The implied volatilities are available on Datastream interpolated between the nearest strike and at-the-money strike. For this, values from the nearest expiry months are used. Descriptive statistics of the dependent and independent variables can be found in the Appendix (
Table A3 and
Table A4, respectively).
5.3. Regression Results
Table 5 shows the results of a pooled random-effects model
24 for the sample of 14 EU governments during the period from April 2008 until January 2014. Two further regressions were conducted for a shorter period from April 2008 until February 2012. This allowed including Greek CDS spreads, which stopped being quoted in early 2012, into a third analysis. The coefficients of the counterparty banks’ variables imply that counterparty risk played a role in sovereign debt pricing during the recent crisis years. The counterparty banks’ implied volatility, which is especially important during turbulent periods, had a highly significant and increasing effect on sovereign debt pricing. Indeed, of the four financial sector variables, it is the variable that is most often significant across the countries’ individual regression results
25. When looking at the pooled regression including Greece, the coefficient is much higher, indicating the influential role of counterparty risk in Greek sovereign debt pricing.
The counterparty banks’ leverage ratio on the other hand is not statistically significant. This might be due to the fact that considerable political pressure was exerted to increase the common equity capital ratios of banks over the last years
26 in combination with efforts to bolster their balance sheets. Market participants, being aware of this, seemed to disregard this variable when assessing sovereign risk but still consider counterparty risk to be an issue. Also the domestic financial sector variables played a considerable role in sovereign debt pricing. The financial sectors considered here either remained of relatively the same size with respect to the overall economies or shrunk during the periods in questions. Markets seemed to consider this a welcome development, implying some distrust towards these sectors.
Also liquidity concerns appear to have been an issue, with the variables exhibiting relatively big coefficients. Interestingly, neither of the domestic financial sector variables is statistically significant in the third regression, again underlining how the extreme case of Greece changes the picture.
Table 5.
Pooled Regression Results.
Table 5.
Pooled Regression Results.
| | Long Period (April 2008–January 2014) | Short Period (April 2008–February 2012) | Short Periodwith Greece |
|---|
| | Coefficient | t-stat | Coefficient | t-stat | Coefficient | t-stat |
|---|
| S(−1) | 0.874 *** (0.011) | 81.669 | 0.880 *** (0.016) | 56.709 | 0.057 ** (0.023) | 2.487 |
| Debt to GDP | 0.417 *** (0.072) | 5.775 | 0.335 *** (0.081) | 4.120 | 3.448 *** (0.375) | 9.188 |
| Slope Yield Curve | −0.273 *** (0.020) | −13.355 | −0.323 *** (0.039) | −8.222 | −0.463 *** (0.006) | −79.478 |
| Itraxx | 0.546 *** (0.115) | 4.743 | 0.511 *** (0.139) | 3.680 | −0.505 (0.736) | −0.686 |
| Vstoxx | 0.216 *** (0.074) | 2.901 | 0.151 * (0.091) | 1.651 | 0.195 (0.492) | 0.395 |
| Counterparty Leverage (−1) | 0.990 (1.338) | 0.740 | 1.805 (1.671) | 1.080 | −9.245 (8.457) | −1.093 |
| Counterparty Volatility | 0.526 *** (0.087) | 6.054 | 0.492 *** (0.091) | 5.429 | 2.876 *** (0.456) | 6.310 |
| Domestic Banks Size (−1) | 0.920 * (0.512) | 1.796 | 1.448 * (0.862) | 1.680 | 1.761 (3.331) | 0.529 |
| Domestic Banks Liquidity | −1.597 *** (0.610) | −2.617 | −1.739 * (0.894) | −1.945 | −5.818 (3.735) | −1.558 |
| C | −14.994 (19.149) | −0.783 | −23.816 (25.752) | −0.925 | 25.148 (118.951) | 0.211 |
| Adj.
R2 | 0.934 | | 0.942 | | 0.962 | |
| N | 955 | | 635 | | 682 | |
| Hausman | 0.367 | | 0.619 | | 0.149 | |
The coefficient of the yield curve slope shows that the negative economic outlook had an increasing impact on CDS spreads and more so during the earlier period. Furthermore, the global risk factor and especially companies’ credit conditions considerably affected sovereign debt pricing for the considered countries. As was to be expected the debt-to-GDP ratio had an increasing and significant effect on the spreads, but even more so in the third regression. The high adjusted R2 of each regression shows that the independent variables explain a considerable part of the sovereign debt pricing of the countries.
Table 6 shows simple linear regressions for two subgroups of the sample. Since most of the counterparty banks considered here belong to the afore-described core group in the bank-sovereign network, the first regression analyses the CDS spreads of the home countries of the core banks. For comparison, the second regression looks at the peripheral EU countries.
Table 6.
Pooled Regression Results of Subgroups (long period).
Table 6.
Pooled Regression Results of Subgroups (long period).
| | Home Countries of Counterparty Banks | | Peripheral Countries | |
|---|
| | Coefficient | t-stat | Coefficient | t-stat |
|---|
| S(−1) | 0.935 *** (0.032) | 29.664 | 0.839 *** (0.043) | 19.473 |
| Debt to GDP | 0.223 *** (0.076) | 2.942 | 0.417 *** (0.121) | 3.446 |
| Slope Yield Curve | −0.065 (0.049) | −1.322 | −0.348 *** (0.065) | −5.320 |
| Itraxx | 0.637 *** (0.153) | 4.158 | 0.604 (0.478) | 1.262 |
| Vstoxx | 0.105 (0.129) | 0.818 | 0.643 * (0.332) | 1.936 |
| Counterparty Leverage (−1) | −1.123 (1.657) | −0.678 | 5.453 (4.329) | 1.260 |
| Counterparty Volatility | 0.355 *** (0.108) | 3.282 | 0.463 * (0.248) | 1.867 |
| Domestic Banks Size (−1) | −0.596 *** (0.206) | −2.896 | 0.261 (0.323) | 0.806 |
| Domestic Banks Liquidity | −0.169 (0.112) | −1.505 | −3.938 *** (1.268) | −3.107 |
| C | 4.640 (20.212) | 0.230 | −3.791 (56.957) | −0.067 |
| Adj. R2 | 0.950 | | 0.949 | |
| N | 472 | | 272 | |
As before, the counterparty banks’ volatility is statistically significant while the leverage ratio is not. The coefficient of the former is higher for the peripheral countries despite none of the considered counterparty banks being from these countries. This indicates more clearly how counterparty risk affects European sovereigns across borders. Furthermore, the CDS spreads of the home countries of the core banks were considerably affected by the size of their domestic financial sectors, which indicates the importance of the sectors for the overall economies. The peripheral countries’ spreads on the other hand were substantially affected by the liquidity in their domestic financial sectors.
6. Conclusions
The European bank-sovereign network, like many financial networks, features what can be identified as a highly connected core. Its analysis allows identifying a group of 15 banks, which hold the debt of a higher number of different sovereigns and in much bigger volumes than the rest of the network. These banks also distinguish themselves due to certain balance sheet characteristics. Even though they hold a very large fraction of European sovereign debt in their portfolios, their capital buffers were between end-2010 and end-2013 only average or even below average with regard to the rest of the network. Given their high financial connectedness to European sovereigns, these banks were both potential sources and transmitters of systemic risk. This is due first and foremost to the danger of portfolio contagion affecting their investments, their status as major sovereign debt investors, and their role for the real economy more generally. Since the core banks undertake most of the sovereign debt investments in the assessed network, the possible vanishing of one of these nodes poses a considerable threat to the stability of the system and creates financial dependency on part of the sovereign issuers. Indeed, many of these banks had to be financially supported in recent years. The evidence suggests that the resilience of the bank-sovereign network is compromised. Portfolio contagion due to EU sovereign debt exposures, depending on its extent, is unlikely to be easily absorbed when these assumed risks are unaccounted for in the core banks’ capital buffers and when these banks are simultaneously faced with general economic distress. The fact that sovereign debt exposures are not taken into account when calculating the RWA on their balance sheets led to an overstatement of their capital ratios. It implied a double strain on their capital reserves during the economic and sovereign debt crises and contributed to the Basel II capital requirements turning out to be inadequate.
Recent regulatory developments such as the BRRD and the Basel Committee’s higher absorbency requirements give reason to believe that the negative feedback loop between EU banks and sovereigns will be eased. These are welcome developments but it remains a drawback that the sovereign debt exposures continue to be disregarded in the calculation of the RWA of systemically important entities such as the here defined core banks. It remains in the interest of these banks’ major investors and the overall economy more generally that all assumed risks in banks’ portfolios are taken into account. Furthermore, considering the small margins with which some banks have passed or failed the EBA’s stress tests in the past, the inclusion of sovereign debt exposures in the calculation of the relevant capital ratios, such as the CET1 ratio, remains crucial.
Furthermore, the regression analysis in this paper underlines the interconnection between the core banks and sovereign debt issuers. It shows the role of counterparty risk in sovereign debt pricing over recent years, which indicates another transmission channel through which systemic risk can spread from the biggest invested banks to sovereign debt issuers. Markets seemed to be aware of the presence of this counterparty risk and priced sovereign debt accordingly. The leverage ratio turned out to be a non-statistically significant variable, which does not mean that the capitalization of the main sovereign debt invested banks is not relevant but rather indicates that short-term policy measures such as capital injections, which increased the Tier 1 ratios, were not enough. The implied volatility variable showed that counterparty risk is an important factor to be taken into account when addressing the causes of increased sovereign debt pricing.
Policy making often focuses on the resilience and stability of the financial sector as a whole. The network approach underlines that it is worth addressing the financial health of specific systemically important banks separately.


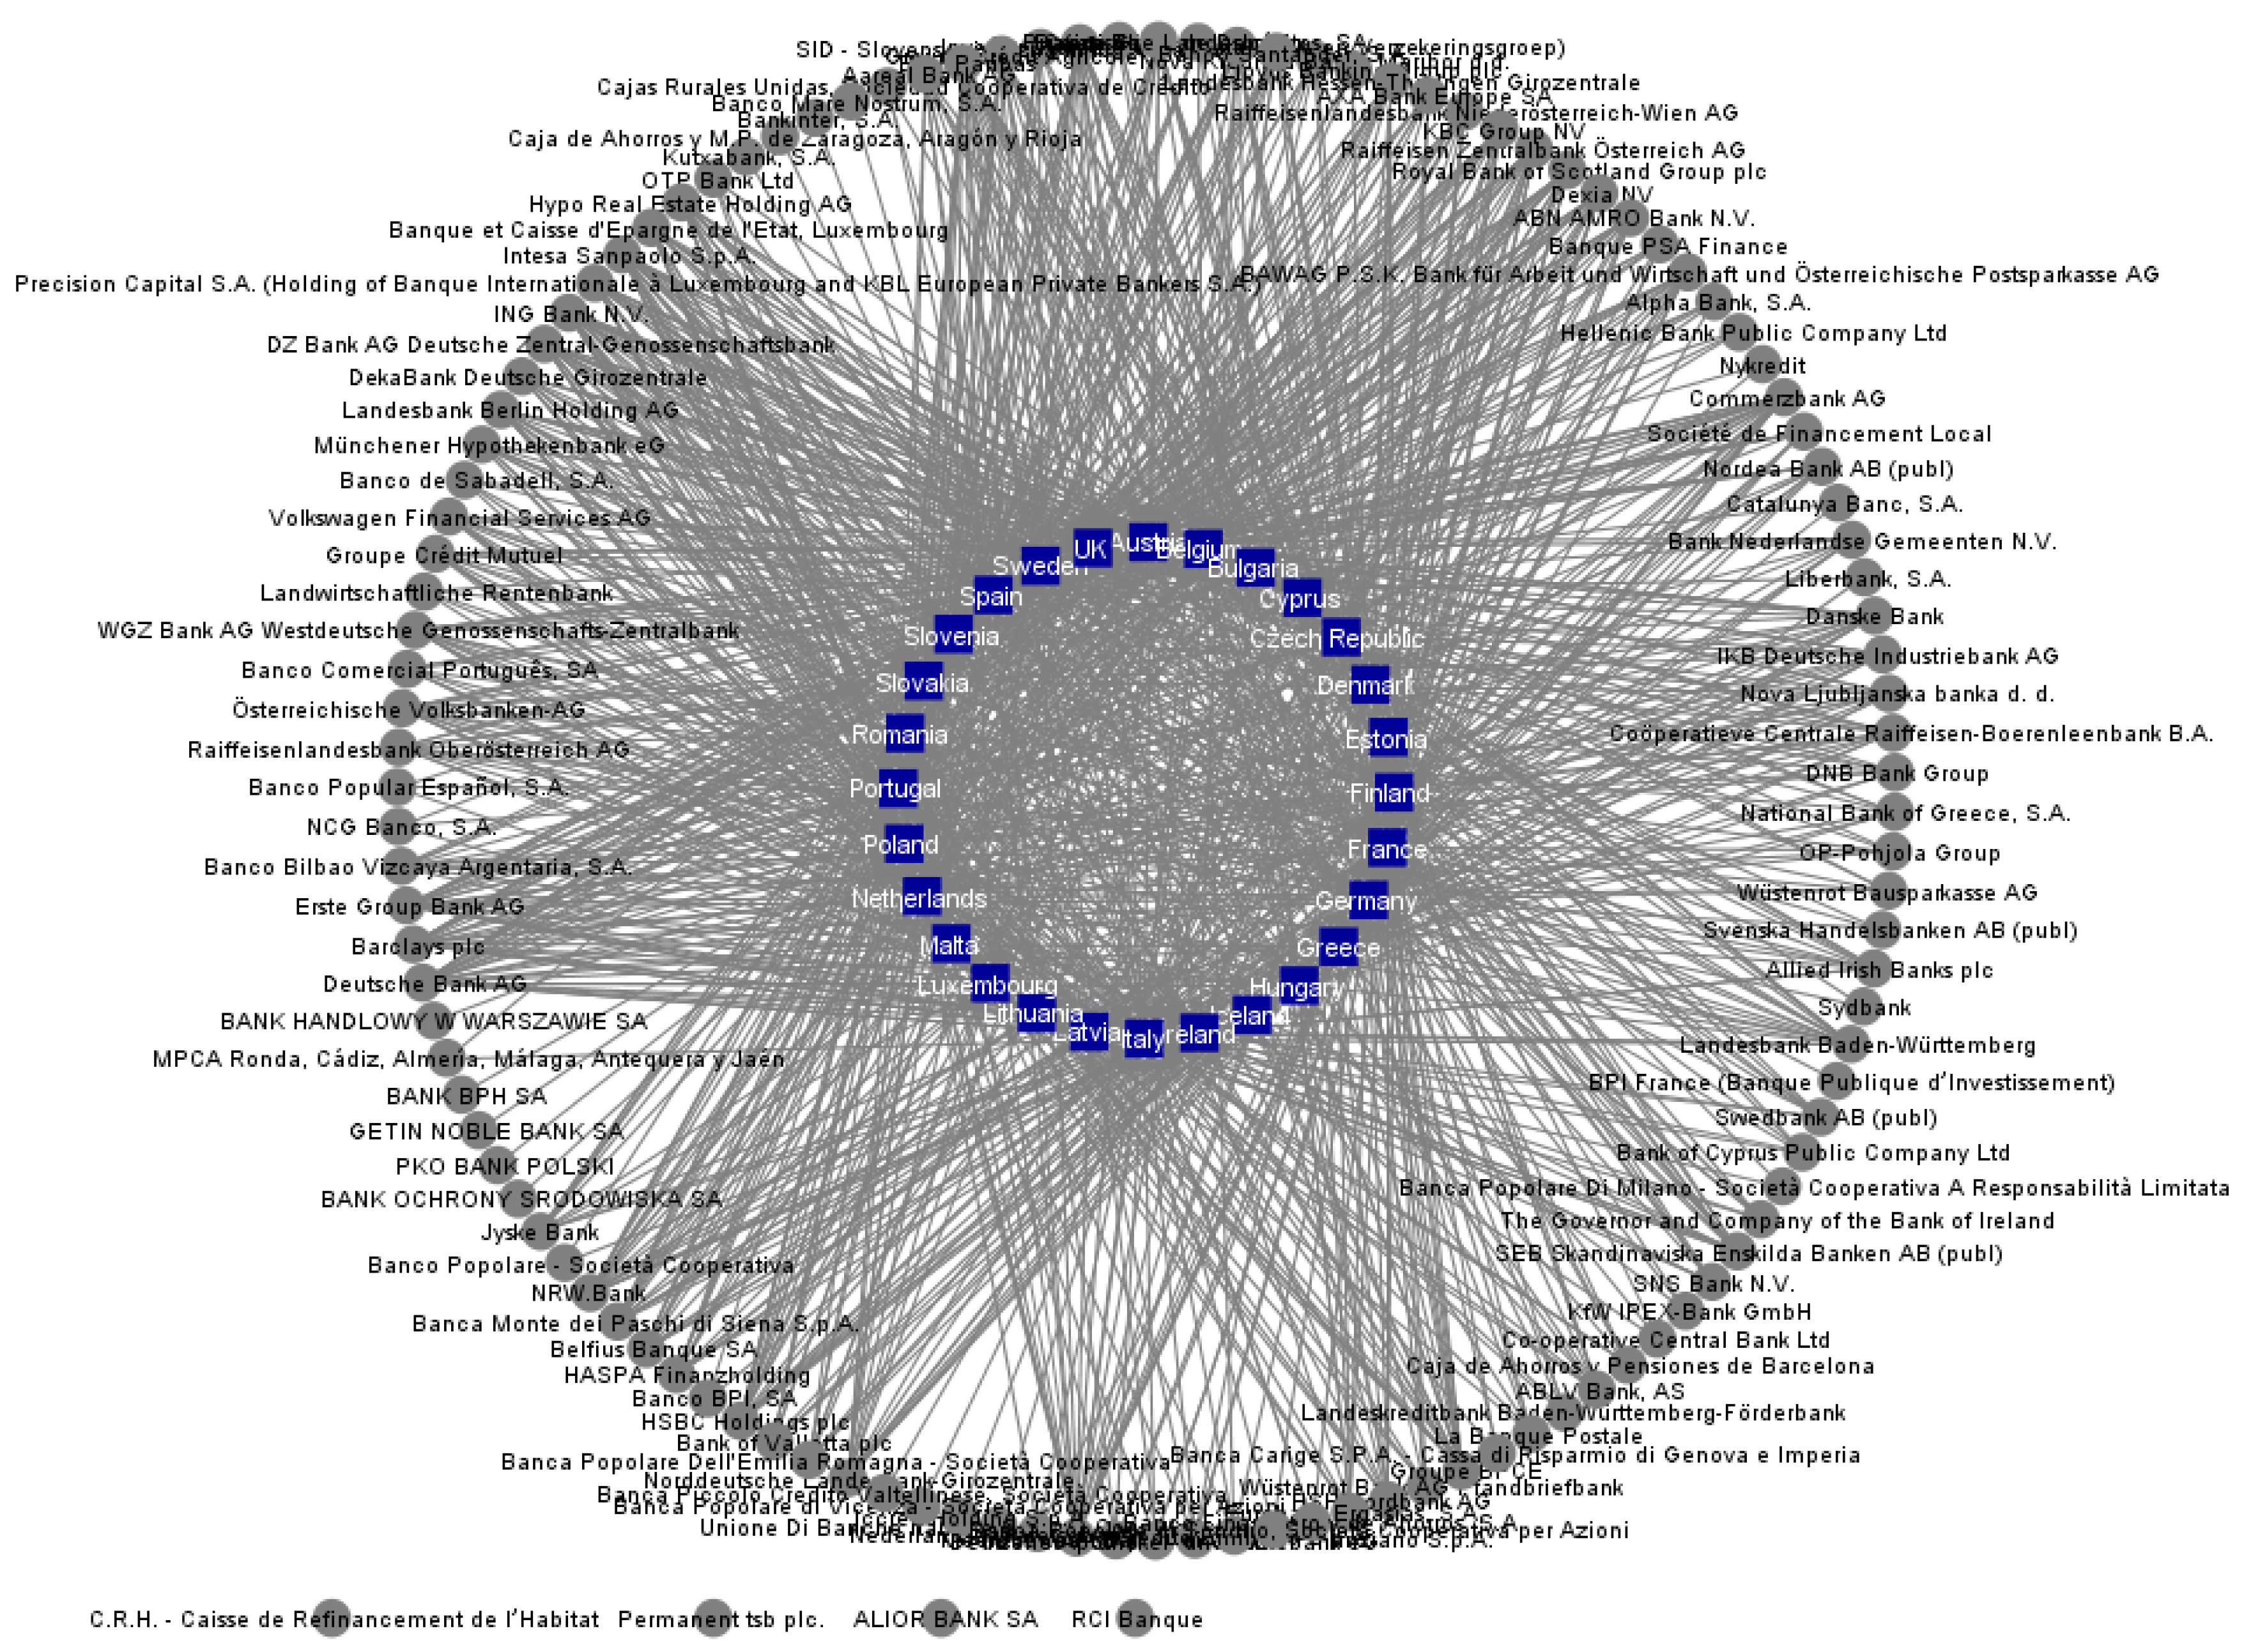

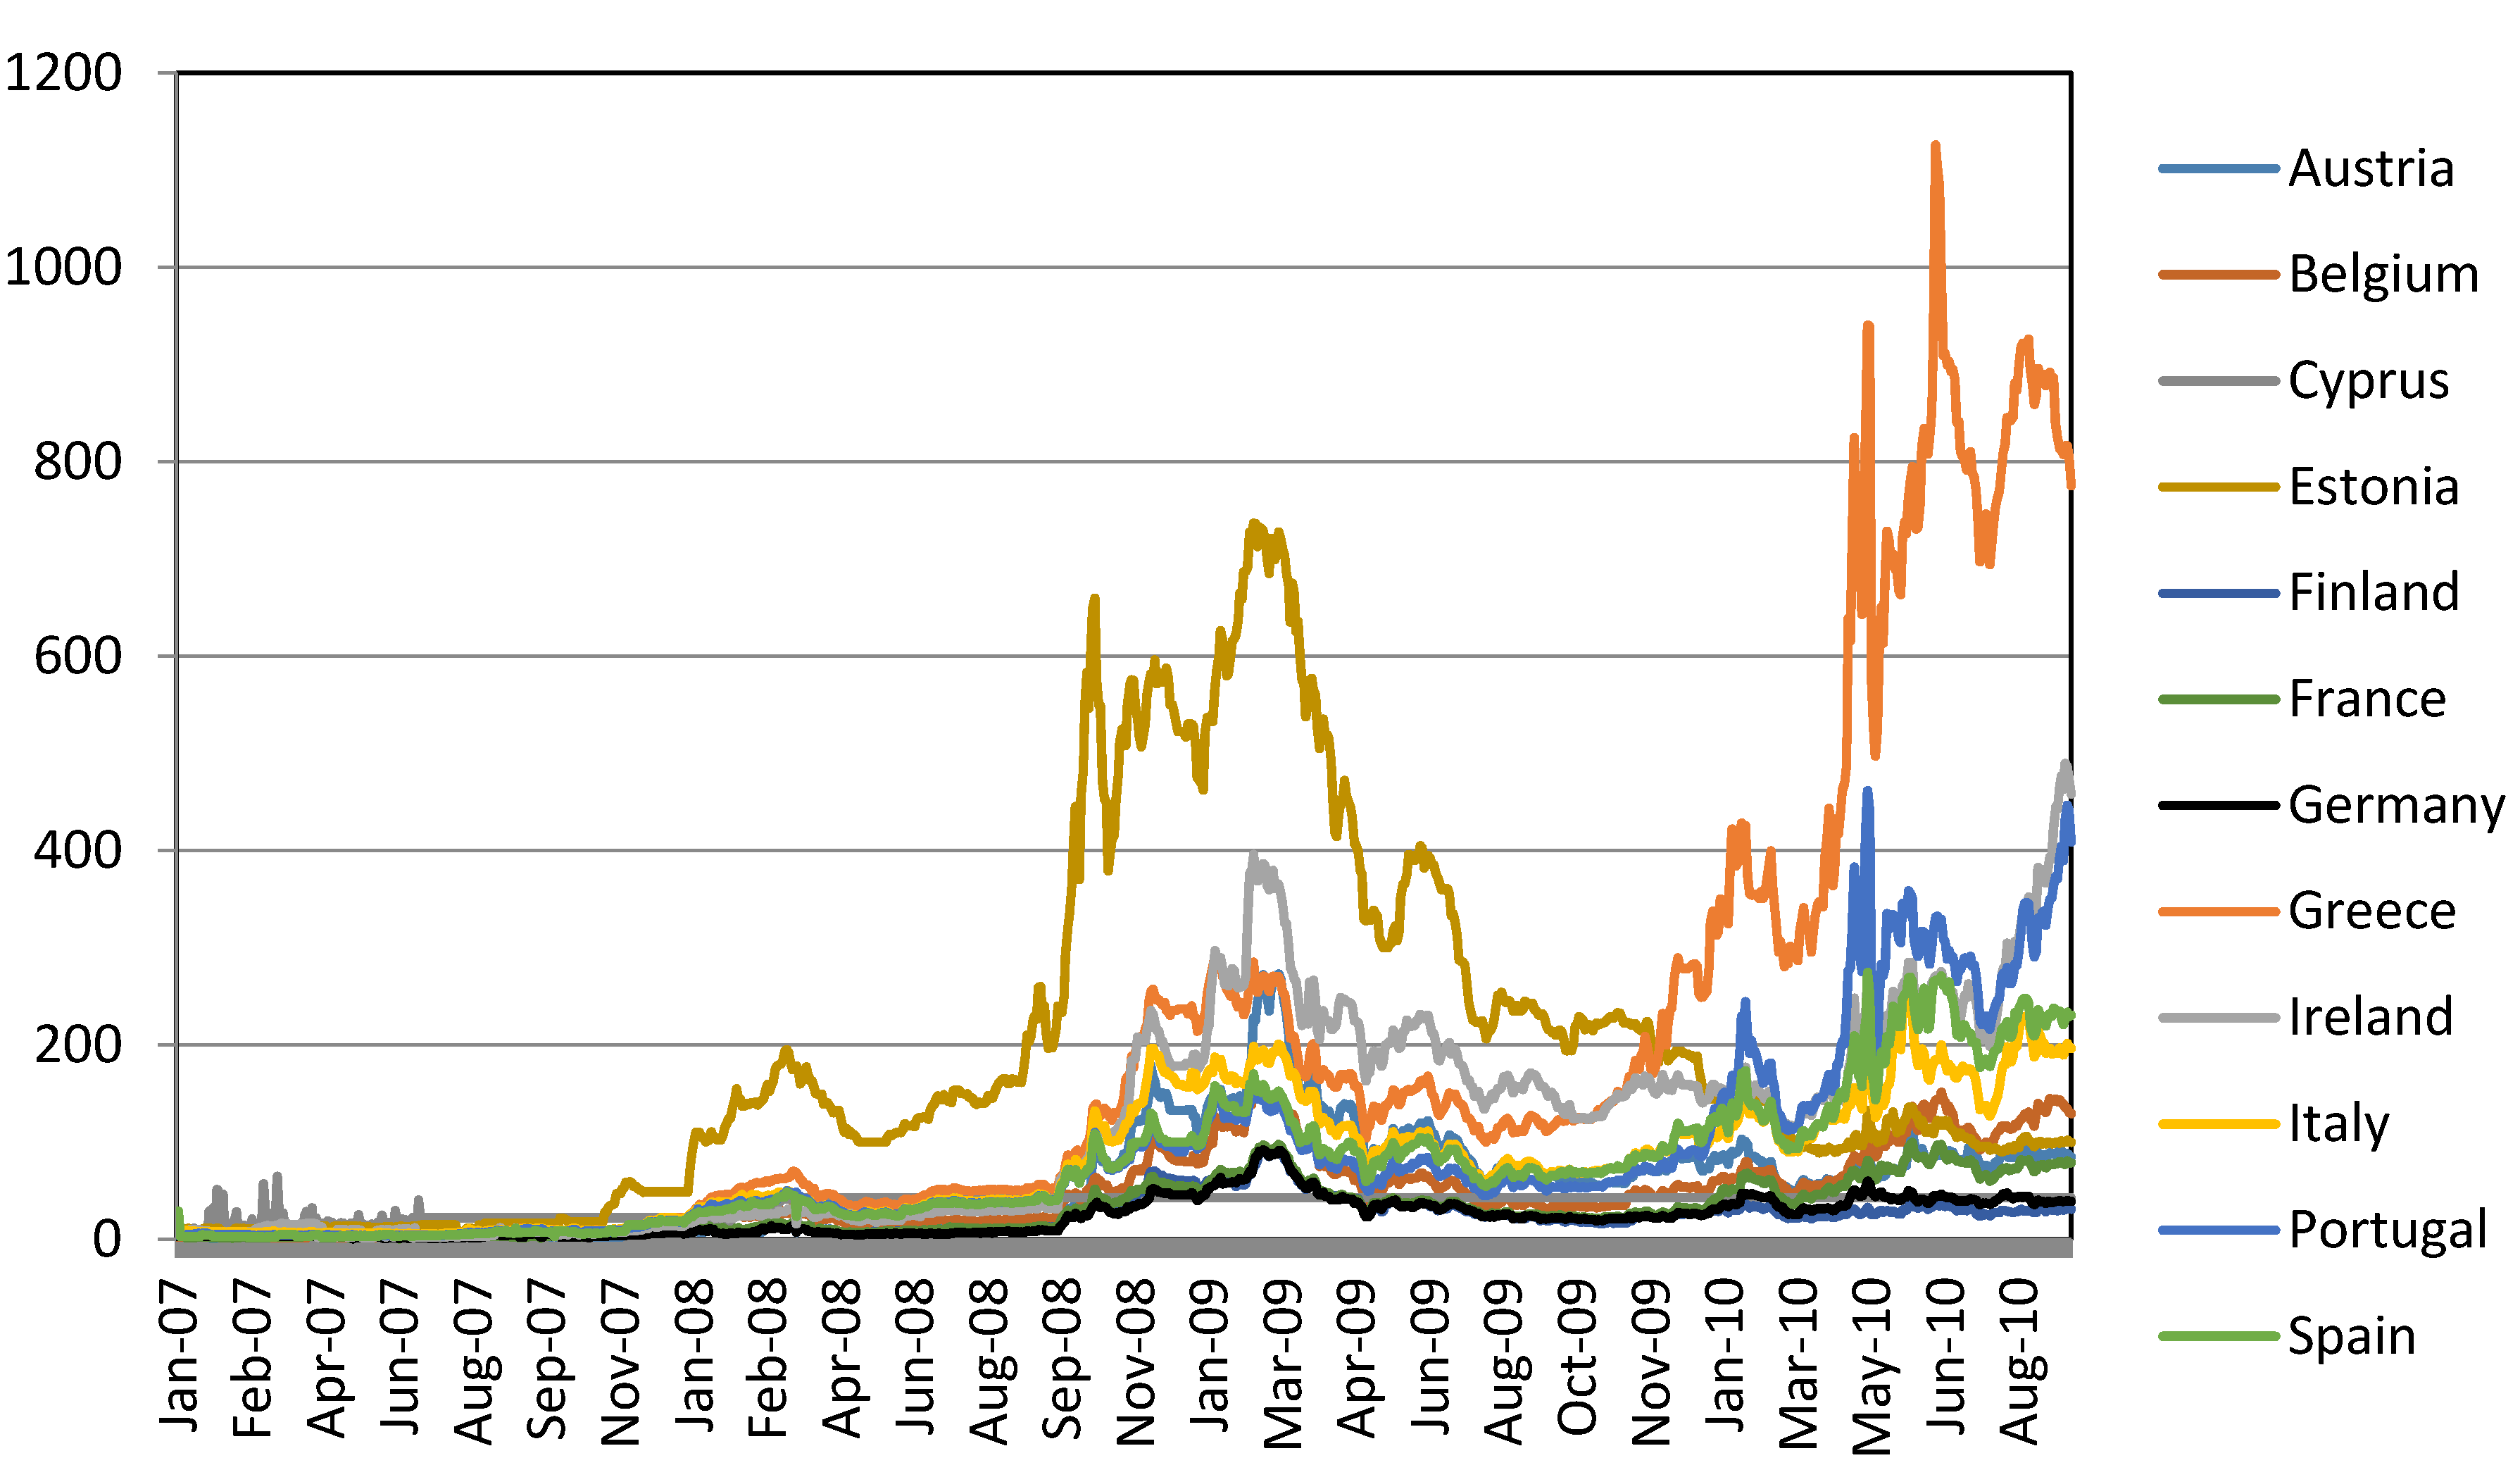
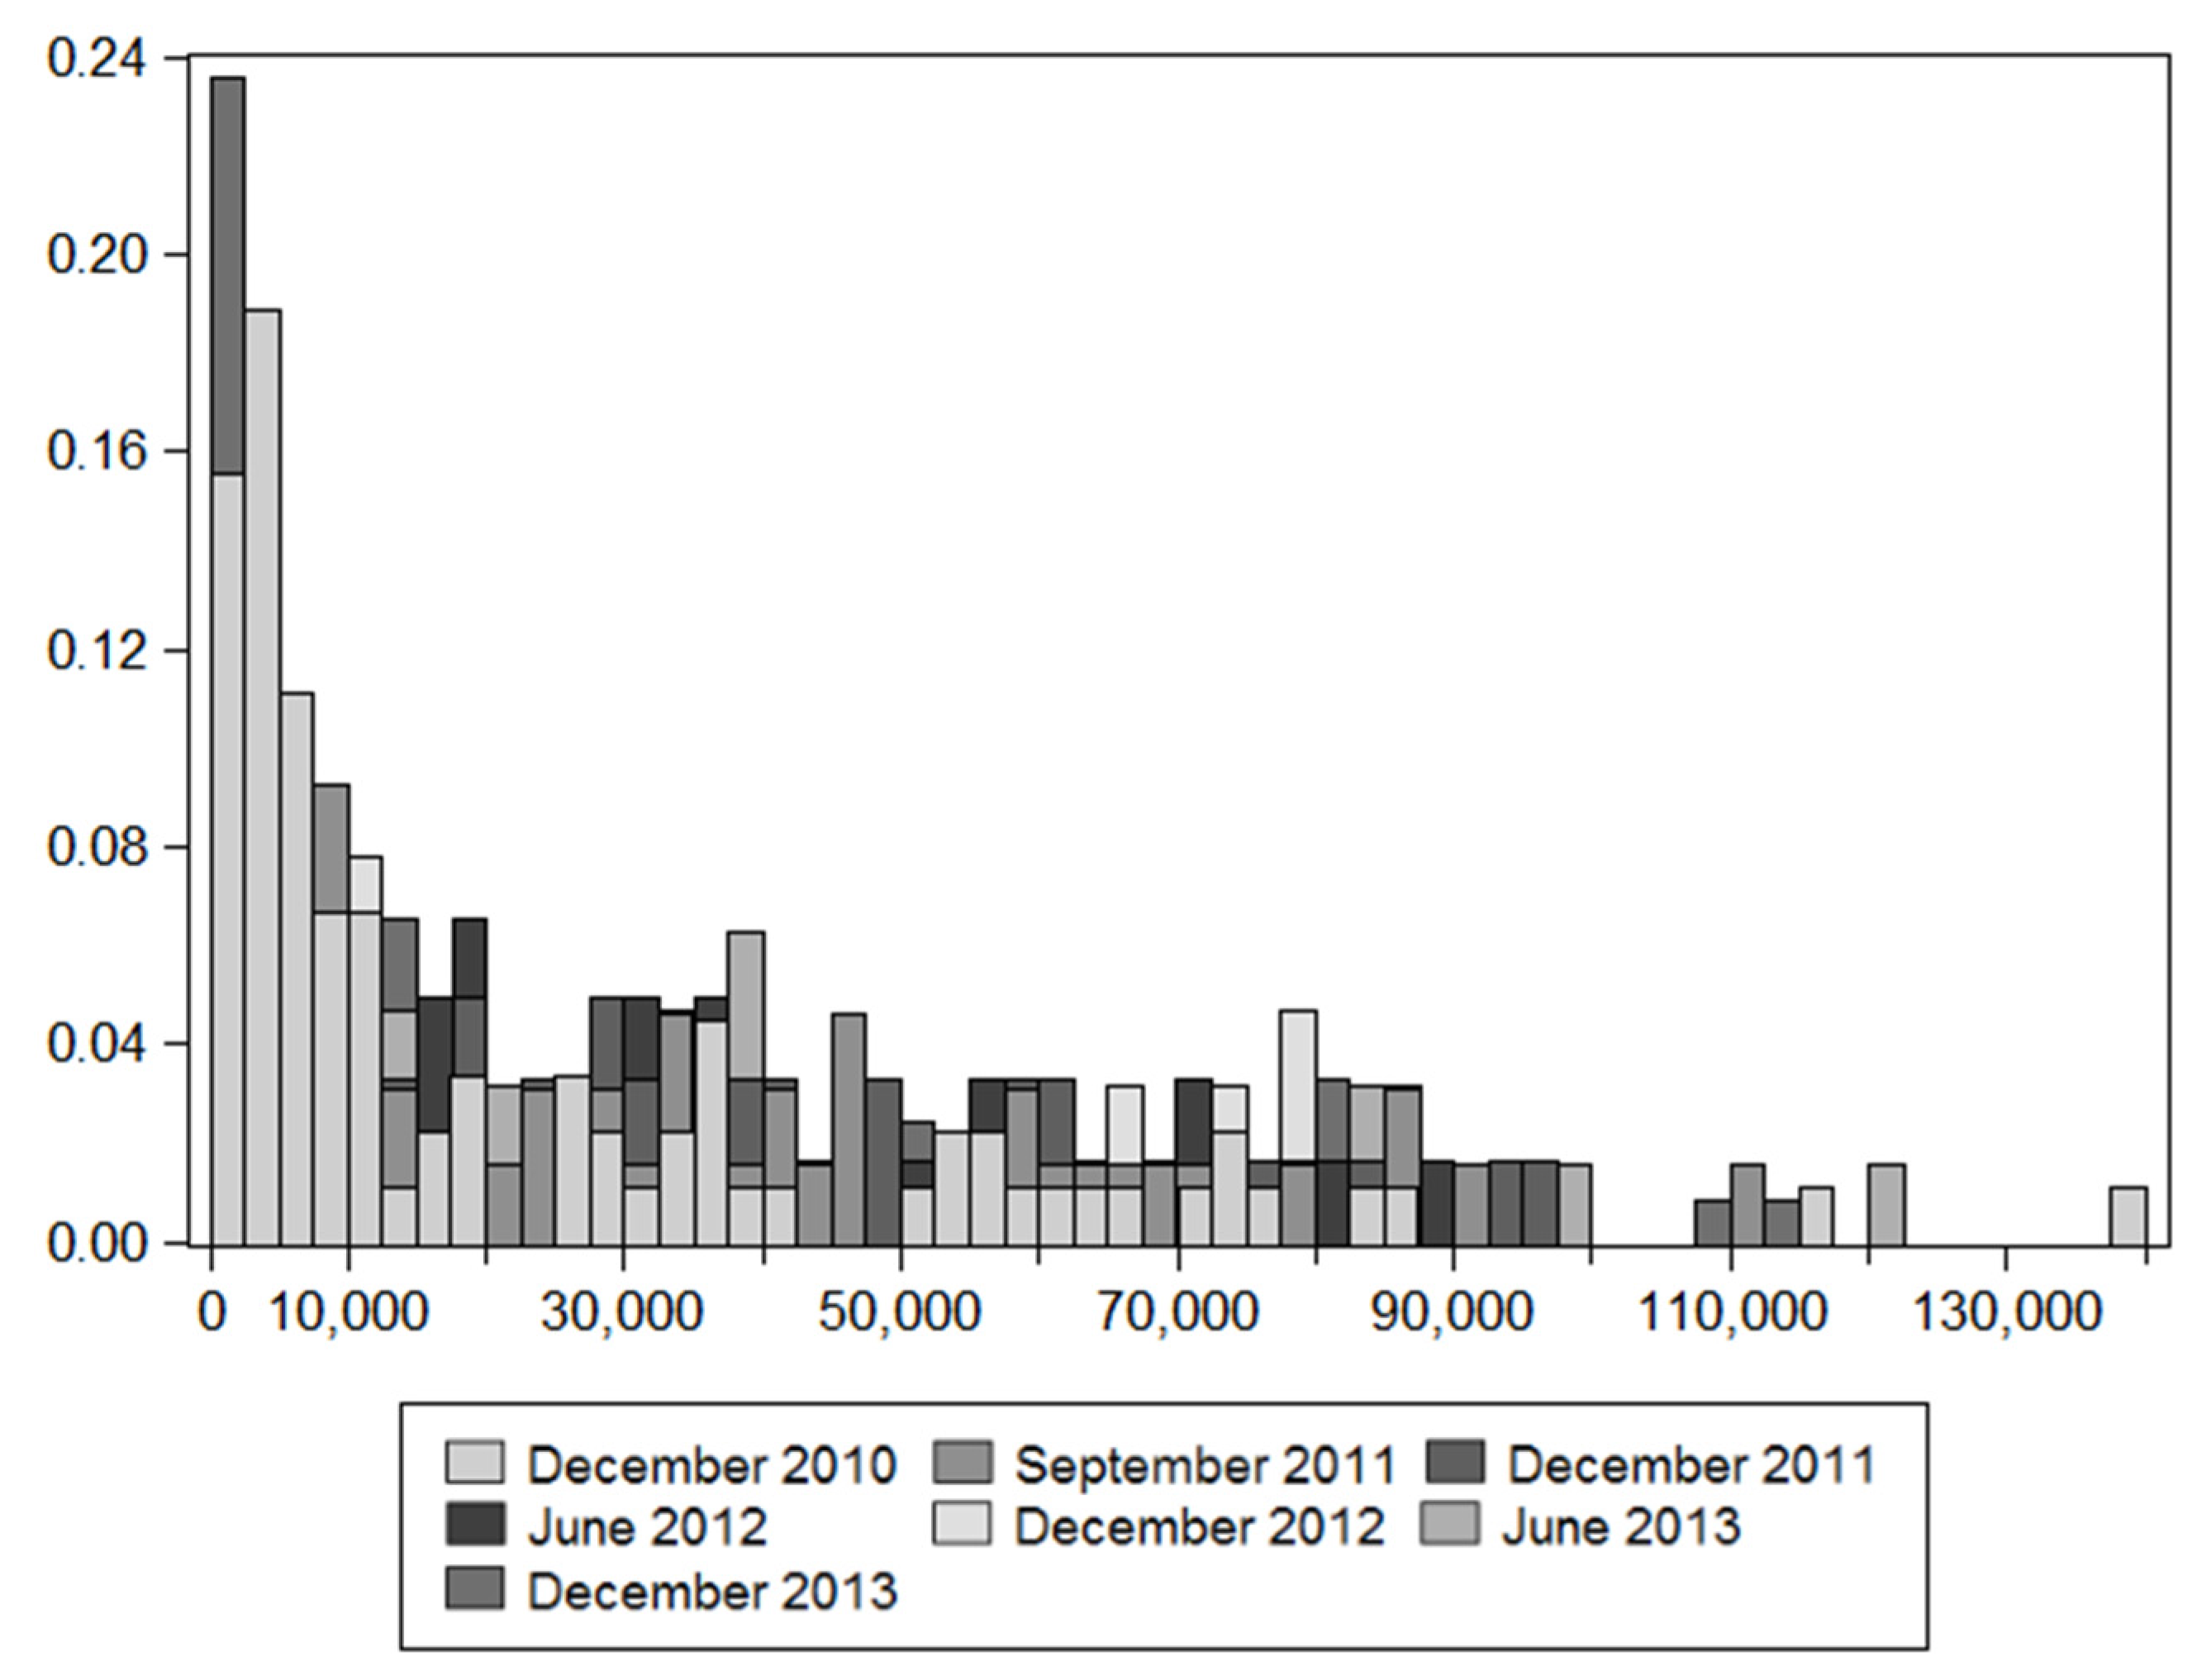
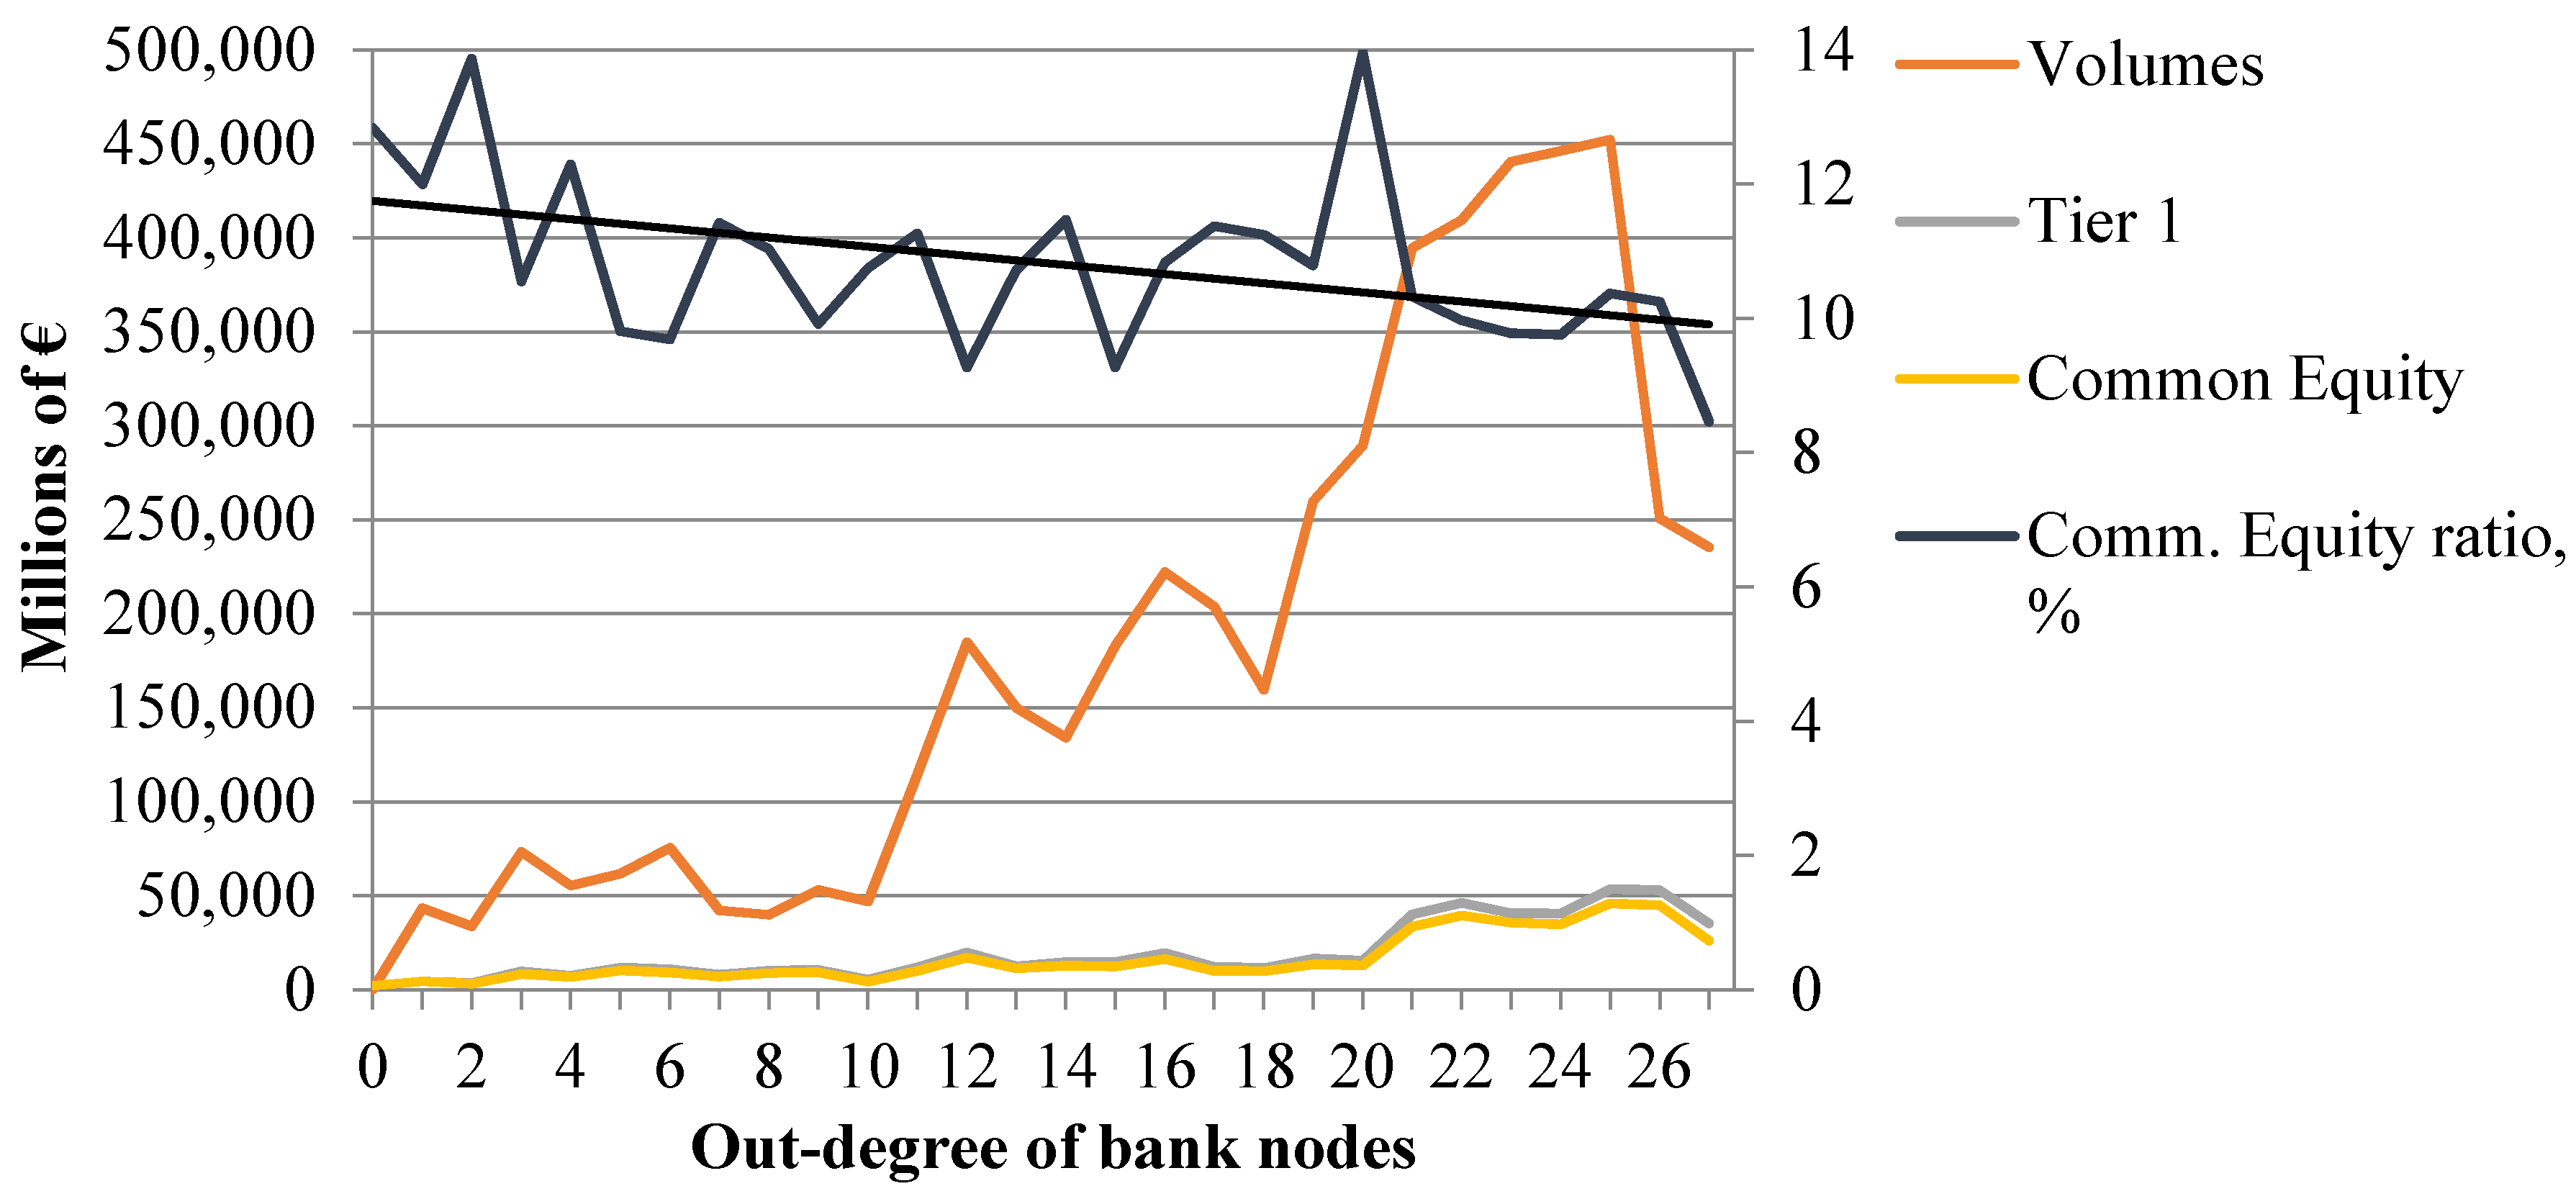
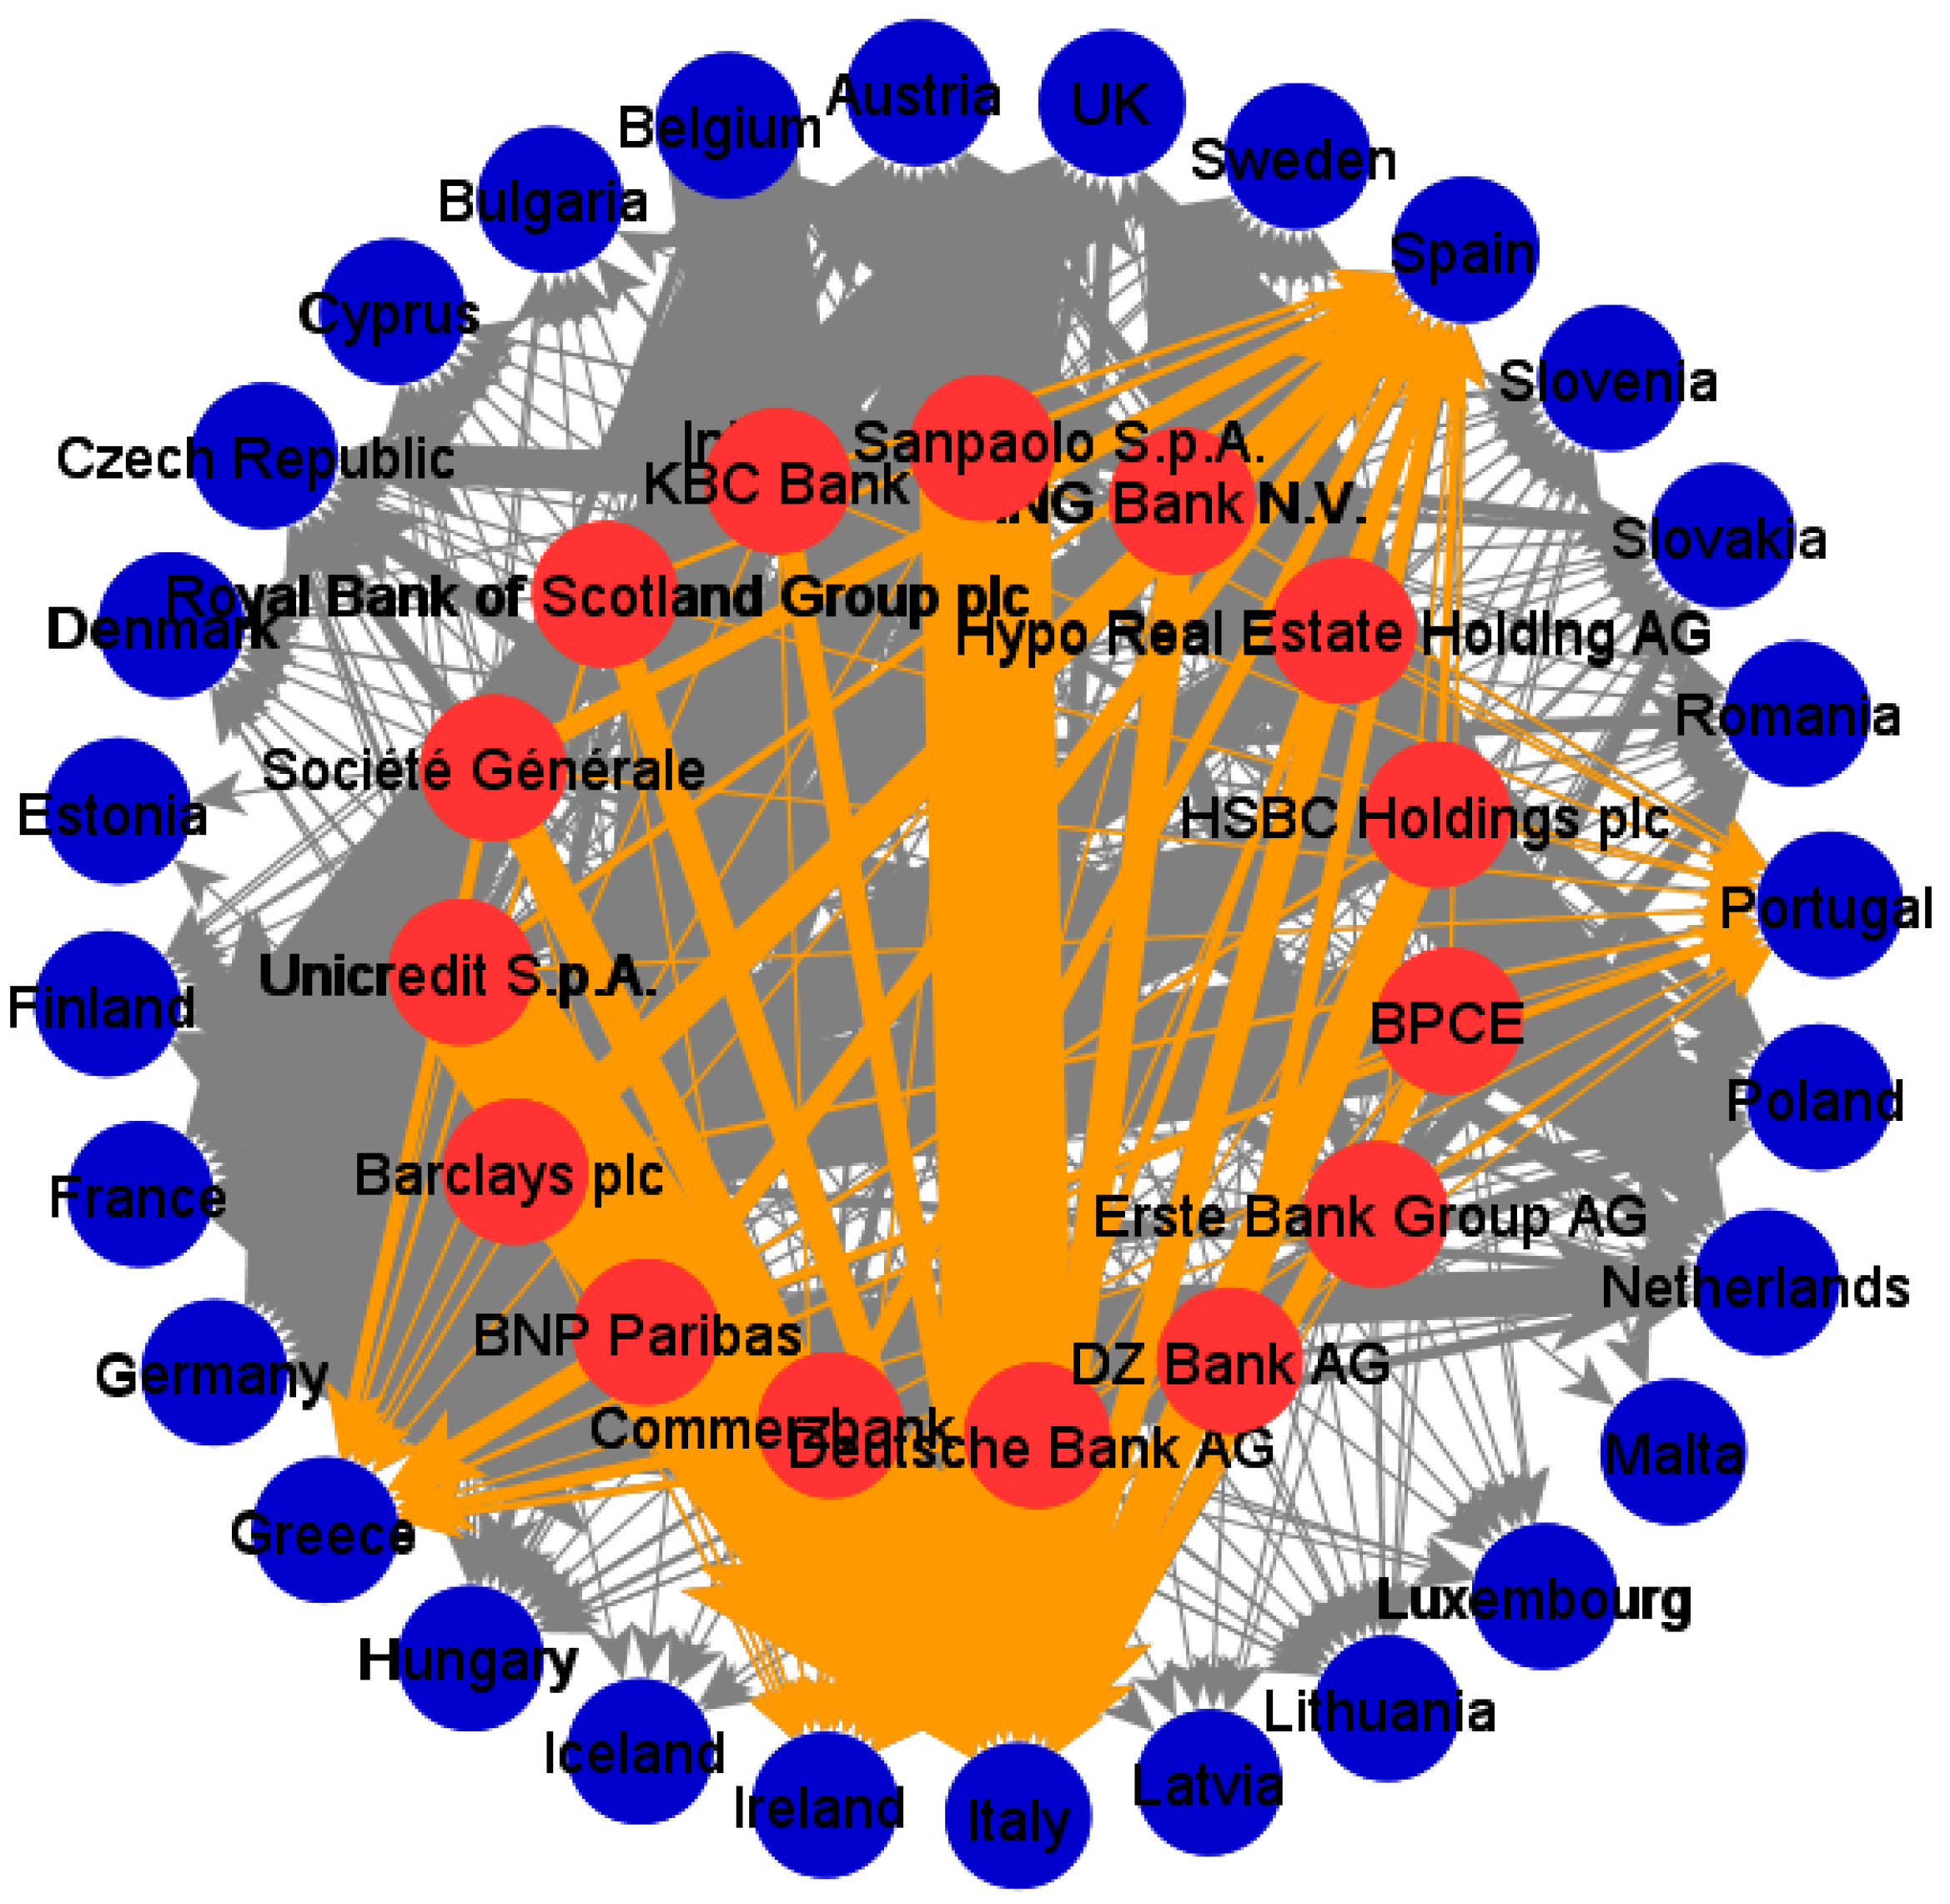
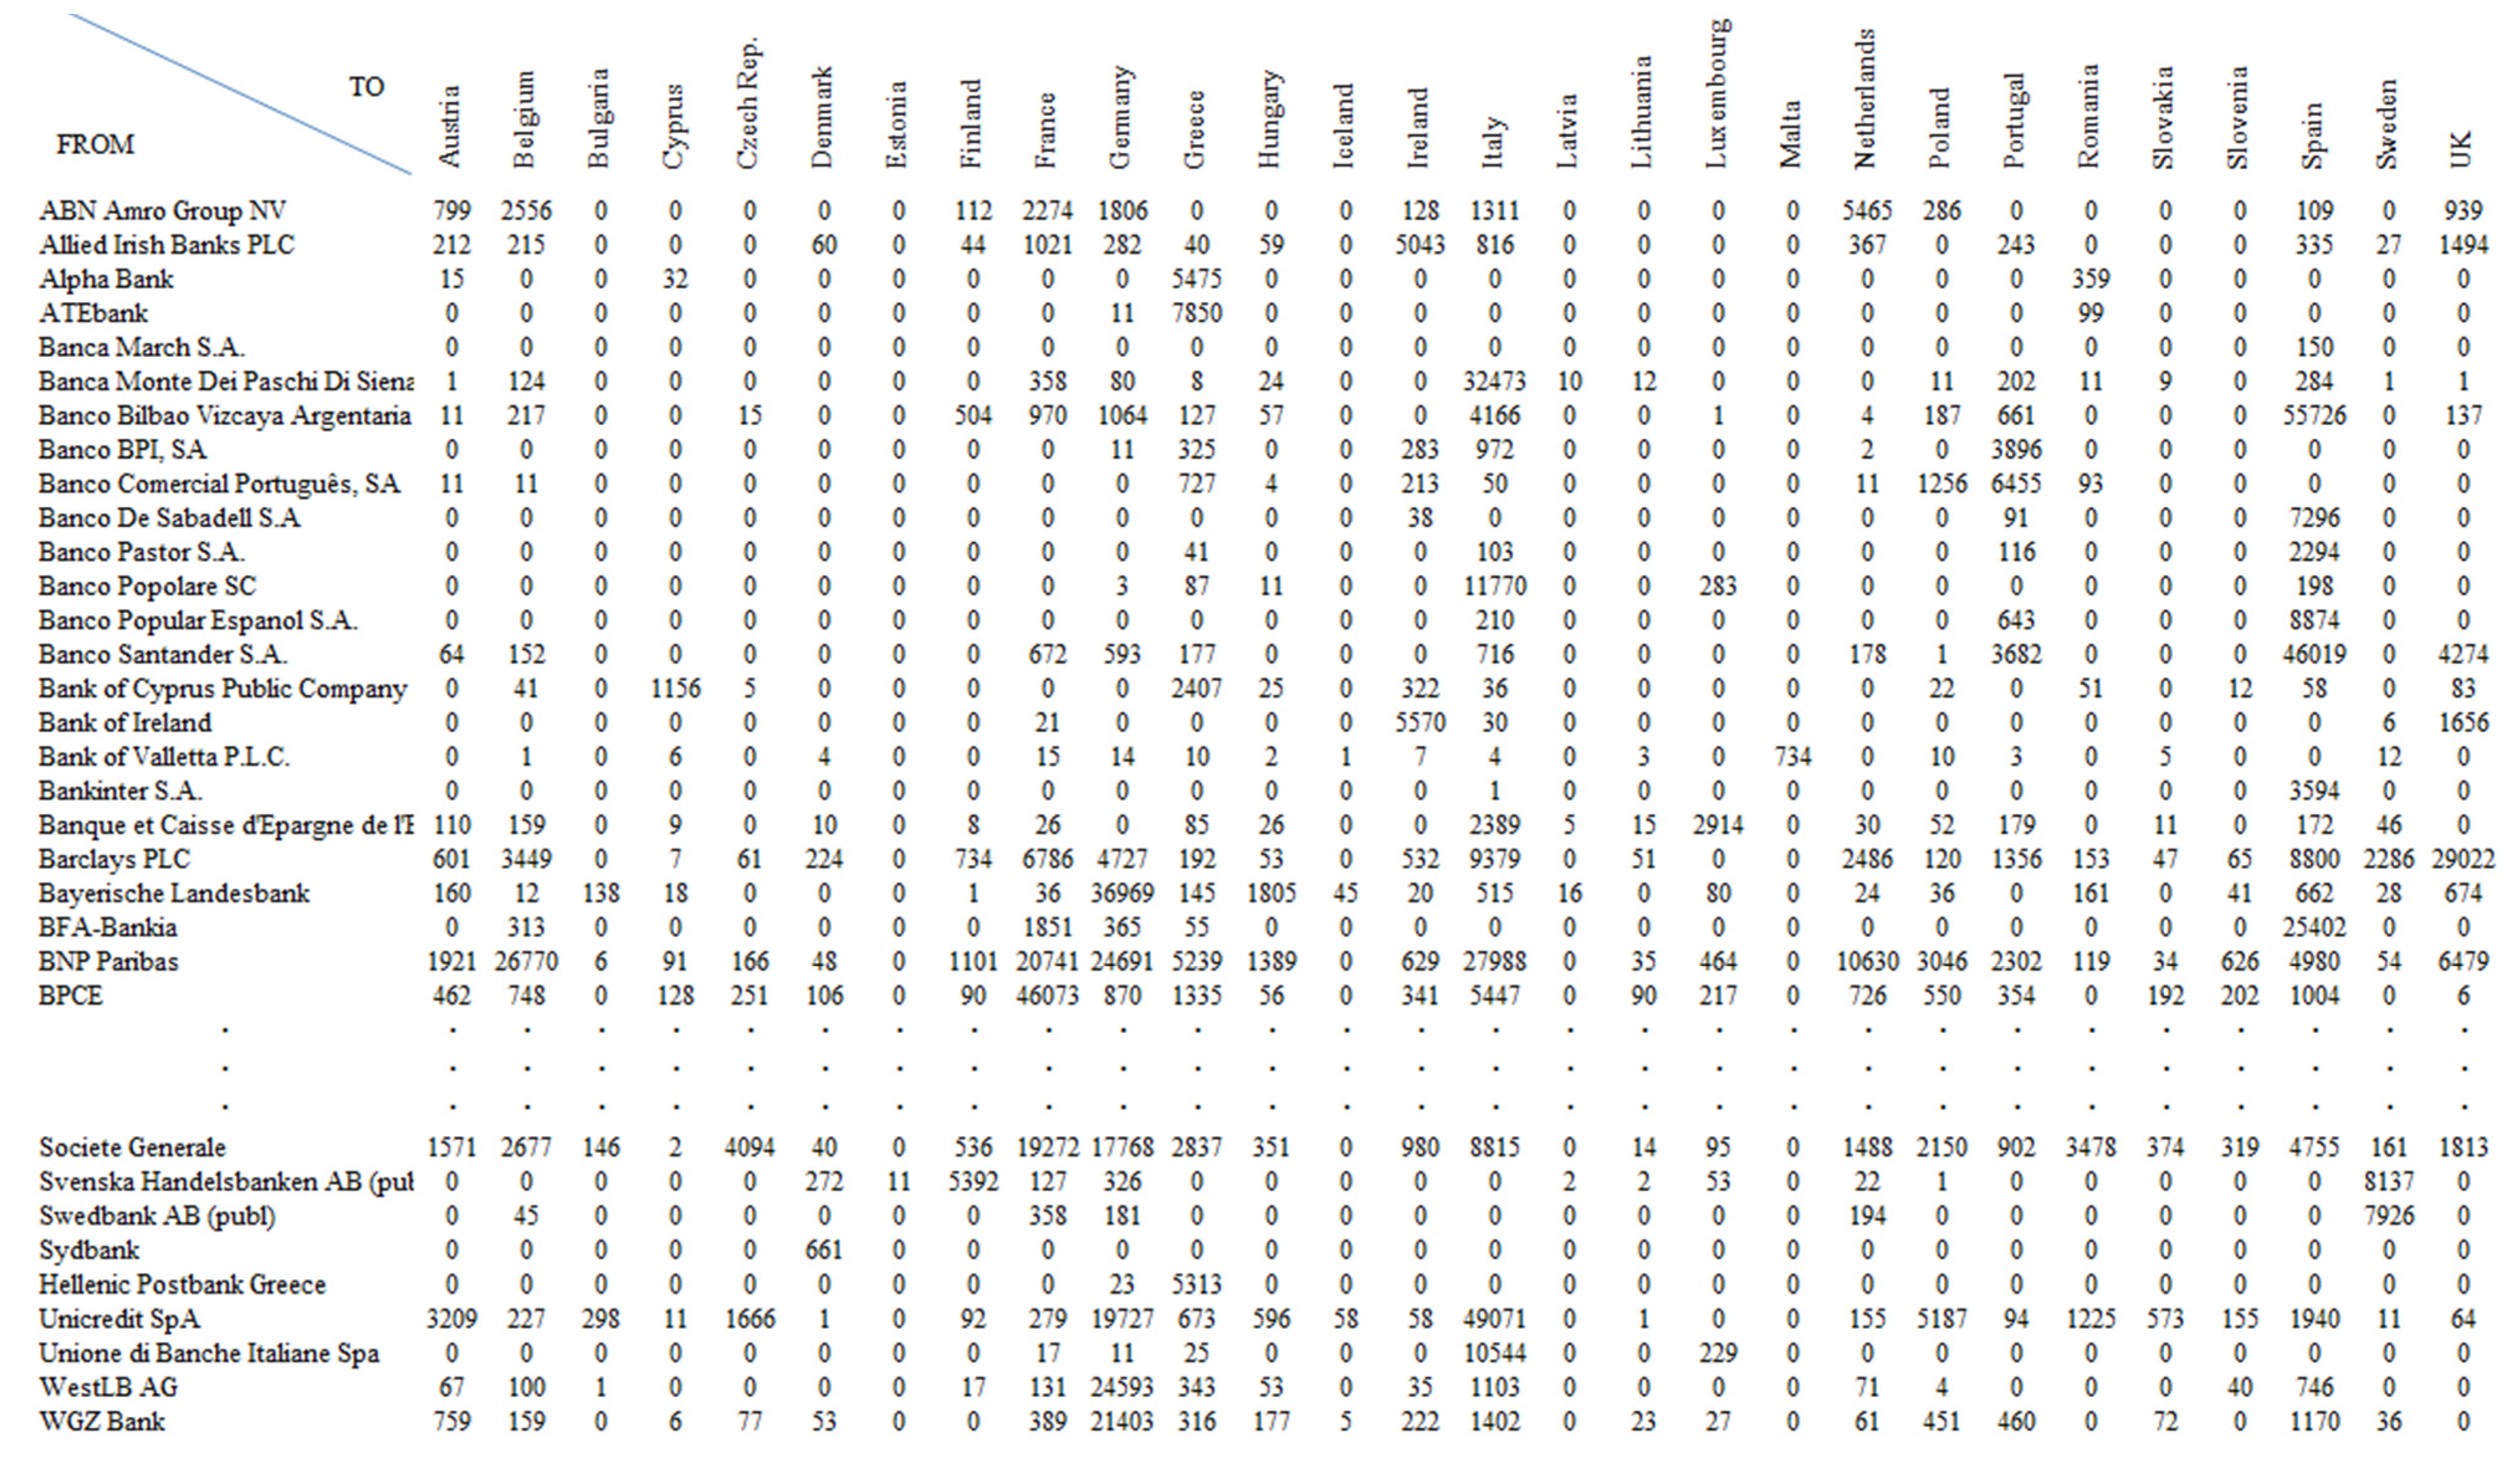


