Continued Experimental Study on the Friction Contact between a Labyrinth Seal Fin and a Honeycomb Stator: Slanted Position

1
Institute of Thermal Turbomachinery, Karlsruhe Institute of Technology, 76131 Karlsruhe, Germany
2
Robert Bosch GmbH, Robert-Bosch-Campus 1, 71272 Renningen, Germany
*
Author to whom correspondence should be addressed.
Aerospace 2018, 5(3), 82; https://doi.org/10.3390/aerospace5030082
Submission received: 2 June 2018
/
Revised: 21 July 2018
/
Accepted: 2 August 2018
/
Published: 7 August 2018
(This article belongs to the Special Issue Secondary Air Systems in Gas Turbine Engines)
Abstract
:Labyrinth seals are a state-of-the-art sealing technology to prevent and control leakage flows at rotor–stator interfaces in turbomachinery. Higher pressure ratios and the economical use of cooling air require small clearances, which lead to potential rubbing events. The use of honeycomb liners allows for minimal leakage by tolerating rub events to a certain extent. A previous study within an EU project investigated the complex contact conditions of honeycomb liners, with the idealized contact of a seal fin and a single parallel metal foil representing the honeycomb double foil section. In the present work, the results for the slanted foil position are shown and compared to the previous results. The variation of rub velocity, incursion speed, incursion rate, and seal geometry in a test rig allows for the identification of the influence on contact forces, temperatures, and wear. For the slanted position, significantly lower friction temperatures are observed, leading to a higher ratio of abrasive wear. Overall, the rub test results demonstrate strong interactions between the contact forces, friction temperatures, and wear.
1. Introduction
In steam and gas turbines, labyrinth seals are state of the art as an interface between stationary and rotating parts [1]. They tolerate high relative speeds, high pressures, and high temperatures with comparatively simple construction and low production costs. Rapid changes in operating conditions and maneuver loads require high demands on the design and construction of sealing systems. The main focus is to achieve the highest possible tolerances for radial and axial displacements.
The most relevant design parameter is the clearance [2,3]. By reducing the clearance, engine efficiency can be increased and fuel consumption reduced, however, the risk of rubbing increases. Rubbing may cause detrimental heat input into the rotating structure and lead to severe damages [4]. Therefore, abradable liner materials are used which provide a fast and controlled wear to protect the rotor. Wear of the rotor is critical for the reliability of the sealing system and can have a negative effect on the leakage. In addition, abradable seal materials have to withstand thermal and corrosive environments [5]. They can be categorized into porous materials, low shear strength materials, and honeycomb structures [6]. A distinction can be made between the high-speed friction contacts of a rotor blade against the stator or a vane and contact of rotating seals against a static casing. Blade rubbing is characterized by a defined cutting edge formed by the blade, whereas an undefined cutting edge is formed by the seal. A large number of publications of both experimental and numerical nature exist for blade-rubbing [7]. In this context, we focus on rotating seals.
Experiments with Hastelloy-X honeycombs [6] show that braze nodes at the interface between two metal foils increase the wall thickness up to to 2–3 times and can lead to a critical condition. Bill and Shiembob [8] experimentally investigated the contact between a knife-edge seal and a sintered NiCrAlY fiber-metal structure at room temperature and elevated temperature. Low incursion rates lead to local hotspots and therefore plastic smearing, which increases the wear of the knife-edge seal. In wear tests with a vertical grinding apparatus, performed by Dowson et al. [9], sparks and thermal cracks were observed at low friction speeds and high incursion rates. Additionally, hardness tests show that soft materials tend to exhibit better wear behavior.
Experimental investigations by Mutasim et al. [10] showed smearing, material transfer, and smooth cutting edges in the contact between plasma sprayed abradable coatings and rotating knife edges. Ghasripoor et al. [11] identified melting and mushrooming as dominant wear mechanisms in strip seals. Low thermal conductivity of the material leads to significantly higher wear. Sporer et al. [12] observed in abradability tests that the wear of honeycomb structures is mainly influenced by plastic deformation. Rathmann et al. [13] have tested honeycomb shroud interactions, but no data was presented. Herrmann et al. [14] studied the wear behavior of labyrinth seal strips by means of experimental rub testing and numerical finite element analysis, focusing on plastic deformation wear.
Experimental results by Delebarre et al. [15] for an Al–Si 6% coating and a labyrinth seal show an interaction between incursion rate and friction speed, resulting in a change of wear phenomenon. Increasing friction speed leads to significantly lower interaction force. A subsequent tribological analysis [16] based on a third-body approach was conducted, taking into account abrasion and adhesion. Higher friction speeds result in an increasing abrasive mechanism and thus improve the wear behavior of the coating. Zhang et al. [17] observed smearing and adhesive material transfer under the effect of high temperatures, depending strongly on the incursion rate.
Pychynski et al. [18] idealized the contact of a honeycomb seal with the contact between a single metal foil and a seal fin. Experimental investigations using a steel material combination show a dominant amount of plastic wear due to temperatures around 800 . The incursion rate had a significant influence on the contact forces, and an increase in friction speed resulted in lower rub forces. Fischer et al. [19] developed a finite element model for the rubbing process of metal foils that was validated using experimental data from [18]. The model was used to conduct a parameter study for the nickel-based alloys Hastelloy X and Haynes 214. Welzenbach et al. [20] applied an analytical approach and a two-dimensional numerical model to investigate the temperature distribution of the seal fin tip during a rubbing process. Thus, the influence of the heat transfer coefficient and thermal conductivity on the radial temperature distribution could be investigated.
The friction contact in turbomachinery is the subject of several studies. However, regarding the contact between sealing fins in labyrinth seals and honeycomb liners, there is still a lack of experimental data and numerical investigations. Therefore an experimental investigation was conducted. In Figure 1, the top view of a honeycomb liner is depicted. Considering possible seal fin positions, complex contact areas can be formed. In order to get a better physical understanding of the rubbing process, only the extreme seal fin positions, as depicted in Figure 1, were regarded for the experimental study.
Pychynski et al. [18] focused on the experimental investigation of the parallel seal fin position. Although the parallel position offers the largest contact surface and is potentially the more critical case, the interaction with the side walls is of great importance, especially due to axial movement of the rotor and slanted fin geometries. Therefore, the experiments conducted in the slanted position and the comparison with the parallel results is the focus of the presented study.
2. Experimental Setup
The test rig used to perform both the experiments for parallel and slanted foil positions is depicted in Figure 2. A rotor with five integrated labyrinth seal fins, which consist of two different geometries, is driven by an electric motor. The metal foils are mounted in a special foil holder which allows for three orientations of the metal foils, depicted in Figure 1. The cross head of the traversing system is driven by a linear stepper motor.
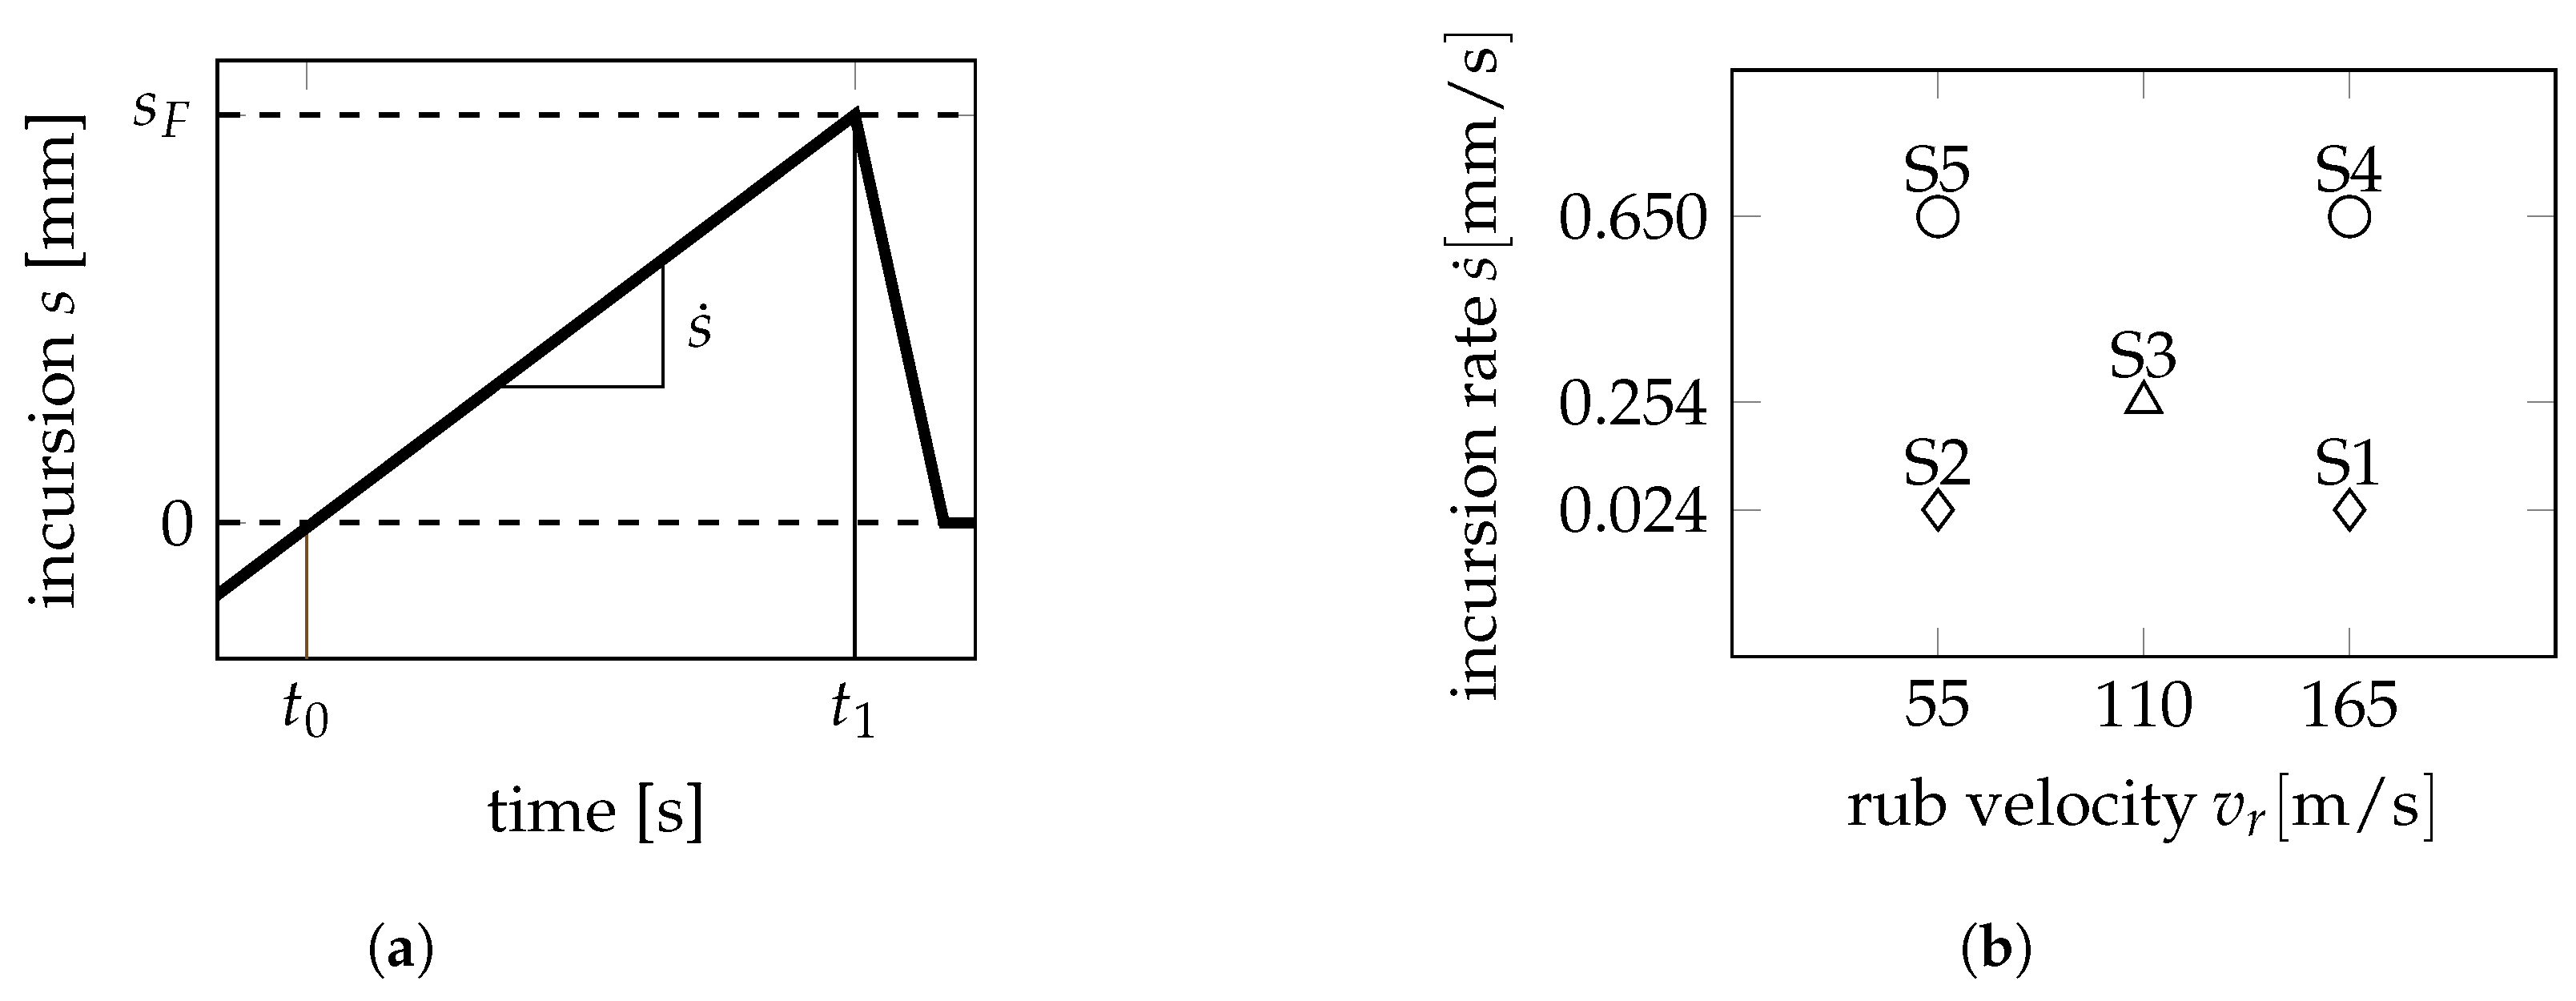
The metal foils have the dimension 12 mm × 20 mm with variable thickness. The metal alloy 42CrMo4 (1.7225) was used as the rotor material and the metal foils consist of a stainless austenitic steel X5CrNi18-10 (1.4301). Although steel differs from the materials commonly used in aero engines, like nickel-based alloys, the well-known material properties provide insight into the physical phenomenon of rubbing. In Figure 3, a typical radial incursion profile and the test matrix for the varied conditions—rub velocity and incursion rate —is shown.
The resulting friction forces were measured by a strain-gauge force meter in three axes. The temperatures of the static foils were measured by means of infrared (IR) thermography. Therefore, the metal foils were coated to achieve a homogeneous and highly emissive surface. The use of an IR thermo camera and the measurement procedure described by Ochs et al. [21] resulted in an accuracy of ± 25 and a spatial resolution of 400 pixels/mm. The temperature at the rotating seal fin was measured with two high-speed pyrometers for the temperature ranges 300–900 and 120–550 . All tests were conducted at ambient pressure and temperature. For more information on the test rig and the measurement technique, we refer to the original paper by Pychynski et al. [18].
3. Test Results
This section presents and discusses the resulting wear, forces, and temperatures of the tests. Experiments were carried out with both an inclined and a perpendicular seal fin, as shown in Figure 4. The investigation of two different configurations (60, 120) allows the measurement of the temperature evolution for both the front edge and rear edge of seal fin SF2. The final incursion depth was kept constant at . In the following subsections, selected test runs of rub scenario 3 (S3, 110 m/s rub velocity, mm/s incursion rate, foil thickness) are discussed to get insights into the friction and wear behavior of the studied system. In order to interpret the resulting forces, a geometrical analysis of the system is demonstrated. Then the results for all rub scenarios are presented and discussed.
3.1. Rub Scenario S3—Different Seal Fins and Foil Orientation
In the selected test runs, the resulting forces, images from the IR camera, and extracted temperatures from the IR camera for the reference rub test are shown. The wear profile of the metal foil after the rub test in Figure 5 helps to understand the IR thermo camera images. Plastic deformation wear can be identified by shear lips both on the leading edge (LE) and the trailing edge (TE) for all rub orientations. Comparing both seal fin geometries, the plastic wear on the side surface(s) of the rub groove is much more pronounced for the inclined seal fin SF2. On the one hand, this is due to the larger volume of metal foil material that has to be worn away or pushed aside from the seal fin. On the other hand, this observation suggests higher temperatures, and hence lower yield strength, near the contact area on the rear surface of seal fin SF2. Higher local friction temperatures lead to more local plastic deformation wear on the sharp edge. This demonstrates the importance of heat removal from the contact zone and the resulting metal foil friction temperatures.
Figure 6 depicts the contact forces in radial () and tangential () directions over time for a metal foil thickness B of mm. The green graph indicates the radial incursion s in . The parallel rub tests presented in [18] had shown that, despite the continuous increase in radial incursion, a steady wear state develops after a characteristic peak value in the contact forces. This distinction of two phases cannot be observed for the slanted position. There is a smaller peak at the beginning of the friction contact, but, especially for the inclined seal fin (SF2) in Figure 6a,b, both radial and tangential forces continue to increase over time. This trend is not so pronounced for the perpendicular seal fin (SF3) in Figure 6c, which can be explained by the increasing geometric contact area with increasing incursion rate.
The corresponding IR images of the metal foil front face for reference rub scenario S3 are depicted in Figure 7. Only temperatures on the left-hand edge could be determined by means of IR imaging, because the view is partially blocked by the seal fin (see Figure 4). In Figure 7a, the inclined seal fin with 60 foil orientation is shown. It can be clearly seen that the temperature distribution at the tip is much more pronounced than the temperature at the left-hand edge. This is an indication that the front edge of the seal fin is not involved in the rubbing process. The temperature distribution of the inclined seal fin with 120 foil orientation in Figure 7b and the perpendicular seal fin in Figure 7c indicate that there is a contact and frictional heat fluxes are released.
In order to quantify the temperature distribution, an algorithm was used to extract the maximum foil temperatures at the seal fin tip and the front edge. Figure 8 shows the transient development for the temperature of seal fin tip and front edge directly at the contact and at a distance of mm perpendicular to the respective contact surface. In the tests on the inclined seal fin SF2 with 60 foil orientation in Figure 8a, the maximum temperatures at the edge correspond to the temperatures measured on the small, visible section of the rear surface.
In contrast to the parallel foil orientation, where the maximum temperatures are always around 800 , the measured friction temperatures for the slanted foil position are considerably lower with maximum temperatures under 400 . This can be attributed to the improved heat transfer to the surrounding metal foil through conduction. Also, the convective heat transfer can be expected to be larger, as air is swirled directly onto the front face of the metal foil by rotor windage. The tip temperatures of the inclined seal fin SF2 are almost identical for both foil angles 60° and 120 in Figure 8a,b. The maximum temperatures at the rear edge seem to be slightly higher than those at the fin tip. This is particularly true for the beginning of the rub process for the 60 foil orientation on SF2 in Figure 8b. In contrast, the temperatures at the edge and fin tip seem to be more similar for the perpendicular seal fin SF3 in Figure 8c.
Both the IR camera pictures in Figure 7 and the extracted temperatures in Figure 8 show that temperatures are approximately 50 lower for the perpendicular seal fin SF3 and fluctuate much more in comparison. An explanation for this can be found in a repeating shift of contact from the seal fin tip to the edge surfaces, for example, due to an opening and closing of the contact caused by a combination of thermal expansion and wear or adhesive material transfer. For the inclined seal fin SF2, the measured temperatures are much steadier. As a result of increasing contact area and resulting forces over the rub duration, the temperatures in the contact zone take longer to approach a steady-state phase.
The plastic deformation wear of the metal foil must be taken into account when interpreting the foil temperatures near the contact area. Therefore, a more reliable comparison of the foil temperatures can be made for the foil temperatures at a mm distance from the contact surface in Figure 8. The foil temperatures at the mm distance from the contact surface are clearly higher for the inclined seal fin SF2. Although the contact area at the tip is similar for both the inclined and perpendicular seal fin, the total heat input into the metal foil seems to be larger for the inclined seal fin. This indicates that the total frictional heat generated in the contact zone is larger for the inclined seal fin. However, it must be pointed out that the measurement error of the IR camera increases with decreasing foil temperature. Also, due to the grinding of the seal fins after each rub test, the width of the inclined seal fin tip increased more than the tip width of the perpendicular seal fin tip with increasing number of experiments.
3.2. Geometrical Analysis of the Contact Area
As shown in the previous section, an analysis of the contact surfaces is necessary in order to interpret the resulting forces and temperatures in the contact appropriately. The ideal geometries of seal fins and metal foils are depicted in Figure 9. For the initial contact, only the tip of the fin is in contact. If the incursion is increasing, the contact surface areas of the edge become larger, while the contact surface at the tip remains constant.
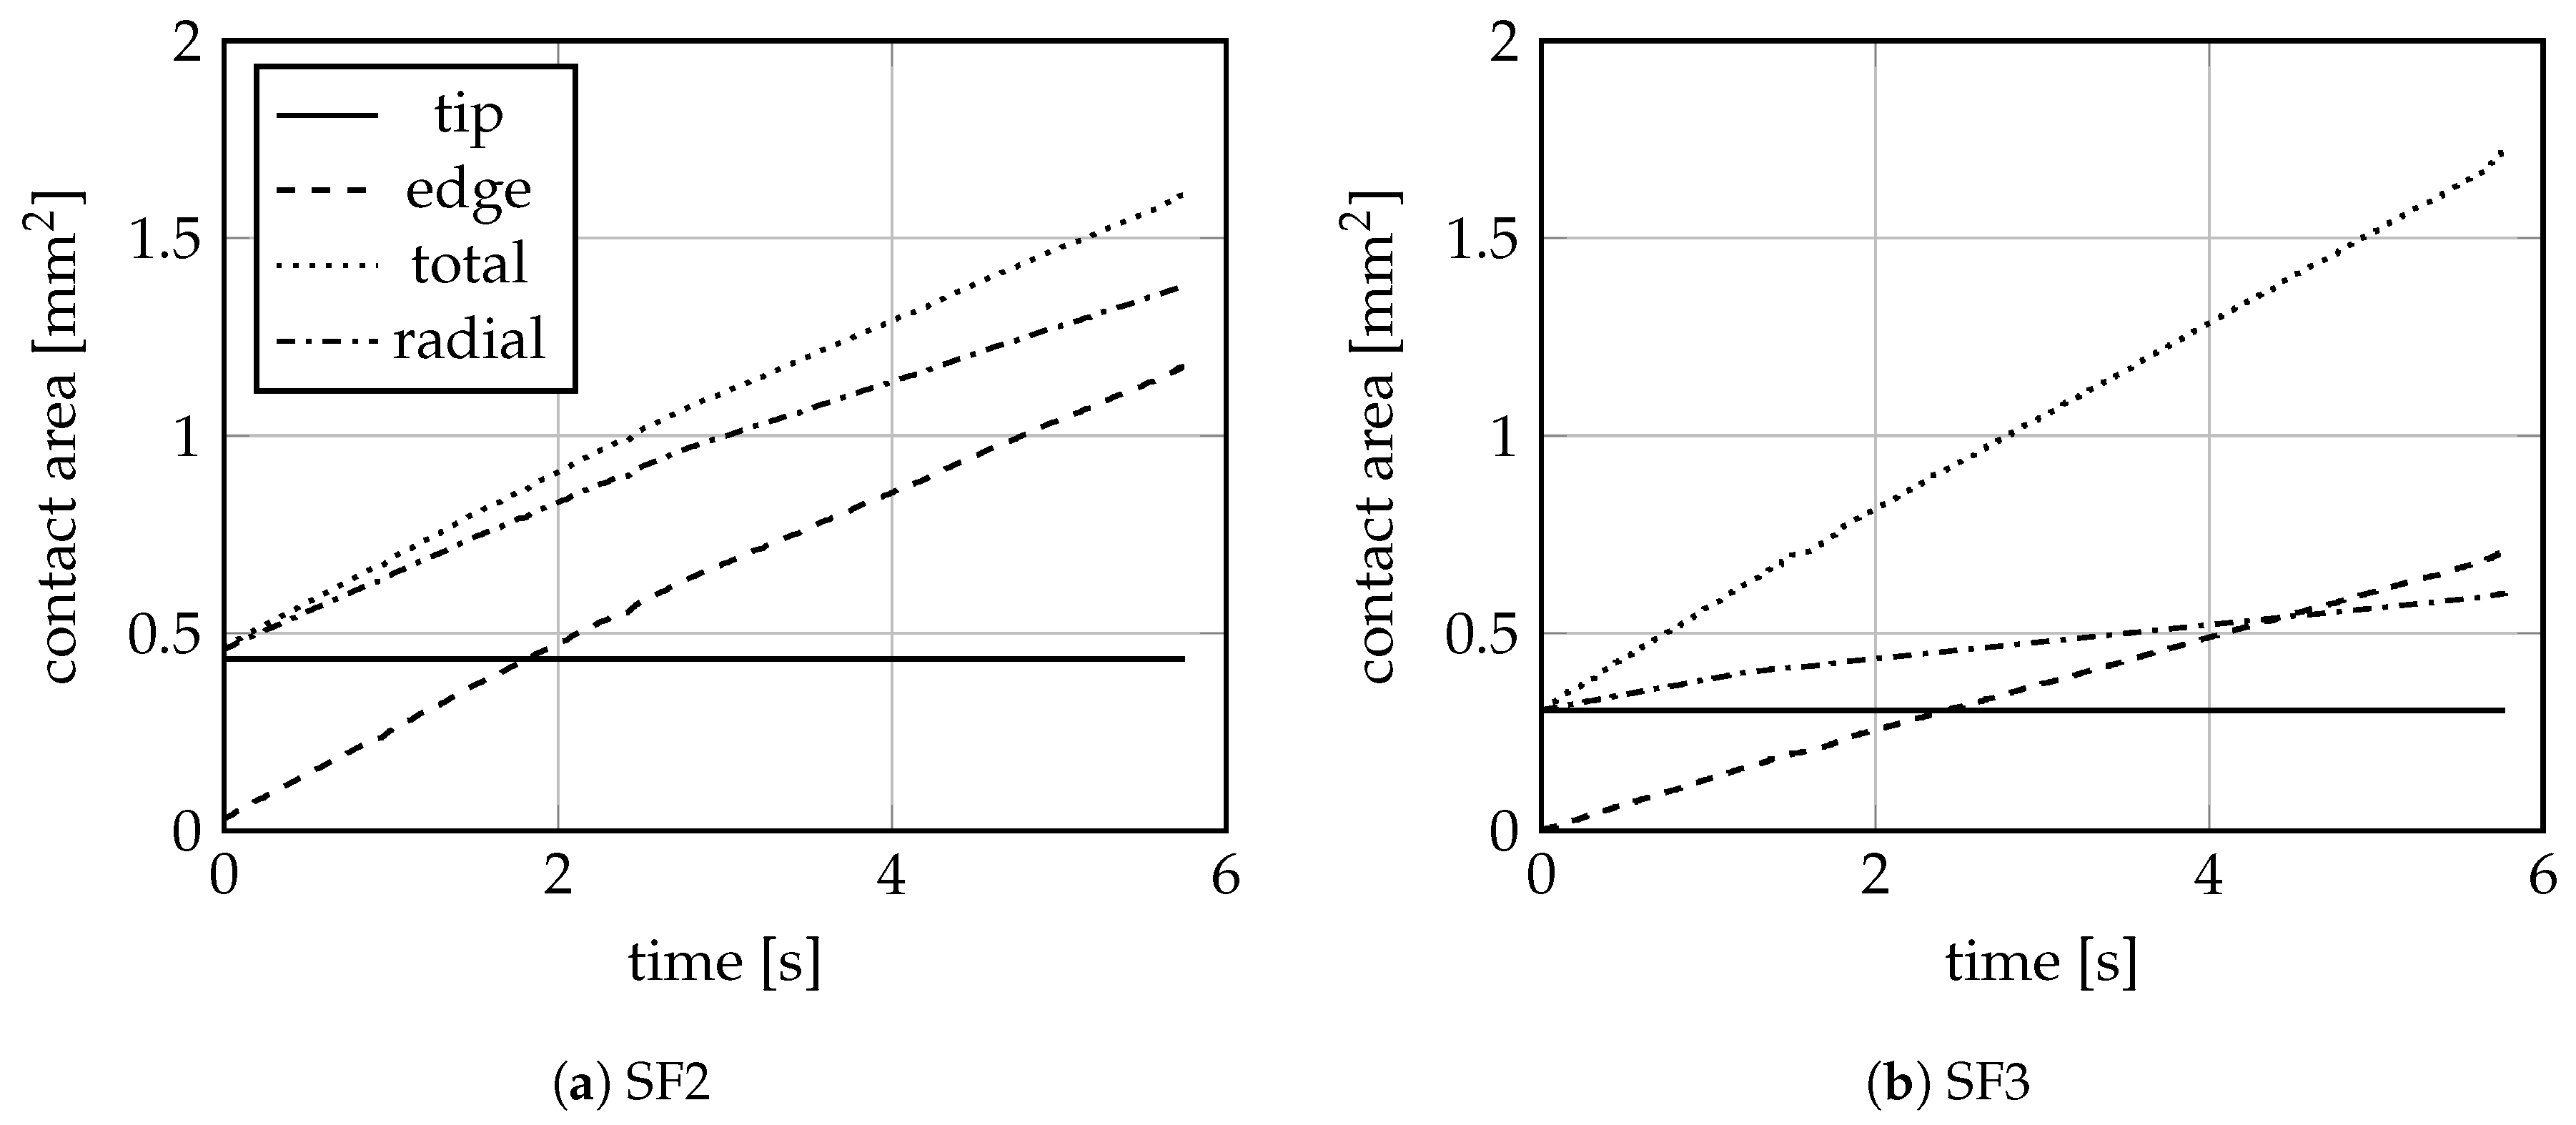
The theoretical development of the surfaces involved in the friction process is represented in Figure 10. Determining the dimensions of the seal fins at regular intervals using imprints takes into account the wear of the seal fin during the tests. A distinction is made between the surface of the tip , the surface of the edges , and the sum of surfaces . In addition, the surface projected in radial direction is indicated, as this is the influencing quantity for the contact pressure distribution. The initial contact surface formed by the seal fin tip is smaller for the perpendicular seal fin because of the real geometry of the seal fins. A more pronounced area increase of the inclined seal fin as a result of the incursion leads to a similar total contact surface at the end of the rubbing process. There is a significant difference for the total projected area because the angles of SF3 are much smaller. The increasing forces during the experiment for the inclined seal fin in Figure 6 can be attributed to the increase in the contact area involved in the rubbing process. The theoretical development of the areas involved in the friction process are also used to calculate the wear volume on the basis of material loss .
3.3. All Test Runs for Metal Foil Thickness 0.4 mm
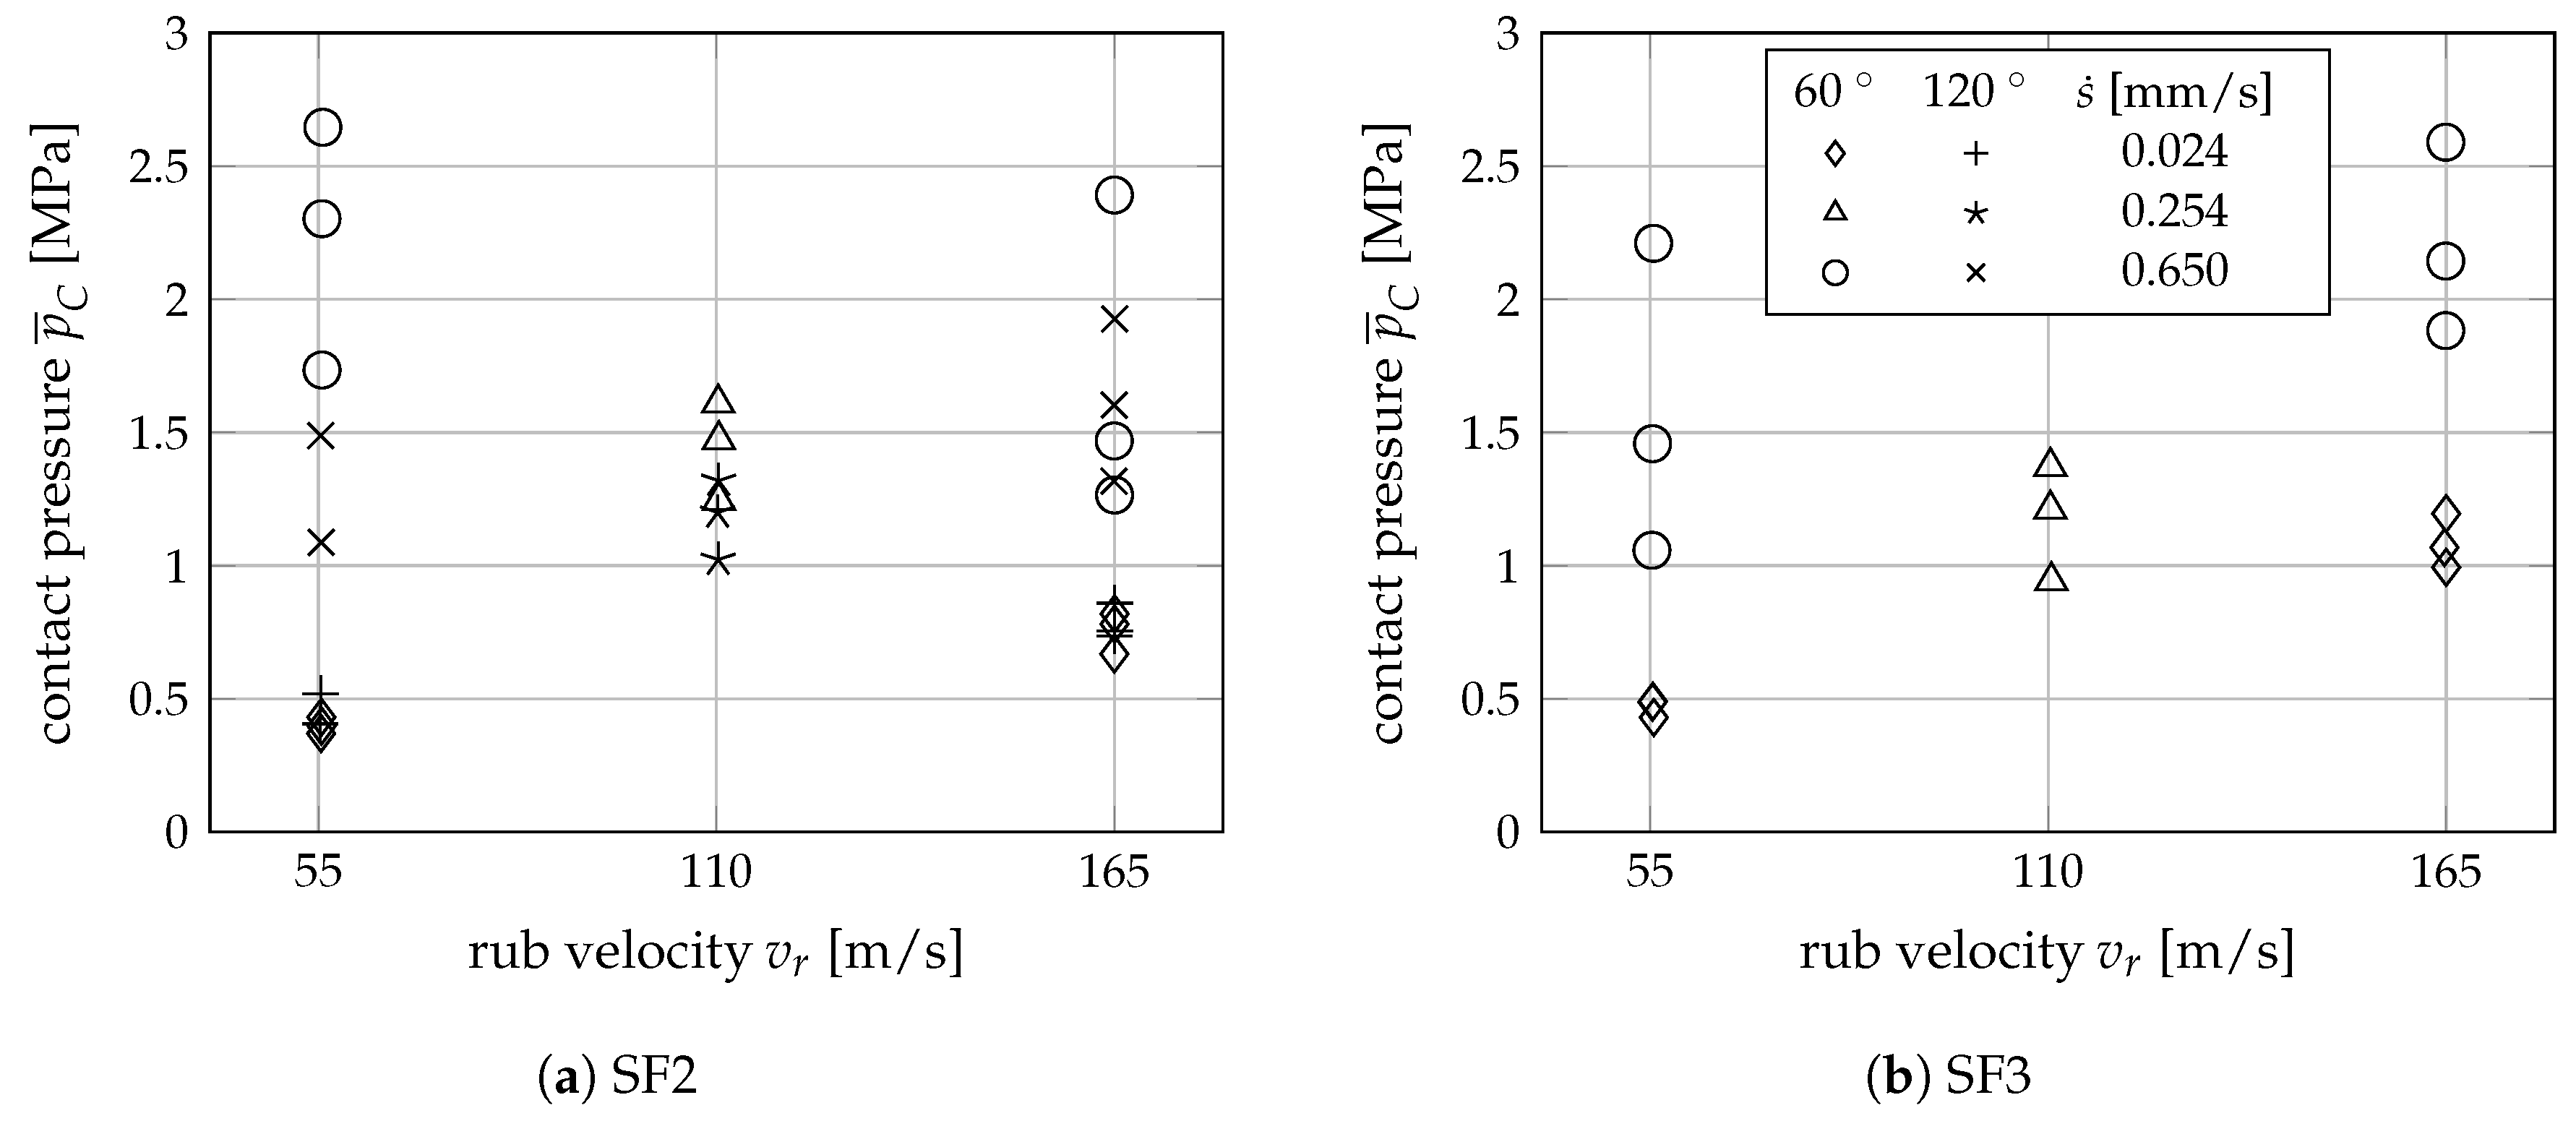
The effects of rub velocity and incursion rate on the averaged resulting contact pressure for each seal fin geometry with foil thickness of mm are shown in Figure 11. The contact pressure was calculated by dividing the measured radial force by the projected radial contact surface,
and averaging over the rub duration. Similar to the parallel rub tests, the contact pressure increases with increasing incursion rate, irrespective of the seal fin geometry. However, as opposed to the parallel rub tests, the radial forces increase with increasing rub velocity. This trend is particularly pronounced for the low incursion rates of mm/s, irrespective of the seal fin geometry. The contact pressure of the reference scenario S3 suggests a linear relationship between the rub conditions and the resulting radial forces. The resulting contact pressures are very similar for both seal fin geometries, which shows that, according to Equation (1), the resulting radial forces are larger for the inclined seal fin geometry SF2. Overall, a reliable comparison between both seal fin geometries is difficult because of uncertainties in estimating the projected radial contact surface and differentiation between force components acting on each edge, contributing to the resulting force.
The corresponding frictional stress was determined by dividing the measured tangential force by the total contact area,
and averaging over the rub duration. The results are depicted in Figure 12. Here, the average frictional stress decreases with increasing rub velocity for high incursion rates, while, for low incursion rates, the frictional stress slightly increases with rub velocity. This trend is the same for both seal fin geometries. While for small rub velocities of 55 m/s the incursion rate has an increasing effect on the resulting frictional stresses, this trend is not so obvious for higher rub velocities of 165 m/s. Because the total contact area is similar for both seal fin geometries (see Figure 10), the resulting friction forces are significantly lower for the perpendicular seal fin SF3, even though the contact pressure was very similar. This indicates that the forces acting on the front and rear edge are small compared to the tip forces.
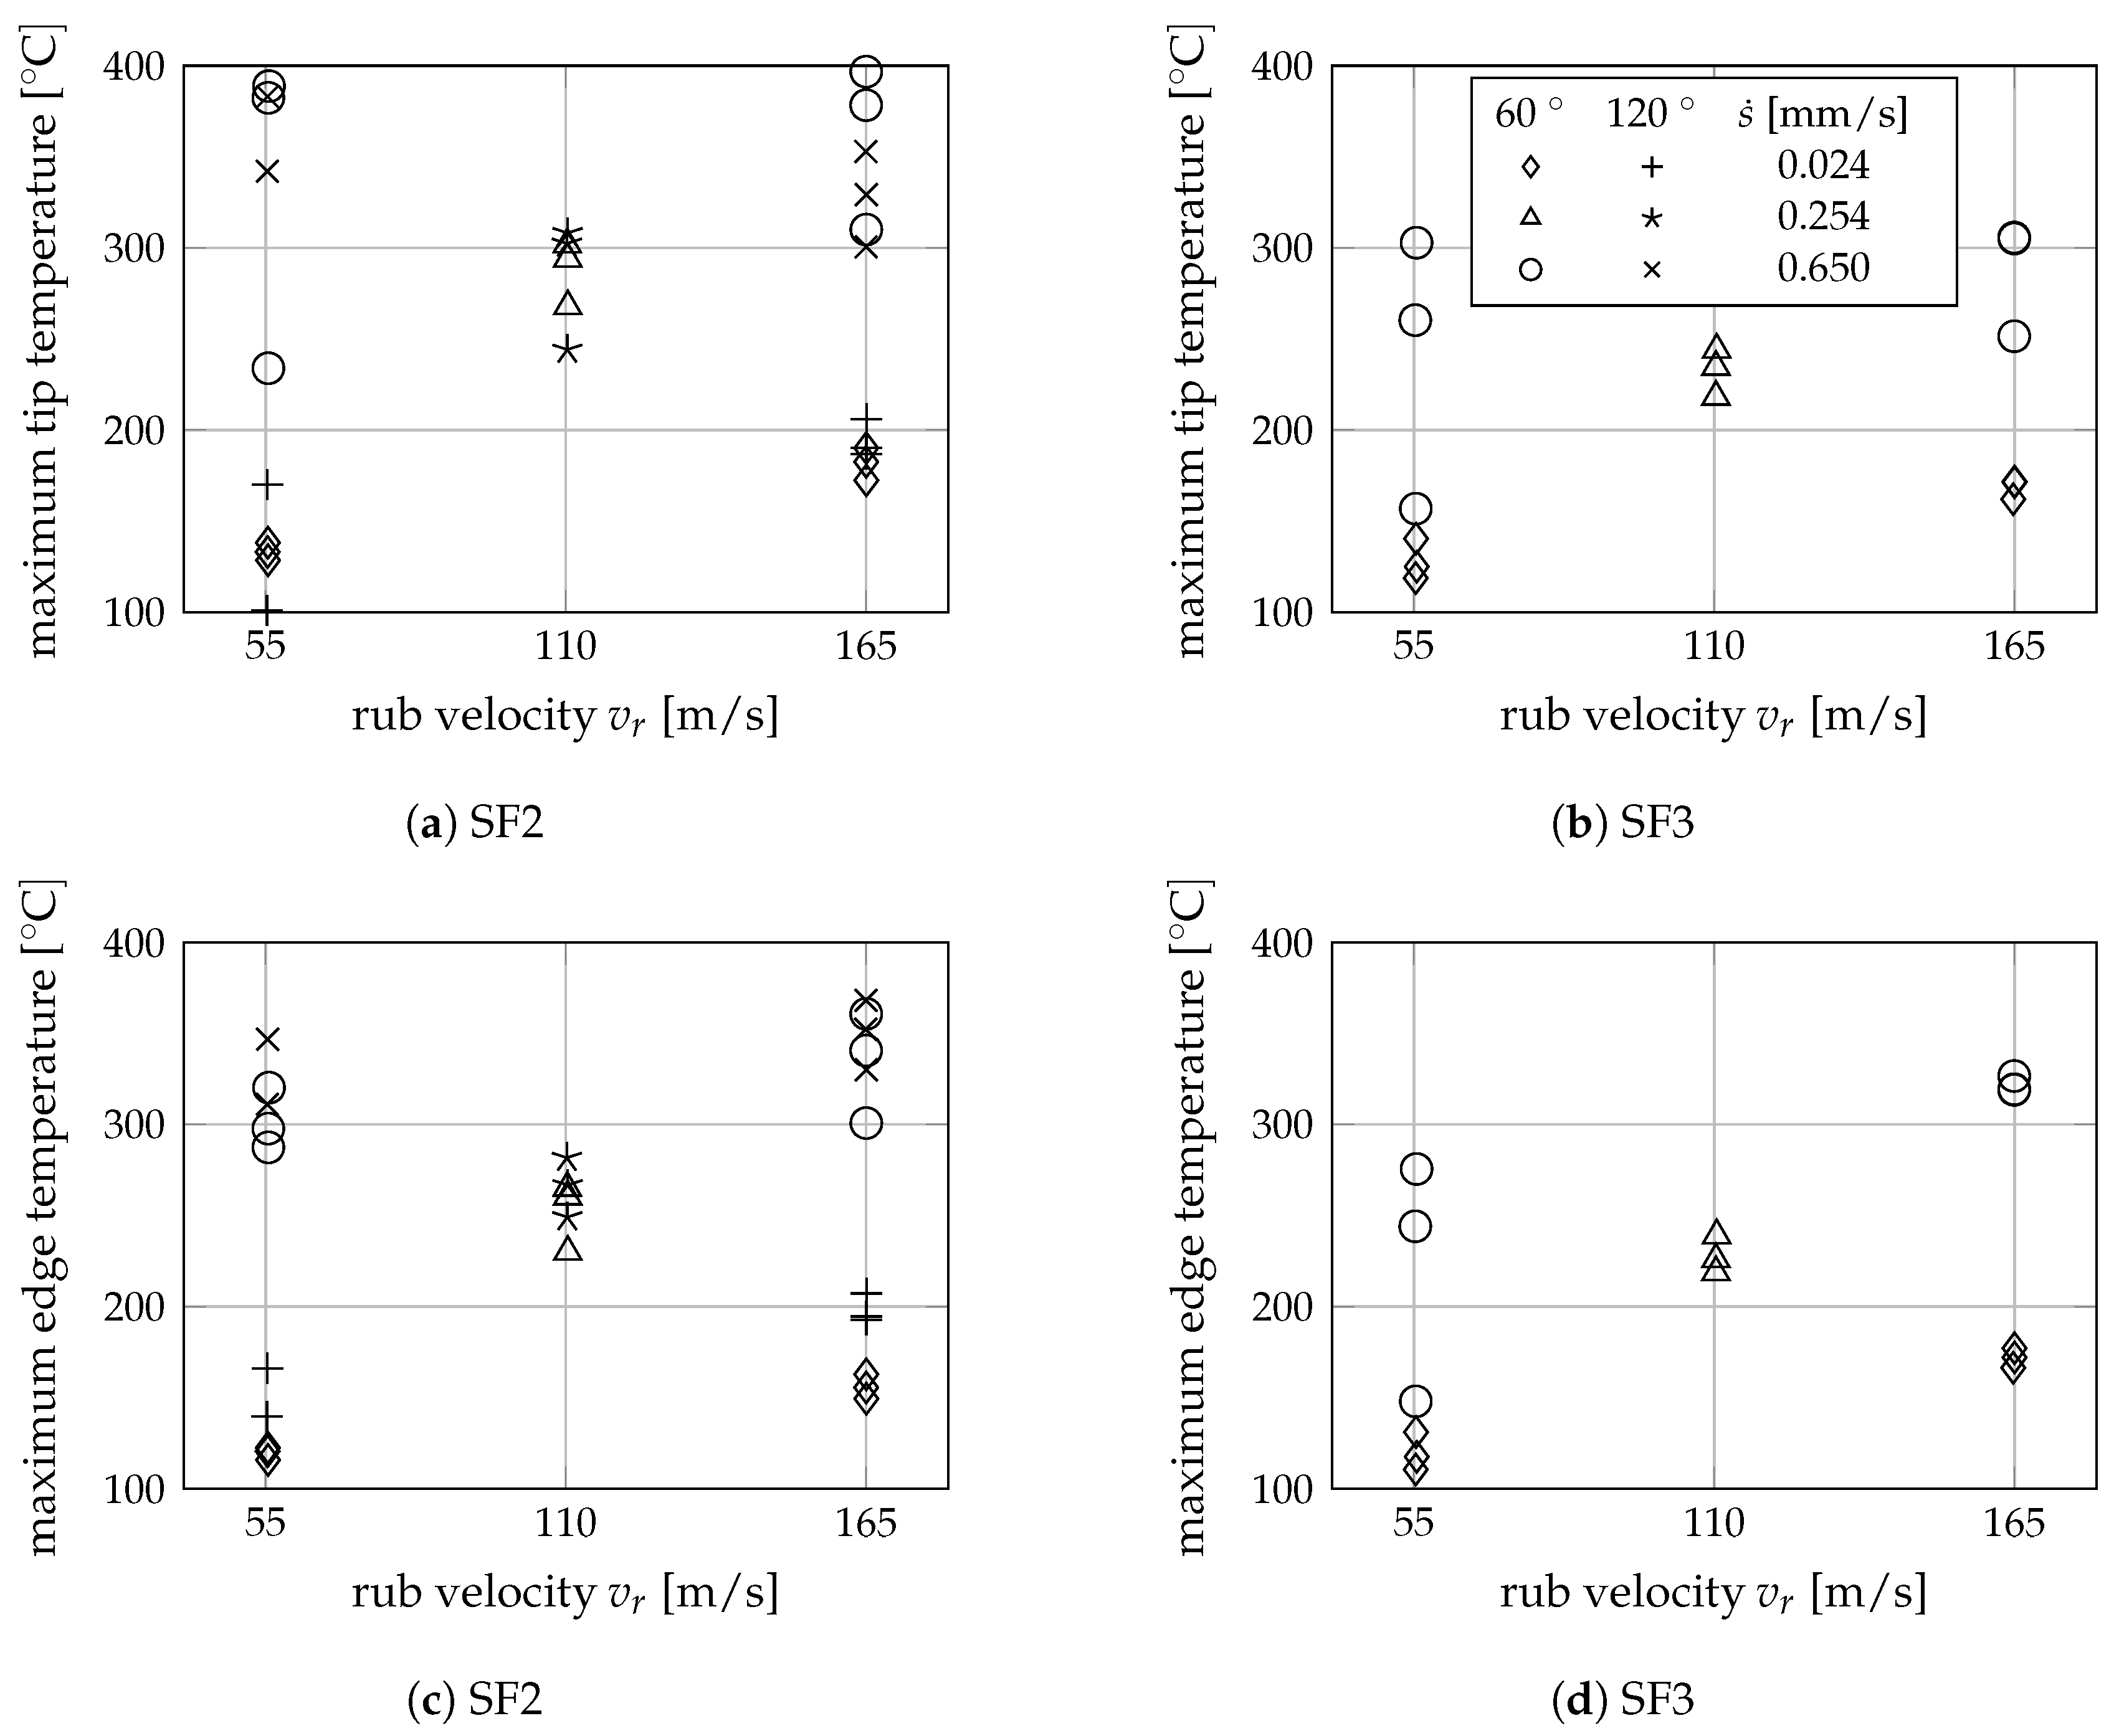
The time-averaged maximum tip and edge foil temperatures in the contact surface are plotted in Figure 13, respectively. They show very similar trends to the contact pressures in Figure 11. For high incursion rates of mm/s, the measured frictional stresses were observed to decrease with increasing rub velocity, being very similar to the frictional stresses obtained for small incursion rates at high rub velocities of 165 m/s in Figure 12. This suggests that the resulting friction temperatures on the foil are rather more proportional to the resulting contact pressures than to the resulting frictional stresses. Further studies are required to explain this unexpected trend. For the lowest incursion rate of mm/s, the fin tip and edge temperatures seem to be very similar for both the perpendicular and the inclined seal fin. For higher incursion rates, the maximum tip temperatures in the contact zone are slightly higher than the maximum edge temperatures (approximately 25 to 50 ). The tip temperatures are almost identical for the inclined seal fin SF2 for both foil orientations of 60° and 120 in Figure 13a. Both tip and edge temperatures seem to be about 50 lower for the perpendicular seal fin than for the inclined seal fin, irrespective of the rub scenario. This may be related to the effect of plastic deformation, which is slightly different for both seal fin geometries (see Figure 5). Overall, the metal foil friction temperatures measured for the slanted foil orientation are significantly smaller than for the parallel foil orientation, which were always beyond 700 in the contact region.
To get an indication on the amount of abrasive wear to total wear , a total wear volume was defined, such that the rub groove geometry corresponds to the seal fin geometry at the end of the rub process (see Figure 9). By converting the global weight loss determined for the metal foil into an equivalent volume using the material’s density, a resulting wear ratio can be obtained. It indicates the amount of abrasive wear to total wear, similar to the tests with parallel metal foil orientation. As the total volume of the rub groove is much smaller for the perpendicular seal fin SF3, the measurement error for the weight loss is larger, making interpretation more difficult. The wear ratios determined for mm metal foil thickness are shown in Figure 14. Different trends can be observed for both seal fin geometries. For the inclined seal fin SF2, the percentage of abrasive wear seems to be a function of the rub velocity, similar to what was observed for the tests with parallel foil orientation. For the perpendicular seal fin SF3, the rub velocity only seems to affect the wear ratio for high incursion rates of mm/s. This consideration disregards the amount of adhesive wear observed during the experiments.
Overall, Figure 11, Figure 12, Figure 13 and Figure 14 demonstrate the repeatability of the rub tests, which allows for identification of the effect of rub scenario, fin geometry, and foil orientation. The test results for all rub scenarios suggest an interaction between the rub velocity and incursion rate, which is different for inclined and perpendicular seal fins. This indicates that the friction temperatures have an influence on the associated wear mechanisms. As discussed for the parallel rub tests [18], softening of the material and possible oxidation may decrease friction effects.
This seems to be the case only for higher average maximum foil temperatures, beyond 250 , reached for higher incursion rates. The fact that only the resulting radial force correlates with foil temperatures may indicate that a large amount of friction heat is generated by the plastic deformation processes, irrespective of the friction force. Plastic deformation of the metal foil in the contact region, depicted in Figure 5, can be observed for all rub scenarios and seal fin geometries. Especially for the inclined seal fin and the rub scenarios S3 and S1/S4 with rub velocities of 110 m/s and 165 m/s, respectively, plastic deformation wear is more pronounced than for the low rub velocities in scenario S2/S5. In fact, for low rub velocities, the metal foil was bent by the rotating seal fin for the small metal foil thicknesses of mm, suggesting lower metal foil temperatures and/or high friction forces at the side edge. In fact, this bending effect may be one possible reason explaining the trends observed for the contact and friction forces, metal foil temperatures, and wear ratios discussed previously.
The wear patterns clearly show less plastic deformation for the rub scenarios with low rub velocity, also suggesting lower friction temperatures in the contact region. These observations match the higher percentages of abrasive wear observed for these rub scenarios (Figure 14). For the inclined seal fin SF2, the plastic deformation wear on the seal fin side surface appears to be slightly different for the metal foil inclination of 60° and 120. On the one hand, this may be due to the differences in seal geometry, which was much wider and rounder for the rub tests with 120 metal foil orientation (see Figure 9). On the other hand, this difference may be due to the effect of the sharp metal foil angle restricting the heat removal from the contact zone.
Another interesting observation for the inclined seal fin SF2 is that the metal foil seems to be pushed axially towards the front edge of the seal fin during rubbing, as indicated by the slightly inclined edge of the rub groove on the front side. This is presumably due to the axial force affecting the inclined rear seal fin edge. As a consequence, the small corner radius at the front edge of the seal fin tip is also involved in the rub process, as was also indicated by the temperature field measurements on the metal foil obtained with the IR camera. The contribution of the small leading edge to the resulting axial force makes interpretation of the various force components very difficult.
3.4. Effect of Foil Thickness for Rub Scenario S3
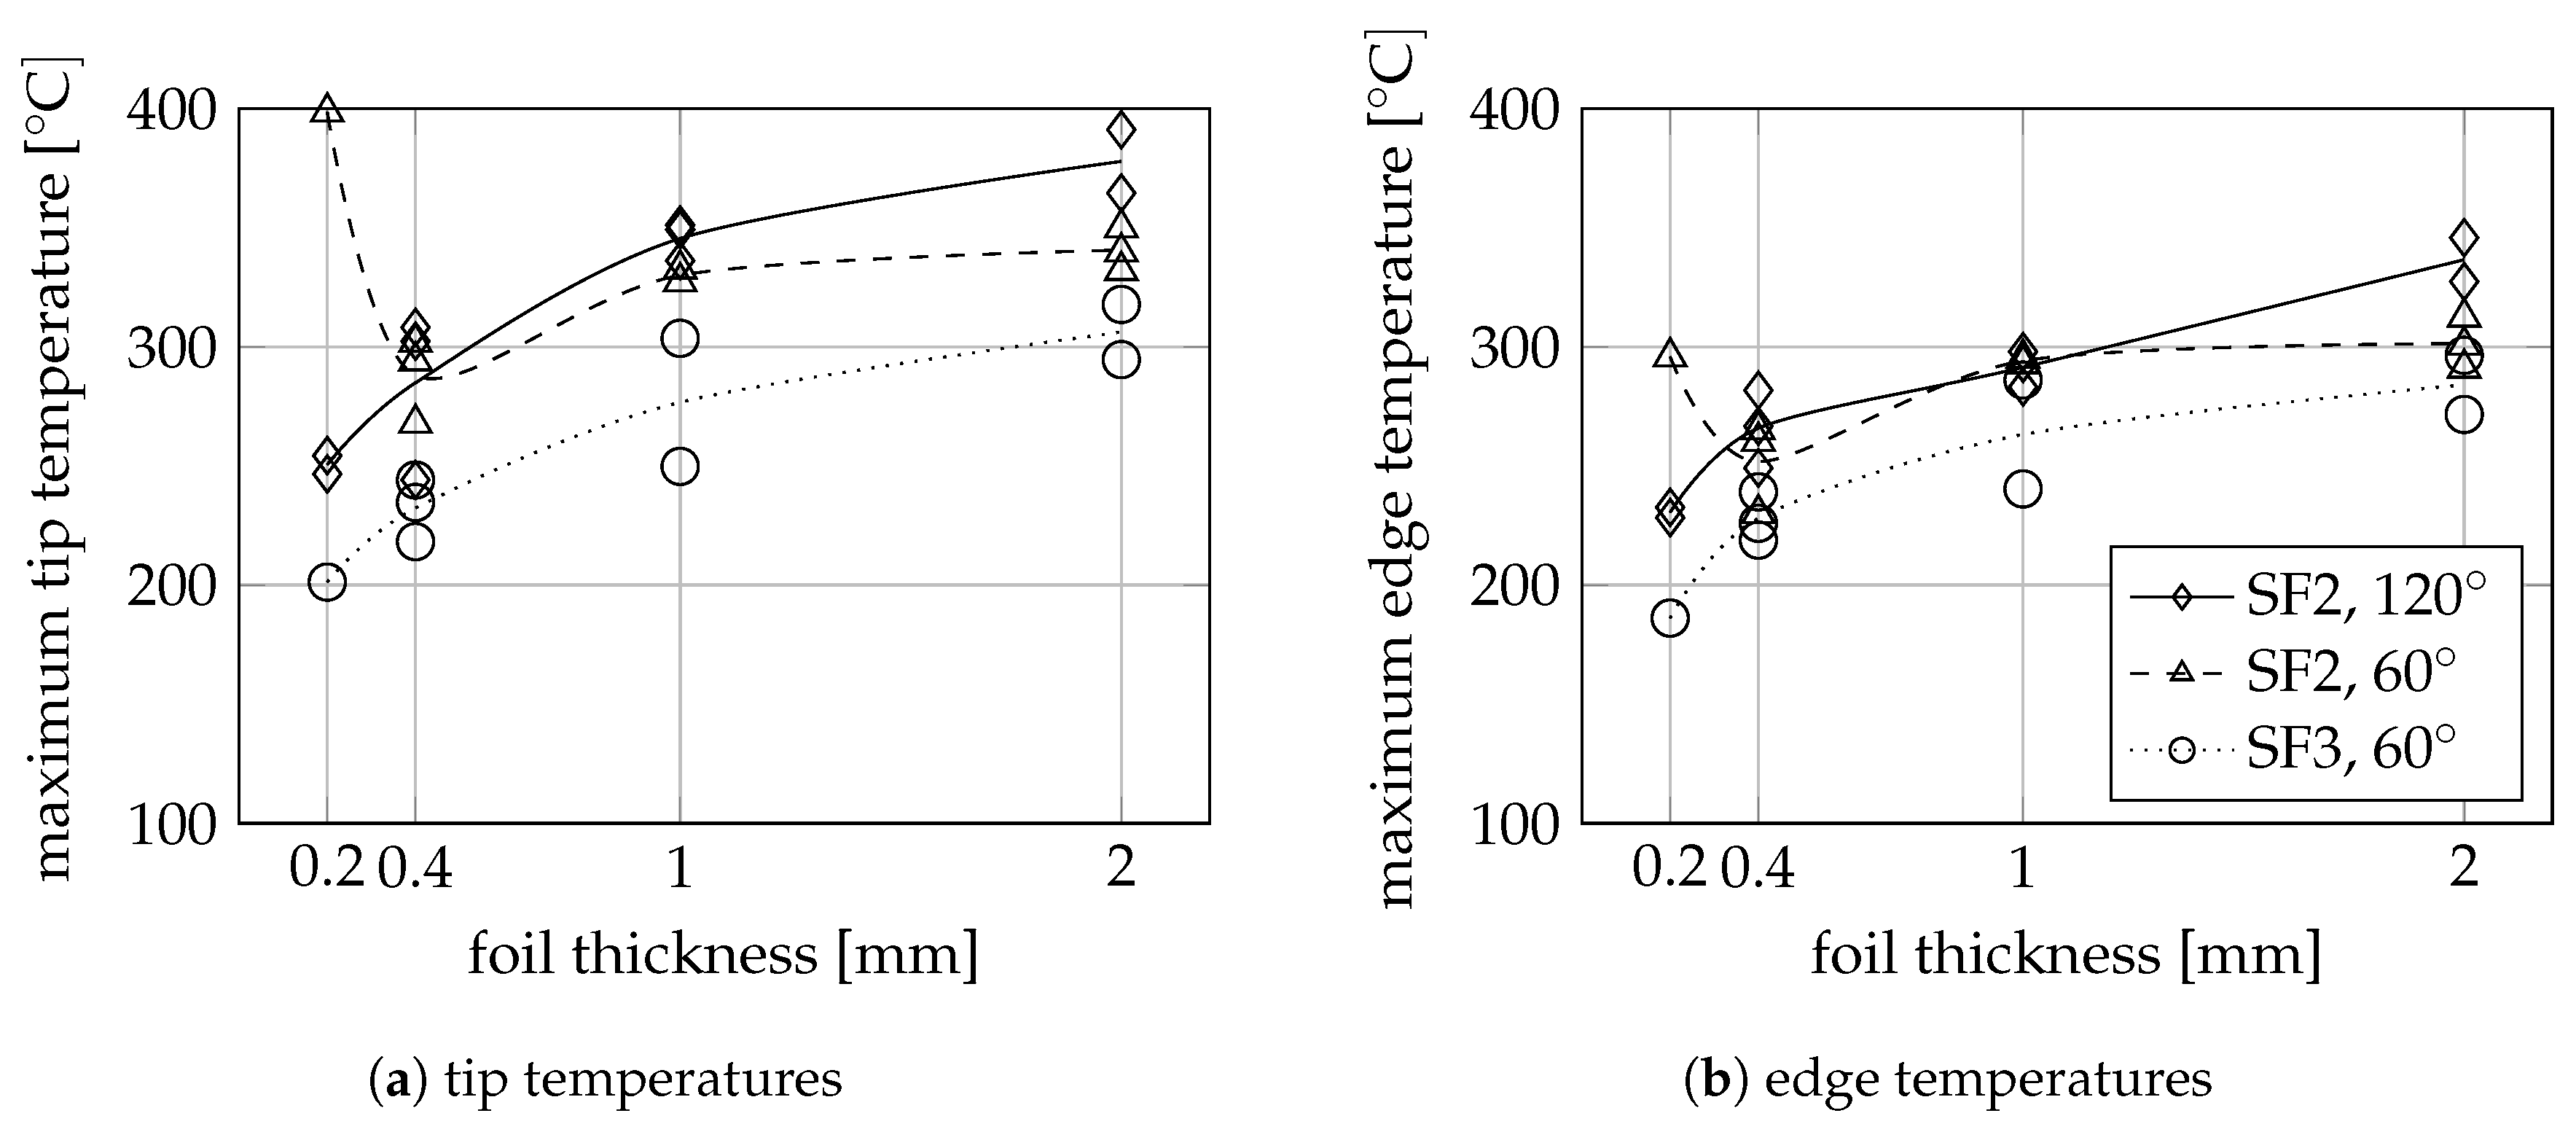
In this section, the effect of metal foil thickness on the system’s rub behavior is discussed for reference rub scenario S3. Figure 15 shows the effect of foil thickness on the averaged foil tip and edge temperatures for all combinations of seal fin geometries and foil orientations. First of all, it can be seen that the average foil temperatures increase slightly with foil thickness, true for both fin geometries and foil orientations. For example, the average foil temperature near the fin tip in Figure 15a increases by approximately 100 with a foil thickness varying from 0.2 to 2.0 mm. This can be attributed to the increase in the ratio of total friction heat to convective cooling. While the convective heat transfer coefficient approximately remains the same irrespective of the metal foil thickness, the total amount of friction heat released in the contact region increases with increasing metal foil thickness. Especially for rub tests with low rub velocity and high incursion rate, the metal foils of mm thickness occasionally bent in the direction of rotor rotation. Therefore, the high temperatures measured for seal fin SF2 with 60 metal foil orientation at mm metal foil thickness may be an outlier. For all metal foil thicknesses, the metal foil temperatures are about 30 to 50 lower for the perpendicular seal fin SF3 compared to the inclined seal fin SF2 at both the fin tip and fin edge, as observed previously. For the inclined seal fin SF2, the temperatures on the rear edge are approximately 30 to 50 lower than at the seal fin tip. For the perpendicular seal fin SF3, however, the temperatures are very similar at the fin tip and edge.
Similar trends to the metal foil temperatures can be observed for the ratio of abrasive wear to total wear, which also increases with foil thickness, as shown in Figure 16. Only for the thinnest foils ( mm) does abrasive wear seem to increase significantly. However, it must also be pointed out that the measurement uncertainty increases with decreasing foil thickness, as the mg resolution of the scales was too low to resolve small material losses of only a few milligrams (for example, 2 mg for SF2 and 120 and 1 mg for SF3 with mm foil thickness). As opposed to the parallel rub tests, where the wear ratio is significantly lower, with about 0 and 0.2, the amount of abrasive wear for metal foil thickness 0.4 mm is higher for the slanted foil orientation. For large and small foil thicknesses (2 mm and 0.2 mm), the amount even increases. The smaller amount of plastic wear for the slanted rub tests with respect to the parallel rub tests may be attributed to the lower friction temperatures and hence higher plastic yield limit. As a consequence, abrasive wear is more important. The same explanation applies to the larger plastic wear observed for the hotter inclined SF2 with respect to the perpendicular SF3. It is interesting to note that, in contrast to the rub tests with parallel metal foil orientation, an increase in the metal foil friction temperatures does not seem to result in an increase in plastic deformation wear.
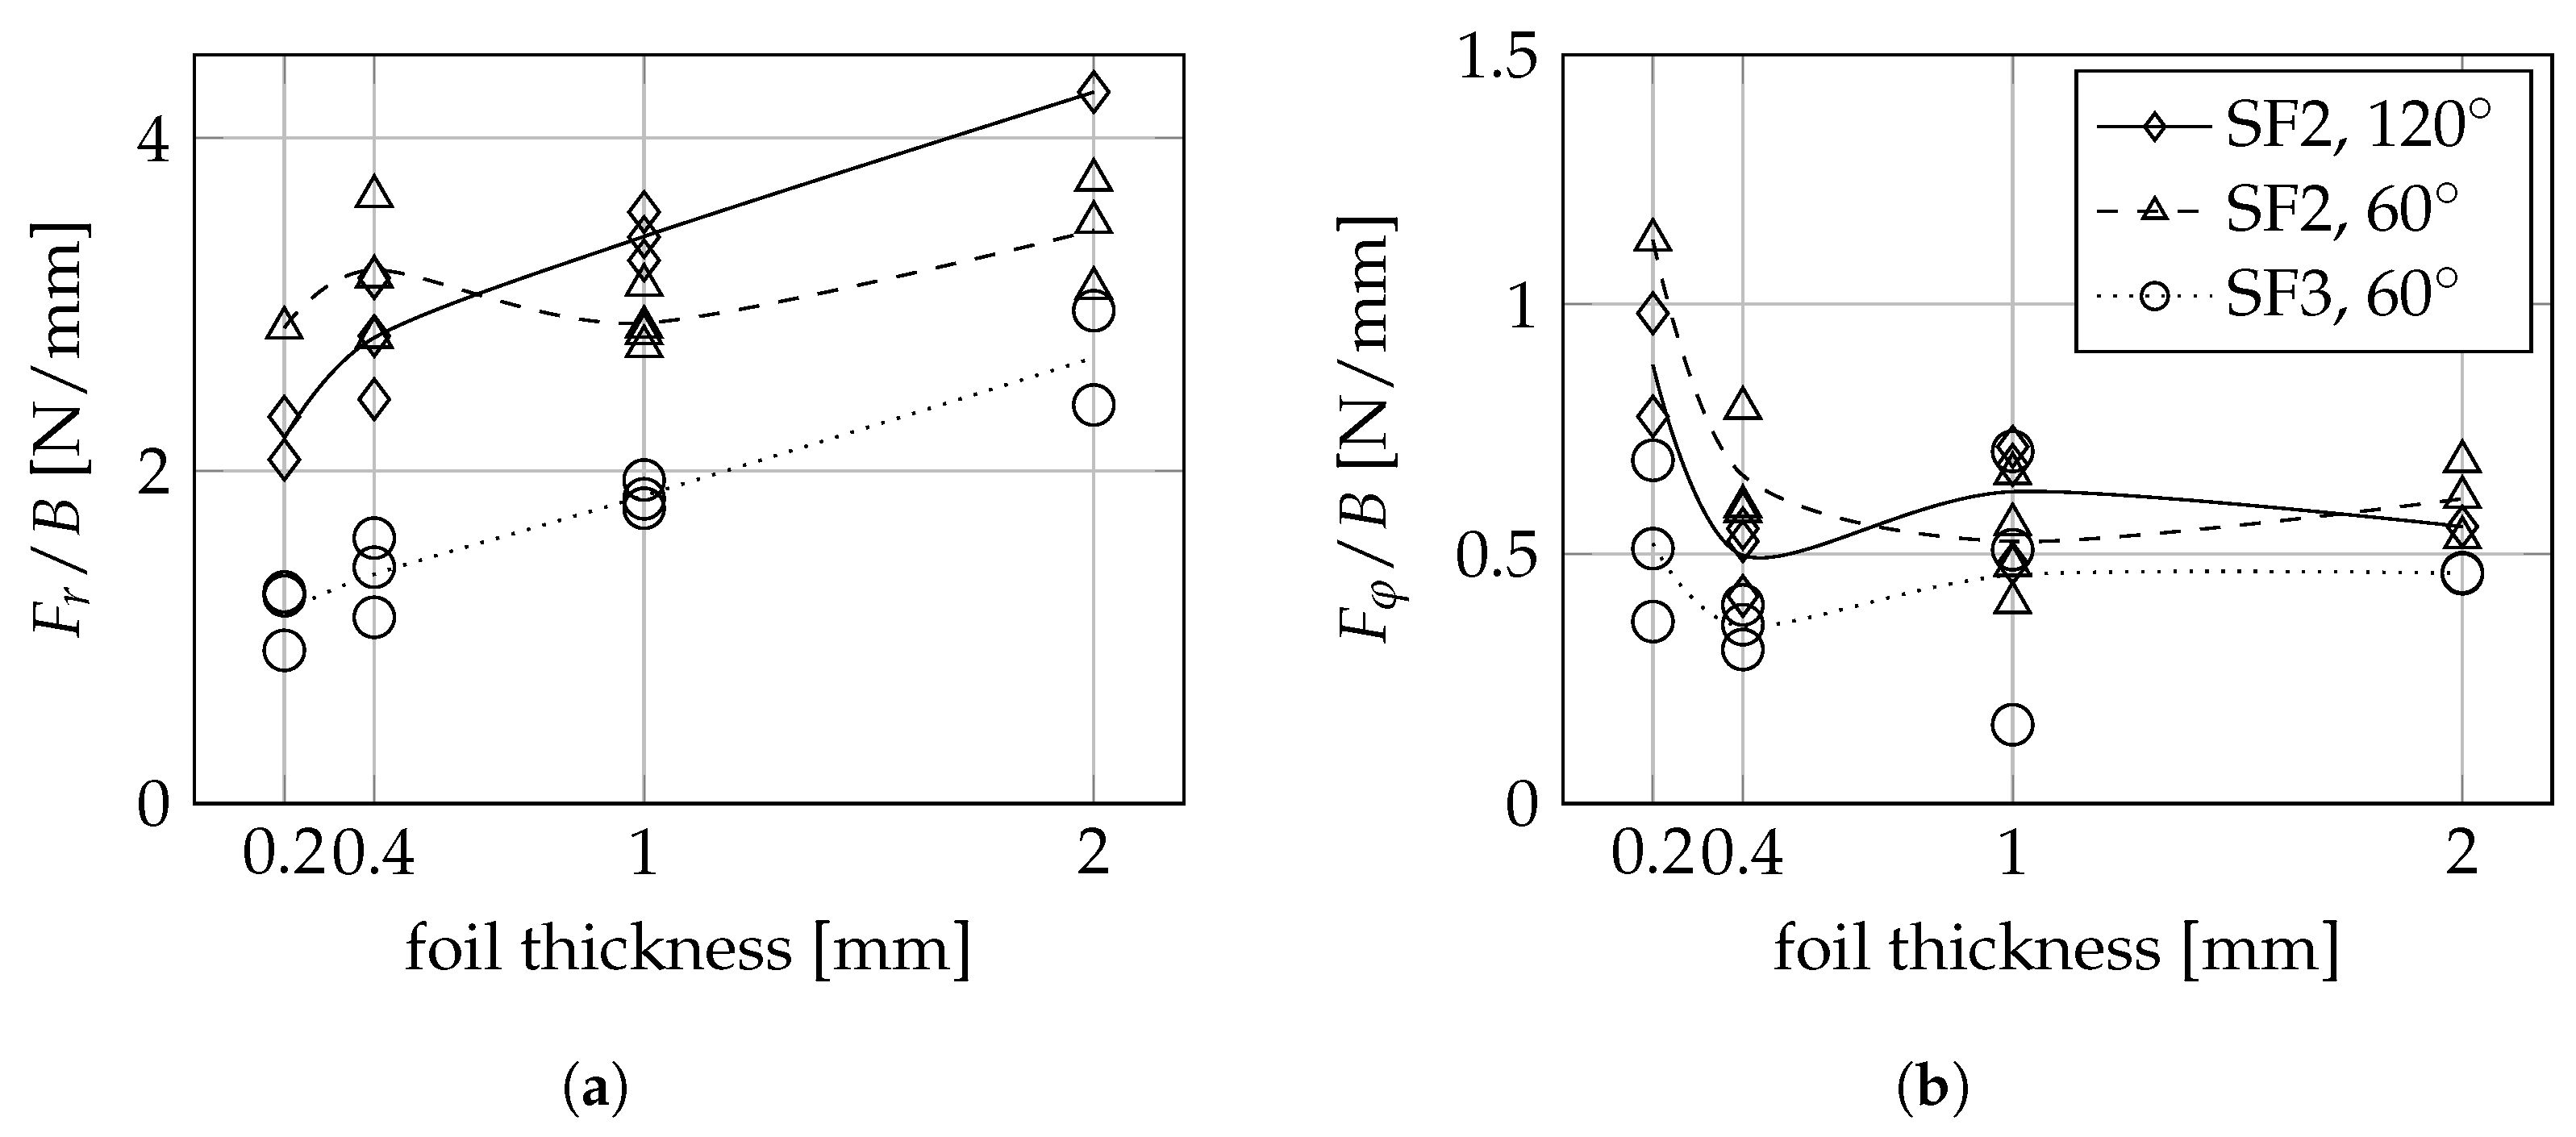
Figure 17 shows the measured time-averaged forces divided by the foil thickness B for rub scenario S3 and for all foil thicknesses. Similar to the foil temperatures, the normalized radial force increases with foil thickness B, again indicating a correlation (Figure 17a). A different behavior can be seen for the time-averaged tangential forces. They decrease with increasing foil thickness and seem to approach a steady state (Figure 17b). Overall, the forces divided by foil thickness are smaller for the perpendicular seal fin SF3. According to Figure 10, the total nominal contact area for the perpendicular SF3 is slightly larger than for the inclined SF2, as both the front and rear fin edge are in contact simultaneously. As a consequence, it is surprising that the normalized tangential force is smallest for the perpendicular SF3 in Figure 17b.
4. Conclusions of Rub Testing
A large number of rub tests were performed on a simplified system using individual metal foils to improve understanding of the effects and interactions of rub and wear phenomena in labyrinth seal fins rubbing into a honeycomb liner. The metal foils were rubbed against the seal fin with slanted (60° and 120) orientation, and the results were discussed and compared with already published results for the parallel orientation. Wear of the seal fin due to rubbing was negligibly small for the rub tests run on the rub test rig.
Overall, the rub test results demonstrate a strong interaction between the contact forces, friction temperatures, and wear. For the parallel metal foil orientation, the maximum friction temperatures in the contact region were very similar for all rub scenarios around 800 . More efficient heat removal from the contact region through solid-body heat conduction into the surrounding metal foil for the slanted orientation leads to much lower maximum friction temperatures, between 100 to 400 . These large differences in friction temperatures for both the parallel and slanted metal foil orientation lead to different rub and wear mechanisms. For example, different friction temperatures in the contact surface may lead to different local friction coefficients, heat transfer through the thermal contact, or different wear coefficients.
Only one contact area for the parallel orientation enables direct correlation of the resulting contact pressures, friction shear stresses, friction temperatures, and resulting wear, giving insight into the physical processes taking place. The interpretation of the rub tests with a slanted metal foil orientation relies on distinguishing the local effects on each individual macroscopic contact surface. Careful determination of the evolution of both the contact surfaces and the volume of material covered by the groove are necessary for quantification of the tribological system’s behavior. The simplified setup with parallel foil orientation is therefore well suited for basic rub tests for material characterization.
Modeling the rub event is indispensable in understanding the physical processes and quantifying the various tribological parameters. Simulations of the rub test configuration with slanted metal foil orientation are required in order to enable interpretation of the results. Therefore, an adaptation of the model for parallel foil configuration (as described in [22]) is planned. Tests with more realistic material combinations, such as Inconel Alloy 718 and Hastelloy X, are planned for the simplified test rig. Also, rub tests on honeycomb liner segments will be performed and compared to the results for individual foil rubbing.
Author Contributions
O.M. wrote the paper. T.P. performed the experiments and analyzed the data. C.S. contributed to the the analysis of the experiment and assisted with writing the manuscript. H.-J.B. initialized the study and acted as a project leader.
Funding
The experimental investigations were carried out in the FP7 E-BREAK project under grant agreement no. 314366.
Conflicts of Interest
The authors declare no conflict of interest.
Nomenclature
| A | area |
| B | metal foil thickness |
| F | force |
| p | pressure |
| s | radial incursion |
| incursion rate | |
| final incursion depth | |
| t | time |
| T | temperature |
| rub velocity | |
| V | volume |
| w | wear |
| stress |
Subscripts
| a | abrasive |
| C | contact |
| edge | edge of seal fin |
| f | frictional |
| ml | material loss |
| rad | radial |
| tip | seal fin tip |
| tot | total |
| tangential |
Abbreviations
| IR | infrared |
| LE | leading edge |
| S1–S5 | rub scenario 1–5 |
| SF | seal fin |
| TE | trailing edge |
References
- Chupp, R.E.; Hendricks, R.C.; Lattime, S.B.; Steinetz, B.M. Sealing in Turbomachinery. J. Propuls. Power 2006, 22, 313–349. [Google Scholar] [CrossRef]
- Braun, E.; Dullenkopf, K.; Bauer, H.J. Optimization of Labyrinth Seal Performance Combining Experimental, Numerical and Data Mining Methods. In Proceedings of the ASME Turbo Expo 2012: Turbine Technical Conference and Exposition, Copenhagen, Denmark, 11–15 June 2012; p. 1847. [Google Scholar]
- Schramm, V.; Willenborg, K.; Kim, S.; Wittig, S. Influence of a Honeycomb Facing on the Flow through a Stepped Labyrinth Seal. In Proceedings of the ASME Turbo Expo 2000: Power for Land, Sea and Air, Munich, Germany, 8–11 May 2000; p. V003T01A092. [Google Scholar]
- Pychynski, T.; Dullenkopf, K.; Bauer, H.J. Theoretical Study on the Origin of Radial Cracks in Labyrinth Seal Fins due to Rubbing. In Proceedings of the ASME Turbo Expo 2013: Turbine Technical Conference and Exposition, San Antonio, TX, USA, 3–7 June 2013; p. V07AT27A006. [Google Scholar]
- Potter, D.J.; Chai, Y.W.; Tatlock, G.J. Improvements in honeycomb abradable seals. Mater. High Temp. 2009, 26, 127–135. [Google Scholar] [CrossRef]
- Bill, R.C.; Ludwig, L.P. Wear of seal materials used in aircraft propulsion systems. Wear 1980, 59, 165–189. [Google Scholar] [CrossRef] [Green Version]
- Ma, H.; Yin, F.; Guo, Y.; Tai, X.; Wen, B. A review on dynamic characteristics of blade—Casing rubbing. Nonlinear Dyn. 2016, 84, 437–472. [Google Scholar] [CrossRef]
- Bill, R.C.; Shiembob, L.T. Friction and Wear of Sintered Fibermetal Abradable Seal Materials. J. Lubr. Technol. 1977, 99, 421. [Google Scholar] [CrossRef]
- Dowson, P.; Ross, S.L.; Schuster, C. The investigation of suitability of abradable seal materials for application in centrifugal compressors and steam turbines. In Proceedings of the Twentieth Turbomachinery Symposium; Turbomachinery Laboratory, Texas A&M University: College Station, TX, USA; pp. 77–90.
- Mutasim, Z.; Hsu, L.; Wong, E. Evaluation of plasma sprayed abradable coatings. Surf. Coat. Technol. 1992, 54–55, 39–44. [Google Scholar] [CrossRef]
- Ghasripoor, F.; Turnquist, N.A.; Kowalczyk, M.; Couture, B. Wear Prediction of Strip Seals through Conductance. In Proceedings of the ASME Turbo Expo 2004: Power for Land, Sea and Air, Vienna, Austria, 14–17 June 2004; pp. 331–337. [Google Scholar]
- Sporer, D.R.; Shiembob, L.T. Alloy Selection for Honeycomb Gas Path Seal Systems. In Proceedings of the ASME Turbo Expo 2004: Power for Land, Sea and Air, Vienna, Austria, 14–17 June 2004; pp. 763–774. [Google Scholar]
- Rathmann, U.; Olmes, S.; Simeon, A. Sealing Technology: Rub Test Rig for Abrasive/Abradable Systems. In Proceedings of the ASME Turbo Expo 2007: Power for Land, Sea and Air, Montreal, QC, Canada, 14–17 May 2007; pp. 223–228. [Google Scholar]
- Herrmann, N.; Dullenkopf, K.; Bauer, H.J. Flexible Seal Strip Design for Advanced Labyrinth Seals in Turbines. In Proceedings of the ASME Turbo Expo 2013: Turbine Technical Conference and Exposition, San Antonio, TX, USA, 3–7 June 2013; p. V05BT25A035. [Google Scholar]
- Delebarre, C.; Wagner, V.; Paris, J.Y.; Dessein, G.; Denape, J.; Gurt-Santanach, J. An experimental study of the high speed interaction between a labyrinth seal and an abradable coating in a turbo-engine application. Wear 2014, 316, 109–118. [Google Scholar] [CrossRef] [Green Version]
- Delebarre, C.; Wagner, V.; Paris, J.Y.; Dessein, G.; Denape, J.; Gurt-Santanach, J. Tribological characterization of a labyrinth-abradable interaction in a turbo engine application. Wear 2017, 370–371, 29–38. [Google Scholar] [CrossRef]
- Zhang, N.; Xuan, H.J.; Guo, X.J.; Guan, C.P.; Hong, W.R. Investigation of high-speed rubbing behavior of labyrinth-honeycomb seal for turbine engine application. J. Zhejiang Univ. Sci. A 2016, 17, 947–960. [Google Scholar] [CrossRef] [Green Version]
- Pychynski, T.; Höfler, C.; Bauer, H.J. Experimental Study on the Friction Contact Between a Labyrinth Seal Fin and a Honeycomb Stator. ASME J. Eng. Gas Turbines Power 2015, 138, 062501. [Google Scholar] [CrossRef]
- Fischer, T.; Welzenbach, S.; Meier, F.; Werner, E.; kyzy, S.U.; Munz, O. Modeling the rubbing contact in honeycomb seals. Contin. Mech. Thermodyn. 2018, 30, 381–395. [Google Scholar] [CrossRef]
- Welzenbach, S.; Fischer, T.; Meier, F.; Werner, E.; kyzy, S.U.; Munz, O. Temperature distribution of a simplified rotor due to a uniform heat source. Contin. Mech. Thermodyn. 2018, 30, 279–290. [Google Scholar] [CrossRef]
- Ochs, M.; Schulz, A.; Bauer, H.J. High dynamic range infrared thermography by pixelwise radiometric self calibration. Infrared Phys. Technol. 2010, 53, 112–119. [Google Scholar] [CrossRef]
- Munz, O.; Schwitzke, C.; Bauer, H.J.; Welzenbach, S.; Fischer, T.; Ulan Kyzy, S. Modelling the Rubbing Process in Labyrinth Seals. In Proceedings of the GPPS Forum 18, Zurich, Switzerland, 10–12 January 2018. [Google Scholar]
Figure 1.
Schematic drawing of a honeycomb liner and extreme positions of a labyrinth seal fin, modified according to [18].
Figure 1.
Schematic drawing of a honeycomb liner and extreme positions of a labyrinth seal fin, modified according to [18].
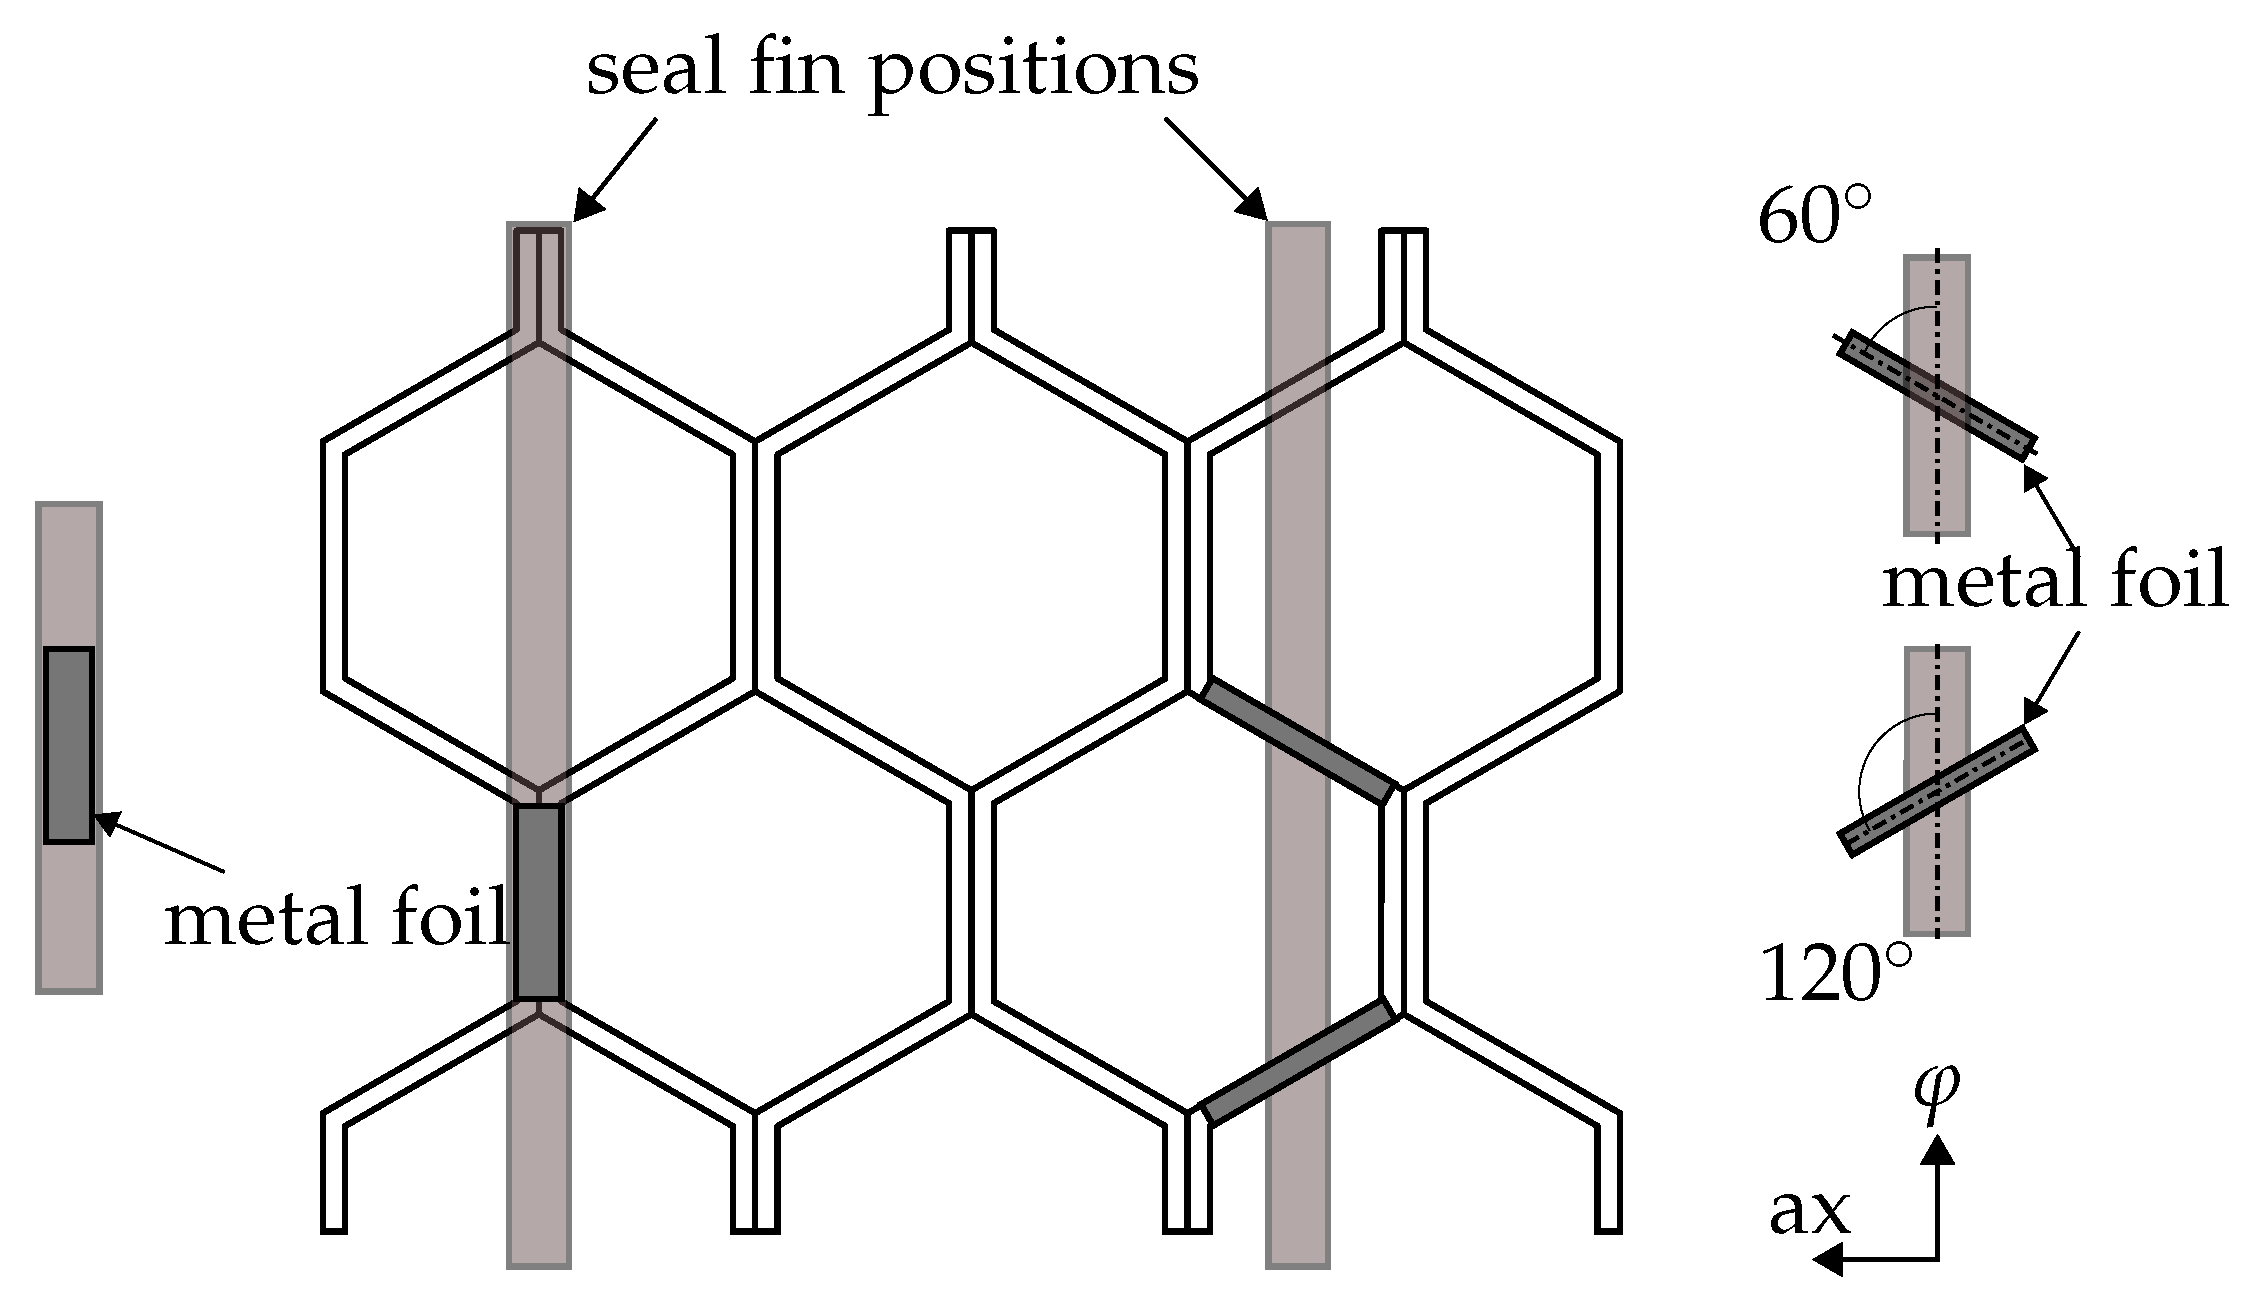
Figure 2.
Setup of the test rig: A traversing cross head causes the radial incursion of the metal foil onto the five possible seal fins with two different geometries (slanted SF2, perpendicular SF3).
Figure 2.
Setup of the test rig: A traversing cross head causes the radial incursion of the metal foil onto the five possible seal fins with two different geometries (slanted SF2, perpendicular SF3).
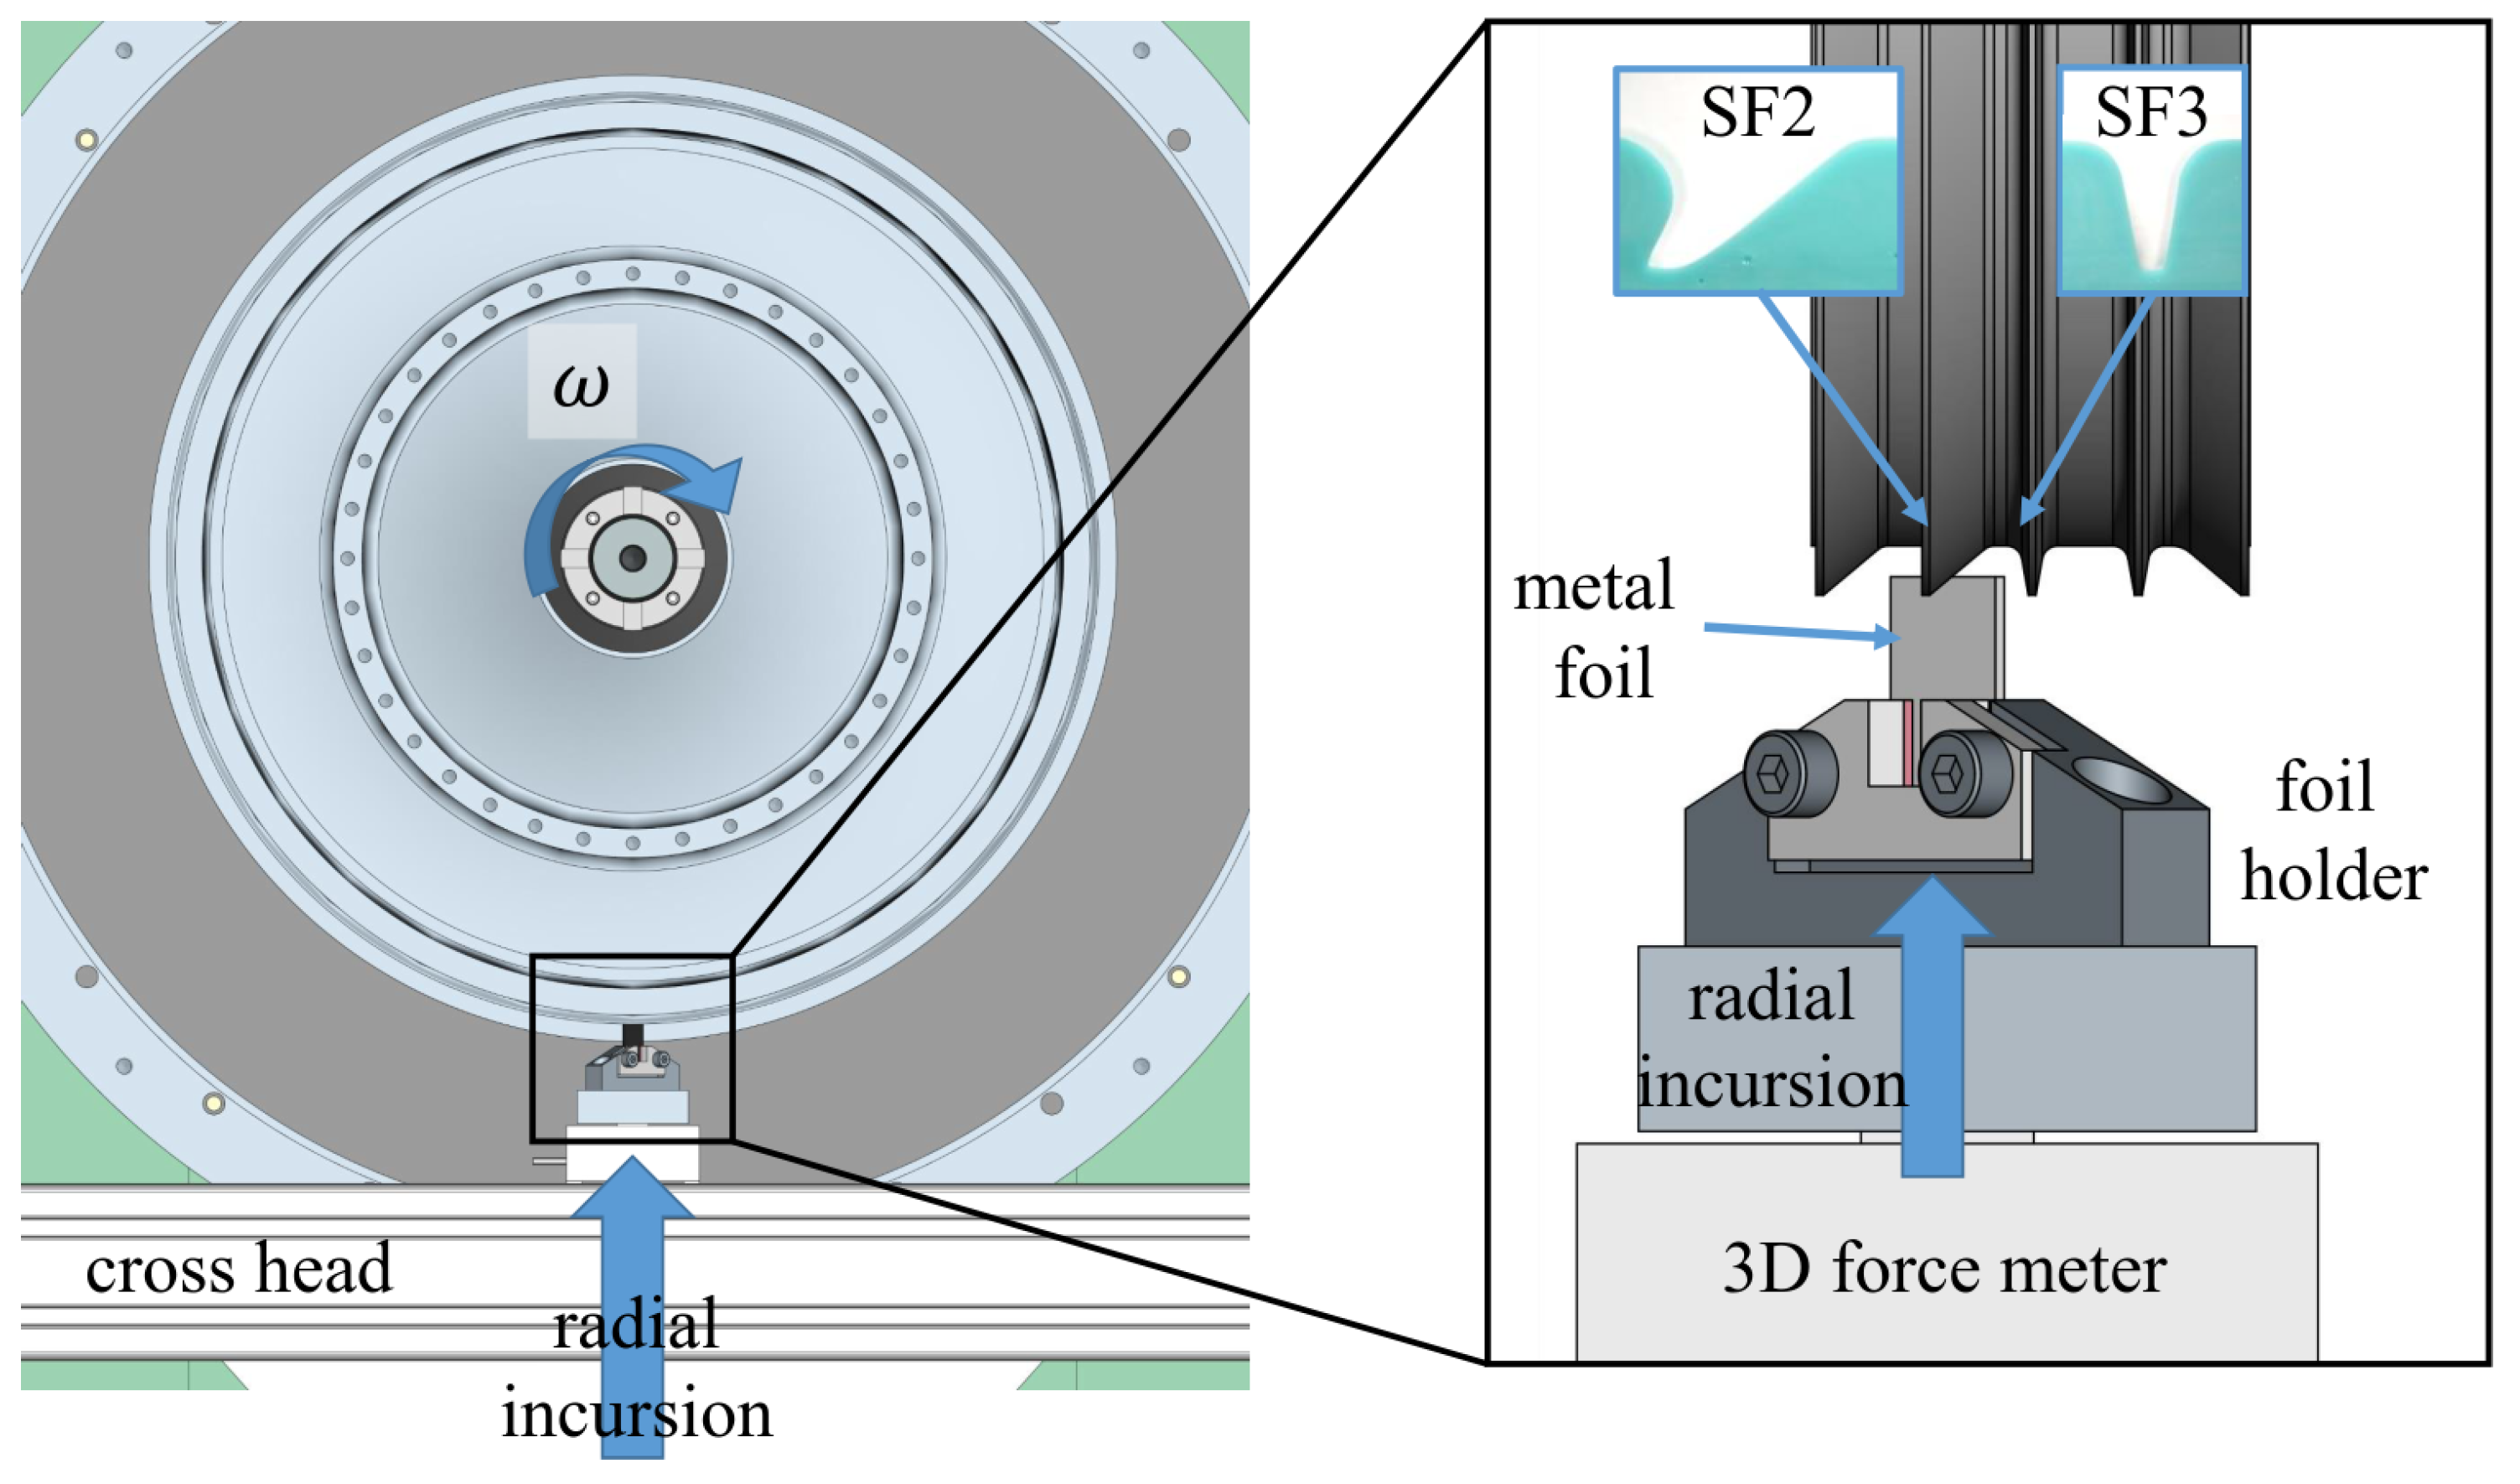
Figure 3.
(a) Typical incursion profile; (b) test matrix for all five rub scenarios (S1–S5) with varying incursion rate and rub velocity , modified according to [18].
Figure 3.
(a) Typical incursion profile; (b) test matrix for all five rub scenarios (S1–S5) with varying incursion rate and rub velocity , modified according to [18].

Figure 4.
Geometrical contact conditions for the inclined seal fin (SF2) in 60 and 120 configuration, the perpendicular seal fin (SF3).
Figure 4.
Geometrical contact conditions for the inclined seal fin (SF2) in 60 and 120 configuration, the perpendicular seal fin (SF3).
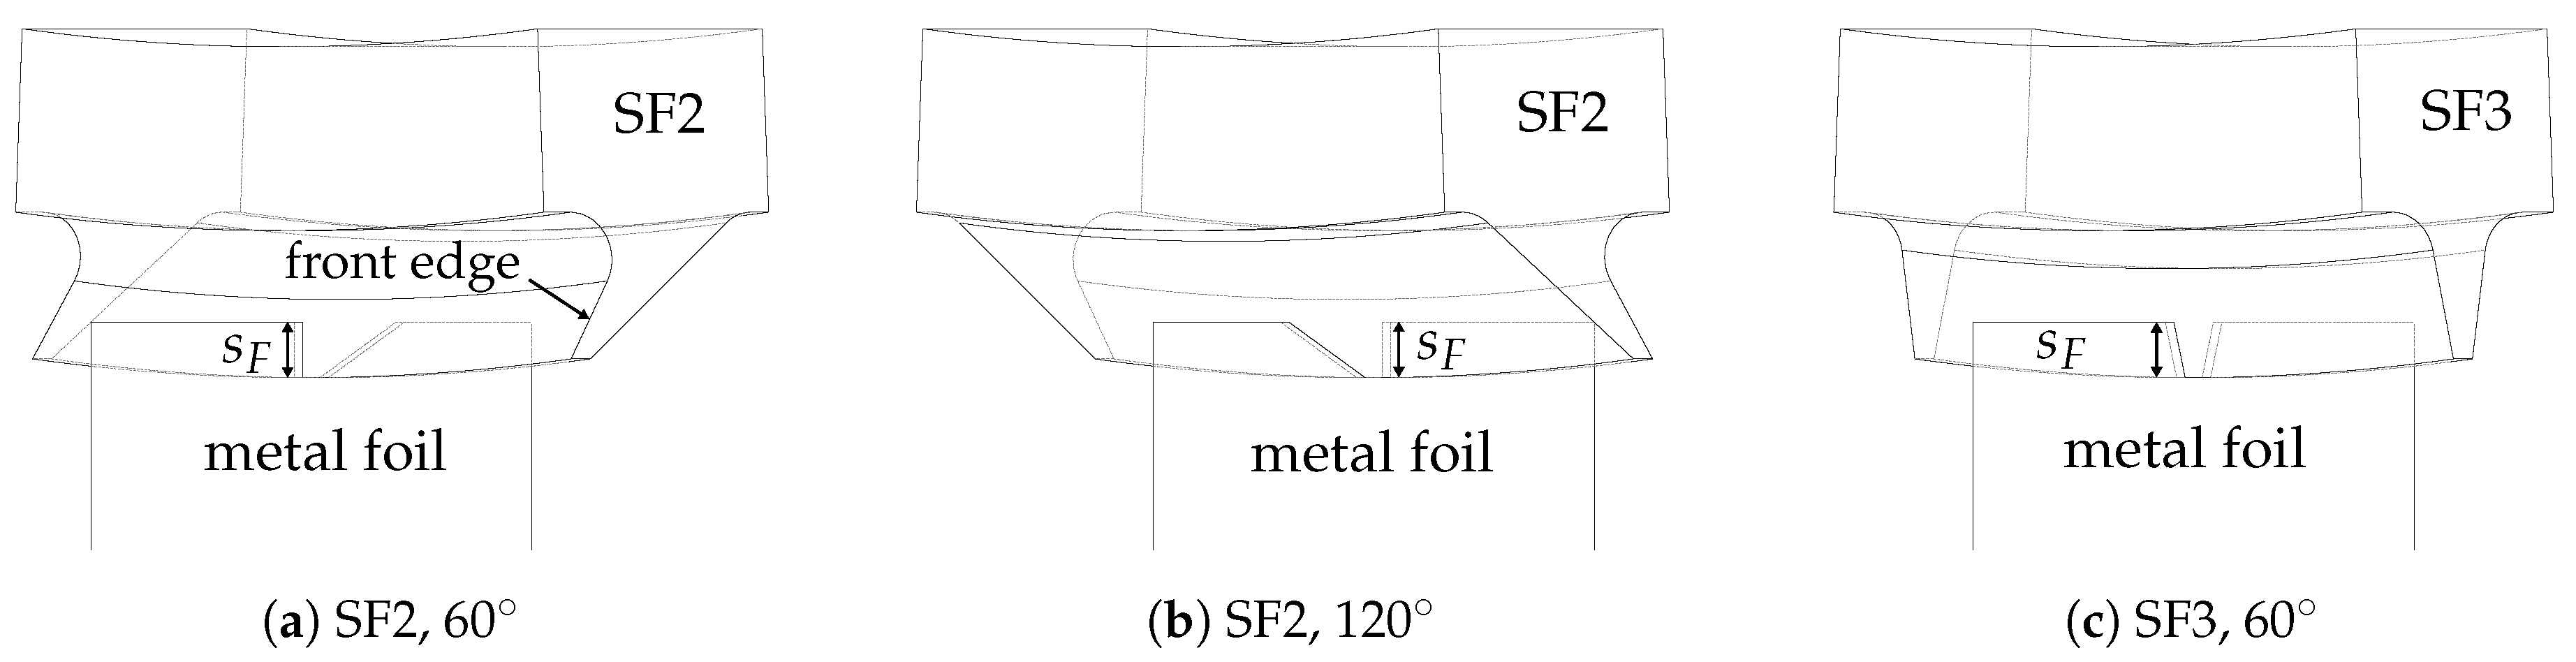
Figure 5.
Top and front view of worn metal foils after rubbing, L—left, R—right, LE—leading edge, TE—trailing edge.
Figure 5.
Top and front view of worn metal foils after rubbing, L—left, R—right, LE—leading edge, TE—trailing edge.
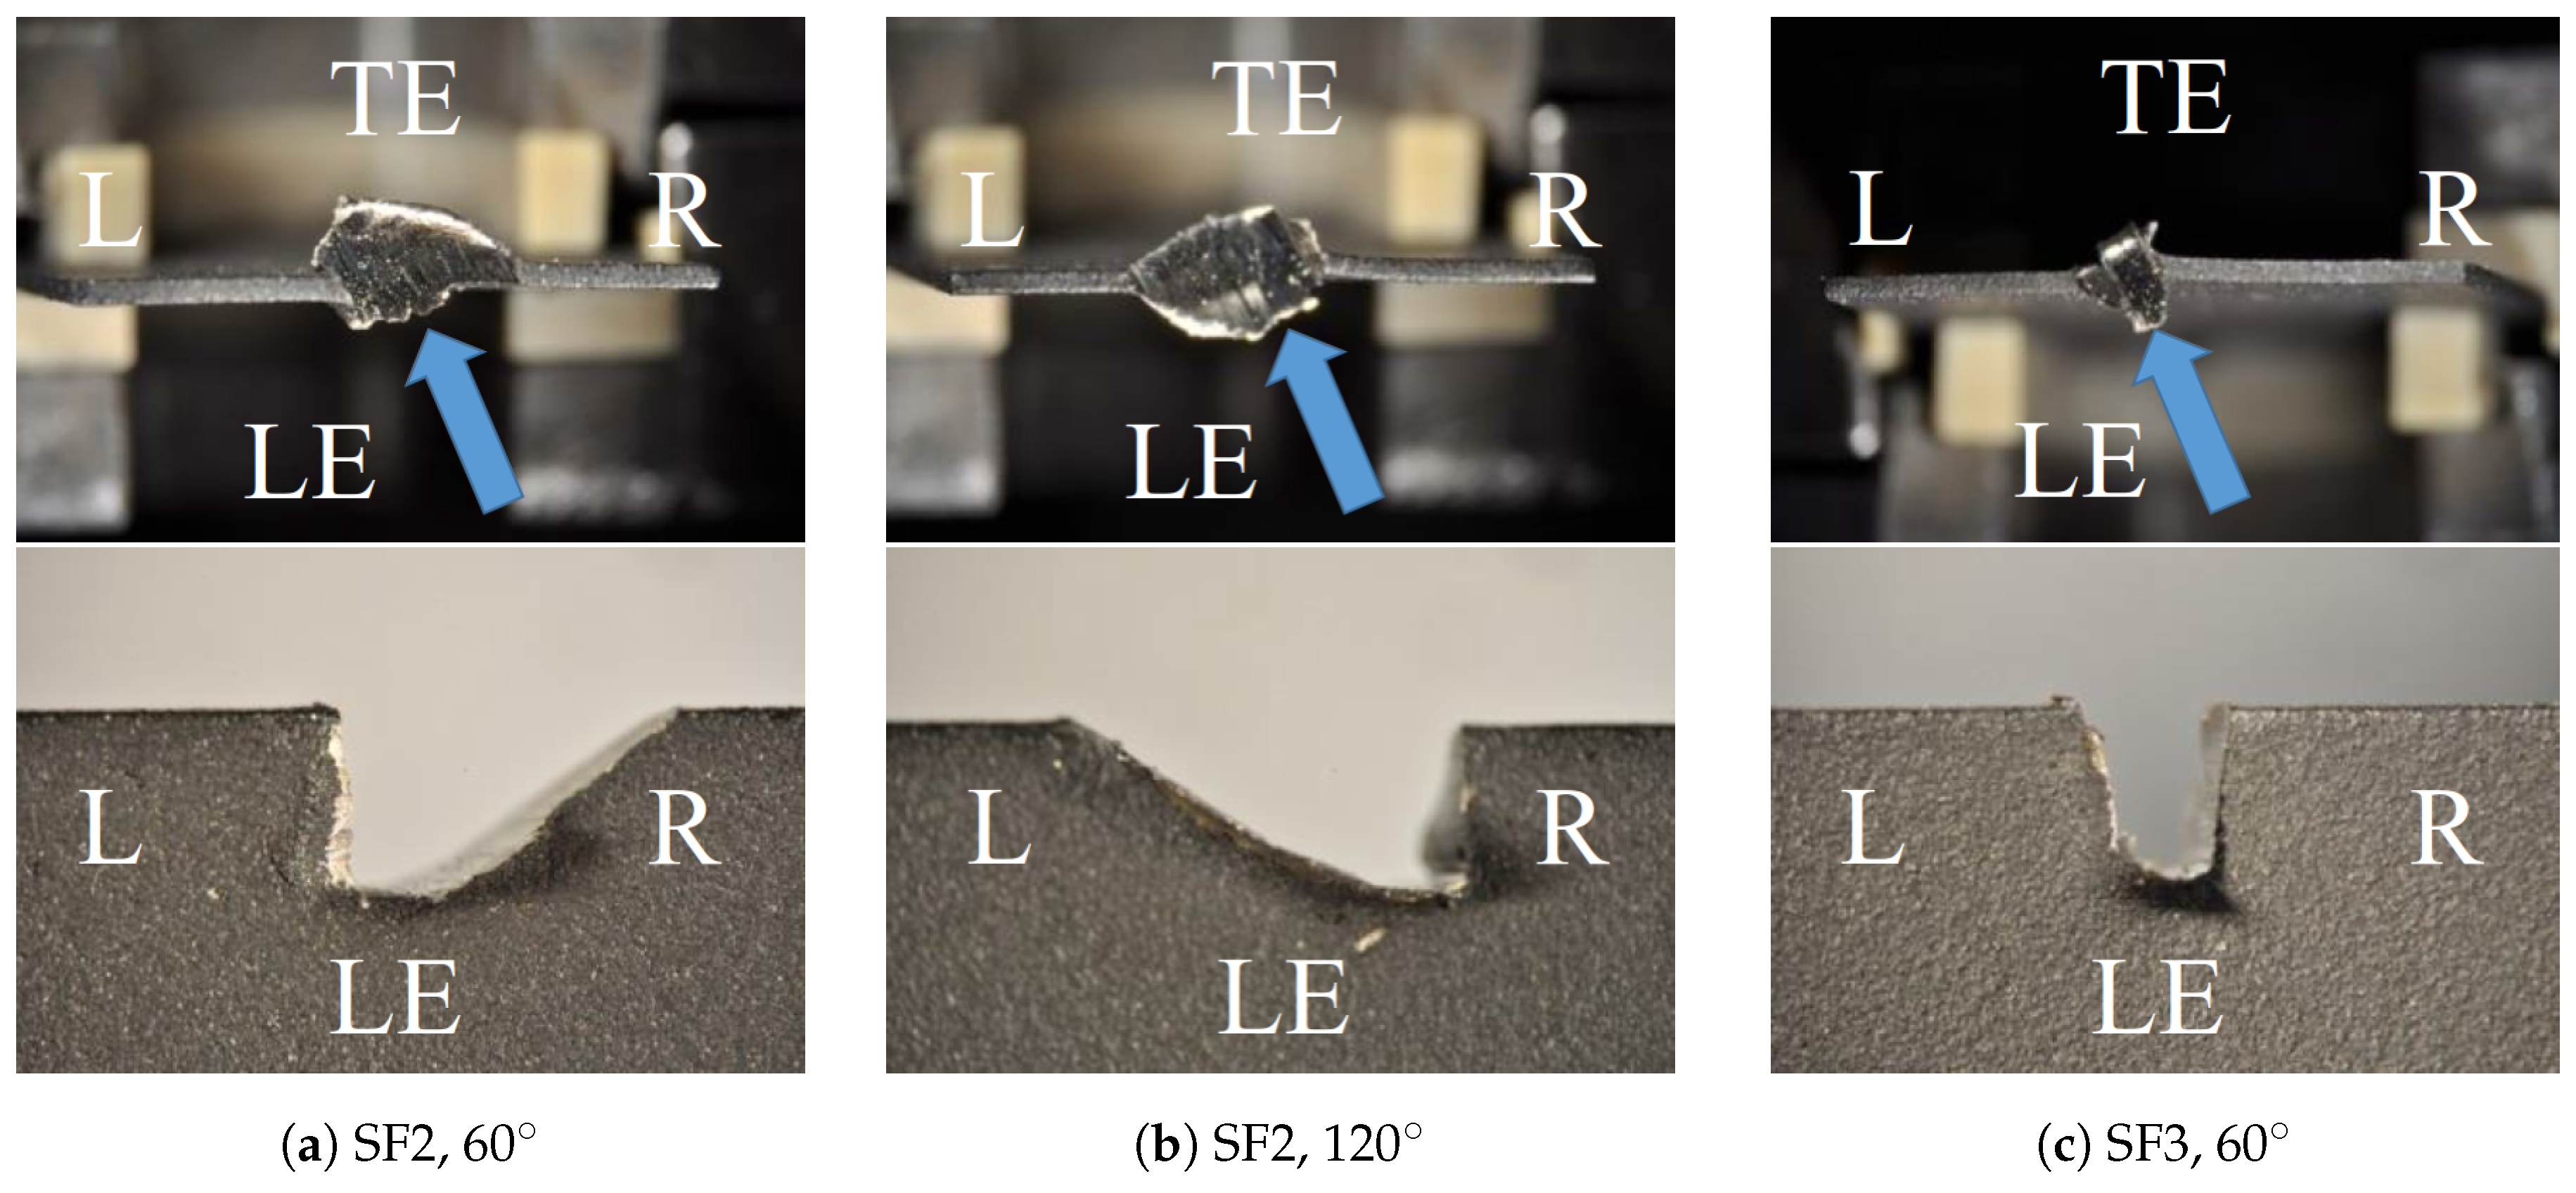
Figure 6.
Radial and tangential forces and radial incursion over time for reference rub scenario S3.
Figure 6.
Radial and tangential forces and radial incursion over time for reference rub scenario S3.

Figure 7.
Images from IR camera showing foil steady-state temperature distribution.
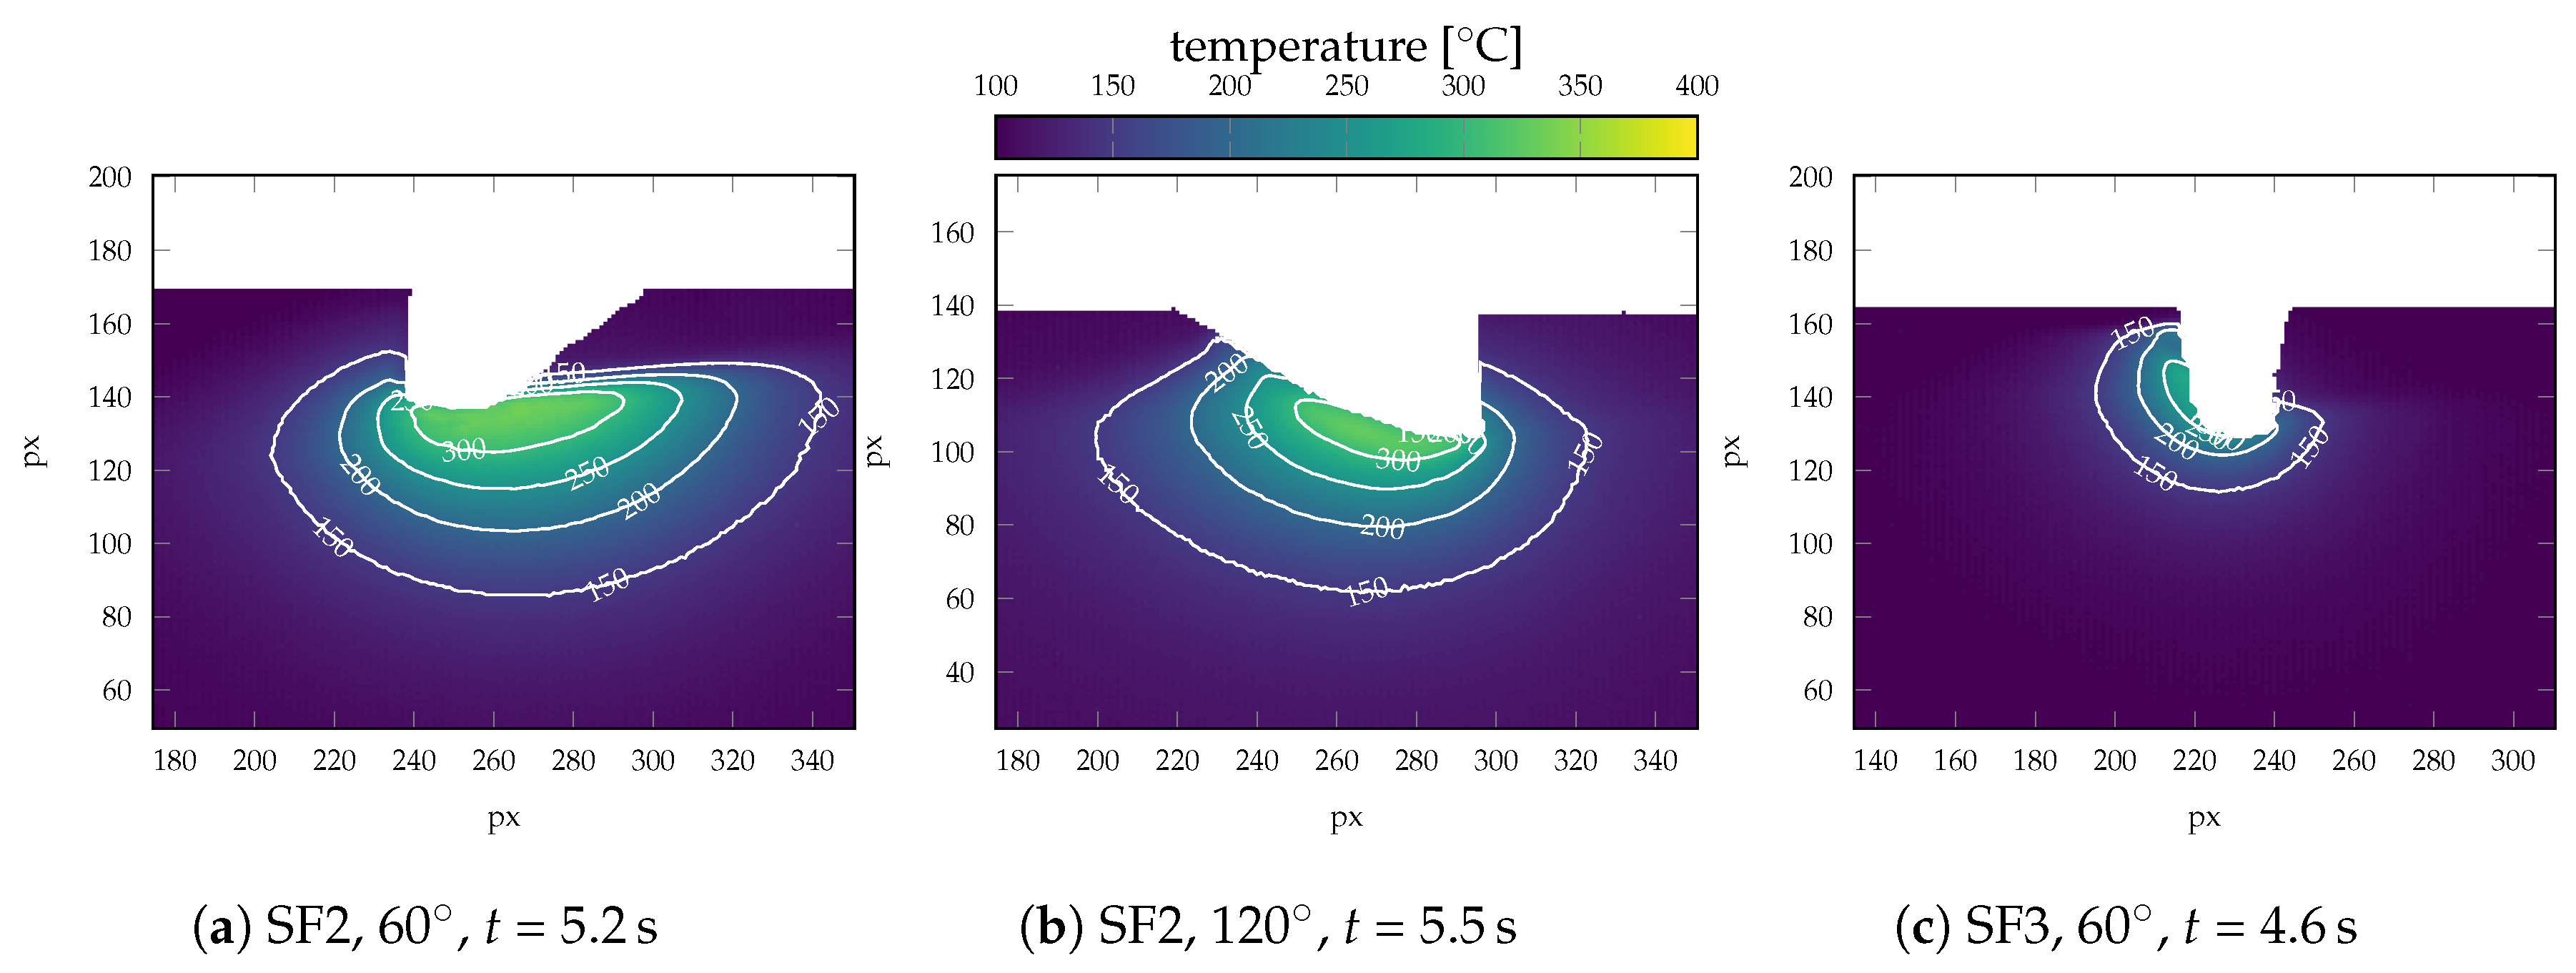
Figure 8.
Maximum tip and edge foil temperatures extracted from the IR thermo camera images over time, both in the contact zone (0) and mm away from the contact zone (1.4) in the perpendicular direction.
Figure 8.
Maximum tip and edge foil temperatures extracted from the IR thermo camera images over time, both in the contact zone (0) and mm away from the contact zone (1.4) in the perpendicular direction.
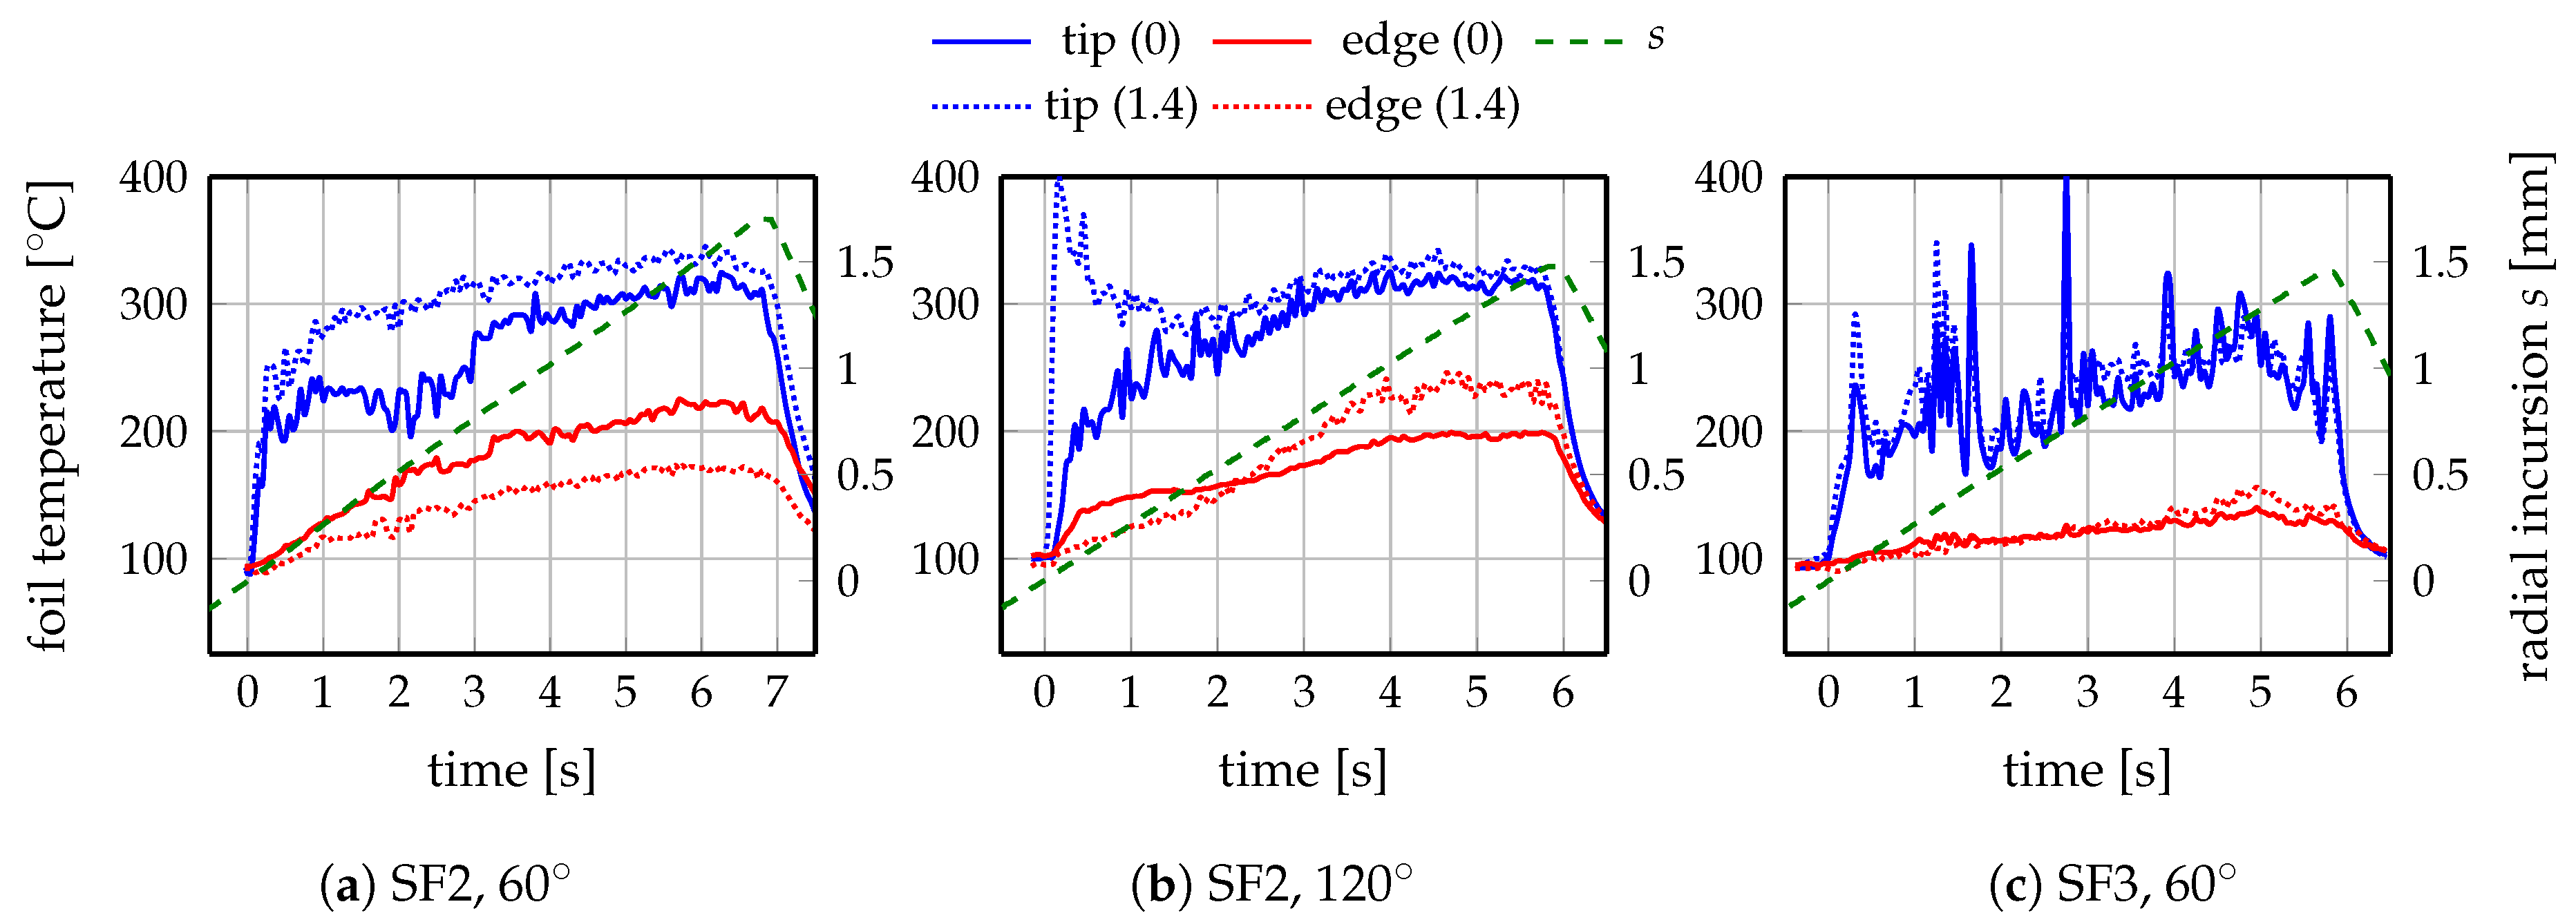
Figure 9.
Participating contact areas , ; measured force components , ; and total wear volume .

Figure 10.
Theoretical development of the size of the contact surface on each edge over time and hence incursion depth.
Figure 10.
Theoretical development of the size of the contact surface on each edge over time and hence incursion depth.

Figure 11.
Average measured contact pressure for all five rub scenarios with sheet thickness mm.

Figure 12.
Average measured frictional stress for all five rub scenarios with sheet thickness 0.4 mm for (a) the inclined seal fin (SF2) and (b) perpendicular seal fin (SF3).
Figure 12.
Average measured frictional stress for all five rub scenarios with sheet thickness 0.4 mm for (a) the inclined seal fin (SF2) and (b) perpendicular seal fin (SF3).
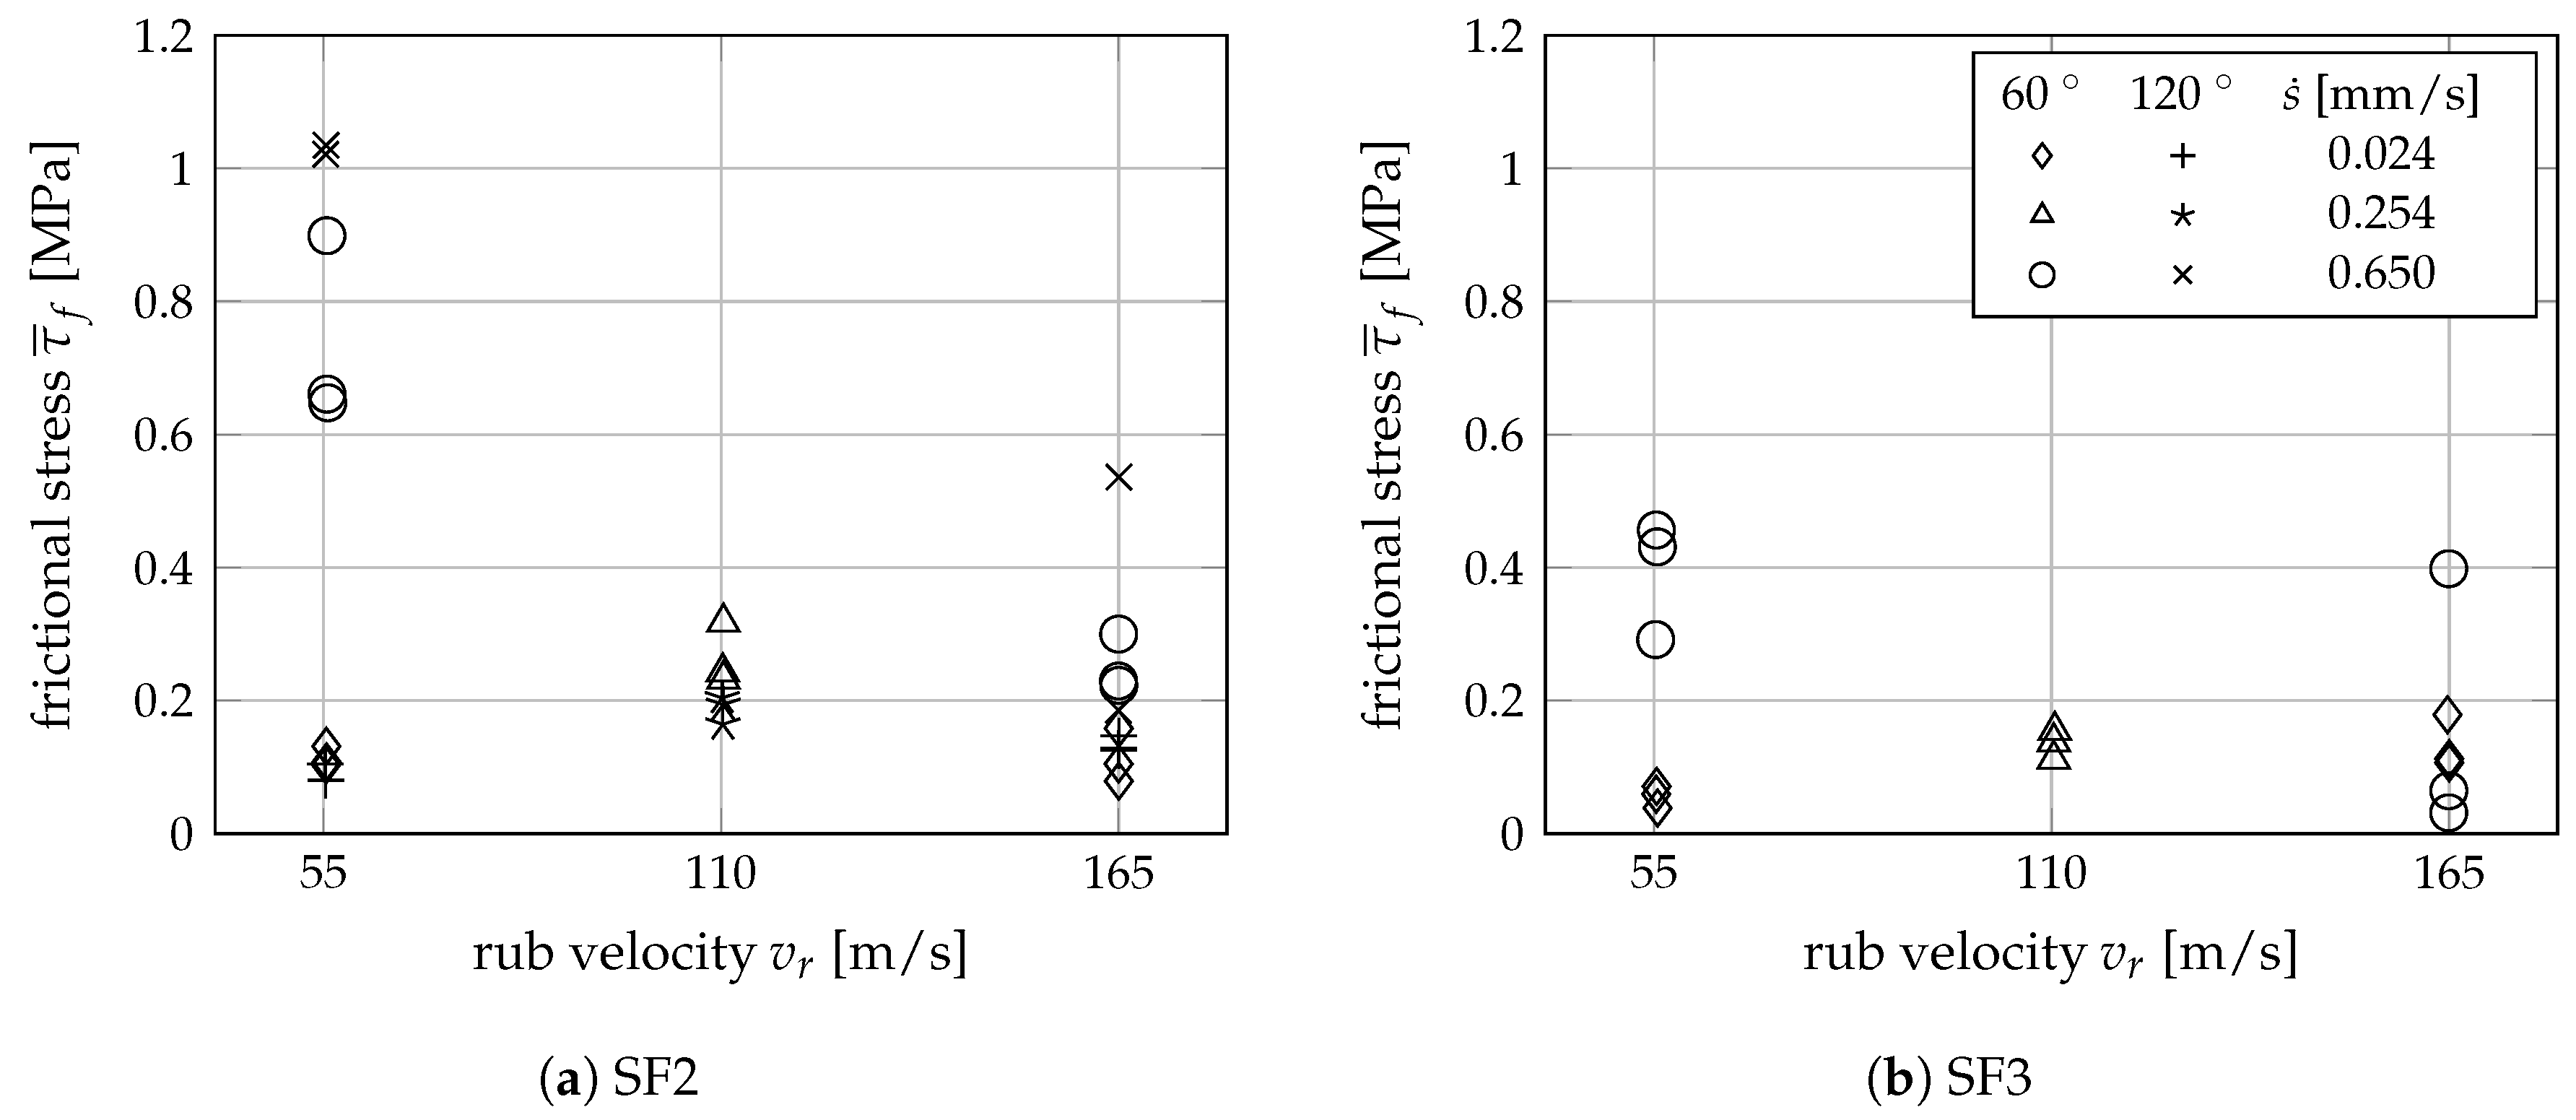
Figure 13.
Average maximum foil temperature in the tip region and the left edge for all five rub scenarios with sheet thickness mm.
Figure 13.
Average maximum foil temperature in the tip region and the left edge for all five rub scenarios with sheet thickness mm.

Figure 14.
Ratio of resulting wear due to material loss to total wear of the metal foil with thickness mm.
Figure 14.
Ratio of resulting wear due to material loss to total wear of the metal foil with thickness mm.
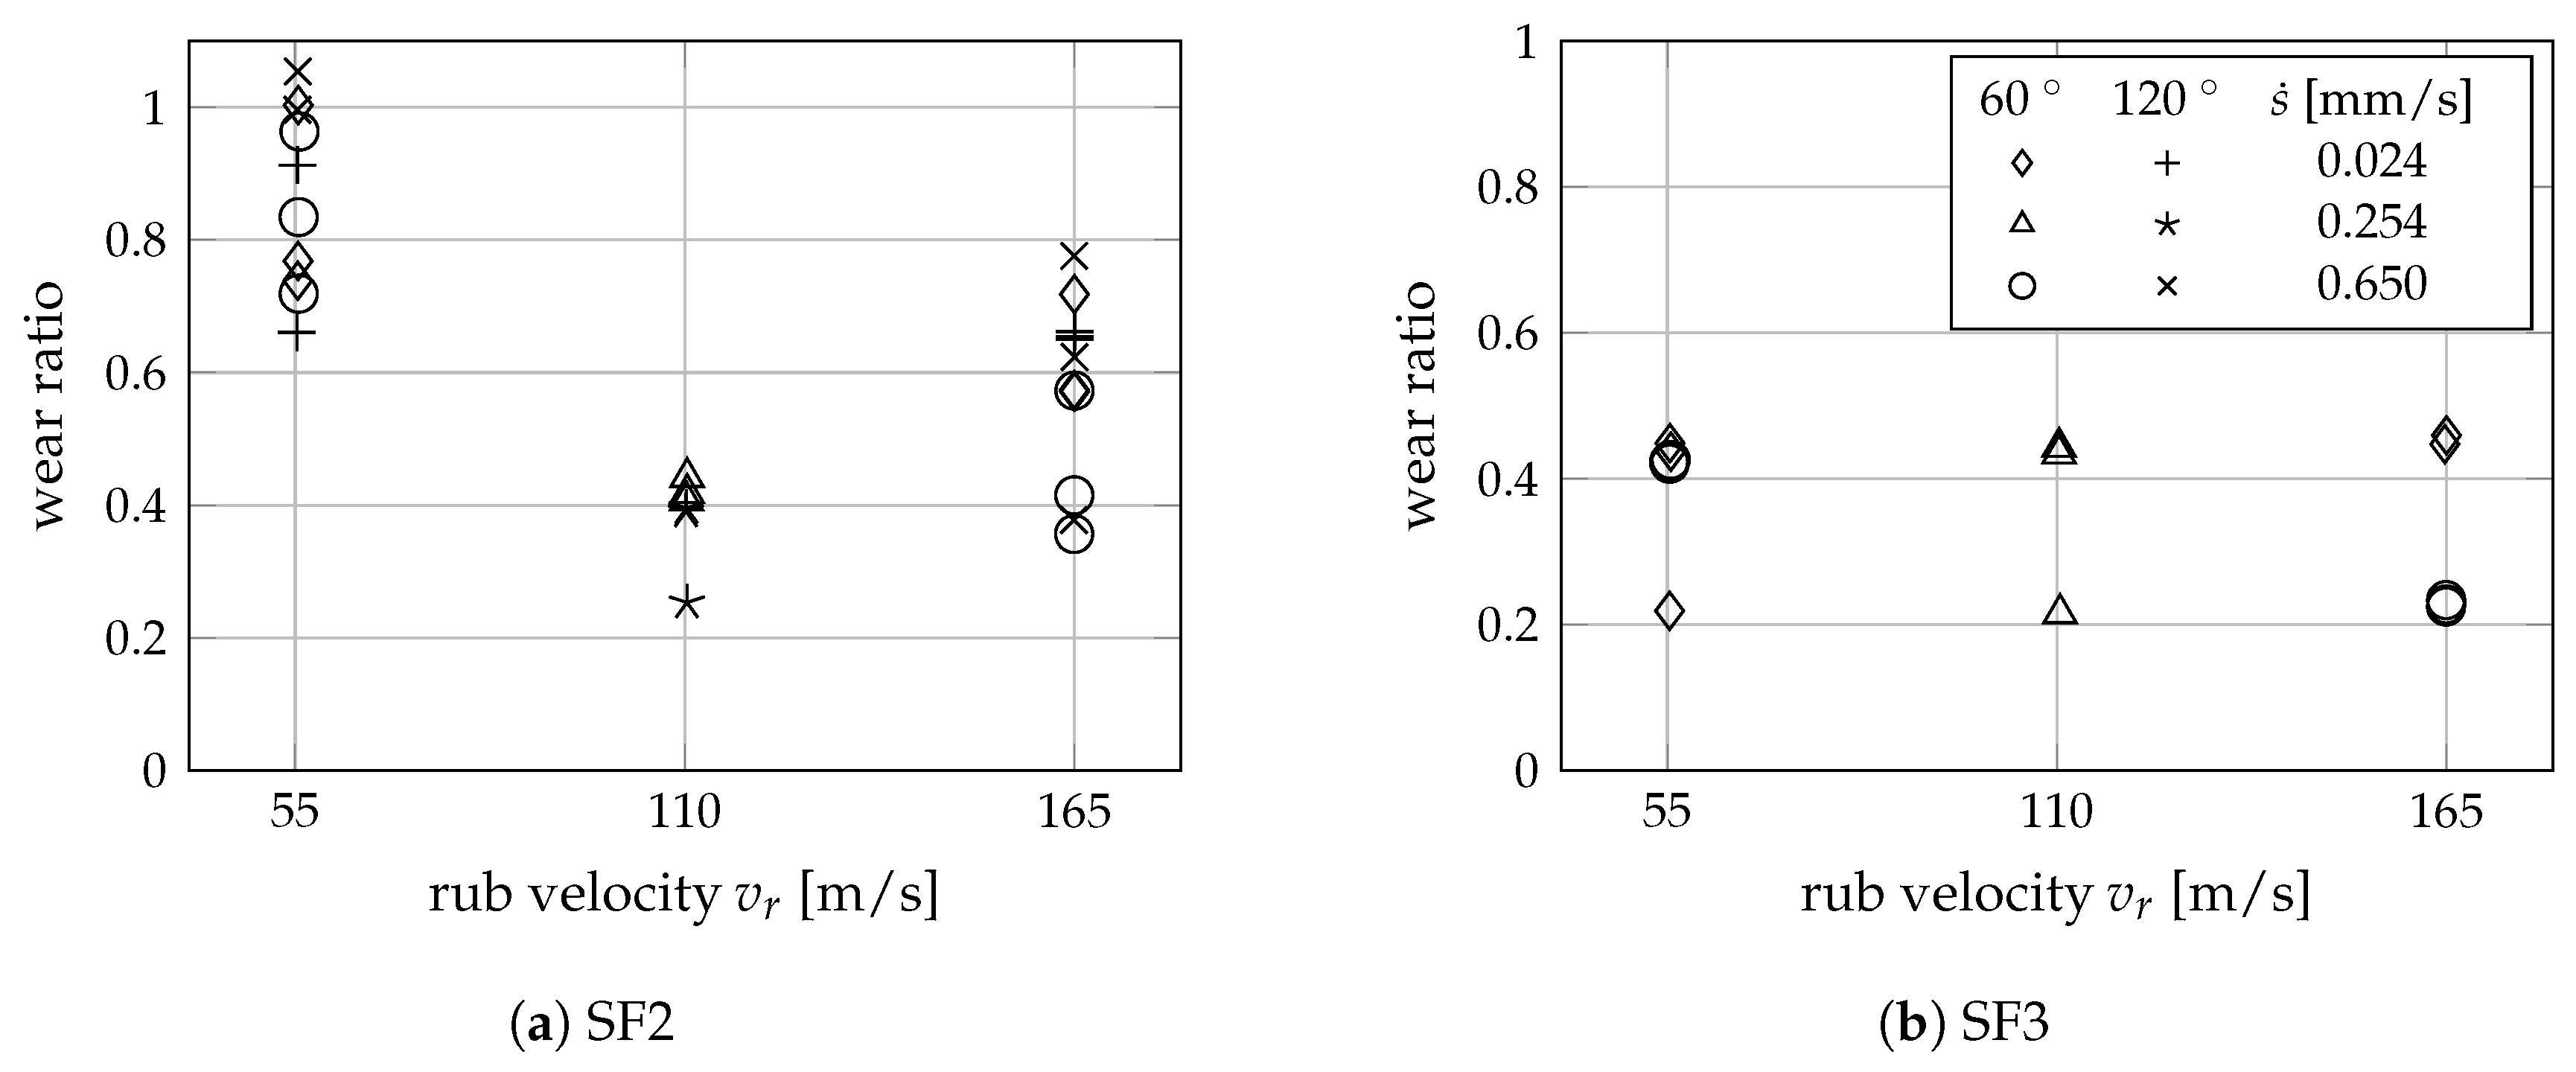
Figure 15.
Average measured foil temperature at the fin tip and on the edge over foil thickness for rub scenario S3, both seal fin geometries and foil orientations.
Figure 15.
Average measured foil temperature at the fin tip and on the edge over foil thickness for rub scenario S3, both seal fin geometries and foil orientations.

Figure 16.
Average ratio of resulting wear due to material loss to total wear over foil thickness for rub scenario S3, both seal fin geometries and foil orientations.
Figure 16.
Average ratio of resulting wear due to material loss to total wear over foil thickness for rub scenario S3, both seal fin geometries and foil orientations.
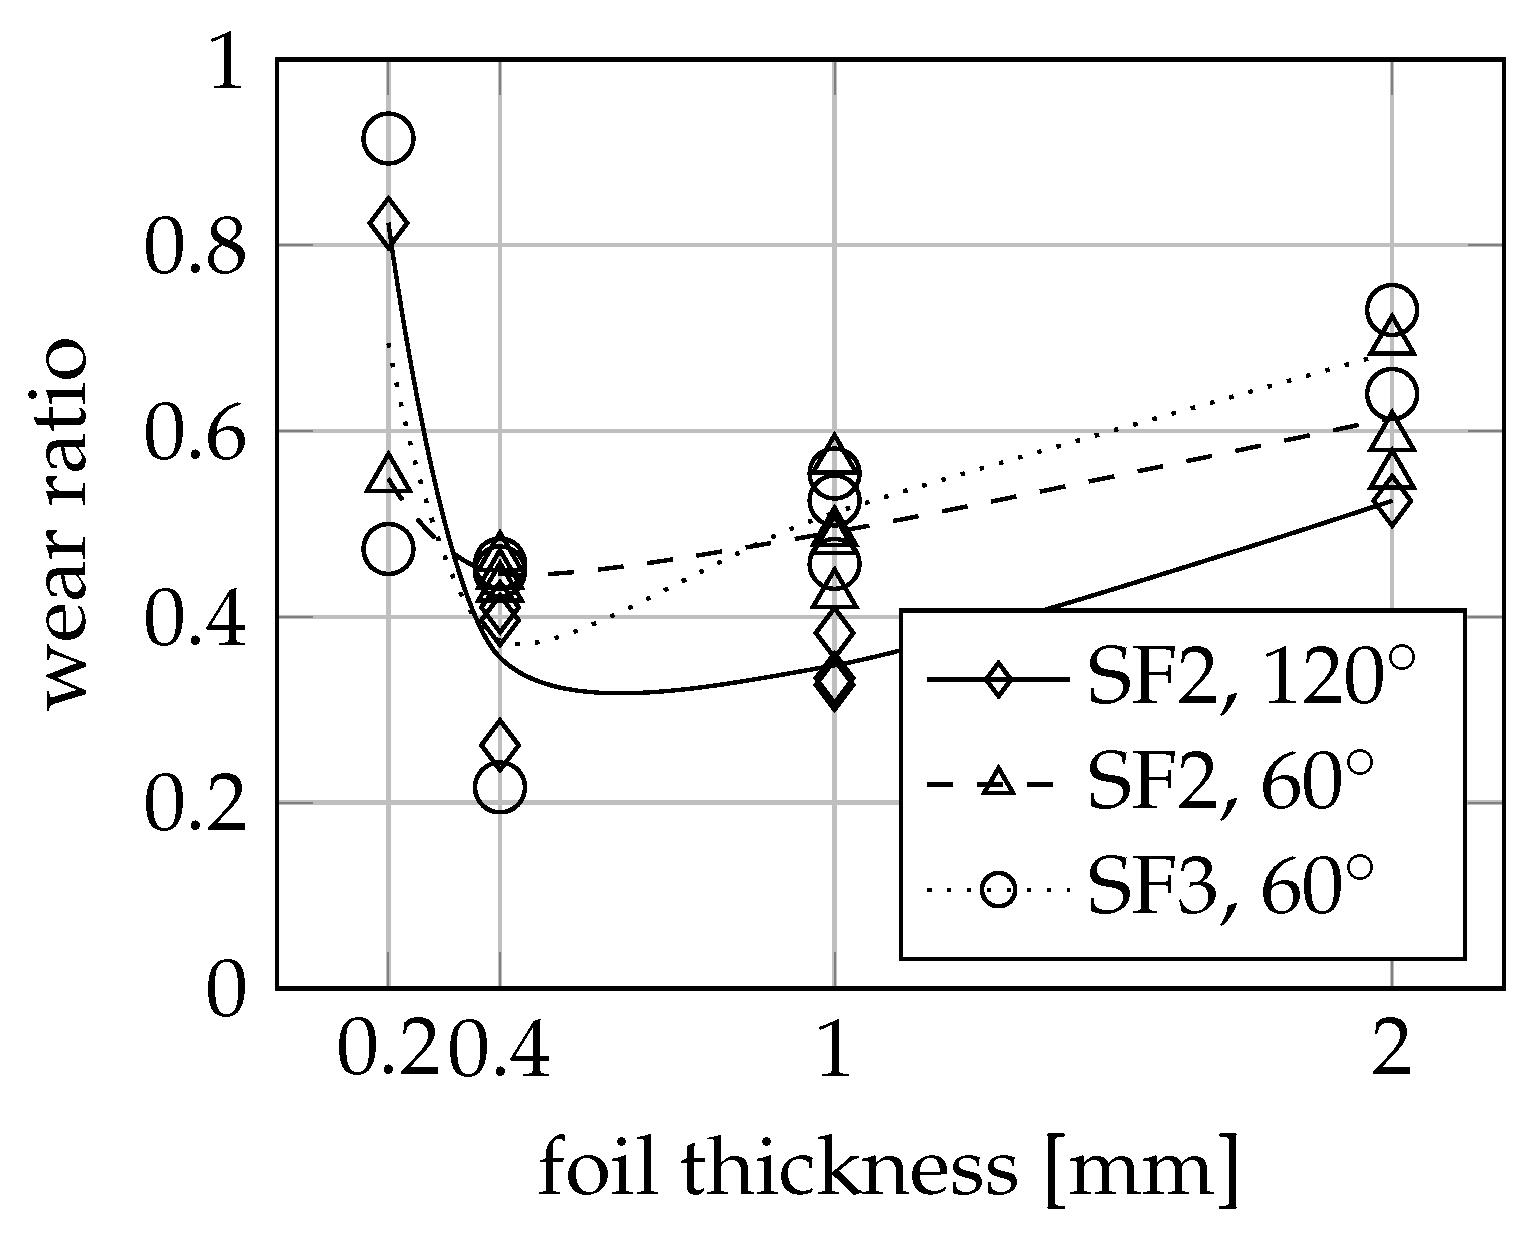
Figure 17.
Average radial force (a) and average tangential force (b) over foil thickness for rub scenario S3, both seal fin geometries and foil orientations.
Figure 17.
Average radial force (a) and average tangential force (b) over foil thickness for rub scenario S3, both seal fin geometries and foil orientations.

© 2018 by the authors. Licensee MDPI, Basel, Switzerland. This article is an open access article distributed under the terms and conditions of the Creative Commons Attribution (CC BY) license (http://creativecommons.org/licenses/by/4.0/).
Share and Cite
MDPI and ACS Style
Munz, O.; Pychynski, T.; Schwitzke, C.; Bauer, H.-J. Continued Experimental Study on the Friction Contact between a Labyrinth Seal Fin and a Honeycomb Stator: Slanted Position. Aerospace 2018, 5, 82. https://doi.org/10.3390/aerospace5030082
AMA Style
Munz O, Pychynski T, Schwitzke C, Bauer H-J. Continued Experimental Study on the Friction Contact between a Labyrinth Seal Fin and a Honeycomb Stator: Slanted Position. Aerospace. 2018; 5(3):82. https://doi.org/10.3390/aerospace5030082
Chicago/Turabian StyleMunz, Oliver, Tim Pychynski, Corina Schwitzke, and Hans-Jörg Bauer. 2018. "Continued Experimental Study on the Friction Contact between a Labyrinth Seal Fin and a Honeycomb Stator: Slanted Position" Aerospace 5, no. 3: 82. https://doi.org/10.3390/aerospace5030082
Note that from the first issue of 2016, this journal uses article numbers instead of page numbers. See further details here.