
Gust Alleviation of a Large Aircraft with a Passive Twist Wingtip

Abstract
:
1. Introduction
2. Design Requirements and Analysis Methods
2.1. Design Requirements and Procedure
2.2. Aeroelastic Analysis
2.3. Gust Model and Load
3. Aircraft Design Example and Results
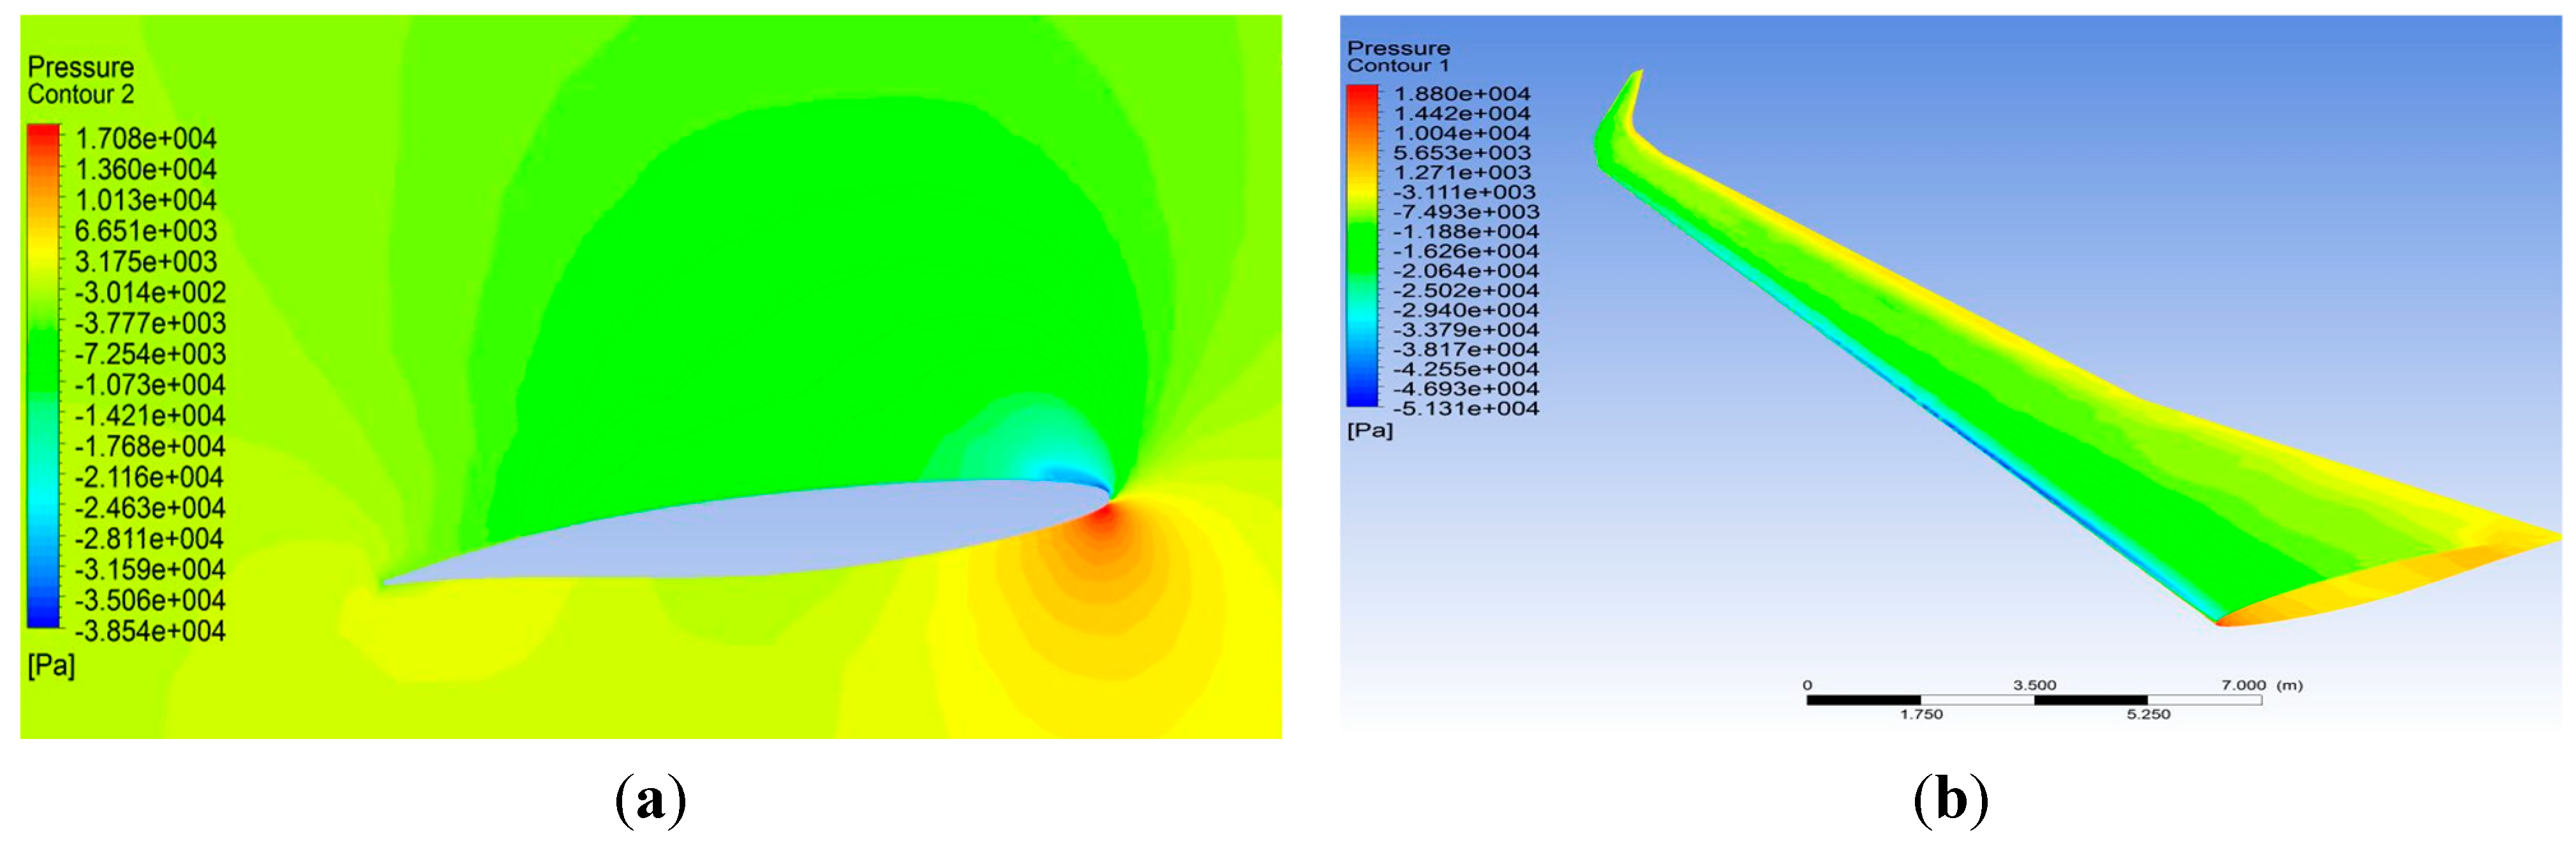
3.1. Aircraft Data and Aerodynamic Load

| Wing Span (m) | Aspect Ratio | Leading Edge Sweep Angle (deg) | Fuselage Length (m) | MTOM (Maximum Take-Off Mass) (kg) | OEM (Operation Empty Mass) (kg) | Cruise Altitude (feet) |
|---|---|---|---|---|---|---|
| 38.3 | 12 | 5.0 | 44.5 | 87,663.0 | 46,500.0 | 35,000 |

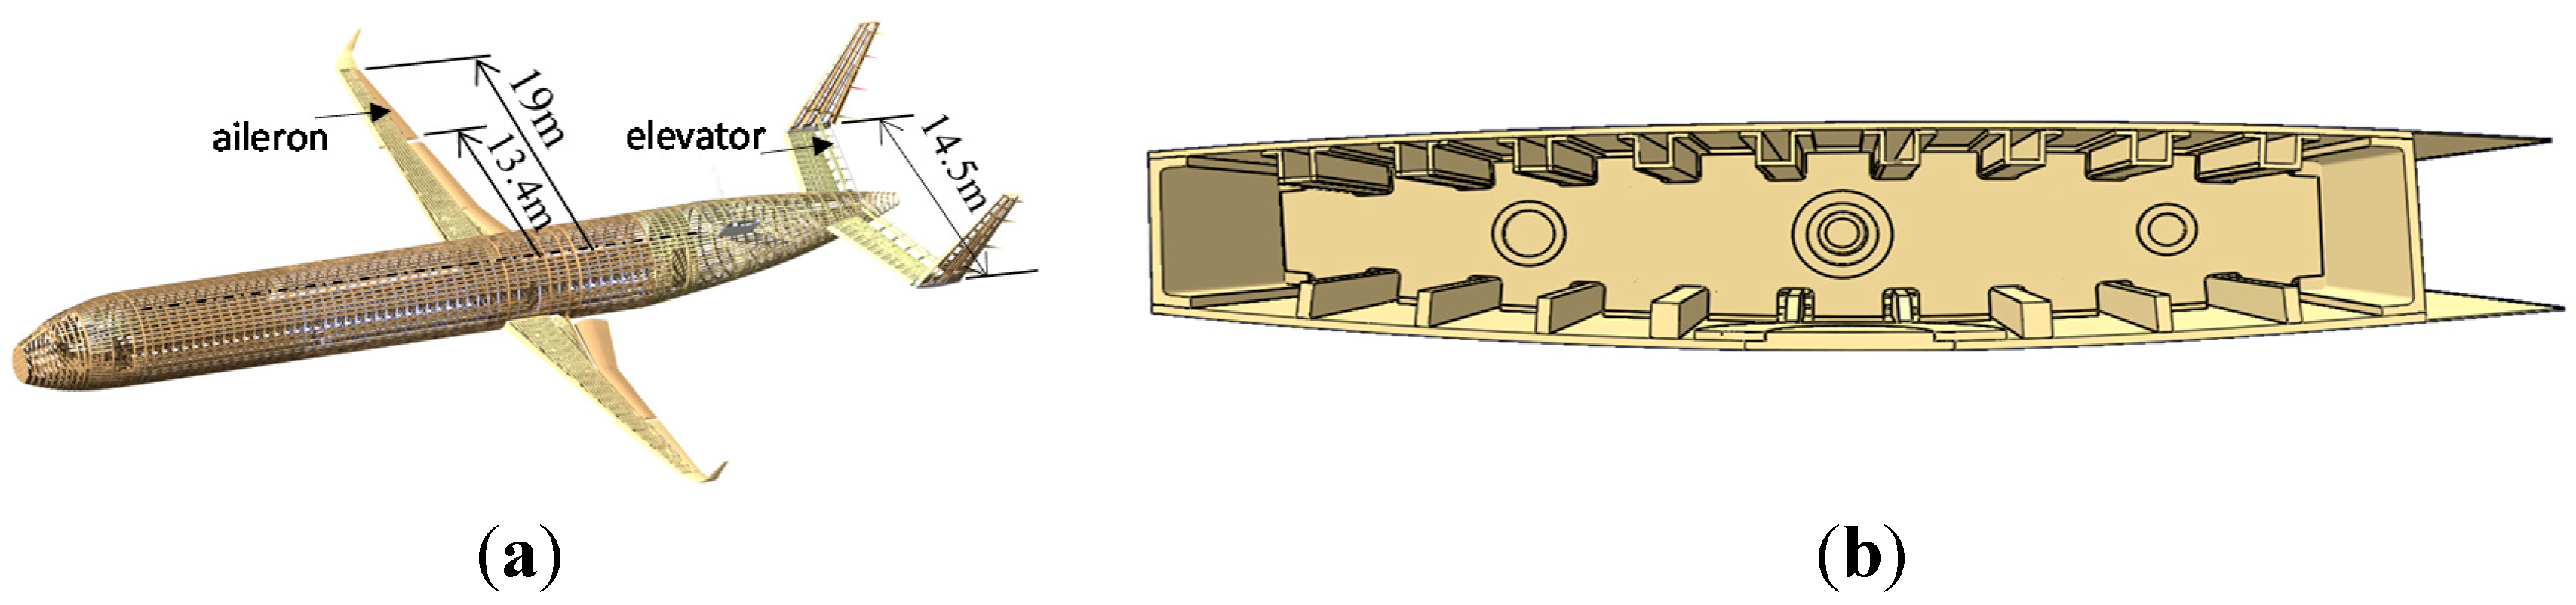
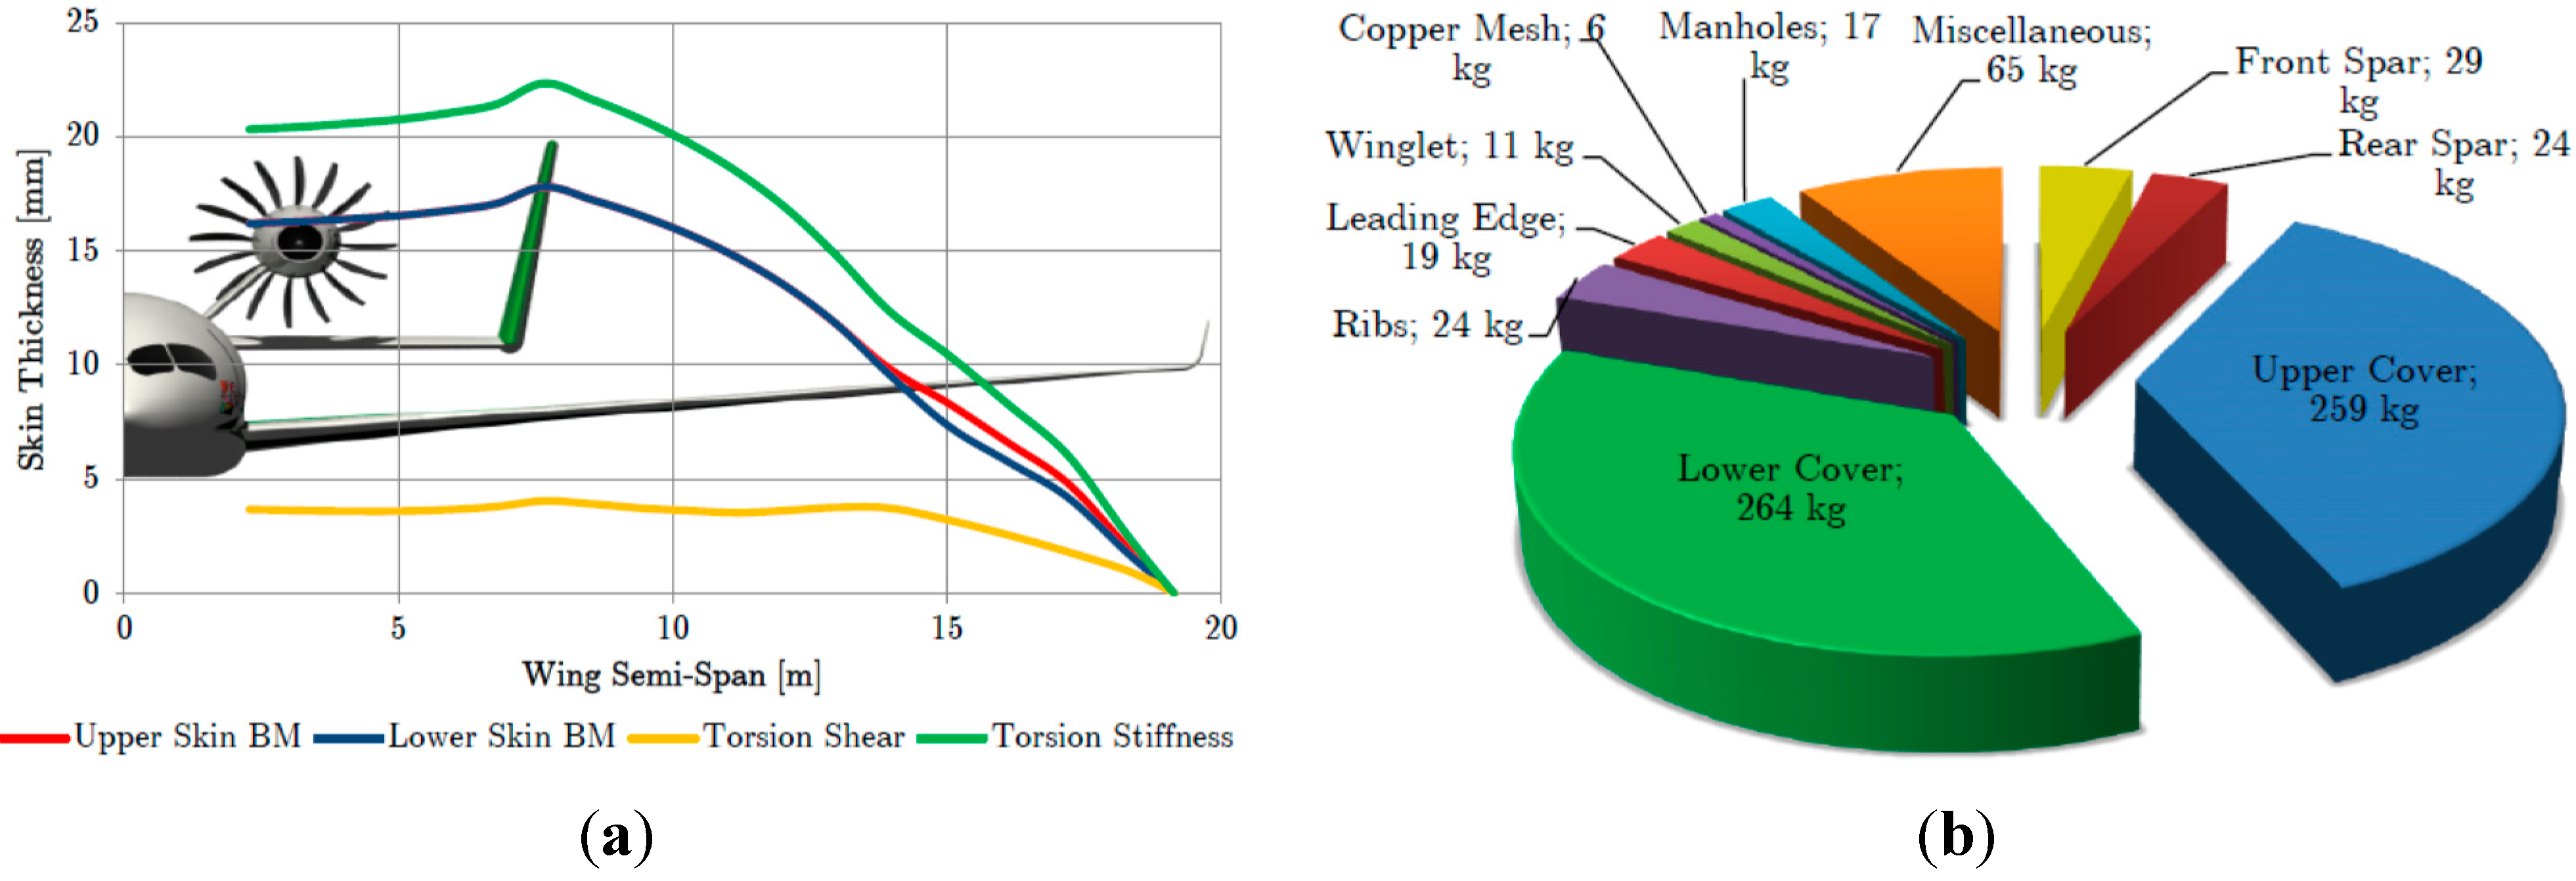
3.2. Structural Layout and Initial Design
| E1 (GPa) | E2 (GPa) | G12 (GPa) | v12 | Xt (MPa) | Xc (MPa) | Yt (MPa) | Yc (MPa) | S (MPa) | ρ (kg/m3) |
|---|---|---|---|---|---|---|---|---|---|
| 176 | 15 | 5.6 | 0.27 | 3520 | 1880 | 42.7 | 127 | 105 | 1586 |
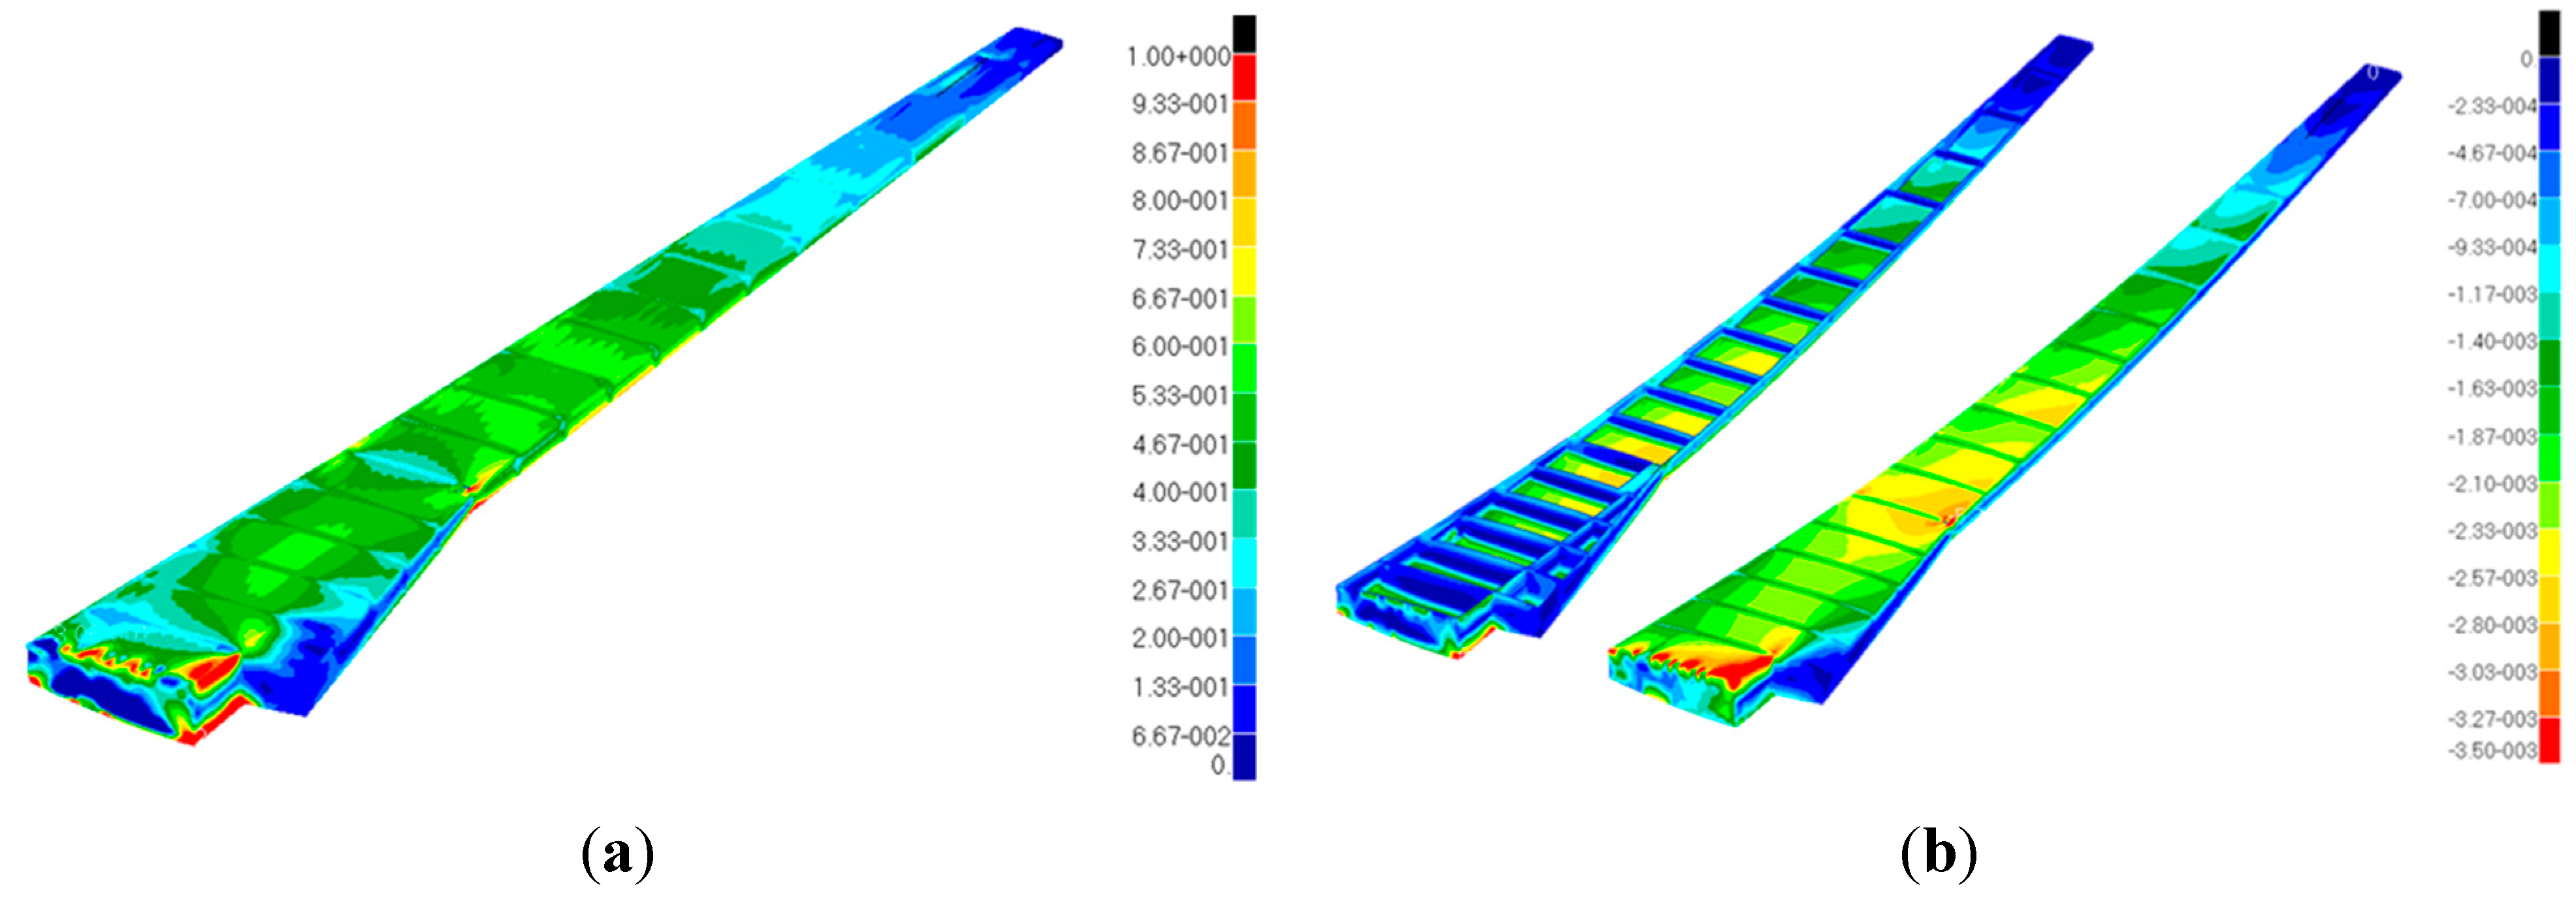
3.3. Structural FE Model and Stress Analysis
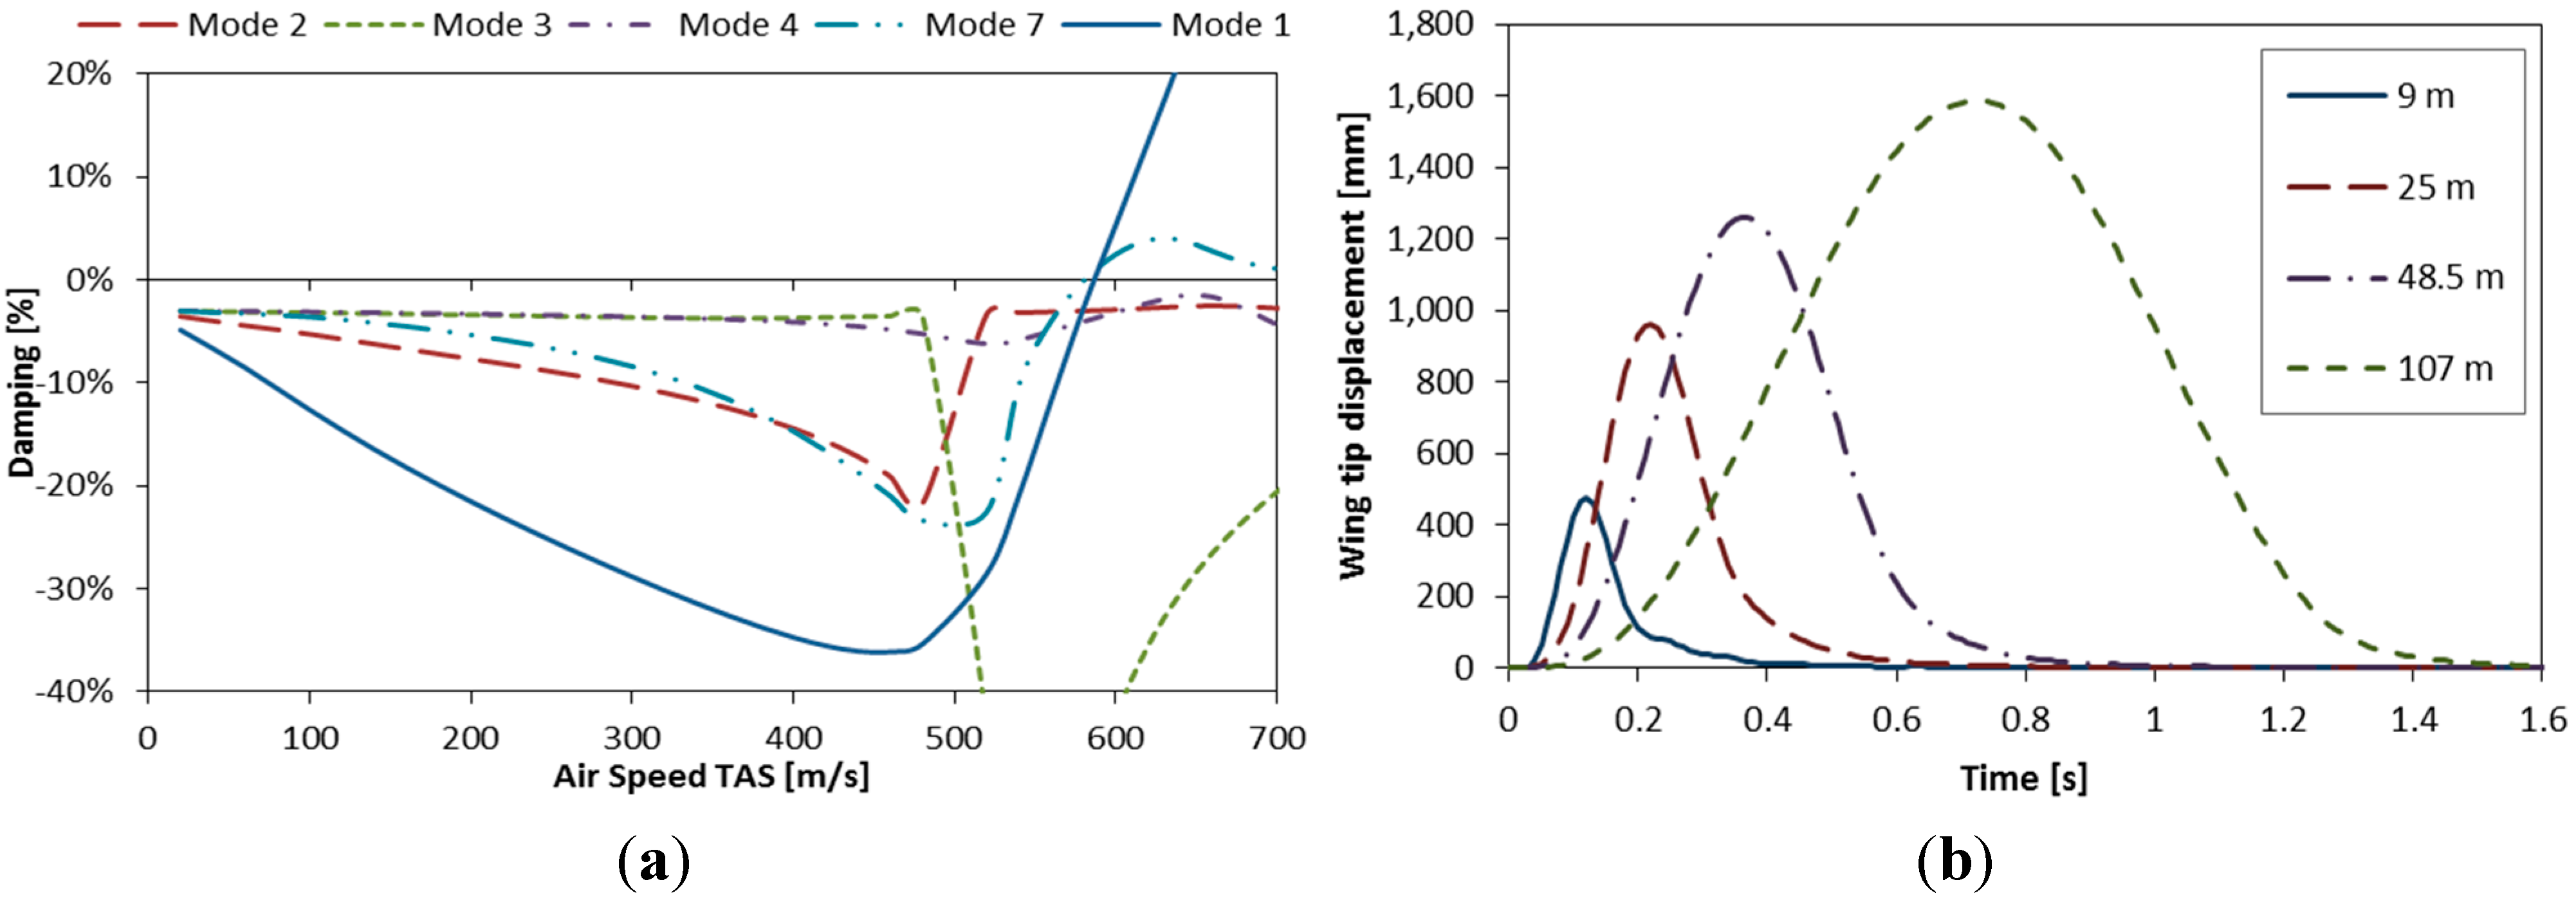
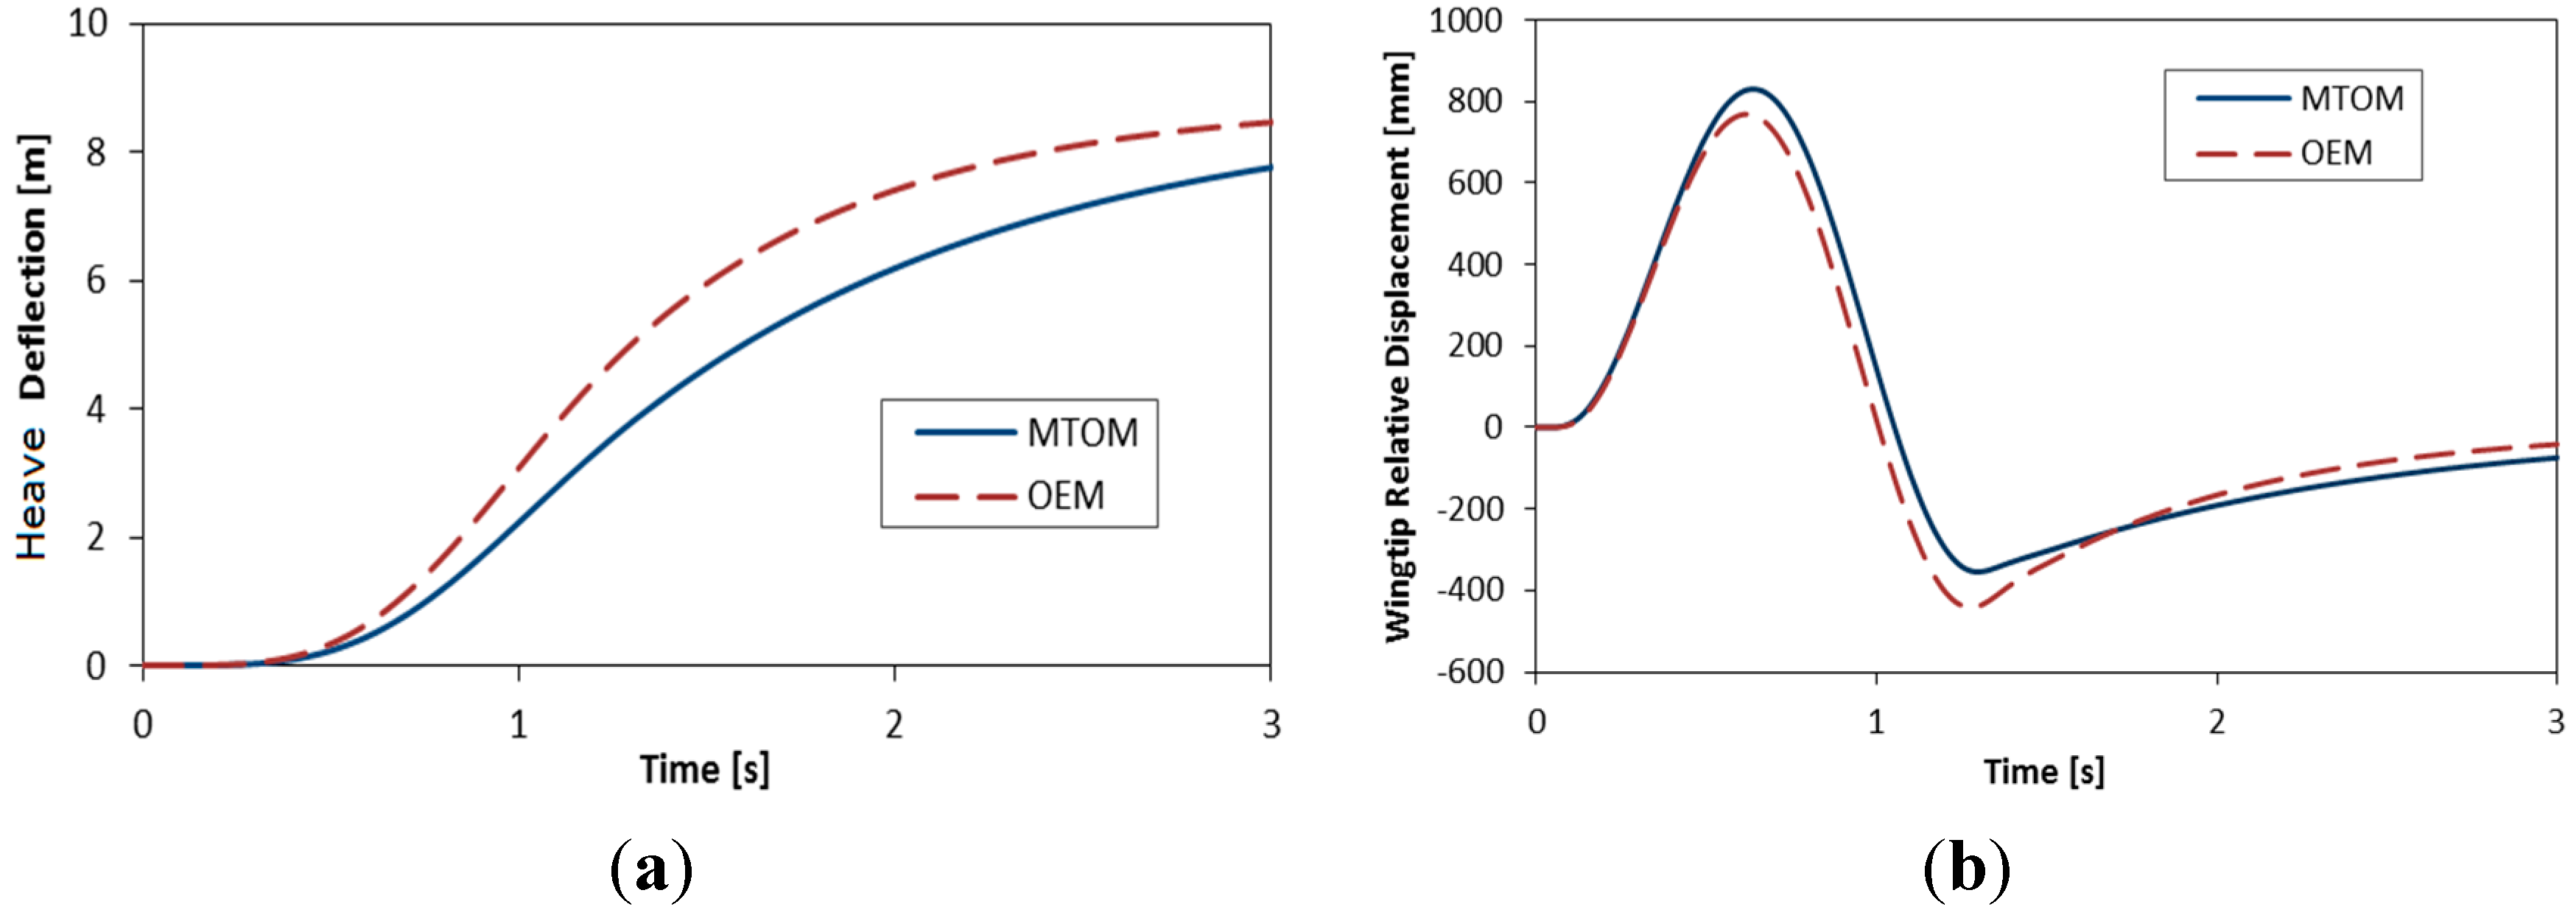
3.4. Aeroelastic and Gust Response Analysis
| Mode (Hz) | 1st Bending | 2nd Bending | Bending/Torsion Coupled | 1st Torsion | 3rd Bending |
|---|---|---|---|---|---|
| MTOM | 3.5 | 9.5 | 11.1 | 17.0 | 20.3 |
| OEM | 4.0 | 12.4 | 18.6 | 17.4 | 31.2 |

| Gust Gradient Distance H (m) | 9.0 | 25 | 12.5 = 48.5 | 107.0 |
|---|---|---|---|---|
| Design gust velocity Uds (m/s) | 6.63 | 7.86 | 8.77 | 10.01 |
| Gust frequency (Hz) | 9.72 | 3.50 | 1.80 | 0.80 |
| Altitude | Airspeed | Case | Gust Response (mm) | |||
|---|---|---|---|---|---|---|
| H = 9 m | H = 25 m | H = 48.5 m | H = 107 m | |||
| Sea level | VB | MTOM | 466 | 677 | 968 | 1,179 |
| OEM | 484 | 647 | 867 | 1,037 | ||
| VC | MTOM | 474 | 960 | 1,261 | 1,586 | |
| OEM | 474 | 959 | 1,261 | 1,587 | ||
| Cruise altitude | VC | MTOM | 216 | 465 | 614 | 776 |
| OEM | 217 | 464 | 614 | 776 | ||
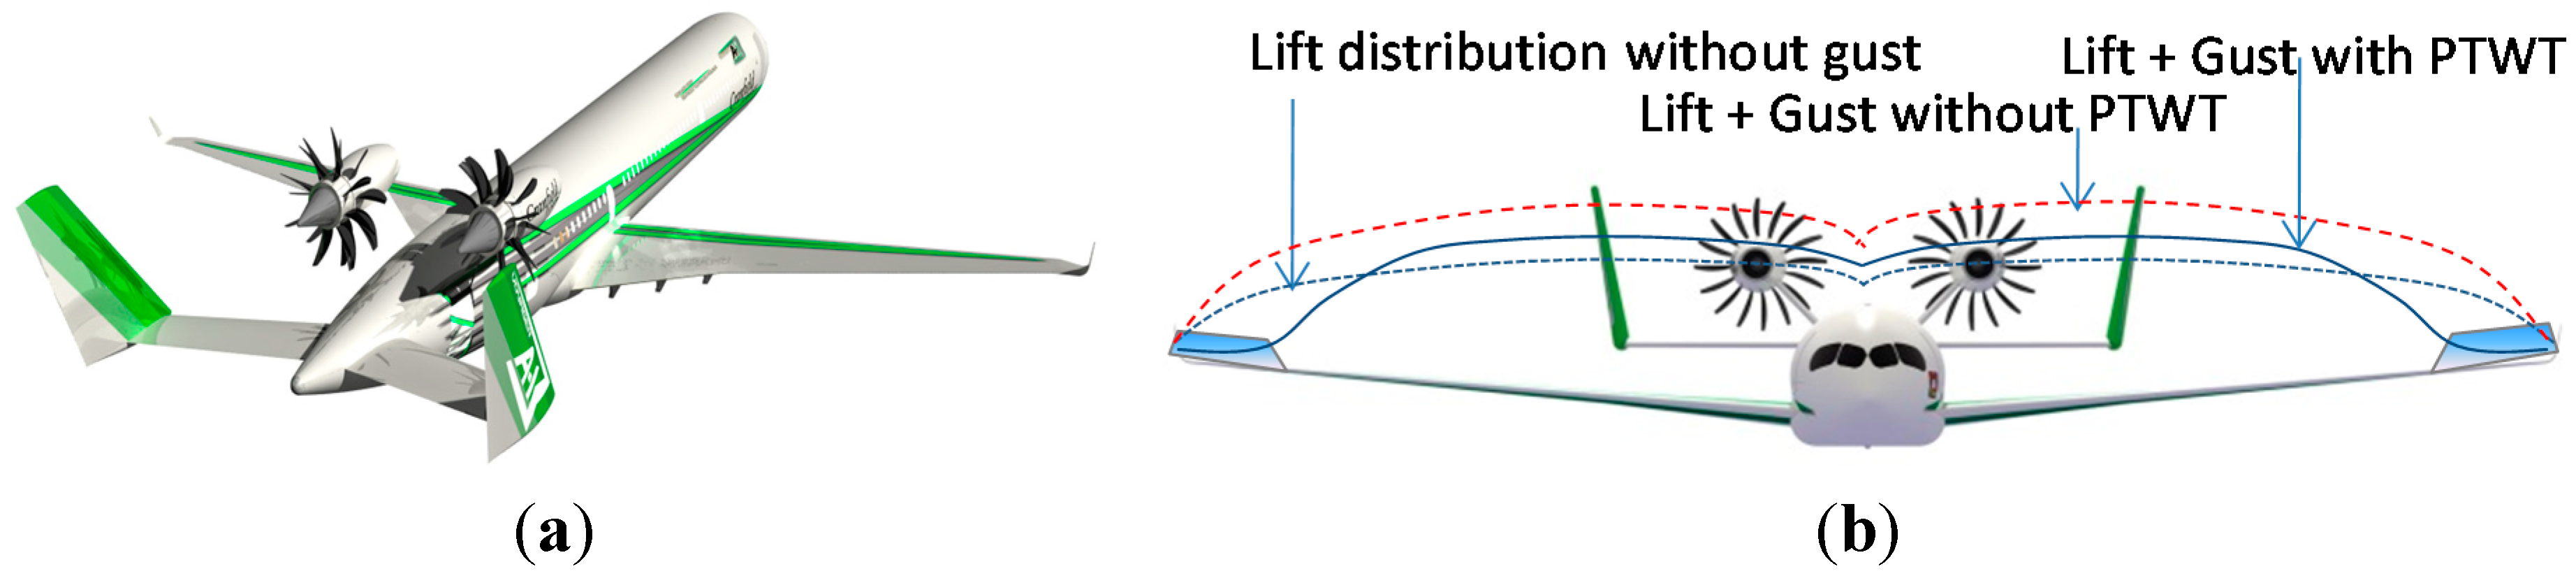
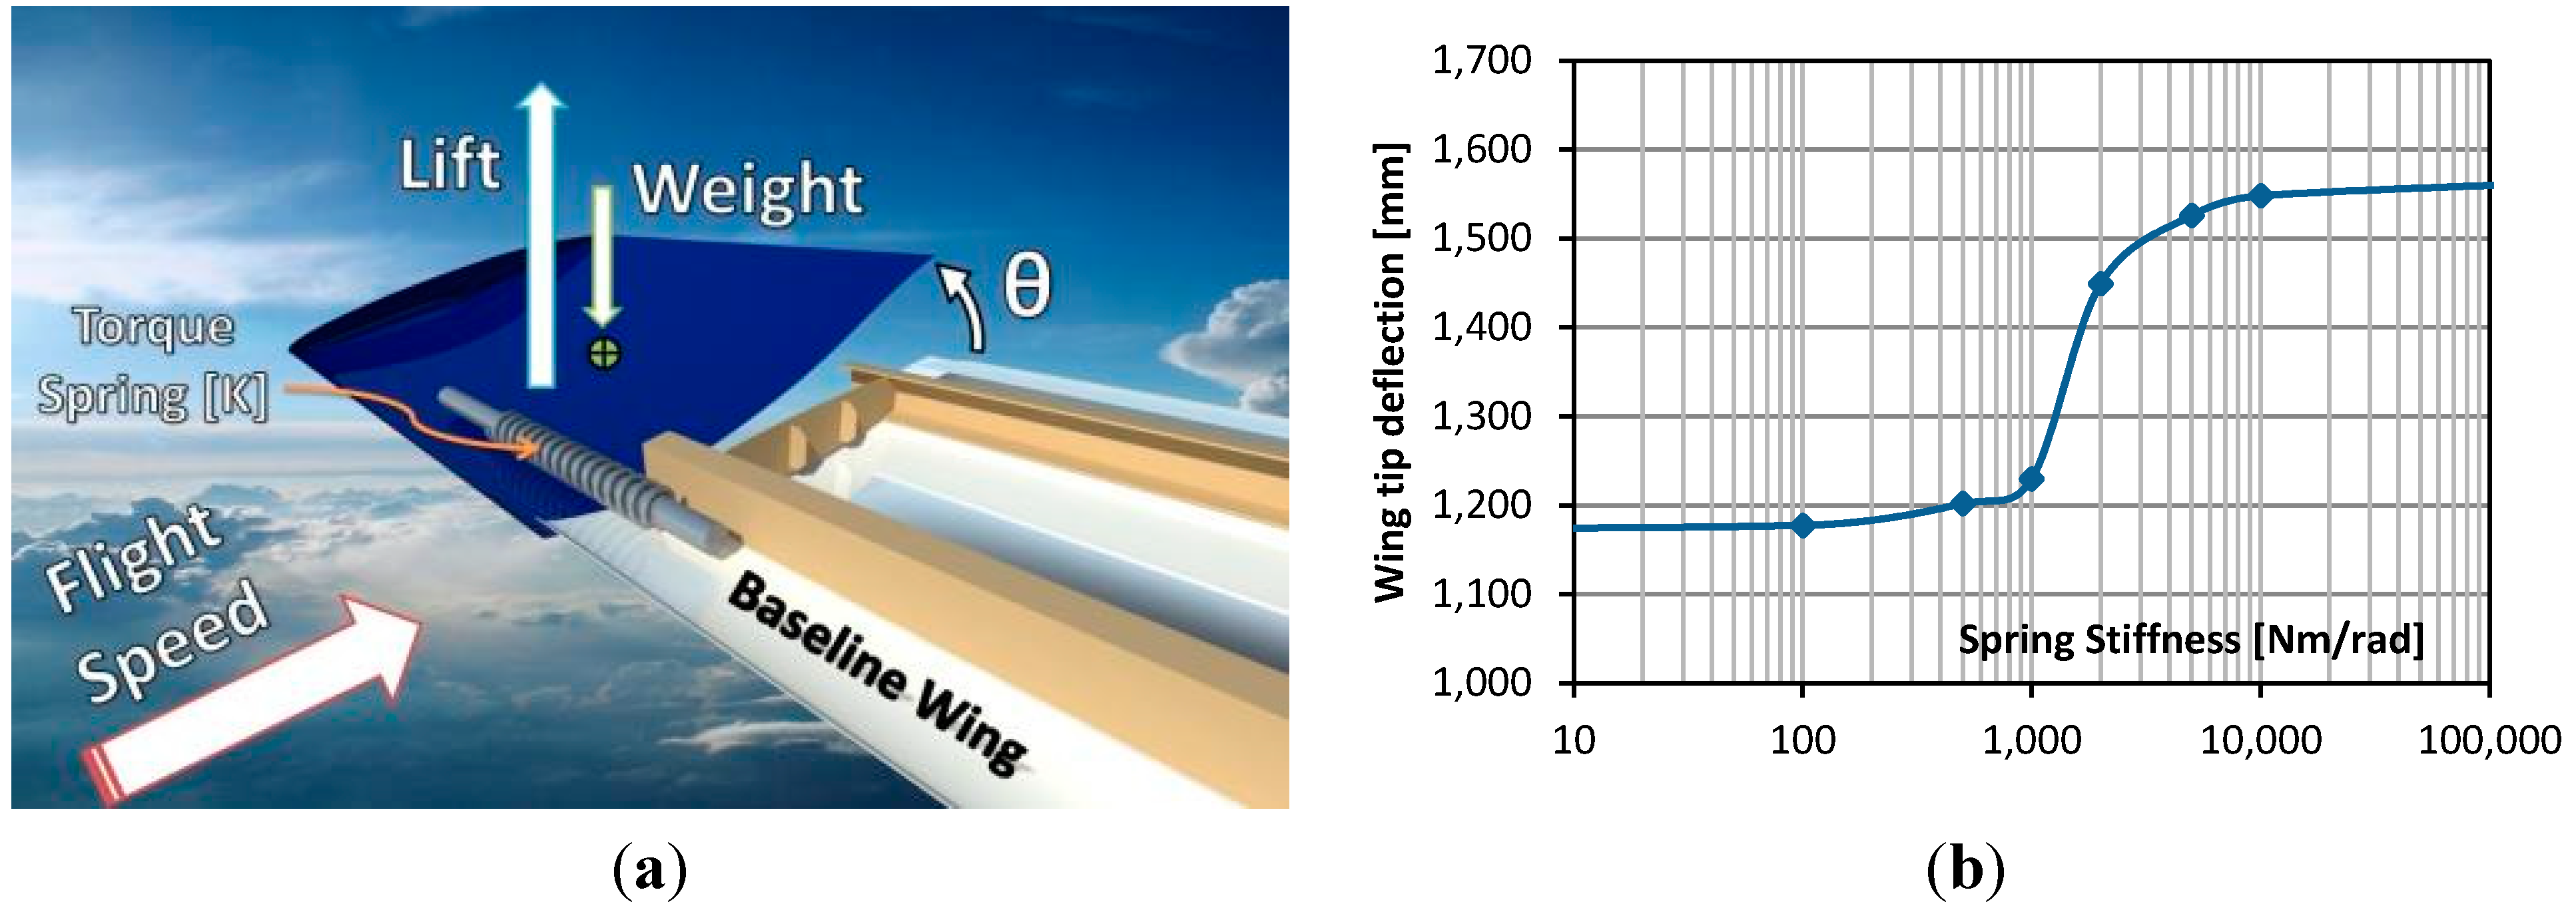
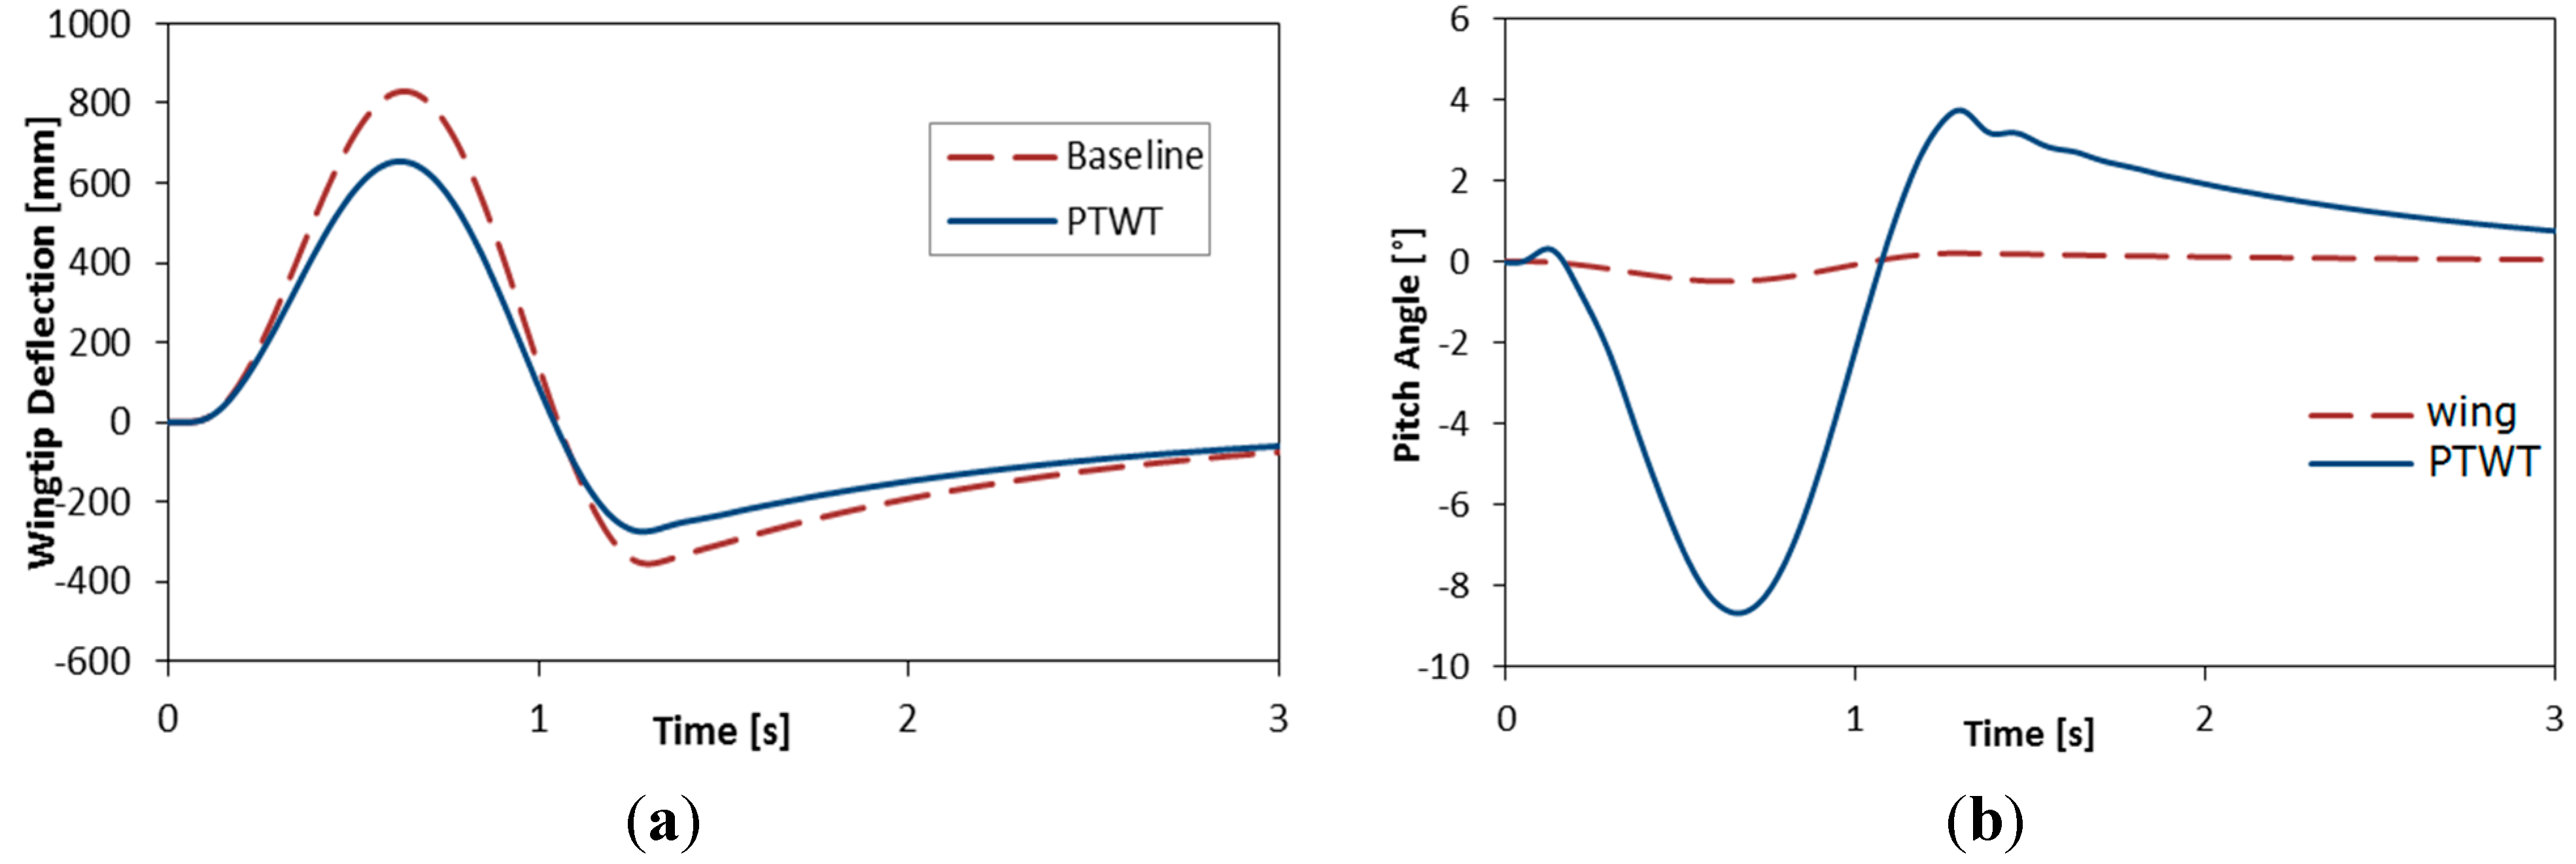
4. The PTWT Design and Gust Response
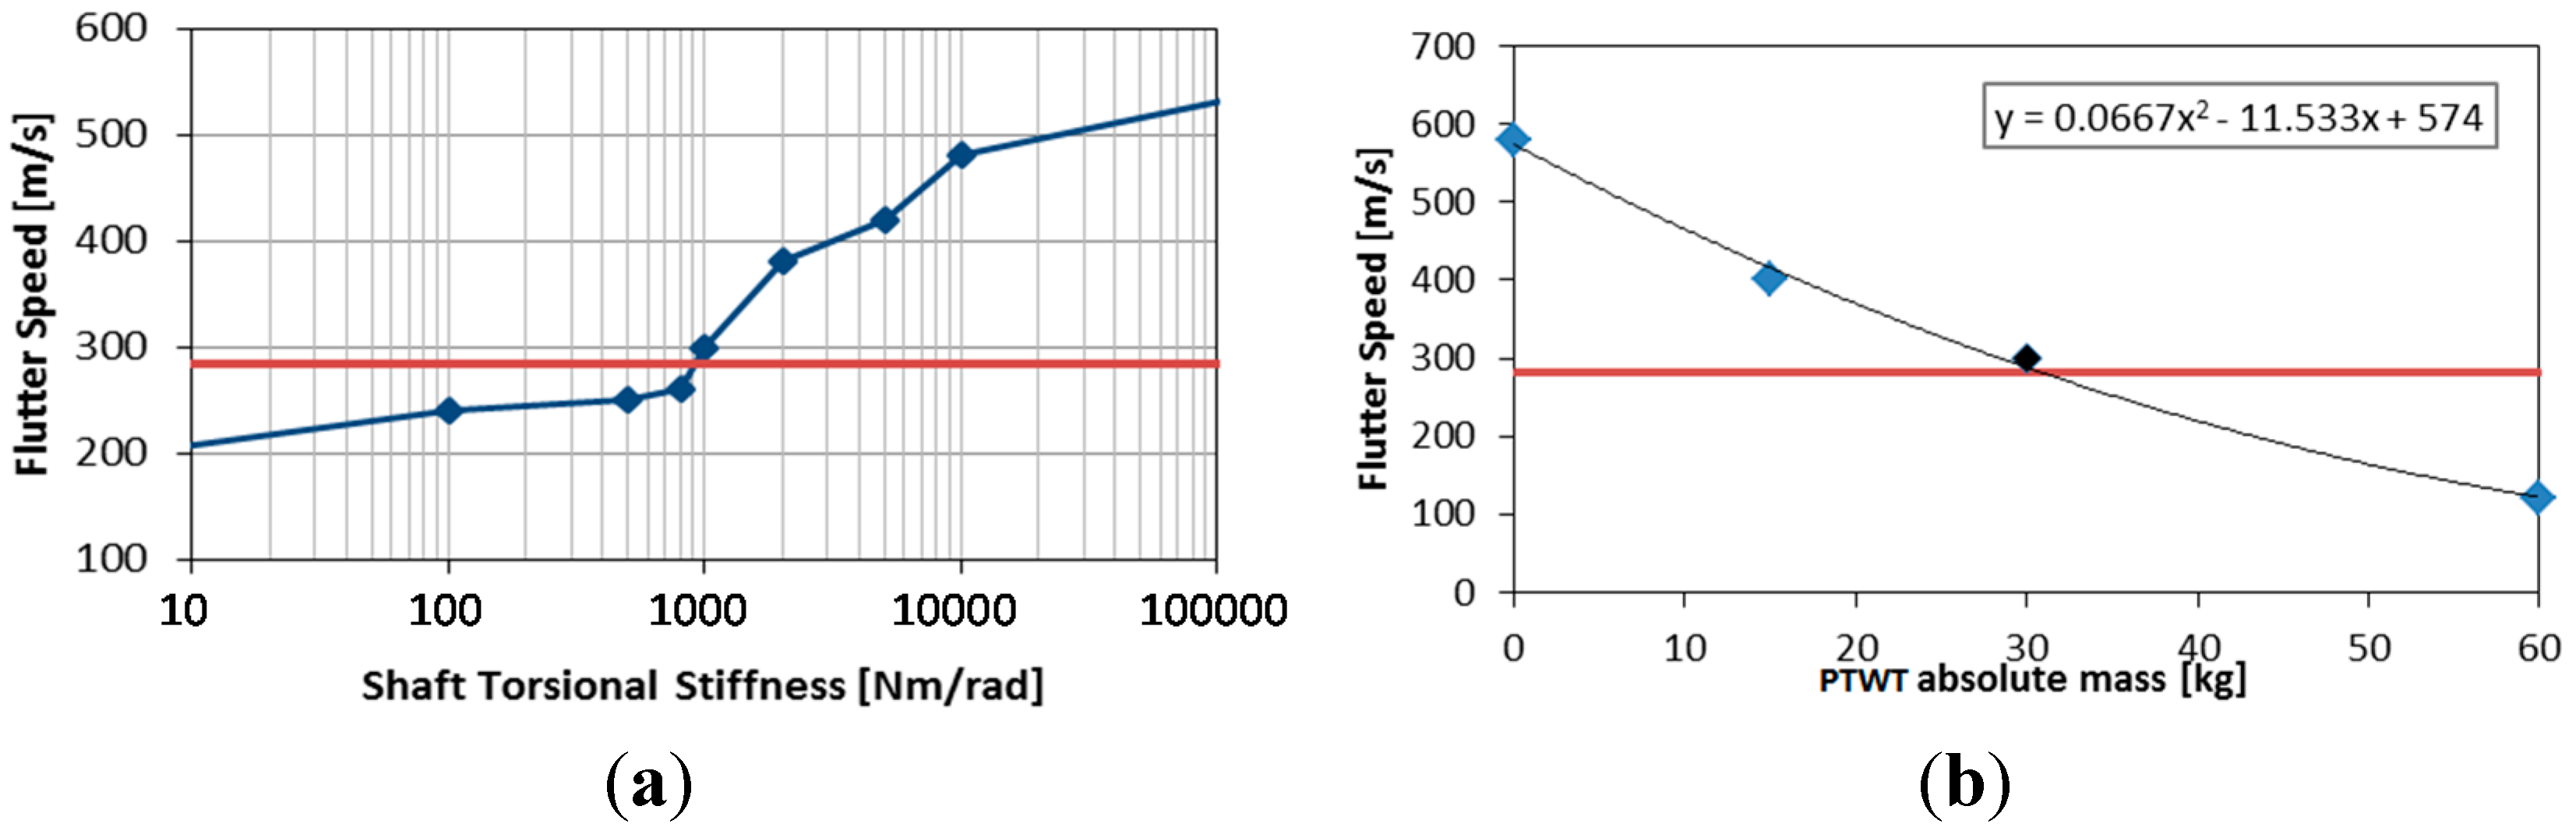
4.1. The PTWT Key Parameters and Influence on Gust Response

| Altitude | Airspeed | H = 9 m | H = 25 m | H = 48.5 m | H = 107 m |
|---|---|---|---|---|---|
| Sea level | VB | −7.7% | −9.7% | −23.4% | −22.0% |
| VC | −5.1% | −12.6% | −21.2% | −9.8% | |
| Cruise altitude | VC | −6.5% | −10.5% | −18.4% | −24.3% |
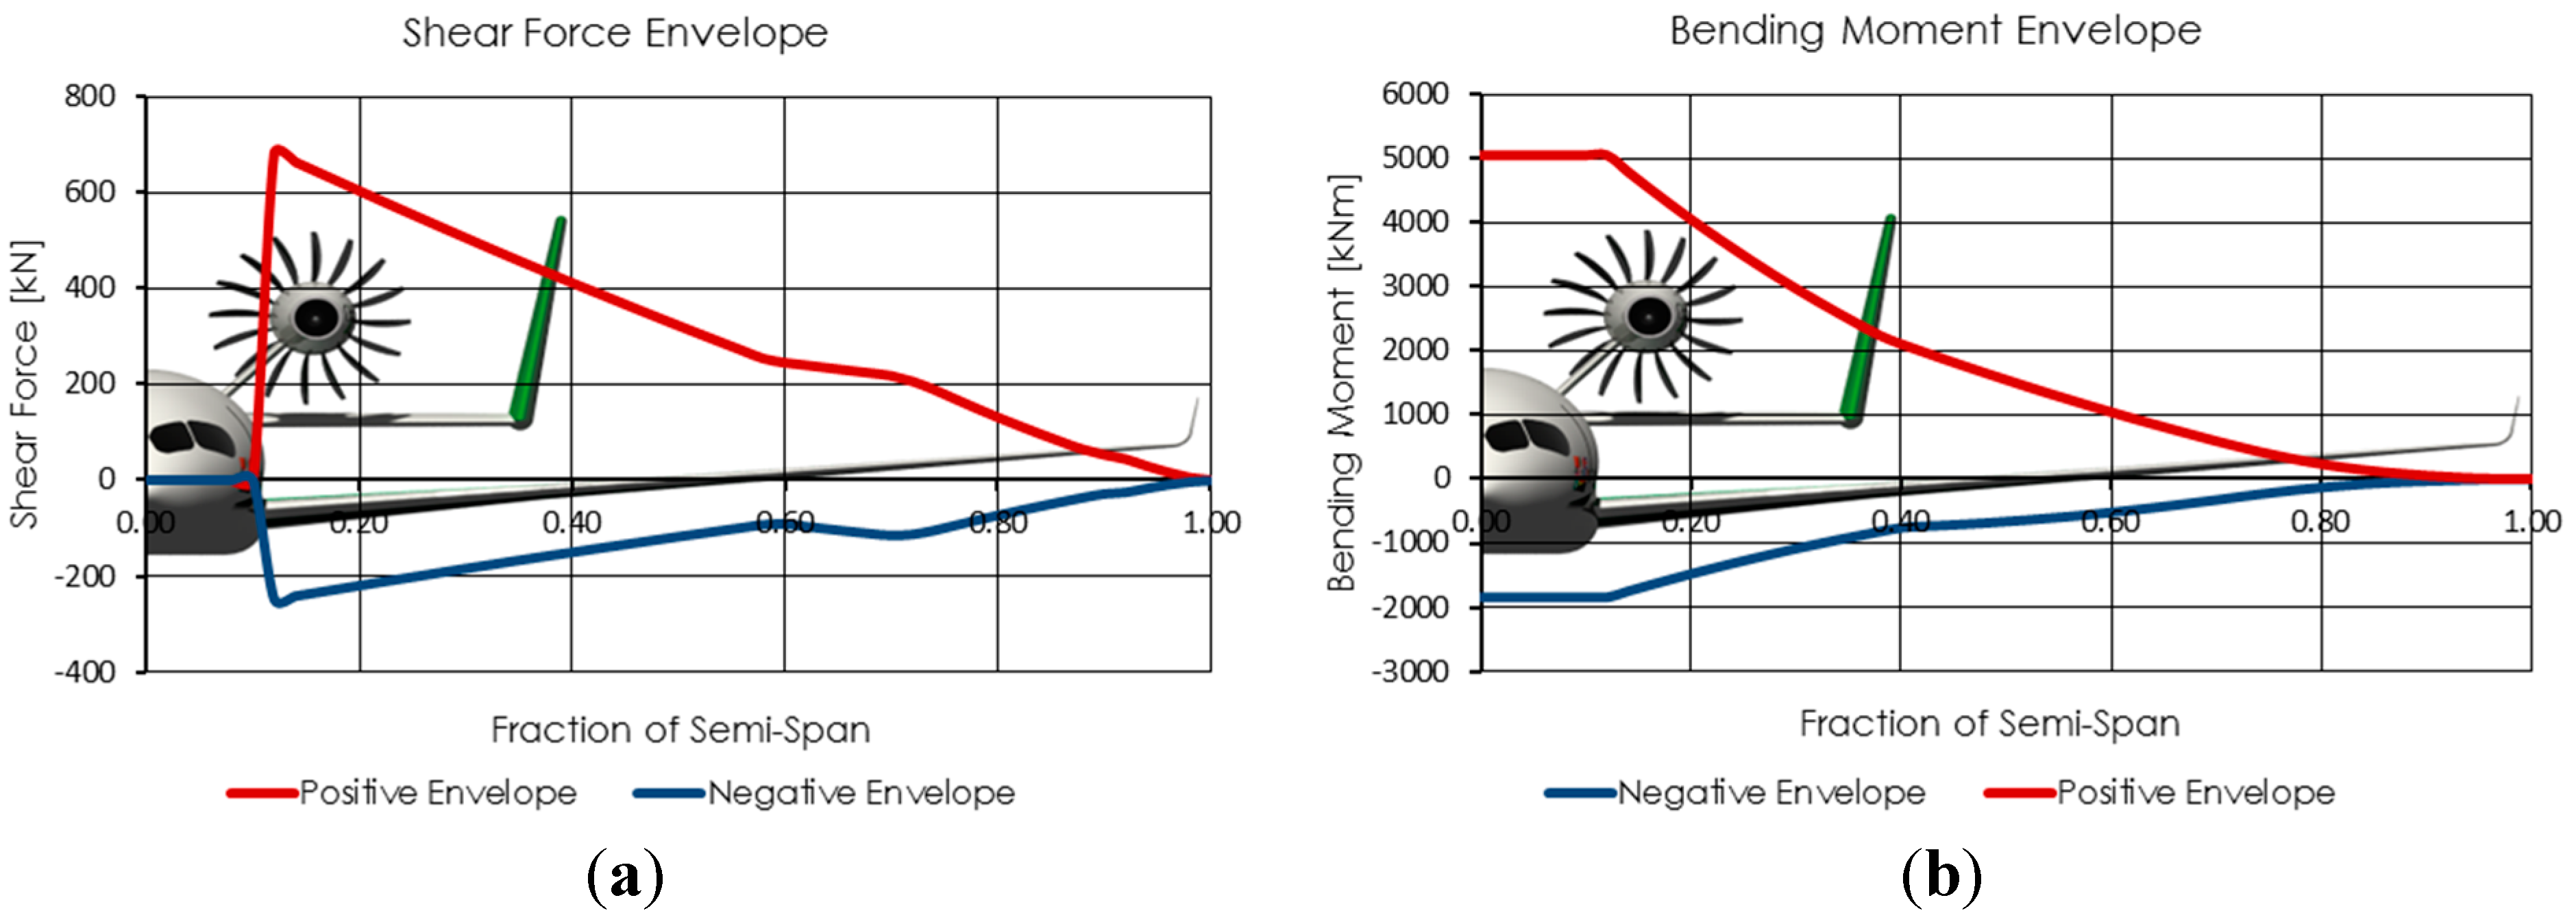
4.2. Gust Response of the Whole Aircraft


| Case | Normal Acceleration at CG | Bending Moment | Wing Deflection |
|---|---|---|---|
| MTOM | −2.4% | −10.6% | −21.2% |
| OEM | −3.2% | −14.4% | −20.6% |
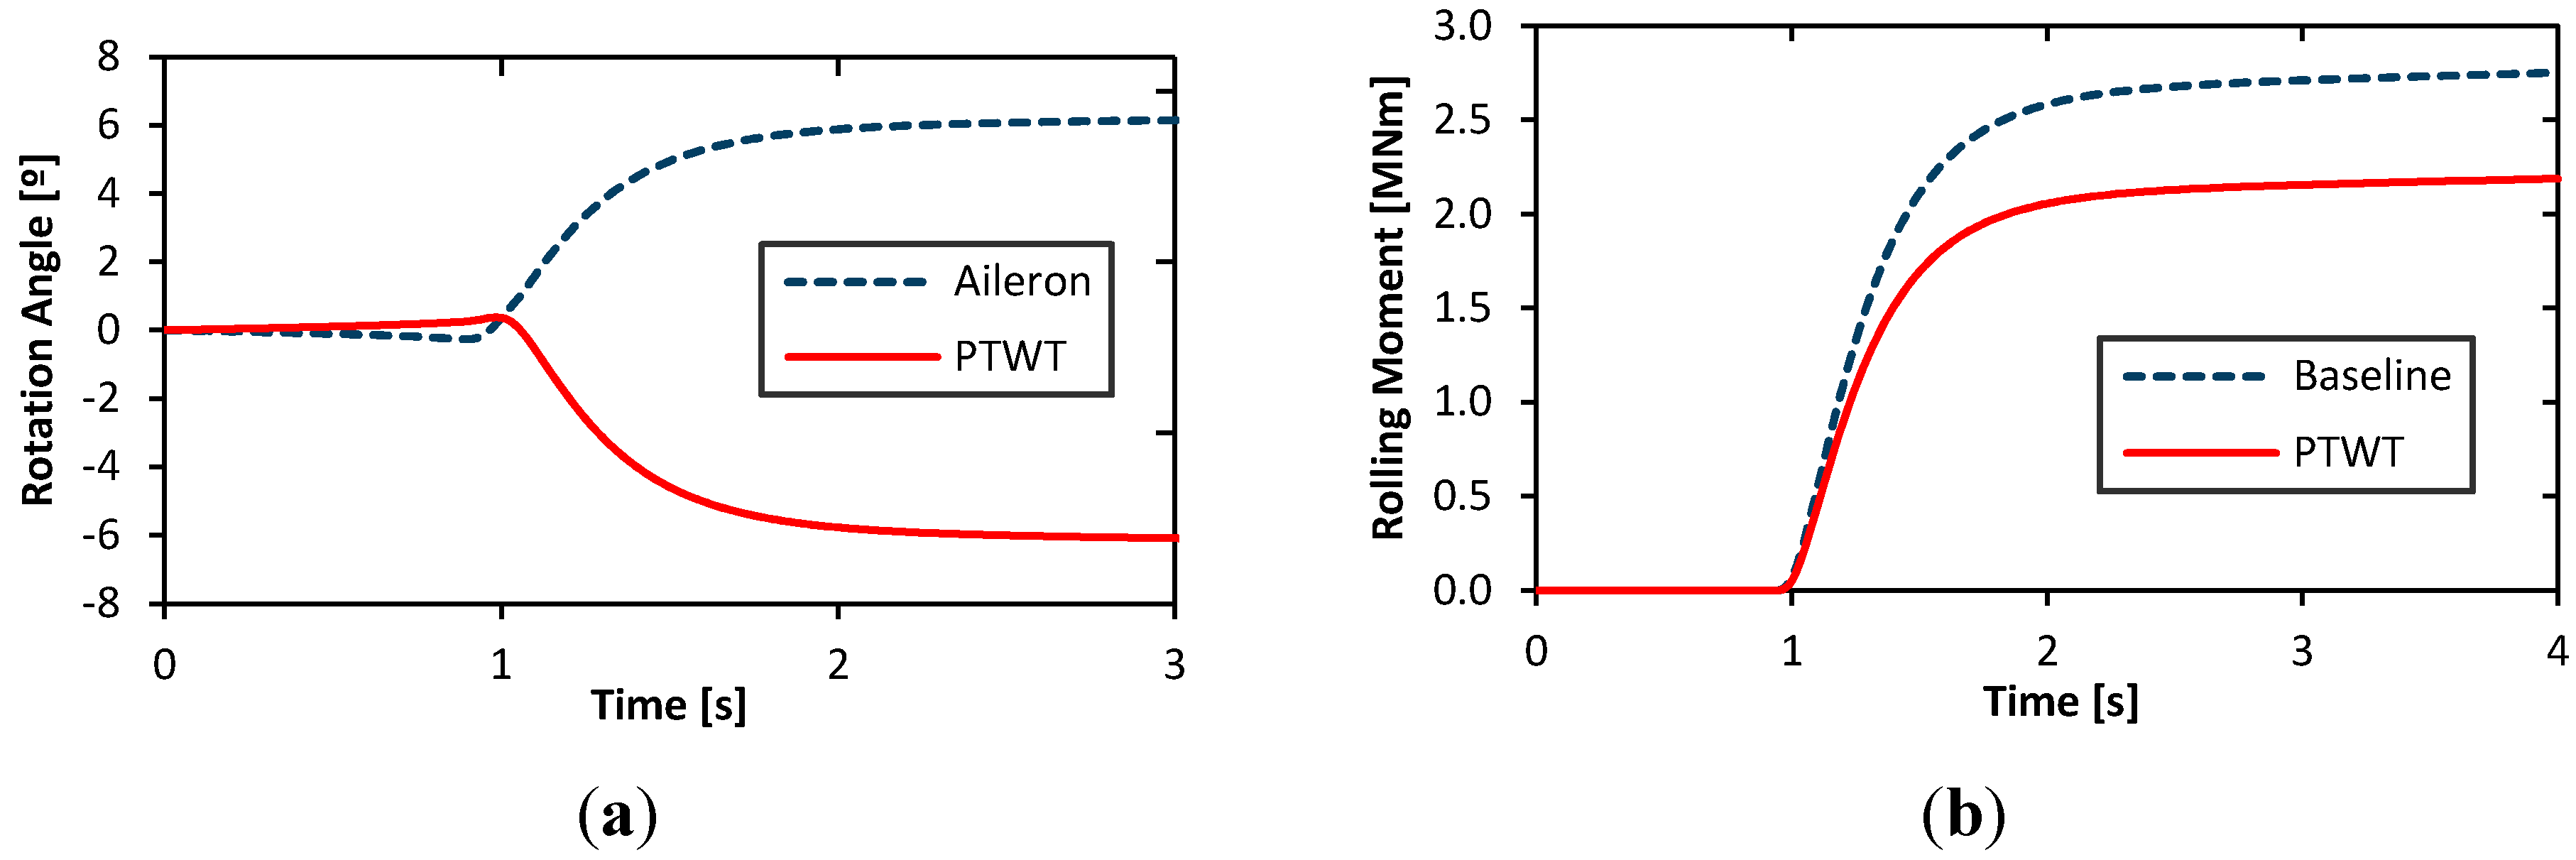
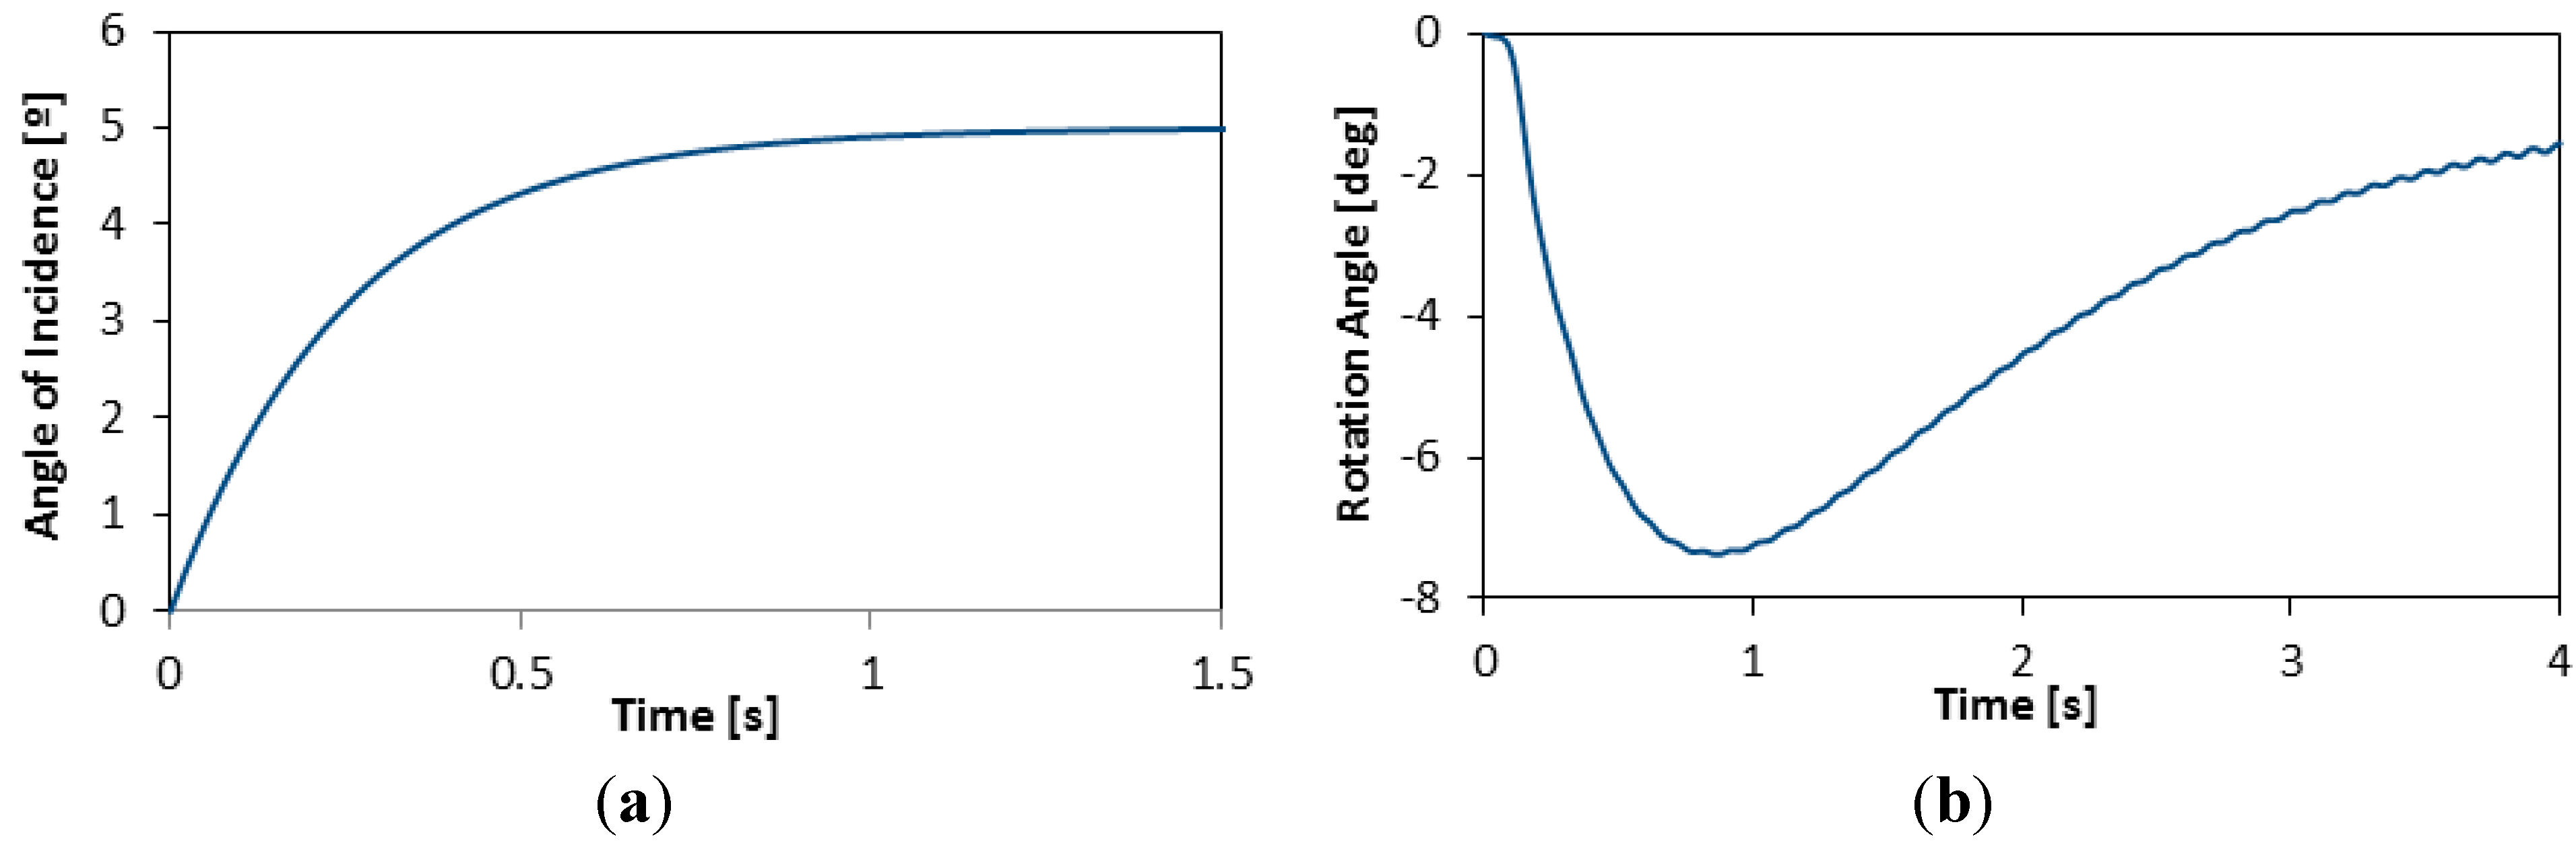
4.3. The PTWT Influence on the Flight Manoeuvre Performance
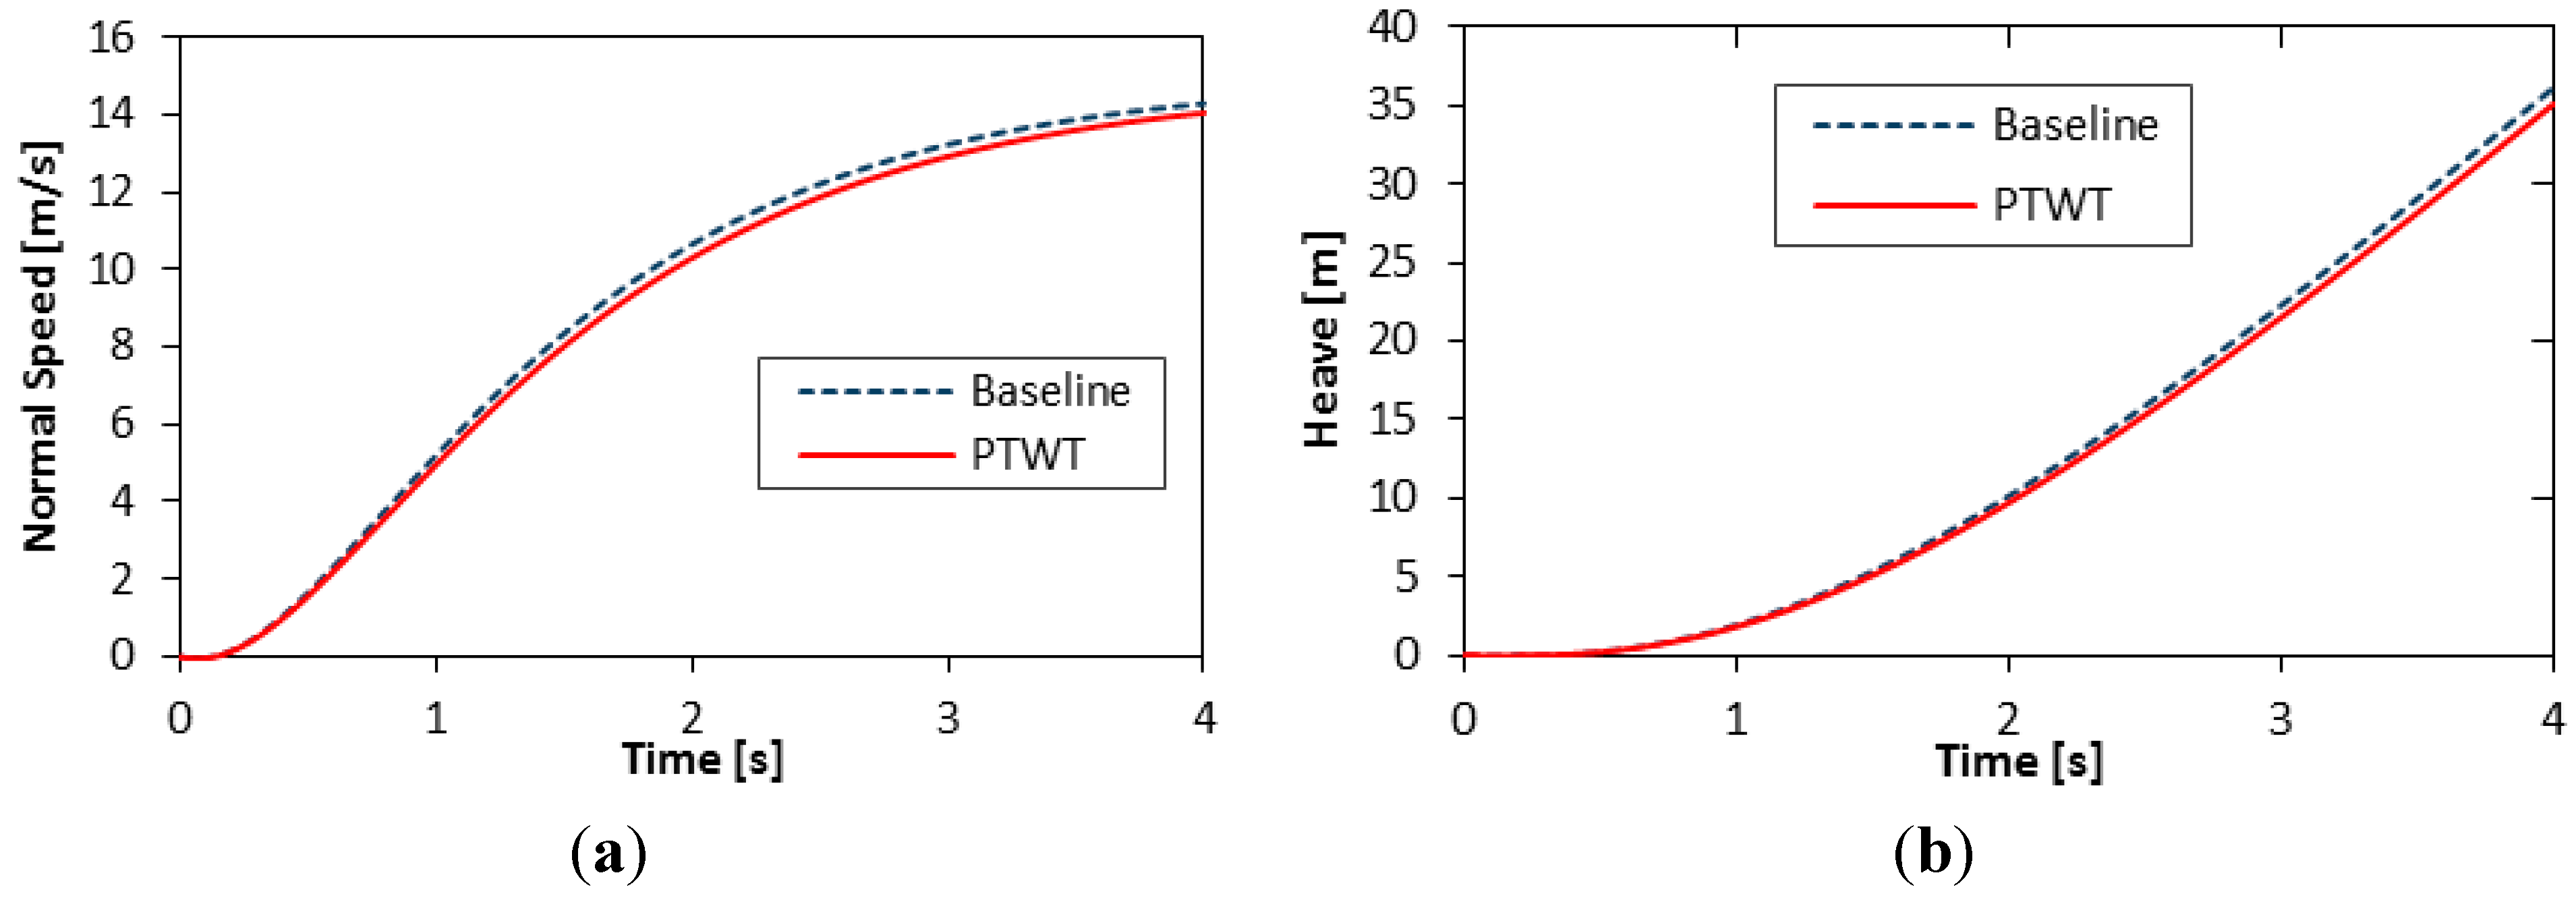
| Parameter | MTOM | OEM |
|---|---|---|
| Max normal acceleration | −2.7% | −2.6% |
| Vertical speed after 4 s | −1.7% | −0.6% |
| Heave after 4 s | −2.9% | −1.6% |

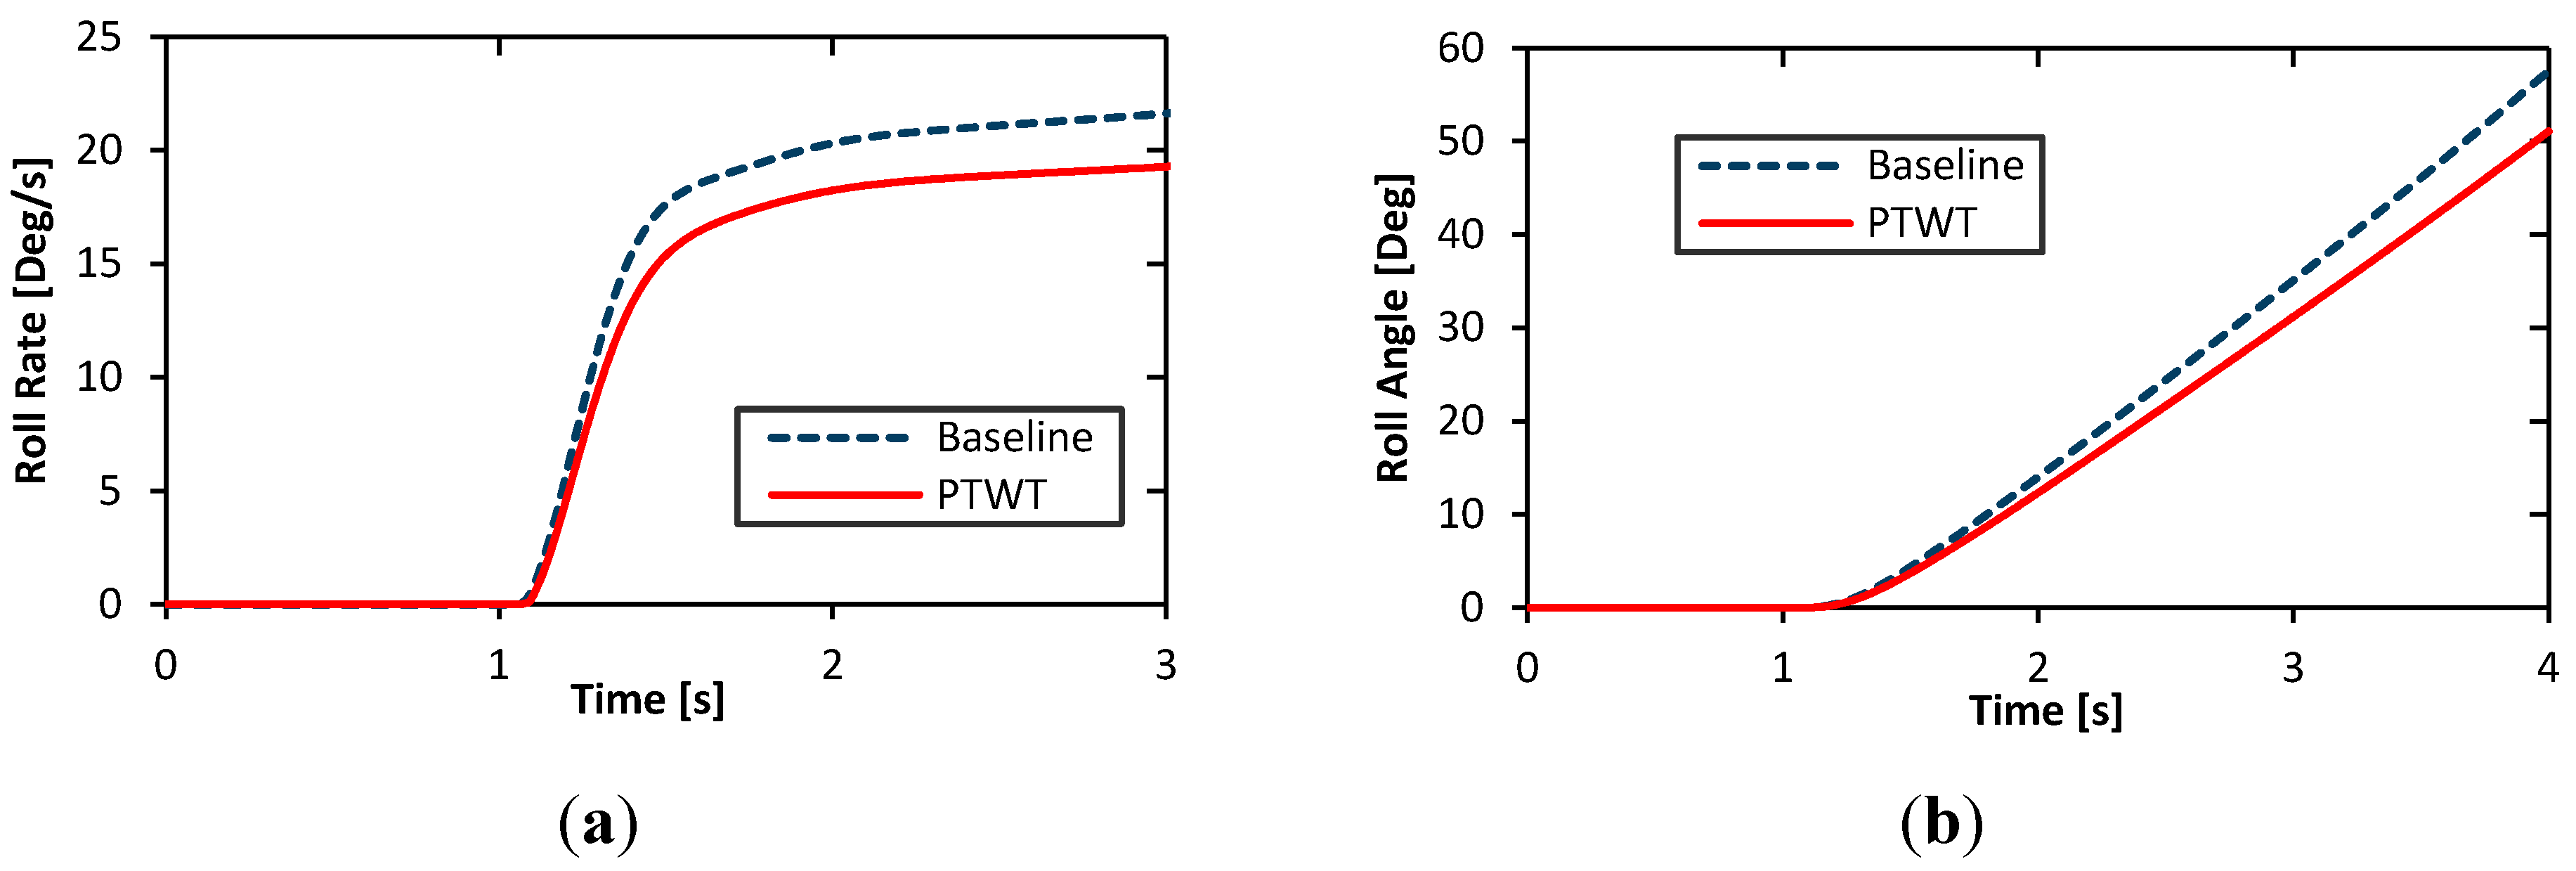
| Parameter | MTOM | OEM |
|---|---|---|
| Maximum roll acceleration | −13.5% | −13.6% |
| Roll rate after 4 s | −11.6% | −11.8% |
| Roll angle after 4 s | −10.6% | −10.8% |
5. Conclusions
Notation
| a1 | Lift curve slope of the wing |
| c | Wing mean chord |
| [Dhh] | Generalized damping matrix |
| E1/E2 | Ply modulus in fiber/off-fiber direction |
| Fg | Flight profile alleviation factor |
| G12 | Shear modulus of the ply |
| H | Gust gradient distance |
| k | Reduced frequency |
| K | Spring stiffness of the PTWT |
| [Khh] | Generalized stiffness matrix |
| L | Aerodynamic lift force |
| {LG} | Gust induced aerodynamic force vector |
| {Lhh} | Unsteady aerodynamic force vector |
| [Mhh] | Generalized mass matrix |
| {qh} | Generalized coordinate vector |
| {QG} | Generalized aerodynamic force due to gust |
| [Qhhi] | Generalized unsteady aerodynamic matric (imaginary part) |
| [QhhR] | Generalized unsteady aerodynamic matric (real part) |
| p | Static pressure |
| s | Reference area of the wing |
| S | Shear strength of ply |
| U | Gust velocity |
| Uds | Design gust velocity |
| Uref | Reference gust velocity |
| V | Airspeed |
| VB | Design speed for maximum gust velocity |
| VC | Cruise airspeed |
| VD | Dive airspeed |
| Vf | Flutter airspeed |
| Xt/Xc | Tension/compression strength of ply in fiber direction |
| Yt/Yc | Tension/compression strength of ply in off-fiber direction |
| Zmo | Maximum operating altitude |
| λ | Decay constant |
| µ | Mass parameter |
| ρ | Air density |
| ν12 | Poisson’s ration of ply |
| ω | Gust frequency |
| [Φ] | Modal matrix of the structure in special coordinates |
Abbreviations
| AoA | Angle of attack |
| CFD | Computational Fluid Dynamics |
| CG | Center of gravity |
| FE | Finite element |
| FI | Failure Index |
| MLM | Maximum landing mass |
| MTOM | Maximum take-off mass |
| MZFM | Maximum zero fuel mass |
| OEM | Operating empty mass |
| PTWP | Passive twist wing tip (device) |
Acknowledgments
Author Contributions
Conflicts of Interest
References
- Baldelli, D.H.; Ohta, H.; Nitta, K. Gust load alleviation of an aeroelastic wing model. Trans. Jpn. Soc. Aeronaut. Spacial Sci. 1993, 36, 125–142. [Google Scholar]
- Honlinger, H.; Zimmermann, H.; Sensburg, O.; Becker, J. Structural Aspects of Active Control Technology; AGARD Flight Mechanics Panel Symposium: Turin, Italy, 1995. [Google Scholar]
- Guo, S.; Cheung, W.; Banerjee, J.R.; Butlar, R. Gust alleviation and flutter suppression of an optimized composite wing. In Proceedings of the International Forum on Aeroelasticity and Structural Dynamics, Manchester, UK, 24–26 June 1995; p. 41.
- Moulin, B.; Karpel, M. Gust loads alleviation using special control surfaces. J. Aircr. 2007, 44, 17–25. [Google Scholar] [CrossRef]
- Dillsaver, M.J.; Cesnik, C.E.S. Gust load alleviation control for very flexible aircraft. In Proceedings of the AIAA Atmospheric Flight Mechanics Conference, Portland, OR, USA, 8–11 August 2011.
- Britt, R.; Jacobson, S.; Arthurs, T. Aeroservoelastic Analysis of the B-2 Bomber. J. Aircr. 2000, 37, 745–752. [Google Scholar] [CrossRef]
- Guo, S.; Fu, Q.; Sensburg, O.K. Optimal design of a passive gust alleviation device for a flying wing aircraft. In Proceedings of the 12th AIAA ATIO/14th AIAA/ISSMO MAO Conference, Session MAO-25, Indianapolis, IN, USA, 17–19 September 2012.
- Miller, S.; Vio, G.A.; Cooper, J.E.; Sensburg, O.K. Optimisation of a scaled sensorcraft model with passive gust alleviation. In Proceedings of the 12th AIAA/ISSMO Multidisciplinary Analysis and Optimization Conference, MAO, Victoria, BC, Canada, 10–12 September 2008.
- Vartio, E.; Shimko, A.; Tilmann, C.P.; Flick, P.M. Structural Modal Control and Gust Load Alleviation for a SensorCraft Concept. In Proceedings of the 46th AIAA/ASME/ASCE/AHS/ASC Structures, Structural Dynamics & Materials Conference, Austin, TX, USA, 18–21 April 2005.
- Tilmann, C.P.; Flick, P.M.; Martin, C.A.; Love, M.H. High-altitude long endurance technologies for sensorcraft, RTO Paper MP-104-P-26. In Proceedings of the RTO AVT-099 Symposium on Novel and Emerging Vehicle and Vehicle Technology Concepts, Brussels, Belgium, 7–11 April 2003.
- Reich, G.; Raveh, D.; Zink, P. Application of Active Aeroelastic Wing Technology to a Joined-Wing SensorCraft. In Proceedings of the AIAA Paper 2002–1633 43rd AIAA/ASME/ASCE/AHS/ASC Structures, Structural Dynamics, and Materials Conference, Denver, CO, USA, 22–25 April 2002.
- Reich, G.W.; Bowman, J.C.; Sanders, B. Application of Adaptive Structures Technology to High Altitude Long Endurance Sensor Platforms. In Proceedings of the 13th International Conference on Adaptive Structures and Technologies, Potsdam, Germany, 7–9 October 2002; pp. 423–434.
- European Aviation Safety Agency. CS-25 Certification Specification for Large Aircraft; European Aviation Safety Agency: Cologne, Germany, 2012. [Google Scholar]
- Engineering Science Data Unit (ESDU). Elastic Buckling of Long, Symmetrically-Laminated (ASBODF) Composite Stiffened Panels ans Struts in Compression; HIS ESDU: London, UK, 2003; Number 03001. [Google Scholar]
- Niu, M.C. Airframe Stress Analysis and Sizing, 2nd ed.; Conmilit Press Ltd.: Hong Kong, China, 1999. [Google Scholar]
- Rodden, W.P.; Johnson, E.H. MSC/NASTRAN Aeroelastic Analysis: User’s guide Version 68; MacNeal-Schwendler Corporation: Newport Beach, CA, USA, 2004. [Google Scholar]
- Albano, E.; Rodden, W.P. A doublet-lattice method for calculating lift distributions on oscillating surfaces in subsonic flows. AIAA J. 1969, 7, 279–285. [Google Scholar] [CrossRef]
- Giesing, J.P.; Kalman, T.P.; Rodden, W.P. Subsonic steady and oscillatory aerodynamics for multiple interfering wings and bodies. J. Aircr. 1972, 9, 693–702. [Google Scholar] [CrossRef]
- Glauert, H. The Elements of Aerofoil and Airscrew Theory; Cambridge University Press: Cambridge, UK, 1948. [Google Scholar]
- Jaime Espinosa de los Monteros, J. A-13 Voyager. Design of the Outer Wing and Winglet in Composite Materials. M.Sc. Thesis, Cranfield University, Cranfield, UK, 2013. [Google Scholar]
- Hexcel’s Prepreg Data Sheets. Available online: http://hexcel.com/Resources/prepreg-data-sheets (accessed on 30 March 2015).
- Wright, J.R.; Cooper, J.E. Introduction to Aircraft Aeroelasticity and Loads; American Institute of Aeronautics and Astronautics: Reston, VA, USA, 2007. [Google Scholar]
© 2015 by the authors; licensee MDPI, Basel, Switzerland. This article is an open access article distributed under the terms and conditions of the Creative Commons Attribution license (http://creativecommons.org/licenses/by/4.0/).
Share and Cite
Guo, S.; De Los Monteros, J.E.; Liu, Y. Gust Alleviation of a Large Aircraft with a Passive Twist Wingtip. Aerospace 2015, 2, 135-154. https://doi.org/10.3390/aerospace2020135
Guo S, De Los Monteros JE, Liu Y. Gust Alleviation of a Large Aircraft with a Passive Twist Wingtip. Aerospace. 2015; 2(2):135-154. https://doi.org/10.3390/aerospace2020135
Chicago/Turabian StyleGuo, Shijun, Jaime Espinosa De Los Monteros, and Ying Liu. 2015. "Gust Alleviation of a Large Aircraft with a Passive Twist Wingtip" Aerospace 2, no. 2: 135-154. https://doi.org/10.3390/aerospace2020135