Next Issue
Volume 6, December
Previous Issue
Volume 6, June


Climate, Volume 6, Issue 3 (September 2018) – 24 articles

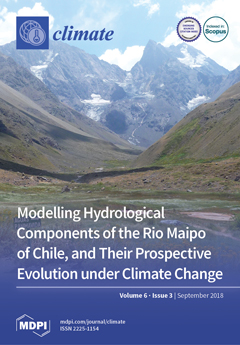
Cover Story (view full-size image): We used historical data and the results of field studies to set up the Poly-Hydro model in order to assess the main hydrological components of the snow/ice melt-driven Maipo river of Chile, as well as glaciers’ retreat under climate change in the last three decades. We subsequently forced the model with climate projections up to 2100 from three GCMs from the IPCC AR5, under three different representative concentration pathways (RCPs 2.6, 4.5, 8.5). We investigated potential trends of precipitation, temperature, and stream flows until 2100 in the projection period (PR, 2014–2100) and the whole period (CM, 1980–2100, composite) against historical trends in the control period (CP, 1980–2013). Our results demonstrate the largest potential for droughts during summer in the Maipo river, in addition to largely decreasing ice cover in the area. View the paper
  • Issues are regarded as officially published after their release is announced to the table of contents alert mailing list.
  • You may sign up for e-mail alerts to receive table of contents of newly released issues.
  • PDF is the official format for papers published in both, html and pdf forms. To view the papers in pdf format, click on the "PDF Full-text" link, and use the free Adobe Reader to open them.
Order results
Result details
Section
Select all
Export citation of selected articles as:
15 pages, 2766 KiB  
Article
The Value of Tactical Adaptation to El Niño–Southern Oscillation for East Australian Wheat
by Bangyou Zheng, Scott Chapman and Karine Chenu
Climate 2018, 6(3), 77; https://doi.org/10.3390/cli6030077 - 11 Sep 2018
Cited by 12 | Viewed by 6077
Abstract
El Niño–Southern Oscillation strongly influences rainfall and temperature patterns in Eastern Australia, with major impacts on frost, heat, and drought stresses, and potential consequences for wheat production. Wheat phenology is a key factor to adapt to the risk of frost, heat, and drought [...] Read more.
El Niño–Southern Oscillation strongly influences rainfall and temperature patterns in Eastern Australia, with major impacts on frost, heat, and drought stresses, and potential consequences for wheat production. Wheat phenology is a key factor to adapt to the risk of frost, heat, and drought stresses in the Australian wheatbelt. This study explores broad and specific options to adapt wheat cropping systems to El Niño–Southern Oscillation, and more specifically, to the Southern Oscillation Index (SOI) phases ahead of the season (i.e., April forecast) in Eastern Australia, when wheat producers make their most crucial management decisions. Crop model simulations were performed for commercially-grown wheat varieties, as well as for virtual genotypes representing possible combinations of phenology alleles that are currently present in the Australian wheat germplasm pool. Different adaptation strategies were tested at the site level, across Eastern Australia, for a wide range of sowing dates and nitrogen applications over long-term historical weather records (1900–2016). The results highlight that a fixed adaptation system, with genotype maturities, sowing time, and nitrogen application adapted to each location would greatly increase wheat productivity compared to sowing a mid-maturity genotype, mid-season, using current practices for nitrogen applications. Tactical adaptation of both genotype and management to the different SOI phases and to different levels of initial Plant Available Water (‘PAW & SOI adaptation’) resulted in further yield improvement. Site long-term increases in yield and gross margin were up to 1.15 t·ha−1 and AU$ 223.0 ha−1 for fixed adaptation (0.78 t·ha−1 and AU$ 153 ha−1 on average across the whole region), and up to an extra 0.26 t·ha−1 and AU$ 63.9 ha−1 for tactical adaptation. For the whole eastern region, these results correspond to an annual AU$ 440 M increase for the fixed adaptation, and an extra AU$ 188 M for the PAW & SOI tactical adaptation. The benefits of PAW & SOI tactical adaptation could be useful for growers to adjust farm management practices according to pre-sowing seasonal conditions and the seasonal climate forecast. Full article
(This article belongs to the Special Issue Sustainable Agriculture for Climate Change Adaptation)
Show Figures

Figure 1

17 pages, 5144 KiB  
Article
Evaluation of Gridded Multi-Satellite Precipitation Estimation (TRMM-3B42-V7) Performance in the Upper Indus Basin (UIB)
by Asim Jahangir Khan, Manfred Koch and Karen Milena Chinchilla
Climate 2018, 6(3), 76; https://doi.org/10.3390/cli6030076 - 07 Sep 2018
Cited by 18 | Viewed by 5348
Abstract
The present study aims to evaluate the capability of the Tropical Rainfall Measurement Mission (TRMM), Multi-satellite Precipitation Analysis (TMPA), version 7 (TRMM-3B42-V7) precipitation product to estimate appropriate precipitation rates in the Upper Indus Basin (UIB) by analyzing the dependency of the estimates’ accuracies [...] Read more.
The present study aims to evaluate the capability of the Tropical Rainfall Measurement Mission (TRMM), Multi-satellite Precipitation Analysis (TMPA), version 7 (TRMM-3B42-V7) precipitation product to estimate appropriate precipitation rates in the Upper Indus Basin (UIB) by analyzing the dependency of the estimates’ accuracies on the time scale. To that avail, various statistical analyses and comparison of Multisatellite Precipitation Analysis (TMPA) products with gauge measurements in the UIB are carried out. The dependency of the TMPA estimates’ quality on the aggregation time scale is analyzed by comparisons of daily, monthly, seasonal and annual sums for the UIB. The results show considerable biases in the TMPA Tropical Rainfall Measurement Mission (TRMM) precipitation estimates for the UIB, as well as high numbers of false alarms and miss ratios. The correlation of the TMPA estimates with ground-based gauge data increases considerably and almost in a linear fashion with increasing temporal aggregation, i.e., time scale. There is a predominant trend of underestimation of the TRMM product across the UIB at most of the gauge stations, i.e., TRMM-estimated rainfall is generally lower than the gauge-measured rainfall. For the seasonal aggregates, the bias is mostly positive for the summer but predominantly negative for the winter season, thereby showing a slight overestimation of the precipitation in summer and underestimation in winter. The results of the study suggest that, in spite of these discrepancies between TMPA estimates and gauge data, the use of the former in hydrological watershed modeling undertaken by the authors may be a valuable alternative in data-scarce regions like the UIB, but still must be taken with a grain of salt. Full article
(This article belongs to the Special Issue Impact of Climate-Change on Water Resources)
Show Figures

Figure 1

15 pages, 2383 KiB  
Article
Spatial and Temporal Rainfall Variability over the Mountainous Central Pindus (Greece)
by Stefanos Stefanidis and Dimitrios Stathis
Climate 2018, 6(3), 75; https://doi.org/10.3390/cli6030075 - 06 Sep 2018
Cited by 19 | Viewed by 4332
Abstract
In this study, the authors evaluated the spatial and temporal variability of rainfall over the central Pindus mountain range. To accomplish this, long-term (1961–2016) monthly rainfall data from nine rain gauges were collected and analyzed. Seasonal and annual rainfall data were subjected to [...] Read more.
In this study, the authors evaluated the spatial and temporal variability of rainfall over the central Pindus mountain range. To accomplish this, long-term (1961–2016) monthly rainfall data from nine rain gauges were collected and analyzed. Seasonal and annual rainfall data were subjected to Mann–Kendall tests to assess the possible upward or downward statistically significant trends and to change-point analyses to detect whether a change in the rainfall time series mean had taken place. Additionally, Sen’s slope method was used to estimate the trend magnitude, whereas multiple regression models were developed to determine the relationship between rainfall and geomorphological factors. The results showed decreasing trends in annual, winter, and spring rainfalls and increasing trends in autumn and summer rainfalls, both not statistically significant, for most stations. Rainfall non-stationarity started to occur in the middle of the 1960s for the annual, autumn, spring, and summer rainfalls and in the early 1970s for the winter rainfall in most of the stations. In addition, the average magnitude trend per decade is approximately −1.9%, −3.2%, +0.7%, +0.2%, and +2.4% for annual, winter, autumn, spring, and summer rainfalls, respectively. The multiple regression model can explain 62.2% of the spatial variability in annual rainfall, 58.9% of variability in winter, 75.9% of variability in autumn, 55.1% of variability in spring, and 32.2% of variability in summer. Moreover, rainfall spatial distribution maps were produced using the ordinary kriging method, through GIS software, representing the major rainfall range within the mountainous catchment of the study area. Full article
(This article belongs to the Special Issue Climate Variability and Change in the 21th Century)
Show Figures

Figure 1

3 pages, 168 KiB  
Correction
Correction: Khatiwada, K.R.; et al. Hydro-Climatic Variability in the Karnali River Basin of Nepal Himalaya. Climate 2016, 4, 17
by Kabi Raj Khatiwada, Jeeban Panthi, Madan Lall Shrestha and Santosh Nepal
Climate 2018, 6(3), 74; https://doi.org/10.3390/cli6030074 - 05 Sep 2018
Viewed by 2984
Abstract
The authors wish to make the following correction to this paper [...] Full article
16 pages, 2219 KiB  
Article
Past and Future Precipitation Trend Analysis for the City of Niamey (Niger): An Overview
by Velia Bigi, Alessandro Pezzoli and Maurizio Rosso
Climate 2018, 6(3), 73; https://doi.org/10.3390/cli6030073 - 05 Sep 2018
Cited by 21 | Viewed by 6077
Abstract
Despite the interest in detecting the extremes of climate in the West African Sahel, few studies have been specifically conducted on the Republic of Niger. This research focuses on past, present, and future precipitation trends for the city of Niamey through the combined [...] Read more.
Despite the interest in detecting the extremes of climate in the West African Sahel, few studies have been specifically conducted on the Republic of Niger. This research focuses on past, present, and future precipitation trends for the city of Niamey through the combined assessment of WMO precipitation indices using RClimDex and the Standardized Precipitation Index. Past daily precipitation data were derived from a 60-year reconstructed meteorological dataset for the Niamey airport station for the period of 1950–2009 and validated through comparison with an observed time series at Niamey airport (1980–2012). Precipitation analysis confirms the literature’s findings, in particular, a decreasing trend in total precipitation over the period of 1950–2009, and a positive trend for data that spans over the period of 1980–2009, suggesting a precipitation recovery after the dry epoch (1968–1985), even if the deficit with the wettest years in the period of 1950–1968 has not been made up. Furthermore, WATCH-Forcing-Data-ERA-Interim projections, elaborated under RCP 4.5 and RCP 8.5 socio-economic conditions, show that precipitation will increase in the future. Therefore, the Nigerien population will benefit from increased rainfall, but will also have to cope with the exacerbation of both flood and drought risks due to a great interannual variability that can positively or negatively influence water availability. Full article
(This article belongs to the Special Issue Climate Services for Local Disaster Risk Reduction in Africa)
Show Figures

Figure 1

18 pages, 1557 KiB  
Article
The Hiatus in Global Warming and Interactions between the El Niño and the Pacific Decadal Oscillation: Comparing Observations and Modeling Results
by Knut L. Seip and Hui Wang
Climate 2018, 6(3), 72; https://doi.org/10.3390/cli6030072 - 04 Sep 2018
Cited by 3 | Viewed by 10397
Abstract
Ocean oscillations interact across large regions and these interactions may explain cycles in global temperature anomaly, including hiatus periods. Here, we examine ocean interaction measures and compare results from model simulations to observations for El Niño and the Pacific decadal oscillation (PDO). We [...] Read more.
Ocean oscillations interact across large regions and these interactions may explain cycles in global temperature anomaly, including hiatus periods. Here, we examine ocean interaction measures and compare results from model simulations to observations for El Niño and the Pacific decadal oscillation (PDO). We use the global climate model of the Met Office Hadley Centre. A relatively novel method for identifying running leading-agging LL-relations show that the observed El Niño generally leads the observed PDO and this pattern is strengthened in the simulations. However, LL-pattern in both observations and models shows that there are three periods, around 1910–1920, around 1960 and around 2000 where El Niño lags PDO, or the leading signature is weak. These periods correspond to hiatus periods in global warming. The power spectral density analysis, (PSD), identifies various ocean cycle lengths in El Niño and PDO, but the LL-algorithm picks out common cycles of 7–8 and 24 years that shows leading-lagging relations between them. Full article
(This article belongs to the Special Issue Postmortem of the Global Warming Hiatus)
Show Figures

Figure 1

8 pages, 2820 KiB  
Article
Dominant Modes of Upper Ocean Heat Content in the North Indian Ocean
by Meer Mohammed Ali, Neetu Singh, Manchikanti Suresh Kumar, Yangxing Zheng, Mark Bourassa, Chandra Mohan Kishtawal and Chandu Venkateswara Rao
Climate 2018, 6(3), 71; https://doi.org/10.3390/cli6030071 - 03 Sep 2018
Cited by 4 | Viewed by 5088
Abstract
The thermal energy needed for the development of hurricanes and monsoons as well as any prolonged marine weather event comes from layers in the upper oceans, not just from the thin layer represented by sea surface temperature alone. Ocean layers have different modes [...] Read more.
The thermal energy needed for the development of hurricanes and monsoons as well as any prolonged marine weather event comes from layers in the upper oceans, not just from the thin layer represented by sea surface temperature alone. Ocean layers have different modes of thermal energy variability because of the different time scales of ocean–atmosphere interaction. Although many previous studies have focused on the influence of upper ocean heat content (OHC) on tropical cyclones and monsoons, no study thus far—particularly in the North Indian Ocean (NIO)—has specifically concluded the types of dominant modes in different layers of the ocean. In this study, we examined the dominant modes of variability of OHC of seven layers in the NIO during 1998–2014. We conclude that the thermal variability in the top 50 m of the ocean had statistically significant semiannual and annual modes of variability, while the deeper layers had the annual mode alone. Time series of OHC for the top four layers were analyzed separately for the NIO, Arabian Sea, and Bay of Bengal. For the surface to 50 m layer, the lowest and the highest values of OHC were present in January and May every year, respectively, which was mainly caused by the solar radiation cycle. Full article
Show Figures

Graphical abstract

14 pages, 5299 KiB  
Article
Urban Cold and Heat Island in the City of Bragança (Portugal)
by Artur Gonçalves, Gabriella Ornellas, António Castro Ribeiro, Filipe Maia, Alfredo Rocha and Manuel Feliciano
Climate 2018, 6(3), 70; https://doi.org/10.3390/cli6030070 - 31 Aug 2018
Cited by 25 | Viewed by 10073
Abstract
The thermal environment is an important aspect of the urban environment because it affects the quality of life of urban residents and the energy use in buildings. Urban Heat Island (UHI) and Urban Cold Island (UCI) are complementary effects that are the consequence [...] Read more.
The thermal environment is an important aspect of the urban environment because it affects the quality of life of urban residents and the energy use in buildings. Urban Heat Island (UHI) and Urban Cold Island (UCI) are complementary effects that are the consequence of cities’ structures interference with the local climate. This article presents results from five years of urban climate monitoring (2012–2016) in a small Portuguese city (Bragança) using a dense meteorological network of 23 locations covering a wide array of Local Climate Zones (LCZ), from urban areas to nearby rural areas. Results show the presence of both the UHI effect, from mid-afternoon until sunrise, and the UCI after sunrise, both being more intense under the dense midrise urban context and during the summer. Urban Green Spaces had an impact on both UHI and UCI, with an important role in cooling areas of the city during daytime in the summer. Other LCZs had less impact on local thermal conditions. Despite the small size of this city, both effects (UHI and UCI) had a relevant intensity with an impact on local climate conditions. Both effects tend to decrease in intensity with increasing wind speed and precipitation. Full article
(This article belongs to the Special Issue Social-Ecological Systems, Climate and Global Change Impacts)
Show Figures

Figure 1

21 pages, 3318 KiB  
Article
Quality Control of Global Horizontal Irradiance Estimates through BSRN, TOACs and Air Temperature/Sunshine Duration Test Procedures
by Bikhtiyar Ameen, Heiko Balzter and Claire Jarvis
Climate 2018, 6(3), 69; https://doi.org/10.3390/cli6030069 - 27 Aug 2018
Cited by 9 | Viewed by 4591
Abstract
Solar Radiation (SR) data are required for many disciplines and applications. The ground measurement of SR data is hampered by technical and operational errors. Therefore, several approaches have been developed to detect these errors. This study aimed to compare two quality tests of [...] Read more.
Solar Radiation (SR) data are required for many disciplines and applications. The ground measurement of SR data is hampered by technical and operational errors. Therefore, several approaches have been developed to detect these errors. This study aimed to compare two quality tests of hourly Global Horizontal Irradiance (GHI) estimates through the Baseline Surface Radiation Network (BSRN) of the World Meteorological Organization (WMO) and Top of Atmosphere irradiance and Clear sky (TOACs) on a horizontal plane. Each of these tests has a threshold to pass data, which leads to different results. A newly developed quality test method is presented that uses Sunshine Duration (SD) and Air Temperature (AT) to check hourly GHI and is applied to data from 20 meteorological stations in northeast Iraq. The new method was validated using independent high quality data from six stations in various regions with the same climate regime. The method consists of several tests that compare ground data with upper and lower limits of radiation at the top of the atmosphere, using a clear sky radiation model and the relation between SD and AT with SR to determine data values of dubious quality. The rate of error flags generally range from 1% to 27%. The findings show that SD and AT can be used to support other quality tests and to detect nearly 2% additional dubious data values compared to BSRN and TOACs tests. The SD test tends to work like a consistency check but AT does not work like that according to the validation result. However, AT can be used to test the plausibility of data. The argument for using AT in this study may be impractical for other climate conditions. The results suggest that a combination of tests can lead to a better quality of ground data, especially when the components of SR are unviable. Using climate variables for further checks is another possibility. Full article
Show Figures

Figure 1

16 pages, 3448 KiB  
Article
Leftover Spaces for the Mitigation of Urban Overheating in Municipal Beirut
by Noushig Kaloustian, David Aouad, Gabriele Battista and Michele Zinzi
Climate 2018, 6(3), 68; https://doi.org/10.3390/cli6030068 - 21 Aug 2018
Cited by 19 | Viewed by 5692
Abstract
The Urban Heat Island phenomenon and urban overheating are serious consequences of urbanization resulting in impacts on thermal comfort levels, heat stress and even mortality. This paper builds on previous findings on the topic of non-constructible parcels, small vacant or built spaces in [...] Read more.
The Urban Heat Island phenomenon and urban overheating are serious consequences of urbanization resulting in impacts on thermal comfort levels, heat stress and even mortality. This paper builds on previous findings on the topic of non-constructible parcels, small vacant or built spaces in Municipal Beirut, some of which belong to the municipality while others are privately owned and which might be used for different functional purposes. This paper further examines the possibility of implementing cool surface or paving materials and urban vegetation to reduce air urban temperature, especially during the summer period and with the view to project the positive findings of this case study to the entire Municipal Beirut area. A numerical analysis using ENVI-met 4.0 investigates the thermal performance of these non-constructibles further to implementation of high reflective surfaces and urban vegetation on a broad neighborhood scale, taking the Bachoura District as a reference case for a typical summer day. The best air temperature reductions correspond to the use of cool material in areas that are far from buildings where there are no shadow effects. In some cases, the introduction of trees leads to an increase of the air temperature near the ground because they became an obstacle of the natural ventilation. Results show a maximum mitigation effect with the use of cool materials that lead to reductions in air temperatures up to 0.42 °C if used alone and up to 0.77 °C if used in combination with trees. Within the framework of an integrated approach to planning, this form of urban intervention aims for substantial overheating reduction. Full article
Show Figures

Figure 1

29 pages, 5975 KiB  
Article
Multihazard Risk Assessment for Planning with Climate in the Dosso Region, Niger
by Maurizio Tiepolo, Maurizio Bacci and Sarah Braccio
Climate 2018, 6(3), 67; https://doi.org/10.3390/cli6030067 - 08 Aug 2018
Cited by 19 | Viewed by 7724
Abstract
International aid for climate change adaptation in West Africa is increasing exponentially, but our understanding of hydroclimatic risks is not keeping pace with that increase. The aim of this article is to develop a multihazard risk assessment on a regional scale based on [...] Read more.
International aid for climate change adaptation in West Africa is increasing exponentially, but our understanding of hydroclimatic risks is not keeping pace with that increase. The aim of this article is to develop a multihazard risk assessment on a regional scale based on existing information that can be repeated over time and space and that will be useful during decision-making processes. This assessment was conducted in Dosso (Niger), the region most hit by flooding in the country, with the highest hydroclimatic risk in West Africa. The assessment characterizes the climate, identifies hazards, and analyzes multihazard risk over the 2011–2017 period for each of the region’s 43 municipalities. Hazards and risk level are compared to the intervention areas and actions of 6 municipal development plans and 12 adaptation and resilience projects. Over the past seven years, heavy precipitation and dry spells in the Dosso region have been more frequent than during the previous 30-year period. As many as 606 settlements have been repeatedly hit and 15 municipalities are classified as being at elevated-to-severe multihazard risk. The geographical distribution of the adaptation and resilience projects does not reflect the risk level. A third of the local development plans examined propose actions that are inconsistent with the main hydroclimatic threats. Full article
(This article belongs to the Special Issue Climate Services for Local Disaster Risk Reduction in Africa)
Show Figures

Figure 1

23 pages, 7348 KiB  
Article
Changes in the Intensity and Variability of Precipitation in the Central Region of Argentina between 1960 and 2012
by Antonio C. De la Casa, Gustavo G. Ovando and Olga B. Nasello
Climate 2018, 6(3), 66; https://doi.org/10.3390/cli6030066 - 25 Jul 2018
Cited by 2 | Viewed by 3699
Abstract
This study analyzes the temporal variation of different rainfall features in the central region of Argentina between 1960 and 2012, and evaluates the dynamics of temporal trends by using the Mann–Kendall–Sneyers (MKS) and Tomé–Miranda (TM) procedures. Under different criteria and levels of significance, [...] Read more.
This study analyzes the temporal variation of different rainfall features in the central region of Argentina between 1960 and 2012, and evaluates the dynamics of temporal trends by using the Mann–Kendall–Sneyers (MKS) and Tomé–Miranda (TM) procedures. Under different criteria and levels of significance, rainfall time series show homogeneous behavior in more than 80% of cases. Only 18 of the 42 annual cases analyzed reached a significant long-term trend (p < 0.10). Total annual rainfall (AR) showed a significant increase only in Laboulaye Aero (LB) and Villa Dolores Aero (VD), but this does not currently persist. A decrease in the annual frequency of rainy days (DPF) is more widespread in the region. Thus, the increase in mean annual rainfall intensity (INT) seems to be particularly associated with the decrease in annual frequency of events (DPF) in the central region of Argentina. However, the increase in INT currently persists only at the Córdoba Observatorio (BO), as INT stopped growing for LB, Río Cuarto Aero (RC), and VD in the mid-1990s. The variation coefficients of total annual rainfall (ARCV) and DPF (DPFCV) have increased in the region, but with the former restricted locally to the Pilar Observatorio (PI), RC, and VM, and the latter to BO and RC. Long-term changes of the pluvial regime in the central region of Argentina appear to be not only local and restricted to some properties of rainfall during the period, but also reveal a particular dynamic where the long-term trends of the evaluated properties have now changed sign or maintain a certain constancy at present. Full article
(This article belongs to the Special Issue Decadal Variability and Predictability of Climate)
Show Figures

Figure 1

36 pages, 7556 KiB  
Article
Farmers’ Net Income Distribution and Regional Vulnerability to Climate Change: An Empirical Study of Bangladesh
by Md. Shah ALAMGIR, Jun FURUYA, Shintaro KOBAYASHI, Mostafiz Rubaiya BINTE and Md. Abdus SALAM
Climate 2018, 6(3), 65; https://doi.org/10.3390/cli6030065 - 23 Jul 2018
Cited by 17 | Viewed by 8474
Abstract
Widespread poverty is the most serious threat and social problem that Bangladesh faces. Regional vulnerability to climate change threatens to escalate the magnitude of poverty. It is essential that poverty projections be estimated while bearing in mind the effects of climate change. The [...] Read more.
Widespread poverty is the most serious threat and social problem that Bangladesh faces. Regional vulnerability to climate change threatens to escalate the magnitude of poverty. It is essential that poverty projections be estimated while bearing in mind the effects of climate change. The main purpose of this paper is to perform an agrarian sub-national regional analysis of climate change vulnerability in Bangladesh under various climate change scenarios and evaluate its potential impact on poverty. This study is relevant to socio-economic research on climate change vulnerability and agriculture risk management and has the potential to contribute new insights to the complex interactions between household income and climate change risks to agricultural communities in Bangladesh and South Asia. This study uses analysis of variance, cluster analysis, decomposition of variance and log-normal distribution to estimate the parameters of income variability that can be used to ascertain vulnerability levels and help us to understand the poverty levels that climate change could potentially generate. It is found that the levels and sources of income vary greatly among regions of Bangladesh. The variance decomposition of income showed that agricultural income in Mymensingh and Rangpur is the main cause of the total income difference among all sources of income. Moreover, a large variance in agricultural income among regions is induced by the gross income from rice production. Additionally, even in the long run the gradual, constant reduction of rice yield due to climate change in Bangladesh is not a severe problem for farmers. However, extreme events such as floods, flash floods, droughts, sea level rise and greenhouse gas emissions, based on Representative concentration pathways (RCPs), could increase the poverty rates in Mymensingh, Rajshahi, Barisal and Khulna—regions that would be greatly affected by unexpected yield losses due to extreme climatic events. Therefore, research into and development of adaptation measures to climate change in regions where farmers are largely dependent on agricultural income are important. Full article
(This article belongs to the Special Issue Sustainable Agriculture for Climate Change Adaptation)
Show Figures

Figure 1

14 pages, 779 KiB  
Article
The Life and Death of the Recent Global Surface Warming Hiatus Parsimoniously Explained
by Kristoffer Rypdal
Climate 2018, 6(3), 64; https://doi.org/10.3390/cli6030064 - 21 Jul 2018
Cited by 7 | Viewed by 5261
Abstract
The main features of the instrumental global mean surface temperature (GMST) are reasonably well described by a simple linear response model driven by anthropogenic, volcanic and solar forcing. This model acts as a linear long-memory filter of the forcing signal. The physical interpretation [...] Read more.
The main features of the instrumental global mean surface temperature (GMST) are reasonably well described by a simple linear response model driven by anthropogenic, volcanic and solar forcing. This model acts as a linear long-memory filter of the forcing signal. The physical interpretation of this filtering is the delayed response due to the thermal inertia of the ocean. This description is considerably more accurate if El Niño Southern Oscillation (ENSO) and the Atlantic Multidecadal Oscillation (AMO) are regarded as additional forcings of the global temperature and hence subject to the same filtering as the other forcing components. By considering these as predictors in a linear regression scheme, more than 92% of the variance in the instrumental GMST over the period 1870–2017 is explained by this model, in particular, all features of the 1998–2015 hiatus, including its death. While the more prominent pauses during 1870–1915 and 1940–1970 can be attributed to clustering in time of strong volcanic eruptions, the recent hiatus is an unremarkable phenomenon that is attributed to ENSO with a small contribution from solar activity. Full article
(This article belongs to the Special Issue Postmortem of the Global Warming Hiatus)
Show Figures

Figure 1

20 pages, 3508 KiB  
Article
Mapping Precipitation, Temperature, and Evapotranspiration in the Mkomazi River Basin, Tanzania
by Godfrey A. Mmbando and Michael Kleyer
Climate 2018, 6(3), 63; https://doi.org/10.3390/cli6030063 - 17 Jul 2018
Cited by 10 | Viewed by 7952
Abstract
It is still a challenge to provide spatially explicit predictions of climate parameters in African regions of complex relief, where meteorological information is scarce. Here we predict rainfall, temperature, and reference evapotranspiration (ETo) for the southern Mkomazi River Basin in Northeastern [...] Read more.
It is still a challenge to provide spatially explicit predictions of climate parameters in African regions of complex relief, where meteorological information is scarce. Here we predict rainfall, temperature, and reference evapotranspiration (ETo) for the southern Mkomazi River Basin in Northeastern Tanzania, East Africa, by means of regression-based, digital elevation models (DEM) at 90 m spatial-resolution and geographic information systems (GIS) techniques. We mapped rainfall for the period 1964–2010. The models accounted for orographic factors which strongly influenced the spatial variability of rainfall in the region. According to orography, the area was divided into three zones for modelling rainfall: windward, leeward, and transition zone. Rainfall indicates high spatial and temporal variability dominated by equatorial East-African climate circulation systems. Maximum and minimum temperatures were modelled for the period 1989–1994, the models accounted only for the altitude gradient. Mean temperature was calculated by arithmetic mean of maximum and minimum temperatures maps in ArcGIS. ETo was estimated in ArcGIS following the method described by Hargreaves and Samani. The maps were made on a monthly basis for rainfall, ETo, and mean, maximum, and minimum temperatures. The obtained maps are useful for the purpose of agriculture, ecological, and water resources management. Full article
(This article belongs to the Special Issue Climate Services for Local Disaster Risk Reduction in Africa)
Show Figures

Figure 1

18 pages, 5046 KiB  
Article
Changes in Earth’s Energy Budget during and after the “Pause” in Global Warming: An Observational Perspective
by Norman G. Loeb, Tyler J. Thorsen, Joel R. Norris, Hailan Wang and Wenying Su
Climate 2018, 6(3), 62; https://doi.org/10.3390/cli6030062 - 11 Jul 2018
Cited by 64 | Viewed by 24105
Abstract
This study examines changes in Earth’s energy budget during and after the global warming “pause” (or “hiatus”) using observations from the Clouds and the Earth’s Radiant Energy System. We find a marked 0.83 ± 0.41 Wm−2 reduction in global mean reflected shortwave [...] Read more.
This study examines changes in Earth’s energy budget during and after the global warming “pause” (or “hiatus”) using observations from the Clouds and the Earth’s Radiant Energy System. We find a marked 0.83 ± 0.41 Wm−2 reduction in global mean reflected shortwave (SW) top-of-atmosphere (TOA) flux during the three years following the hiatus that results in an increase in net energy into the climate system. A partial radiative perturbation analysis reveals that decreases in low cloud cover are the primary driver of the decrease in SW TOA flux. The regional distribution of the SW TOA flux changes associated with the decreases in low cloud cover closely matches that of sea-surface temperature warming, which shows a pattern typical of the positive phase of the Pacific Decadal Oscillation. Large reductions in clear-sky SW TOA flux are also found over much of the Pacific and Atlantic Oceans in the northern hemisphere. These are associated with a reduction in aerosol optical depth consistent with stricter pollution controls in China and North America. A simple energy budget framework is used to show that TOA radiation (particularly in the SW) likely played a dominant role in driving the marked increase in temperature tendency during the post-hiatus period. Full article
(This article belongs to the Special Issue Postmortem of the Global Warming Hiatus)
Show Figures

Figure 1

18 pages, 4626 KiB  
Article
Ocean Impacts on Australian Interannual to Decadal Precipitation Variability
by Zachary F. Johnson, Yoshimitsu Chikamoto, Jing-Jia Luo and Takashi Mochizuki
Climate 2018, 6(3), 61; https://doi.org/10.3390/cli6030061 - 11 Jul 2018
Cited by 14 | Viewed by 5106
Abstract
In Australia, successful seasonal predictions of wet and dry conditions are achieved by utilizing the remote impact of sea surface temperature (SST) variability in tropical oceans, particularly the Pacific Ocean, on the seasonal timescale. Beyond seasonal timescales, however, it is still unclear which [...] Read more.
In Australia, successful seasonal predictions of wet and dry conditions are achieved by utilizing the remote impact of sea surface temperature (SST) variability in tropical oceans, particularly the Pacific Ocean, on the seasonal timescale. Beyond seasonal timescales, however, it is still unclear which processes and oceans contribute to interannual-to-decadal wet/dry conditions in Australia. This research examines the interannual-to-decadal relationship between global SST anomalies (SSTAs) and Australian wet/dry variability by analyzing observational data and global climate model experiments conducted with the NCAR Community Earth System Model (CESM) and the Model for Interdisciplinary Research on Climate (MIROC). A 10-member ensemble simulation suite for 1960–2015 (CESM) and 1950–2010 (MIROC) is conducted by assimilating the observed three-dimensional ocean temperature and salinity anomalies into fully coupled global climate models. In both observational analyses and ocean assimilation experiments, the most dominant annual mean precipitation variability shows a clear relationship with SSTAs in the tropical Pacific and the Atlantic. Our partial ocean assimilation experiment, in which the ocean component of the CESM and MIROC are assimilated by the observed ocean temperature and salinity anomalies in the equatorial Pacific only, shows that the tropical Pacific SST variability is the main driver of Australian precipitation variability on the interannual-to-decadal timescales. However, our additional partial ocean assimilation experiment, in which the climate models incorporate the observed anomalies solely in the Atlantic ocean, demonstrates that the Atlantic Ocean can also affect Australian precipitation variability on the interannual-to-decadal timescale through changes in tropical Pacific SSTAs and the modulation of the global Walker circulation. Our results suggest that about a half of Australian interannual-to-decadal precipitation variability originates from the Atlantic Ocean. Full article
(This article belongs to the Special Issue Decadal Variability and Predictability of Climate)
Show Figures

Figure 1

24 pages, 8061 KiB  
Article
Sky View Factor Calculation in Urban Context: Computational Performance and Accuracy Analysis of Two Open and Free GIS Tools
by Jérémy Bernard, Erwan Bocher, Gwendall Petit and Sylvain Palominos
Climate 2018, 6(3), 60; https://doi.org/10.3390/cli6030060 - 04 Jul 2018
Cited by 55 | Viewed by 12367
Abstract
The sky view factor (SVF) has an important role in the analysis of the urban micro-climate. A new vector-based SVF calculation tool was implemented in a free and open source Geographic Information System named OrbisGIS. Its accuracy and computational performance are compared to [...] Read more.
The sky view factor (SVF) has an important role in the analysis of the urban micro-climate. A new vector-based SVF calculation tool was implemented in a free and open source Geographic Information System named OrbisGIS. Its accuracy and computational performance are compared to the ones of an existing raster based algorithm used in SAGA-GIS. The study is performed on 72 urban blocks selected within the Paris commune territory. This sample has been chosen to represent the heterogeneity of nine of the ten Local Climate Zone built types. The effect of the algorithms’ input parameters (ray length, number of directions and grid resolution) is investigated. The combination minimizing the computation time and the SVF error is identified for SAGA-GIS and OrbisGIS algorithms. In both cases, the standard deviation of the block mean SVF estimate is about 0.03. A simple linear relationship having a high determination coefficient is also established between block mean SVF and the facade density fraction, confirming the results of previous research. This formula and the optimized combinations for the OrbisGIS and the SAGA-GIS algorithms are finally used to calculate the SVF of every urban block of the Paris commune. Full article
Show Figures

Figure 1

18 pages, 2878 KiB  
Article
Recent Changes of Floods and Related Impacts in Niger Based on the ANADIA Niger Flood Database
by Edoardo Fiorillo, Alfonso Crisci, Hassimou Issa, Giampiero Maracchi, Marco Morabito and Vieri Tarchiani
Climate 2018, 6(3), 59; https://doi.org/10.3390/cli6030059 - 03 Jul 2018
Cited by 26 | Viewed by 8689
Abstract
During the last two decades, the sub-Saharan region has experienced unusual floods that have differentially impacted the region. No official and precise data regarding flood damage and impacts on the population are available, and the magnitude of events are not easily evaluated. Most [...] Read more.
During the last two decades, the sub-Saharan region has experienced unusual floods that have differentially impacted the region. No official and precise data regarding flood damage and impacts on the population are available, and the magnitude of events are not easily evaluated. Most previous studies have investigated this new threat using data derived from local media sources or world disaster databases. The aim of this study was to provide the scientific community and policy makers with an updated and reliable referenced data source concerning floods in Niger between 1998 and 2015, at national, regional and sub-regional scales. Reliable information regarding floods was derived from the national official flood damage database (ANADIA DB) showing their impact on the country. During the investigated period, considerable numbers regarding flood impacts were found (about 4000 settlements and 1.7 million people were affected by floods). The analysis also indicates a sudden increase in flood impacts since 2010. Regions in the south-west (Tillabery, Dosso and Niamey district) are the most affected; however, this kind of risk involves the whole country, and some particularly vulnerable areas have been identified. A data modeling comprehensive framework based on remotely sensed rainfall (climate hazards group infrared precipitation with stations (CHIRPS)) and vegetation index (moderate resolution imagery spectroradiometer normalized difference vegetation index (MODIS NDVI)) datasets data along with census data were used to investigate which variables are most able to explain the recent and sudden Niger flood vulnerability detected at the departmental scale. Only a few statistically significant flood damage models were found (61 out of 297), due essentially to the non-linearity of the increase in damage time series compared to environmental and climatic trends. The population increase is the most significant variable at national level; however, at regional and sub-regional scales, different patterns provided evidence to identify local triggers for vulnerability. Full article
(This article belongs to the Special Issue Climate Services for Local Disaster Risk Reduction in Africa)
Show Figures

Figure 1

19 pages, 1773 KiB  
Article
Downscaling of Future Temperature and Precipitation Extremes in Addis Ababa under Climate Change
by Getnet Feyissa, Gete Zeleke, Woldeamlak Bewket and Ephrem Gebremariam
Climate 2018, 6(3), 58; https://doi.org/10.3390/cli6030058 - 28 Jun 2018
Cited by 42 | Viewed by 8812
Abstract
One of the recent advances in climate science research is the development of global general circulation models (GCMs) to simulate changes in climatic elements of the present and future, which helps us to determine consequences earlier and prepare for necessary adaptation measures. However, [...] Read more.
One of the recent advances in climate science research is the development of global general circulation models (GCMs) to simulate changes in climatic elements of the present and future, which helps us to determine consequences earlier and prepare for necessary adaptation measures. However, it is difficult to apply the raw data of GCMs at a local scale, such as the urban scale, without downscaling due to coarse resolution. This study, therefore, statistically downscaled daily maximum temperature, minimum temperature, and precipitation in 30-year intervals from the second generation of the Earth System Model (CanESM2) and Coupled Global Climate Model (CGCM3) under two Representative Concentration Pathways (RCP) Scenarios (RCP4.5 and RCP8.5) and two Special Report Emission Scenarios (SRES), A1B and A2, to examine future changes and their extremes. Two representative meteorological stations (Entoto at high elevation and Addis Ababa at downtown and medium elevation) were selected for model calibration and validation in the Statistical Downscaling Model (SDSM). Twelve core temperature and precipitation indices were selected to assess temperature changes and precipitation extremes. For the largest changes the results showed that the maximum temperature increases were in the range of 0.9 °C (RCP4.5) in 2020 to 2.1 °C (CGCM3A2) in 2080 at Addis Ababa Observatory. The minimum temperature is projected to increase by 0.3 °C (RCP4.5) in 2020 and 1.0 °C in 2080 (CGCM3A1B). While the changes in maximum temperature are lower at Entoto station compared to Addis Ababa Observatory, the highest minimum temperature change is projected at Addis Ababa Observatory, which ranges from 0.25 °C in the 2020s to 1.04 °C in 2080 according to the CGCM3 model. Except for the coldest nights (TNn), the mean temperature and other temperature indices will continue to increase to the end of this century. The highest precipitation change is projected by CGCM3A2 and CanESM2 RCP8.5 at an increase of about 11.8% and 16.62% by 2080. The highest total precipitation increase is 29% (RCP4.5) in winter and 20.9% (RCP8.5) in summer by 2080. There is high interseasonal variability in changes of extreme events. The topographic role will diminish in influence on the air temperature distribution due to the high rate of urbanization. The rise in temperature will exacerbate the urban heat highland effects in warm seasons and an increase in precipitation is expected along with a possible risk of flooding due to a low level of infrastructure development and a high rate of urbanization. Full article
Show Figures

Figure 1

27 pages, 15727 KiB  
Article
Modelling Hydrological Components of the Rio Maipo of Chile, and Their Prospective Evolution under Climate Change
by Daniele Bocchiola, Andrea Soncini, Antonella Senese and Guglielmina Diolaiuti
Climate 2018, 6(3), 57; https://doi.org/10.3390/cli6030057 - 25 Jun 2018
Cited by 20 | Viewed by 5413
Abstract
We used the Poly-Hydro model to assess the main hydrological components of the snow-ice melt driven Maipo River in Chile, and glaciers’ retreat under climate change therein until 2100. We used field data of ice ablation, ice thickness, weather and hydrological data, and [...] Read more.
We used the Poly-Hydro model to assess the main hydrological components of the snow-ice melt driven Maipo River in Chile, and glaciers’ retreat under climate change therein until 2100. We used field data of ice ablation, ice thickness, weather and hydrological data, and precipitation from TRMM. Snow cover and temperature were taken from MODIS. We forced the model using weather projections until 2100 from three GCMs from the IPCC AR5, under three different radiative concentration pathways (RCPs 2.6, 4.5, 8.5). We investigated trends of precipitation, temperature, and hydrology until 2100 in the projection period (PR, 2014–2100) and the whole period (CM 1980–2100, composite), against historical trends in control period (CP, 1980–2013). We found potentially increasing temperature until 2100, except for Spring (OND). In the PR period, yearly flow decreases significantly under RCP85, on average −0.25 m3·s−1·year−1, and down to −0.48 m3·s−1·year−1, i.e., −0.4% year−1 against CP yearly average (120 m3 s−1). In the long run (CM) significant flow decrease would, occur under almost all scenarios, confirming persistence of a historical decrease, down to −0.39 m3·s−1·year−1 during CM. Large flow decreases are expected under all scenarios in Summer (JFM) during PR, down to −1.6 m3·s−1·year−1, or −1% year−1 against CP for RCP8.5, due to increase of evapotranspiration in response to higher temperatures. Fall (AMJ) flows would be mostly unchanged, while Winter (JAS) flows would be projected to increase significantly, up to 0.7 m3·s−1·year−1 during 2014–2100, i.e., +0.9% year−1 vs. CP under RCP8.5, due to large melting therein. Spring (OND) flows would decrease largely under RCP8.5, down to −0.67 m3 s−1·year−1, or −0.4% year−1 vs. CP, again due to evapotranspiration. Glacier down wasting is projected to speed up, and increasingly so with RCPs. Until 2100 ice loss would range from −13% to −49% (−9%, and −39% at 2050) of the estimated volume at 2012, which changed by −24% to −56% (−21%, and −39% at 2050) vs. ice volume in 1982, thus with rapider depletion in the first half of the century. Policy makers will have to cope with modified hydrological cycle in the Maipo River, and greatly decreasing ice cover in the area. Full article
(This article belongs to the Special Issue Modified Hydrological Cycle under Global Warming)
Show Figures

Figure 1

26 pages, 5109 KiB  
Article
The Effect of Building Facades on Outdoor Microclimate—Reflectance Recovery from Terrestrial Multispectral Images Using a Robust Empirical Line Method
by Jonathan Fox, Paul Osmond and Alan Peters
Climate 2018, 6(3), 56; https://doi.org/10.3390/cli6030056 - 25 Jun 2018
Cited by 14 | Viewed by 6226
Abstract
Climate change and the urban heat island effect pose significant health, energy and economic risks. Urban heat mitigation research promotes the use of reflective surfaces to counteract the negative effects of extreme heat. Surface reflectance is a key parameter for understanding, modeling and [...] Read more.
Climate change and the urban heat island effect pose significant health, energy and economic risks. Urban heat mitigation research promotes the use of reflective surfaces to counteract the negative effects of extreme heat. Surface reflectance is a key parameter for understanding, modeling and modifying the urban surface energy balance to cool cities and improve outdoor thermal comfort. The majority of urban surface studies address the impacts of horizontal surface properties at the material and precinct scales. However, there is a gap in research focusing on individual building facades. This paper analyses the results of a novel application of the empirical line method to calibrate a terrestrial low-cost multispectral sensor to recover spectral reflectance from urban vertical surfaces. The high correlation between measured and predicted mean reflectance values per waveband (0.940 (Red) < rs > 0.967 (NIR)) confirmed a near-perfect positive agreement between pairs of samples of ranked scores. The measured and predicted distributions exhibited no statistically significant difference at the 95% confidence level. Accuracy measures indicate absolute errors within previously reported limits and support the utility of a single-target spectral reflectance recovery method for urban heat mitigation studies focusing on individual building facades. Full article
Show Figures

Figure 1

25 pages, 10272 KiB  
Article
Evaluation and Modeling of Urban Heat Island Intensity in Basel, Switzerland
by Andreas Wicki, Eberhard Parlow and Christian Feigenwinter
Climate 2018, 6(3), 55; https://doi.org/10.3390/cli6030055 - 21 Jun 2018
Cited by 34 | Viewed by 6633
Abstract
An increasing number of people living in urban environments and the expected increase in long lasting heat waves makes the study of temperature distribution one of the major tasks in urban climatology, especially considering human health and heat stress. This excess heat is [...] Read more.
An increasing number of people living in urban environments and the expected increase in long lasting heat waves makes the study of temperature distribution one of the major tasks in urban climatology, especially considering human health and heat stress. This excess heat is often underestimated because stations from national meteorological services are limited in numbers and are not representing the entire urban area with typically higher nocturnal temperatures, especially in densely built-up environments. For a majority of the population, heat stress is consequently monitored insufficiently. In this study, the factors influencing the nocturnal urban heat island have been evaluated in detail and have been tested using different spatial resolutions. A multiple linear regression model has been developed with predictors resulting from different data sources to model the urban air temperature distribution continuously. Results show that various datasets can be used for the prediction of the heat island distribution with comparable results, ideally run on a 200 m grid. Validation using random sampling indicated a RMSE clearly below the standard deviation of the measurements with an average around ~0.15 °C. The regression coefficients are varying within the nocturnal runs with best results around 22:00 CET (R2 > 0.9). Full article
Show Figures

Figure 1

17 pages, 8277 KiB  
Review
Livestock Under Climate Change: A Systematic Review of Impacts and Adaptation
by Jacquelyn F. Escarcha, Jonatan A. Lassa and Kerstin K. Zander
Climate 2018, 6(3), 54; https://doi.org/10.3390/cli6030054 - 21 Jun 2018
Cited by 79 | Viewed by 17473
Abstract
We conducted a systematic literature review to document the scientific knowledge about climate change impacts and adaptation in livestock systems, and to identify research gaps. The analysis was built from the premise that livestock offers substantial opportunities for food security and sustainable development [...] Read more.
We conducted a systematic literature review to document the scientific knowledge about climate change impacts and adaptation in livestock systems, and to identify research gaps. The analysis was built from the premise that livestock offers substantial opportunities for food security and sustainable development if adaptation to climate change is appropriated. In examining 126 suitable peer-reviewed publications we discovered five research gaps: (1) a lack of research in Asia and South America; (2) a lack of mutual investigation and linkages between impacts and adaptation; (3) a lack of emphasis on mixed crop-livestock systems; (4) a lack of emphasis on monogastric livestock; and (5) an underrepresentation of quantitative methods including yield impact models. The findings suggest that the research on climate change impacts and adaptation in livestock systems needs to move beyond certain geographical contexts and consider key vulnerability priorities, particularly from developing countries. It is pivotal that research begins to jointly look at climate change impacts and the livestock keepers’ adaptation to draw out policy implications and to effectively target support for impact-specific adaptation options. Only if such evidence is established, adaptation will be appropriated accordingly to the needs of the livestock sector, and provision for the growing demand of animal-based products will be secured. Full article
Show Figures

Figure 1

Previous Issue
Next Issue
Back to TopTop