1. Introduction
The livestock industry is challenged with reducing greenhouse gas (GHG) emissions to limit the negative impacts of climate change. Using a life cycle approach, it has been estimated that livestock production contributes about 14.5% of global anthropogenic GHG emissions, with dairy production accounting for about 20% of this figure [
1]. Dairy production and the demand for milk products continue to rise, thus GHG emissions associated with livestock production will increase further unless mitigation strategies and new technologies are adopted [
2].
Approximately 70–85% of total GHG emissions associated with milk consumption in industrialized countries can be attributed to activities on the farm (i.e., “cradle-to-farm gate emissions” [
3,
4]). This highlights the opportunity for dairy producers to make management choices that can significantly reduce the overall carbon footprint (e.g., sum of GHG emissions and removals in a product system) or GHG intensity (e.g., sum of GHG emissions and removals expressed relative to a kilogram of fat and protein corrected milk (FPCM)) of dairy products.
While overall milk production in Canada has increased slightly since 1990, the dairy cattle population has been decreasing steadily due to increased productivity per cow [
5]. GHG emissions attributed to the Canadian dairy sector have remained stable during the last decade, largely due to greater feed consumption of cows, leading to greater enteric methane (CH
4) emissions [
6]. Farm-based life cycle assessments of Canadian dairy production have identified methane (CH
4), mostly from enteric fermentation, as the largest source of GHG from dairy farms [
7,
8].
A number of comprehensive reviews document potential strategies for reducing enteric CH
4 emissions from dairy cows [
9,
10,
11,
12]. Strategies for reducing enteric CH
4 include supplementing diets with feed additives and dietary fats, offering diets high in starch content, improving forage quality, and changing forage type (e.g., corn silage and legume forages). For example, the high starch content of corn silage, compared to perennial grass or legume silage, tends to shift ruminal fermentation patterns towards the formation of more propionate and less acetate, which lowers hydrogen availability for methanogens that use hydrogen and carbon dioxide (CO
2) to produce CH
4. Legumes tend to decrease CH
4 synthesis compared with grasses because of their shorter residence time in the rumen, although comparisons can be confounded by differences in physiological maturity and growing conditions. In addition, the source of forage in the diet can increase animal productivity, thereby lowering enteric CH
4 emissions per unit of product. While the use of alfalfa and corn silage rather than grasses may reduce enteric CH
4 emissions, the availability of forage crops depends on local growing conditions.
Some dietary mitigation strategies can be implemented without large-scale changes to dairy infrastructure. However, a change in forage feeding affects the feed production system as well as milk production and composition due to differences in intake and nutrient availability (i.e., digestibility). For example, Hassanat et al. [
13] reported that, compared to lactating dairy cows fed alfalfa silage, cows fed corn silage produced 10% less enteric CH
4 and 6% more milk, but the milk contained less fat and more protein. Similarly, Benchaar et al. [
14] reported that dairy cows fed corn silage produced 14% less CH
4 and 16% more milk, with less fat and more protein, compared with cows fed barley silage diets. While the forage source can affect CH
4 emissions and milk production from the dairy system, these effects must be considered in tandem with effects on emissions from affiliated changes in the agronomic system. The overall effect of changing the forage source on the total GHG emissions from dairy systems remains unclear; for example, planting perennial forages such as alfalfa may also reduce agricultural GHG emissions by sequestering CO
2 in agricultural soils [
15,
16,
17]. While changes in soil carbon can affect the carbon footprint of agricultural systems, they are rarely included in GHG analysis of dairy products because of the complexity and lack of consensus on methodology [
4,
7,
18,
19].
Before recommending a change in forage management as a strategy for enteric CH
4 mitigation, it is important to conduct a holistic—or whole-farm—assessment of all contributing emissions, including those from feed production and digestion, managing the resulting manure, and other on-farm production processes and inputs. While agriculture can help reduce global GHG emissions, finding the best approach is challenging; for example, a dietary change to reduce enteric CH
4 production may inadvertently increase emissions elsewhere in the system [
20,
21].
The cumulating and cascading effects of management practices on emissions from agricultural systems can rarely be measured directly, so whole-farm emissions are normally estimated using mathematical models [
22]. An example of such a model is Holos, a whole-farm model and software tool developed by Agriculture and Agri-Food Canada to estimate GHG emissions from Canadian farm systems (
www.agr.gc.ca/holos-ghg, [
23]). Holos was designed as an exploratory tool to test possible ways of reducing GHG emissions prior to implementation. The objective of this study was to compare GHG emissions from corn silage- and alfalfa silage-based dairy systems, using whole-farm analyses, including effects on soil carbon.
2. Materials and Methods
This analysis followed the baseline scenario described by McGeough et al. [
8], spanning the entire lifespan of an average dairy cow rather than simulating a single, point-in-time condition, which allowed us to account for the dynamics of the herd over time. The simulated farm was located in Napierville in the Montérégie region of Québec, Canada, within Ecodistrict 541 in the Mixed Woods Plains Ecozone. Precipitation and evapotranspiration during the growing season (May–October) averaged 559 and 529 mm, respectively [
24]. The soil was a Humic Gleysol with a fine texture [
25]. Input data for lactating cows were based on the study of Hassanat et al. [
13], conducted at a nearby research facility (Ecodistrict 483), which examined the effects of forage source on enteric CH
4 emissions, nitrogen (N) excretion, and milk performance. Utilizing these input data, we compared two scenarios, using (1) alfalfa or (2) corn as the silage component of the system diet (for lactating cows, dry cows, and heifers).
2.1. Animal Management
2.1.1. Herd Dynamics and Diet
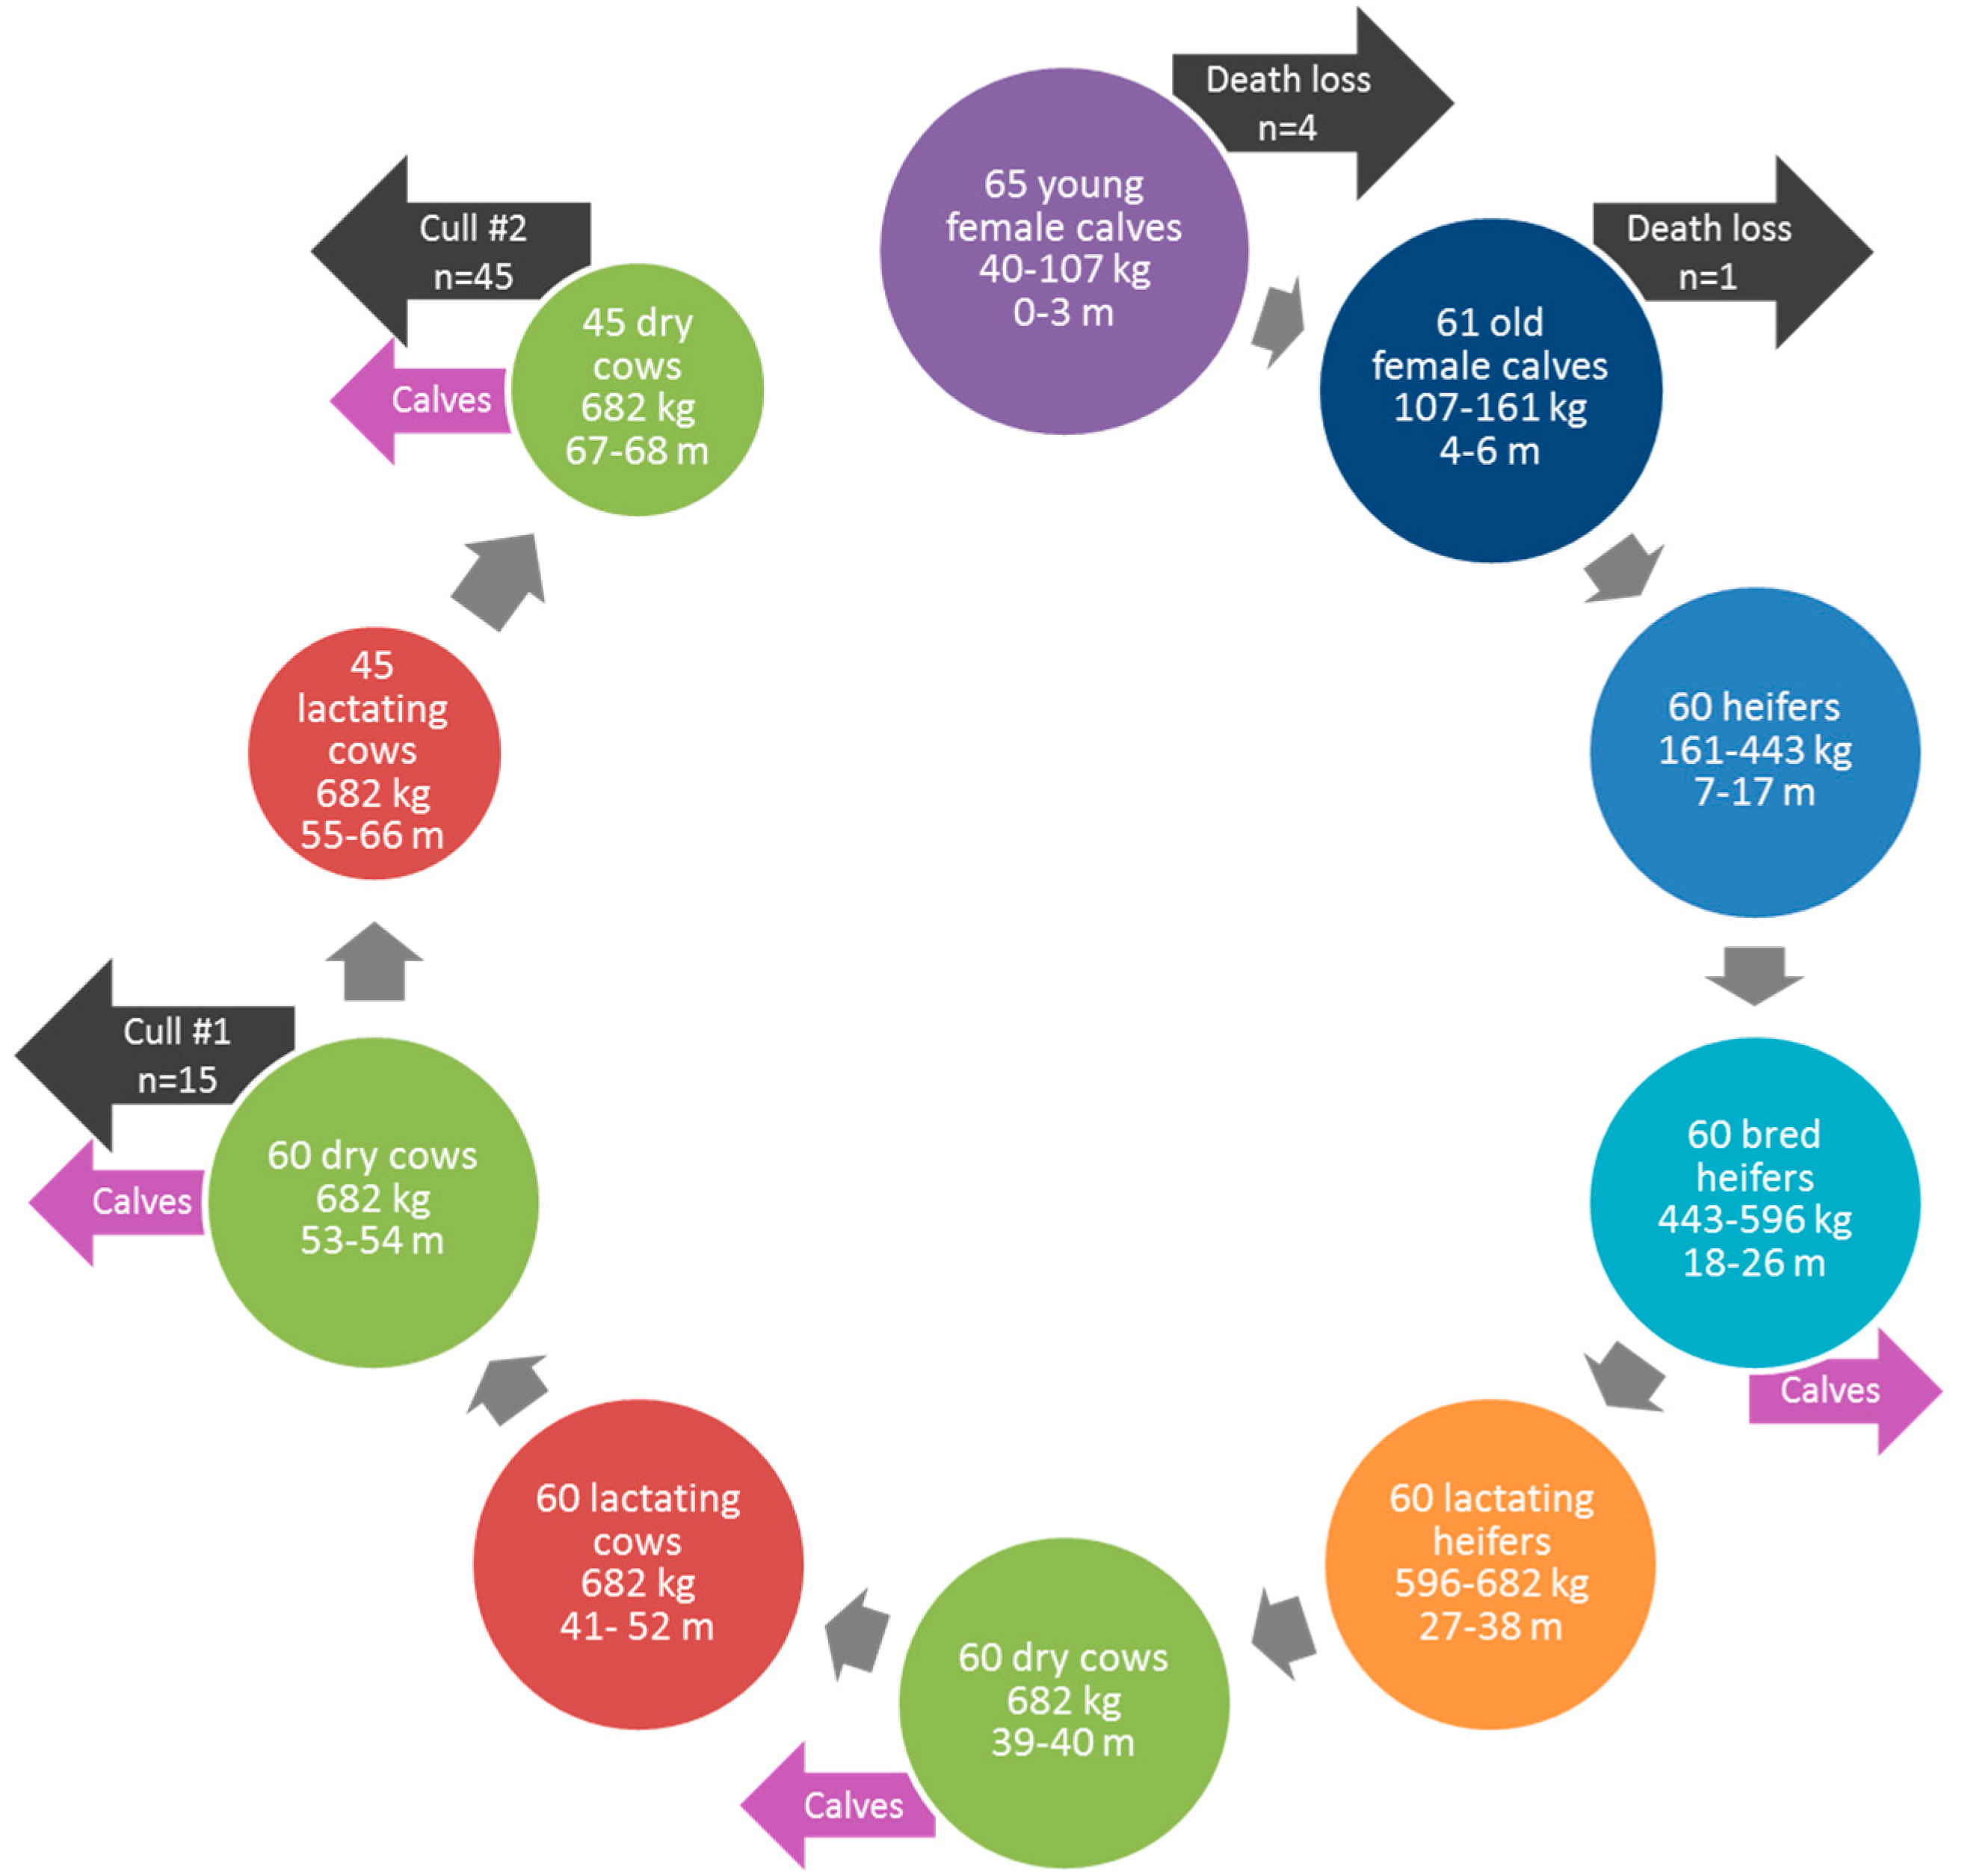
The scenario represents a dairy farm with 60 lactating Holstein cows. The herd dynamics considered the rearing of heifers, subsequent birth of female and male calves, production of veal calves, and average number of lactations per cow (
Figure 1). The analysis begins with the birth of calves and ends with the cull of the final group of lactating cows during the sixth year of the production cycle.
To achieve a herd size of 60 lactating cows while factoring in death loss, 65 female calves were required. Calves were fed milk replacer and concentrate for the first three months [
8] (
Table 1). At four months of age, 61 calves transitioned to a mixed hay (legume and grass) and concentrate diet. At seven months, 60 calves transitioned to a mixed hay and silage diet (alfalfa or corn, depending on scenario). Death losses of 7.8 and 1.8% for each of these time periods, respectively, were assumed [
26].
Heifers were artificially inseminated at 18 months and continued on the mixed hay and silage diet until calving at 27 months, when the initial lactation cycle began. Primiparous cows (1st lactation), weighing 596 kg, were fed the lactation diet for 12 months prior to entering into a two-month non-lactating period (dry cow) where they were fed the dry cow diet. Cows reached maturity at the beginning of this dry period at 682 kg. The lactation diet, including either alfalfa silage or corn silage at 56.4% of dietary dry matter (DM), was described by Hassanat et al. [
13]. Additional ingredients were added to the diets to ensure adequate crude protein, mineral, and vitamin levels. The dry cow diet consisted mainly of mixed hay and was supplemented with the corresponding silage depending on the scenario (
Table 1).
Dry matter intake for mature cows was 21.7 kg head
−1 day
−1 (alfalfa-silage diet) or 24.6 kg head
−1 day
−1 (corn-silage diet), based on measurements by Hassanat et al. [
13]. At the end of the second lactation and dry period, 15 cows were culled from the herd, leaving 45, simulating a cow replacement rate of 31%, with cows retained for 2.75 lactations, representing a typical Québec dairy [
27]. After the third and final lactation, dry period, and calving, at 69 months, the remaining 45 cows were culled and sent to slaughter. These scenarios represent average practices, recognizing that animals would be culled throughout the cycle in common practice.
The 135 calves not required for replacement of lactating cows entered into the veal system and were fed milk replacer and corn grain from birth to three months. Factoring in death loss, at four months, 127 veal calves were fed corn grain until their slaughter at 6.5 months weighing 273 kg.
2.1.2. Milk Production and Housing
Assumed daily average milk production and composition were from Hassanat et al. [
13] (
Table 2). Milk production for first lactation heifers was 93% of mature cow production [
27]. During lactation, cows were housed in individual tie-stalls and bedded with barley straw grown on the farm. Manure was removed regularly and stockpiled (solid storage). Dry cows, heifers, and all calves were group housed in deep-bedded pens with straw bedding added to absorb moisture. All manure was spread on the farm’s lands once per year.
2.2. Crop Production and Imported Feed
Alfalfa silage, corn silage, mixed hay, corn grain, barley grain, and soybean for meal and hulls were grown on the simulated farm, with area of each based on feed requirements, yield of each crop, and losses from harvest, storage, and feed wastage. Yield, fertilizer rates, and lime application rates were representative of those found in the region (
Table 3), except for the alfalfa silage and corn silage, where we used data from Hassanat et al. [
13]. Crops were grown using reduced tillage and were not irrigated. Alfalfa silage and mixed hay crops were assumed to be a four-year perennial stand.
Ingredients imported onto the farm (corn gluten feed, rumen inert fat, urea, calcium carbonate, potassium carbonate, mineral/vitamin supplement, and milk replacer) were included in the overall analysis, using published emission factor values, recognizing their contributions were small (
Table 4). We assumed no losses or wastage from imported ingredients.
2.3. Quantification of GHG Emissions
2.3.1. Holos Model
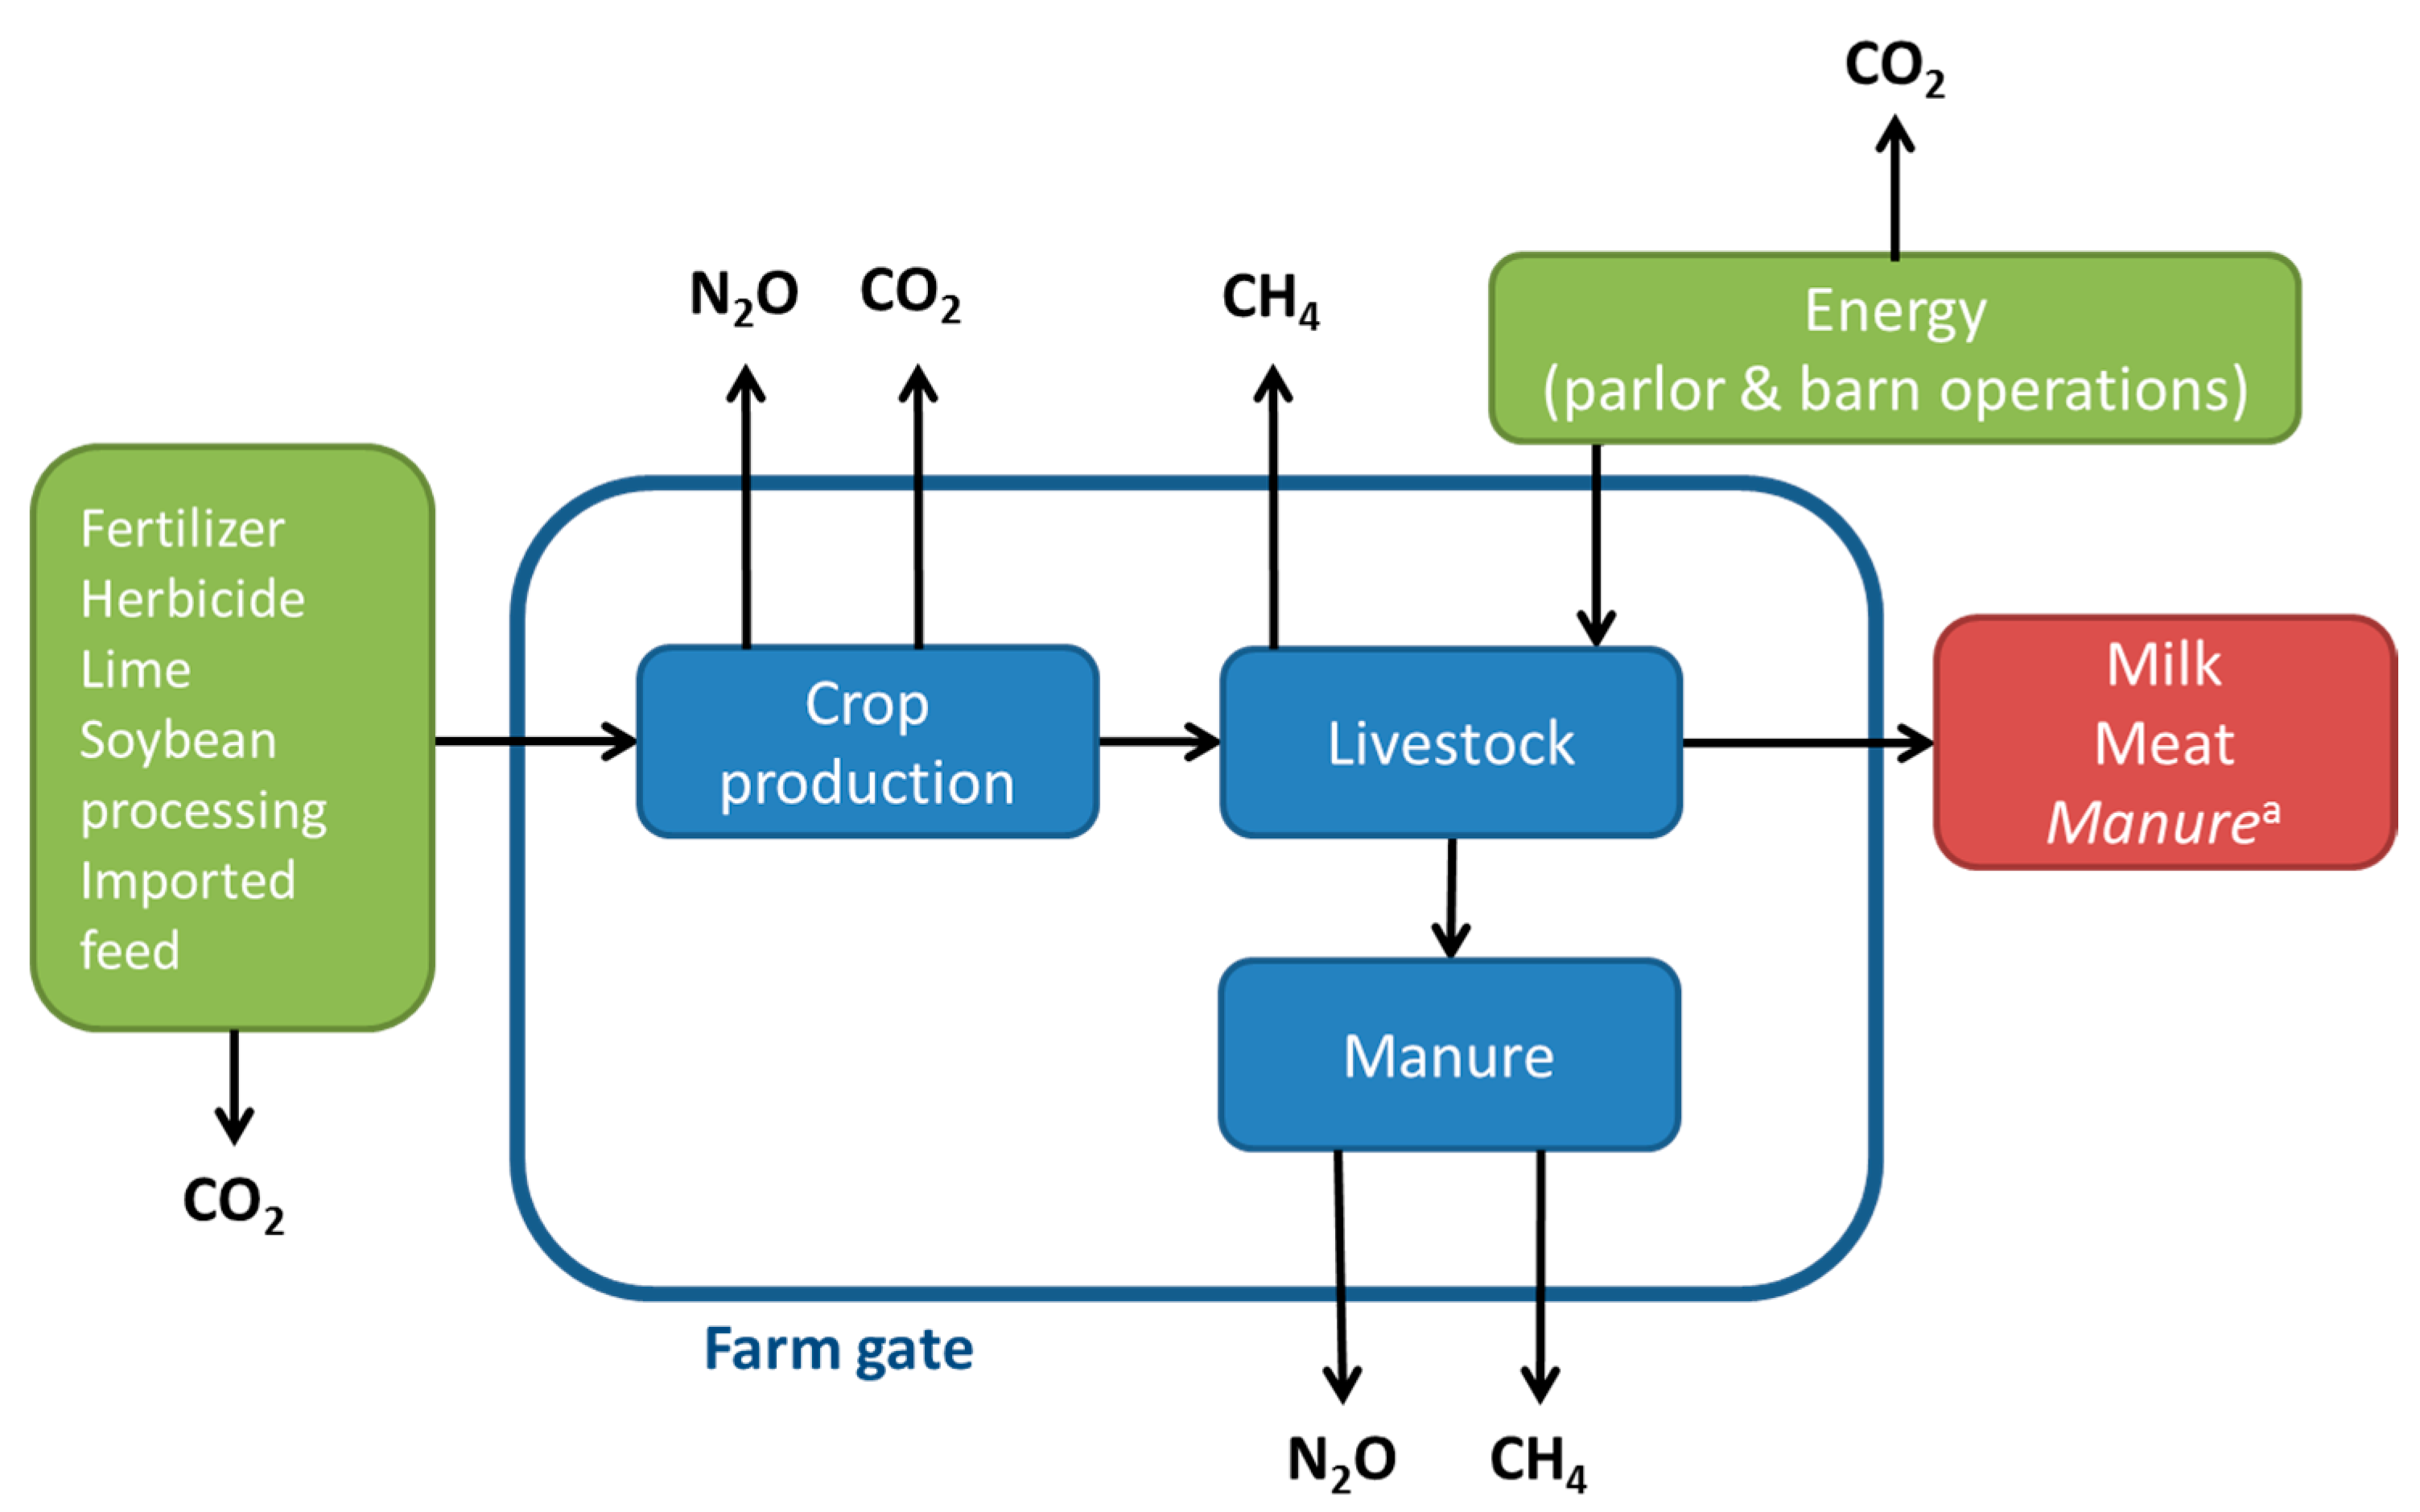
Greenhouse gas emissions from each scenario (alfalfa silage and corn silage) were estimated using the Holos model, Version 2. The system boundary of the analysis was the farm-gate, including the following emissions: CH
4 from enteric fermentation and manure management; nitrous oxide (N
2O), direct and indirect, from soils and cropping and manure management; and CO
2 from energy use. Also included were emissions associated with production of inputs (fertilizers, herbicide, and imported feeds), application of lime, and the production and processing of some diet ingredients (
Figure 2). Emissions associated with the production of capital goods were not included. Emissions were expressed as net GHGs or as CO
2-equivalents (CO
2e) utilizing the 100-year global warming potential (GWP) values of CO
2 = 1, CH
4 = 28, N
2O = 265 [
41].
2.3.2. GHG Emissions from Livestock Management
Enteric CH
4 emissions were estimated as a function of DM intake and CH
4 conversion factor (Y
m) for the diets (
Table 1); Y
m values for diets fed to lactating cows were from Hassanat et al. [
13], while values for the other diets are from Mc Geough et al. [
8], except for the alfalfa-based diet fed to the dry cows and heifers, where the Y
m value was adjusted to maintain the percentage difference between the alfalfa silage and corn silage reported by Hassanat et al. [
13]. The DM intake of each animal group was estimated based on the net energy requirements of the animal, factoring in maintenance, activity, growth, pregnancy, lactation, and the estimated net energy content of the diet [
42], except for lactating cows, where measured intake values were used [
13].
Methane emissions from manure management were estimated based on DM intake and volatile solids production. Volatile solids production was multiplied by the CH
4 producing capacity of the animals (B
o = 0.24 for dairy animals) and the CH
4 conversion factor (MCF) of the manure handling system. For solid storage, MCF = 0.02; for deep bedding, MCF = 0.17 [
34].
Manure N was estimated based on DM intake, crude protein content of the diet, and N retention of cattle [
34], except for mature, lactating dairy cows, where we used measured data from Hassanat et al. [
13] to estimate N excretion as a percentage of crude protein intake (alfalfa silage diet = 68.7%; corn silage diet = 61.5%). Direct N
2O emissions were estimated by multiplying manure N by an emission factor specific to the manure handling system (solid storage = 0.005; deep bedding = 0.01; [
34]). Nitrogen contributions from straw bedding, along with associated emissions, were assumed to be the same as if residue was left on fields after harvest, so these contributions were accounted for as cropping emissions.
Indirect N2O emissions from leaching and runoff and volatilization were also estimated. We assumed that leaching and runoff losses during storage were negligible, but that 30% of manure N was volatilized. Indirect N2O emissions from volatilized N was estimated as 0.01 kg N2O-N (kg manure N)−1. Remaining manure N, adjusted for storage losses, was assumed to be applied to cropland once per year.
Emissions of CO
2 due to energy use were calculated using estimated electricity usage of 968 kWh per dairy cow per year (derived from [
7]) and the Québec electricity production CO
2 emission rate of 3.4 g CO
2e kWh
−1 [
36]. Emissions of CO
2 associated with diesel fuel use for spreading manure were estimated based on the volume and concentration of manure produced and an emission factor of 0.347 kg CO
2e (kg manure N)
−1 [
23].
2.3.3. GHG Emissions from Crop and Feed Production and Imported Feed
Direct N
2O emissions from soils and cropping were based on N inputs from synthetic N fertilizer, above- and below-ground crop residue decomposition, land applied manure, and mineralized N (assumed to be zero in these simulations). Using coefficients modified from Janzen et al. [
31], crop residue N input was calculated based on crop yields [
23] (
Table 3). To calculate below-ground residue input for perennial crops, it was assumed that 39% of root biomass turns over annually, with a complete return-to-soil in the final year [
43]. Soil texture, climate, and tillage modified the impact of these N inputs [
35].
Nitrous oxide emission factors were derived using Canada-specific methodology developed for GHG inventory reporting [
35] (
Table 4).We used a location-specific direct N
2O emission factor, based on Ecodistrict growing season precipitation and potential evapotranspiration. Indirect N
2O emissions due to leaching and runoff and volatilization were calculated based on loss fractions, adjusted for growing season precipitation and potential evapotranspiration, and indirect emission factors.
Emissions of CO
2 from energy used to produce crops were estimated for each crop (
Table 4), including those associated with N and phosphorus fertilizer production, herbicide production, and the production, transport, and dissociation of lime. Also considered were CO
2 emissions from processing of feed (drying and grinding of corn, processing of soybean into meal and hulls) and transport of soy ingredients to and from the farm.
2.3.4. Functional Unit and Co-Product Allocation
Whole farm GHG emissions were estimated for each scenario. As dairy systems produce multiple products, or co-products, more than one functional unit (a quantified performance of a product system; [
44]) was required as a reference for assessment. Functional units used in the comparison were:
kg of FPCM (standardized to 4% fat, 3.3% protein);
kg of meat, live weight;
kg of meat, carcass weight;
kg of protein;
MJ of energy;
ha of farm land; and
kg of manure N.
FPCM was calculated as recommended by the International Dairy Federation (IDF) [
45]:
Carcass weight was calculated as 60% of live weight [
8]. We assumed protein content of meat was 17.32% of carcass weight and its energy value was 12.18 MJ (kg carcass)
−1 [
46]. The energy value of milk [
42] was calculated as:
The generation of multiple co-products requires whole-farm GHG emissions to be allocated between these products. Therefore, four co-product allocation methodologies were utilized to assign emissions to the food products of milk and meat. The first method assigned all GHG emissions to milk. The second method assigned emissions to the products of milk and meat based on income from each (i.e., economic allocation), using the following prices: milk (FPCM):
$0.80/L (5-y average price in Québec, 2011–2015 [
47]); veal:
$5.07/kg carcass; culled cows:
$2.29/kg carcass (meat prices = 5-y average in Canada, 2010–2015 [
48]). The third and fourth methods partitioned GHG emissions between co-products in a way that reflects underlying physical relationships [
44]. The third allocation method followed the physical allocation approach of IDF [
45] and the allocation factor (AF) for assigning GHG emissions to milk was calculated as:
IDF [
45] also provides a default ratio of 0.02 for [total meat/total FPCM], which was used in the fourth allocation method. Functional units of protein, energy, and land area required no allocation.
While manure is commonly considered a waste, manure N can also be considered as a co-product of the dairy system when it is used to replace inorganic N fertilizer. Thus an additional functional unit, ‘kg of manure N’, was included in the analysis. The price of this third co-product (manure N) was set at
$1.34/kg (5-y average urea fertilizer, 2011–2015 [
49]).
Co-product allocation was required for soybean meal and soy hulls production. The environmental burden of, and cropland area for, growing soybeans was distributed between the products of oil, meal, and hulls. We assumed that soybeans were transported 60 km from the farm for processing before the meal and hulls were returned to the farm. Emissions due to processing were also included. The AF was determined to be 0.67 for soy meal and 0.02 for soy hulls using IDF [
45] methodology to determine feed product allocation factors, industry published product mass ratios [
38], and 2011–2015 USDA soy prices [
39].
2.3.5. Soil Carbon
Assessing CO
2 emissions or removals from changes in soil C stocks is complex and subject to many assumptions [
19,
33,
50,
51,
52]. We estimated soil C change using the Introductory Carbon Balance Model (ICBM), a two-component model comprised of young and old soil C pools [
53], which allowed us to explore, by way of example, changes in crop rotation or residue management [
54]. From among various soil organic carbon models considered, we selected ICBM because of its simplicity, its compatibility with the Holos model and computational structure, and its demonstrated applicability to Canadian conditions, based on extensive prior research [
55,
56].
Soil carbon changes were estimated using the average, yearly land area for the silage crop in each scenario (alfalfa or corn). ICBM runs were initialized, using estimates of steady state values for young and old carbon pools [
53], derived by running estimates for a four-year stand of mixed hay long enough to approach steady state. From this point, a typical five-year alfalfa silage rotation was initiated consisting of 4 years of alfalfa silage followed by one year of barley silage. This rotation was simulated for 30 years utilizing average (rotation) annual carbon inputs. To compare the simulated alfalfa silage rotation to a corn silage rotation, a typical eight-year corn silage rotation was also initiated from the mixed hay steady state as before [
53]. This rotation consisted of four years of corn silage followed by a four-year perennial hay stand, run for 30 years using average rotation carbon inputs.
ICBM utilizes local factors to assign a climate-dependent soil biological activity parameter that modifies decomposition rates (
re). For the location and conditions of this simulated farm,
re = 0.9823 [
57]. Crop yields, moisture content, and residue ratios were used to calculate above and below ground residue carbon input (
Table 3). The humification coefficient was 0.125 for above ground residue and 0.3 for below ground residue [
58]. Decomposition constants were set at 0.80 and 0.00605 for the young and old pools, respectively [
59]. For perennial crops, we assumed an annual root turnover of 39% with a complete return-to-soil in the final year [
43]. Carbon due to manure input was not considered in this analysis of soil carbon.
3. Results
Our life span approach captured emissions from the birth of the dairy cow to the point of entering the dairy herd and accounted for length and number of lactations once in the producing herd [
8,
28]. Although described in a linear pattern, for simplicity, the approach describes the full cycle, with animals continually entering and leaving, and provides a system perspective of how herd management affects GHG emissions.
3.1. Greenhouse Gas Emissions
Overall farm GHG emissions for the production cycle differed little between the alfalfa- and corn-based systems (
Table 5). The corn silage system had lower enteric CH
4 (−6%), manure CH
4 (−6%), manure-direct N
2O (−17%), soils/cropping-direct N
2O (−2%), and indirect N
2O (−5%) emissions, but these were offset by greater emissions for energy CO
2 (91%), liming CO
2 (168%), and imported feed CO
2 (8%).
Corn silage, because of its elevated starch content has a lower Y
m value than most other perennial and annual forages [
11,
12]. In our study, however, the 10% lower Y
m value for corn silage diets only resulted in 6% less enteric CH
4 as compared with the alfalfa silage because the lactating cows fed corn silage had greater feed intake (
Table 5).
Manure CH
4 emissions are a function of volatile solids production. Lactating cows fed the alfalfa silage-based diet produced less volatile solids than cows fed corn silage-based diet because of lower measured feed intake. The opposite occurred for the dry cows and heifers due to their greater intake relative to those fed corn silage. These converse results for feed intake occurred because feed intake of the lactating cows was measured, whereas intakes of the dry cows and heifers were estimated based on energy requirements and energy content of feed. In the absence of measured data, estimating feed intake required based on energy requirements is a commonly utilized methodology [
60]. Energy requirements of the non-lactating groups were the same for both silage systems, but the greater energy content of corn silage meant that less silage was needed to supply energy requirements. Increased volatile solids production coupled with a greater CH
4 conversion factor for the deep bedding system of the dry cows and heifers compared with the solid manure storage for the lactating cows resulted in greater manure CH
4 emissions for the alfalfa silage based system. Choice of manure handling practices, therefore, may offer potential opportunity for reducing CH
4 emissions [
11,
61].
The alfalfa silage system produced 14% more manure N than the corn silage system (
Table 5) mainly due to greater DM intake for some cattle groups, greater crude protein content of diets, and greater N excretion with alfalfa silage based diets (
Table 5). Dietary crude protein level and N excretion from dairy cattle is primarily affected by N intake; about 70–80% of the N consumed by dairy cows is excreted in manure [
62]. The lower N excretion of the corn silage-based system resulted in lower manure N
2O emissions and less manure N to spread on fields.
Despite greater fertilizer N demands and yield of corn silage, emissions for soils/cropping direct N
2O were greater for the alfalfa silage-based system (
Table 5), largely because of the greater N input from crop residue from the perennial, leguminous alfalfa. This perennial legume not only has greater root yield but also higher root N content than corn [
31].
Indirect N
2O emissions, associated with leaching and runoff and volatilization from both manure and from soils and cropping, were 5% less for corn silage than for alfalfa silage (
Table 5).
Greater energy CO2 emissions for corn silage can be attributed to cropping practices, including use of fertilizer, lime, and herbicide. The lower crude protein content of corn versus alfalfa necessitated supplementing corn silage-based diets with protein from soybeans, adding to CO2 energy emissions associated with feeding corn silage.
3.2. Production
Diet affects not only GHG emissions but also milk production and associated nutritional value. Cows fed corn silage-based diets produced a similar amount of FPCM but 13% more milk protein than cows fed the alfalfa silage-based diet (
Table 5). Less than 1% difference existed between the two silage systems when compared on the basis of milk energy production. As herd dynamics and structure were the same with both scenarios, there was no difference in the mass of meat, meat protein, or meat energy produced.
3.3. Emissions Breakdown
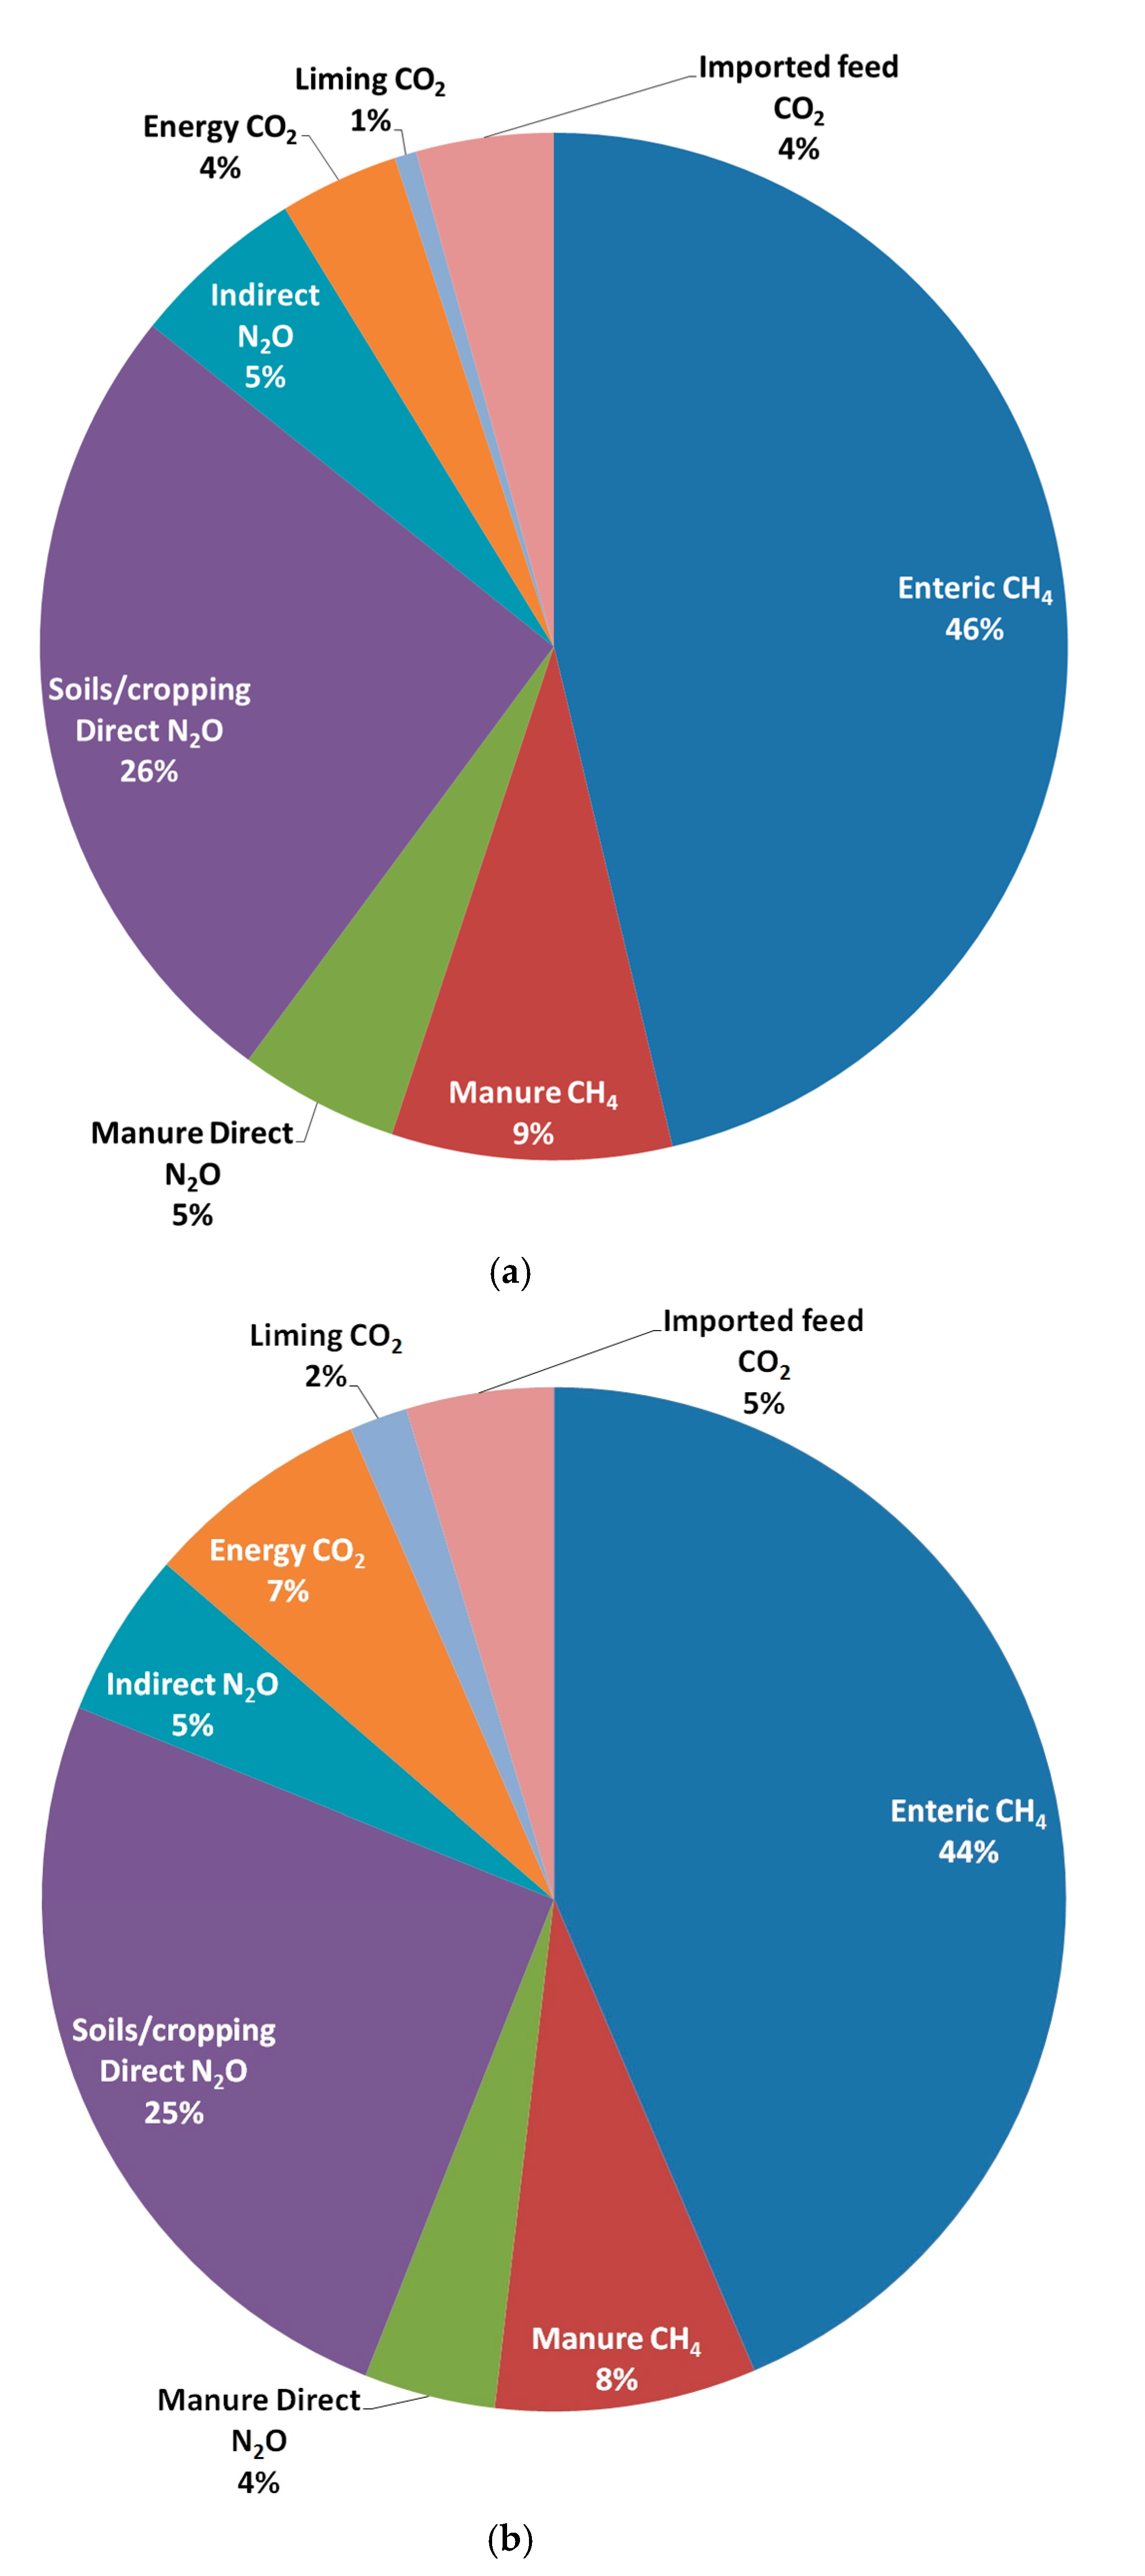
For both silage systems, the majority of emissions were associated with enteric CH
4 (46% and 44% for alfalfa silage and corn silage, respectively;
Figure 3). The second largest contributor was soils/cropping N
2O direct emissions (26% for alfalfa silage and 25% for corn silage) followed by manure CH
4. Energy-related CO
2 emissions were 7% of total emissions for corn silage, and 4% of total emissions for alfalfa silage, somewhat lower than in other studies because of extensive hydro-electricity production in Québec [
7]. With both systems, emissions associated with imported feed made up 5% of total emissions (
Figure 3). The relative contributions of GHG sources were similar to other Canadian studies that included the whole, on-farm production cycle including growing and importing feed [
7,
8,
28,
63]. The dominance of enteric CH
4 to total GHG emissions demonstrates the importance of developing methods to reduce these emissions in dairy systems.
3.4. Land Base
Corn silage had greater biomass yield and thus used less land area to produce the required feed: 57.28 ha as compared with 61.90 ha for alfalfa silage (
Table 5). Thus, on an annual basis, the corn silage-based system produced 7% more FPCM per hectare of land, and greater GHG emissions per unit of land area, than the alfalfa silage-based system (
Table 6). But expressing emissions relative to land area can be misleading if estimates of productivity are not also acknowledged; focusing on GHG emissions on a per unit area basis could lead to decline in food production and may not lead to reduction in GHG emissions for a set amount of product [
64]. The complexity of acknowledging land base in carbon footprinting studies of agricultural products requires more consideration.
3.5. Greenhouse Gas Intensity
Our study found no difference between the two silage production systems when emissions were expressed per unit of energy produced (0.36 kg CO
2e (MJ total energy)
−1). Per kg protein produced, however, the corn silage system generated 10% fewer emissions than the alfalfa silage system (
Table 6). Expressing GHG intensity with the functional units of energy and protein circumvents the need to partition GHG emissions between milk and meat products.
Regardless of how emissions were partitioned between the co-products of milk and meat, the two silage systems showed similar emissions per functional unit (
Table 6). When emissions were allocated entirely to milk, the average GHG emission intensity of FPCM was 1.25 kg CO
2e (kg FPCM)
−1. Economic allocation assigned an average of 89.7% of emissions to milk, which resulted in an approximate GHG emission intensity of 1.12 kg CO
2e (kg FPCM)
−1. Using the IDF [
45] default milk-to-meat ratio, 88.0% of farm emissions were assigned to milk, but using the calculated IDF [
45] method to calculate the milk-to-meat ratio led to a much reduced allocation ratio with 74.6% of emissions assigned to milk overall. The default ratio may be more appropriate than the calculated ratio for Canadian dairy production as it is more similar to the other allocation ratios. Using the IDF [
45] calculated ratio, the GHG emission intensity per kg of FPCM was lower (0.93 CO
2e, for both alfalfa silage and corn silage) than other calculated intensities while GHG intensity per kg of meat was greater, thereby shifting the emissions towards meat from milk. While the method of allocation affected the GHG intensity values, the differences between the alfalfa silage and corn silage systems remained minimal regardless of allocation method.
The GHG intensity results fall into the range of values from previous studies despite differences in assumptions, inputs, conditions, and GWP factors utilized [
7,
28,
63]. Our values for carbon footprint per functional unit were slightly greater than those of McGeough et al. [
8] for similar scenarios, because McGeough et al. [
8] used diets with greater digestibility and, hence, lower DM intake which reduced enteric and manure CH
4 emissions. McGeough et al. [
8] also used different GWP values and assumed all manure N produced replaced inorganic N fertilizer and calculated an energy CO
2 offset for excess manure N, which may have underestimated associated emissions.
When manure N was considered as a co-product in economic allocation, the overall GHG emission intensity of milk and meat was reduced (
Table 6). The GHG emission intensity was 1.63 kg CO
2e per kg manure N for alfalfa silage and 1.65 CO
2e per kg manure N for corn silage. Both systems had excess N, with both synthetic N fertilizer and manure N applied to cropland, implying opportunity to reduce emissions with improved nutrient management by using manure to reduce fertilizer inputs. Considering manure N as a co-product emphasizes that manure has value and is not a waste [
45].
The choice of reporting unit affects the ranking and relative merits of proposed practices in carbon footprinting studies. For example, we observed differential results between the two systems when we used ‘ha of farm land’ or ‘kg of protein’ as the functional unit. Other functional units, however, elicited differences between systems that were negligible (less than the uncertainty of the estimates). There may be no ‘best’ functional unit; choice of functional unit, in the end, depends on the underlying questions and aim addressed by the analysis.
3.6. Soil Carbon
A major advantage of ruminant systems is that forage production can recycle carbon back to the soil, thereby lowering atmospheric CO
2 and enhancing soil health [
65]. Increasing soil carbon stocks is an effective opportunity to offset enteric GHG emissions in the short term, but its benefit requires long-term evaluation. The ICBM model describes soil organic carbon dynamics in a decadal time frame (30 to 50 years), and estimates parameters from information that is usually available on the farm [
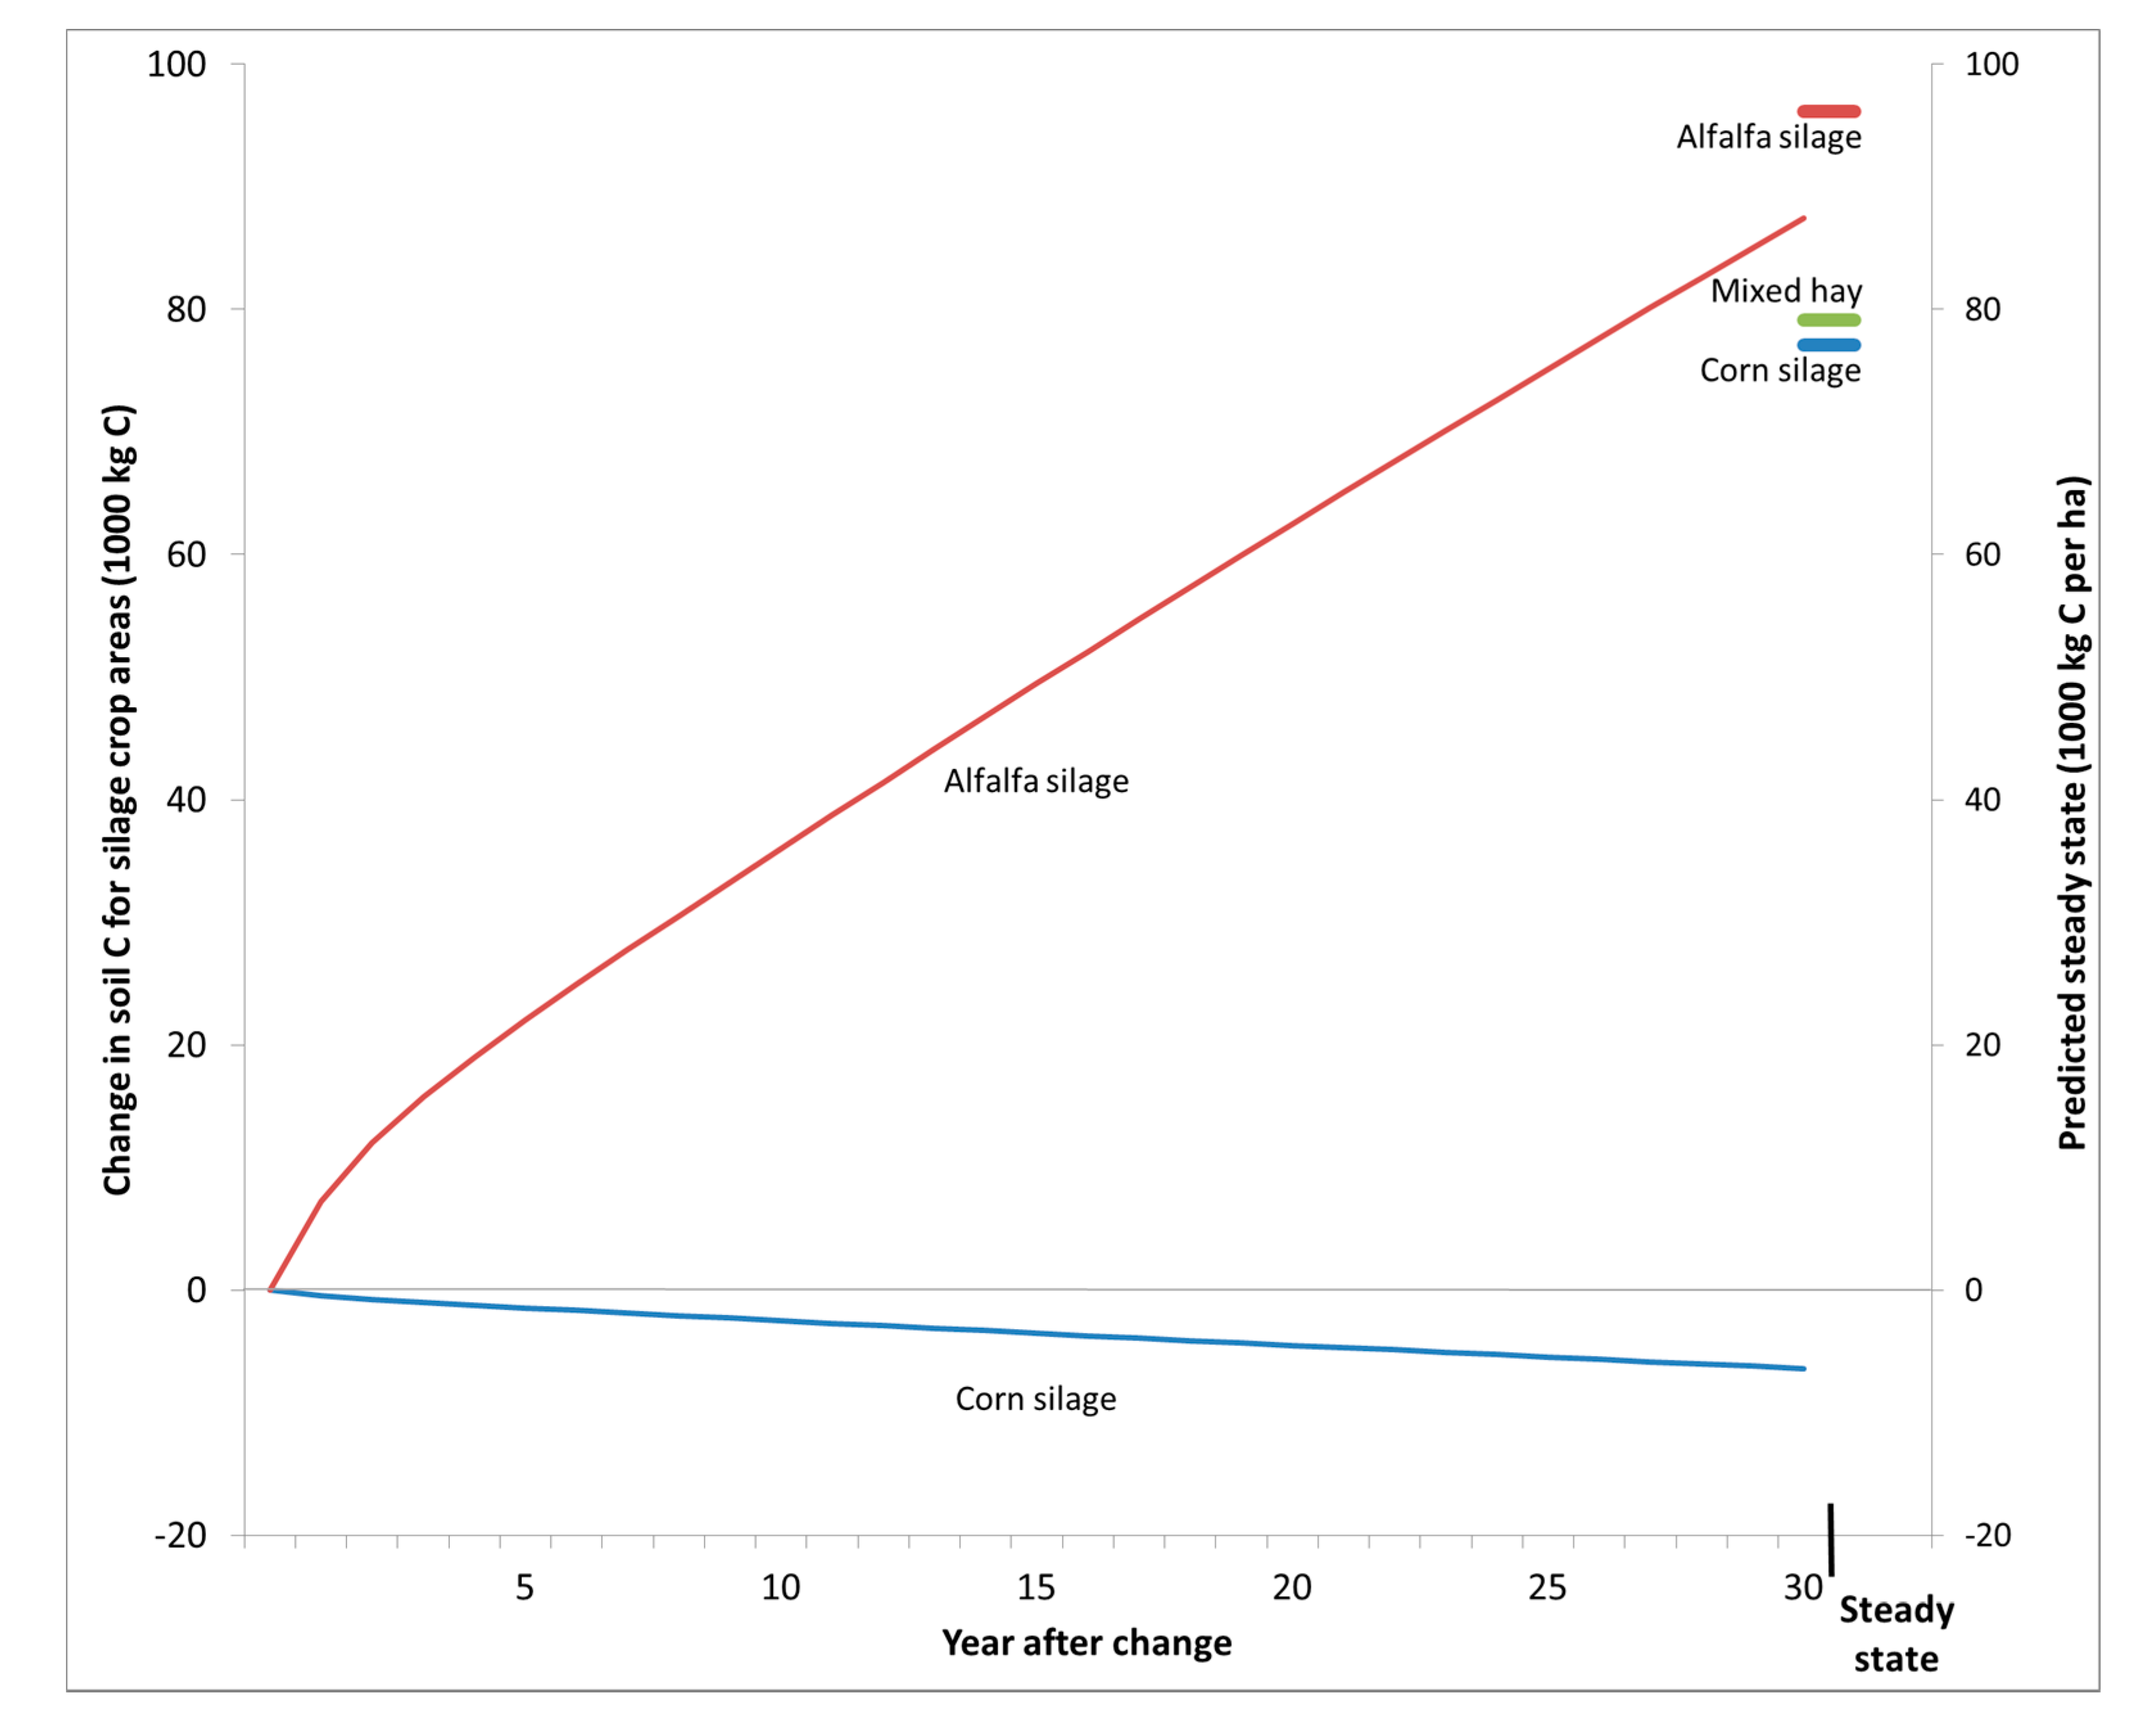
54]. We compared ICBM simulations of alfalfa silage and corn silage rotations from an initial steady state under hay. After a period of 30 years, the model predicted a gain of 87,449 kg soil carbon under the alfalfa system and a loss of 6384 kg carbon under the corn system (
Figure 4). If over 30 years the dairy system completed five cycles, producing approximately 11,000,000 kg CO
2e, the potential carbon gain from alfalfa and the potential carbon loss from corn represents less than 1% of emissions, implying little impact on soil carbon of switching from hay to an alfalfa silage or corn silage system.
In the long run, ICBM predicted a steady state value of 79,126 kg C ha−1 for the mixed hay stand, 96,148 kg C ha−1 for the alfalfa silage rotation, and 77,098 kg C ha−1 for the corn silage rotation, largely reflecting differences in residue input. While steady state is rarely if ever attained in ecosystems, because of shifting conditions and practices, these predictions illustrate the overall, long-term potential for these systems to capture and withhold carbon from the atmosphere.
ICBM is very responsive to carbon input from residues, especially those entering the soil below-ground. Improved estimates of the mass and turnover of roots and root-derived carbon from perennial crops would reduce uncertainty in current estimates of net GHG emissions from dairy systems, particularly those based on forage crops. Nevertheless, our findings demonstrate the potentially dominant influence that changes in soil carbon can impose on the overall carbon footprint of dairy production systems. The amount of soil carbon gained or lost depends on previous management practices [
66]; consequently, estimates of net CO
2 exchange from soil must be derived for local soils, conditions, and management practices.
4. Conclusions
Earlier, Hassanat et al. [
13] showed that lactating dairy cows fed a corn silage-based diet emitted 10% less enteric CH
4 per unit gross energy intake than cows on an alfalfa silage-based diet. Expanding the analysis to encompass the entire system—the entire dairy herd as well as the production of crops for feed and handling of manure—showed that enteric CH
4 was 6% lower for the corn silage-based system than for the alfalfa silage-based system. However, when all sources and GHGs were considered, the differences between the two forage systems on overall net GHG emissions of the dairy production system were minimal (<0.01%). Over the long-term, however, the alfalfa silage rotation had greater potential to store soil carbon than the corn silage rotation, though not enough to offset GHG emissions from dairy production. Our findings illustrate the importance of soil carbon changes in assessing overall carbon footprint of dairy systems, and the need for improved ways of predicting these changes.
This study reinforces the merits of using a whole-systems or life cycle approach rather than focusing on single elements of a farm system without investigating interrelated effects of management choices. Reported GHG reduction factors cannot be simply combined additively, because interwoven effects of management choices cascade through the entire system, sometimes with counter-intuitive outcomes. A whole-systems approach is most likely to steer policy and management toward reduced GHG emissions and improved sustainability.


