Article

The Influence of the Antarctic Oscillation (AAO) on Cold Waves and Occurrence of Frosts in the State of Santa Catarina, Brazil

by
Maikon Passos A. Alves
1,*,
Rafael Brito Silveira
1,
Rosandro Boligon Minuzzi
2 and
Alberto Elvino Franke
1
1
Applied Climatology Laboratory (LabClima), Federal University of Santa Catarina (UFSC), Trindade, Florianópolis 88040-900, Brazil
2
Agricultural Climatology Laboratory (Labclimagri), Federal University of Santa Catarina (UFSC), Admar Gonzaga Str., Itacorubi, Florianópolis 88034-000, Brazil
*
Author to whom correspondence should be addressed.
Climate 2017, 5(1), 17; https://doi.org/10.3390/cli5010017
Submission received: 1 November 2016 / Revised: 20 February 2017 / Accepted: 24 February 2017 / Published: 2 March 2017
(This article belongs to the Special Issue Studies and Perspectives of Climatology in Brazil)

Abstract

:
This paper examines the relationship between the Antarctic Oscillation (AAO), cold waves and occurrence of frosts in the state of Santa Catarina, Brazil, during the winter quarter. Research on this topic can assist different spheres of society, such as public health and agriculture, since cold waves can influence and/or aggravate health problems and frosts can inflict economic losses especially in the agricultural sector. For the purpose of this paper, cold wave is considered as the event in which the daily average surface air temperature was at least two standard deviations below the average value of the series on the day and for two consecutive days or more. The data on the average air temperature and frost occurrences are provided by the Company of Agricultural Research and Rural Extension of Santa Catarina/Center for Environmental Information and Hydrometeorology (EPAGRI/CIRAM). The AAO was subjected to statistical analysis using significance tests for the averages (Student’s t-test) and variances (F-test) with a significance level of α = 5%. The results show that cold waves are unevenly distributed in the agroecological zones of Santa Catarina. It is found that the AAO is associated with the occurrence of frosts (in the agroecological zones represented by the municipalities of Itajaí and São José) in the state of Santa Catarina.

1. Introduction

The geographical situation of the southern region of Brazil in the subtropics ensures the highest thermal amplitude in the annual cycle with a greater distinction between winter and summer. The mountain ranges and the southern plateau determine contrasts in the temperature distribution, this being the only region in Brazil with snow precipitation where noticeably cold temperatures have been registered [1]. Sharp temperature drops associated with incursions of cold air masses in the southern and southeastern regions of Brazil have great social impacts as they often cause damage, especially in the agricultural sector. These sudden temperature drops are usually accompanied by cold winds, accentuating the sensation of thermal discomfort.
Temperature drops in the state of Santa Catarina (SC), Brazil, are highly related to the state’s latitude, which is submitted to the varied atmospheric systems occurring in Brazil. In winter, frontal atmospheric systems are more frequent in SC. In different seasons of the year, these systems also make temperatures drop below the expected average, since the polar air masses that come subsequently have great frequency and intensity and are responsible for the occurrences of cold and even snow [2,3].
In the state of Santa Catarina (SC) (Figure 1), incursions of polar air masses commonly occur in the early fall, causing temperature drops and favoring the formation of frosts, especially in the West and Plateau regions of SC. However, it is in the winter season that the polar anticyclone moves over Argentina towards the south of Brazil and invades the territory of Santa Catarina, causing sharp temperature drops and strong winds in the southern quadrant of the country [2]. The temperatures in the state of SC tend to increase in the south–north direction, and from the higher mountainous areas and plateau to the west and east [2,4].
Santa Catarina is also known for its geographic (physical–natural) peculiarities with respect to relief. The territory has a large plateau area and approximately 20.4% of its total area consists of mountain ranges located above 900 m, so, altitude is an important factor regarding the cold in SC. These latitude peculiarities differentiate the state of SC from the state of Rio Grande do Sul (RS) and Paraná (PR), neighboring to the south and north of SC, respectively. RS is located at a higher latitude; however, it does not have areas as high as SC (although there is a mountain range). On the other hand, PR is at a lower latitude, which causes the polar masses to arrive more weakened and less frequently to the state, in general. However, these three states, RS, SC and PR, which form the Southern Region of Brazil, are directly impacted by the cold within the Brazilian context [4].
For these reasons, and the low temperatures typical of SC, the research was carried out, by choice, only in the state referring to this paper.
The social and environmental impacts of cold waves associated with oscillation rates of low-frequency variability in South America demonstrate that cold intercontinental waves sometimes cause illness—especially respiratory ones such as influenza, asthma and pneumonia—and death to people, as well as economic losses. All those factors end up impacting the development of activities in the city and countryside, damaging landscapes and cultures in different countries of the South American continent [5,6].
There is no consensus on a definition of cold wave, as there are several ways to define them [7,8,9,10,11,12]. Some studies define cold waves as a specific event, others define them as extreme or anomalous air temperature drops, without setting a threshold of temperature and frequency. In the Manual of Natural Disasters in Brazil, a cold wave is characterized by an event of rapid and big temperature drop over a wide area, lasting for several hours, days and sometimes a week or more. According to this manual, cold waves in South America occur more frequently between the months of May and September, predominantly in July and August, and typically last from four to five days [13] (p. 21).
A cold extreme is defined as the occurrence of two consecutive days or more during which the average daily surface air temperature is at least twice the standard deviation below the average local temperature in winter [11].
Cold waves differ from frosts or local coolings, as they cover large portions of the atmosphere. During a cold wave, the atmosphere is characterized by abnormally high pressures, clear sky, reduction or substitution of liquid precipitation, and periods of frost and abnormally low temperatures [5].
Frosts in southern Brazil are related with incursions of strong cold fronts, which consequently open the way to migratory anticyclones from southern Argentina [14]. The absence of cloudiness associated with a decrease in the wind speed creates conditions conducive to frost formation typical of the winter season.
Frost is a meteorological phenomenon visually recognizable by observers, usually at conventional weather stations, or its occurrence can be estimated by analyzing other registered meteorological variables such as soil temperature, hourly air temperature and/or daily minimum temperature, relative humidity, leaf wetness, etc. [15].
Other geographical factors such as latitude, maritimity, continentality, relief, soil and vegetation largely influence the intensity, duration and distribution of frosts in SC [16]. With the climatological study on frosts carried out by [16], it was found that in SC over 24 years, from 1980 to 2003, frosts were most frequently registered in the mesoregions of the South Plateau, Midwest, North Plateau and the northeast portion of the west mesoregion.
Frosts are classified as white or black. White frosts are associated with the formation of ice crystals on the ground, plants or other exposed surfaces. The process of white frost formation occurs upon dew freezing—transition from liquid to solid—when the soil temperature falls to 0 °C. However, when the air is very dry and the temperature of its dew point is below 0 °C, a frost may occur without the formation of ice crystals on the surface [17]. It is under these conditions that the so-called black frost occurs, which is more damaging to plants than the white frost as the surface temperature remains below 0 °C, freezing and burning the plant tissues [16,18].
Besides the geographical factors affecting the temperatures in SC [16], there is the impact caused by changes in the weather patterns, such as low-frequency climate variability, the El Niño-Southern Oscillation (ENSO) on an interannual scale, the Antarctic Oscillation (AAO), and the Pacific Decadal Oscillation (PDO) on a decadal scale. The climate variability timescales are as follows: intraseasonal (monthly variations occurring along the same season), interannual (annual variations of the annual or seasonal averages) and decennial/secular (variations from decade to decade or century to century) [19].
In the Southern Hemisphere (SH), the leading pattern of climate variability is the Southern Annular Mode (SAM), also known as Antarctic Oscillation (AAO) [20]. The AAO was originally identified by [21] as pressure variations in a belt that crosses Chile and Argentina, as opposed to the belt that crosses the region of the Weddell and Bellingshausen seas [22]. Subsequent studies determined that the AAO is a seasonal variation of pressure and geopotencial height between middle and high latitudes in the SH [20,23,24]. Thus, the AAO was identified as one of the modes of variability in the middle and high latitudes of the SH [23]. These authors defined the AAO as an oscillation at sea level between the pressure belts of the middle and high latitudes of the SH and a large-scale alternation of atmospheric mass between these pressure belts.
The positive phase of the AAO is associated with negative anomalies in temperature and geopotential height over the Antarctic continent and with positive anomalies in the middle latitudes. This phase is characterized by a temperature rise in the Antarctic Peninsula and South Shetland, intensification of the cyclones over the Southern Ocean and the east winds around 60° S. The negative phase, or low polarity indices, is marked by anomalies in the opposite direction [24,25,26,27,28].
Research such as this can help different areas of society, such as public health and agriculture, due to the fact that cold waves can influence and/or aggravate health problems (especially respiratory and circulatory) [29,30,31,32,33,34,35,36,37,38]; in addition, the frosts can generate problems for the cultures maintained by the farmers of the state of SC [5,10,18]. Discoveries involving cold waves and low frequency climatic variabilities can help civil society to prepare for these events, also serving as a basis for the government at different levels of management, enabling the creation of policies, plans, projects and actions to reduce the problems generated.
Other studies have investigated cold waves in Brazil (e.g., [10,12]), but none of them with statistical approaches showing the influence of AAO during the occurrence of cold waves, nor in frost cases in austral winter.
One of the challenges for this paper was the lack of published studies on cold waves and frosts linked to a climatic variability, in this case the AAO. Although some publications have been internationally published, we believe that the present paper is a groundbreaker within the proposed theme in the Brazilian context.
In this sense, this paper aimed to analyze possible influences of the Antarctic Oscillation on the occurrence of cold waves and frosts in the state of Santa Catarina, Brazil, during the winter season.

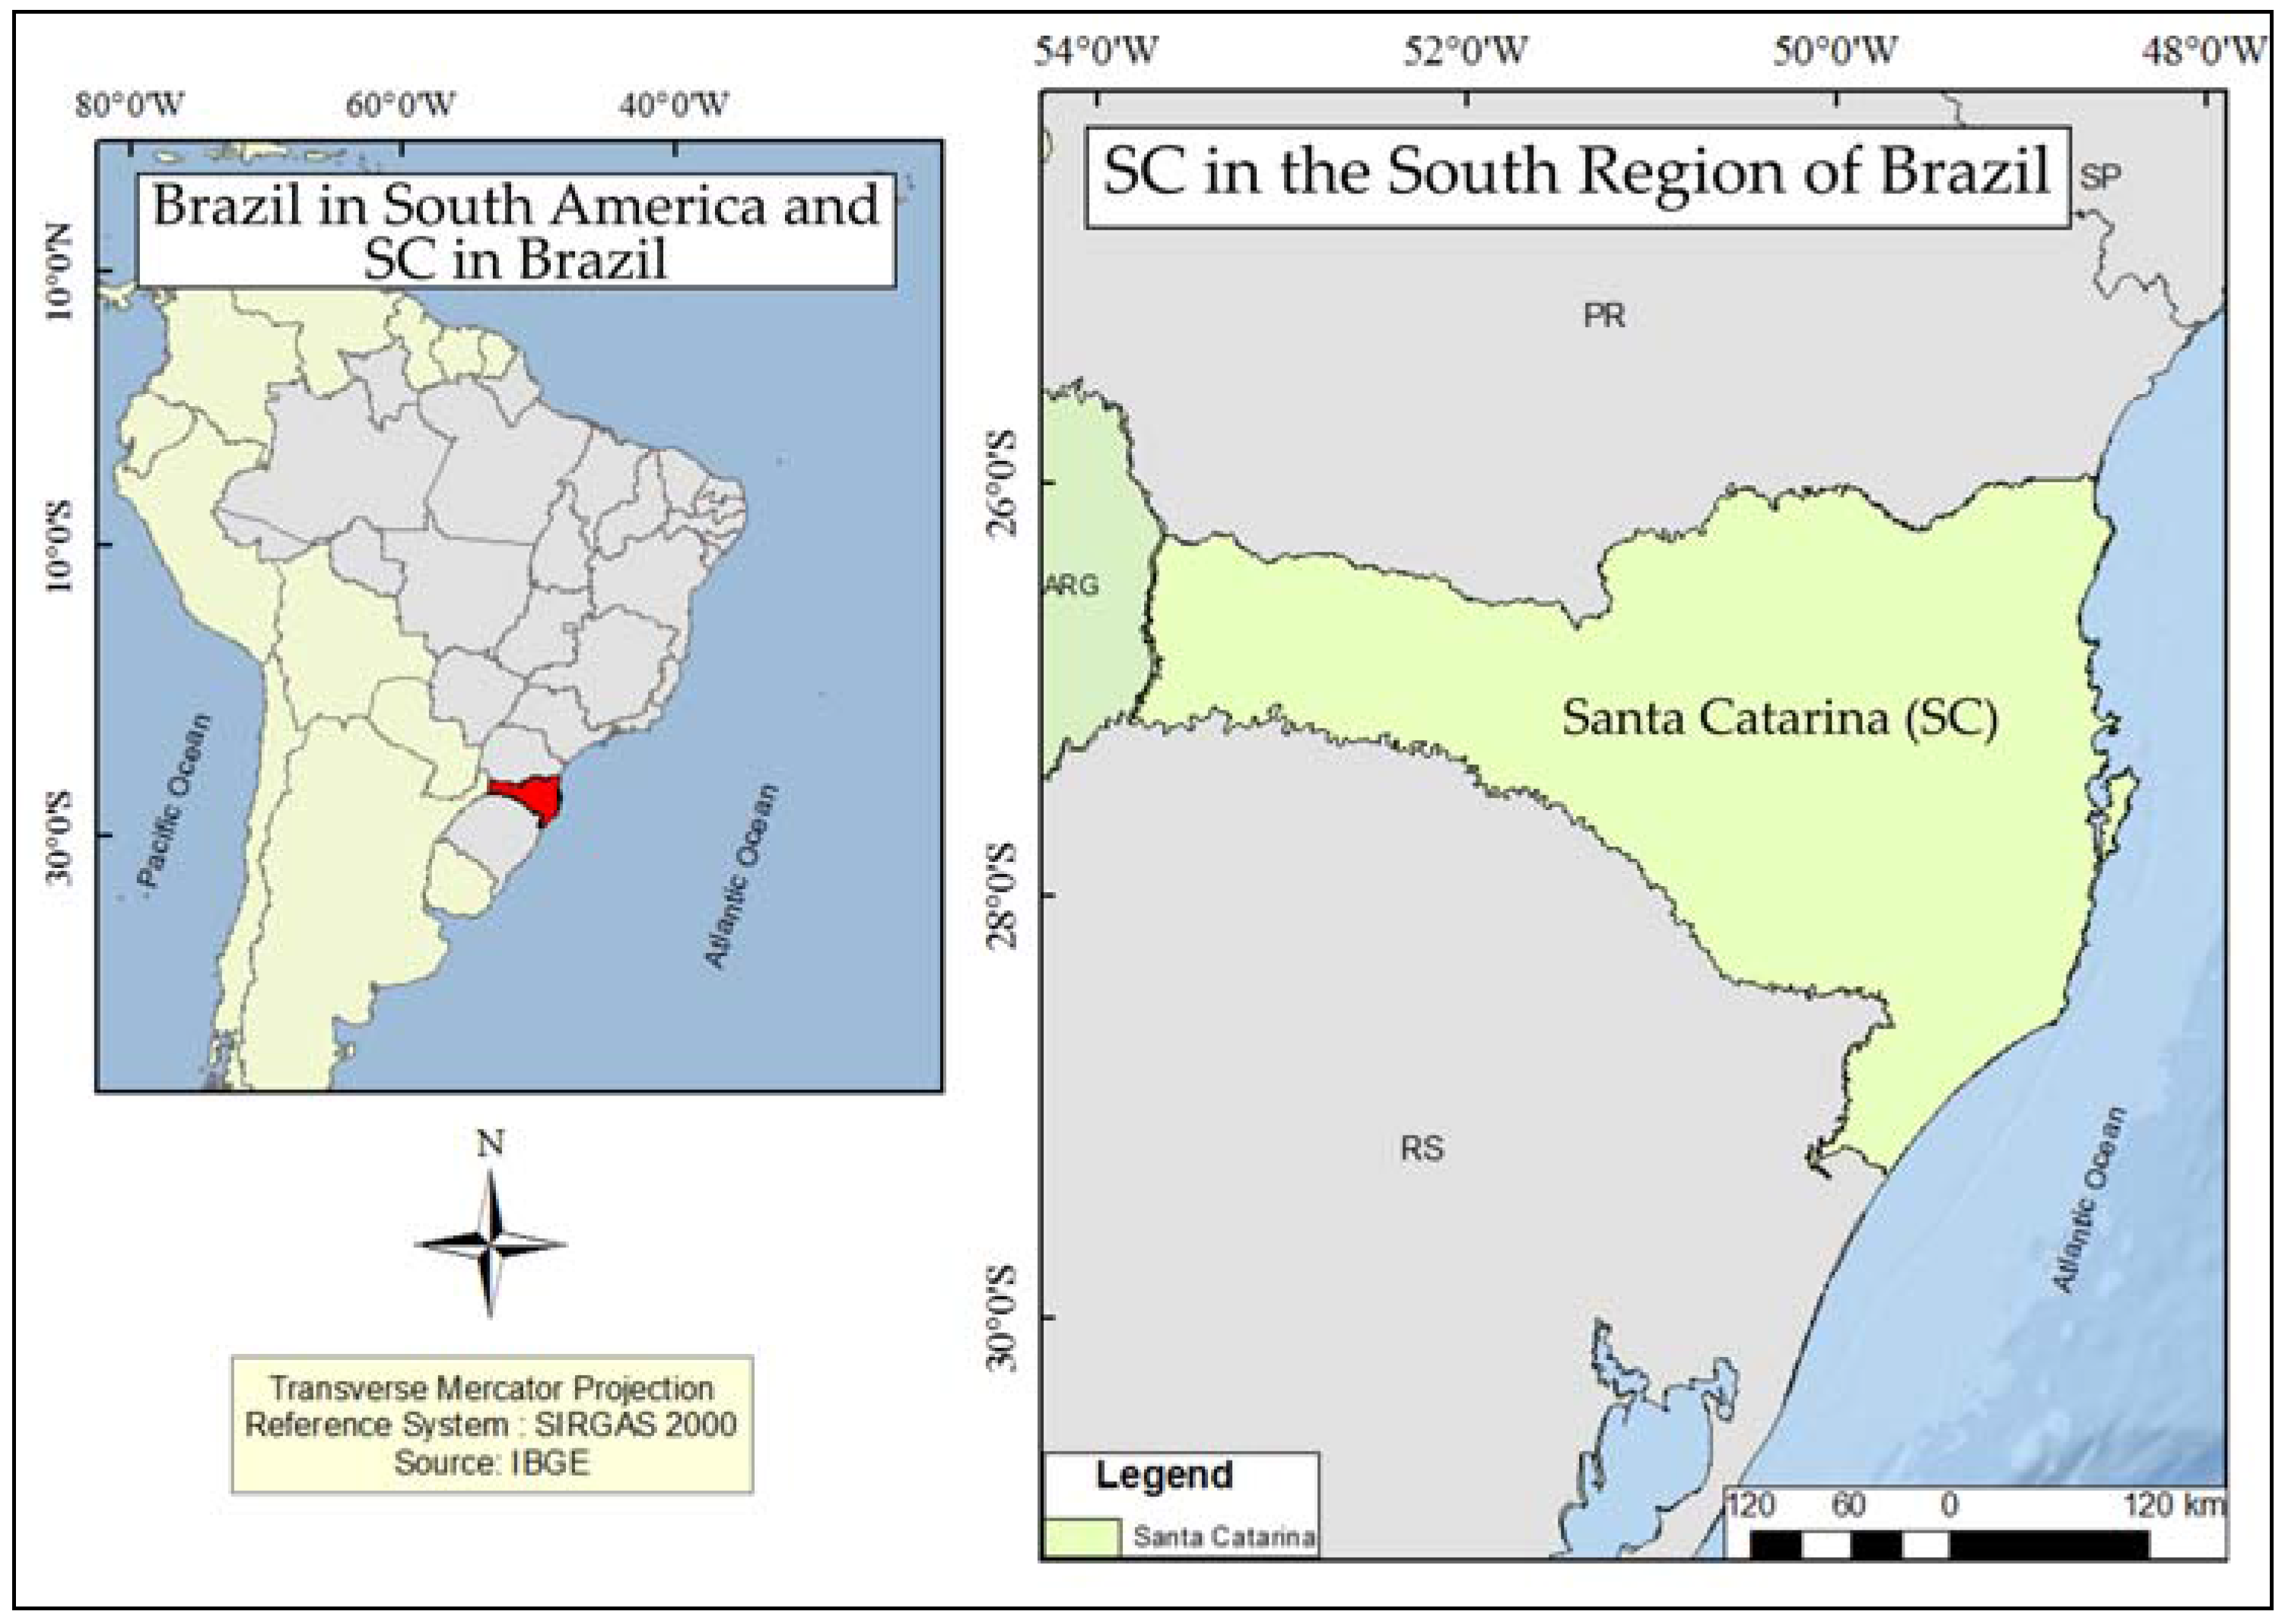
2. Materials and Methods

This paper drew upon daily air temperature data from eleven conventional weather stations (Figure 2) of the EPAGRI (Company of Agricultural Research and Rural Extension of Santa Catarina) and the CIRAM (Center for Environmental Information and Hydrometeorology) and the INMET (National Institute of Meteorology). The time series data on daily air temperature, measured in degrees Celsius (°C), encompass the winter season of the years 1983–2013, totaling 31 years of data gathering.
The choice of this time series was based on the data availability, since prior to 1983 it is difficult to find homogeneous series for all the regions analyzed, with many faults or periods without data. The 31 years analyzed represent a good data sampling; however, an ongoing updating of the data and continuation of the analysis is crucial. The analysis of the frost occurrences drew on the data of the conventional weather stations recorded by an observer at the synoptic observation times, which are 9 a.m., 3 p.m. and 9 p.m. in Brazil, Brasilia time (disregarding the Daylight Saving Time). The data recorded by a meteorological observer are advantageous for not depending upon automatic instruments with respect to their effectiveness. These data on frost occurrence recorded at the weather stations have their intensity classified from weak to exceptional, measured by the minimum temperature of the grass. The study took into account only the occurrence or non-occurrence of frosts, disregarding their intensity. The data were provided by EPAGRI/CIRAM.
For the purpose of regionalization, we used a division delimited by the agroecological zones of Santa Catarina, characterized in a relatively homogeneous way based on physical factors such as: climate, mainly regarding the thermopluviometric regime; soil; land forms; biology (flora, fauna) and socioeconomic (human activities); besides the evaluation of these same areas with respect to their sustainability potential for specific uses [39]. The state of SC has other regional classifications, among them, the political-administrative division into mesoregions by the Brazilian Institute of Geography and Statistics (IBGE), and the Köppen and Thornthwaite climate classifications. However, as presented previously, we decided to use the agroecological zones of SC for providing greater detail of the physical-natural aspects of the state [40,41,42].
The data on the compensated average air temperature were organized on Excel 2007 spreadsheets, and then the cold wave classification method proposed by [11] was applied. This method considers cold waves to be the event in which the average daily surface air temperature is at least twice the standard deviation below the average value for two consecutive days or more in the winter season. The standard deviation (S) is the average value of the 365 daily air temperature standard deviations. However, this paper takes into account only the 92 days of winter from June 1 to August 31. There are several methods to classify a cold wave, but there is no universal conceptualization. As an example, there are studies that use percentile techniques allied to minimum and maximum temperatures; with longer periods of time (amount of days) based on minimum temperature anomalies; percentiles with average temperature; with the wave intensity; among others (e.g., [9,43,44]). We decided not to use the minimum temperature for identification of cold waves, as in some studies, owing to the thermal amplitude that some regions may present. The method that this study used to classify the cold waves identifies only extreme waves, yet it can provide a fairly large amount of extreme events.
Thus, a cold day is classified as the day whose average air temperature is below or equal to the threshold identified for its date, and, in order to classify it as a cold wave, this needs to occur for two consecutive days or more. It can be said that this analysis can be identified as a climatological study for the classification of cold days in SC and also for identification of cold waves, given the series under analysis.
The analysis related to the AAO drew upon data on monthly averages of the Antarctic Oscillation Index (Table 1) provided by the Climate Prediction Center/National Centers for Environmental Prediction (CPC/NCEP) for the period 1983–2013. The CPC computes the Antarctic Oscillation Index daily through the projection of geopotential height anomalies at 700 hPa on the main mode of the Empirical Orthogonal Function (EOF-1) derived from monthly averages of geopotencial height anomalies at 700 hPa from 20° to 90° S. EOF-1 captures the maximum explained variance.
The AAO data allowed establishing connections of these variabilities with the occurrence of cold waves and frosts by means of graphs and comparative tables, according to the cold wave occurrence dates from each weather station.
Different methods are available to test the statistical significance of the difference between population means or variances, for instance the z-test, the Student’s t-test, the χ2-test, and the Snedecor’s F-test. For the choice of the most appropriate method, some criteria must be considered as the sample size whether the standard deviation and/or variance is known, whether the samples follow a normal distribution and whether or not the amount of samples of both populations compared is the same. So, for being more adequate for the data analysis in this study, the Student’s t-test and the Snedecor’s F-test were used to test the difference between means and variances, respectively, at 5% of significance level. In this study, the Student’s t-test was used to compare the means of occurrence of cold waves in the positive and negative phase of AAO. In order to test the statistically significant differences between the standard deviations of the samples, the analysis of variance was applied through the F-test, at a significance level of 5%. The analyses were carried out using the statistical program PAST© [46].

3. Results

The weather stations in the municipalities of Chapecó and Caçador registered the largest number of occurrences of cold waves, 93 and 77 respectively, followed by Campos Novos (71), São Joaquim (69), Lages (64), Itajaí (58), Ituporanga (56); Urussanga (54), São José (52), Major Vieira (50) and Itapiranga (48). The average of occurrence was 62.8 cold waves among the eleven stations in SC, from 1983 to 2013 (Figure 3). It is worth mentioning that the data periods were different for some stations: Itapiranga (1987–2013), Major Vieira (1988–2013) and the stations of São Joaquim and Ituporanga (1984–2013).
In general, the high-altitude regions presented more occurrences of cold waves, highlighting the influence of relief and altitude on the temperature behavior in SC. Another important fact that can justify this spatial distribution of cold waves are the seasonal trajectories of the polar systems, which in their mostly continental movement eventually penetrate the west/southwest regions of SC. In SC, continentality, relief, altitude and maritimity are the factors that have greater interaction with the atmospheric systems and therefore are the most influential ones [4] (p. 5).
By relating cold wave occurrences in SC with the AAO in the austral winter season (Figure 4), it can be stated that, except for Ituporanga, Itapiranga and Campos Novos, the stations presented more occurrences of cold waves in the positive phase of the AAO. Regarding the AAO, its positive phase is the one that contributes to negative temperature anomalies in southern Brazil [5,24,27,28,47,48].
When considering the occurrence of frosts during the winter cold waves in relation to the AAO phases (Figure 5), it appears that in ten seasons the occurrence of frosts is frequent in the positive phase of the AAO, especially in Itajaí (70%), a result similar to those for cold waves. The Ituporanga station was the only station that, during the negative period of the analyzed variability, obtained a higher occurrence (60.9%).
Positive anomalies in the Antarctic Oscillation Index cause abnormally dry conditions in southern South America, Australia and South Africa, while strong zonal winds increase the isolation of Antarctica, reducing heat exchange with the tropics and causing a cooling of the continent and the seas surrounding it, generating the air masses that are responsible for the cold waves, low temperatures, and subsequent occurrence of frosts [5]. According to the literature review, the AAO was in line with the expectations for its phases in relation to the occurrence of cold weather (cold waves and occurrence of frosts).

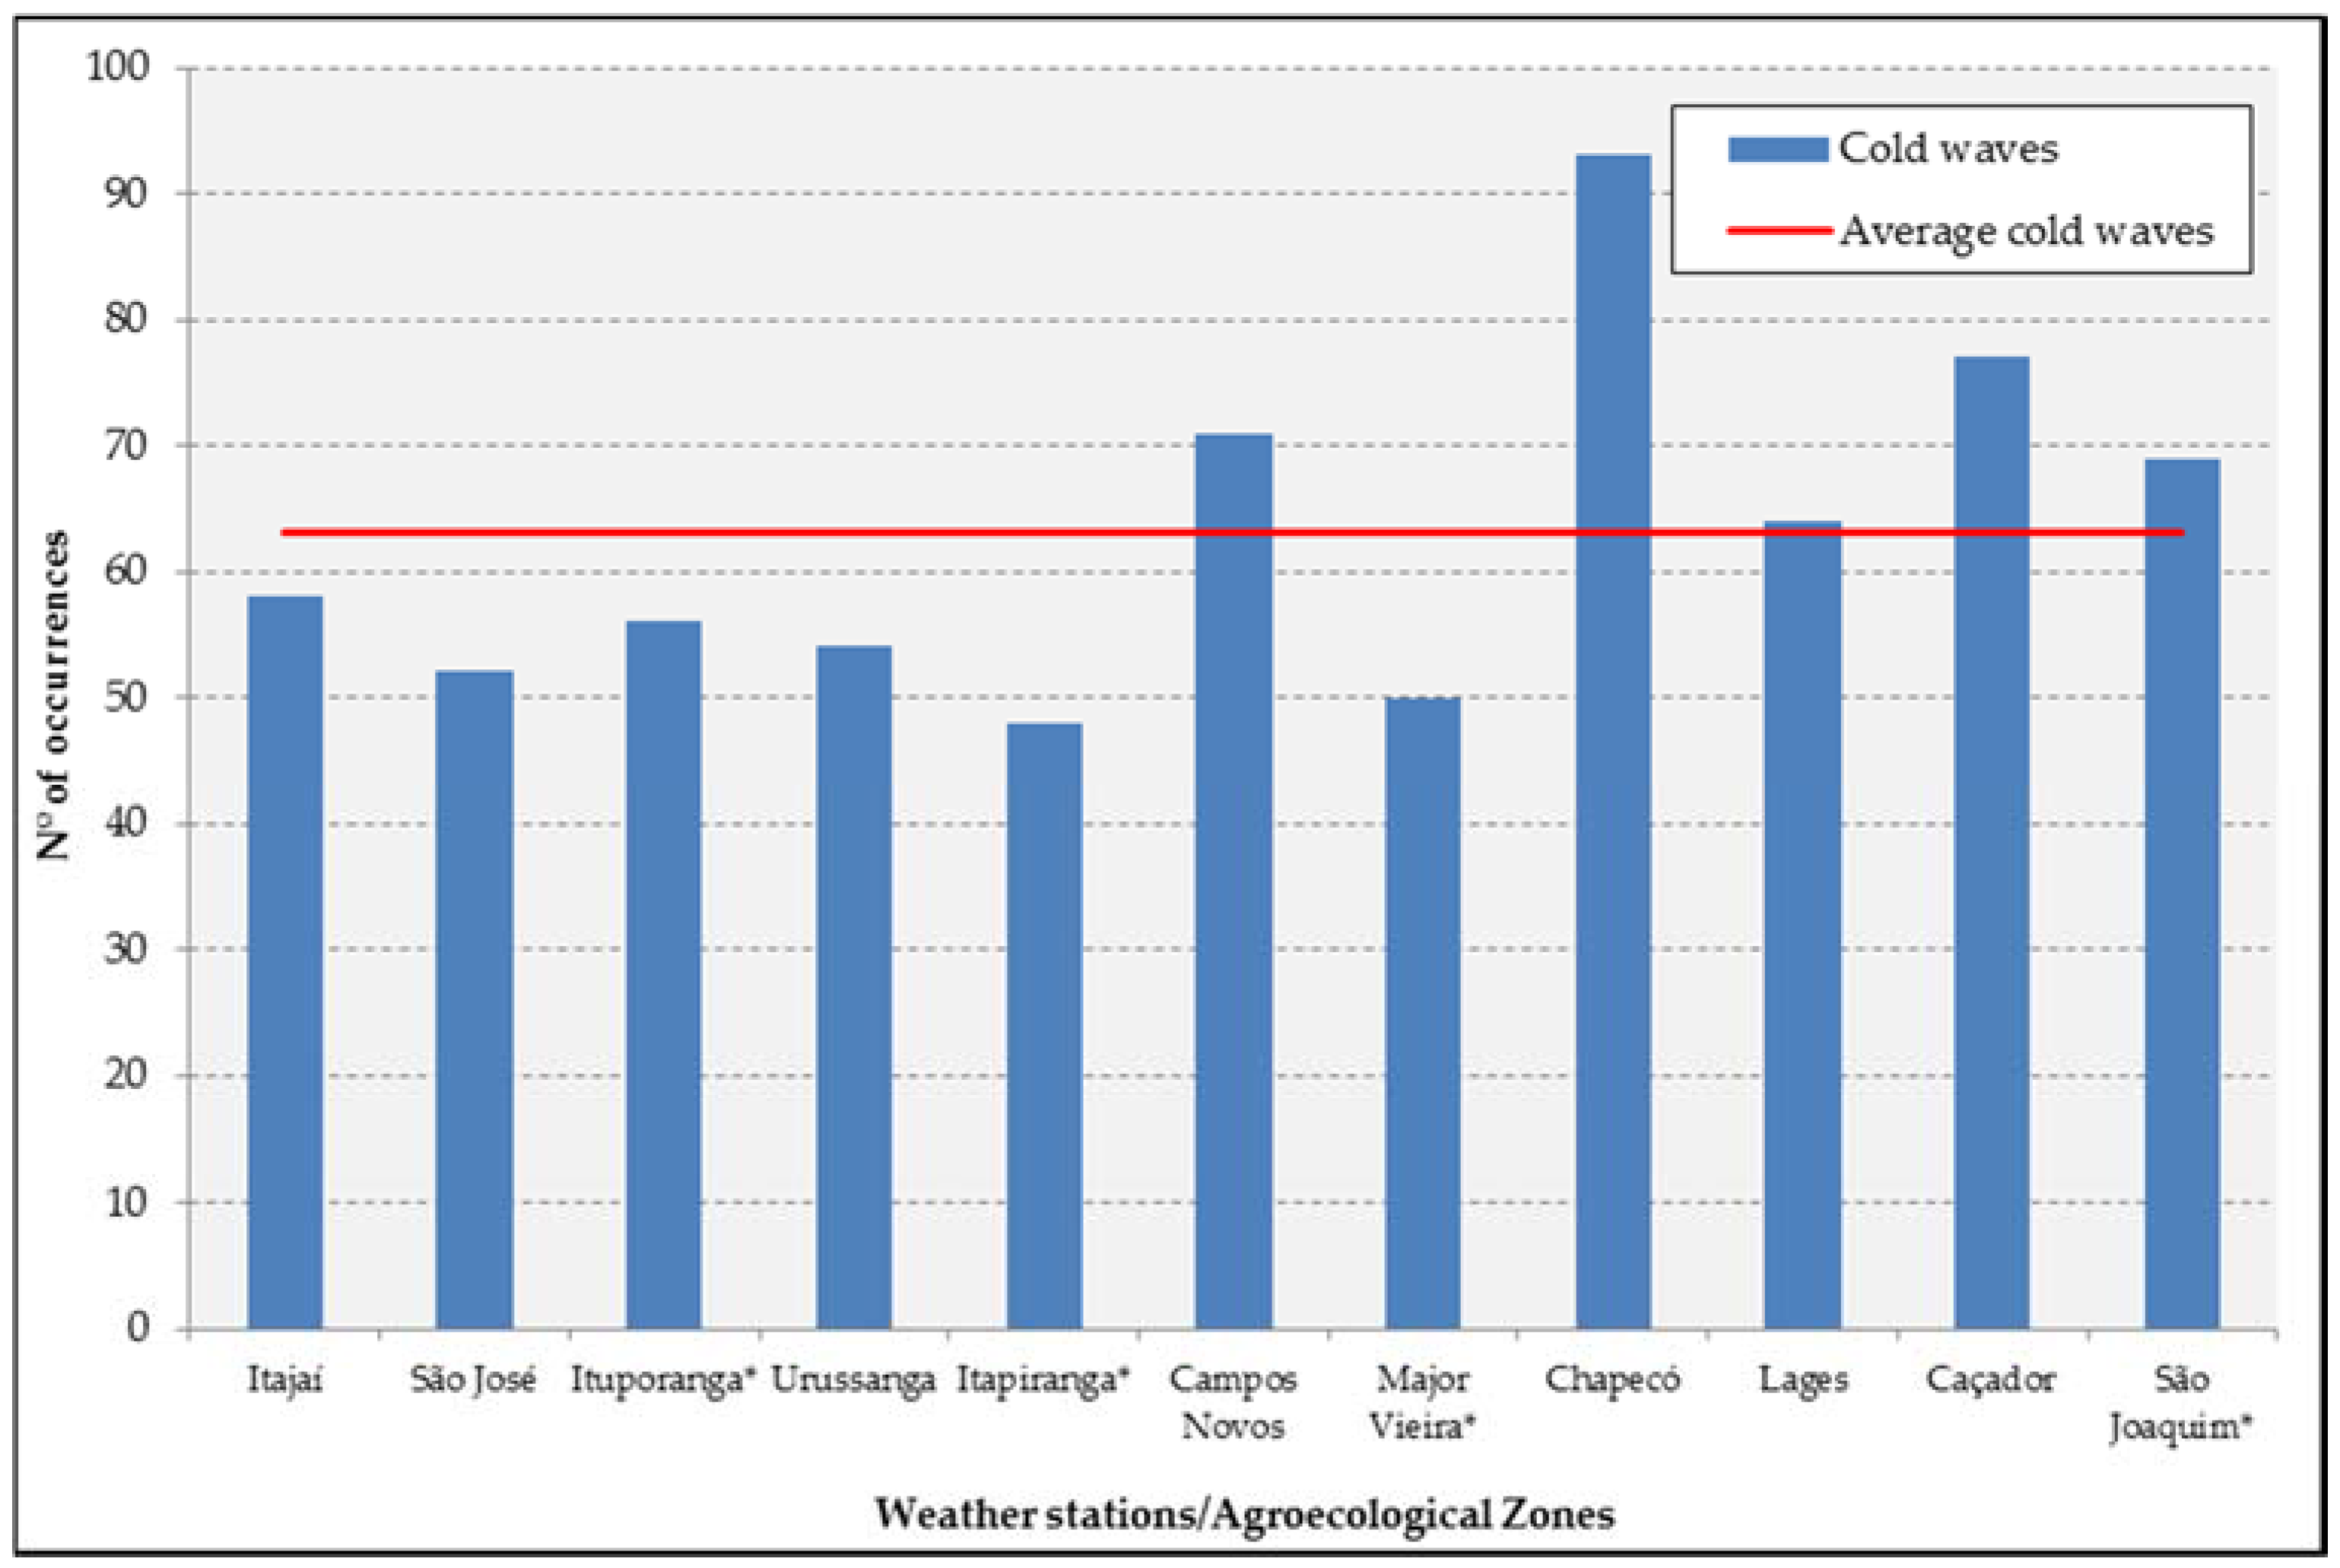
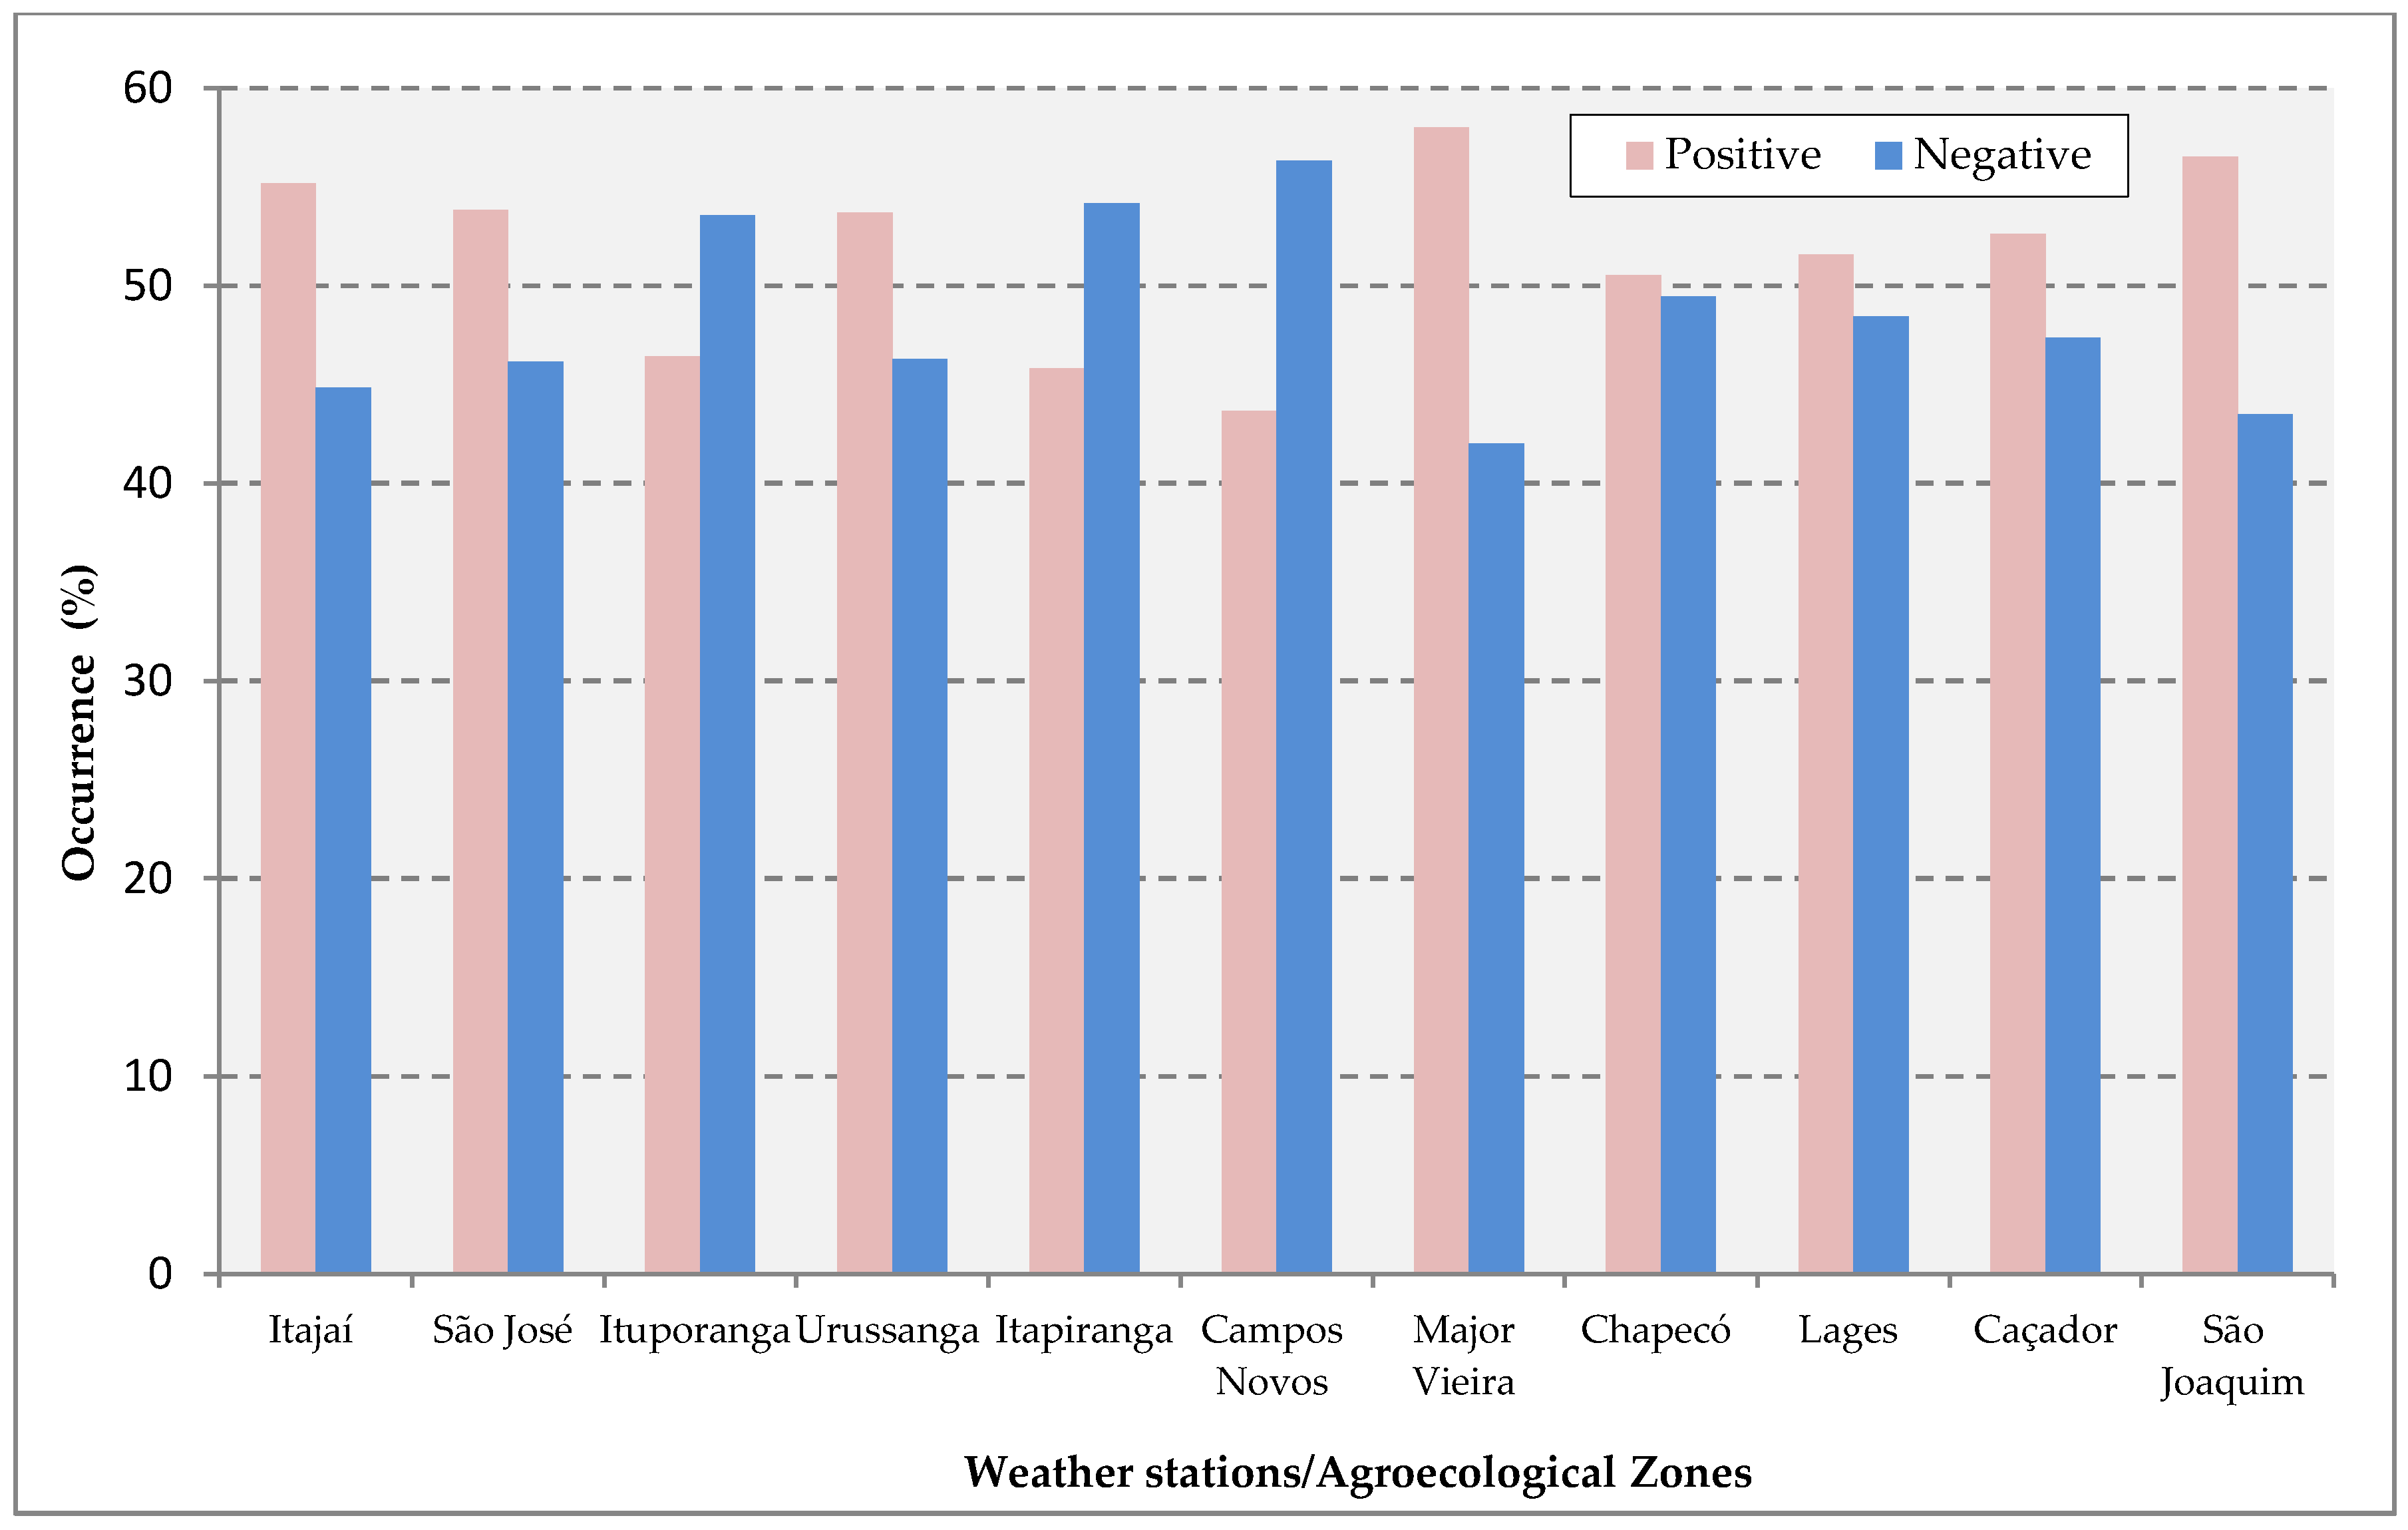
3.1. Statistical Analysis between Cold Waves and the AAO

During cold waves, in most of the stations the highest average values prevailed in the negative phase of the AAO. However, these averages do not show statistical significance to any of the stations analyzed (Table 2).
Table 3 shows that, just as with the averages, the variances did not differ either among themselves in any station, with well distributed dispersions among the stations in the positive and negative phases of the AAO.

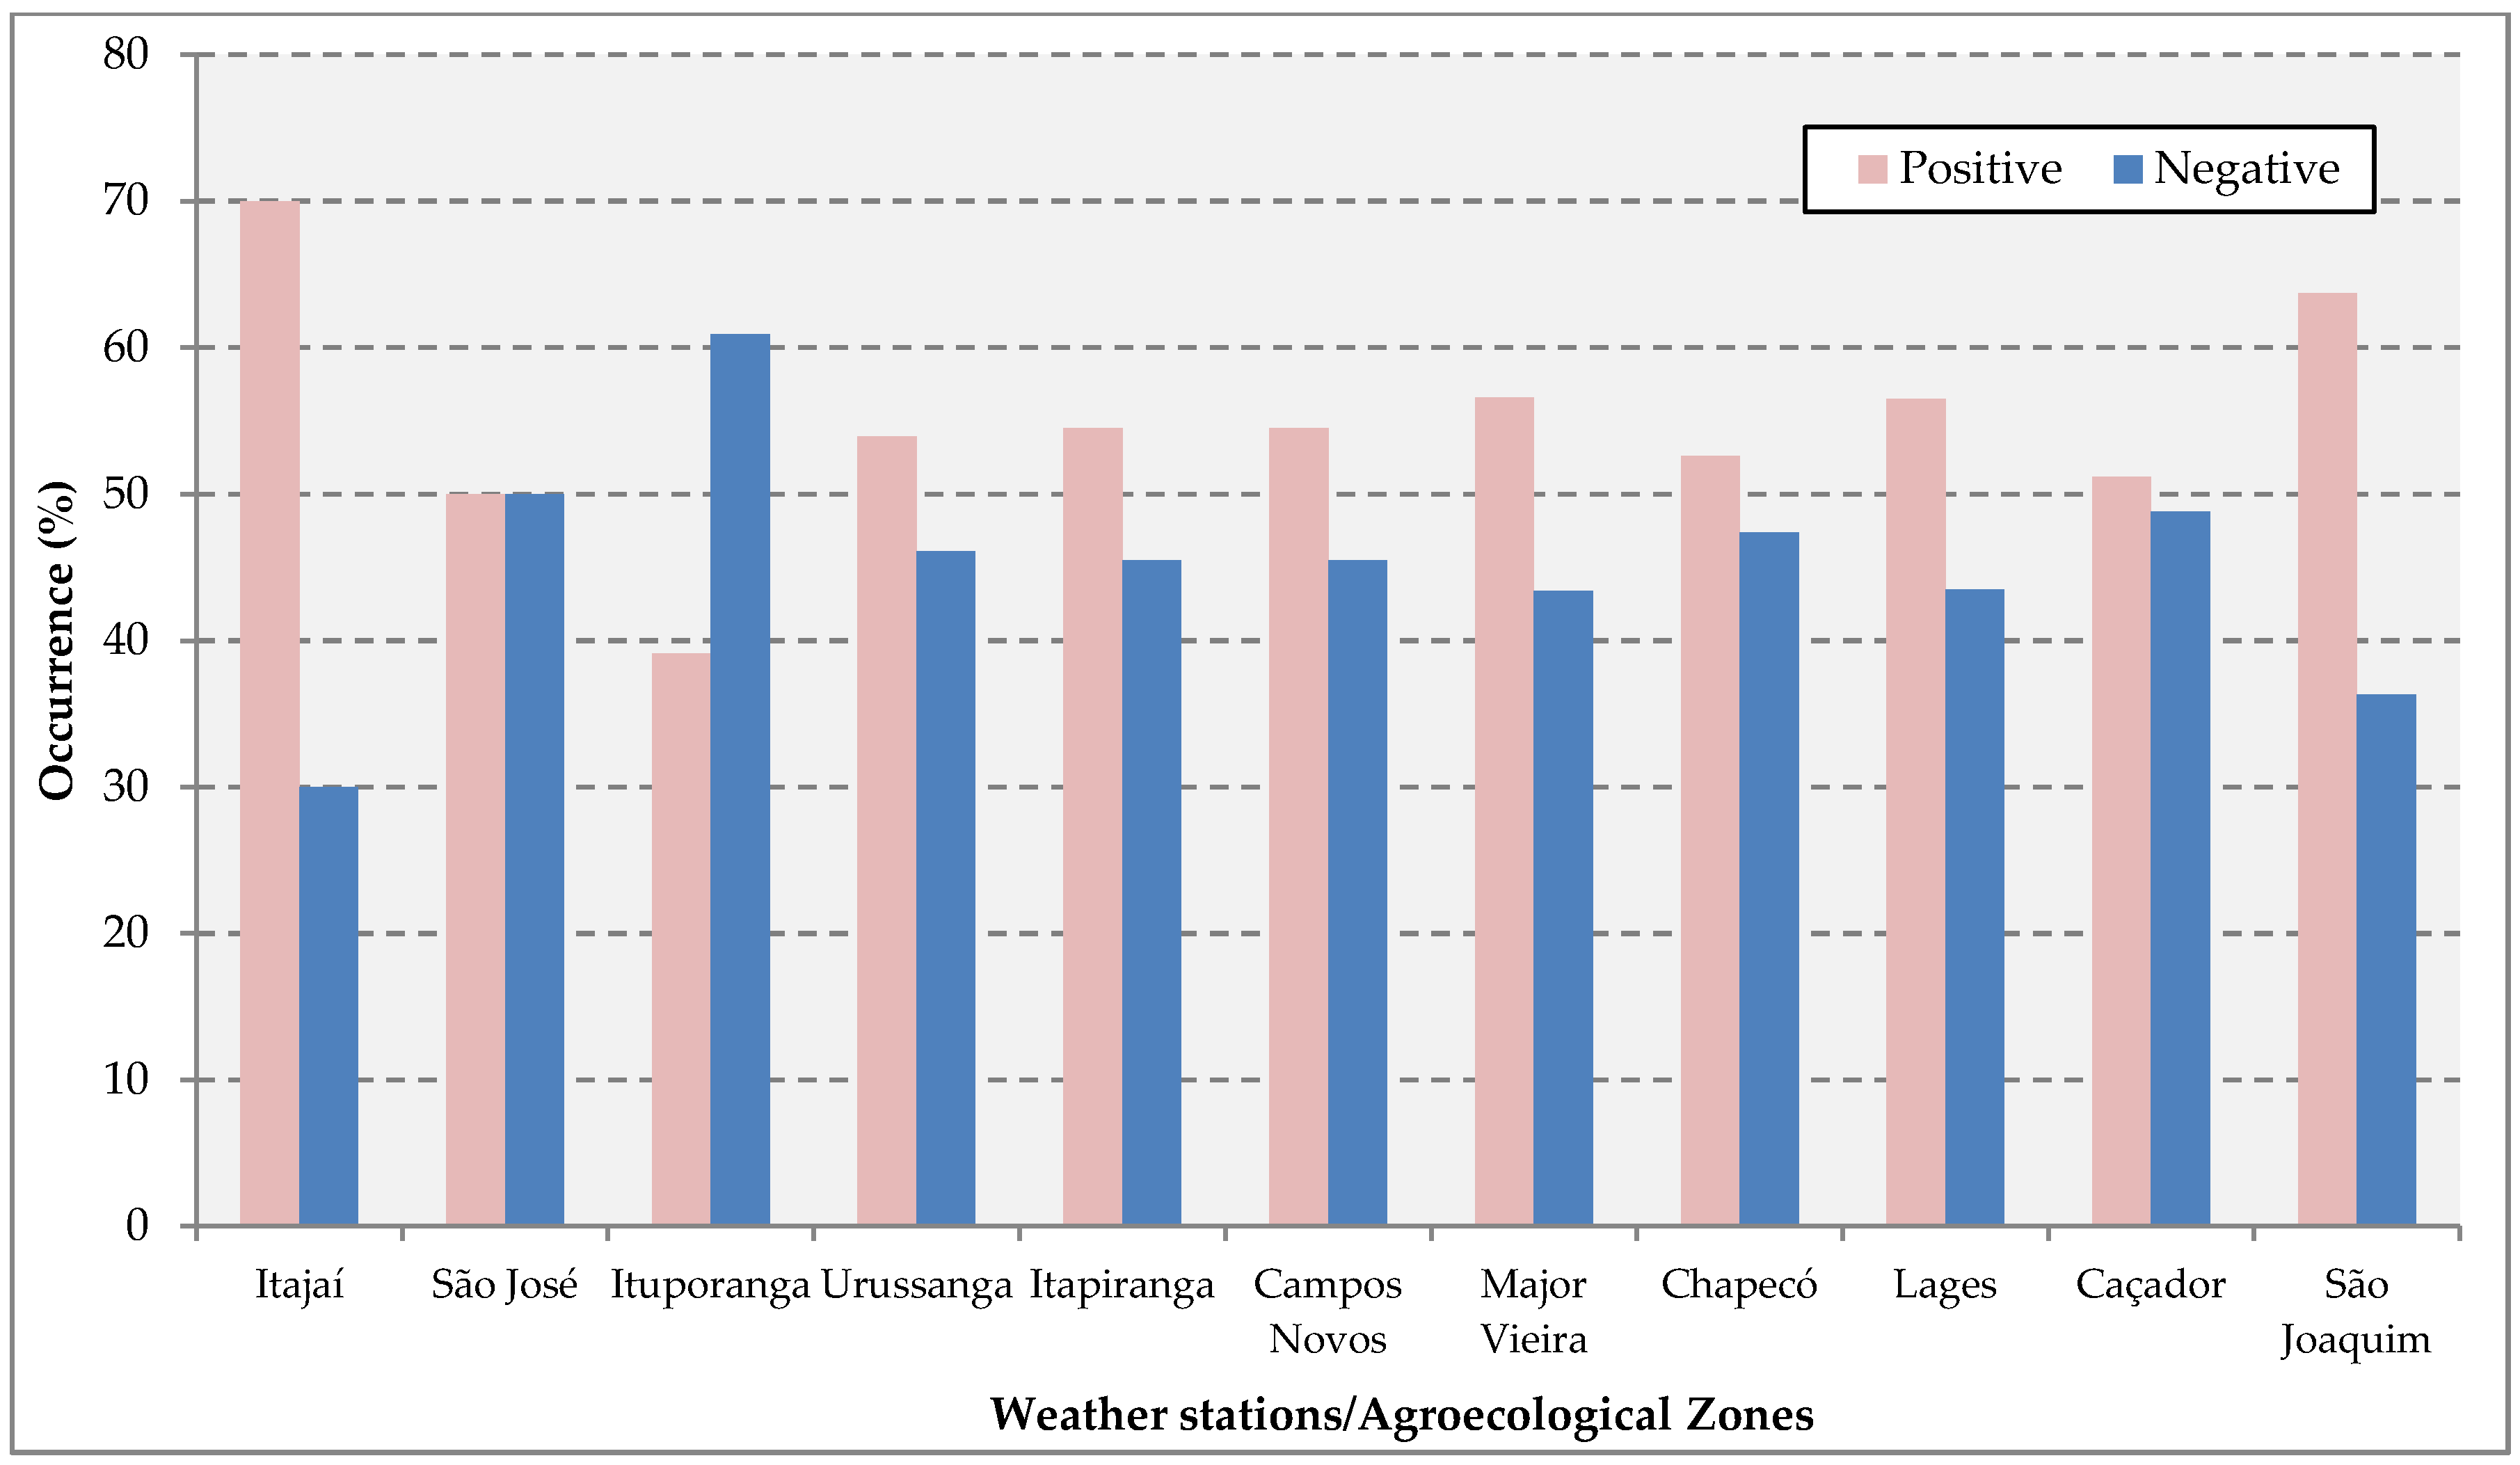
3.2. Statistical Analysis between Frosts and the AAO

The highest averages related to frost occurrences during the AAO are well distributed in the positive and negative phases among the weather stations (Table 4). Thus, the average occurrence of frosts in SC in cold wave events is the same among the phases of the AAO.
When testing the variances, the weather stations of Itajaí and São José showed a 5% statistical significance (Table 5), demonstrating that after years of positive AAO, a greater dispersion of frost occurrences than that of the negative phase is expected.

4. Discussion and Conclusions

During the positive phase of the AAO, low pressure anomalies occur in Antarctica and high pressure anomalies occur in the middle latitudes. Thus, during the positive phase there is a greater chance of cold events in the middle latitudes, where SC is situated [24,27,28]. A positive anomaly in the Antarctic Oscillation Index causes abnormally dry conditions in southern South America, Australia and southern Africa, while strong zonal winds increase Antarctic insulation by reducing heat exchange with the tropics and cooling the continent and surrounding seas, giving rise to air masses which are responsible for the cold waves, low temperatures and consequent occurrence of frosts [5].
In this sense, the results found in this study are in agreement with the literature on the subject, as it was verified that the positive phase of the AAO presented more occurrences of cold waves and frosts in SC during winter. Based on the Student’s t-test and the F-test, with a significance level of 5%, it can be stated that the AAO does not have a statistically significant relationship with the frosts episodes in SC, the only exceptions are the agroecological zones represented by the weather stations of the municipalities of Itajaí and São José (greater variability in frost occurrences in the positive phase of the AAO). As for cold wave occurrences, the AAO has no statistically significant influence.
It was found that cold waves are unevenly distributed in the agroecological zones of SC due to the local geographic factors, the variability of the weather systems, and the trajectories of the polar systems in the continental winter. The weather stations in the municipalities of Chapecó, Caçador, Campos Novos and São Joaquim had the highest number of cold wave events in SC during winter. It is worth emphasizing the influence of relief and altitude on the air temperatures in the state, which may justify the uneven distribution of cold waves and frosts in the agroecological zones, as well as the influence of the AAO, as they are interconnected. The studies conducted by [49] on the relationship between altitude and temperature in the climate zones of SC demonstrated that altitude, latitude and longitude, in this order, influence the average air temperature. The average thermal gradient obtained for the set of all weather stations analyzed in SC was −1 °C/213 m, which is equivalent to a reduction of approximately 0.48 °C per 100 m of altitude.
The relationship between altitude and temperature is especially important for tropical and subtropical regions where an altitude difference of a few hundred meters and slope exposure tend to cause significant changes in the environment.
It is recommended that further research be carried out with an extended data series, from 2013 on, and including all seasons. Considering that other low-frequency climate variabilities exert influence on air temperatures in various parts of the Earth, it is suggested that cold waves and frosts be investigated in this regard. Low-frequency climate variabilities can also exert influence on temperature in a coupled way, possibly generating anomalies even in their classical signatures along their phases. In addition, the method employed here can be applied to other locations in the Southern Cone of South America.

Acknowledgments

Special thanks to the LabClima (Applied Climatology Laboratory) of the Department of Geosciences at UFSC represented by Professor Magaly Mendonça in charge of the project “Climas regionais e locais em Santa Catarina e América do Sul: mudanças, variabilidade, eventos extremos e impactos socioambientais” (Regional and local climates in Santa Catarina and South America: changes, variability, extreme events and socio-environmental impacts) in which the present study is inserted. We also thank the Geography Graduate Program at UFSC and the EPAGRI/CIRAM for providing the meteorological data.

Author Contributions

This paper originated from the master’s research carried out by Maikon P. A. Alves; however, all authors contributed in the various stages of preparation of this paper. Maikon and Rafael B. Silveira contributed more actively to structuring and writing; and Rosandro B. Minuzzi and Alberto E. Franke contributed mainly to the critical review of the research.

Conflicts of Interest

The authors declare no conflict of interest.

References

  1. Grimm, A.M. Variabilidade Interanual do Clima no Brasil. In Tempo e Clima no Brasil, 1st ed.; Cavalcanti, I.F.A., Ed.; Oficina de texto: São Paulo, Brasil, 2009; Volume 1, pp. 353–373. [Google Scholar]
  2. Monteiro, M. Caracterização climática do estado de Santa Catarina: Uma abordagem dos principais sistemas atmosféricos que atuam durante o ano. Rev. Geosul. 2001, 16, 69–78. [Google Scholar]
  3. Murara, P.G.; Fuentes, M.V. Neve. In Atlas de Desastres Naturais do Estado de Santa Catarina: Período de 1980 a 2010, 2nd ed.; Cavalcanti, I.F.A., Ed.; IHGSC-GCN/UFSC: Florianópolis, Brasil, 2014; Volume 1, pp. 163–166. [Google Scholar]
  4. Monteiro, M.; Mendonça, M. Dinâmica Atmosférica no Estado de Santa Catarina. In Atlas de Desastres Naturais do Estado de Santa Catarina: Período de 1980 a 2010, 2nd ed.; Cavalcanti, I.F.A., Ed.; IHGSC-GCN/UFSC: Florianópolis, Brasil, 2014; Volume 1, pp. 5–12. [Google Scholar]
  5. Mendonça, M.; Romero, H. Ondas de frio, índices de oscilação e impactos socioambientais das variabilidades climáticas de baixa frequência na América do Sul. Rev. Acta Geogr. 2012, 2, 185–203. [Google Scholar] [CrossRef]
  6. BRASIL. Ministério da Saúde. Exposição ao frio Pode Agravar Doenças Respiratórias. Portal Brasil/Portal da Saúde, 2014. Available online: http://www.brasil.gov.br/saude/2014/04/exposicao-ao-frio-pode-agravar-doencas-respiratorias (accessed on 24 November 2016). [Google Scholar]
  7. Boyle, J.S. Comparison of the synoptic conditions in midlatitudes accompanying cold surges over eastern Asia for the months of December 1974 and 1978. Part I: Monthly mean fields and individual events. Mon. Weather Rev. 1986, 114, 903–918. [Google Scholar] [CrossRef]
  8. Konrad, C.E. Relationships between the intensity of cold-air outbreaks and the evolution of synoptic and planetary-scale features over North America. Mon. Weather Rev. 1996, 124, 1067–1083. [Google Scholar] [CrossRef]
  9. Walsh, J.E.; Phillips, A.S.; Portis, D.H.; Chapman, W.L. Extreme cold outbreaks in the United States and Europe, 1948–99. J. Clim. 2001, 14, 2642–2658. [Google Scholar] [CrossRef]
  10. Escobar, G.C.J. Padrões sinóticos associados a ondas de frio na cidade de São Paulo. Rev. Bras. Meteor. 2007, 22, 241–254. [Google Scholar] [CrossRef]
  11. Vavrus, S.; Walsh, J.E.; Chapman, W.L.; Portis, D. The behavior of extreme cold air outbreaks under greenhouse warming. Int. J. Climatol. 2006, 26, 1133–1147. [Google Scholar] [CrossRef]
  12. Firpo, M.A.F. Climatologia das ondas de frio e calor para o Rio Grande do Sul e sua Relação com o El Niño e La Niña. Master’s Thesis, Federal University of Pelotas, Pelotas, Brazil, 2008; p. 120. [Google Scholar]
  13. Castro, A.L.C.; Calheiros, L.B.; Cunha, M.I.R.; Bringel, M.L.N.C. Manual de Desastres Naturais, 1st ed.; Ministério do Planejamento e Orçamento, Secretaria Especial—Defesa Civil: Brasília, Brasil, 1995; p. 182. [Google Scholar]
  14. Seluchi, M.E.; Nerv, J.T. Condiciones meteorológicas associadas a la ocurrencia de heladas en la region de Maringá. Rev. Bras. Meteor. 1992, 7, 523–534. [Google Scholar]
  15. Minuzzi, B.M. Ocorrências de Geada no Estado de Santa Catarina. In Anais de Resumos Expandidos [Recurso Eletrônico]; II Simpósio Brasileiro de Agropecuária Sustentável, Viçosa, Brasil, 23–26 September 2010; Lana, R.P., Guimarães, G., Eds.; Viçosa, Brasil, 2010; Available online: https://www.alice.cnptia.embrapa.br/alice/bitstream/doc/874384/1/anaissimbras2010.pdf (accessed on 1 October 2016).
  16. Aguiar, D.; Mendonça, M. Climatologia das Geadas em Santa Catarina. In Anais do SIBRADEN; I Simpósio Brasileiro de Desastres Naturais, Florianópolis, Brasil, 26–30 September 2004; Herrmann, M.L.P., Ed.; GEDN/UFSC (CD-ROM): Florianópolis, Brasil, 2004; pp. 762–773. [Google Scholar]
  17. Tubelis, A.; Nascimento, F.J.L. Meteorologia Descritiva: Fundamentos e Aplicações Brasileiras, 3rd ed.; Nobel: São Paulo, Brasil, 1992; p. 374. [Google Scholar]
  18. Spinelli, K.; Alves, D.B. Geada. In Atlas de Desastres Naturais do Estado de Santa Catarina: Período de 1980 a 2010, 2nd ed.; Hermann, M.L.P., Ed.; IHGSC-GCN/UFSC: Florianópolis, Brasil, 2014; Volume 1, pp. 155–162. [Google Scholar]
  19. Wallace, J.M.; Hobbs, P. Atmospheric Science: An Introductory Survey, 2nd ed.; Academic Press: New York, NY, USA, 2006. [Google Scholar]
  20. Carvalho, L.M.V.; Jones, C.; Ambrizzi, T. Opposite phases of the Antarctic Oscillation and relationships with intraseasonal to interannual activity in the tropics during the austral summer. J. Clim. 2005, 18, 702–718. [Google Scholar] [CrossRef]
  21. Walker, G.T. World weather. Q.J.R. Meteorol. Soc. 1928, 54, 79–87. [Google Scholar] [CrossRef]
  22. Boiaski, N.T. Extremos Intra-Sazonais de Temperatura na Península Antártica e Mecanismos Atmosféricos Associados. Master’s Thesis, University of São Paulo, São Paulo, Brazil, 2007; p. 119. [Google Scholar]
  23. Gong, D.; Wang, S. Definition of Antarctic Oscillation. Geophys. Res. Lett. 1999, 26, 459–462. [Google Scholar] [CrossRef]
  24. Thompson, D.W.J.; Wallace, J.M. Annular modes in the extratropical circulation. Part I: Month-to-month variability. J. Clim. 2000, 13, 1000–1016. [Google Scholar] [CrossRef]
  25. Thompson, D.W.J.; Solomon, S. Interpretation of recent southern hemisphere climate change. Science 2002, 296, 895–899. [Google Scholar] [CrossRef] [PubMed]
  26. Marshall, G.J. Half-century seasonal relationships between the Southern Annular Mode and Antarctic temperatures. Int. J. Climatol. 2007, 27, 373–383. [Google Scholar] [CrossRef] [Green Version]
  27. Justino, F.B.; Peltier, W.R. Climate anomalies induced by the Artic and Antartics Oscillations: Glacial maximum and presente-day perpectives. J. Clim. 2008, 21, 459–475. [Google Scholar] [CrossRef]
  28. Lindemann, D.S. Variações de Temperatura no Continente Antártico: Observações e Reanálises. Master’s Thesis, Federal University of Viçosa, Viçosa, Brazil, 2012; p. 105. [Google Scholar]
  29. Feigin, V.L.; Nikitin, Y.U.; Bots, M.L.; Vinogradova, T.E.; Grobbee, D.E. A population-based study of the associations of stroke occurrence with weather parameters in Siberia, Russia (1982–92). Eur. J. Neurol. 2000, 7, 171–178. [Google Scholar] [CrossRef] [PubMed]
  30. Wilkinson, P.; Landon, M.; Armstrong, B.; Stevenson, S.; McKee, M. Cold Comfort: The Social and Environmental Determinants of Excess Winter Death in England, 1986–1996, 1st ed.; Joseph Rowntree Foundation, Ed.; The Policy Press: York, UK, 2001. [Google Scholar]
  31. Healy, J.D. Excess winter mortality in Europe: A cross country analysis identifying key risk factors. J. Epidemiol. Community Health 2003, 57, 784–789. [Google Scholar] [CrossRef] [PubMed]
  32. WHO. Extreme Weather and Climate Events and Public Health Responses: Report on a WHO Meeting; European Environment Agency: Bratislava, Slovakia, 2004. [Google Scholar]
  33. Lomborg, B. The Skeptical Environmentalist: Measuring the Real State of the World, 1st ed.; Cambridge University Press: Cambridge, UK, 2003. [Google Scholar]
  34. Morabito, M.; Crisci, A.; Grifoni, D.; Orlandini, S.; Cecchi, L.; Bacci, L.; Modesti, P.; Gensini, G.; Maracchi, G. Winter air-mass-based synoptic climatological approach and hospital admissions for myocardial infarction in Florence, Italy. Environ. Res. 2006, 102, 52–60. [Google Scholar] [CrossRef] [PubMed]
  35. Carson, C.; Hajat, S.; Armstrong, B.; Wilkinson, P. Declining vulnerability to temperature-related mortality in London over the 20th century. Am. J. Epidemiol. 2006, 164, 77–84. [Google Scholar] [CrossRef] [PubMed]
  36. Guerreiro, V.I.V. Mortalidade e Conforto Bioclimático em Coimbra—Estudo da Vulnerabilidade das Populações ao frio. Master’s Thesis, University of Coimbra, Coimbra, Portugal, 2011. [Google Scholar]
  37. Barnett, A.G.; Hajat, S.; Gasparrini, A.; Rocklöv, J. Cold and heat waves in the United States. Environ. Res. 2012, 112, 218–224. [Google Scholar] [CrossRef] [PubMed] [Green Version]
  38. Gasparrini, A.; Guo, Y.; Hashizume, M.; Lavigne, E.; Zanobetti, A.; Schwartz, J.; Tobias, A.; Tong, S.; Rocklöv, J.; Forsberg, B.; et al. Mortality risk attributable to high and low ambient temperature: A multicountry observational study. Lancet 2015, 386, 369–375. [Google Scholar] [CrossRef]
  39. Thomé, V.M.R.; Zampieri, S.; Braga, H.J.; Pandolfo, C.; Silva Júnior, V.P.; Bacic, I.; Laus Neto, J.; Soldateli, D.; Gebler, E.; Ore, J.D.; et al. Zoneamento Agroecológico e Socioeconômico de Santa Catarina, 1st ed.; (CD-ROM) Epagri: Florianópolis, Brasil, 1999. [Google Scholar]
  40. Instituto Brasileiro de Geografia e Estatística—IBGE. Centro de Referência em Nomes Geográficos—Referência e Identidade. Available online: http://www.ngb.ibge.gov.br/?pagina=meso (accessed on 25 November 2016).
  41. Thornthwaite, C.W. An approach toward a rational classification of climate. Geogr. Rev. 1948, 38, 55–94. [Google Scholar] [CrossRef]
  42. Alvares, C.A.; Stape, J.L.; Sentelhas, P.C.; de Moraes, G.; Leonardo, J.; Sparovek, G. Köppen’s climate classification map for Brazil. Meteorol. Z. 2013, 22, 711–728. [Google Scholar]
  43. Landa, A.L.G. Olas de Frío en la Zona Central del Estado de Veracruz. Doctor’s Thesis, University of Veracruz, Revolucion, Mexico, 2012. [Google Scholar]
  44. Reboita, M.S.; Escobar, G.; Lopes, V.S. Climatologia sinótica de eventos de ondas de frio sobre a região sul de Minas Gerais. Rev. Bras. Climatol. 2015, 16, 72–92. [Google Scholar] [CrossRef]
  45. NOAA/CPC. Monitoring Weather & Climate. Monthly mean AAO index since January 1979. Available online: http://www.cpc.ncep.noaa.gov/products/precip/CWlink/daily_ao_index/aao/aao.shtml (accessed on 4 August 2016).
  46. Hammer, Ø.; Harper, D.A.T.; Ryan, P.D. Past: PAleontological STatistics software package for education and data analysis. Palaeontol. Electron. 2001, 4, 1–9. [Google Scholar]
  47. Grimm, A.M.; Togatlian, I.M. Relação Entre Eventos El Nino/La Nina e Frequência de Extremos Frios e Quentes de Temperatura no Cone Sul da América do Sul. In Anais do Congresso Brasileiro de Meteorologia; XII Congresso Brasileiro de Meteorologia, Foz do Iguaçu, Brasil, 2002; SBMET: Foz do Iguaçu, Brasil, 2002; pp. 1192–1197. [Google Scholar]
  48. Firpo, M.A.F.; Sansigolo, C.A.E.; Assis, S.V. Climatologia e variabilidade sazonal do número de ondas de calor e de frio no Rio Grande do Sul associadas ao ENOS. Rev. Bras. Meteor. 2012, 27, 95–106. [Google Scholar] [CrossRef]
  49. Fritzsons, E.; Mantovani, L.E.; Wrege, M.S. Relationship between altitude and temperature: A contribution to climatic zonning for the state of Santa Catarina, Brazil. Rev. Bras. Climatol. 2016, 18, 80–92. [Google Scholar]
Figure 1. Location map of the state of Santa Catarina, Brazil. *Geocentric Reference System for the Americas (SIRGAS); *Brazilian Institute of Geography and Statistics (IBGE).
Climate 05 00017 g001
Figure 2. Hypsometric map of the state of Santa Catarina showing the locations of the weather stations and their agroecological zones. *World Geodetic System (WGS).
Climate 05 00017 g002
Figure 3. Number of occurrences of cold waves in winter in SC between 1983 and 2013. Note: (*) Stations with smaller data sets.
Climate 05 00017 g003
Figure 4. Percentage of occurrence of cold waves per weather station in the AAO phases in SC in the winter period from 1983 to 2013.
Climate 05 00017 g004
Figure 5. Percentage of occurrence of frosts during the cold waves per winter season in the AAO phases in SC in the winter period from 1983 to 2013.
Climate 05 00017 g005
Table 1. Monthly Antarctic Oscillation (AAO) Index1 from 1983 to 2013—gray highlights represent winter months in the Southern Hemisphere.
YEARJanuaryFebruaryMarchAprilMayJuneJulyAugustSeptemberOctoberNovemberDecember
1983−1.340−1.0810.1660.149−0.437−0.2631.1140.792−0.6961.1930.7270.475
1984−1.098−0.5440.251−0.204−1.2370.4260.890−0.5480.327−0.009−0.024−1.476
1985−0.7950.215−0.1340.031−0.066−0.3311.9140.5951.5070.4711.0851.240
19860.158−1.588−0.770−0.087−1.847−0.6190.089−0.1570.8490.306−0.2220.886
1987−0.950−0.708−0.133−0.2860.039−0.702−1.5311.485−0.7990.4551.0600.272
1988−0.6120.551−0.219−0.077−0.749−1.0550.576−0.745−0.689−2.3140.4011.074
19890.6180.8490.632−0.5732.6911.9951.458−0.132−0.1210.1360.572−0.445
1990−0.3521.1510.414−1.879−1.8030.093−1.2150.4661.4820.139−0.359−0.312
19910.869−0.8520.522−0.639−0.539−1.155−1.2200.036−0.513−0.623−0.804−2.067
19920.073−1.627−1.010−0.439−2.032−2.193−0.566−0.3500.435−0.3190.1220.244
1993−2.0210.437−0.3780.0871.2601.2181.9571.0831.0610.7480.3241.028
19940.7231.1570.693−0.052−0.153−1.682−0.4921.910−0.947−0.578−0.7930.933
19951.4480.533−0.1540.6491.397−0.802−3.010−0.6961.173−0.0570.1431.470
19960.332−0.5250.5430.1150.983−0.2520.021−1.502−1.3140.966−1.667−0.023
19970.369−0.2440.701−0.4581.028−0.4580.7800.7680.122−0.595−1.905−0.835
19980.4130.3900.7361.927−0.0381.0311.4500.904−0.1220.4000.8171.435
19990.9990.4560.1800.9491.639−1.3250.3160.042−0.0121.6530.9011.784
20001.2730.6200.1330.2331.1270.1170.059−0.674−1.8530.347−1.537−1.290
2001−0.471−0.265−0.5550.515−0.2620.386−0.9280.9101.1611.2770.9961.474
20020.7471.334−1.8230.165−2.798−1.112−0.591−0.099−0.864−2.564−0.9241.308
2003−0.988−0.357−0.1880.2240.385−0.7750.7270.678−0.323−0.025−0.712−1.323
20040.807−1.1820.4320.1510.4601.1951.474−0.0710.254−0.042−0.242−0.973
2005−0.1291.2430.1580.355−0.297−1.428−0.2520.2280.2410.031−0.551−1.968
20060.339−0.2110.501−0.1691.6950.4380.926−1.727−0.3240.8790.1010.638
2007−0.0830.075−0.570−1.035−0.612−1.198−2.631−0.1080.031−0.434−0.9841.929
20081.2081.1470.587−0.873−0.4901.3480.3200.0871.3861.2150.9201.194
20090.9630.4560.6050.029−0.733−0.470−1.234−0.686−0.0170.085−1.9150.607
2010−0.757−0.7750.1080.3771.0212.0712.4241.5100.4021.3351.5160.205
20110.0521.074−0.296−0.8701.266−0.099−1.384−1.202−1.2500.388−0.9082.573
20121.583−0.2830.2750.6660.153−0.1971.2590.4890.562−0.444−1.701−0.764
20130.0710.7161.3750.6110.360−0.2710.945−1.561−1.658−0.4580.1890.061
1 Source (data provided by): [45].
Table 2. Average values1 of the total cold waves in the AAO phases in SC in the winter period from 1983 to 2013.
Phase of the AAOWeather Stations/Agroecological Zones
ItajaíSão JoséChapecóCaçadorCampos NovosSão JoaquimItuporangaLagesUrussangaMajor VieiraItapiranga
Positive1.88a1.64a2.76a2.35a2.06a2.43a1.73a1.94a1.70a2.07a1.57a
Negative1.85a1.71a3.28a2.57a2.85a2.14a2.14a2.21a1.78a1.75a2.00a
1 Averages followed by the same letter in the columns do not differ among themselves by the Student’s t-test at the 5% significance level.
Table 3. Results of the variances1 for the total cold waves in the AAO phases in SC in the winter period from 1983 to 2013.
Phase of the AAOWeather Stations/Agroecological Zones
ItajaíSão JoséChapecóCaçadorCampos NovosSão JoaquimItuporangaLagesUrussangaMajor VieiraItapiranga
Positive2.11a2.86a1.44a1.99a2.20a2.12a1.92a1.05a2.09a3.30a1.80a
Negative2.13a1.14a2.52a2.10a1.51a2.13a1.82a2.02a1.10a2.20a1.16a
1 Variances followed by the same letters in the columns do not differ among themselves by the F-test at the 5% significance level.
Table 4. Average values1 of frost occurrences during cold waves in the AAO phases in SC in the winter period from 1983 to 2013.
Phase of the AAOWeather Stations/Agroecological Zones
ItajaíSão JoséChapecóCaçadorCampos NovosSão JoaquimItuporangaLagesUrussangaMajor VieiraItapiranga
Positive0.82a0.52a2.94a3.70a3.66a4.93a1.80a3.58a2.41a4.28a1.28a
Negative0.42a0.64a3.21a4.28a3.28a3.21a3.00a3.35a2.50a3.83a1.15a
1 Averages followed by the same letter in the columns do not differ among themselves by the Student’s t-test at the 5% significance level.
Table 5. Results of the variances1 for frost occurrences during cold waves in the AAO phases in SC in the winter period from 1983 to 2013
Phase of the AAOWeather Stations/Agroecological Zones
ItajaíSão JoséChapecóCaçadorCampos NovosSão JoaquimItuporangaLagesUrussangaMajor VieiraItapiranga
Positive3.90a2.88a3.05a5.72a9.23a13.26a2.88a5.38a9.00a15.29a2.98a
Negative1.18b0.55b5.71a9.14a5.91a7.25a5.69a5.78a4.57a11.24a1.97a
1 Variances followed by the same letters in the columns do not differ among themselves by the F-test at the 5% significance level.

