
Climate Change Impact and Adaptation Practices in Agriculture: A Case Study of Rautahat District, Nepal


Abstract
:1. Introduction
2. Materials and Methods
2.1. General Approach
2.2. Primary Data
2.2.1. Household Survey
2.2.2. Interview Technique
2.2.3. Key Informant Interviews (KII)
2.2.4. Soil Moisture Estimation Using Remote Sensing Technology
2.3. Secondary Data
2.3.1. Meteorological Data and Analysis
2.3.2. Yield of Major Crops
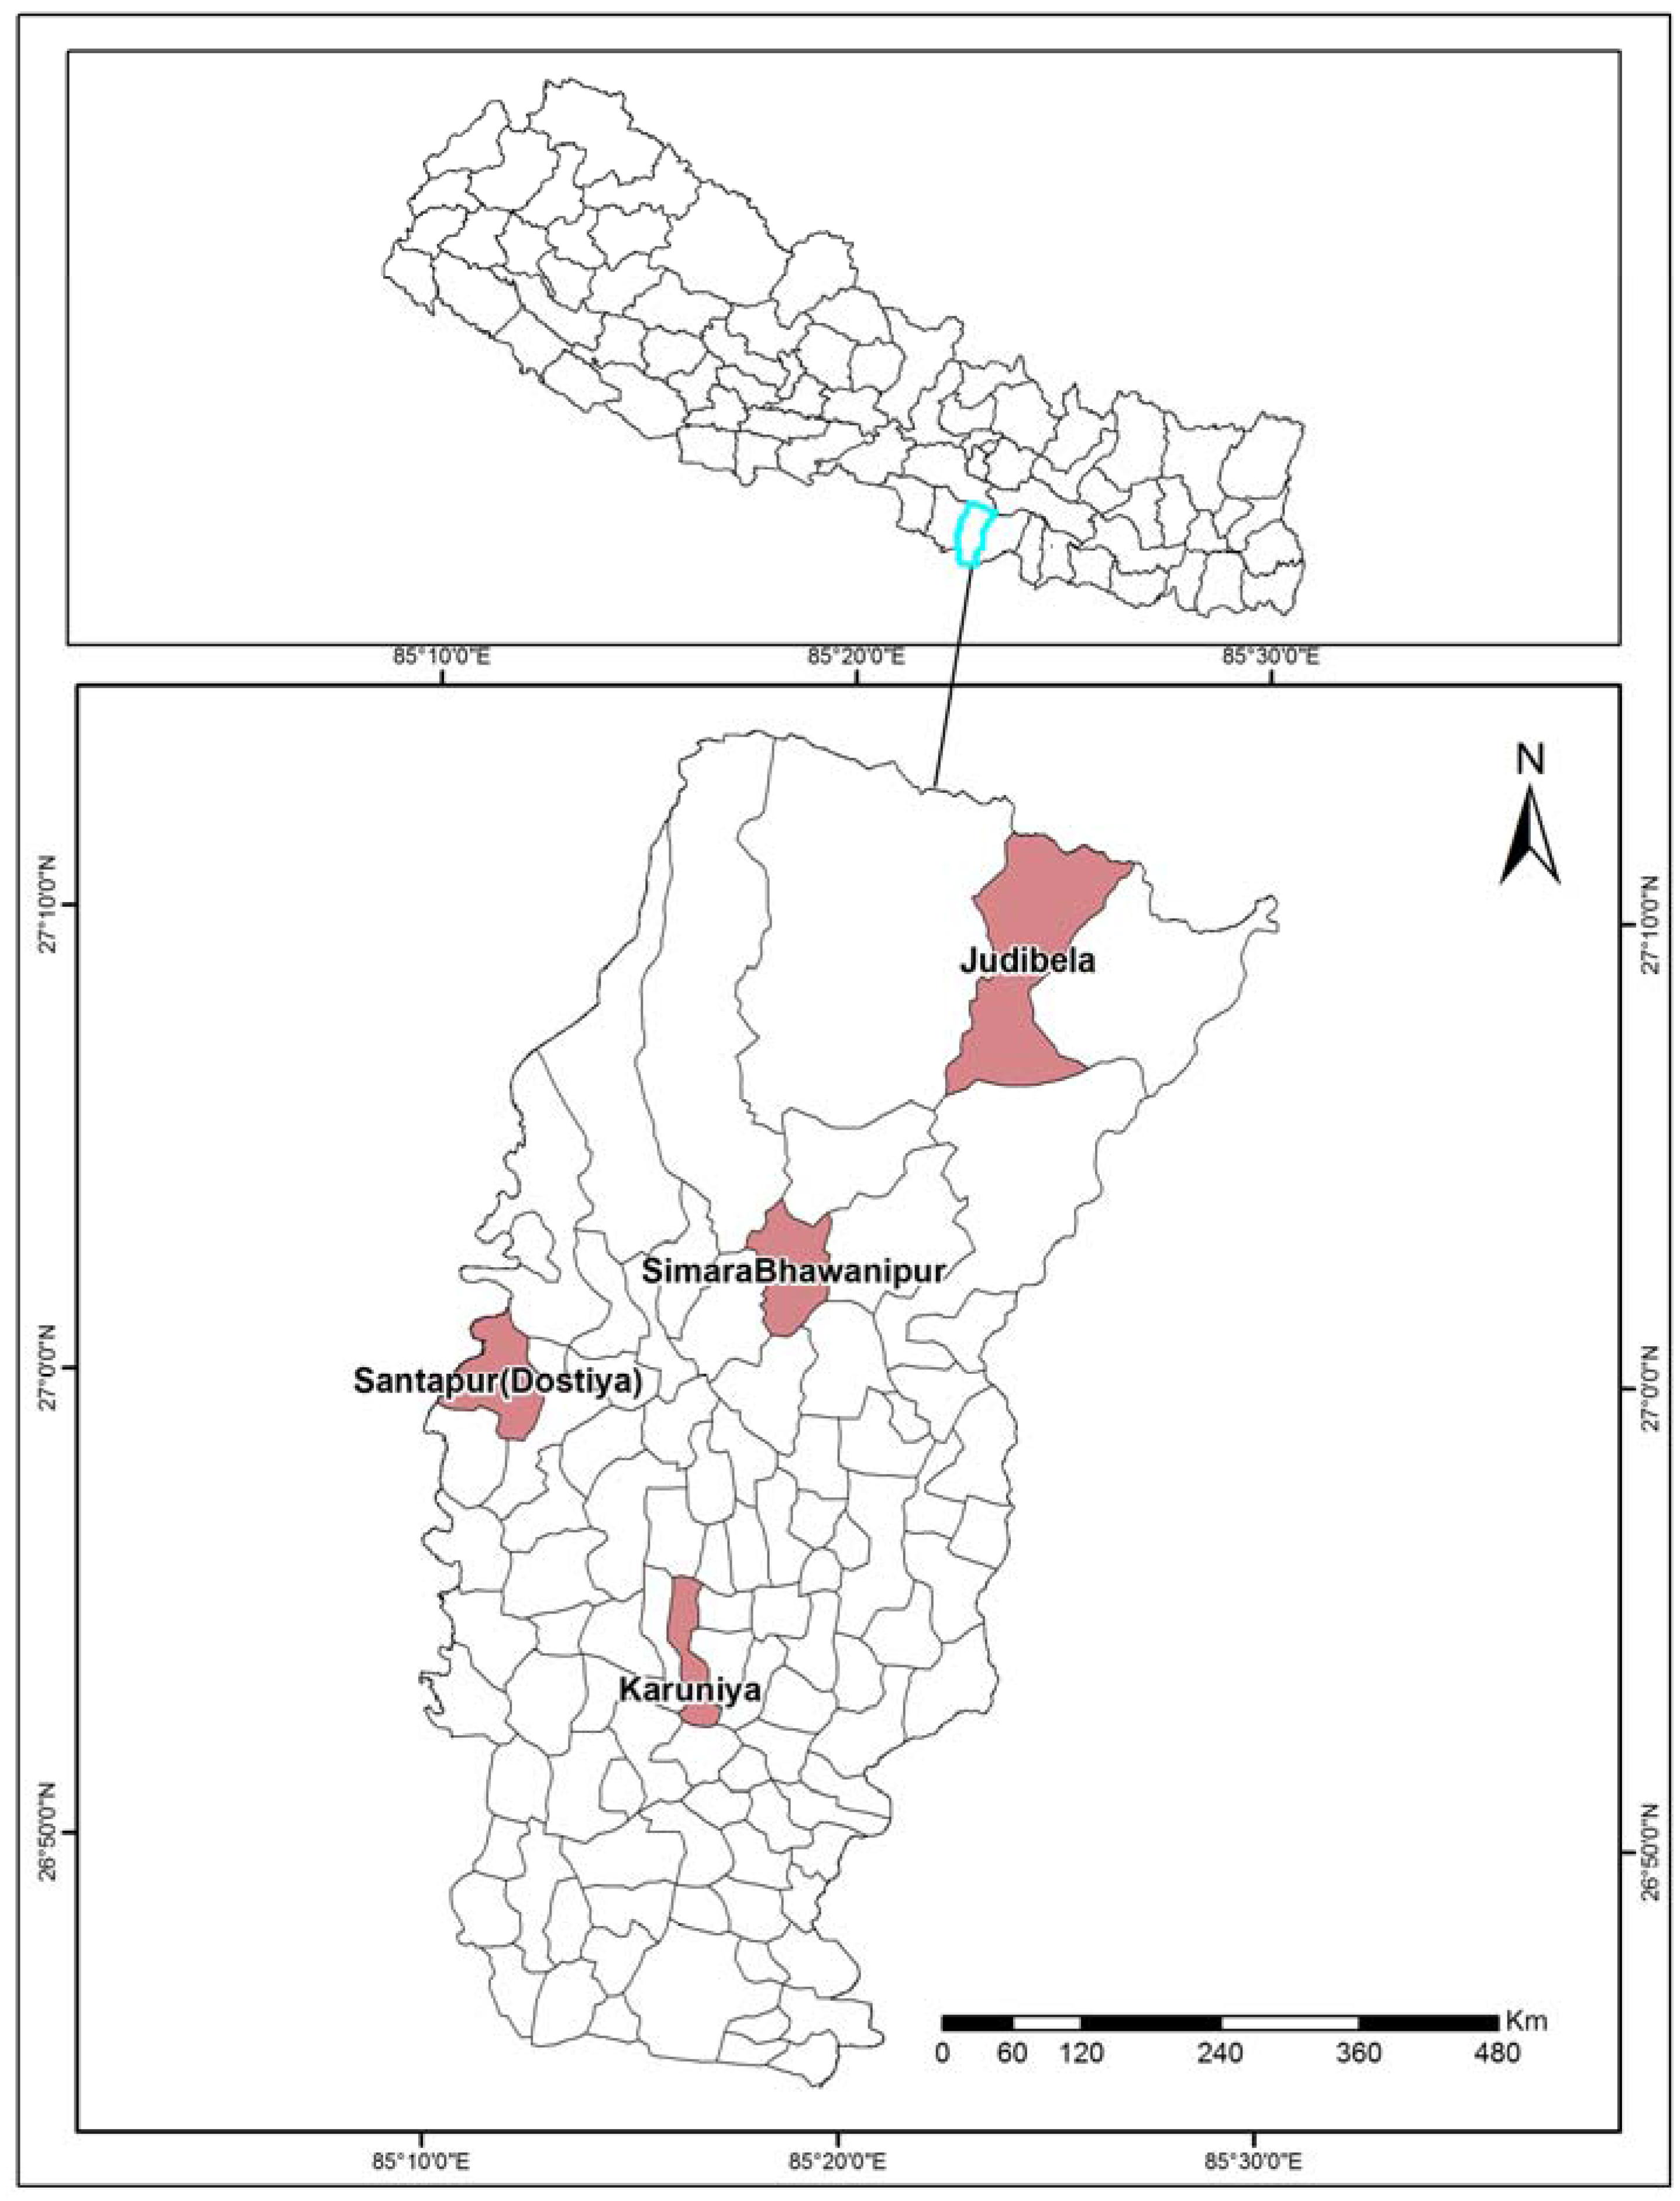
2.4. Study Area
3. Results
3.1. Climate Change Indicators
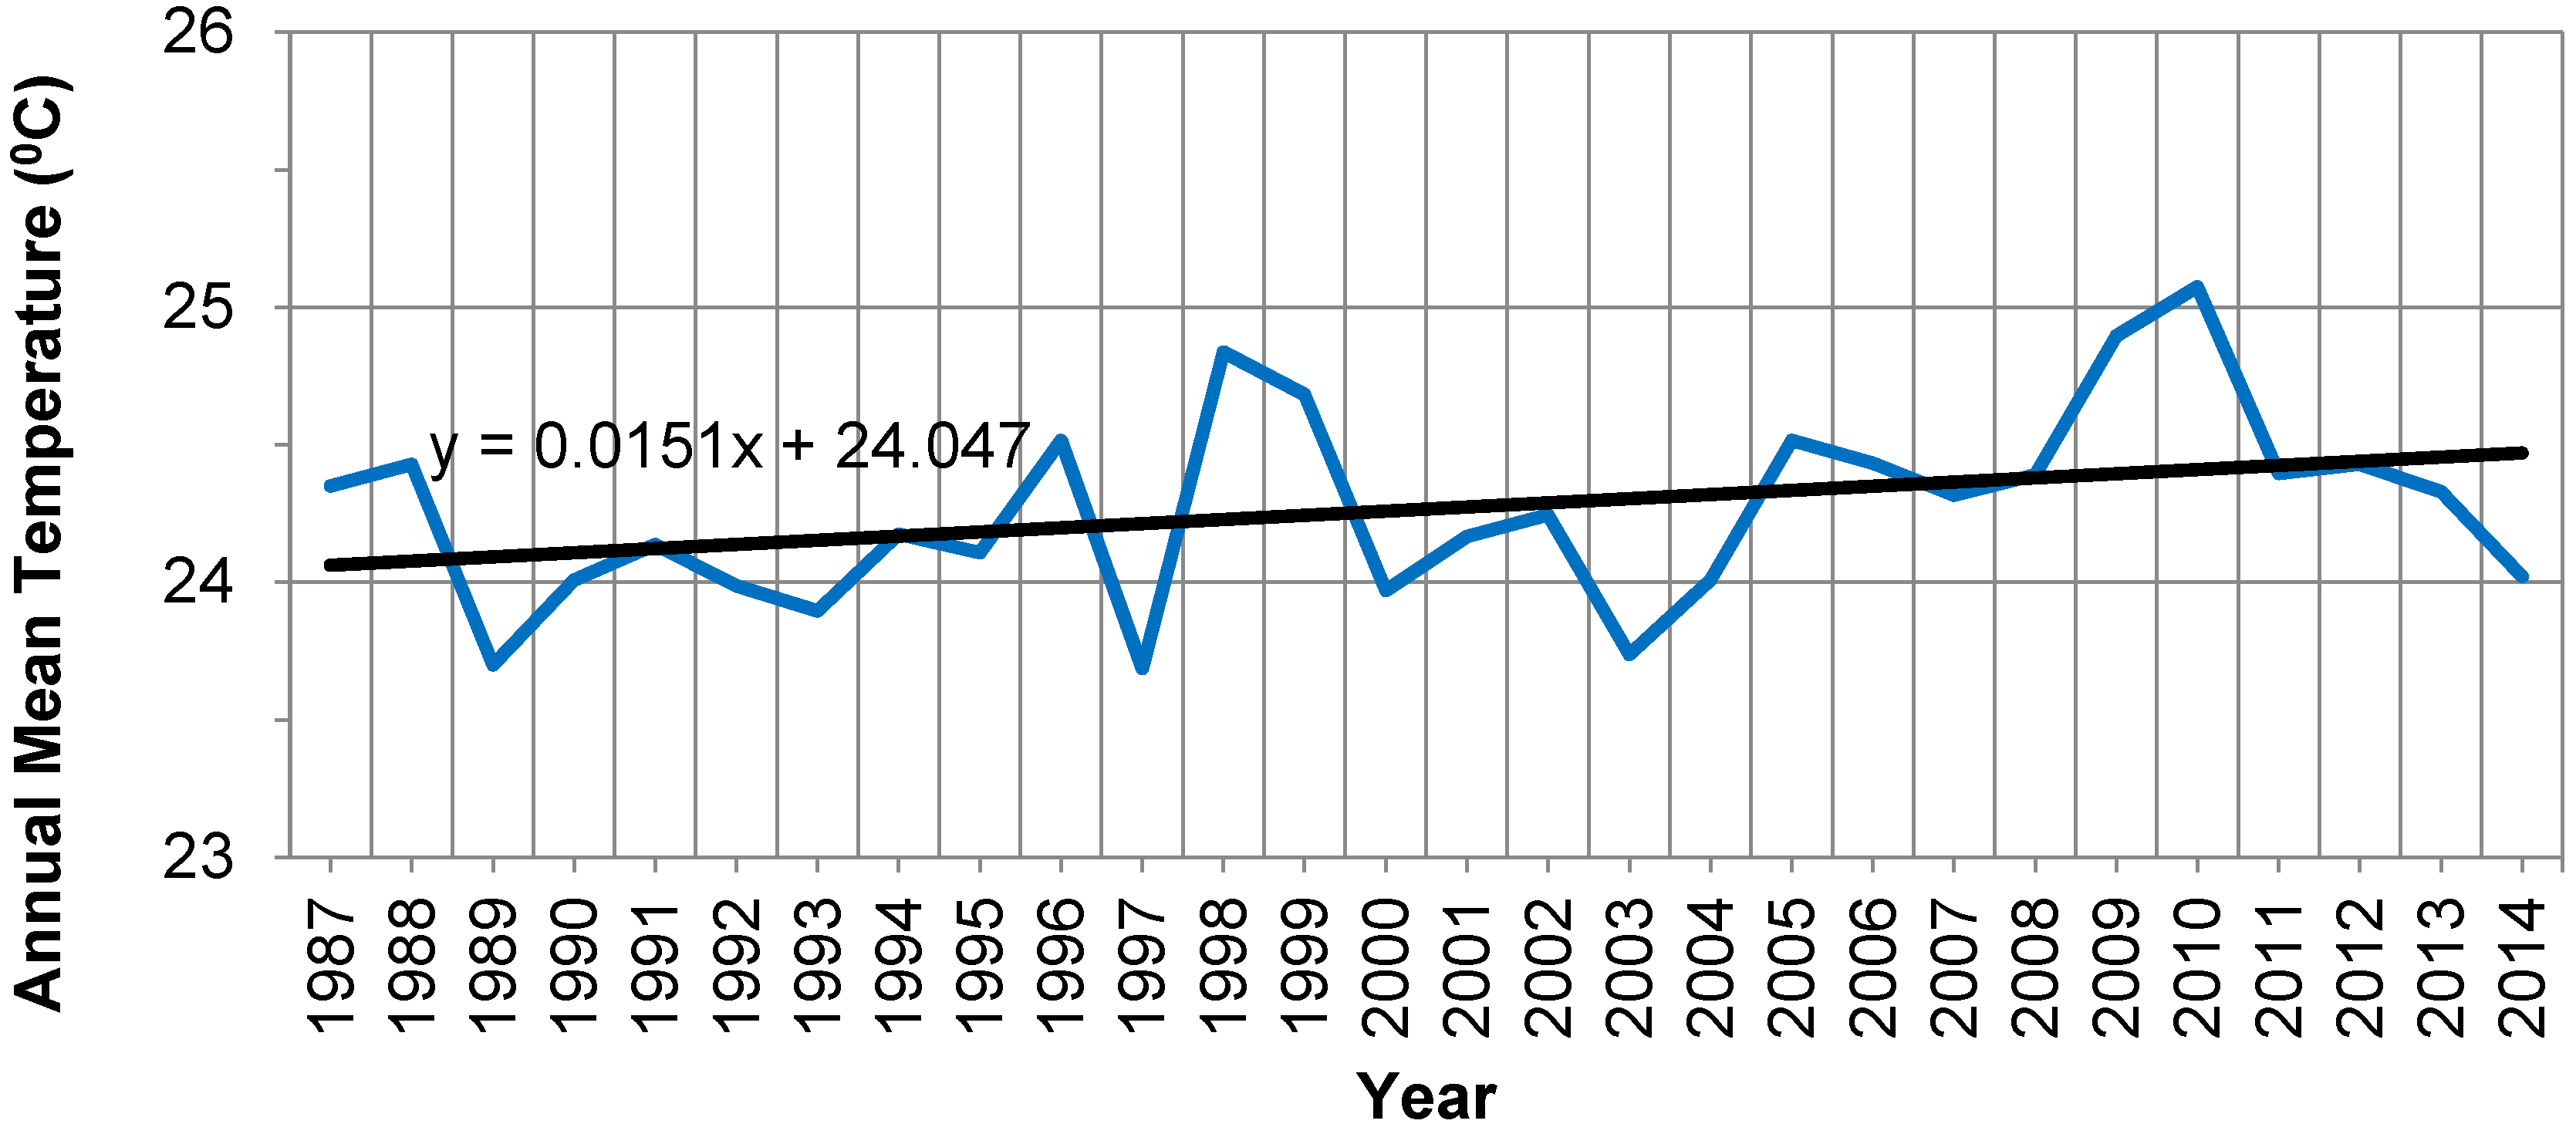
3.1.1. Temperature
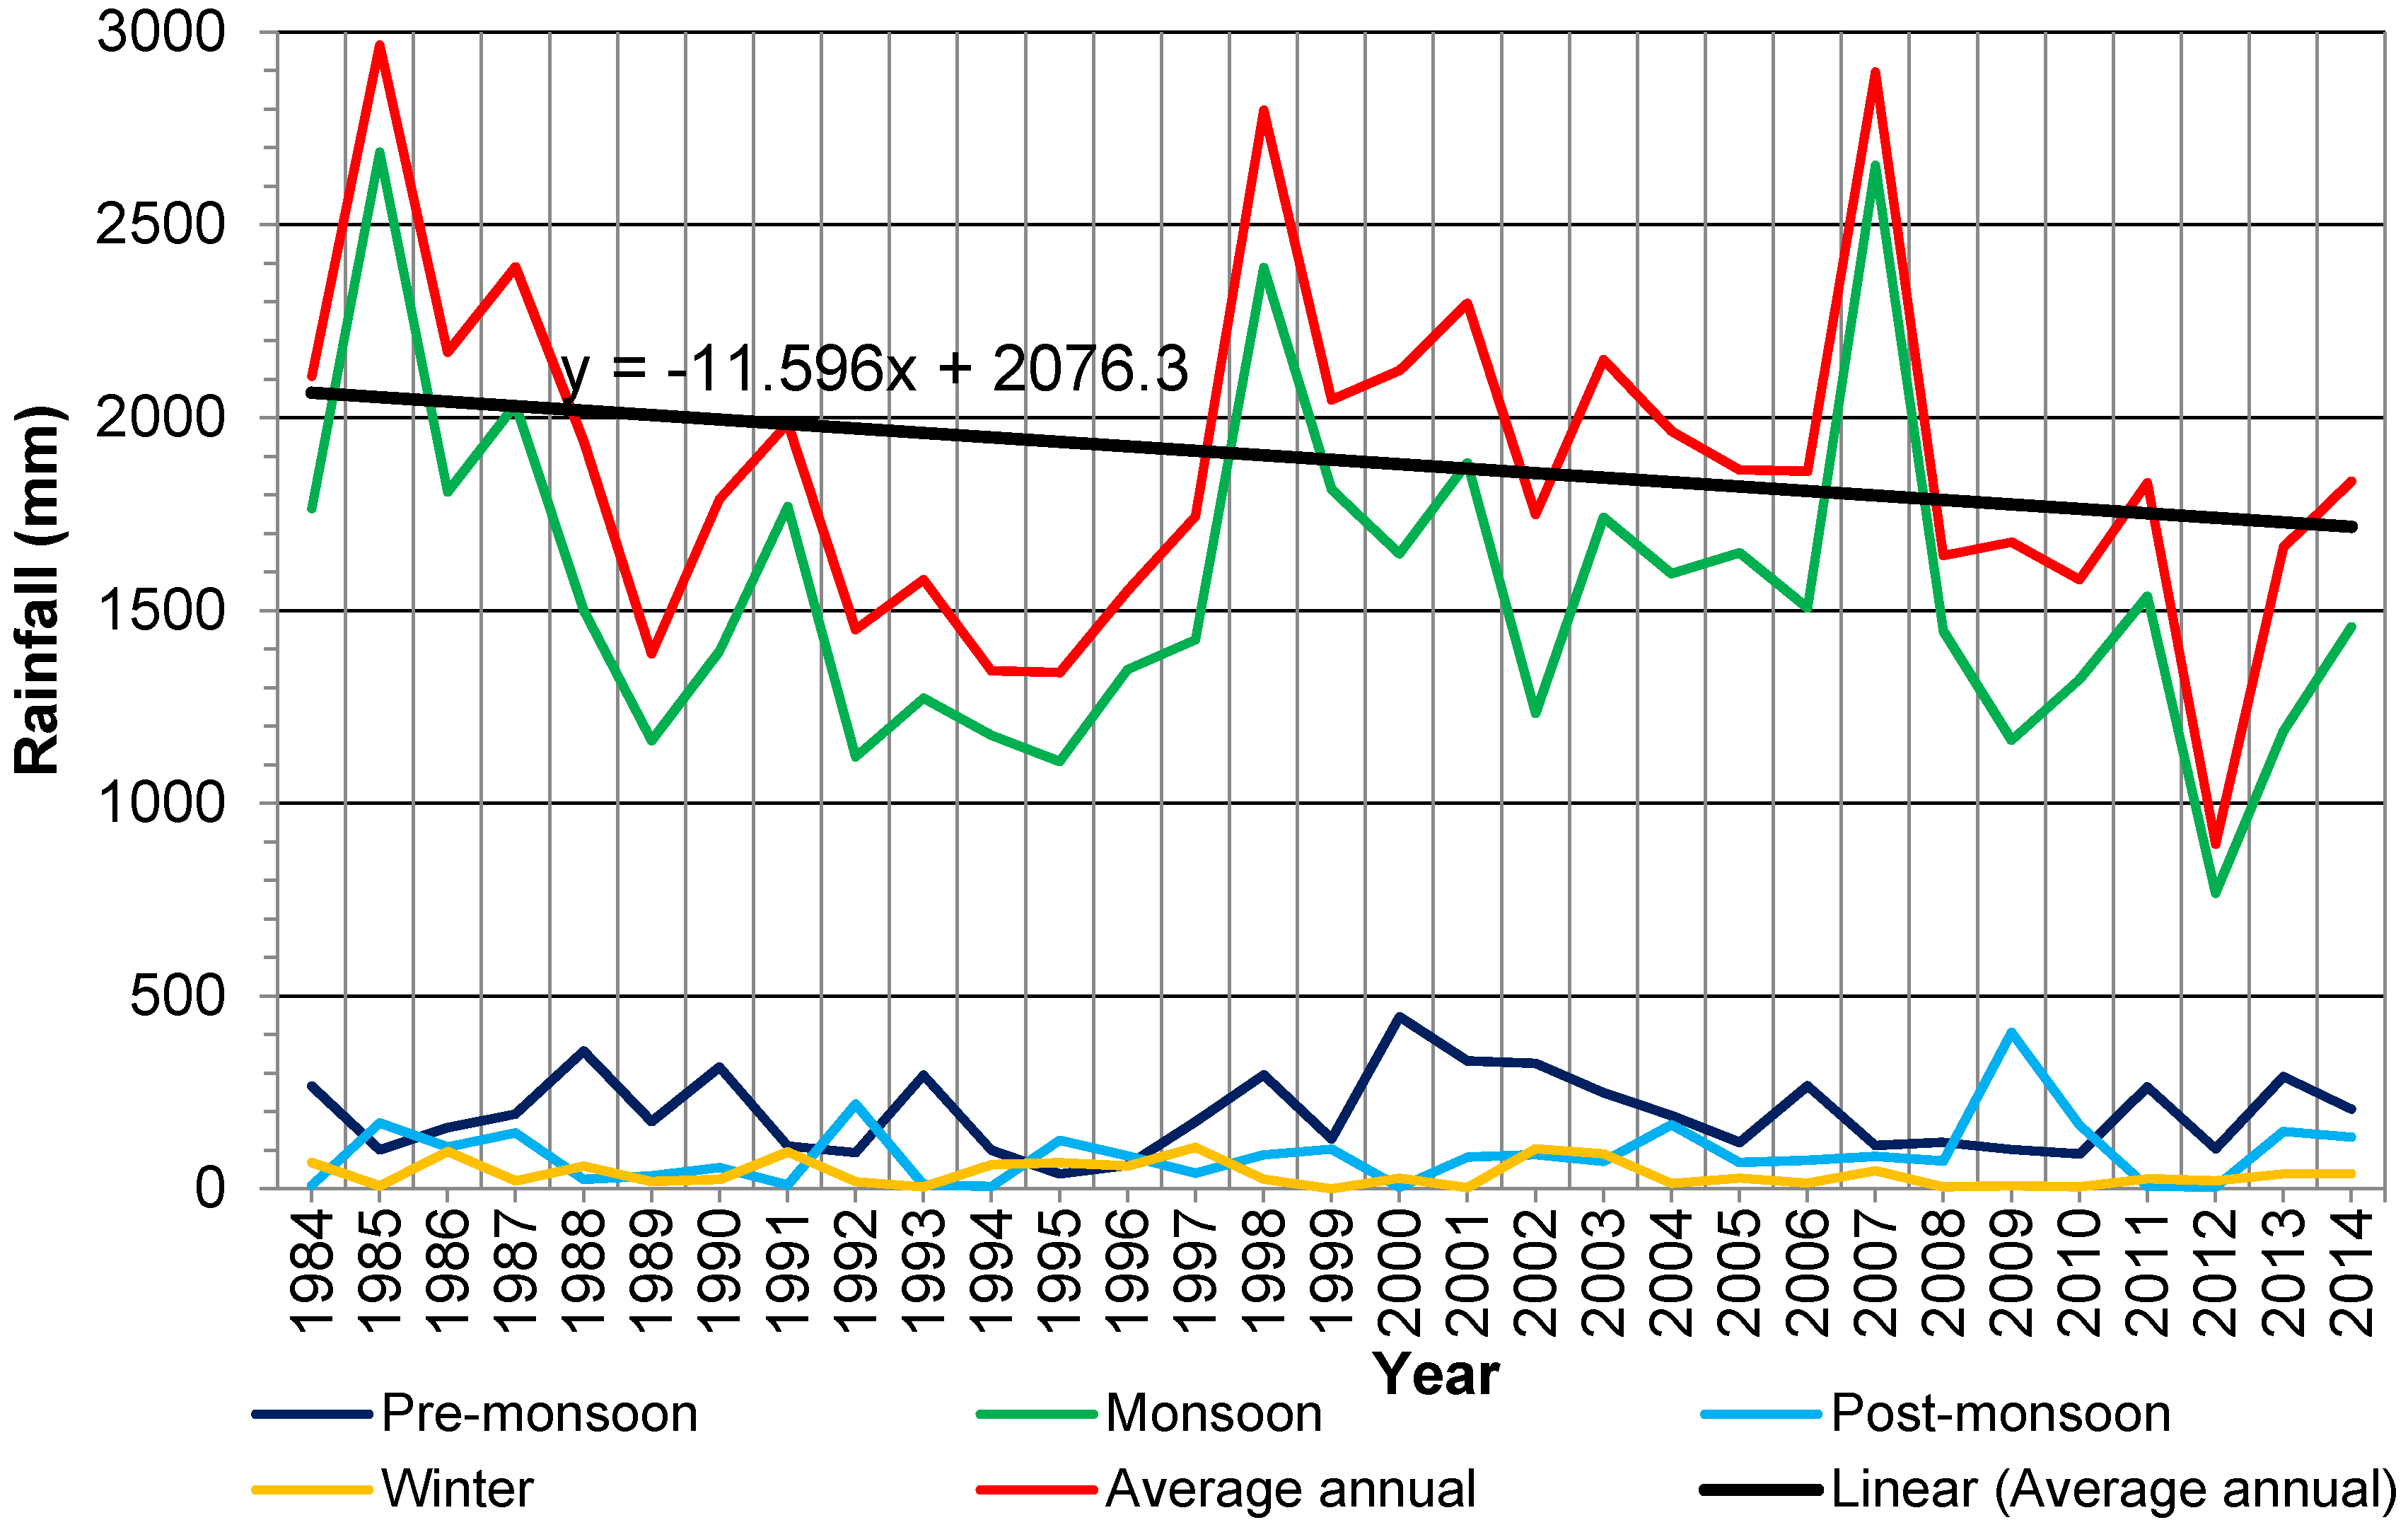
3.1.2. Rainfall
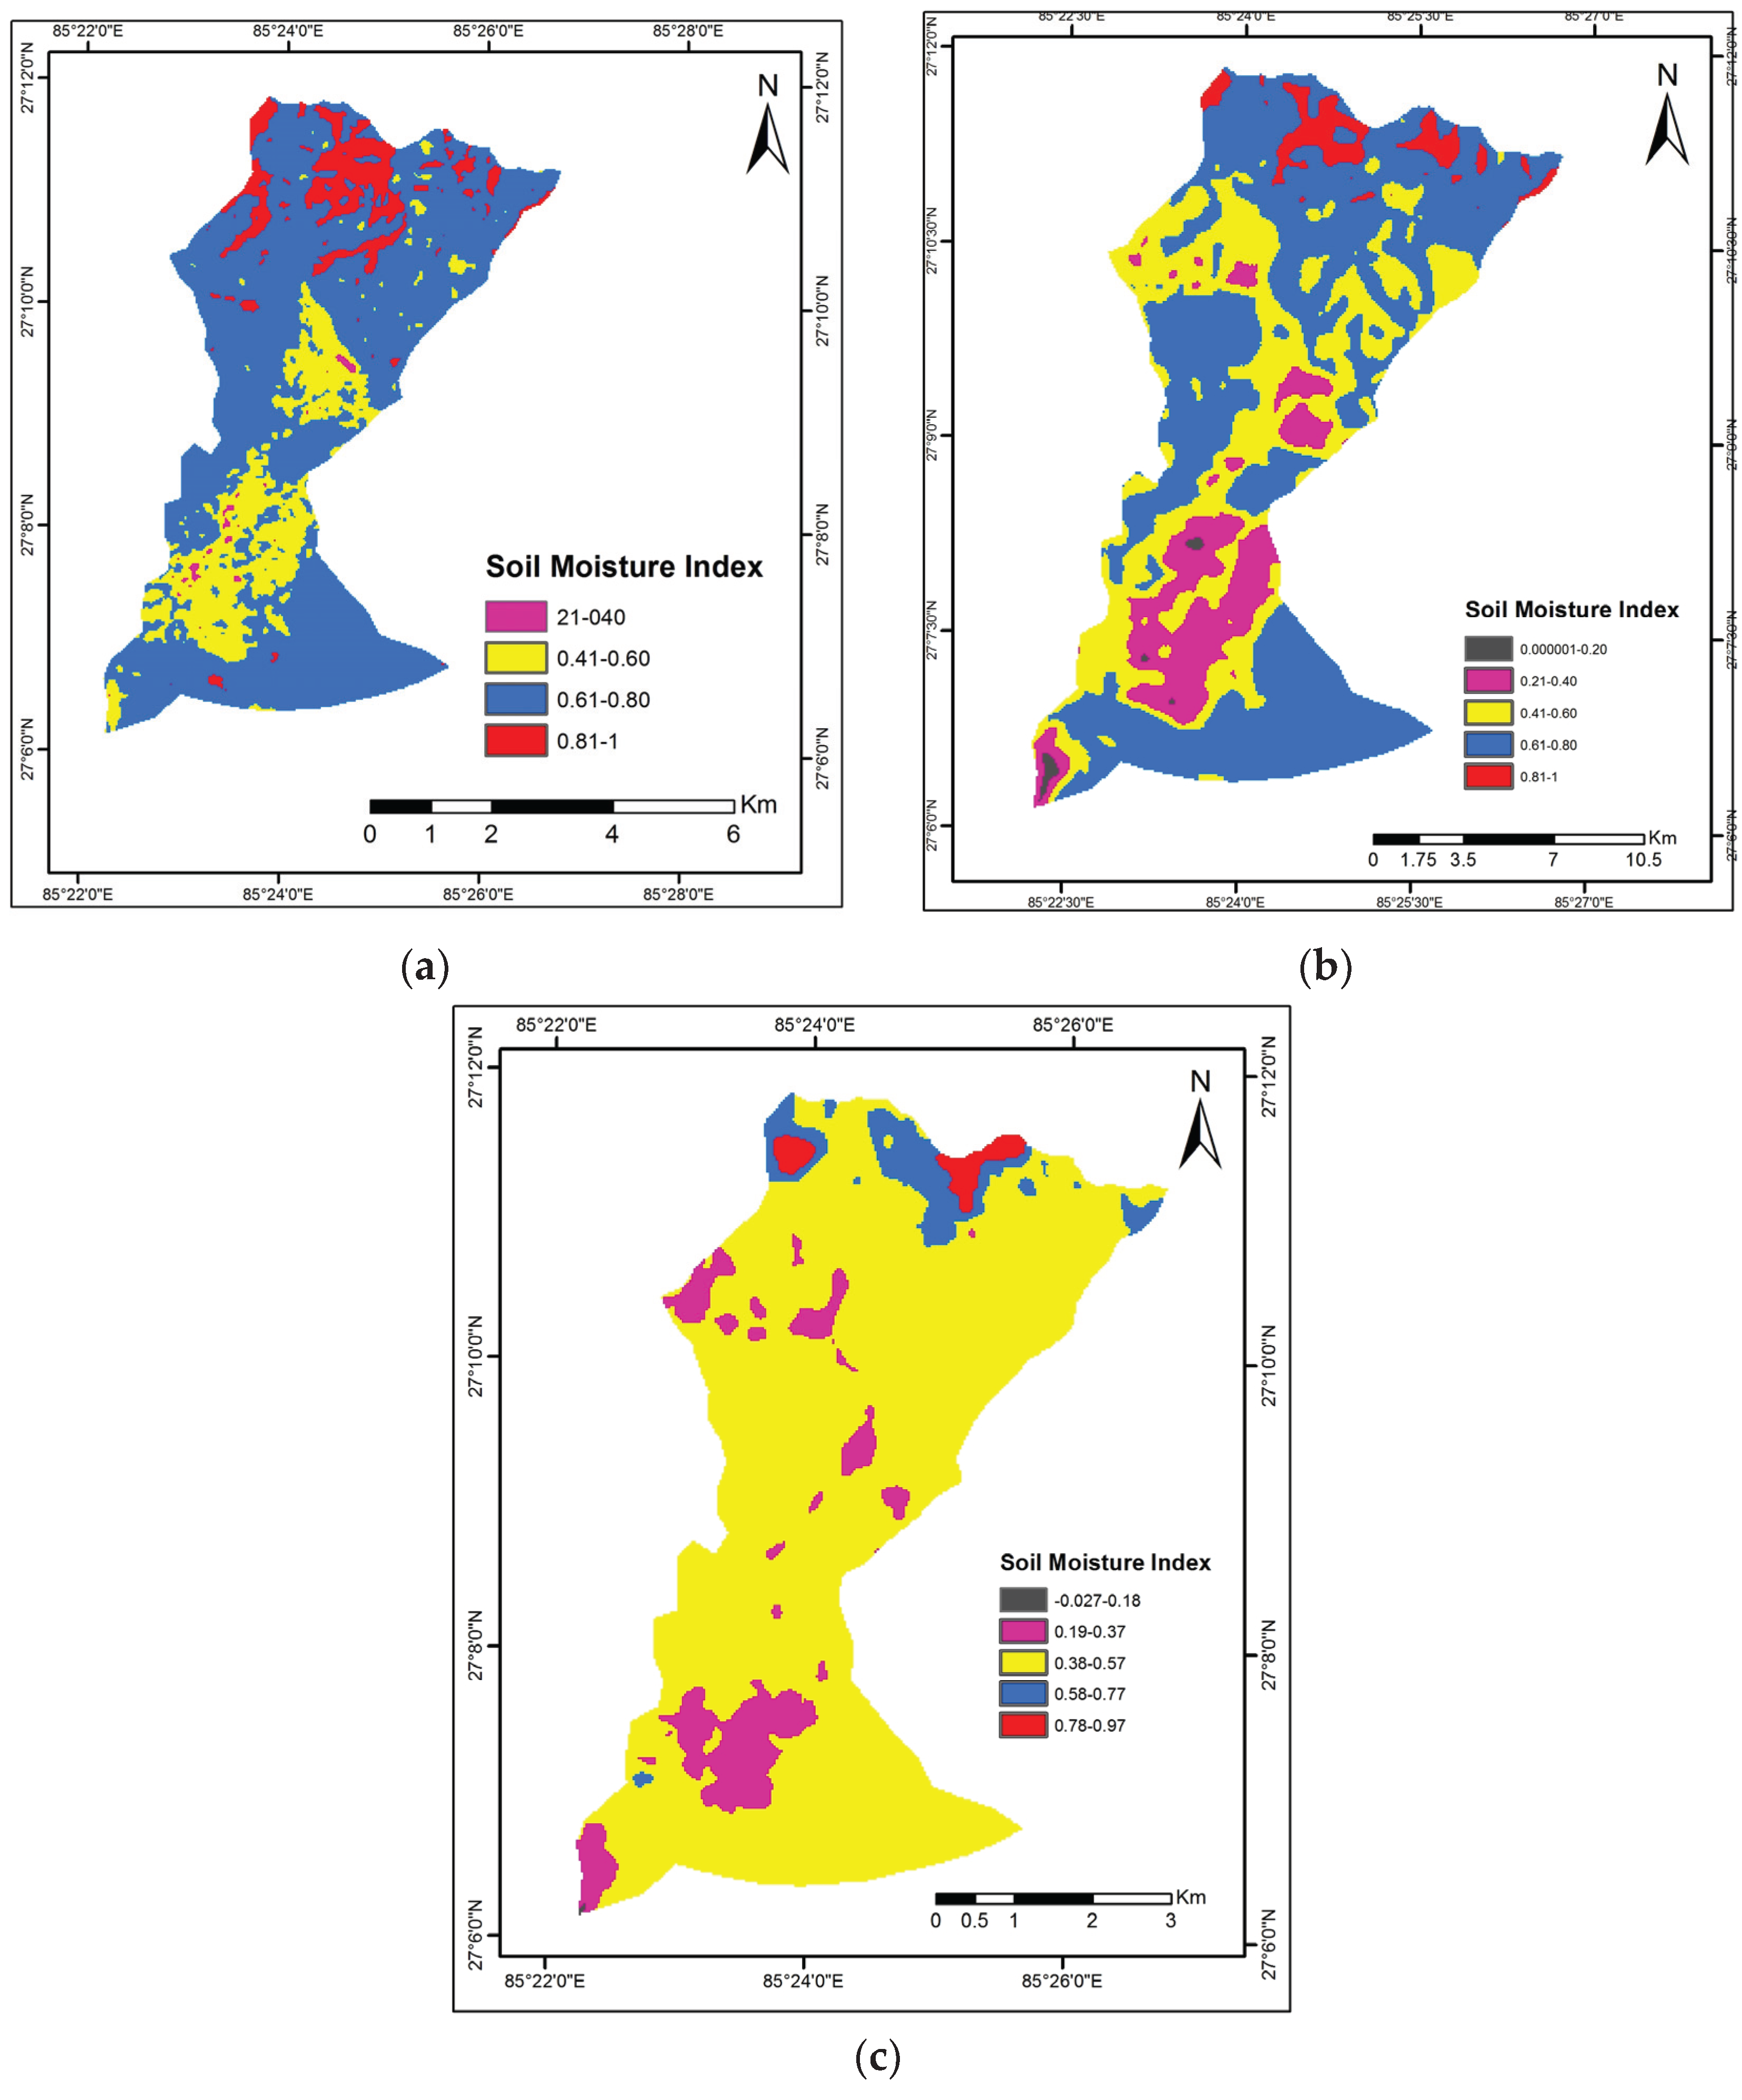
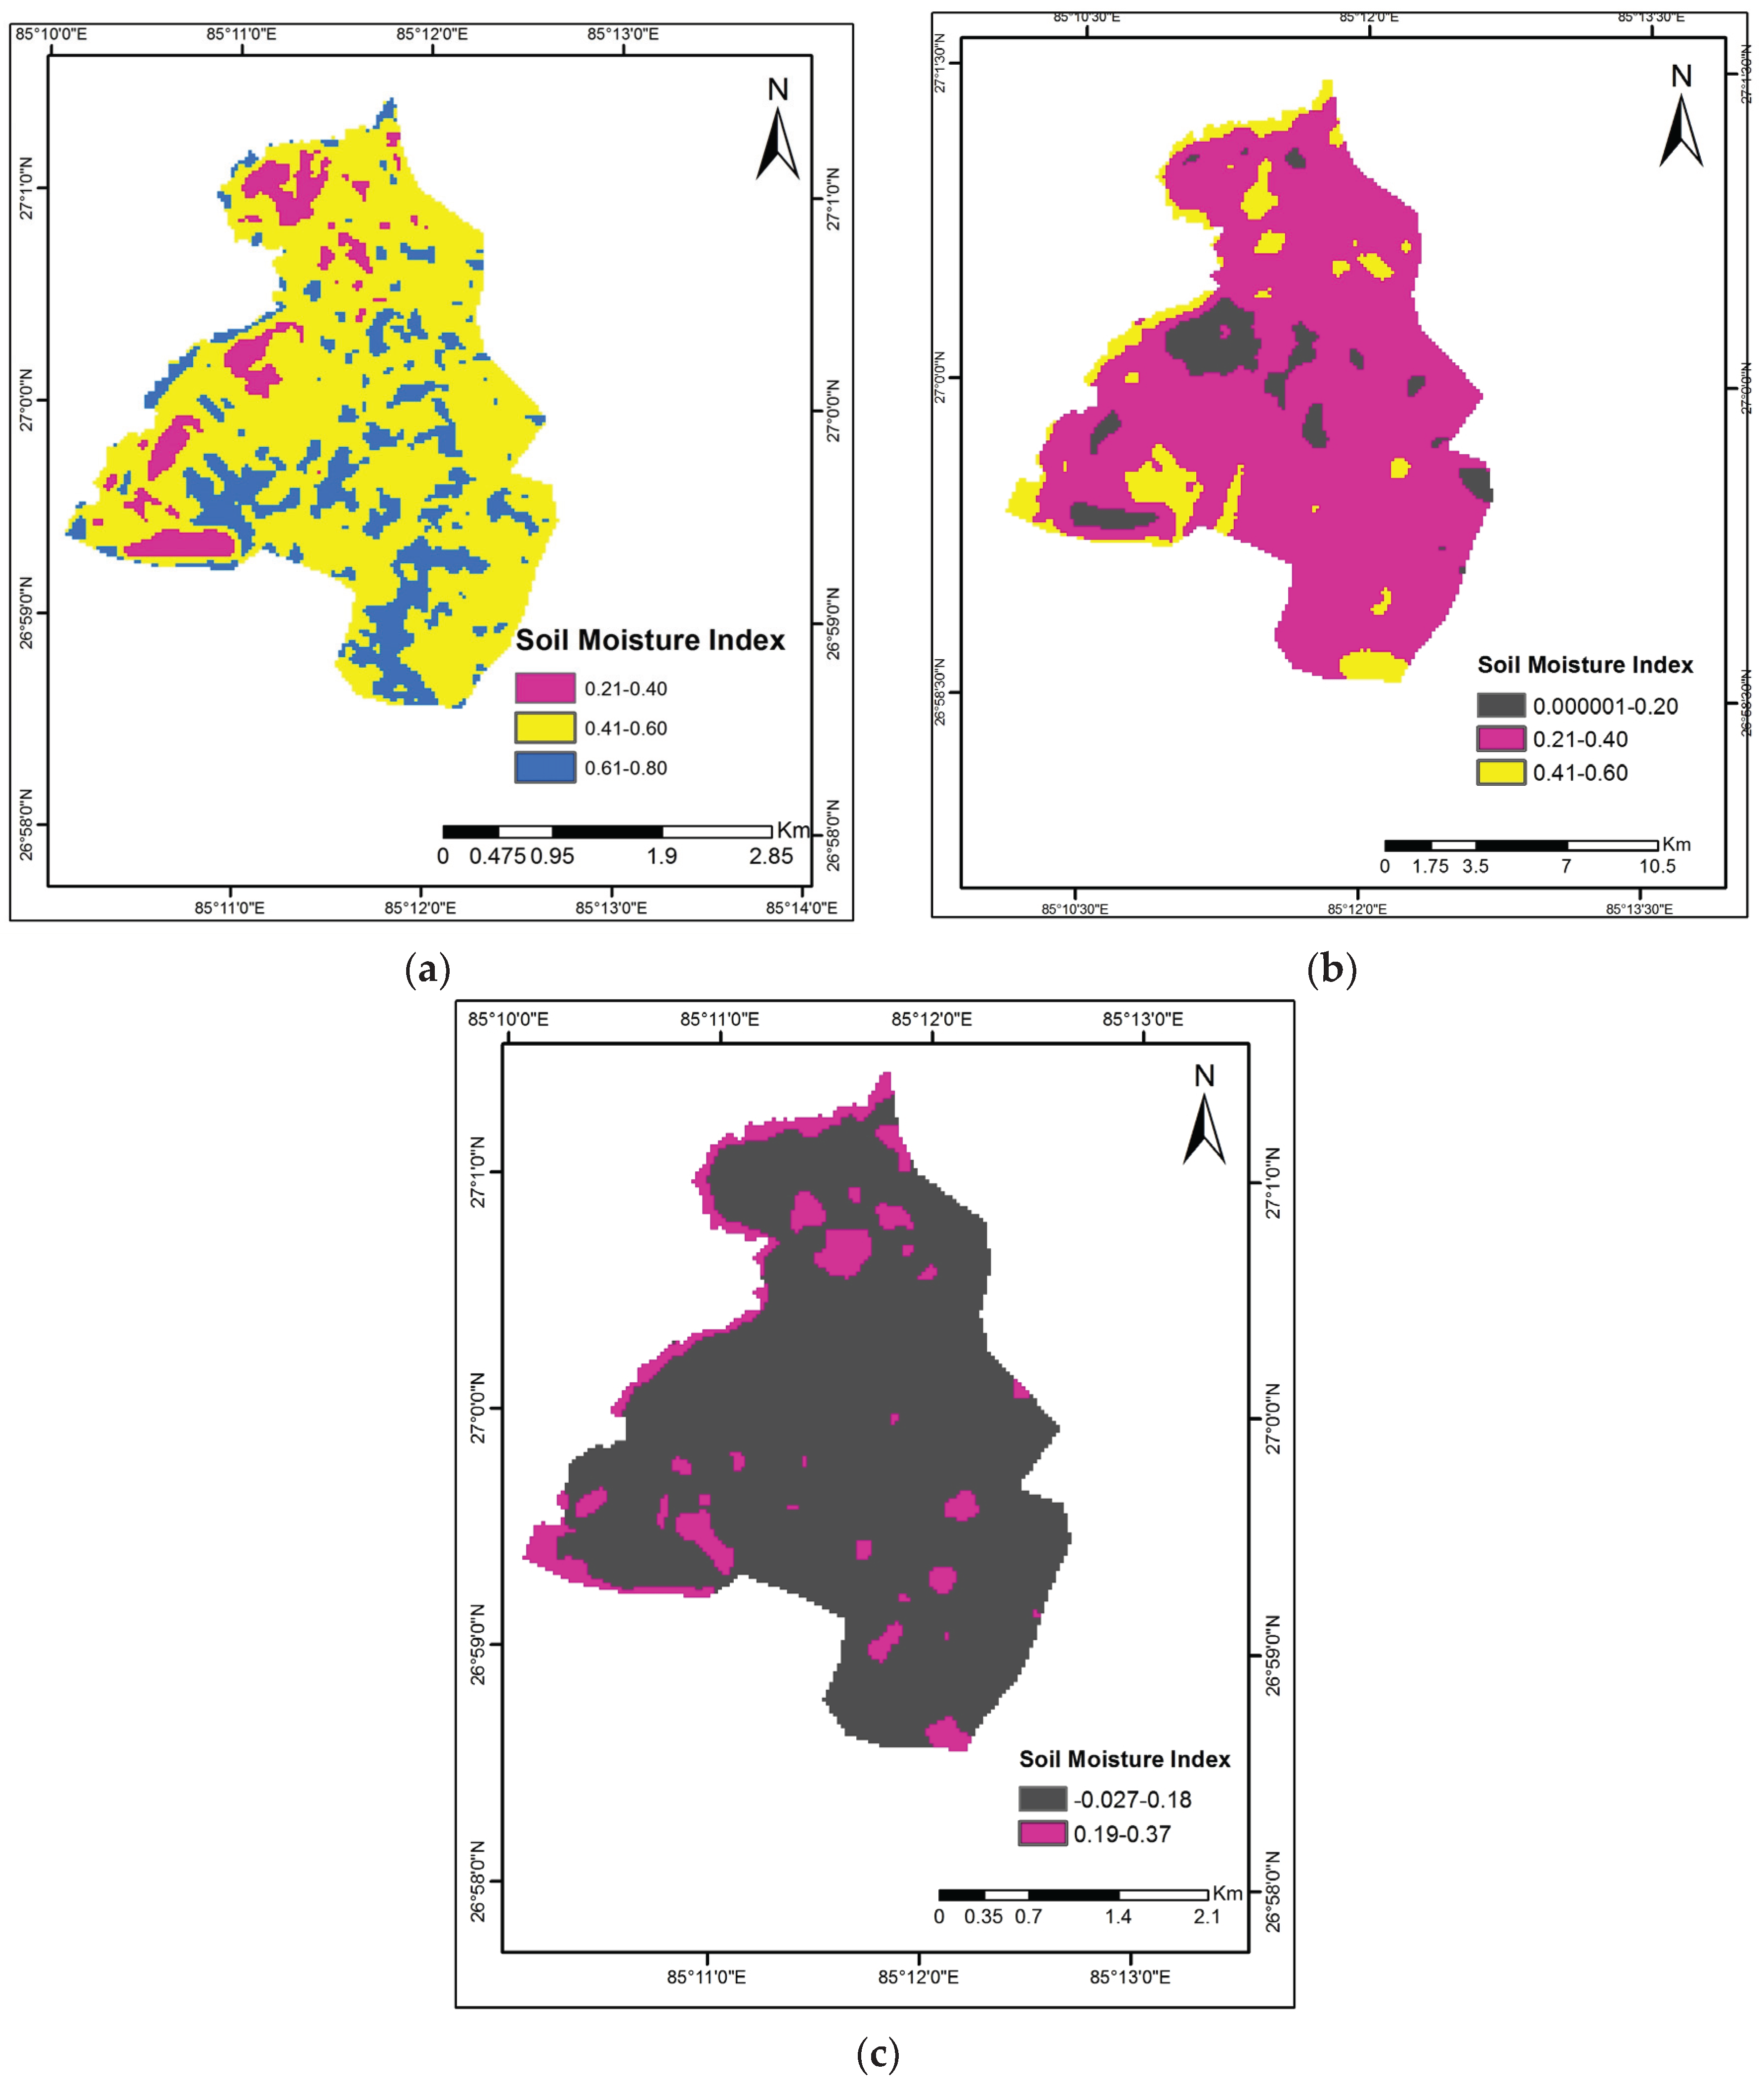
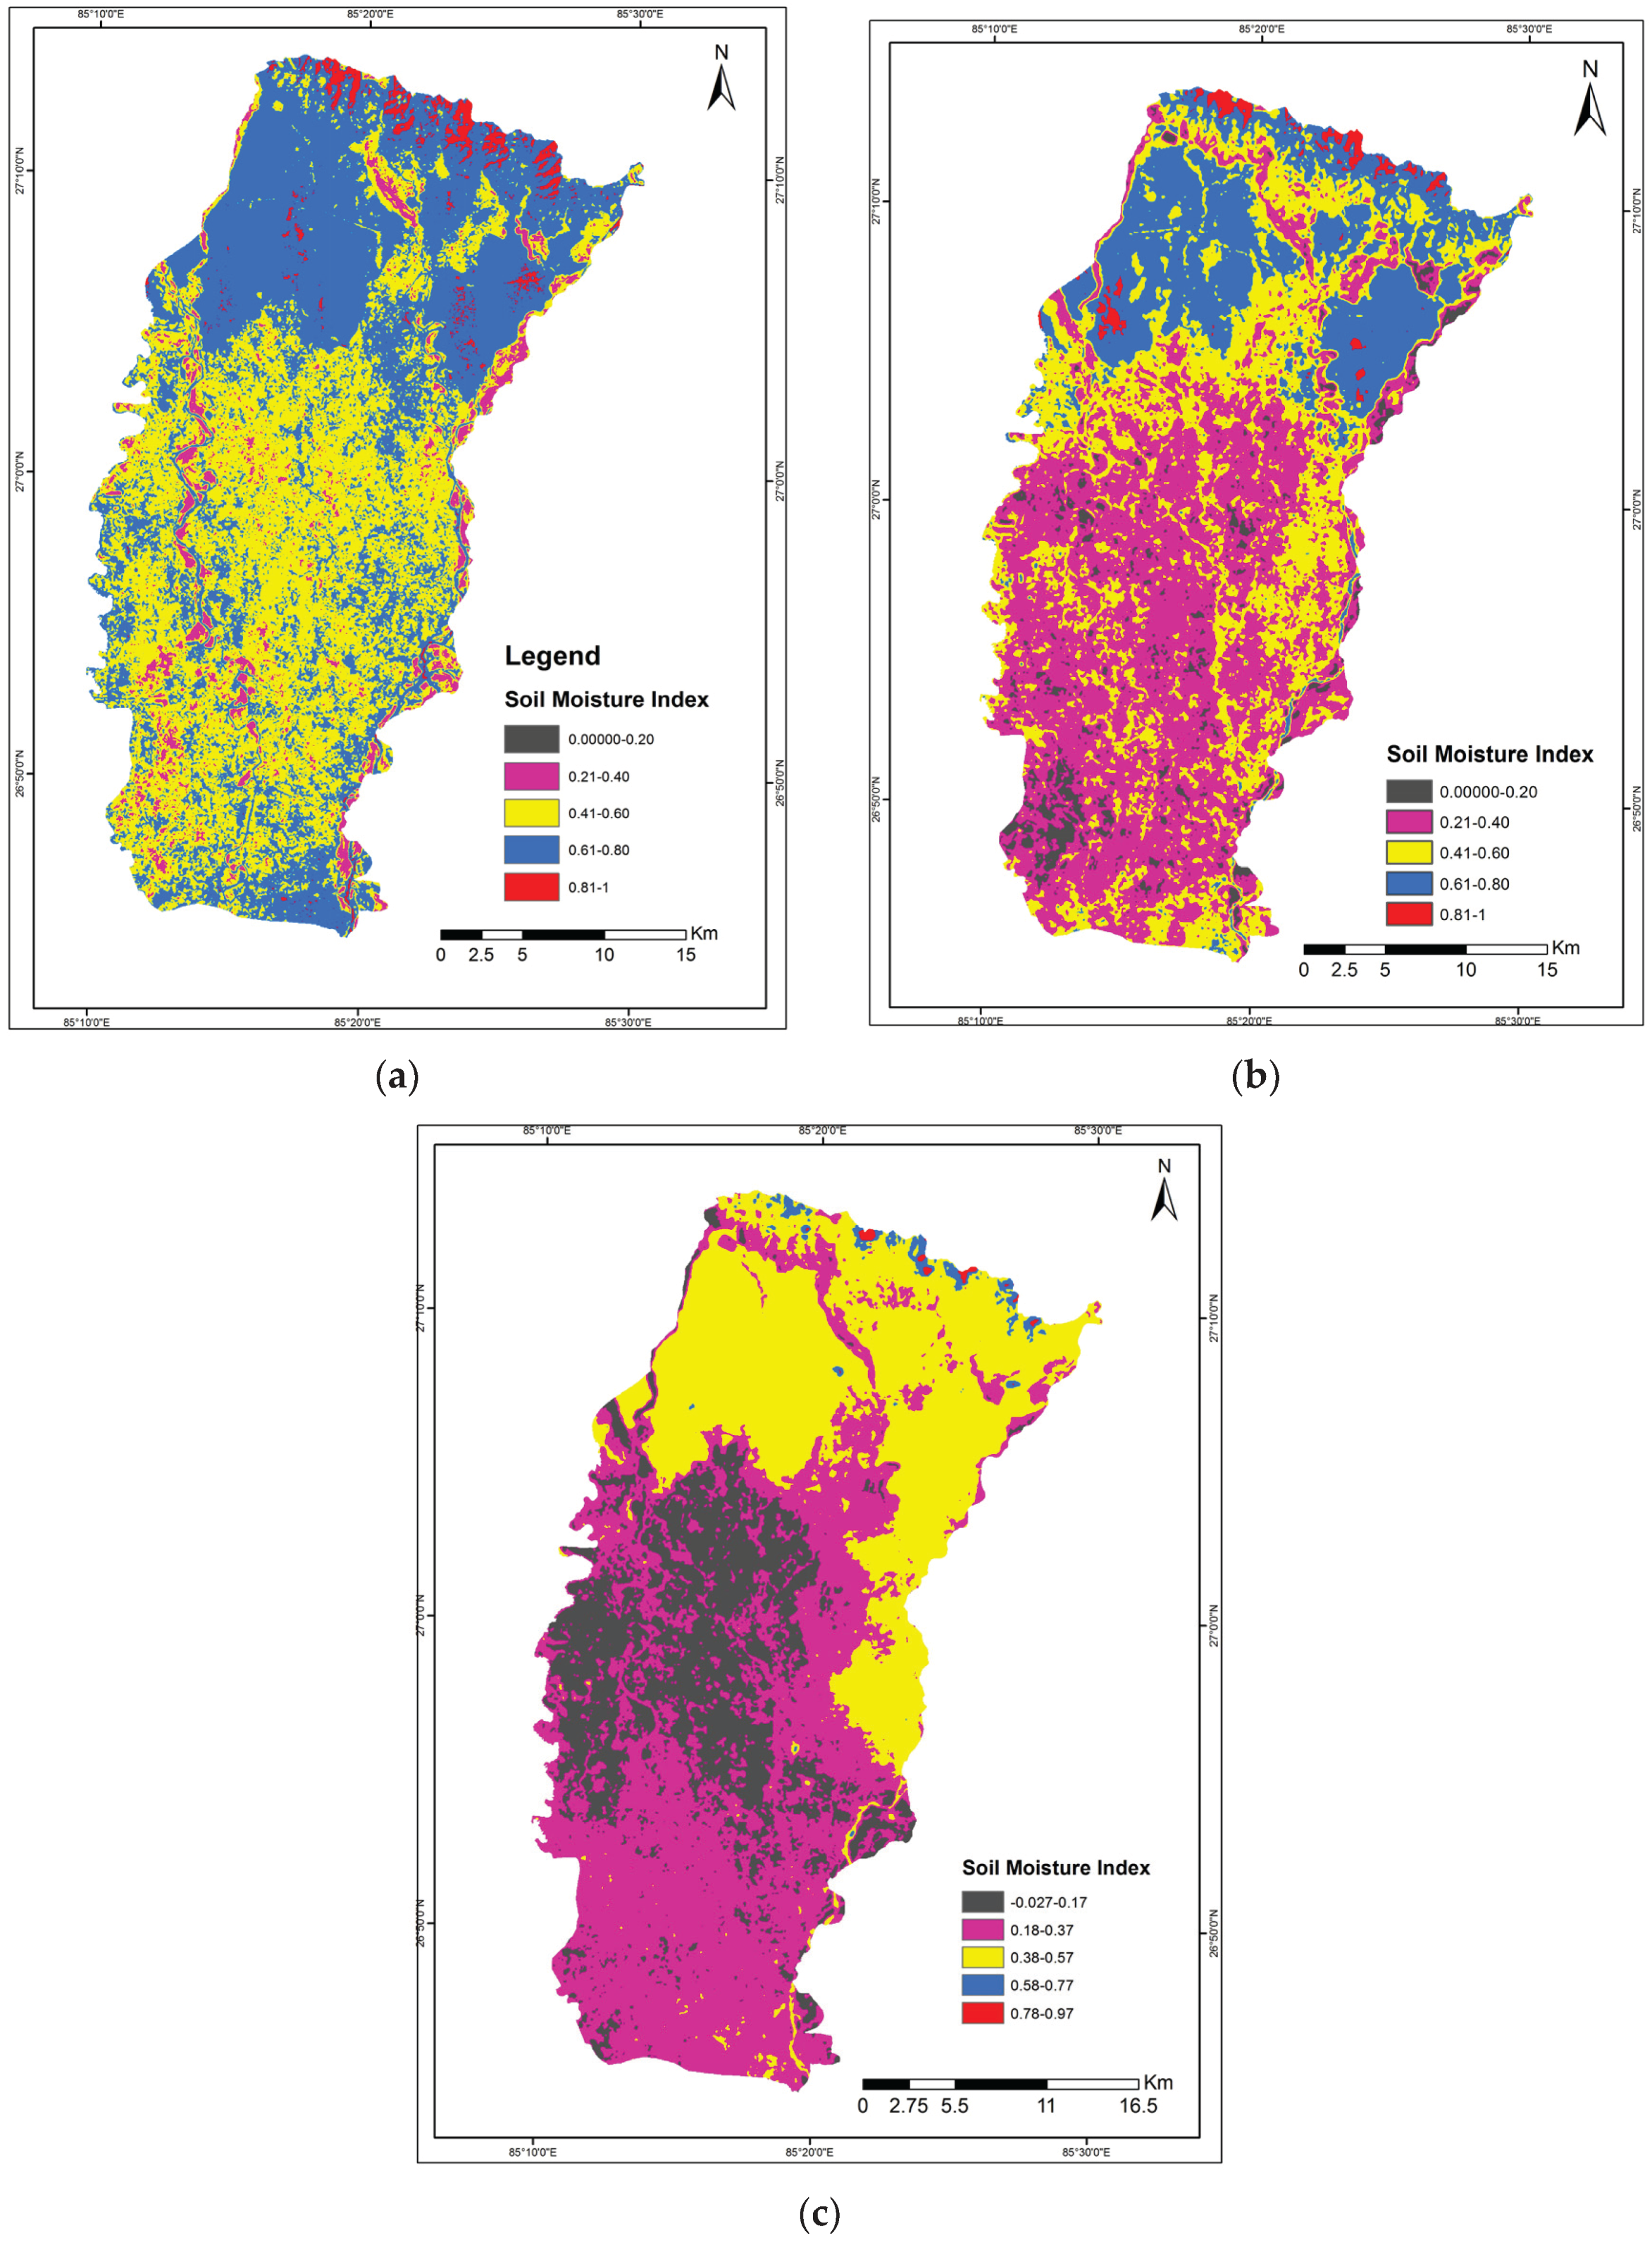
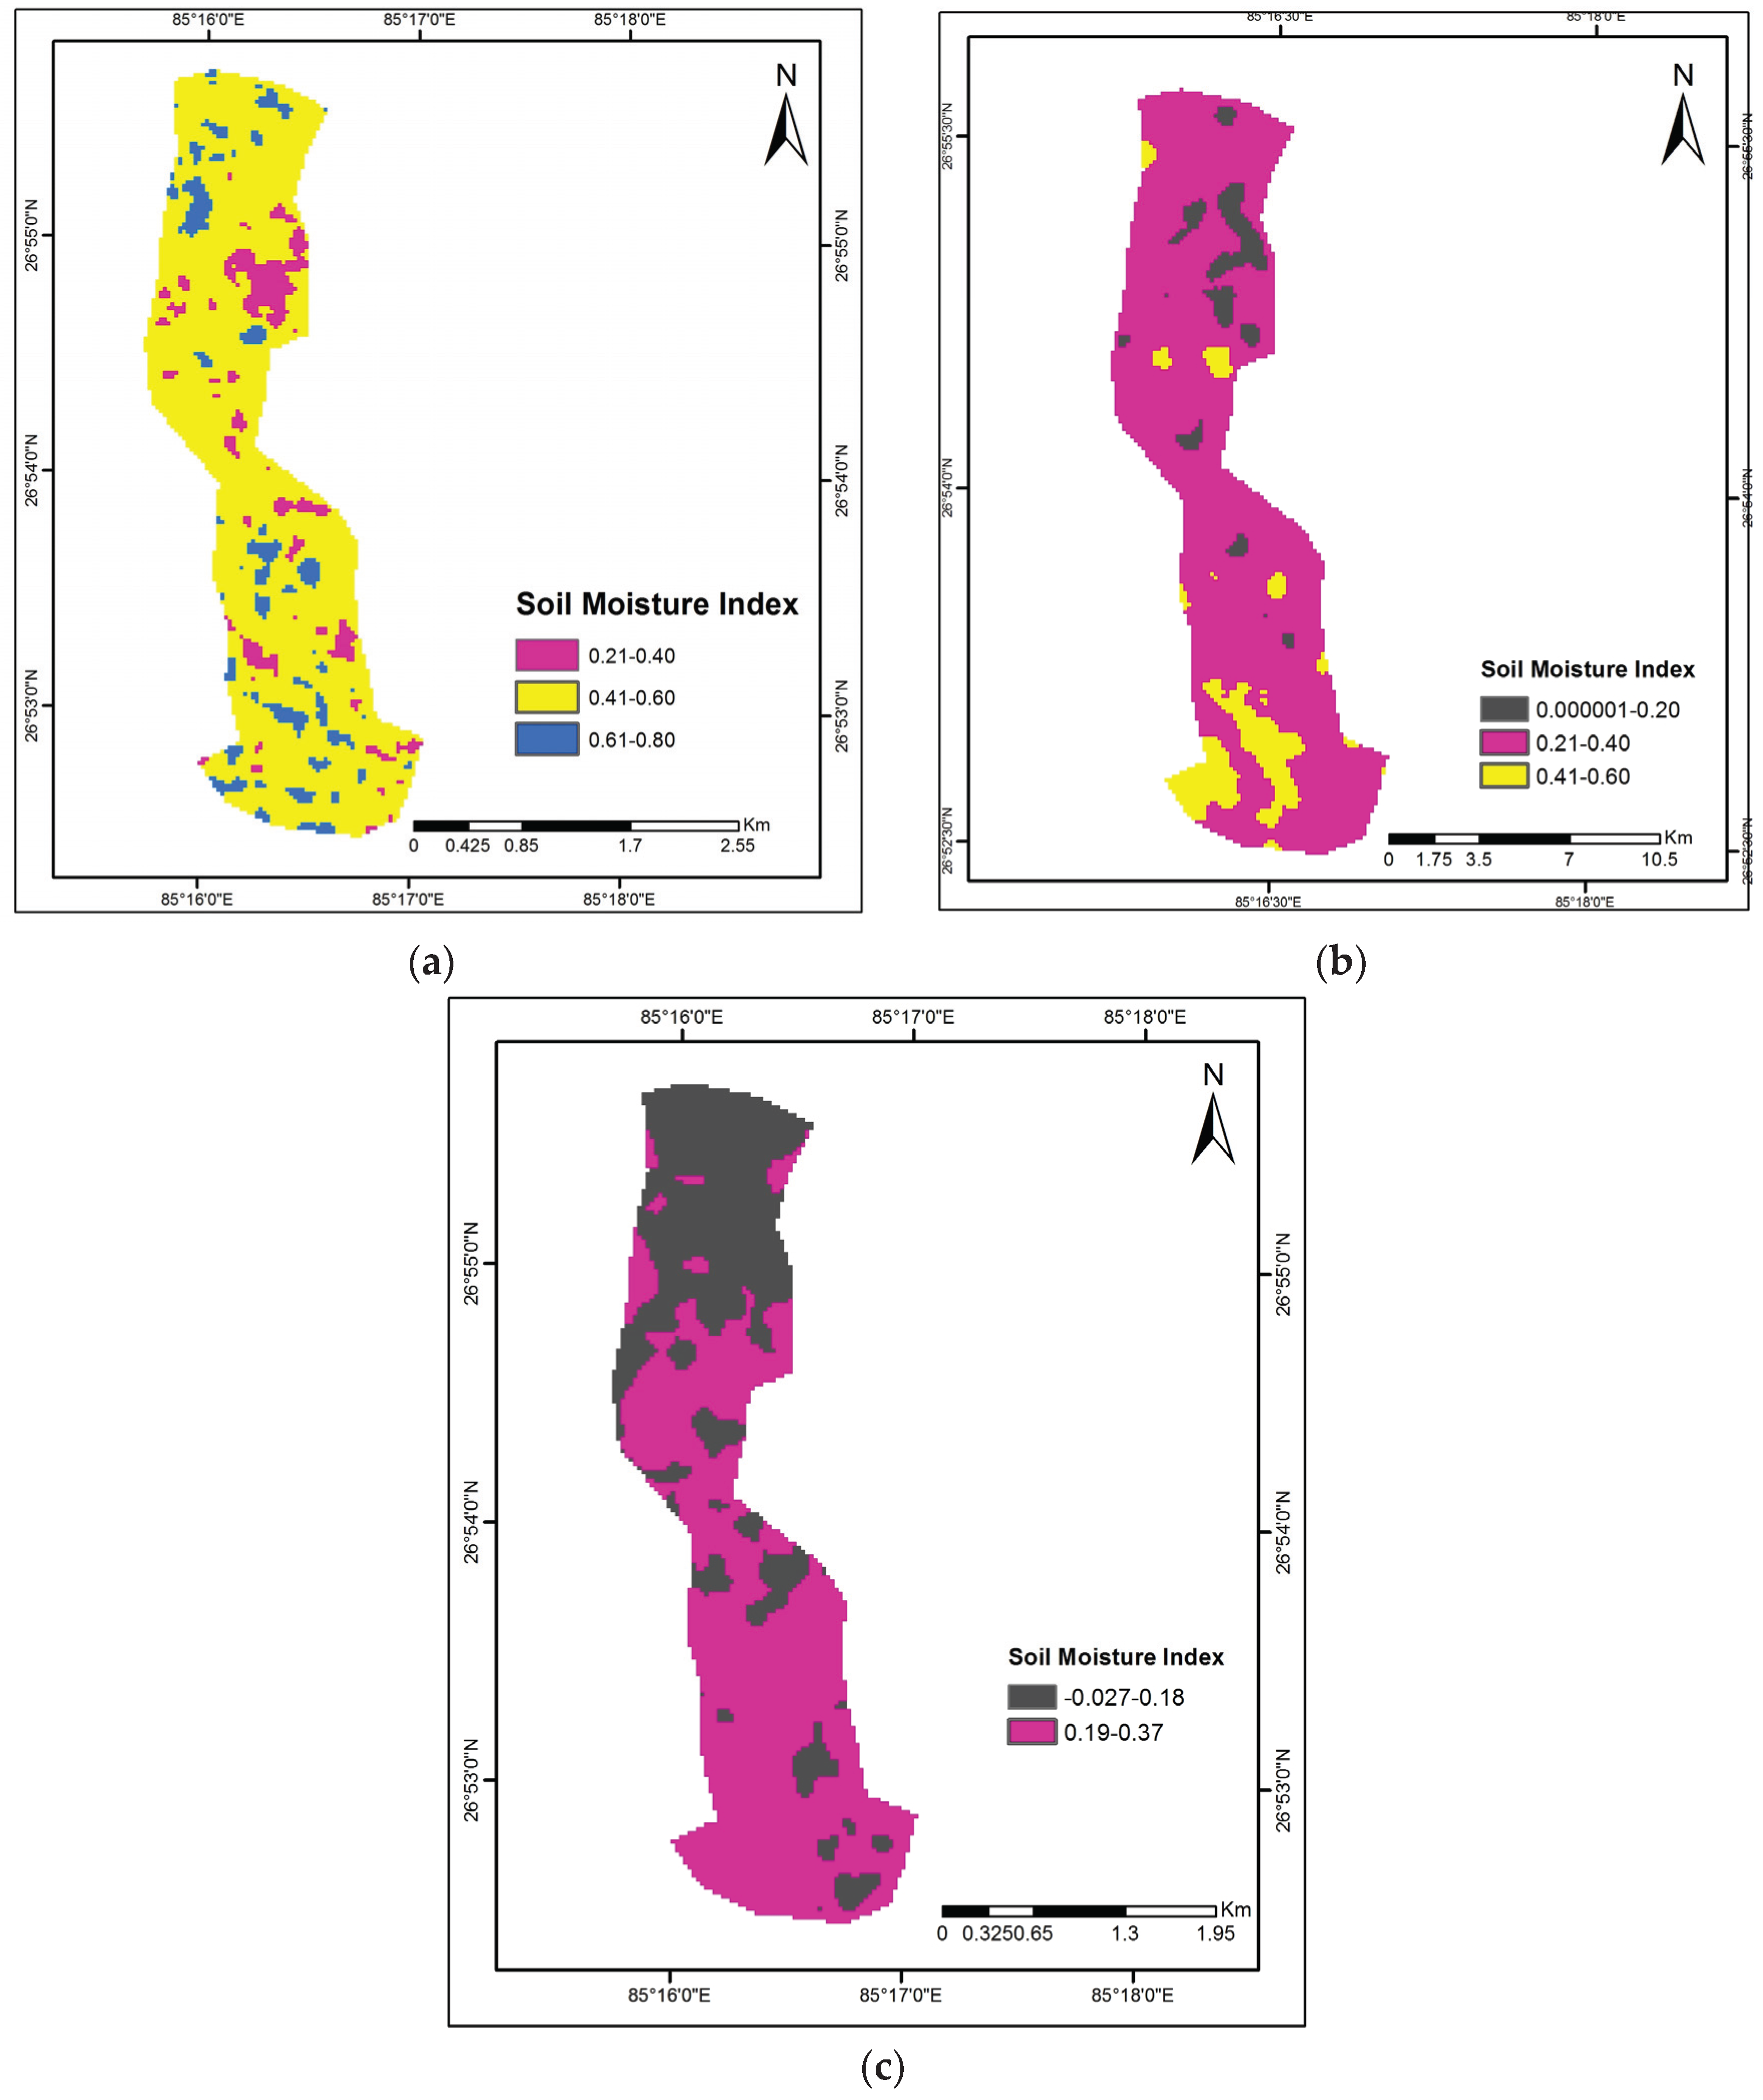
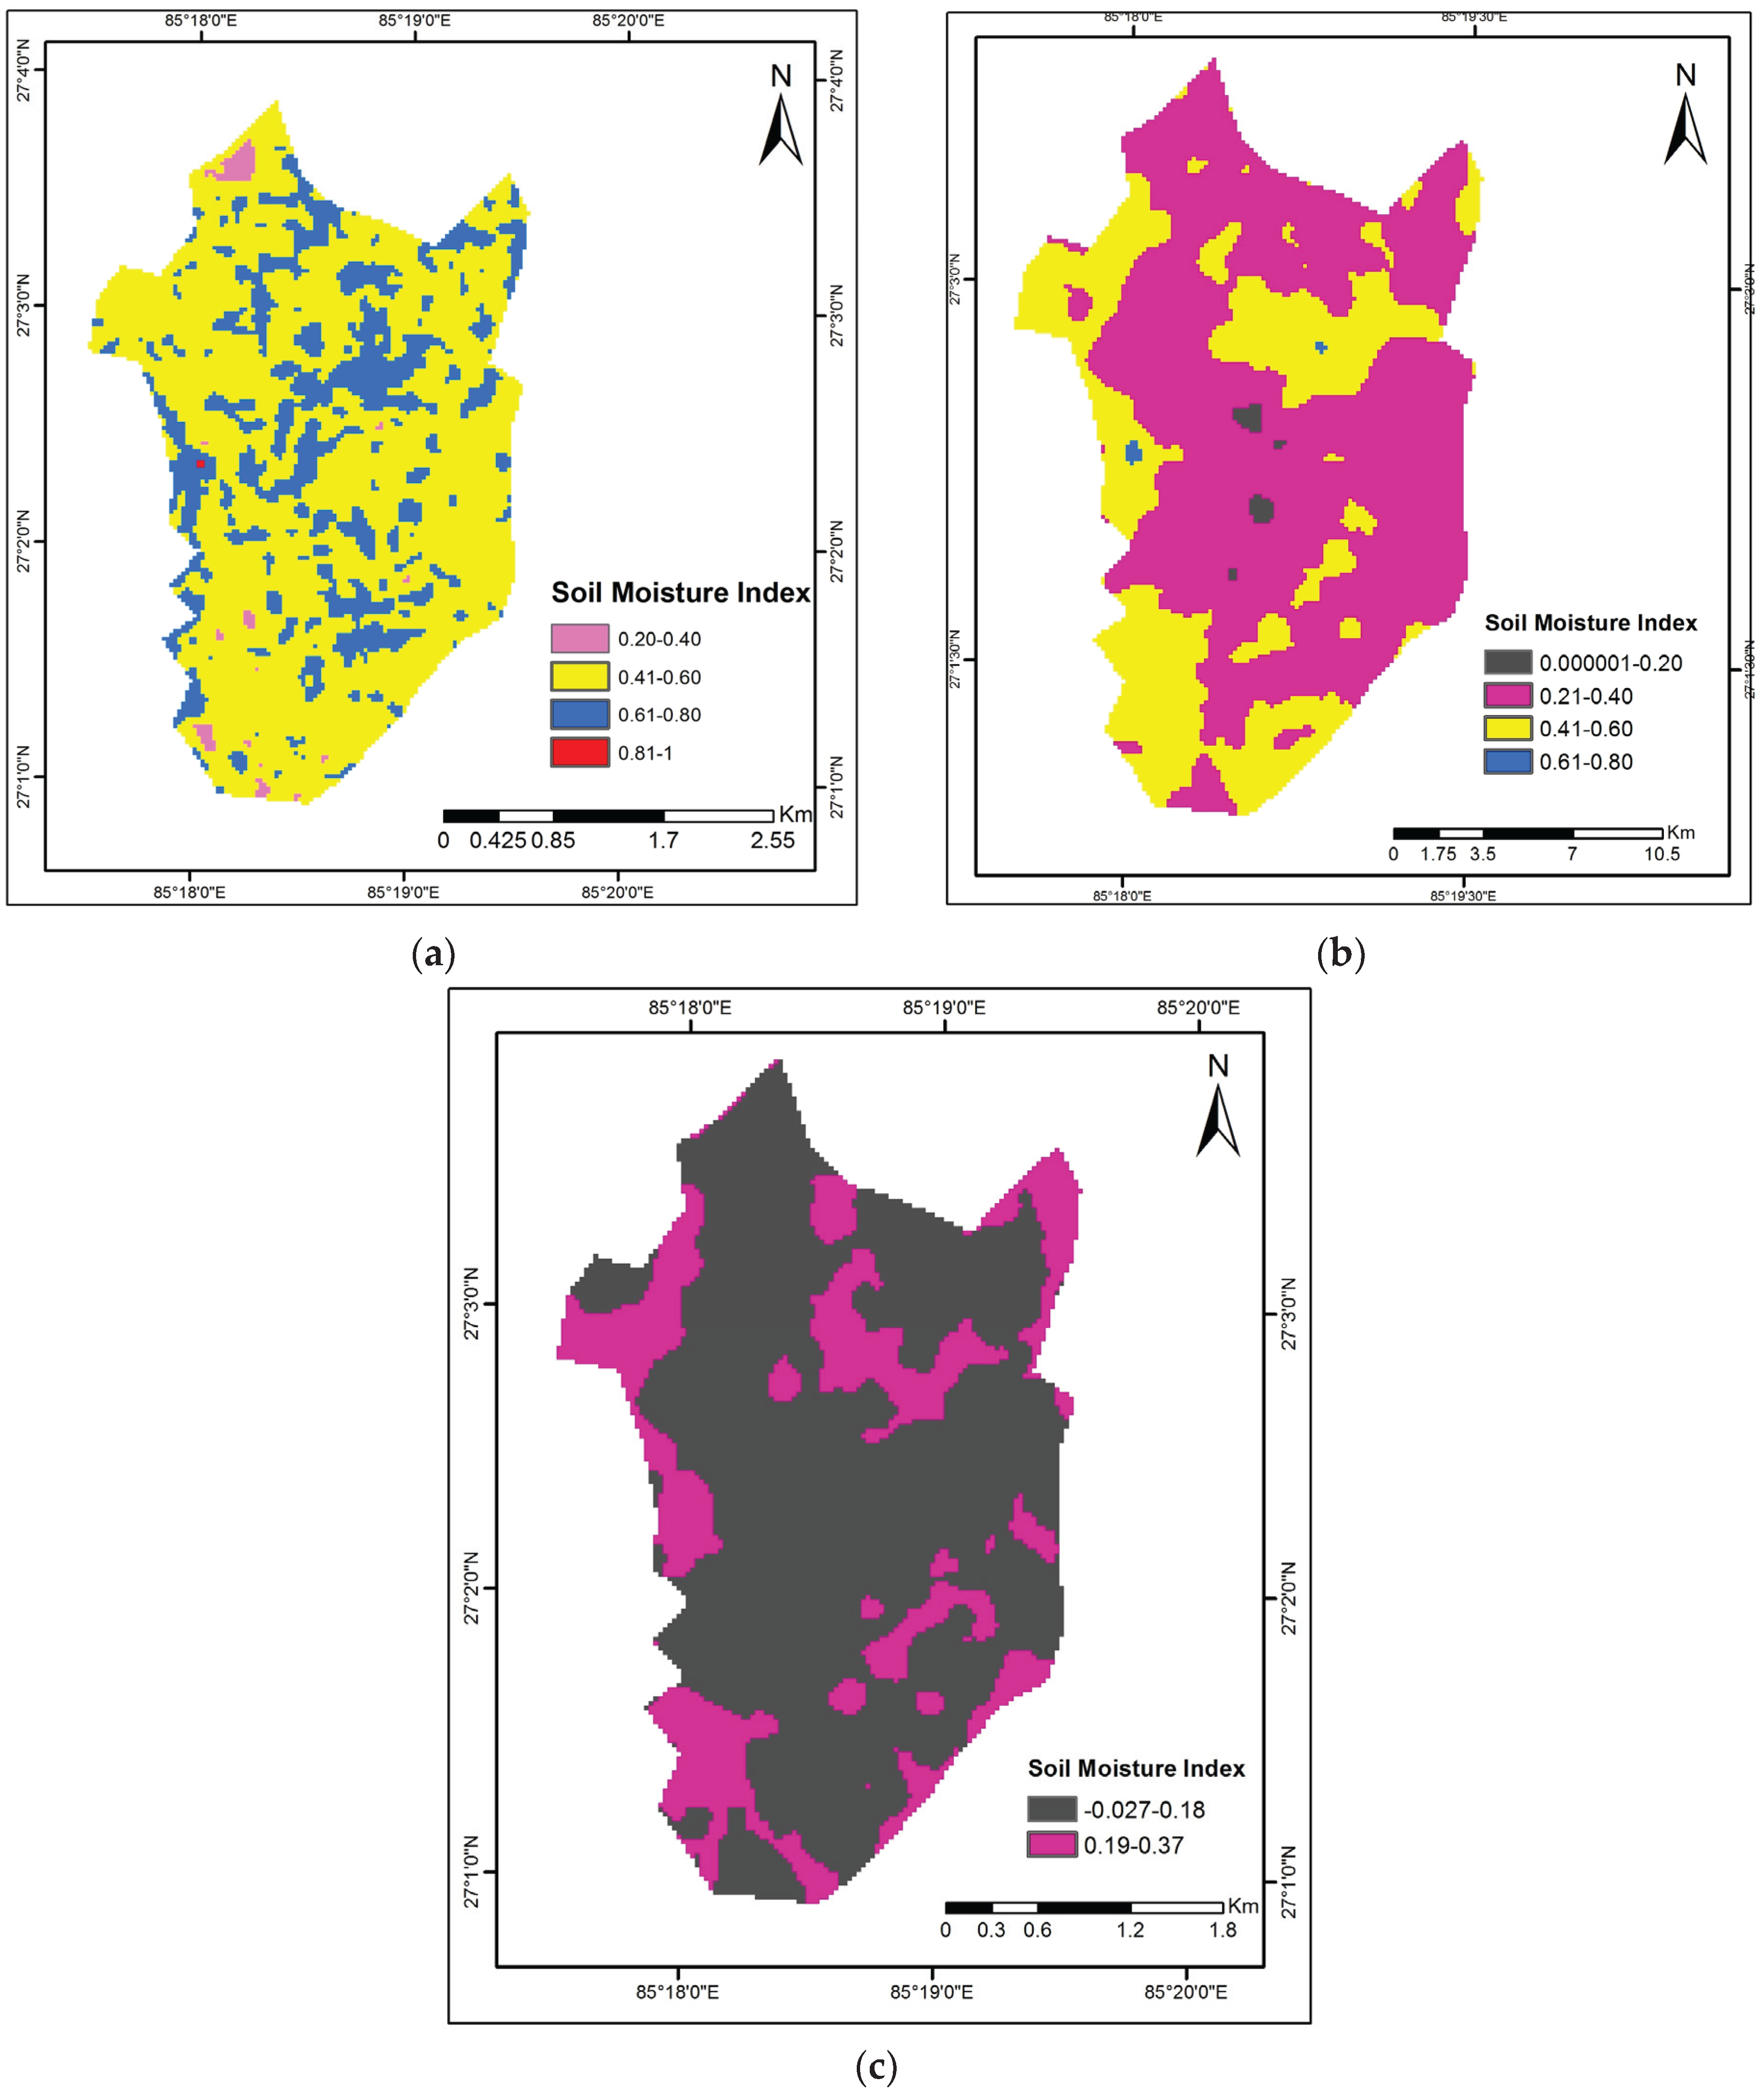
3.1.3. Soil Moisture
3.2. Agricultural Production
3.3. Adaptation Practices
4. Discussion
4.1. Key Climate Change Indicators
4.2. Agricultural Production
4.3. Adaptation Practices
5. Conclusions
Acknowledgments
Author Contributions
Conflicts of Interest
Appendix A
- General information: location, name of household head, name of respondent, and caste/ethnic group
- Demographic information: family size, sex ratio, education, and main occupation
- Socioeconomic status: land ownership status, tenancy, and means of livelihood
- Food production and security status: cropping pattern, sources and means of irrigation, crop types and area of cultivable land, annual crop production and sales by households, livestock/poultry holdings and sales within the last 12 months, food sufficiency status during the last 12 months, major staple food grains, food sufficiency period, reasons for insufficiency, and changes in cropping pattern during the last 10 years
- Perception and knowhow about climate change
- Perceived changes in rainfall patterns and associated effects during the last 10 years
- Perceived effects of climate change in cropping patterns and productivity of major crops
- Trend of incidences of insect pests of crops and diseases of livestock during the past 10 years
- Adaptation measures used by community for reducing the effects of climate change
- Access to basic productive inputs, services, and technologies to the community
- Application of improved technology in farming
- Cost of production of major crops
- Access to financial services of household, including involvement in savings, credit, or microfinance
- Access to credit of households
- Social participation and institutional affiliation of the household
- Access to vocational/skills development training in agriculture
- Perceived food scarcity situation in the community
- Factors affecting the productivity of crops and livestock
- Name of interviewer and date of survey
References
- Intergovernmental Panel on Climate Change (IPCC). The Fourth Assessment Report: Climate Change 2007; Synthesis Report; Cambridge University Press: Cambridge, UK, 2007. [Google Scholar]
- New, M.; Lister, D.; Hulme, M.; Makin, I. A high resolution data set of surface climate over global land areas. Clim. Res. 2002, 21, 1–25. [Google Scholar] [CrossRef]
- Singh, S.P.; Bassignana-Khadka, I.; Karky, B.S.; Sharma, E. Climate Change in the Hindu Kush-Himalayas: The State of Current Knowledge; ICIMOD: Kathmandu, Nepal, 2011. [Google Scholar]
- Maplecroft. Maplecroft Climate Change Risk Atlas 2011; Verisk Maplecroft: Bath, UK, 2011. [Google Scholar]
- Shrestha, A.B.; Wake, C.P.; Mayewski, P.A.; Dibb, J.E. Maximum temperature trends in the himalaya and its vicinity: An analysis based on temperature records from Nepal for the period 1971–94. J. Clim. 1999, 12, 2775–2789. [Google Scholar] [CrossRef]
- United Nations Environment Program (UNEP). Global Environment Outlook 3; United Nations Environment Program (UNEP): Nairobi, Kenya, 2002. [Google Scholar]
- Government of Nepal, Ministry of Environment. National Adaptation Programme of Action (NAPA) to Climate Change; Ministry of Environment: Kathmandu, Nepal, 2010.
- Government of Nepal, Ministry of Agriculture and Cooperative. Selected Indicators of Nepalese Agriculture and Population; Ministry of Agriculture and Cooperative: Kathmandu, Nepal, 2010.
- Dhakal, S. Evolution of geomorphologic Hazards in Hindu Kush Himalaya. In Mountain Hazards and Disaster Risk Reduction; Nibanupudi, H.K., Shaw, R., Eds.; Springer: Japan, 2015; pp. 53–72. [Google Scholar]
- Bashyal, R.; Dhakal, S. Climate Change Impacts and Adaptation Practices in Water Resources: A Case of Salyantar; LAP Lambert Academic Publishing: Saarbrücken, Germany, 2015. [Google Scholar]
- Regmi, H.R. Effect of unusual weather on cereal crops production and household food security. J. Agric. Environ. 2007, 8, 20–29. [Google Scholar] [CrossRef]
- Strategic Program for Climate Resilience (SPCR). Nepal: Strategic Program for Climate Resilience; The Pilot Program for Climate Resilience; Ministry of Science and Technology: Kathmandu, Nepal, 2010.
- Khanal, R.C. Climate change and organic agriculture. J. Agric. Environ. 2009, 10, 100–110. [Google Scholar] [CrossRef]
- Rai, M. Climate change and agriculture: A Nepalese case. J. Agric. Environ. 2007, 8, 92–95. [Google Scholar] [CrossRef]
- Food and Agriculture Organization of the United Nations (FAO). Food Security Indicators; Food and Agriculture Organization of United Nations: Rome, Italy, 2008. [Google Scholar]
- Wang, L.; Qu, J. Satellite remote sensing applications for surface soil moisture monitoring: A review. Front. Earth Sci. China 2009, 3, 237–247. [Google Scholar] [CrossRef]
- Walker, J. Estimating Soil Moisture Profile Dynamics from Near-Surface Soil Moisture Measurements and Standard Meteorological Data. Ph.D. Thesis, The University of Newcastle, Callaghan, Australia, 1999. [Google Scholar]
- Younis, S.M.Z.; Iqbal, J. Estimation of soil moisture using multispectral and FTIR techniques. Egypt. J. Remote Sens. Space Sci. 2015, 18, 151–161. [Google Scholar] [CrossRef]
- Suresh, S.; Ajay, S.V.; Mani, K. Estimation of land surface temperature of high range mountain landscape of Devikulam Taluk using Landsat 8 data. Int. J. Res. Eng. Technol. 2016, 5, 92–96. [Google Scholar]
- Das, A. Estimation of land surface temperature and its relation to land cover land use: A case study on Bankura district, west Bengal India. Res. Dir. 2015, 3, 1–7. [Google Scholar]
- Mann, H.B. Nonparametric tests against trend. Econometrica 1945, 13, 245–259. [Google Scholar] [CrossRef]
- Kendall, M.G. Rank Correlation Methods; Griffin: London, UK, 1975. [Google Scholar]
- Longobardi, A.; Villani, P. Trend analysis of annual and seasonal rainfall time series in the Mediterranean area. Int. J. Climatol. 2010, 30, 1538–1546. [Google Scholar] [CrossRef]
- Sen, P.K. Estimates of the regression coefficient based on Kendall’s tau. J. Am. Stat. Assoc. 1968, 63, 1379–1389. [Google Scholar] [CrossRef]
- Lehman, A. Jmp for Basic Univariate and Multivariate Statistics: A Step-by-Step Guide; SAS Press: Cary, NC, USA, 2015. [Google Scholar]
- Corder, G.W.; Foreman, D.I. Nonparametric Statistics: A Step-by-Step Approach; Wiley: Hoboken, NJ, USA, 2014. [Google Scholar]
- Government of Nepal, Ministry of Environment. Climate Change Vulnerability Mapping for Nepal; Government of Nepal, Ministry of Environment: Kathmandu, Nepal, 2010.
- Government of Nepal, Ministry of Agriculture Development. Reports of Ministry of Agriculture Development. Available online: http://www.moad.gov.np/ (accessed on 23 December 2015).
- Government of Nepal, Ministry of Agriculture Development. Production Cost and Marketing of Cereal, Cash, Vegetables and Industrial Crops in Nepal; Agribusiness Promotion and Market Development Directorate, Market Research and Statistics Management Program, Department of Agriculture, Reports from 1992–2015; Government of Nepal, Ministry of Agriculture Development: Kathmandu, Nepal, 2015.
- Government of Nepal, National Planning Commission. Climate-Resilient Planning, Working Document 2011; Government of Nepal, National Planning Commission: Kathmandu, Nepal, 2011.
- Baidya, S.K.; Shrestha, M.L.; Sheikh, M.M. Trends in daily climatic extremes of temperature and precipitation in Nepal. J. Hydrol. Meteorol. 2008, 5, 38–53. [Google Scholar]
- Paudyal, P.; Bhuju, D.R.; Aryal, M. Climate change dry spell impact on agriculture in Salyantar, Dhading, central Nepal. Nepal J. Sci. Technol. 2015, 16, 59–68. [Google Scholar] [CrossRef]
- Poudel, S.; Shaw, R. The relationships between climate variability and crop yield in a mountainous environment: a case study in Lampung district, Nepal. Climate 2016, 4. [Google Scholar] [CrossRef]
- Pant, K.P. Climate change and food security. J. Agric. Environ. 2012, 13, 9–19. [Google Scholar]
- Joshi, N.P.; Maharjan, K.L.; Luni, P. Effect of climate variables on yield of major food-crops in Nepal: A time-series analysis. J. Contem. India Stud. 2011, 1, 19–26. [Google Scholar]


| Caste/Ethnicity | Frequency | % |
|---|---|---|
| Hills Bahuns/Kshetris/Thakuris | 17 | 9.5 |
| Hills Janajatis | 6 | 3.3 |
| Hills Dalits | 5 | 2.8 |
| Madhesis/Tharus | 74 | 41.1 |
| Muslim or other religious groups | 33 | 18.4 |
| Others (unspecified groups) | 45 | 25.0 |
| Total | 180 | 100.0 |
| Sex | ||
| Male | 172 | 95.6 |
| Female | 8 | 4.4 |
| Total | 180 | 100.0 |
| Age groups (year) | ||
| Less than 40 | 4 | 2.2 |
| 41–50 | 77 | 42.8 |
| 46–50 | 32 | 17.8 |
| 51–60 | 56 | 31.1 |
| Above 60 | 43 | 23.9 |
| Total | 180 | 100.0 |
| Month | Monthly Temperature (°C) (1987 to 2014) | Monthly Rainfall (mm) (1984 to 2014) | ||
|---|---|---|---|---|
| Max | Min | Mean | Average | |
| January | 21.26 | 7.69 | 14.48 | 12.04 |
| February | 25.65 | 9.78 | 17.71 | 16.17 |
| March | 30.83 | 13.59 | 22.21 | 14.99 |
| April | 35.13 | 18.96 | 27.04 | 44.06 |
| May | 35.18 | 23.12 | 29.15 | 136.83 |
| June | 34.37 | 25.30 | 29.84 | 279.70 |
| July | 32.65 | 25.56 | 29.11 | 564.92 |
| August | 32.76 | 25.43 | 29.09 | 438.52 |
| September | 32.59 | 24.31 | 28.45 | 289.72 |
| October | 31.67 | 19.93 | 25.80 | 74.05 |
| November | 28.89 | 13.86 | 21.38 | 4.28 |
| December | 24.38 | 9.50 | 16.94 | 10.19 |
| Average | 30.45 | 18.09 | 24.27 | 1885.47 |
| Temperature | p-Value | τ-Value | Sen’s Slope (°C/year) | Trend | Significance | Alpha Value |
|---|---|---|---|---|---|---|
| Tmax | 0.286 | 0.146 | 0.010 | Increasing | Insignificant | 0.05 |
| Tmin | 0.082 | 0.236 | 0.019 | Increasing | Insignificant | 0.05 |
| Average | 0.075 | 0.242 | 0.015 | Increasing | Insignificant | 0.05 |
| Rainfall | p-Value | Tau (τ) Value | Sen’s Slope (mm/Year) | Trend | Significance |
|---|---|---|---|---|---|
| Pre-monsoon | 0.760 | −0.041 | −0.520 | Decreasing | Insignificant |
| Monsoon | 0.208 | −0.161 | −11.750 | Decreasing | Insignificant |
| Post-monsoon | 0.622 | 0.065 | 1.000 | Increasing | Insignificant |
| Winter | 0.324 | −0.127 | −0.595 | Decreasing | Insignificant |
| Annual Average | 0.208 | −0.161 | −10.210 | Decreasing | Insignificant |
| Rautahat District | Year | ||||
| SMI Class | 2000 | 2014 | SMI Class | 2015 | |
| Area (%) | Area (%) | Area (%) | |||
| 0.000001–0.20 | 0.00 | 3.84 | −0.027–0.18 | 21.10 | |
| 0.21–0.40 | 5.01 | 44.28 | 0.19–0.37 | 45.09 | |
| 0.41–0.60 | 46.06 | 30.63 | 0.38–0.57 | 32.72 | |
| 0.61–0.80 | 46.81 | 20.08 | 0.58–0.77 | 0.94 | |
| 0.81–1 | 2.11 | 1.17 | 0.78–0.97 | 0.15 | |
| Working VDC | Year | ||||
|---|---|---|---|---|---|
| Class | 2000 | 2014 | Class | 2015 | |
| % | % | % | |||
| Judibela | 0.000001–0.20 | - | 0.37 | −0.027–0.18 | 0.02 |
| 0.21–0.40 | 0.44 | 11.97 | 0.19–0.37 | 9.4 | |
| 0.41–0.6 | 17.99 | 29.14 | 0.38–0.57 | 83.96 | |
| 0.61–0.80 | 73.03 | 54.57 | 0.58–0.77 | 4.99 | |
| 0.81–1 | 8.54 | 3.94 | 0.78–0.97 | 1.63 | |
| Working VDC | Year | ||||
|---|---|---|---|---|---|
| Class | 2000 | 2014 | Class | 2015 | |
| % | % | % | |||
| Karuniya | 0.000001–0.20 | - | 5.62 | −0.027–0.18 | 88.93 |
| 0.21–0.40 | 8.25 | 84.04 | 0.19–0.37 | 11.07 | |
| 0.41–0.60 | 83.21 | 10.34 | 0.38–0.57 | - | |
| 0.61–0.80 | 8.54 | - | 0.58–0.77 | - | |
| Working VDC | Year | ||||
|---|---|---|---|---|---|
| Class | 2000 | 2014 | Class | 2015 | |
| % | % | % | |||
| Santapur | 0.00001–0.20 | - | 7.36 | −0.027–0.18 | 86.96 |
| 0.21–0.40 | 7.84 | 82.52 | 0.19–0.37 | 13.04 | |
| 0.41–0.60 | 73.19 | 10.12 | 0.38–0.57 | - | |
| 0.61–0.80 | 18.97 | - | 0.58–0.77 | - | |
| Working VDCs | Year | ||||
|---|---|---|---|---|---|
| Class | 2000 | 2014 | Class | 2015 | |
| % | % | % | |||
| Simara Bhawanipur | 0.000001–0.20 | - | 0.64 | −0.027–0.18 | 74.4 |
| 0.21–0.40 | 1.17 | 67.22 | 0.19–0.37 | 25.6 | |
| 0.41–0.60 | 75.19 | 31.95 | 0.38–0.57 | - | |
| 0.61–0.80 | 23.61 | 0.19 | 0.58–0.77 | - | |
| 0.81–1 | 0.03 | - | 0.78–0.97 | - | |
| Year | Yield (Kg/Hectare) | ||||||
|---|---|---|---|---|---|---|---|
| Paddy | Maize | Wheat | Oil Seeds | Potato | Sugarcane | Pulses | |
| 1999 | 2500 | 1800 | 2000 | 812 | 10,349 | 30,000 | 1000 |
| 2000 | 2785 | 1600 | 1720 | 818 | 13,455 | 30,000 | 988 |
| 2001 | 2660 | 1780 | 1950 | 797 | 13,455 | 36,000 | 963 |
| 2002 | 2800 | 1700 | 2100 | 950 | 14,057 | 36,000 | 700 |
| 2003 | 2800 | 1700 | 2100 | 950 | 14,057 | 36,000 | 700 |
| 2004 | 2534 | 1906 | 1749 | 887 | 14,896 | 36,042 | 700 |
| 2005 | 2326 | 1906 | 1749 | 887 | 14,896 | 36,042 | 789 |
| 2006 | 2230 | 1967 | 2300 | 803 | 14,896 | 36,042 | 789 |
| 2007 | 2433 | 1800 | 2504 | 837 | 16,500 | 35,091 | 829 |
| 2008 | 2660 | 1875 | 2238 | 837 | 16,833 | 39,129 | 796 |
| 2009 | 2472 | 1747 | 2420 | 669 | 16,058 | 45,754 | 802 |
| 2010 | 2651 | 3200 | 2420 | 828 | 16,058 | 35,250 | 790 |
| 2011 | 3350 | 3150 | 2677 | 828 | 18,300 | 40,000 | 868 |
| 2012 | 2243 | 3300 | 3100 | 815 | 16,089 | 41,180 | 1205 |
| 2013 | 3135 | 3235 | 3107 | 828 | 16,089 | 32,000 | 1205 |
| Crops | p-Value | Tau (τ) Value | Sen’s Slope (Kg/Ha/Year) | Trend | Significance | Alpha Value |
|---|---|---|---|---|---|---|
| Paddy | 1 | −0.010 | 0.00 | Increasing | Insignificant | 0.05 |
| Maize | 0.003 | 0.580 | 68.67 | Increasing | Significant | 0.05 |
| Wheat | 0.0005 | 0.715 | 80.80 | Increasing | Significant | 0.05 |
| Oilseeds | 0.485 | −0.147 | −2.25 | Decreasing | Insignificant | 0.05 |
| Potato | 0.0001 | 0.769 | 290.50 | Increasing | Significant | 0.05 |
| Sugarcane | 0.040 | 0.414 | 477.30 | Increasing | Significant | 0.05 |
| Pulses | 0.251 | 0.234 | 12.86 | Increasing | Insignificant | 0.05 |
| Crops | Seasonal Rainfall | Rho Coefficient | p-Value |
|---|---|---|---|
| Paddy | Monsoon | −0.018 | 0.847 |
| Maize | Pre-monsoon | −0.365 | 0.474 |
| Monsoon | −0.419 | 0.053 | |
| Wheat | Post-monsoon | 0.109 | 0.896 |
| Winter | 0.136 | 0.988 | |
| Potato | Post-monsoon | −0.0396 | 0.837 |
| Winter | 0.128 | 0.918 | |
| Sugarcane | Pre | −0.374 | 0.104 |
| Mon | −0.473 | 0.141 | |
| Post | −0.108 | 0.126 | |
| Pulses | Post-monsoon | −0.199 | 0.423 |
| Winter | −0.255 | 0.289 |
| Improved Crop Variety | Households Using Improved Crop Variety | (%) Households | Area Planted with Improved Crop Variety (Hectare/Household) | Average Production (kg/Hectare) |
|---|---|---|---|---|
| Rice | 103 | 60.59 | 0.54 | 5505 |
| Maize | 23 | 51.11 | 0.53 | 8817 |
| Wheat | 41 | 28.67 | 0.28 | 2464 |
| SN | Category of Essential Agricultural Production Inputs and Services | Frequency | (%) | Average Distance (Km) | Average Travel Time (Minute) |
|---|---|---|---|---|---|
| A. | Crop production | ||||
| 1 | Access to improved seeds | 136 | 75.6 | 7.20 | 70.70 |
| 2 | Access to chemical fertilizer | 134 | 74.4 | 7.03 | 77.87 |
| 3 | Access to pesticide | 133 | 73.9 | 6.89 | 73.40 |
| 4 | Access to technical/extension services | 47 | 26.1 | 1.80 | 15.50 |
| Average | 5.73 | 59.37 | |||
| B. | Livestock and poultry | ||||
| 1 | Access to basic veterinary services | 60 | 33.30 | 3.30 | 34.80 |
| 2 | Access to technical know-how in livestock and poultry farming | 18 | 10.00 | 2.10 | 27.30 |
| 3 | Access to productive inputs (feeds, medicines, vaccines, etc.) | 52 | 28.90 | 2.80 | 29.40 |
| 4 | Access to improved breeds (animal and poultry) | 10 | 5.60 | 1.50 | 15.10 |
| 5 | Access to fodder/forage seeds/saplings | 43 | 23.90 | 1.70 | 14.60 |
| Average | 2.03 | 21.60 | |||
| C | Access to marketing services | ||||
| 1 | Cereal grains | 33 | 18.5 | 2.00 | 27.90 |
| 2 | Fresh vegetables and fruits | 29 | 16.1 | 2.60 | 17.60 |
| 3 | Livestock and poultry | 2 | 1.1 | 1.50 | 10.00 |
| 4 | Milk and milk products | 33 | 18.3 | 1.30 | 11.40 |
| 5 | Honey | 1 | 0.6 | 1.00 | 10.00 |
| Average | 1.60 | 12.25 |
| Fiscal Year | Paddy | Maize | Wheat | ||||||
|---|---|---|---|---|---|---|---|---|---|
| Fixed Cost (Rs) | Variable Cost (Rs) | Total Cost (Rs) | Fixed Cost (Rs) | Variable Cost (Rs) | Total Cost (Rs) | Fixed Cost (Rs) | Variable Cost (Rs) | Total Cost (Rs) | |
| 1993/94 | 256.08 | 12,731.23 | 12,987.32 | 205.2 | 7949.22 | 8154.42 | 215.96 | 9357.47 | 9573.44 |
| 1994/95 | 211.17 | 10,471.84 | 10,683.01 | 178.77 | 8703.13 | 8881.9 | 178.77 | 8703.13 | 8881.9 |
| 1996/97 | 224.06 | 16,666.43 | 16,890.48 | 224.14 | 13,584.72 | 13,808.86 | 224.14 | 13,584.72 | 13,808.86 |
| 1997/98 | 224.56 | 17,196.17 | 17,420.73 | 231.64 | 13,297.56 | 13,529.2 | 231.64 | 13,297.56 | 13529.2 |
| 1998/99 | 172.58 | 18,443.15 | 18,615.72 | 309.53 | 12,560.8 | 12,870.33 | 309.53 | 12,560.8 | 12,870.33 |
| 1999/00 | 180.76 | 21,356.34 | 21,537.1 | 180.28 | 15,618.17 | 15,798.45 | 180.28 | 15,618.17 | 15,798.45 |
| 2000/01 | 182.5 | 24,357.69 | 24,540.19 | 174.79 | 16,412.06 | 16,586.85 | 174.79 | 16,412.06 | 16,586.85 |
| 2001/02 | 181.75 | 20,291.79 | 20,473.54 | 174.75 | 16,198.53 | 16,373.28 | 174.75 | 16,198.53 | 16,373.28 |
| 2002/03 | 181.47 | 25,491.93 | 25,673.4 | 172.81 | 22,297.23 | 22,470.04 | 172.81 | 22,297.23 | 22,470.04 |
| 2006/07 | 405.98 | 22,304.57 | 22,710.54 | 280.29 | 21,221.9 | 21,502.2 | 280.29 | 21,221.9 | 21,502.2 |
| 2008/09 | 355.82 | 26,197.47 | 26,553.29 | 273.72 | 22,666.84 | 22,940.56 | 273.72 | 22,666.84 | 22,940.56 |
| 2009/10 | 361.00 | 29,695.89 | 30,056.89 | 273.72 | 28,776.55 | 29,050.27 | 273.72 | 28,776.55 | 29,050.27 |
| 2010/11 | 250.60 | 36,689.23 | 36,939.83 | 273.72 | 26,928.2 | 27,201.92 | 273.72 | 26,928.2 | 27,201.92 |
| 2011/12 | 245.57 | 48,834.04 | 49,079.61 | 257.75 | 43,713.03 | 43,970.78 | 257.75 | 43,713.03 | 43,970.78 |
| 2012/13 | 237.17 | 59,917.27 | 60,154.44 | 235.86 | 51,598.69 | 51,834.54 | 235.86 | 51,598.69 | 51,834.54 |
| 2013/14 | 269.09 | 70,863.25 | 71,132.34 | 262.8 | 62,805.29 | 63,068.09 | 262.8 | 62,805.29 | 63,068.09 |
© 2016 by the authors; licensee MDPI, Basel, Switzerland. This article is an open access article distributed under the terms and conditions of the Creative Commons Attribution (CC-BY) license (http://creativecommons.org/licenses/by/4.0/).
Share and Cite
Dhakal, S.; Sedhain, G.K.; Dhakal, S.C. Climate Change Impact and Adaptation Practices in Agriculture: A Case Study of Rautahat District, Nepal. Climate 2016, 4, 63. https://doi.org/10.3390/cli4040063
Dhakal S, Sedhain GK, Dhakal SC. Climate Change Impact and Adaptation Practices in Agriculture: A Case Study of Rautahat District, Nepal. Climate. 2016; 4(4):63. https://doi.org/10.3390/cli4040063
Chicago/Turabian StyleDhakal, Subodh, Gopi Krishna Sedhain, and Subas Chandra Dhakal. 2016. "Climate Change Impact and Adaptation Practices in Agriculture: A Case Study of Rautahat District, Nepal" Climate 4, no. 4: 63. https://doi.org/10.3390/cli4040063