Article

Nitrous Oxide and Methane Fluxes from Smallholder Farms: A Scoping Study in the Anjeni Watershed

by
Haimanote K. Bayabil
1,2,
Cathelijne R. Stoof
2,3,
Cedric Mason
2,
Brian K. Richards
2 and
Tammo S. Steenhuis
2,4,*
1
Cooperative Agricultural Research Center, College of Agriculture and Human Sciences, Prairie View A&M University, Prairie View, TX 77446, USA
2
Department of Biological and Environmental Engineering, Cornell University, Ithaca, NY 14850, USA
3
Soil Geography and Landscape Group, Wageningen University, The Netherlands
4
School of Civil and Water Resources Engineering, Bahir Dar University, Bahir Dar, P. O. Box 527, Ethiopia
*
Author to whom correspondence should be addressed.
Climate 2016, 4(4), 62; https://doi.org/10.3390/cli4040062
Submission received: 18 July 2016 / Revised: 7 November 2016 / Accepted: 30 November 2016 / Published: 11 December 2016
(This article belongs to the Special Issue Climate Change on Crops, Foods and Diets)

Abstract

:
While agricultural practices are widely reported to contribute to anthropogenic greenhouse gas (GHG) emissions, there are only limited measurements available for emission rates in the monsoon climate of the African continent. We conducted a scoping study to measure nitrous oxide (N2O-N) and methane (CH4) emission rates from 24 plots constructed on smallholder agricultural farms along the slope catena of three transects in the sub-humid Anjeni watershed in the Ethiopian highlands. Greenhouse gas flux samples were collected in 2013, before, towards the end, and after the rainy monsoon phase. At each location, three plots were installed in groups: two plots grown with barley (one enriched with charcoal and the other without soil amendment) and lupine was grown on the third plot without any soil amendment. Preliminary study results showed that nitrous oxide emission rates varied from −275 to 522 μg·m−2·h−1 and methane emissions ranged from −206 to 264 μg·m−2·h−1 with overall means of 51 and 5 μg·m−2·h−1 for N2O-N and CH4, respectively. Compared with the control, charcoal and lupine plots had elevated nitrous oxide emissions. Plots amended with charcoal showed on average greater methane uptake than was emitted. While this study provides insights regarding nitrous oxide and methane emission levels from smallholder farms, studies of longer durations are needed to verify the results.

1. Introduction

Existing literature shows that the burning of fossil fuel is responsible for the lion’s share of the world’s Greenhouse Gas (GHG) (CH4, CO2, and N2O) emissions [1]. In line with this, Africa’s contribution to global warming is reported to be very small, making Africa accountable for only less than 3.7% of the global fossil fuel emissions [2]. As a result, the African continent seeks climate funds to compensate for damages due to global warming due to greenhouse gases primarily emitted by developed countries [3].
The major source of greenhouse gas emission in Africa comes primarily from land use change, such as the clearing of forestlands to agricultural uses. Canadell et al. [2] estimated Africa’s share of global CO2 emission due to land use change at 17% for the period between 2000 and 2005. With increases in the need for agricultural land due to population pressure, deforestation is severe, especially in Sub-Saharan Africa [4,5]. Several studies have also shown that the deforestation of tropical forests contributes a significant proportion of global anthropogenic greenhouse gas emissions [4,5,6]. However, while deforestation is severe in Africa, its contribution of GHG emissions is not well documented, and spatial and temporal GHG emissions yet remain less understood [7]. Such information is critical in order to seek effective climate mitigation strategies.
Smith et al. [8] estimated that agriculture contributes 52% to 84% of the world’s combined anthropogenic methane and nitrous oxide emissions. However, reports also show that agricultural soils can act both as sources and sinks of greenhouse gasses [8,9,10], and thus greenhouse gasses vary greatly both spatially and temporally depending on different factors, e.g., soil, climate, and landuse [7,11,12,13].
Biochar or charcoal soil amendments are one of the options recommended for reducing nitrous oxide emissions from agricultural fields through their effects which control the rates of transformation and/or release of nitrogen compounds in the soil [14,15,16]. Cayuela et al. [17] found that biochar decreased nitrous oxide emissions by up to 54% under field and laboratory conditions, however, they also reported that the effect of biochar amendments on soil nitrous oxide emissions was dependent upon feedstock sources used to prepare the biochar and the pyrolysis temperature at which the biochar was produced.
The effect of biochar on methane emission, however, is not clear. Several studies, for example, a study by Karhu et al. [18] in Finland with colder temperatures and Zhang et al. [19] on paddy rice soils in China, observed reduced methane emissions from biochar amended soils. In contrast, however, increased methane emissions from biochar treated soils have also been reported [15,16]. Several studies in different parts of the world reported that biochar promotes the uptake of methane resulting in negative fluxes [18,20]. In contrast, however, positive emissions were also reported by [16,19]. Zhang et al. [19] suggested that while biochar could have an immediate effect on nitrous oxide emissions, its effect on methane emissions could take longer periods. The production of N2O in soil is mainly due to microbial activity [7]. Nitrous oxide (N2O) is produced as a result of nitrification processes particularly in soils with low oxygen levels (reduced conditions) [21] and during de-nitrification processes during which nitrate is reduced to N2O and N2 under anaerobic conditions. As a result, nitrous oxide emissions are regulated by soil nitrogen status (organic and inorganic N sources in the soil) [20]. Moreover, nitrous oxide emissions are reported to increase with increases in temperature [22].
In the Ethiopian highlands, lupine is commonly used to improve the fertility of less productive agricultural and marginal lands. However, while legumes are known to increase the soil organic matter status of degraded soils through nitrogen fixation [23,24], their effect on nitrous oxide and methane emission needs further investigation. Studies have shown that legumes could increase nitrogen fixation and nitrous oxide emissions. Yang et al. [25] reported that soils planted with soybean emitted five times greater nitrous oxide than the control.
Therefore, this scoping study was conducted with a primary objective to assess nitrous oxide and methane emissions from smallholder agricultural soils with charcoal amendments and lupine, a deep-rooted leguminous (lupine) plant.

2. Methodology

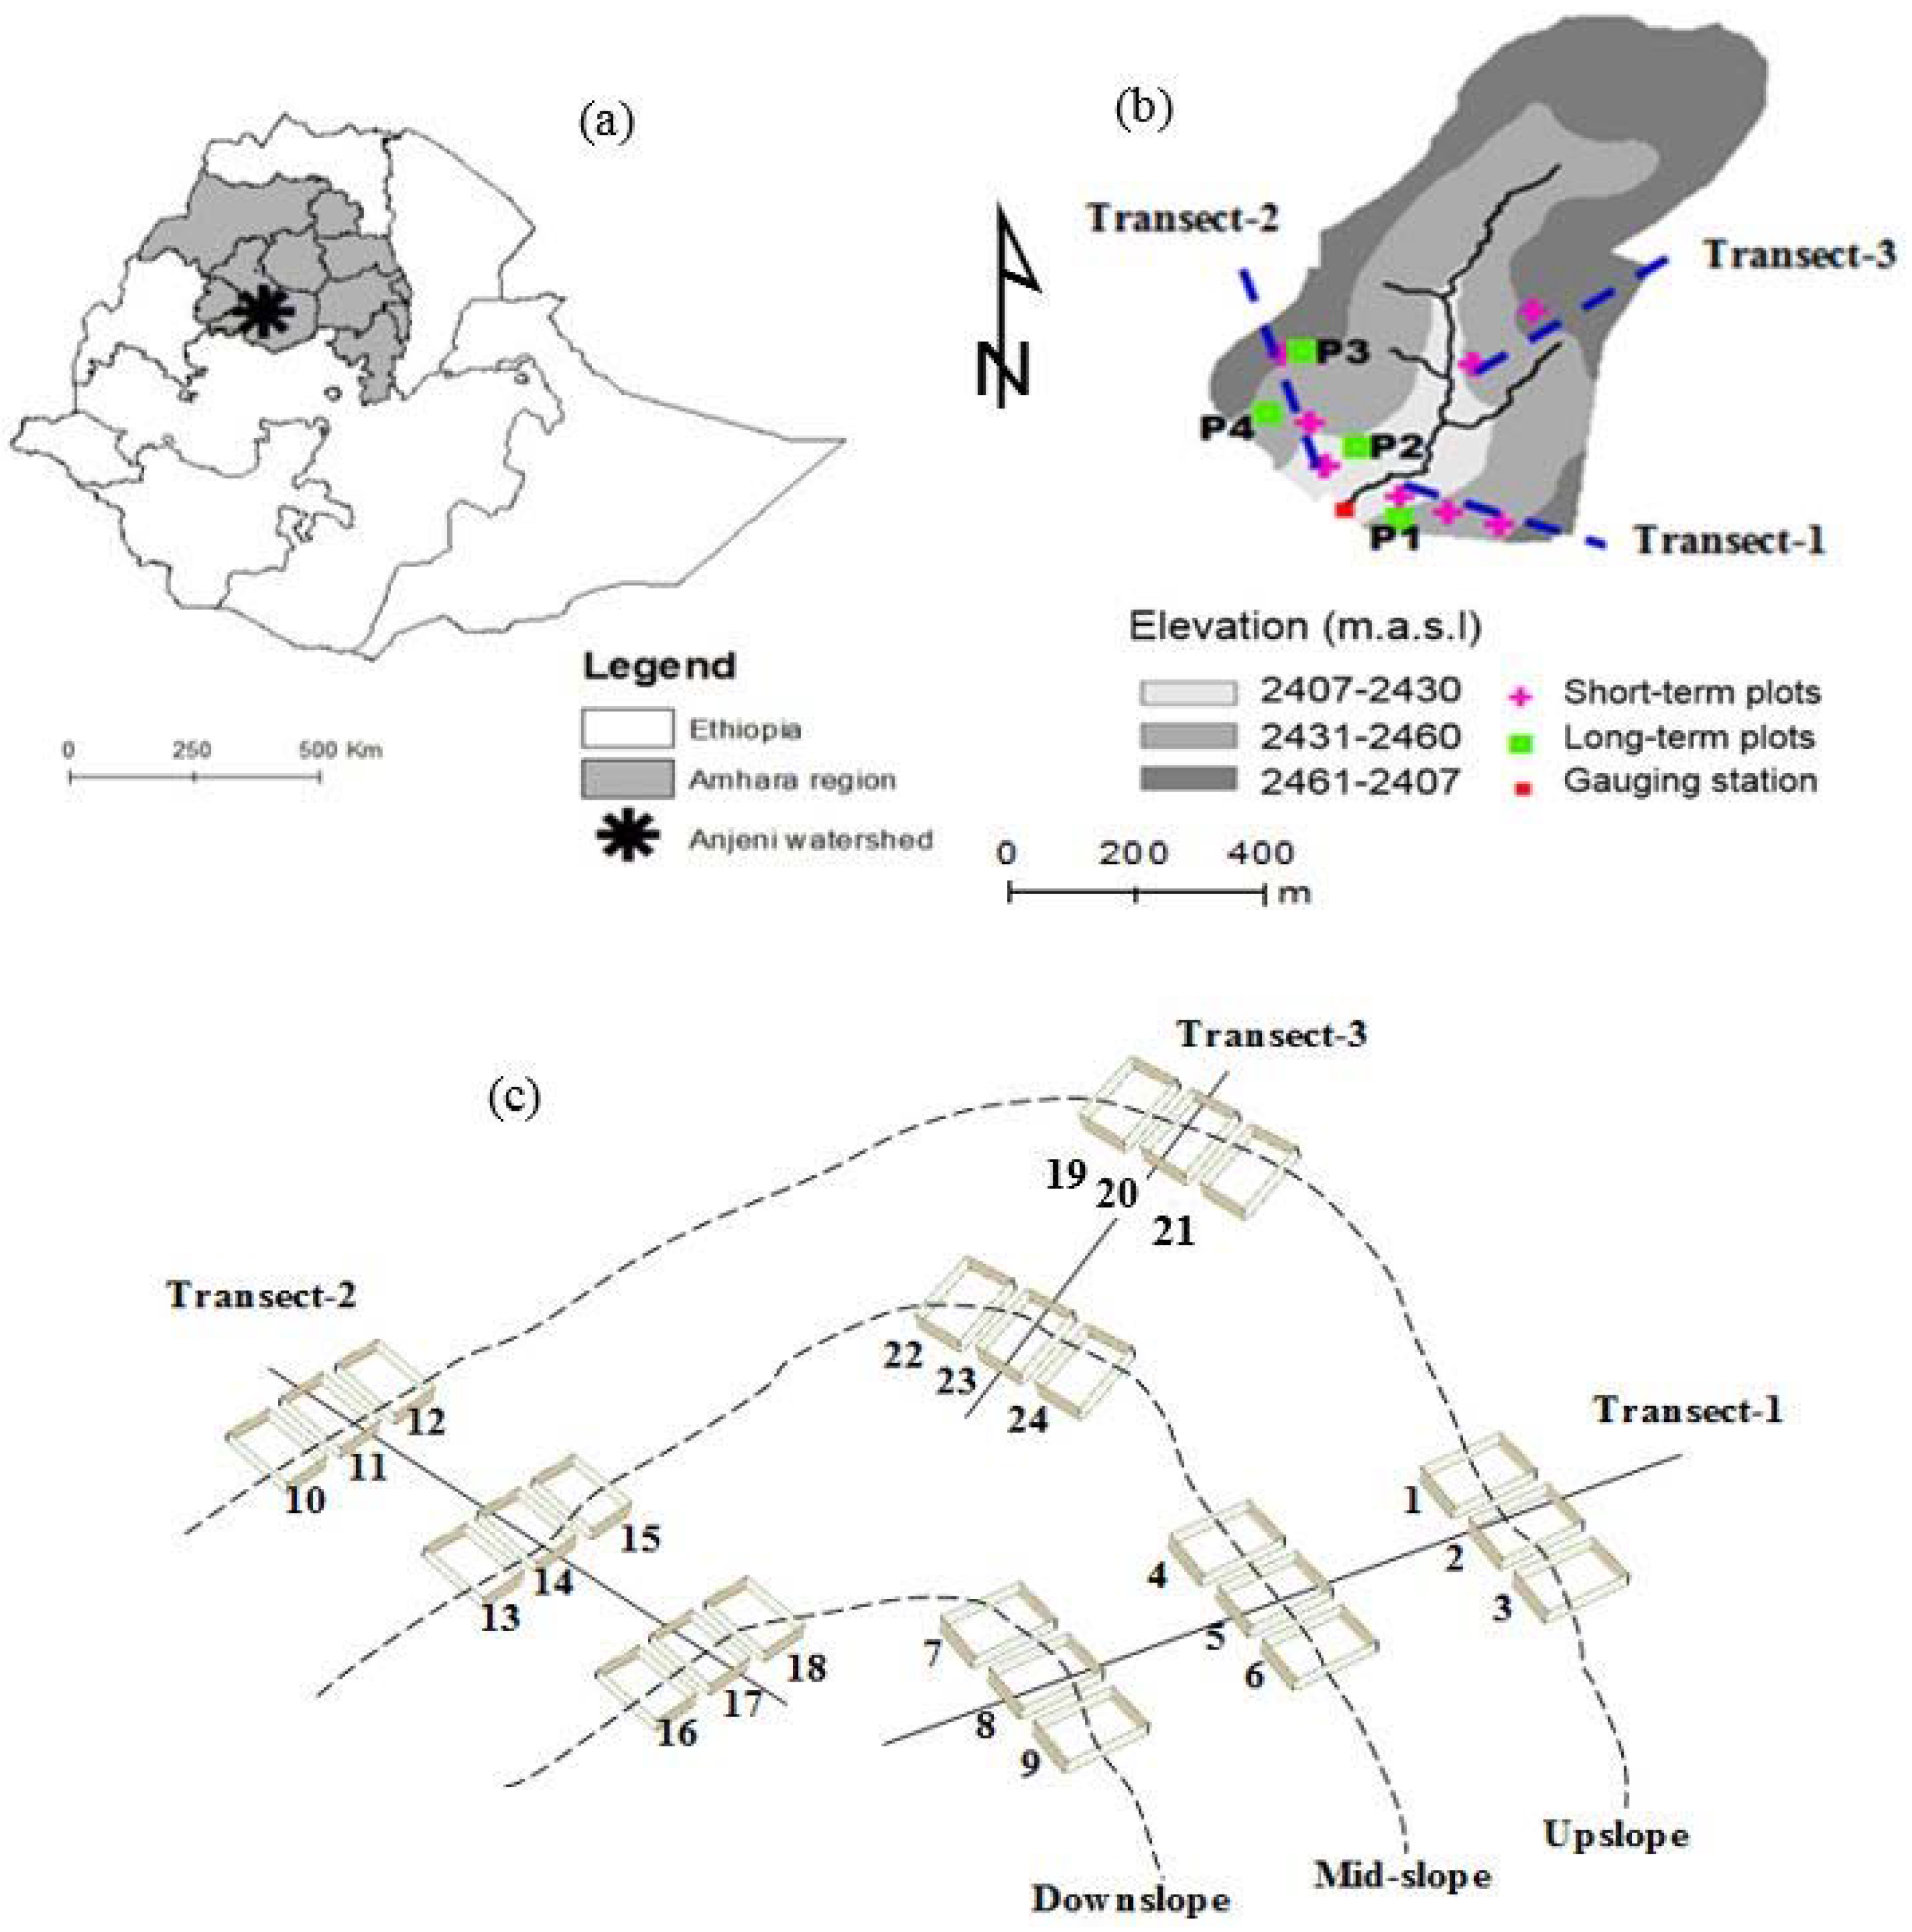
2.1. Study Site Description

The Anjeni watershed is located in the Ethiopian Highlands at 10°40′N, 37°31′E (Figure 1). The watershed total catchment area is 113 ha, with an elevation between 2407 and 2507 m [26]. Agriculture is the main land use system in the watershed, and most fields have been cultivated for longer than fifty years [27]. The soils of Anjeni have developed from the basalt and volcanic ash with major soils comprising Alisols, Nitisols, and Cambisols covering more than 80% of the watershed [27]. The deep Alisols cover the bottom part of the watershed; moderately deep Nitisols cover the mid-transitional, gently sloping parts of the watershed, while the shallow Regosols and Leptosols cover the high, steepest part of the watershed [27].

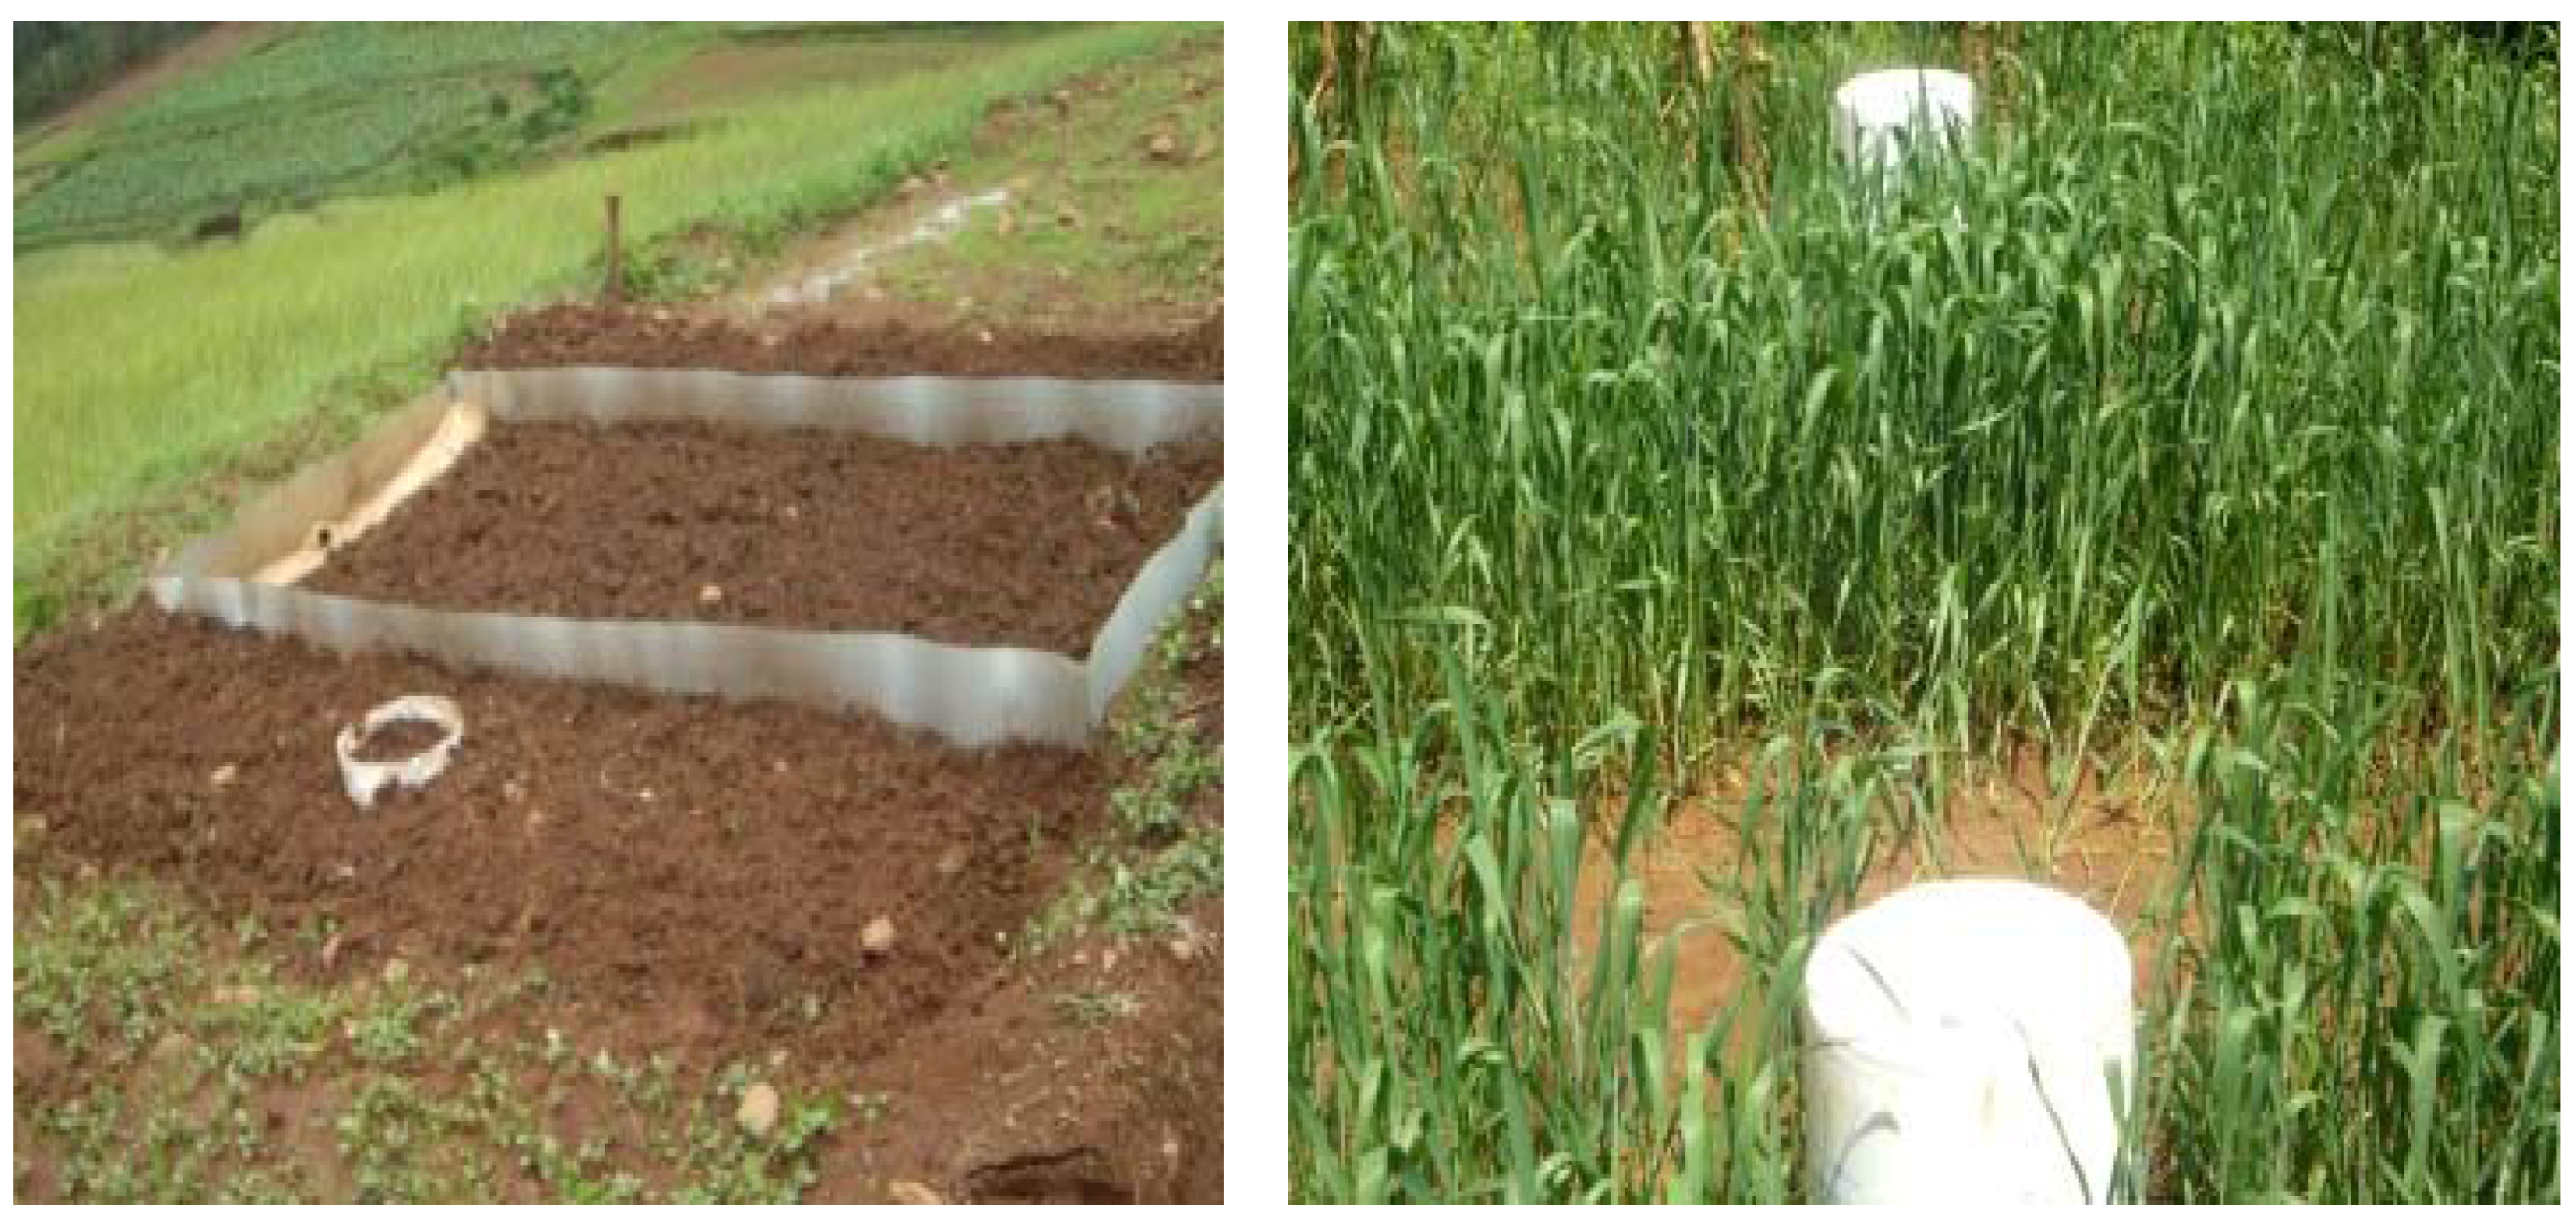
2.2. Experimental Setup

This study was conducted in parallel with another study by Bayabil et al. [29] that used the 24 runoff plots that were laid out in eight replicates (Figure 1c). Each replicate consisted of three treatments (barley grown on non-amended soils and charcoal amended soils, and a leguminous (lupine) crop grown on non-amended soil). Static chambers were installed adjacent to 24 runoff plots (15 cm far from plot boundaries) on fields with the same treatments as the runoff plots. Plots were installed along three transects that represent different soil degradation levels (Table 1). Detailed information about the setup of the plots and treatments can be found in Bayabil et al. [29,30]. Twenty-four chambers (one chamber per plot) were installed immediately after the seeding of the plots.
During the installation of static chambers, we followed the same construction procedure for the static chambers as by [31,32]. Plastic buckets (19-L volume) were cut in half, and the top part was carefully installed wide end down (5 cm below ground) using a handheld hoe (Figure 2). A removable second plastic bucket (19-L volume) fitted with sampling and vent ports and rubber bottle septum (easily penetrable by sampling syringes) was used as a top cover during the extraction of gas samples. To ensure an airtight seal between the chamber installed in the soil and the top cover, a rubber band was put around the outside part of the static chamber, on which the cover was put at the top. Similar to the one used by [32], a second septum with an aluminum pipe (5 cm length) was used to maintain air pressure equilibrium inside the chambers.

2.3. Agronomic Practices on Plots

Charcoal amendments and deep-rooted leguminous crop (lupine) were applied to plots in both 2012 and 2013, while gas samples were collected only in 2013. In 2013, only the barley plots were tilled (three times between the end of May to the middle of June) and seeded. Lupine seeds were sown on untilled plots, which is a more common practice in the area [29]. Also in line with farmer practices, all barley plots were fertilized with 100 kg/ha Di-Ammonium Phosphate (DAP; 46% nitrogen, 23% phosphorous, and 21% potassium) during seeding (middle of June), and 100 kg/ha of Urea was applied one month after sowing. Lupine plots were not fertilized.
Charcoal was applied on charcoal-amended barley plots, at a fixed rate of 12 ton/ha during tillage in 2012 and 2013. Charcoal was prepared from Eucalyptus camaladulensis and manually crushed to obtain relatively uniform particle size (2 mm diameter) and then manually incorporated on the top 20 cm of the soil (more details can be found in Bayabil et al. [28,30]).

2.4. Gas Sampling and Flux Calculation

Field sampling campaigns were conducted in 2013 before, during, and at the end of the rainy monsoon phase that lasts from June to September. During each sampling campaign, samples were collected from all 24 chambers the same day and sampling lasted usually between 10:00 a.m. to 4:00 p.m. Basal area and volume of the collar and chamber, when the chamber was deployed in the field, were 0.06 m2 and 0.02 m3, respectively. Four samples were extracted from each chamber at 10 min interval (0, 10, 20, and 30 min). A 15 mL volume syringe was used to extract gas samples from the static chambers. Samples were then put into 10 mL volume pre-evacuated and air tight sealed glass vials. Gas samples were then shipped to the USA for laboratory analysis and were analyzed in the soil and water lab at Cornell University. Concentrations of N2O and CH4 in the samples were determined using Agilent Technologies (Santa Clara, CA, USA) 6890N gas chromatograph fitted with an ECD detector, and operated using a 44-slot Agilent 7694 headspace sampler that has a 95% confidence interval detection limit of ±10.2 μg·N2O-N·m−2·h−1 [31]. Finally, N2O and CH4 fluxes from each chamber from a given day were computed by calculating the slope of a linear regression model by fitting concentrations vs. sampling time and using Equation (1) below:
F g = ( Δ C Δ t ) ( V c A c ) ( M G V G )
where F g is the nitrous oxide or methane flux in μg·m−2·h−1, Δ C Δ t is the slope of the linear regression model (by fitting gas concentration vs. sampling time), Vc is the volume of chamber in m3, Ac is the area of the chamber at the base in m2, MG is the molecular mass of gas (nitrous oxide or methane in g·mol−1), and Vm is the molar volume of gas (in m3·mol−1) at chamber pressure and temperature.
In addition, soil temperature was measured at 5 cm depth using a Taylor TruTempinstant read digital thermometer (Taylor Precision Products Inc., Seattle, WA, USA) during the field campaigns.

3. Results and Discussions

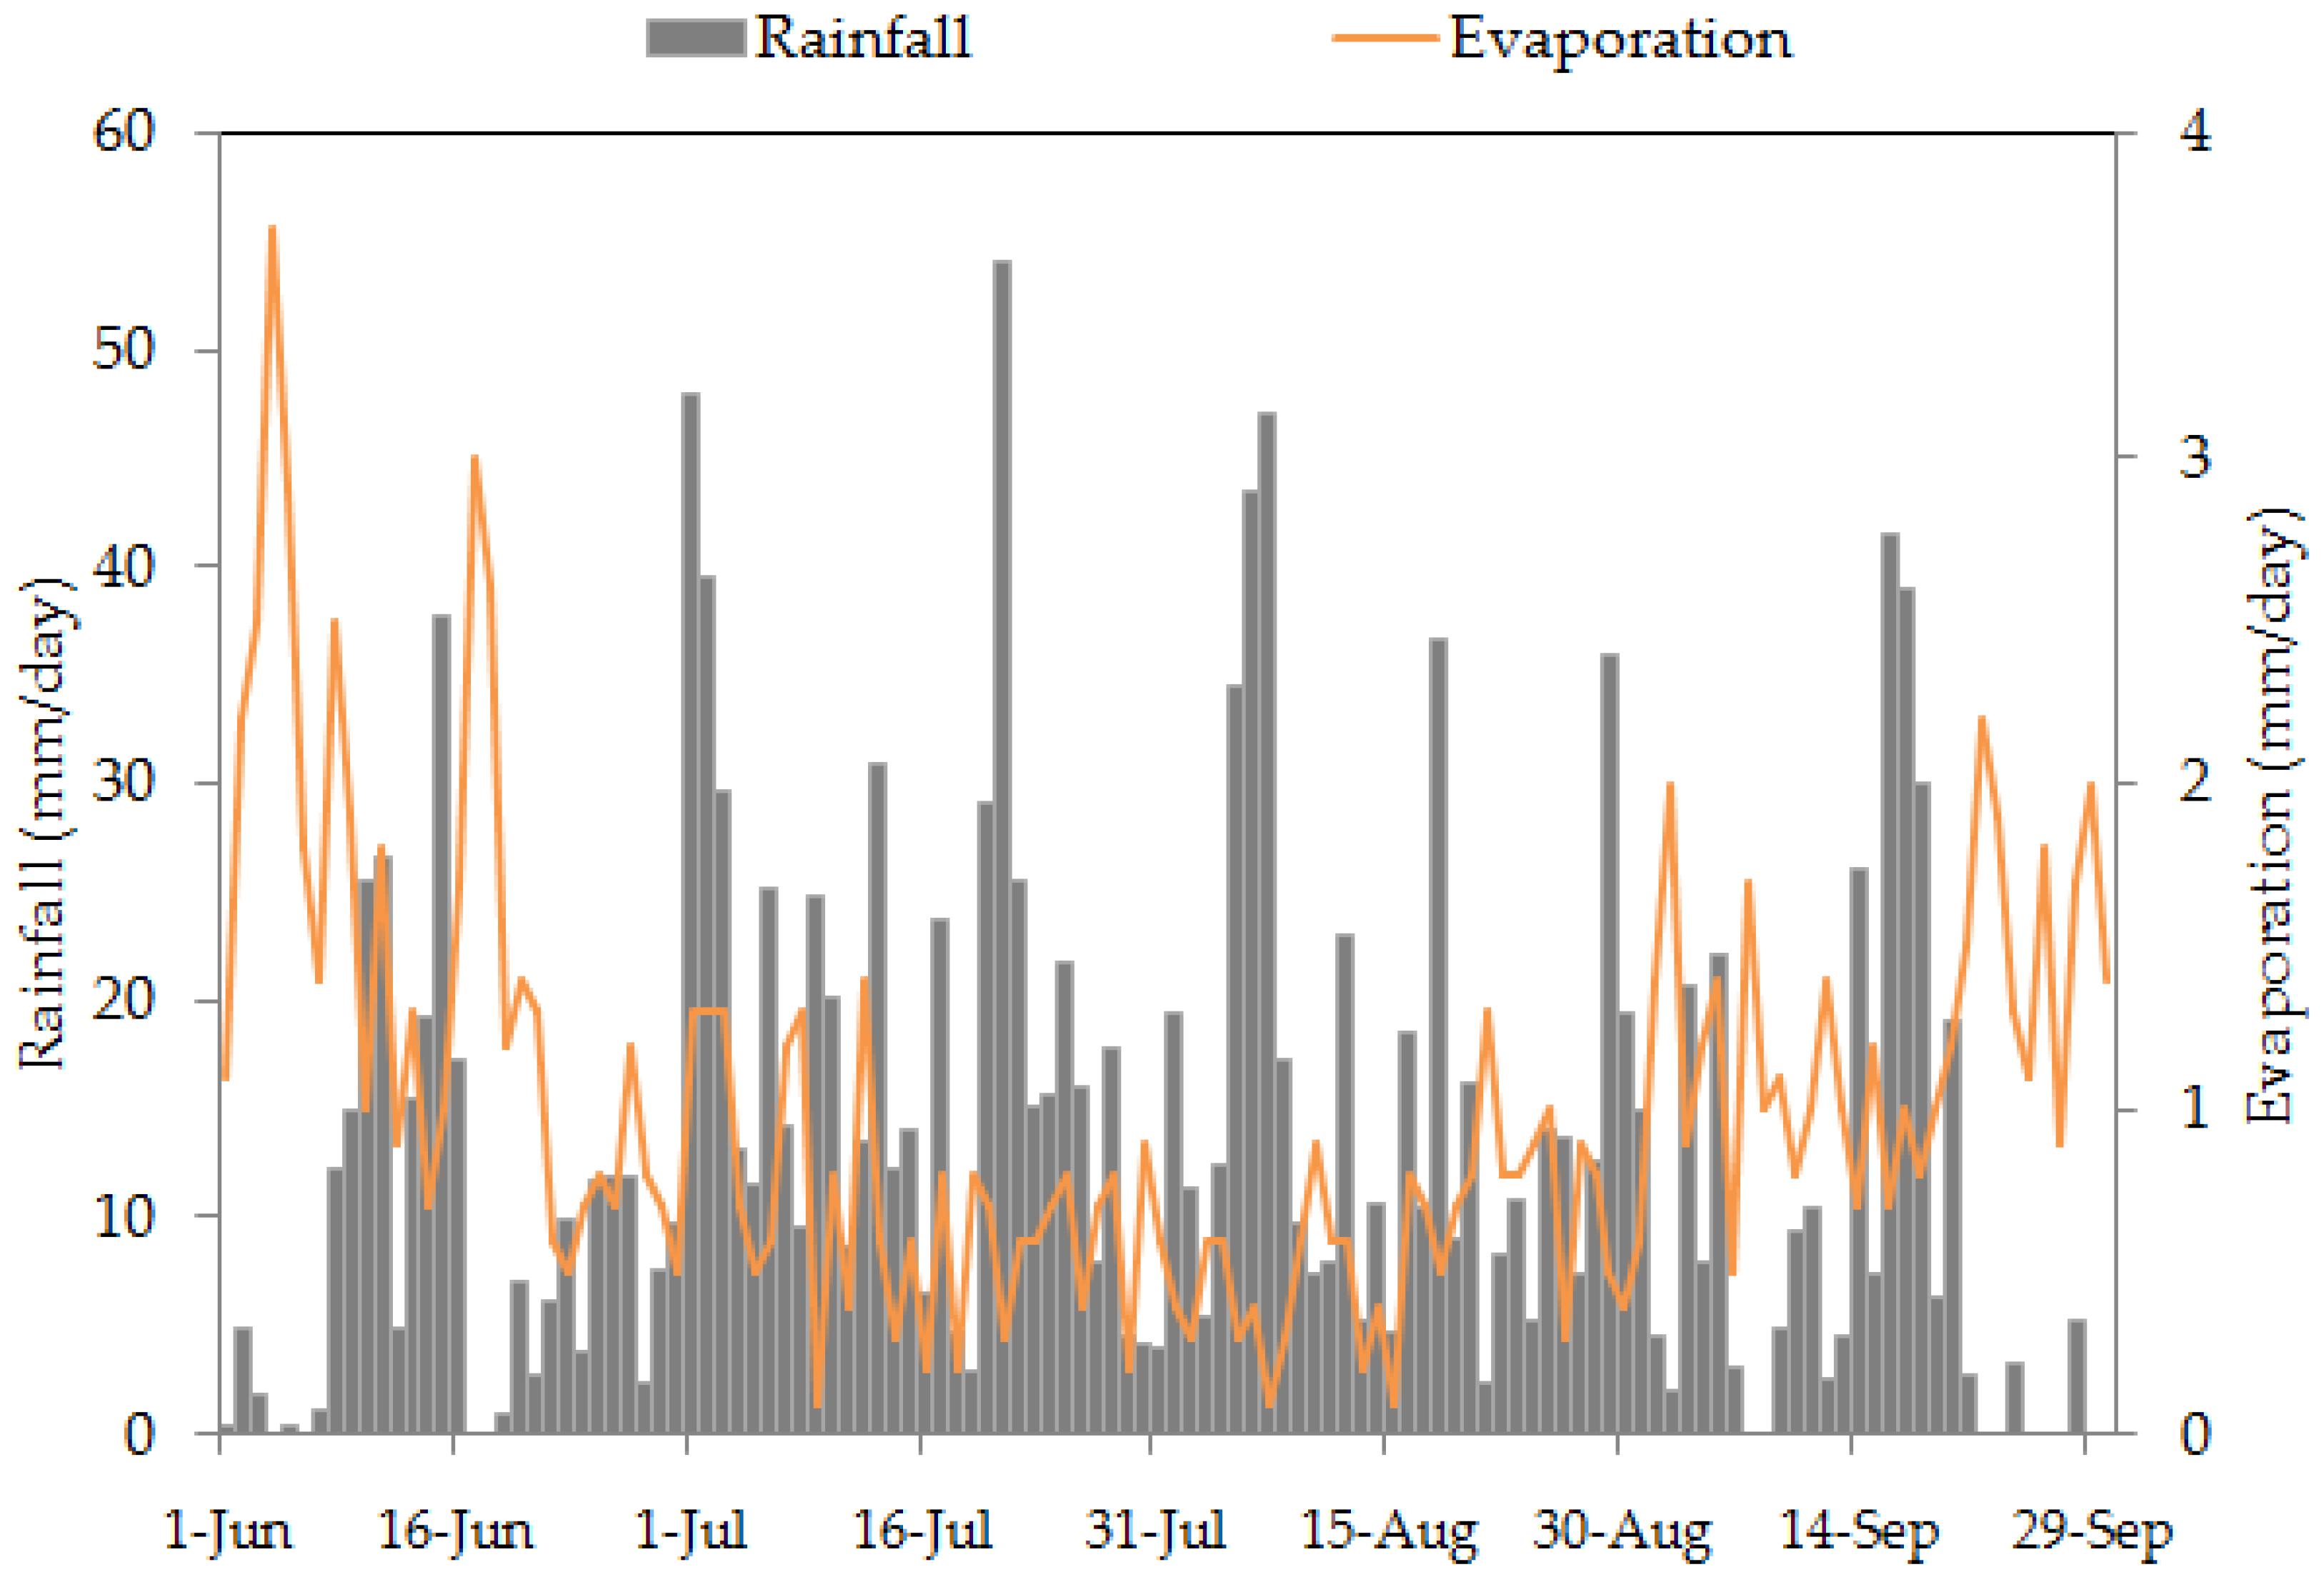
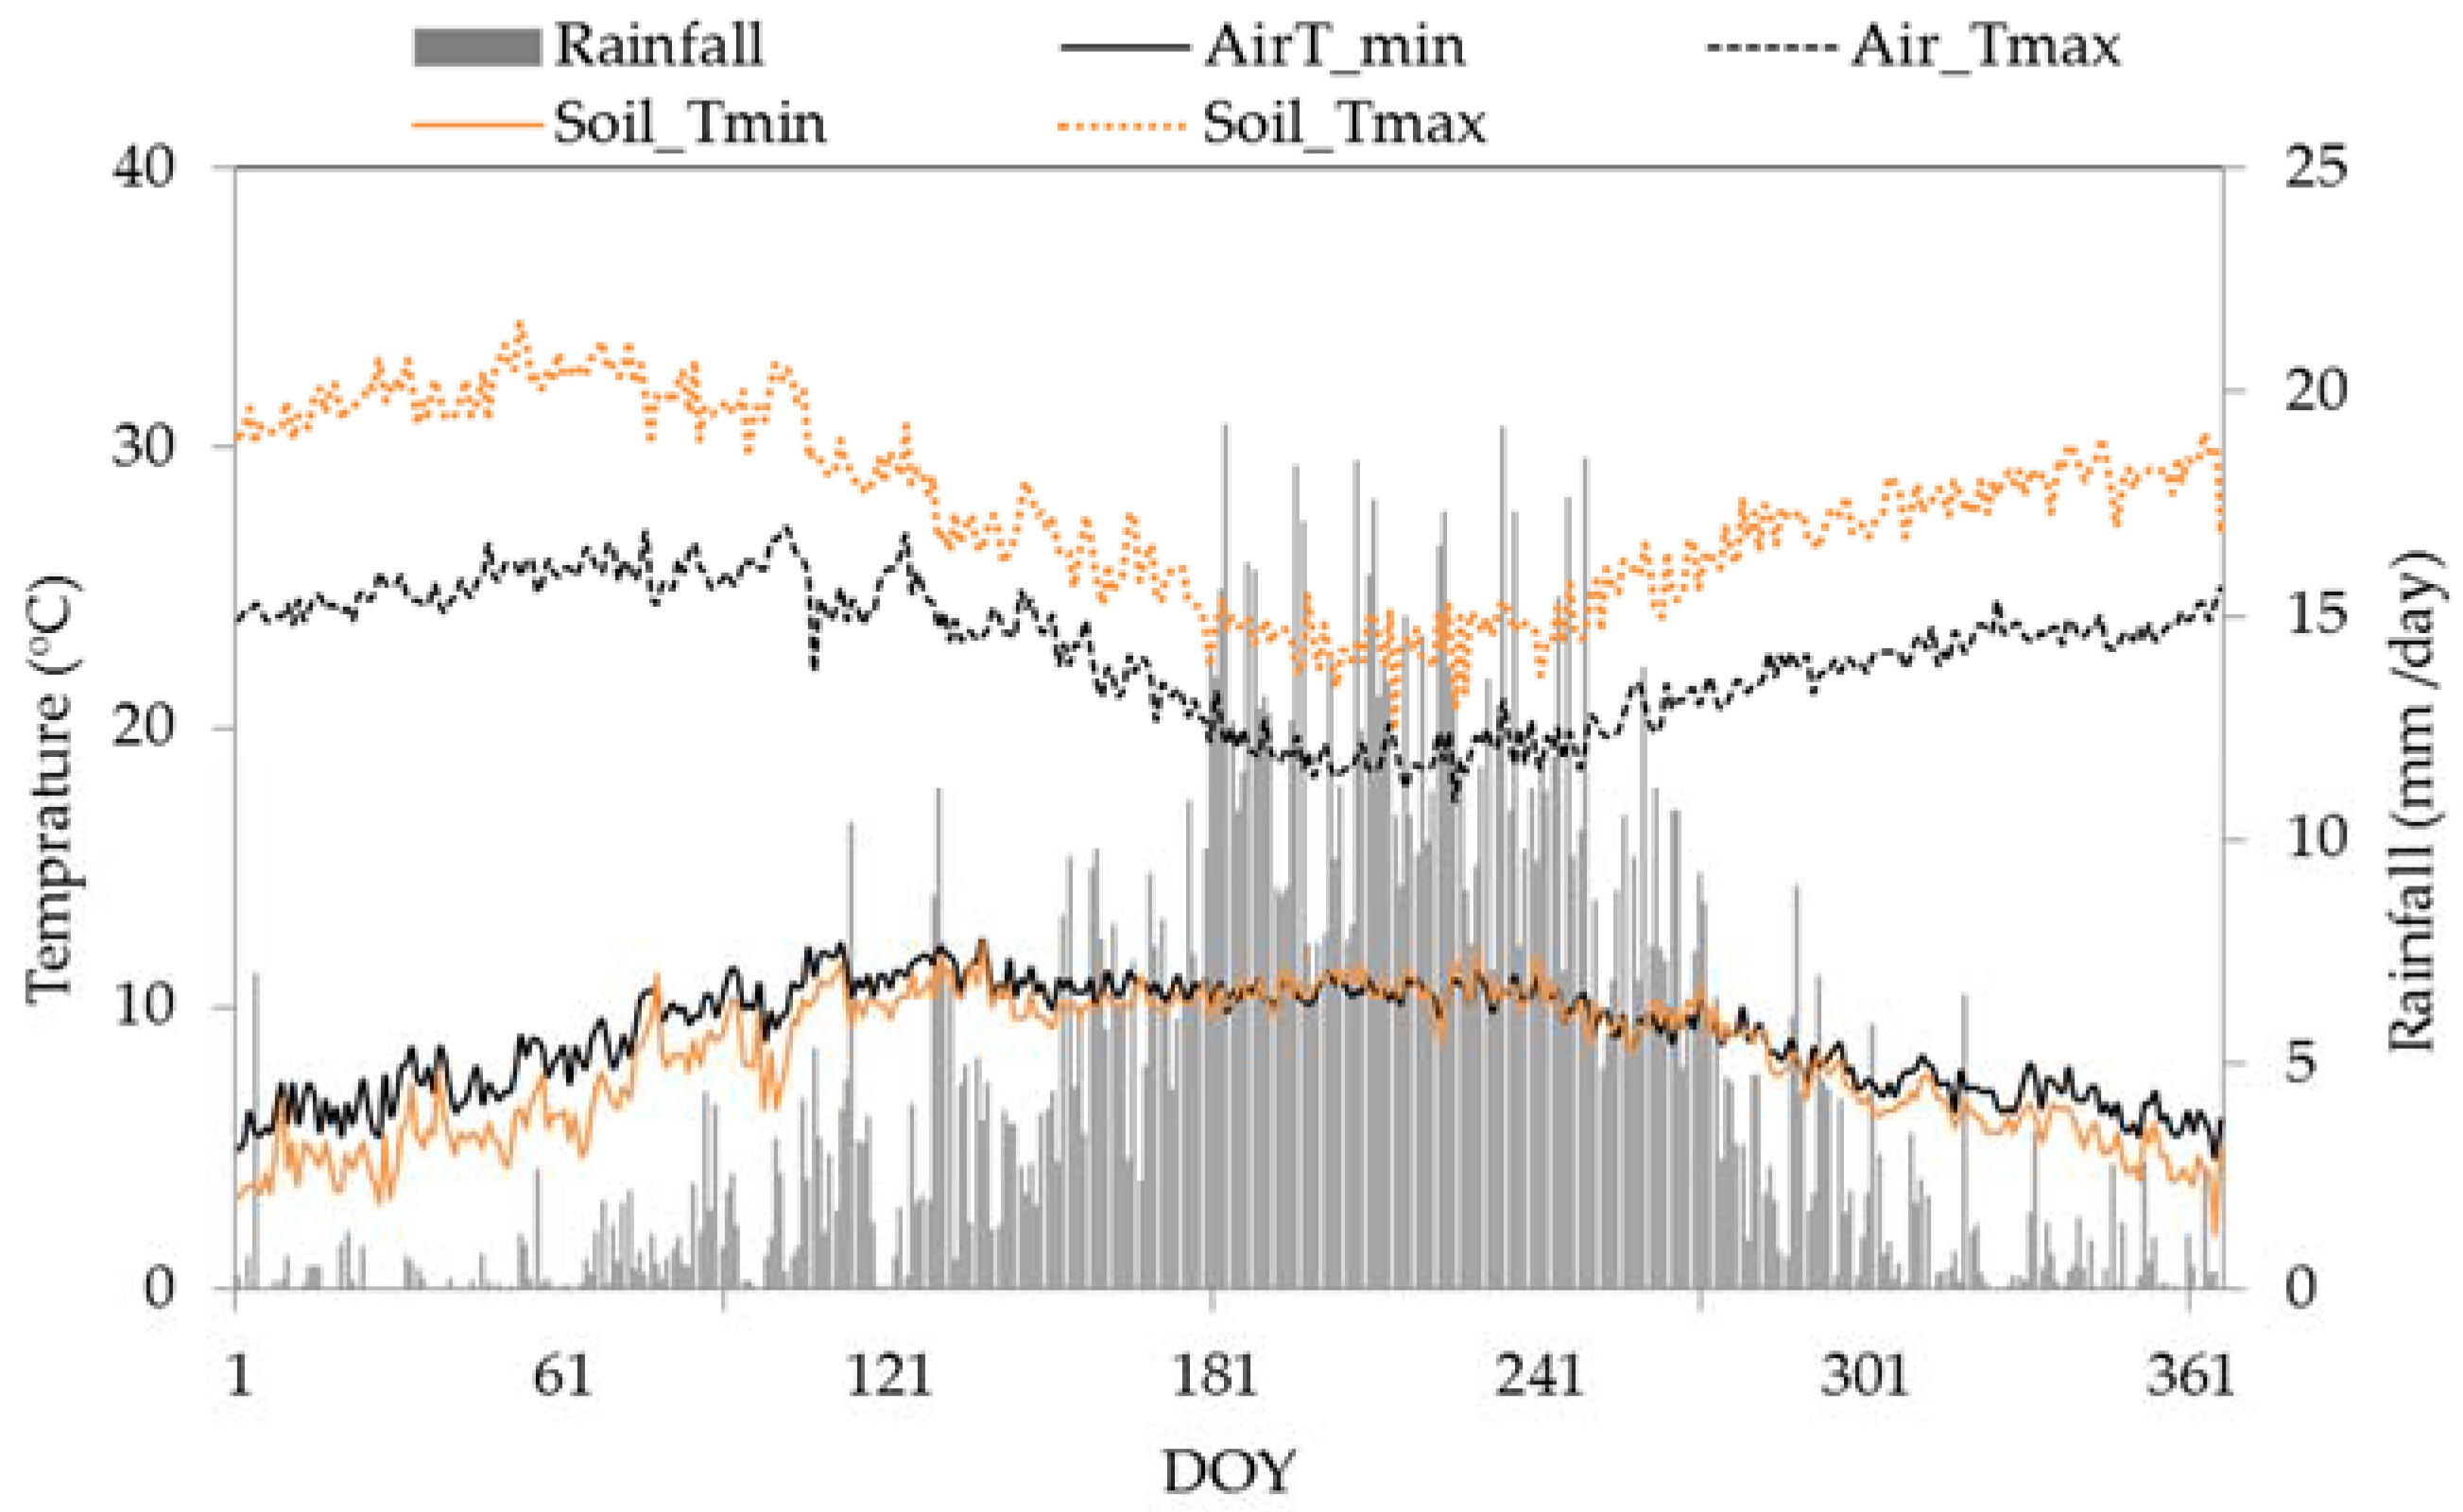
3.1. Weather Characteristics

Results based on seven years (1989–1995) of daily weather (rainfall, minimum and maximum air temperature, and minimum and maximum soil temperature) records show that the watershed receives, on average, 1610 mm of annual precipitation. However, seasonal rainfall distribution is not uniform; the rainfall has a unimodal rainfall distribution (Figure 3). On average, minimum and maximum air temperature ranges between 5–12 and 17–27 °C, respectively; while average minimum and maximum soil temperature at 5 cm depth ranges between 2–12 and 20–34 °C, respectively. The monsoon (rainy) phase lasts for four months (June to September) and, on average, accounts for up to 75% of the annual precipitation in the watershed; while during the rest of the year rainfall is not common and soils are excessively dry. Daily rainfall and evaporation records during the 2013 monsoon phase are presented in Figure B1 in Appendix B.

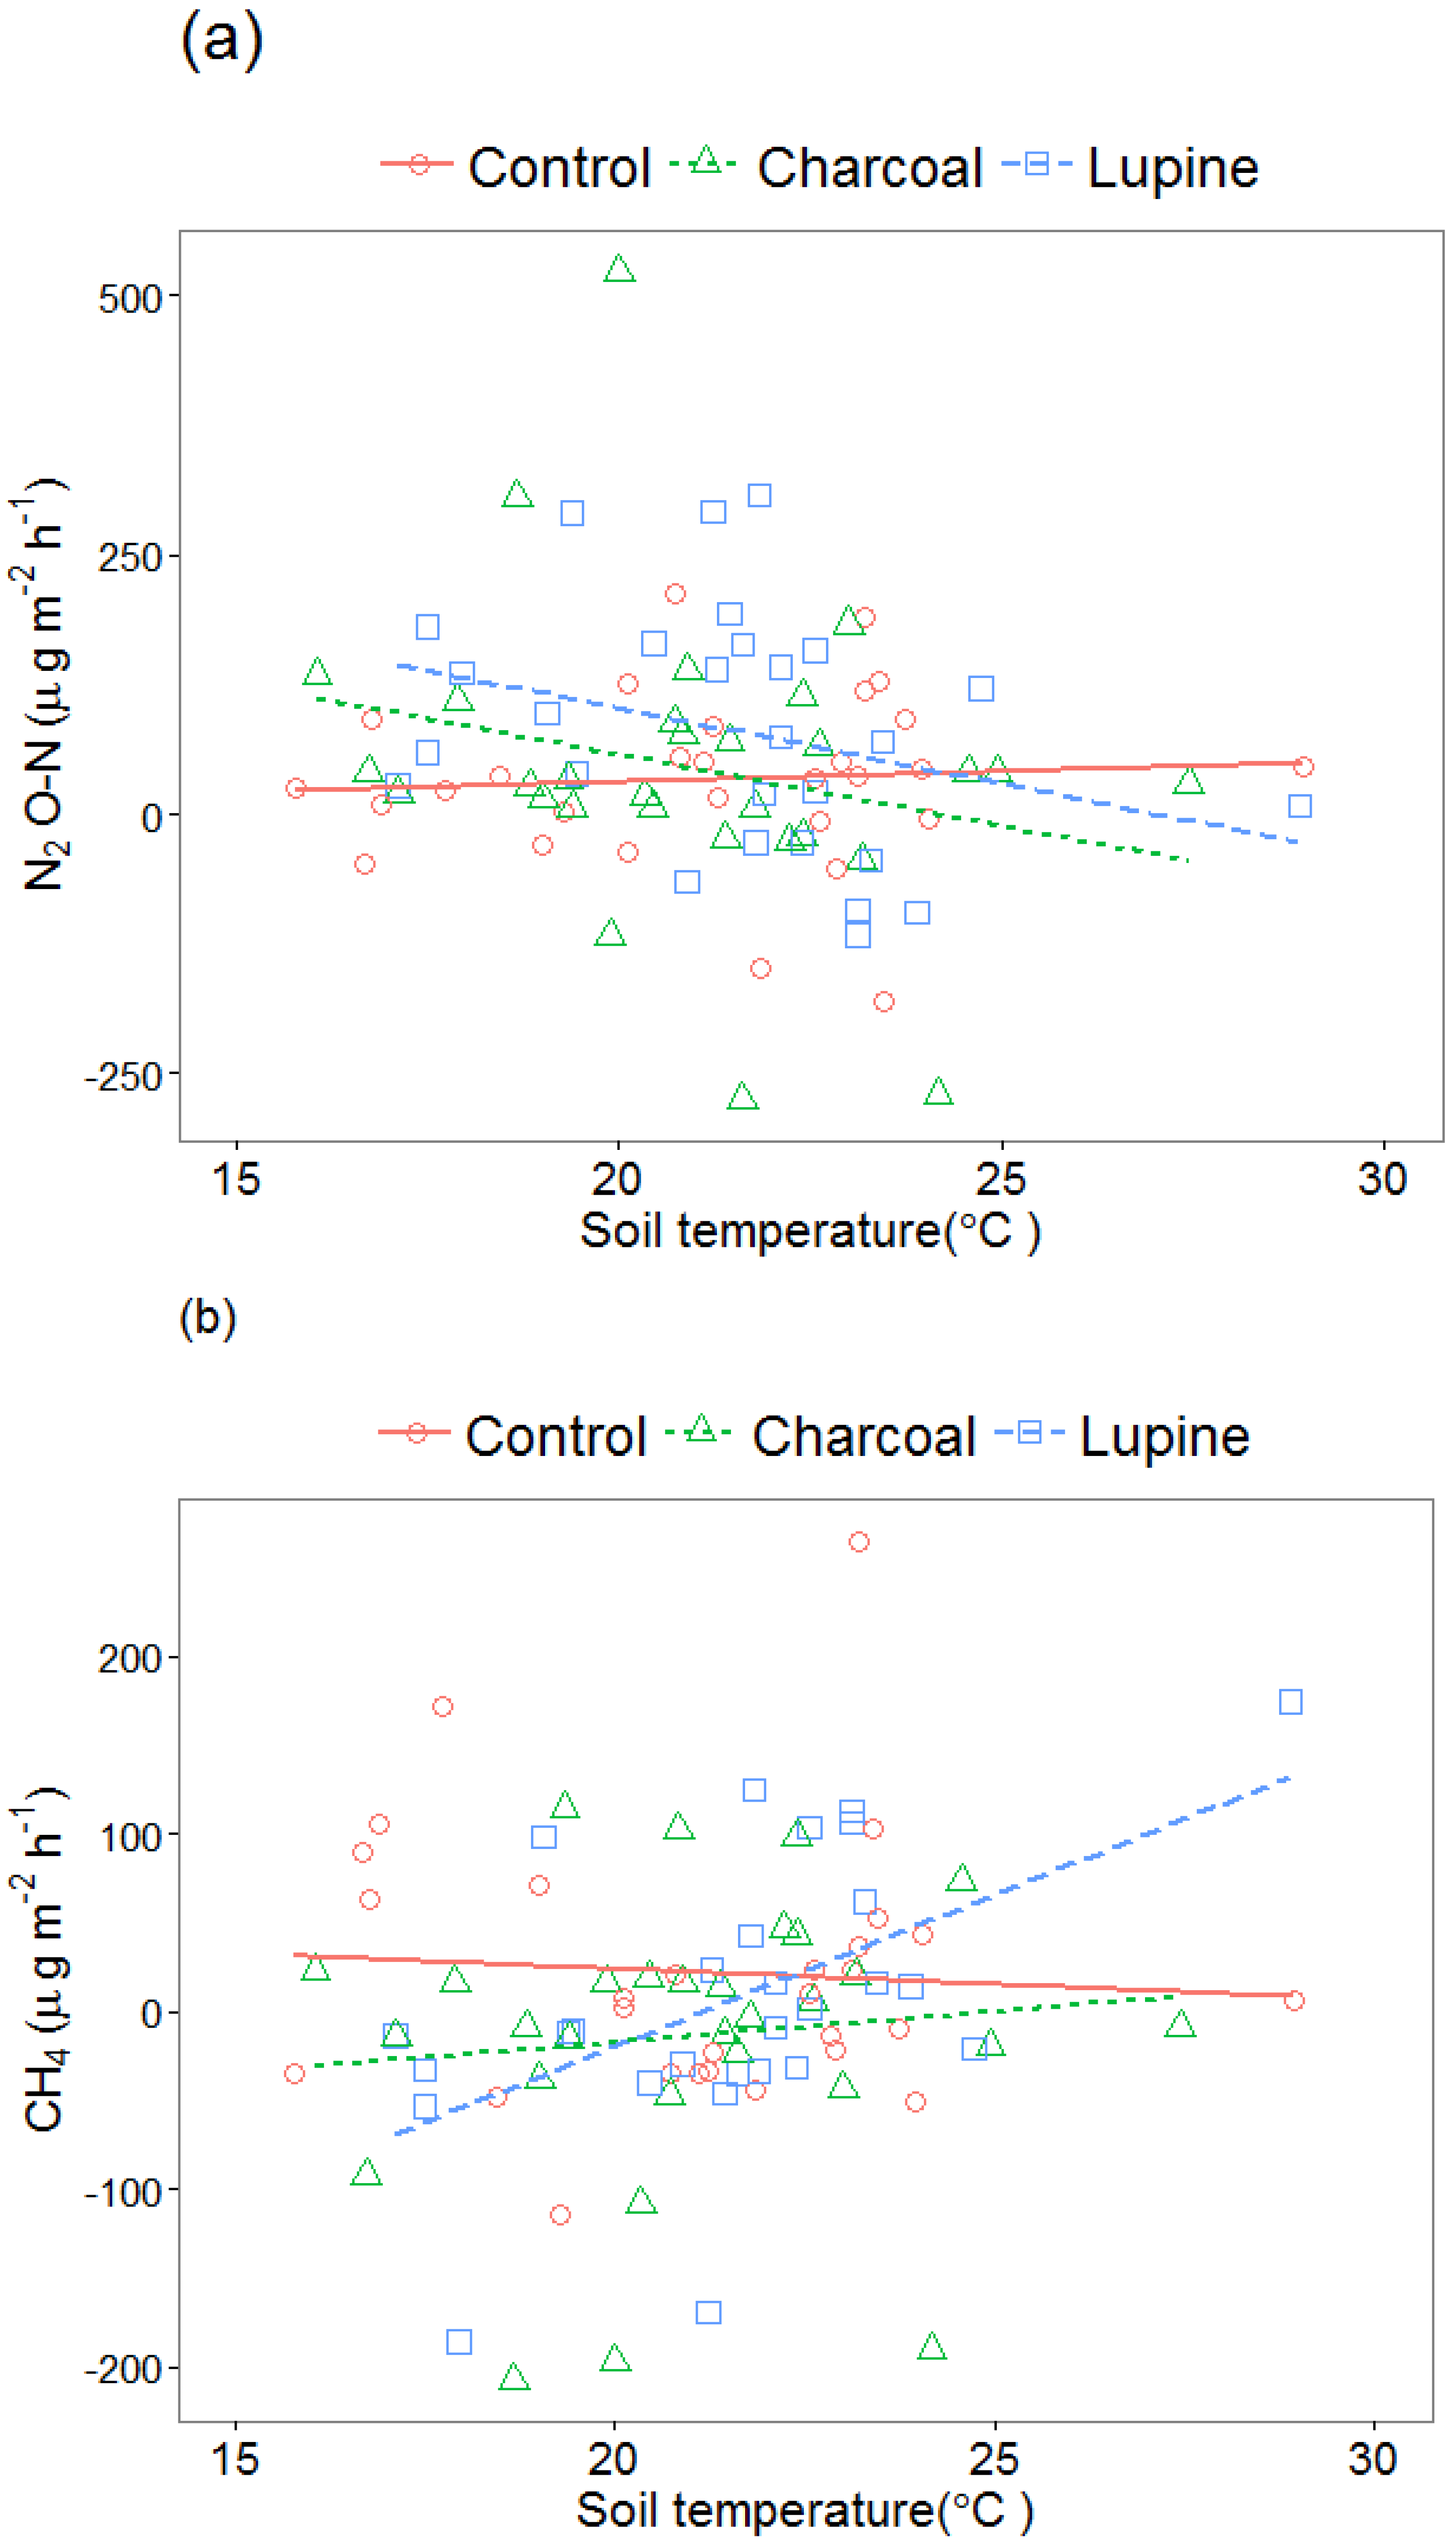
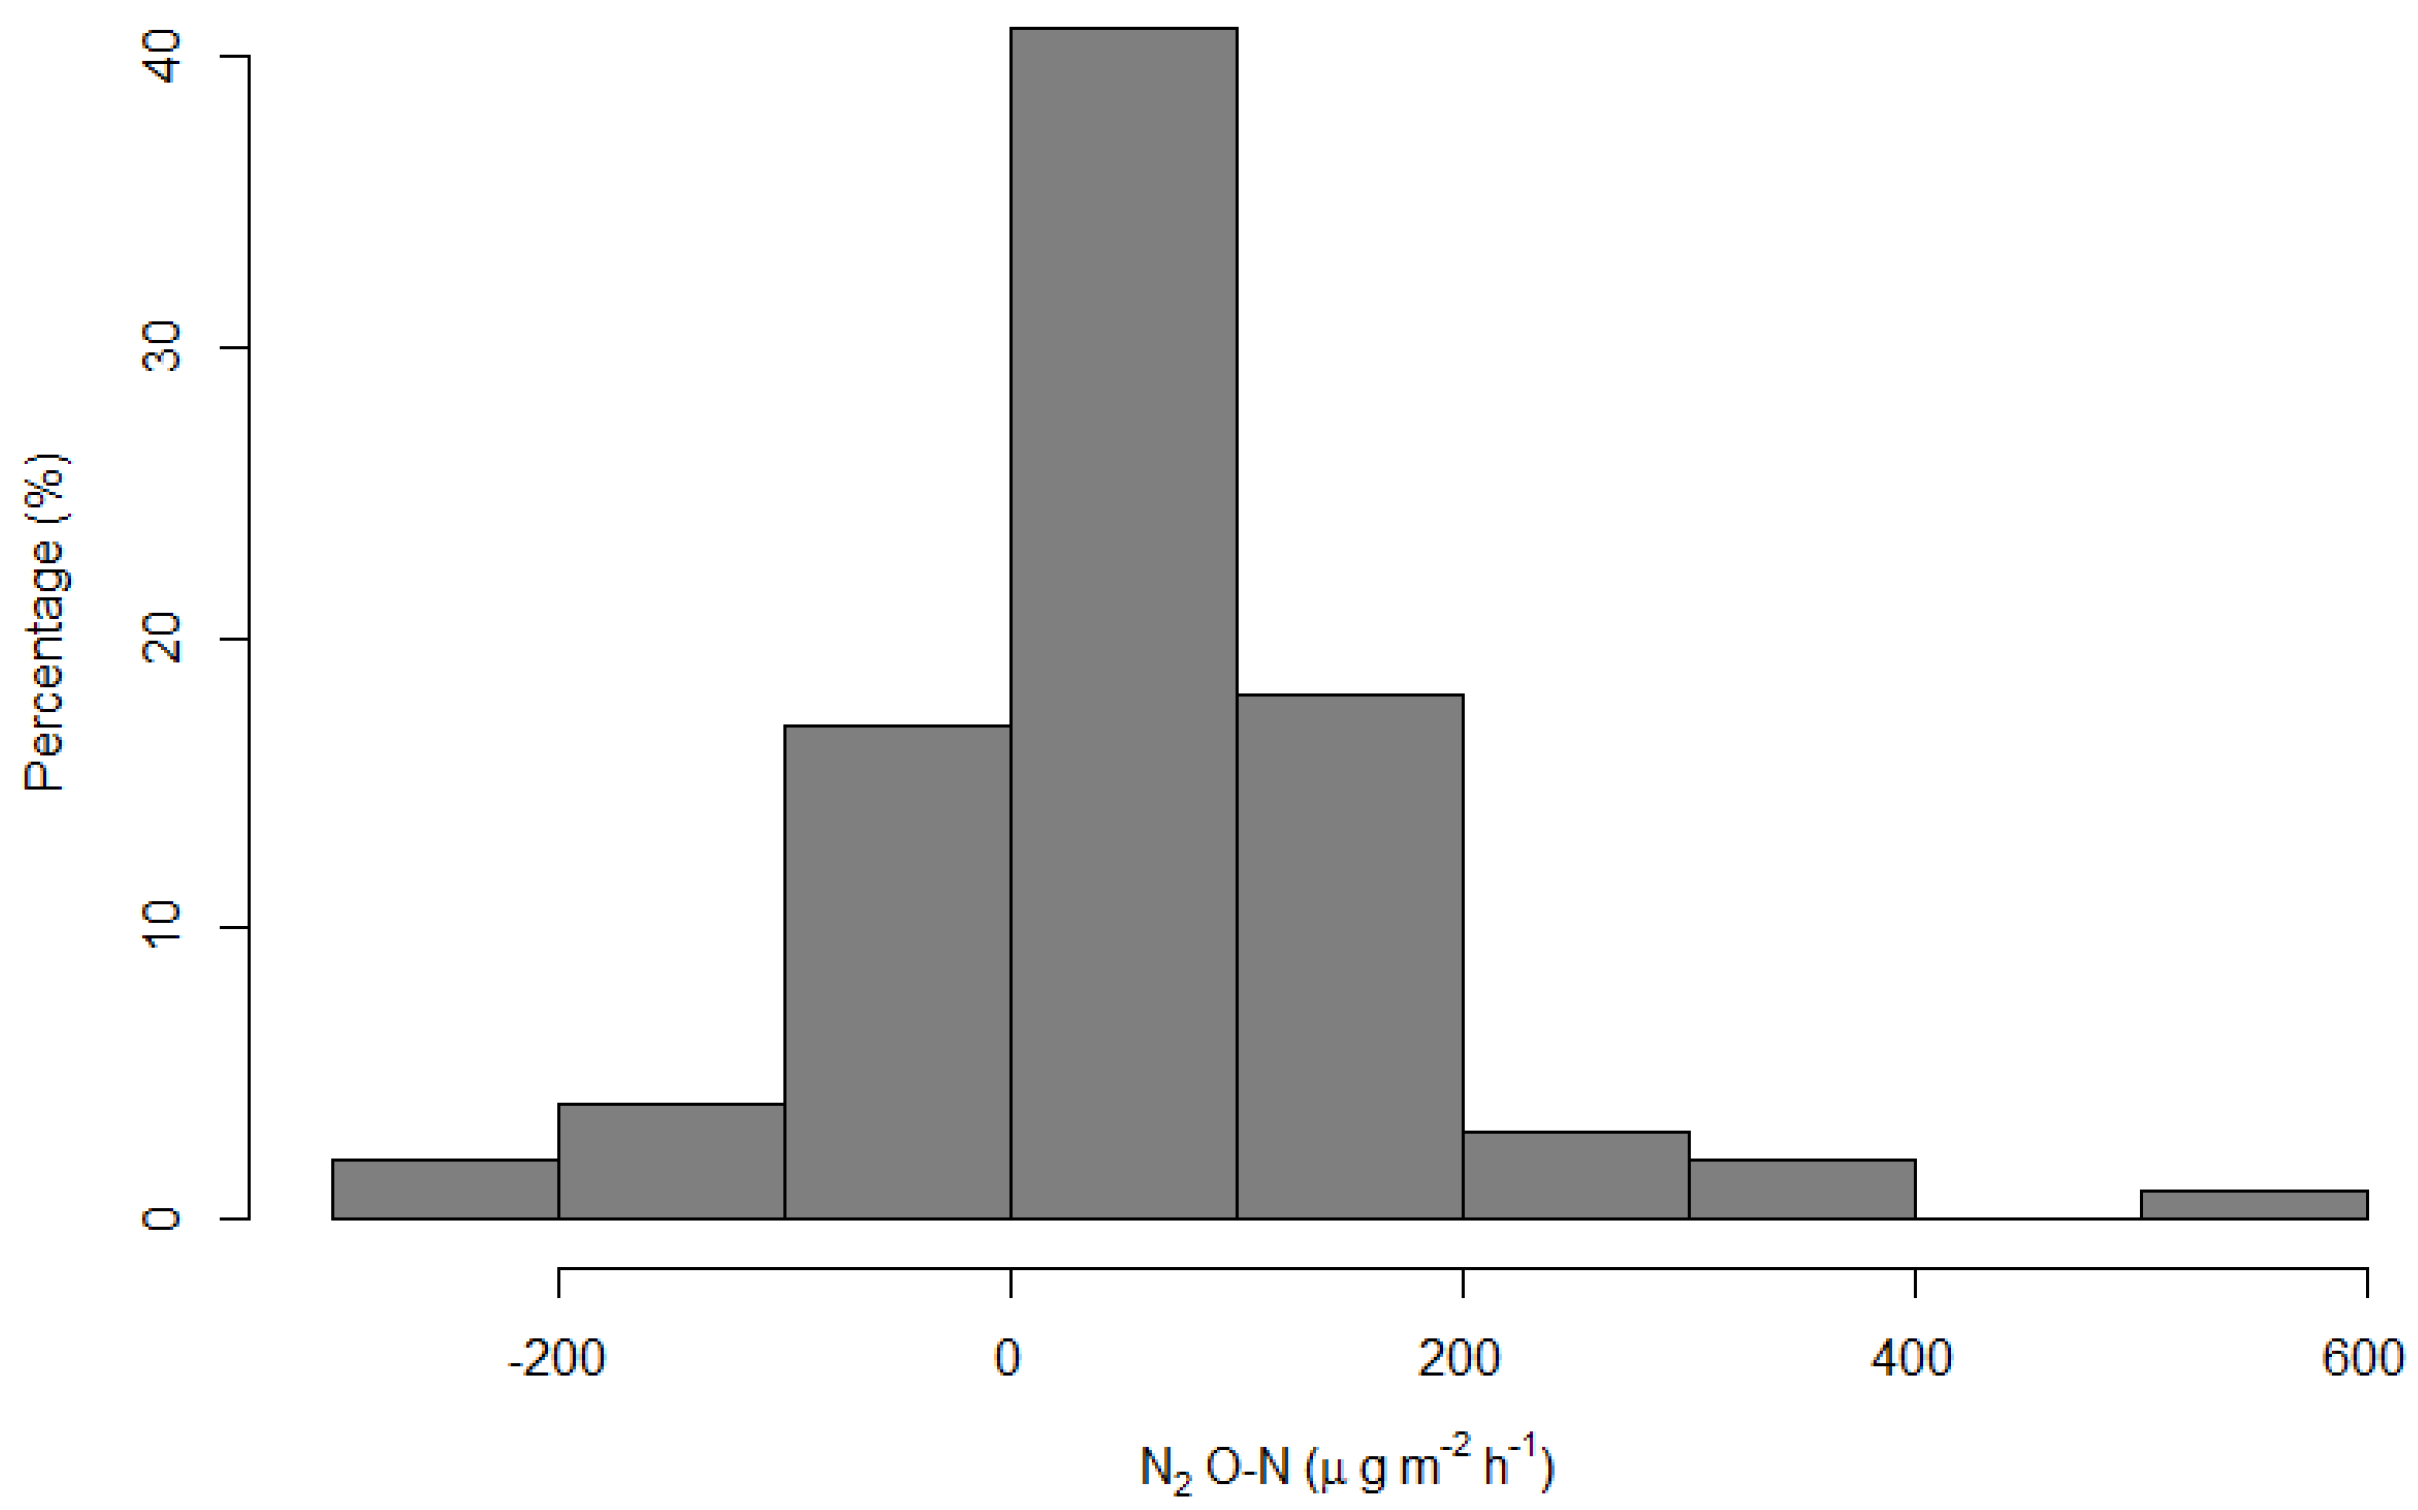
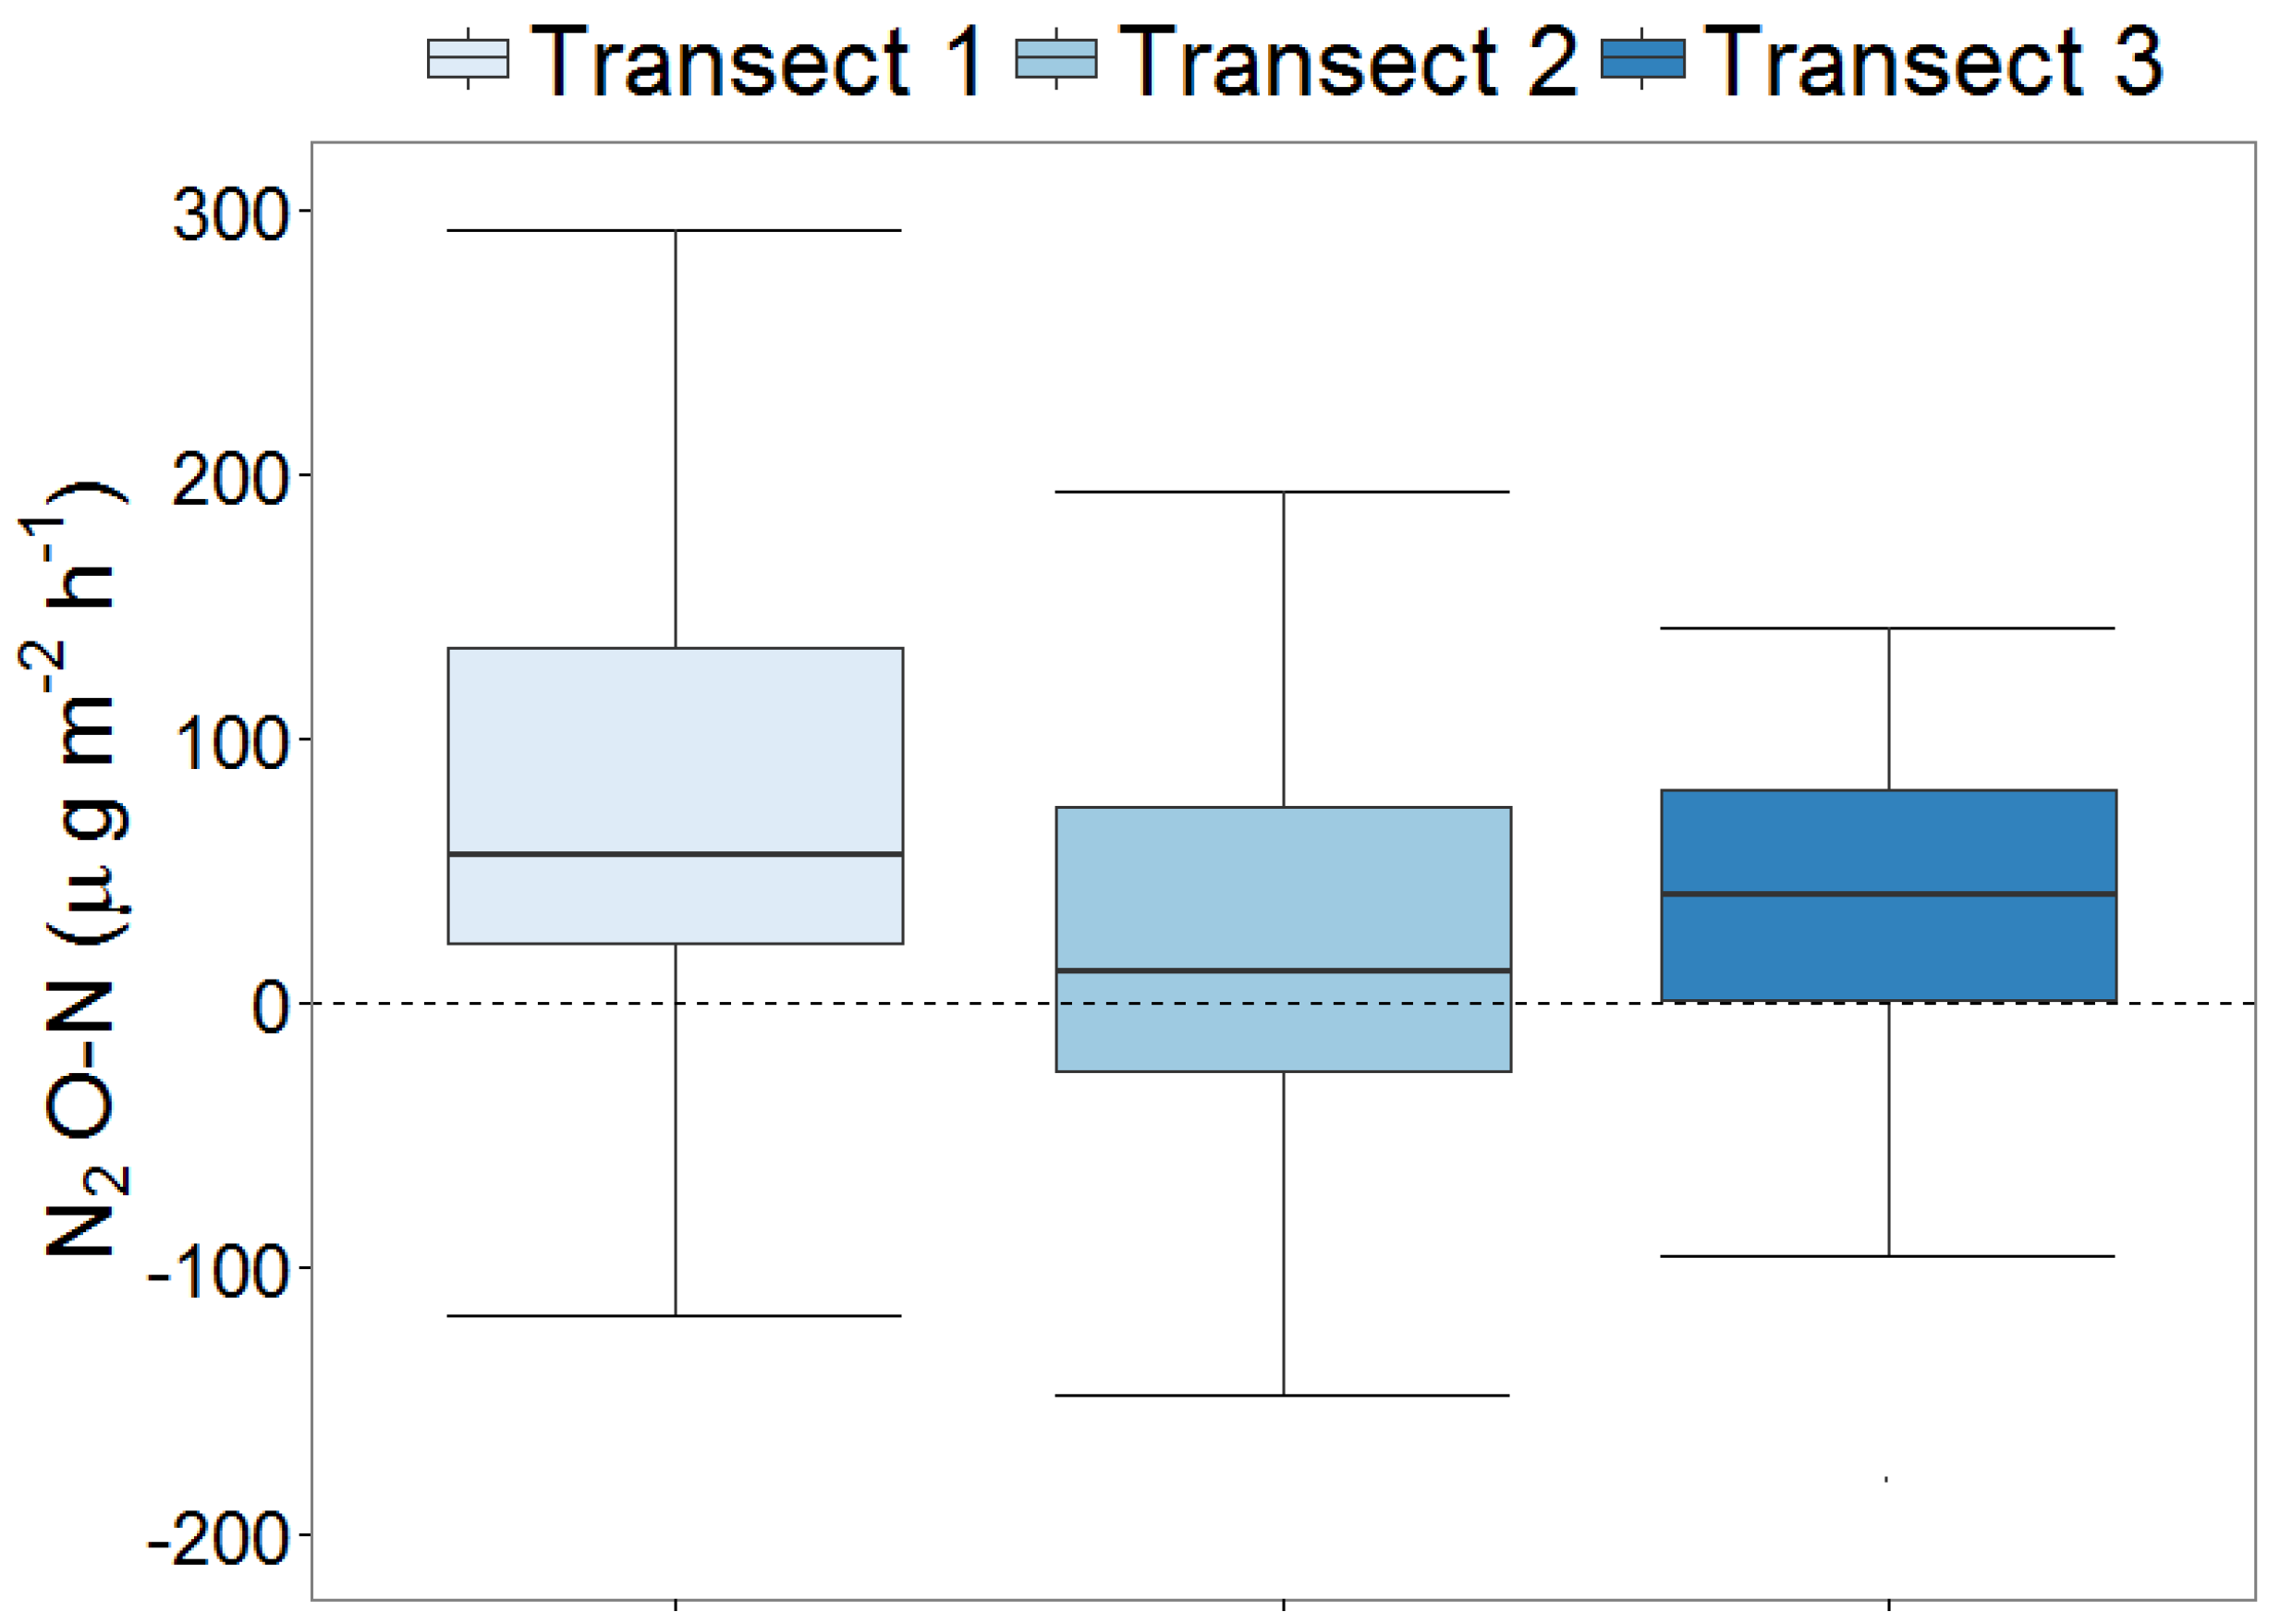
3.2. Nitrous Oxide (N2O-N) Emissions

Nitrous oxide (N2O-N) emissions records ranged between −275 to 522 μg·m−2·h−1 (Figure 4), with an overall mean of 51 μg·N2O-N·m−2·h−1 (Table 2). While observed results show a large range, the distribution of overall nitrous oxide flux records from the 24 static chambers shows relatively normal distribution (Figure 4). In general, overall average nitrous oxide emissions observed from lupine plots was greater, followed by emissions from charcoal plots (Table 2).
Average nitrous oxide fluxes along the slope catena of three transects showed that N2O-N emission rates from plots at the downslope position tended to be slightly greater compared to upslope and mid-slope slope observations (Figure 5). Compared with reports by other studies outside Ethiopia [7,12,13], nitrous oxide fluxes observed in the humid climate in the Anjeni watershed were relatively greater. The trend was also the same as observed in the arid region in the savanna fields of Gambella in Ethiopia by [7]. However, the fluxes measured in our study were almost an order of magnitude greater than the mean nitrous oxide emission of 5.5 μg·m−2·h−1 in the arid Gambella region. Contrary to our observations, however, several studies [11,13,25] reported that charcoal did not reduce nitrous oxide emissions. In addition, it is worth noting that the negative emissions of nitrous oxide in (Figure 4 and Figure 5, Table 2) are not uncommon, as demonstrated by other studies [6,7,8]. However, a study in Madagascar [9] did not report negative nitrous oxide emissions.
While soils in the Anjeni watershed are generally degraded with acidic pH, low organic matter content, high clay content, and shallow depth, as described by Bayabil et al. [28,29,30], there was no clear and consistent trend in N2O-N emission rates between transects (Figure 5) regardless of apparent differences in soil degradation status based on differences in soil depth, organic matter content, and bulk density between the three transects, as shown in Table 1. Since nitrous oxide emissions are regulated by nitrification and de-nitrification rates, which in turn are controlled by soil nitrogen status [11,20,33], our findings demonstrate, in accordance with [11], that elevated fluxes under charcoal and lupine plots (both with a slowly releasing nitrogen source) are directly related to the degraded status of the soil with low organic matter contents. Lupine, being a leguminous plant, is expected to increase organic matter content of degraded soils, which in turn could result in increased nitrous oxide emissions. Likewise, Kammann et al. [14] argued that biochar could have an immediate effect on nitrous oxide emissions.
Contrary to the general expectations, the correlation between nitrous oxide emissions with soil temperature readings at 5 cm depth was not strong (Figure A1a in Appendix A). Nitrous oxide emissions were negatively correlated with soil temperature from charcoal and lupine plots, while emissions from control plots showed almost no correlation with soil temperature. This was in agreement with [12,34] who also found poor correlation with emission rates and soil temperature. Wang et al. [34] reported that nitrous oxide emissions were not affected by temperature; an increase in temperature by 1.3 °C had no effect on nitrous oxide emission rate. In contrast, however, several reports suggest that nitrous oxide and methane emissions increase with an increase in soil temperature and moisture status [20,22,33,35,36]. Smith et al. [22] attributed the increase in nitrous oxide emission with increase in temperature to an increase in the anaerobic volume fraction of the soil. The authors also argue that an increase in soil moisture will result in an exponential increase in nitrous oxide emission.

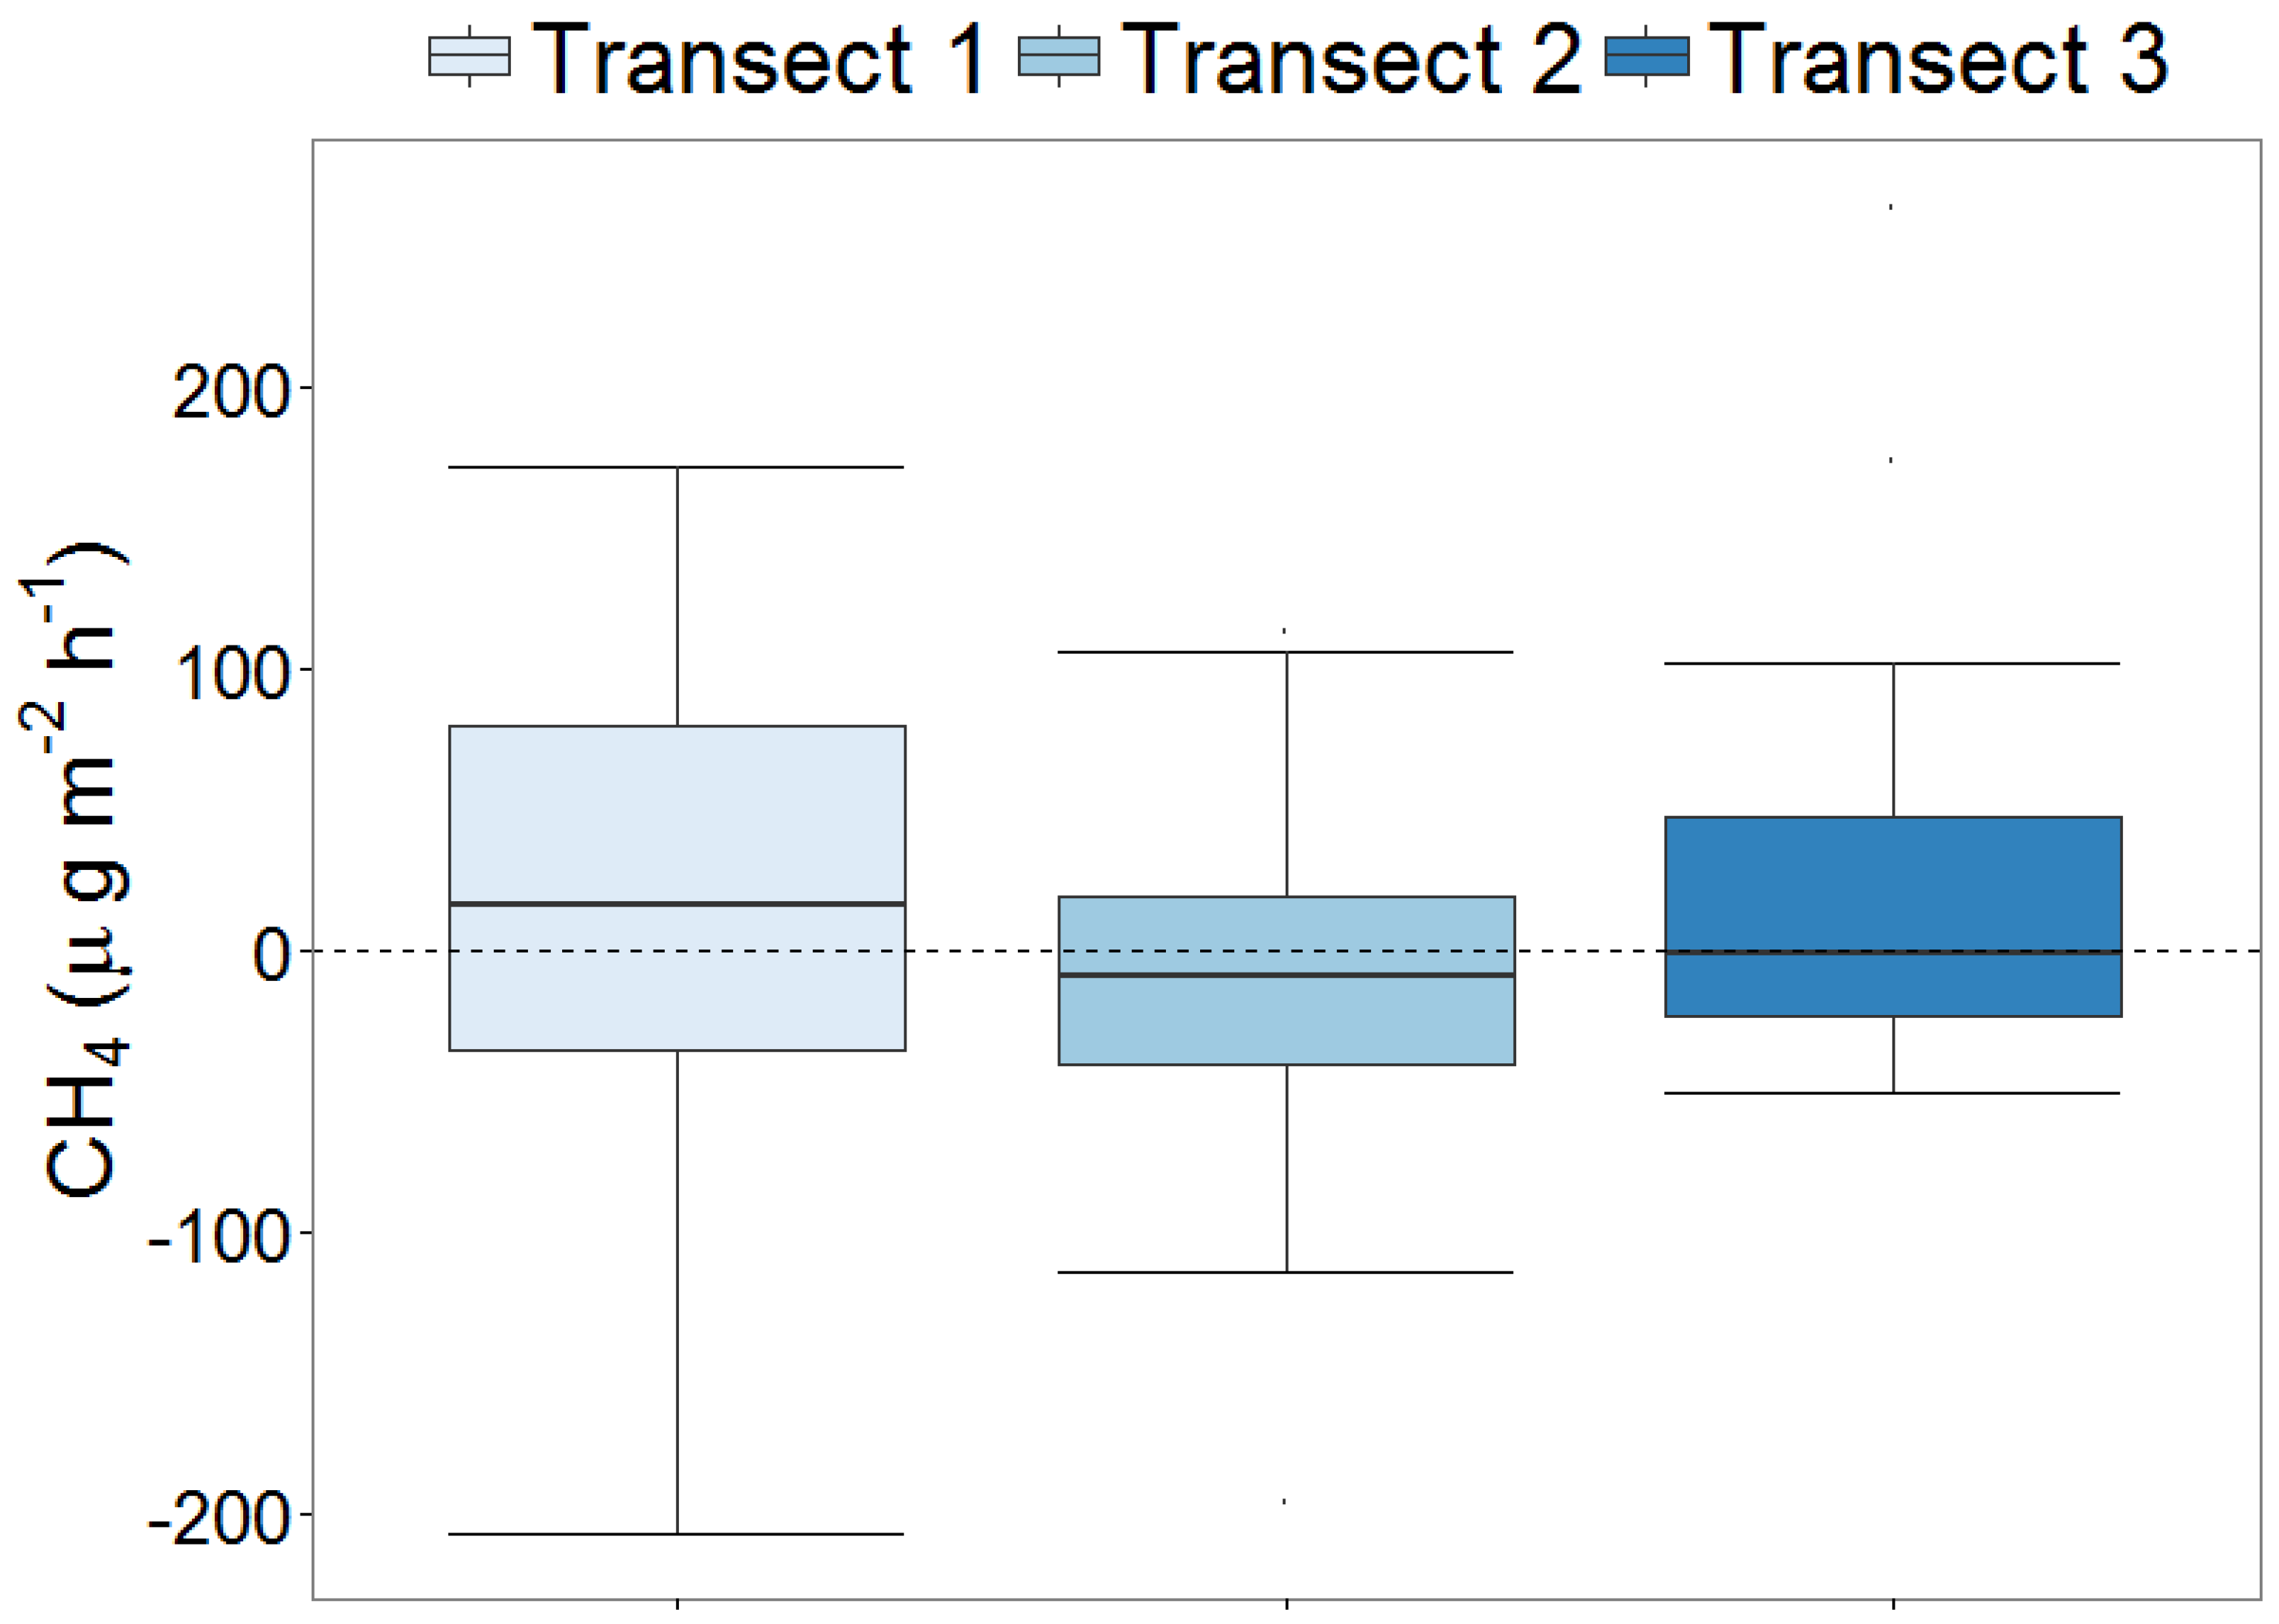
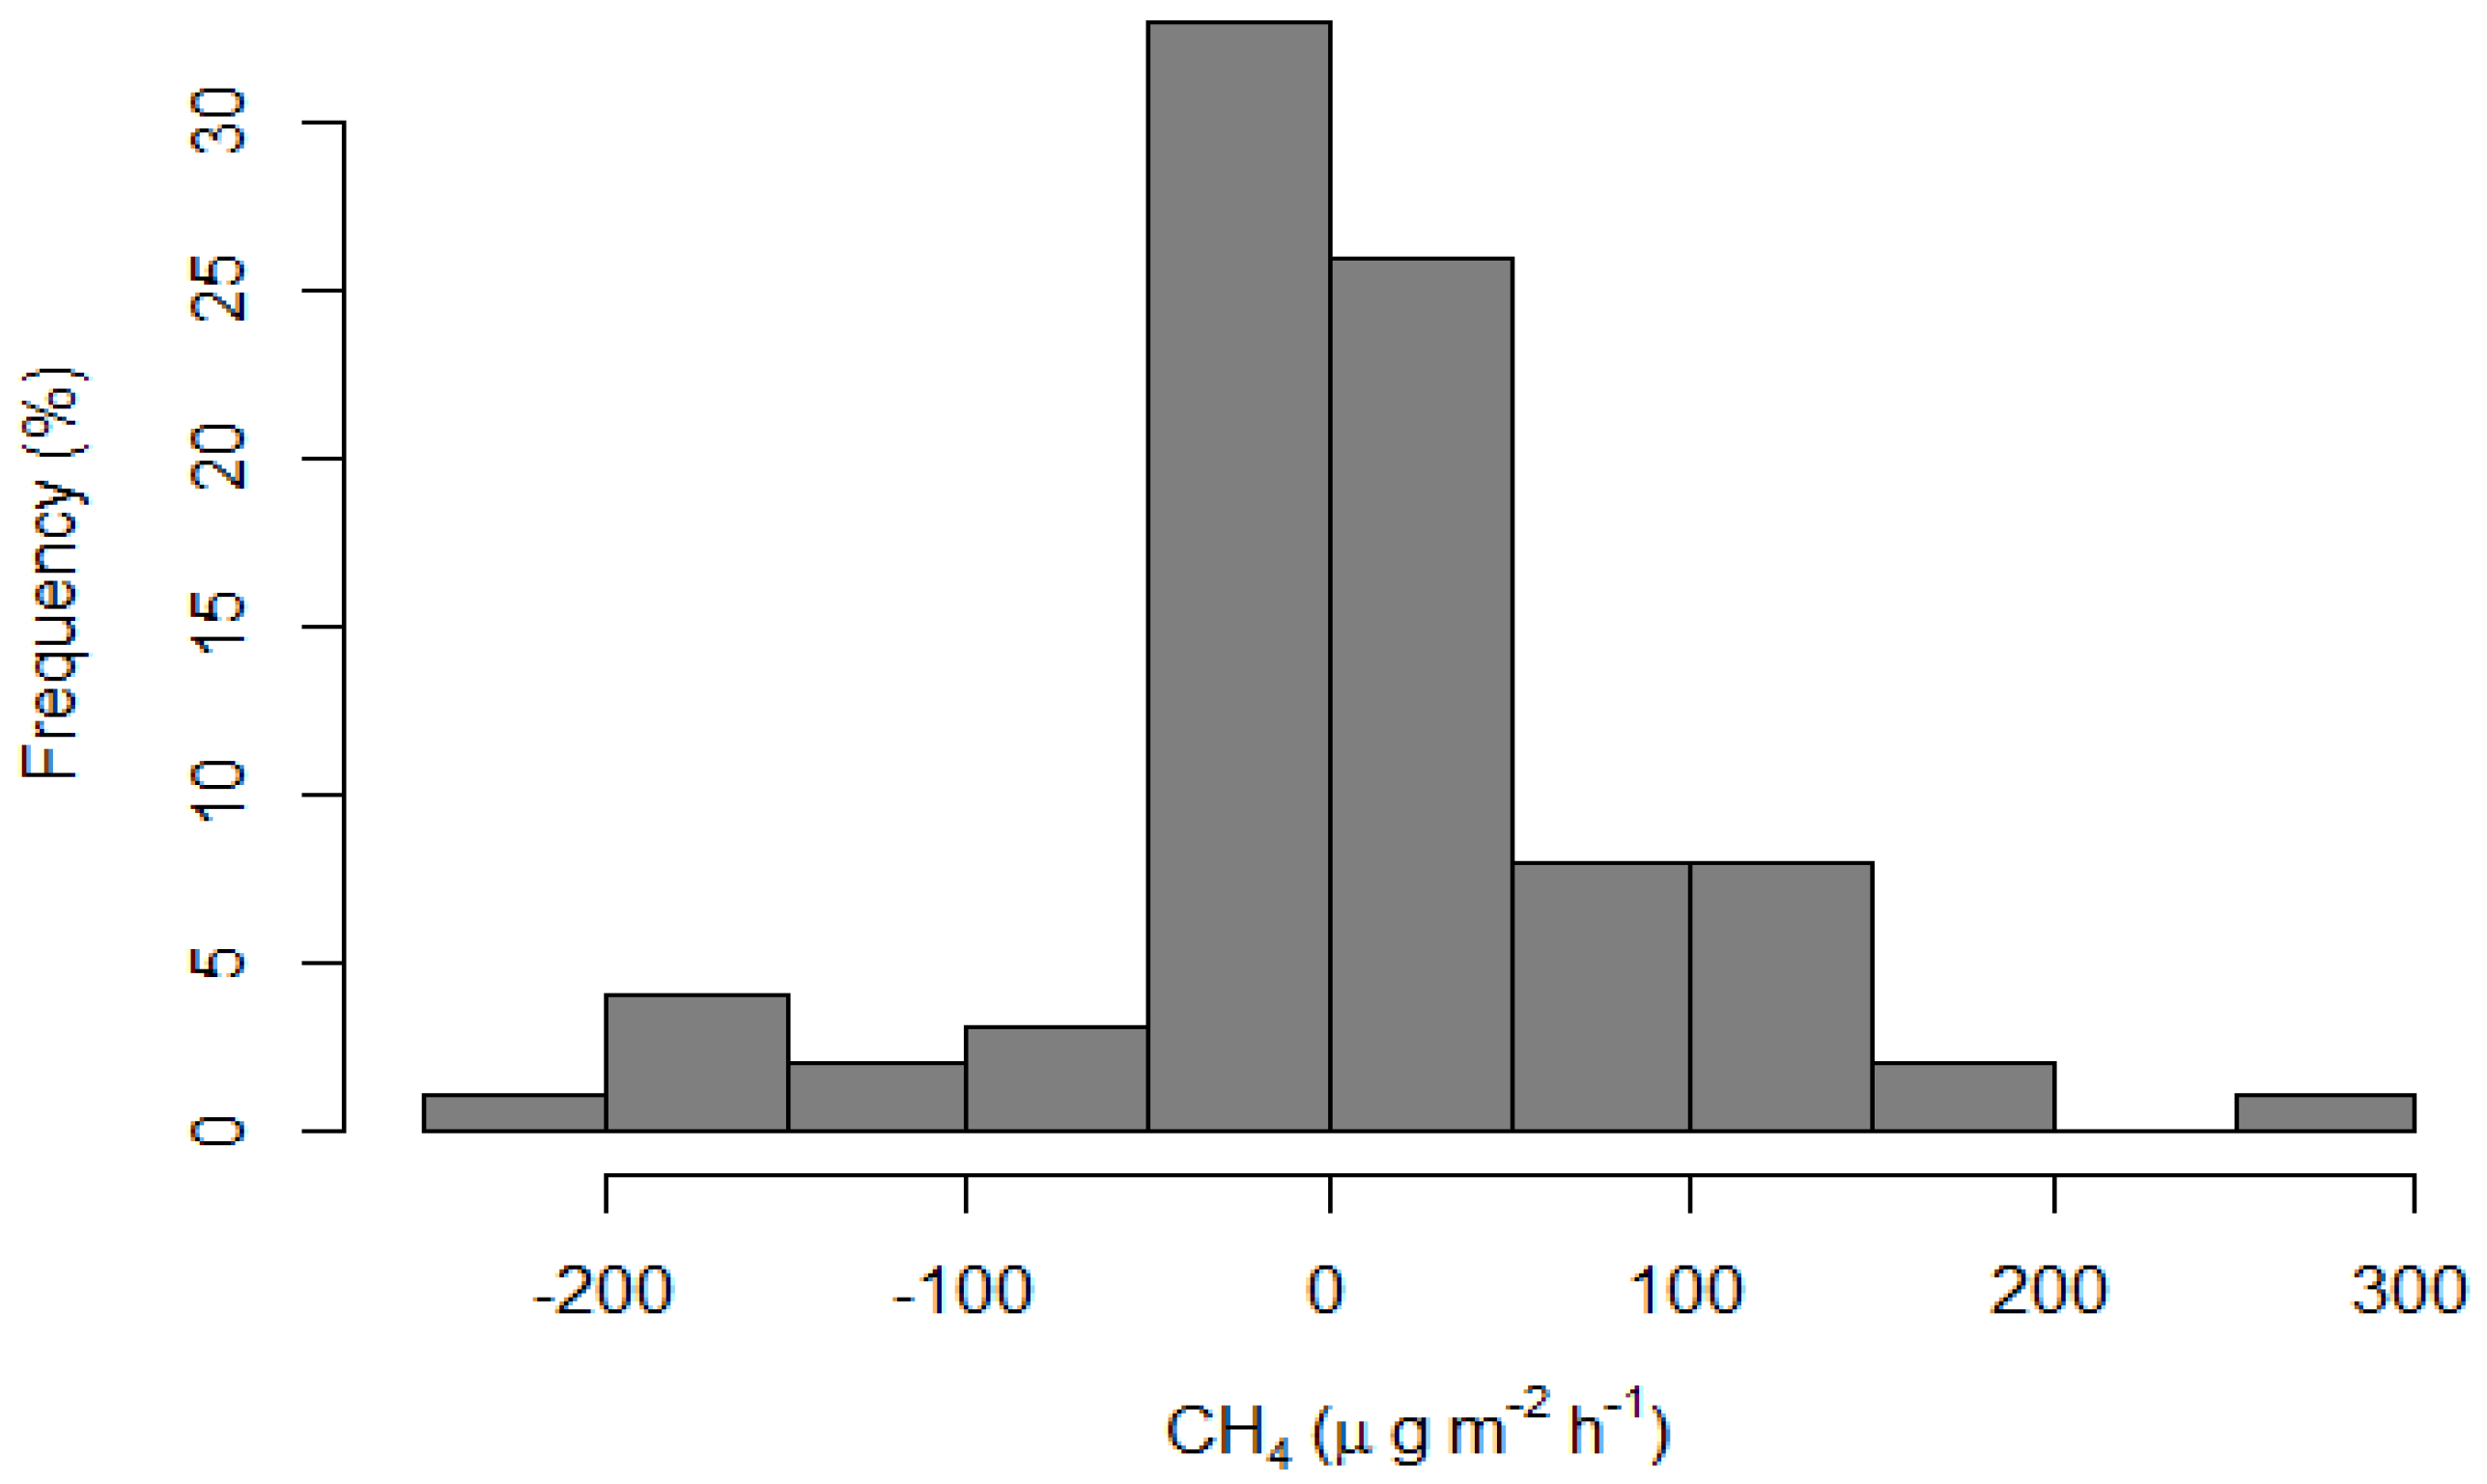
3.3. Methane (CH4) Emissions

Similar to nitrous oxide emissions, measured methane (CH4) emission rates showed great variation between −206 to 264 μg·m−2·h−1 (Figure 6). Greater differences in average methane emission were observed between the control and the charcoal plots (Table 3). Charcoal plots took up more methane from the atmosphere than it emitted, with an overall average emission of −14 μg·m−2·h−1 (Table 3). Methane emissions from lupine plots were intermediate between the charcoal and control plots.
While average emissions of the control plots were slightly positive from plots on relatively deeper soils along Transect 1, there was no consistent trend in methane emissions between the three transects (Figure 7). Negative emissions of methane (CH4) from charcoal amended plots (Figure 6 and Figure 7, Table 3) were in agreement with other studies that found increased uptakes of methane due to biochar resulting in negative fluxes [20]. Well aerated soils act as sinks of methane through microbial oxidation, since oxidation is primarily controlled by gas diffusivity [22]. Observed uptakes from charcoal amended plots could be due to increased drainage and thus aeration on charcoal treated soils. In contrast, however, several previous studies have reported increased methane emissions from biochar amended soils [8,12,13,14]. Kammann et al. [14] argued that while biochar could have an immediate effect on nitrous oxide emissions, its effect on methane emissions could take longer periods. In addition, Wang et al. [16] observed that low nitrogen fertilization increased methane uptake, suggesting that observed negative methane fluxes (Figure 6 and Figure 7, Table 3) from this study could also be due to degraded soil conditions that cover a larger area of the Anjeni watershed (Table 1). Similar findings were reported where cover crops resulted in a considerable uptake of methane in the Mediterranean region [37]. Whalen and Reeburgh [38] reported that a combination of high moisture content and low temperature resulted in the lowest methane oxidation rates.
Overall, preliminary findings suggest that charcoal could increase methane uptake more than lupine and untreated control plots. On the other hand, similar to the observed correlation between nitrous oxide and soil temperature, methane emissions showed a poor correlation with soil temperatures (Figure A1b in Appendix A). However, methane emissions from lupine plots showed a better correlation with soil temperatures(r = 0.53, p = 0.003) (Figure A1b in Appendix A).

4. Conclusions

Results from this scoping field study of nitrous oxide (N2O-N) and methane (CH4) emissions in the sub-humid Anjeni watershed, in the Ethiopian highlands, provide insights about spatial Greenhouse Gas (GHG) emission rates from smallholder farms with different soil amendments: charcoal amendment and leguminous lupine crop. We observed both positive and negative fluxes of nitrous oxide and methane emissions. These confirm that soils act as both sources and sinks of greenhouse gasses. There was not a consistent variation of nitrous oxide and methane emissions along the slope catena along the three transects. Nitrous oxide emissions were mostly greater from lupine plots followed by charcoal amended plots, while methane emissions were mostly negative from lupine and charcoal treated plots. While this study provides some insights regarding the extent of nitrous oxide and methane fluxes from smallholder farms, observed fluxes showed greater variability and thus, detailed studies of longer durations are needed to verify the results.

Acknowledgments

This study was funded in part by the N. Borlaug Leadership Enhancement in Agriculture Program (LEAP) and the Richard Bradfield research award by Cornell University. The authors would like to thank Birhanu Mehiretu (field technician in the Anjeni watershed) for his help during field gas sampling.

Author Contributions

Haimanote Bayabil and Tammo Steenhuis formulated the research question, designed the field experiment, transportation of samples from Ethiopia to the USA for analysis, data analysis and write up of the paper. Cathelijne Stoof, Cedric Mason, and Brian Richards contributed significantly in samples analysis using gas chromatograph and reviewing the manuscript.

Conflicts of Interest

The authors declare no conflict of interest.

Appendix A

Figure A1. Correlation between soil temperature (at 5 cm depth) and nitrous emission with correlations values of 0.01, −0.24, and −0.30 for Control, Charcoal, and Lupine treatments, respectively (a) and methane −0.05, 0.11, and 0.53 for Control, Charcoal, and Lupine treatments, respectively (b) based on combined data from all campaigns.
Climate 04 00062 g008

Appendix B

Figure B1. Weather characteristics of the Anjeni watershed in 2013.
Climate 04 00062 g009

References

  1. IPCC. Climate Change 2013: The Physical Science Basis. Contribution of Working Group I to the Fifth Assessment Report of the Intergovernmental Panel on Climate Change; Stocker, T.F., Qin, D., Plattner, G.K., Tignor, M., Allen, S.K., Boschung, J., Nauels, A., Xia, Y., Bex, B., Midgley, B.M., Eds.; IPCC: Paris, France, 2013. [Google Scholar]
  2. Canadell, J.G.; Raupach, M.R.; Houghton, R.A. Anthropogenic CO2 emissions in Africa. Biogeosciences 2009, 6, 463–468. [Google Scholar] [CrossRef]
  3. Afful-Koomson, T. The Green Climate Fund in Africa: What should be different? Clim. Dev. 2015, 7, 367–379. [Google Scholar] [CrossRef]
  4. Jindal, R.; Swallow, B.; Kerr, J. Forestry-based carbon sequestration projects in Africa: Potential benefits and challenges. Nat. Resour. Forum 2008, 32, 116–130. [Google Scholar] [CrossRef]
  5. Corbera, E.; Estrada, M.; Brown, K. Reducing greenhouse gas emissions from deforestation and forest degradation in developing countries: Revisiting the assumptions. Clim. Chang. 2010, 100, 355–388. [Google Scholar] [CrossRef]
  6. Keller, M.; Kaplan, W.A.; Wofsy, S.C. Emissions of N2O, CH4 and CO2 from tropical forest soils. J. Geophys. Res. Atmos. 1986, 91, 11791–11802. [Google Scholar] [CrossRef]
  7. Andersson, M. Soil emissions of nitrous oxide in fire-prone African savannas. J. Geophys. Res. Atmos. 2003, 108, 1769–1778. [Google Scholar] [CrossRef]
  8. Smith, P.; Martino, D.; Cai, Z.; Gwary, D.; Janzen, H.; Kumar, P.; McCarl, B.; Ogle, S.; O’Mara, F.; Rice, C.; et al. Greenhouse gas mitigation in agriculture. Philos. Trans. R. Soc. B Biol. Sci. 2008, 363, 789–813. [Google Scholar]
  9. Chapuis-Lardy, L.; Metay, A.; Martinet, M.; Rabenarivo, M.; Toucet, J.; Douzet, J.M.; Razafimbelo, T.; Rabeharisoa, L.; Rakotoarisoa, J. Nitrous oxide fluxes from Malagasy agricultural soils. Geoderma 2009, 148, 421–427. [Google Scholar] [CrossRef]
  10. Watson, R.T.; Meira Filho, L.G.; Sanhueza, E.; Janetos, A. Greenhouse gases: Sources and sinks. Clim. Chang. 1992, 92, 25–46. [Google Scholar]
  11. H’enault, C.; Grossel, A.; Mary, B.; Roussel, M.; L’eonard, J. Nitrous oxide emission by agricultural soils: A review of spatial and temporal variability for mitigation. Pedosphere 2012, 22, 426–433. [Google Scholar] [CrossRef]
  12. Luo, G.J.; Kiese, R.; Wolf, B.; Butterbach-Bahl, K. Effects of soil temperature and moisture on methane uptake and nitrous oxide emissions across three different ecosystem types. Biogeosciences 2013, 10, 3205–3219. [Google Scholar] [CrossRef]
  13. Molodovskaya, M.; Singurindy, O.; Richards, B.K.; Warland, J.; Johnson, M.S.; Steenhuis, T.S. Temporal variability of nitrous oxide from fertilized croplands: Hot moment analysis. Soil Sci. Soc. Am. J. 2012, 76, 1728–1740. [Google Scholar] [CrossRef]
  14. Kammann, C.; Ratering, S.; Eckhard, C.; Müller, C. Biochar and hydrochar effects on greenhouse gas (carbon dioxide, nitrous oxide, and methane) fluxes from soils. J. Environ. Qual. 2012, 41, 1052–1066. [Google Scholar] [CrossRef] [PubMed]
  15. Singla, A.; Inubushi, K. Effect of biochar on CH4 and N2O emission from soils vegetated with paddy. Paddy Water Environ. 2014, 12, 239–243. [Google Scholar] [CrossRef]
  16. Wang, J.; Pan, X.; Liu, Y.; Zhang, X.; Xiong, Z. Effects of biochar amendment in two soils on greenhouse gas emissions and crop production. Plant. Soil 2012, 360, 287–298. [Google Scholar] [CrossRef]
  17. Cayuela, M.L.; van Zwieten, L.; Singh, B.P.; Jeffery, S.; Roig, A.; Sánchez-Monedero, M.A. Biochar’s role in mitigating soil nitrous oxide emissions: A review and meta-analysis. Agric. Ecosyst. Environ. 2014, 191, 5–16. [Google Scholar] [CrossRef]
  18. Karhu, K.; Mattila, T.; Bergström, I.; Regina, K. Biochar addition to agricultural soil increased CH4 uptake and water holding capacity—Results from a short-term pilot field study. Agric. Ecosyst. Environ. 2011, 140, 309–313. [Google Scholar] [CrossRef]
  19. Zhang, A.; Bian, R.; Pan, G.; Cui, L.; Hussain, Q.; Li, L.; Zheng, J.; Zheng, J.; Zhang, X.; Han, X.; et al. Effects of biochar amendment on soil quality, crop yield and greenhouse gas emission in a Chinese rice paddy: A field study of 2 consecutive rice growing cycles. Field Crops Res. 2012, 127, 153–160. [Google Scholar] [CrossRef]
  20. Zhang, A.; Cui, L.; Pan, G.; Li, L.; Hussain, Q.; Zhang, X.; Zheng, J.; Crowley, D. Effect of biochar amendment on yield and methane and nitrous oxide emissions from a rice paddy from Tai Lake plain, China. Agric. Ecosyst. Environ. 2010, 139, 469–475. [Google Scholar] [CrossRef]
  21. Bremner, J.M.; Blackmer, A.M. Nitrous oxide: Emission from soils during nitrification of fertilizer nitrogen. Science 1978, 199, 295–296. [Google Scholar] [CrossRef] [PubMed]
  22. Smith, K.A.; Ball, T.; Conen, F.; Dobbie, K.E.; Massheder, J.; Rey, A. Exchange of greenhouse gases between soil and atmosphere: Interactions of soil physical factors and biological processes. Eur. J. Soil Sci. 2003, 54, 779–791. [Google Scholar] [CrossRef]
  23. Armstrong, R.D.; Kuskopf, B.J.; Millar, G.; Whitbread, A.M.; Standley, J. Changes in soil chemical and physical properties following legumes and opportunity cropping on a cracking clay soil. Anim. Prod. Sci. 1999, 39, 445–456. [Google Scholar] [CrossRef]
  24. Dakora, F.D.; Keya, S.O. Contribution of legume nitrogen fixation to sustainable agriculture in Sub-Saharan Africa. Soil Biol. Biochem. 1997, 29, 809–817. [Google Scholar] [CrossRef]
  25. Yang, L.; Cai, Z. The effect of growing soybean (Glycine max. L.) on N2O emission from soil. Soil Biol. Biochem. 2005, 37, 1205–1209. [Google Scholar] [CrossRef]
  26. Herweg, K.; Ludi, E. The performance of selected soil and water conservation measures—Case studies from Ethiopia and Eritrea. Catena 1999, 36, 99–114. [Google Scholar] [CrossRef]
  27. Zeleke, G. Landscape Dynamics and Soil Erosion Process Modelling in the North-Western Ethiopian Highlands; African Studies Series A 16; Geographica Bernensia: Berne, Switzerland, 2000. [Google Scholar]
  28. Bayabil, H.K.; Tebebu, T.Y.; Stoof, C.R.; Steenhuis, T.S. Effects of a deep-rooted crop and soil amended with charcoal on spatial and temporal runoff patterns in a degrading tropical highland watershed. Hydrol. Earth Syst. Sci. 2016, 20, 875–885. [Google Scholar] [CrossRef]
  29. Bayabil, H.K.; Tebebu, T.Y.; Stoof, C.R.; Steenhuis, T.S. Spatial and temporal runoff processes in the degraded Ethiopian Highlands: The Anjeni Watershed. Hydrol. Earth Syst. Sci. Discuss. 2015, 19, 1–25. [Google Scholar] [CrossRef]
  30. Bayabil, H.K.; Stoof, C.R.; Lehmann, J.C.; Yitaferu, B.; Steenhuis, T.S. Assessing the potential of biochar and charcoal to improve soil hydraulic properties in the humid Ethiopian Highlands: The Anjeni watershed. Geoderma 2015, 243–244, 115–123. [Google Scholar] [CrossRef]
  31. Mason, C. Spring-Thaw Nitrous Oxide Emissions from Reed Canary Grass on Wet Marginal Soil in New York State. Master’s Thesis, Cornell University, Ithaca, NY, USA, 2014. [Google Scholar]
  32. Molodovskaya, M.; Warland, J.; Richards, B.K.; Öberg, G.; Steenhuis, T.S. Nitrous oxide from heterogeneous agricultural Landscapes: Source contribution analysis by eddy covariance and Chambers. Soil Sci. Soc. Am. J. 2011, 75, 1829–1838. [Google Scholar] [CrossRef]
  33. Gogoi, B.; Baruah, K.K. Nitrous oxide emissions from fields with different wheat and rice varieties. Pedosphere 2012, 22, 112–121. [Google Scholar] [CrossRef]
  34. Wang, Z.; Hao, X.; Shan, D.; Han, G.; Zhao, M.; Willms, W.D.; Wang, Z.; Han, X. Influence of increasing temperature and nitrogen input on greenhouse gas emissions from a desert steppe soil in Inner Mongolia. Soil Sci. Plant Nutr. 2011, 57, 508–518. [Google Scholar] [CrossRef]
  35. Sainju, U.M.; Stevens, W.B.; Caesar-TonThat, T.; Liebig, M.A. Soil greenhouse gas emissions affected by irrigation, tillage, crop rotation, and nitrogen fertilization. J. Environ. Qual. 2012, 41, 1774–1786. [Google Scholar] [CrossRef] [PubMed]
  36. Yu, L.; Tang, J.; Zhang, R.; Wu, Q.; Gong, M. Effects of biochar application on soil methane emission at different soil moisture levels. Biol. Fertil. Soils 2013, 49, 119–128. [Google Scholar] [CrossRef]
  37. Sanz-Cobena, A.; García-Marco, S.; Quemada, M.; Gabriel, J.L.; Almendros, P.; Vallejo, A. Do cover crops enhance N2O, CO2 or CH4 emissions from soil in Mediterranean arable systems? Sci. Total Environ. 2014, 466–467, 164–174. [Google Scholar] [CrossRef] [PubMed]
  38. Whalen, S.; Reeburgh, W. Moisture and temperature sensitivity of CH4 oxidation in boreal soils. Soil Biol. Biochem. 1996, 28, 1271–1281. [Google Scholar] [CrossRef]
Figure 1. Map of the Anjeni watershed in the Northern Ethiopian Highlands (a), with the location of downslope transects and runoff plots indicated in (b) and (c) (not to scale) (source: [28]). Dashed lines in (c) are elevation contours. Three treatments were applied: barley without soil amendment (control) was grown on plots 2, 4, 7, 12, 15, 18, 21, 23; barley with charcoal amendment was grown on plots 1, 6, 8, 11, 13, 17, 20, 22; lupine without soil amendment was grown on plots 3, 5, 9, 10, 14, 16, 19, 24. Soil and spatial attributes of plots are presented in Table 1.
Climate 04 00062 g001
Figure 2. Static gas sampling chamber collar installed in the field adjacent to runoff plots (left) and static chambers with covers on the top ready for gas sampling (right).
Climate 04 00062 g002
Figure 3. Daily air and soil temperature (Tmin: minimum and Tmax: maximum temperature) and daily rainfall for the Anjeni watershed (based on observations from 1989 to 1995).
Climate 04 00062 g003
Figure 4. Distribution of observed nitrous oxide emissions from 24 static chambers based on combined data from all campaigns in 2013.
Climate 04 00062 g004
Figure 5. Nitrous oxide emissions from plots along the slope catena of three transects based on combined data from all campaigns.
Climate 04 00062 g005
Figure 6. Distribution of observed methane emissions from 24 static chambers installed along the slope catena in three transects based on combined data from all campaigns.
Climate 04 00062 g006
Figure 7. Methane emissions from plots along the slope catena of three transects based on combined data from all campaigns.
Climate 04 00062 g007
Table 1. Soil properties of plots with static gas sampling chambers (source: [28]).
TransectPositionPlotsElevationSlopeSandSiltClayOMPbD
(m a.s.l.)(%)(%) (g·cm−3)(m)
OneUpslope1, 2, 324383.024.835.439.82.21.11.15
Mid-slope4, 5, 624312.531.728.040.32.11.11.22
Down slope7, 8, 924111.523.636.739.62.21.1>1.3
TwoUpslope10, 11, 1224612.523.832.244.02.11.10.84
Mid-slope13, 14, 1524262.017.839.043.22.41.21.09
Down slope16, 17, 1824151.024.736.339.02.41.3>1.3
ThreeUpslope19, 20, 2124553.021.037.741.41.31.40.33
Mid-slope22, 23, 2424382.030.637.432.01.41.30.72
OM: organic matter; Pb: bulk density; and D: soil depth.
Table 2. Summary, range (minimum and maximum) and mean ± standard error of means, of nitrous oxide (N2O-N) emissions based on combined data from all campaigns.
TransectElevationControlCharcoalLupine
RangeMean (±SE)RangeMean (±SE)RangeMean (±SE)
(μg·m−2·h−1)
Transect 1Upslope−48.9–51.59.3 ± 21.320.4–139.8101.1 ± 27.7−27.4–135.648.9 ± 34
Mid-slope35.5–21293.7 ± 41.5−117.5–41.3−20.7 ± 34.774.3–180.8127.6 ± 25
Downslope−29.5–188.877.7 ± 49.4−270.9–305.133.2 ± 118.1290.5–307.1296.5 ± 5.3
Transect 2Upslope−6.3–126.751.9 ± 34−43.1–6.7−13.7 ± 12.2−91.9–165.215.5 ± 77.2
Mid-slope−53.3–36.1−17.8 ± 27.426.5–183.399.4 ± 45.6−116.5–193.232.8 ± 89.6
Downslope−148.4–56−30.4 ± 61.16.2–522.3182.1 ± 170.138.5–163.790.8 ± 37.6
Transect 3Upslope−179.9–84.60.1 ± 60.6−26.2–114.548.4 ± 30.4−95.1–139.118 ± 47.9
Mid-slope−6–118.443.2 ± 27.1−275–70.4−30.9 ± 81.7−65–141.838.4 ± 54.1
Average 32 ±15.2 43.8 ± 26.3 79.9 ± 22.2
Table 3. Summary, range (minimum and maximum) and mean ± standard error (SE) of means, of methane emissions along the slope catena of three transects based on combined data from all campaigns.
ControlCharcoalLupine
TransectElevationRangeMean ± SERangeMean ± SERangeMean ± SE
Transect 1Upslope−35.1–105.434.6 ± 36.5−13.8–22.510.6 ± 8.3−185.8–42.7−52.4 ± 48.6
Mid-slope−47.9–62.5−2.4 ± 25−92.6–98−4 ± 40.7−33.1–103.546.2 ± 33.1
Downslope36.2–172.195.7 ± 28.9−206.7–114.6−69.3 ± 78−169–124.7−18.6 ± 84.9
Transect 2Upslope−9.8–43.815 ± 11.8−15.4–20.13.5 ± 8.1−40.1–106.511.7 ± 47.5
Mid-slope−13.7–24.15.9 ± 10.9−47.1–−9.3−33.1 ± 12−45.7–11322.9 ± 47
Downslope−114.2–20.3−45.8 ± 38.9−196.1–19.5−94.7 ± 62.6−34.7–16.2−9.9 ± 14.7
Transect 3Upslope−35.4–52.3−2.6 ± 20.6−9.3–102.845.7 ± 22.9−33.2–174.544.7 ± 45
Mid-slope−50.9–264.453.9 ± 71.9−23.1–73.44.8 ± 23−29.5–61.90.8 ± 20.8
Average 21.9 ± 13.5 −13.9 ± 14.5 6.3 ± 15.1

