Article

Statistical-Synoptic Analysis of the Atmosphere Thickness Pattern of Iran’s Pervasive Frosts

1
Climatology, Department of Geography, Yazd University, Yazd 8915818411, Iran
2
Climatology, Department of Geography, Zanjan University, Zanjan 3879145371, Iran
3
Climatology, Department of Geography, Tabriz University, Tabriz 5166616471, Iran
4
Geomorphology, Department of Humanities, Mohaghegh Ardabili University, Ardabil 5519911367, Iran
*
Author to whom correspondence should be addressed.
Climate 2016, 4(3), 41; https://doi.org/10.3390/cli4030041
Submission received: 18 July 2016 / Revised: 16 August 2016 / Accepted: 22 August 2016 / Published: 26 August 2016

Abstract

:
The present study aimed at analyzing the synoptic pattern of atmospheric thickness of winter pervasive frosts in Iran. To this end, the data related to the daily minimum temperature of a 50-year period (1961–2010) were gathered from 451 synoptic and climatology stations. Then, the instances in which the temperature was below 0 °C for at least two consecutive days and this phenomenon covered at least 50% of the entirety of Iran were selected. Subsequently, the atmosphere thickness pattern was extracted for these days, with the representative day being identified and analyzed through cluster analysis. The results showed that the Siberian high pressure plays a significant role in the occurrence of pervasive frosts in Iran. In some other cases, the northeast–southwest direction of this pattern leads to its combination with the East Europe high pressure, causing widespread frosts in Iran. Furthermore, the interaction between counter clockwise currents in this system and the clockwise currents in the Azores high pressure tongue directs cold weather from northern parts of Europe toward Iran. The formation of blocking systems leads to the stagnation of cold weather over Iran, a phenomenon that results in significant reduction of temperature and severe frosts in these areas. In addition, the omega pattern (the fifth pattern) and Deep Eastern European trough and polar low pressure pattern (the fourth pattern) were the most dominant and severe frost patterns in Iran respectively.

1. Introduction

Changes in the frequency and intensity of climatic events are an indicator of climate change. Due to their severity and sudden occurrence, extreme frosts have a profound effect on ecosystems and human societies. They are the result of certain atmospheric conditions and atmospheric circulation [1]. Climatic zoning is often performed based on climatic variables. By so doing, the role of all climatic variables is taken into account in determining borders between various areas [2]. In studies related to anomalies of climate variables in each area, the behavior of these variables is investigated in the light of their long-term average. The values that are smaller or bigger than the long-term average, are, respectively, regarded as negative and positive anomalies [3]. Numerous studies of synoptic analysis of East Asian cold waves have indicated that the dominant pattern in these areas is the Siberian high pressure [4,5]. Many researchers have intended to identify anomaly patterns [6,7,8]. Some others have investigated spatial-temporal anomalies of climate variables [9,10,11]. Lau et al. (2006: 402–411) have studied circulation patterns that lead to negative temperature anomalies, with the results demonstrating a significant relationship between sea surface temperature anomalies along the Atlantic and South Pacific, on the one hand, and the occurrence of extreme temperatures, on the other [12]. Furthermore, Prieto et al. [13,14], who studied extreme winter temperatures, and Guirguis et al. [15], who investigated the occurrence of wintry heat and cold waves, showed that North Atlantic Oscillation (NAO) influences the occurrence of cold waves. Pezza & Ambrizzi [16] have also conducted some studies in the realm of synoptic-dynamic meteorology. In a study in Iran, Shahbaiye Kotanaie [17] used cluster analysis on the matrix of sea level pressure data of cold days to come up with the synoptic analysis of wintry cold waves, with the results yielding five influential atmospheric patterns. The researcher also showed that the formation of cold waves is simultaneous with positive anomalies of sea level pressure and negative anomalies of the height of 55 hPa across the country. Moreover, the researcher concluded that the patterns of atmospheric middle level have a considerable effect on the formation and continuation of cold waves. Thus, the strongest, most widespread, and most consistent cold wintry waves are formed when blocking systems are located on Eastern Europe and their eastern troughs are positioned over Iran. Akbari& Masoodian [18] studied the role of macro-scale pressure anomalies in Iran’s temperatures. Mohammadi [3], on the other hand, concentrated on identifying spatial and temporal anomalies of different climate variables of Iran. Analysis of sea level pressure anomalies on days of extreme cold indicated that the most extreme and pervasive frosts of Iran are simultaneous with four patterns of sea level pressure anomalies [19]. Some researchers have demonstrated that severe frosts and extreme temperatures are influenced by thermal advection patterns [20,21,22]. Some of these studies have adopted synoptic-statistical analysis [23] using the index of normalized temperature deviation [21]. Others have adopted cluster analysis [24,25] using the Ward method [1].
Pervasive frosts occur as a result of pouring cold air from higher latitudes. In such a situation, since air mass density goes up, thickness of the atmosphere declines. Thus, in the current study, attempts were made to investigate Iran’s frosts by concentrating on the effect of atmosphere thickness (which is itself influenced by the increase/decrease of air mass density). Due to frosts, Iran incurs heavy financial losses each year in agriculture and animal husbandry. Frosts impose limitations on agriculture. They also play an important role constructing roads, dams, and bridges, hence affecting industry and transportation. On the other hand, the occurrence of frosts in mountainous areas leads to numerous problems such as traffic blocking and car crashes. Consequently, frosts are regarded as an important climate risk and receive a lot of attention from climatologists.

2. Materials and Methods

The present study aimed at synoptic analysis atmosphere thickness patterns of Iran’s pervasive frosts. To this end, two databases were used:
1.
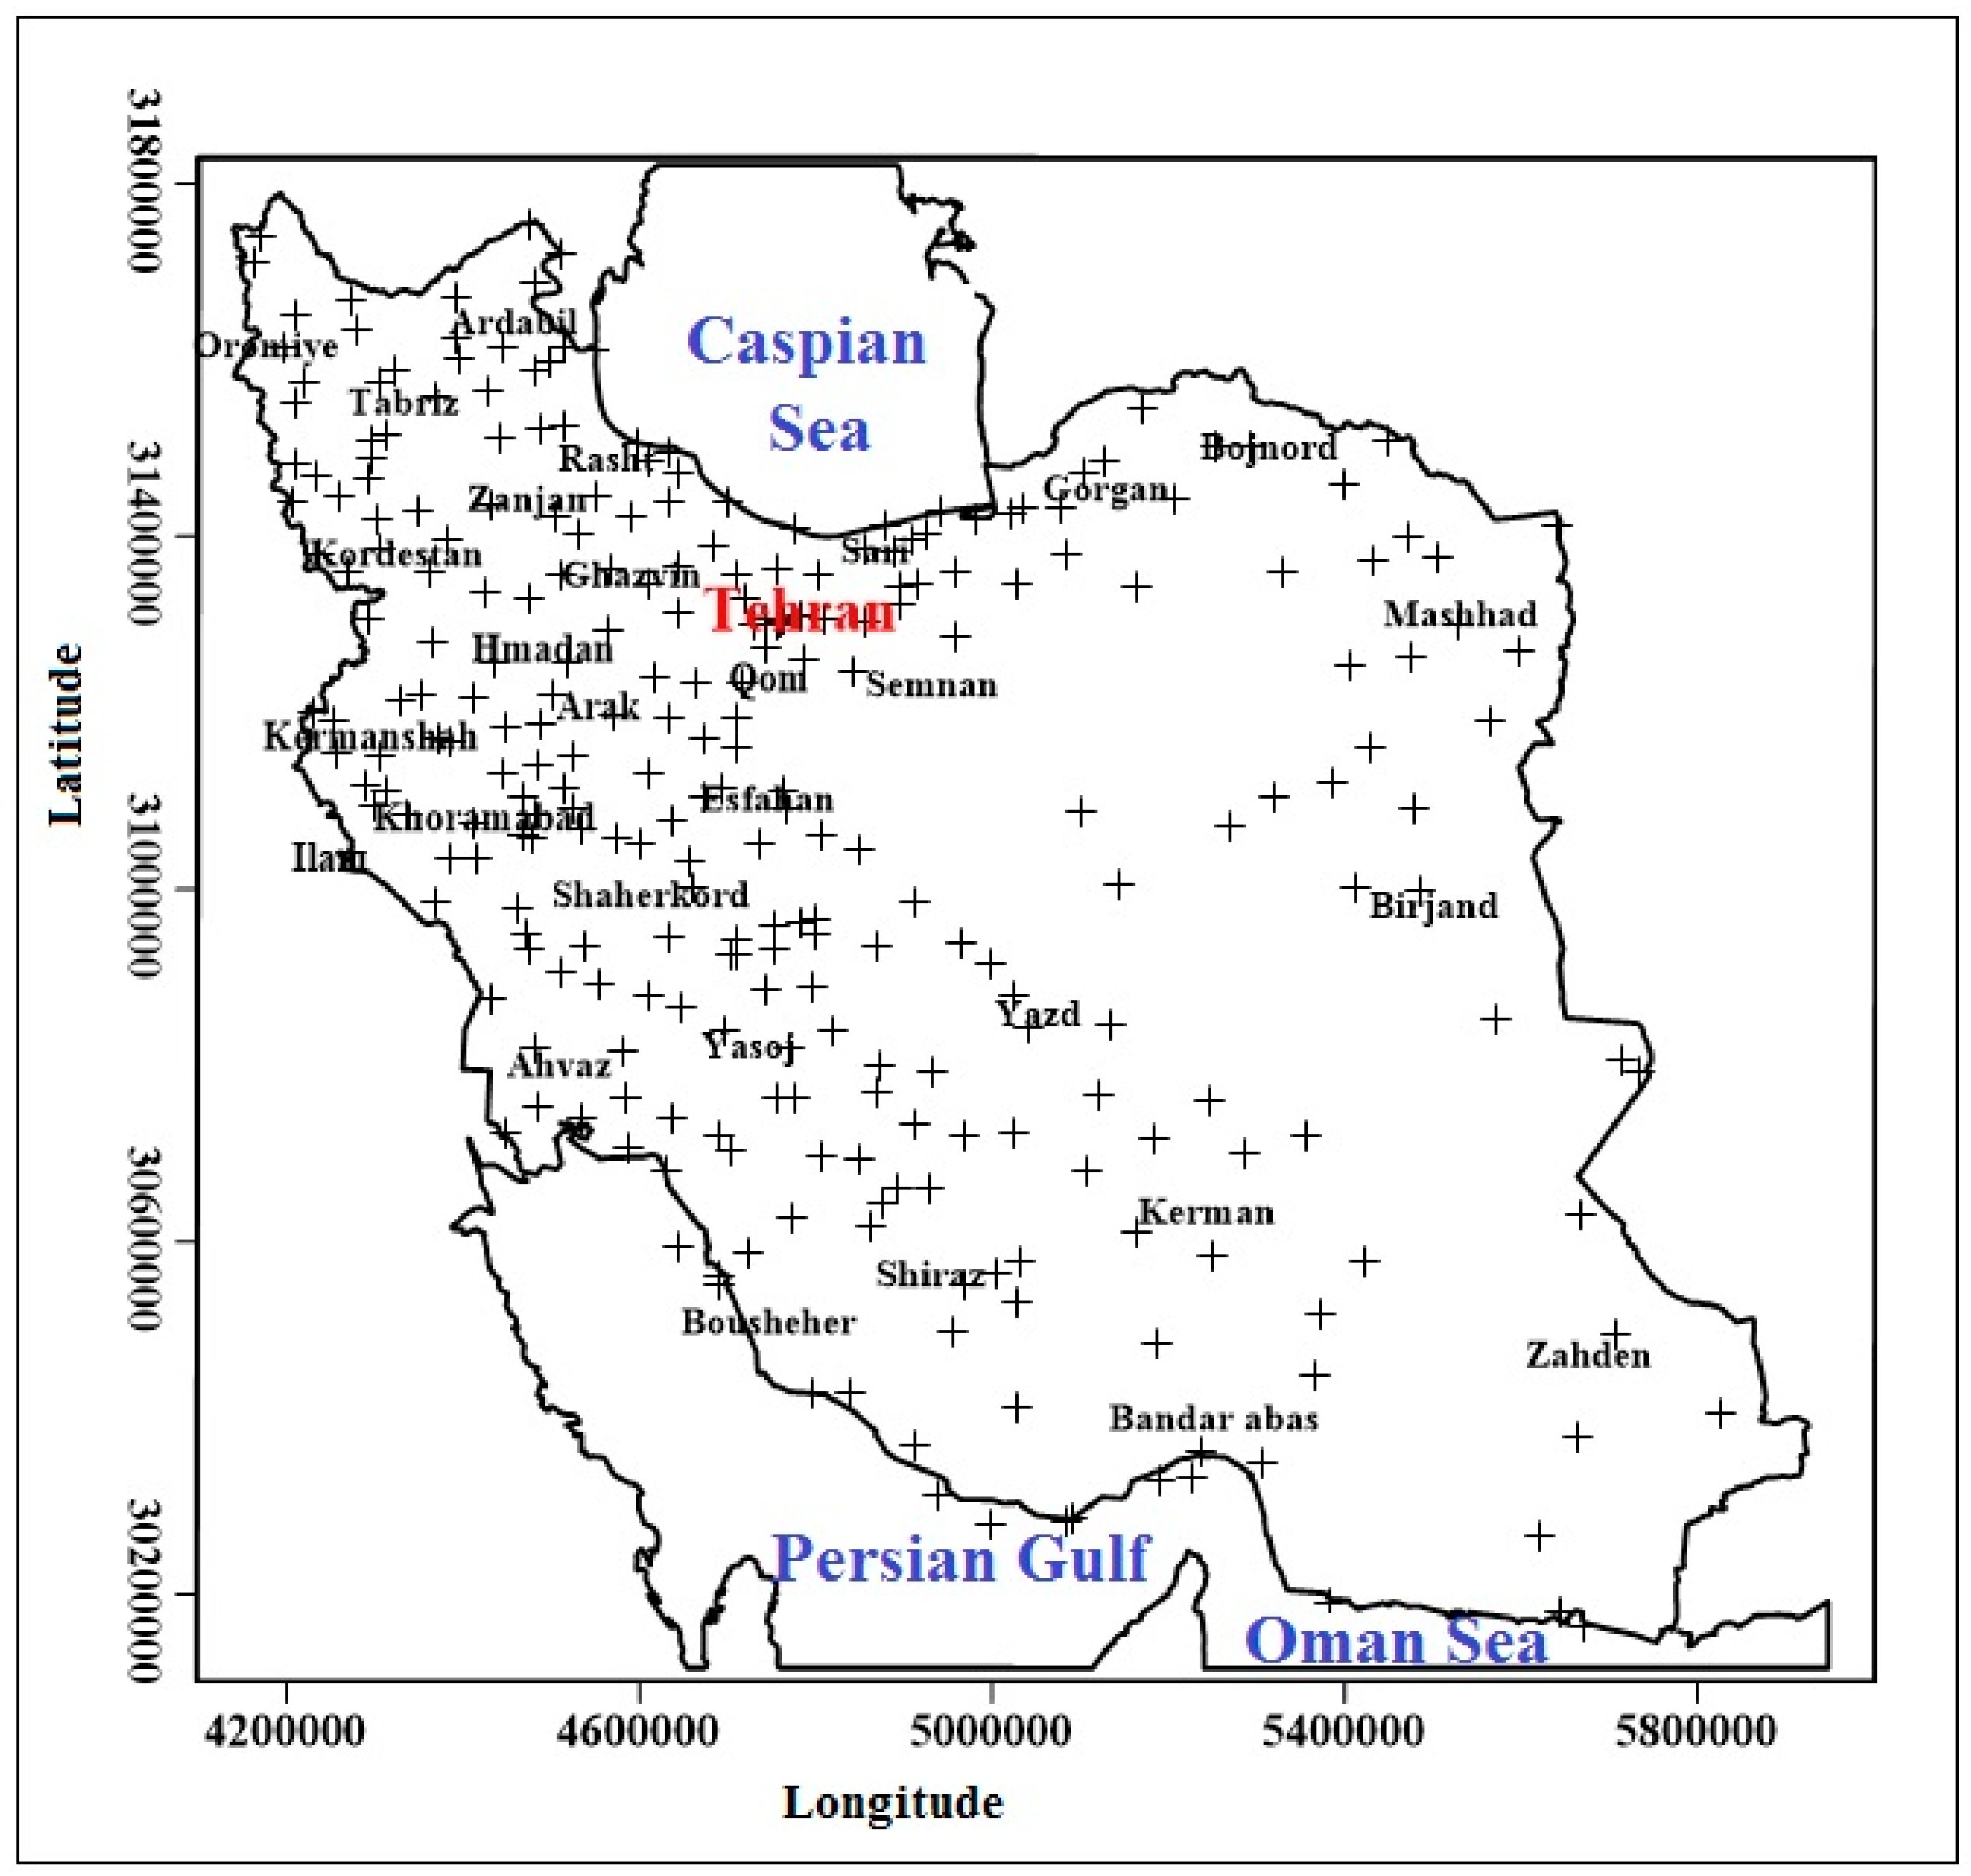
Environmental data: This group of data was obtained through interpolation of values of daily minimum temperatures registered in stations from 1961 to 2010. The data over these 50 years, which were collected from 450 synoptic and climatology stations of Iran’s Meteorological Organization (IRIMO), were sorted and interpolated (Figure 1). The data of this database have a spatial resolution of 15 km × 15 km, which have been produced in the form of Lambert Conformal Conic Projection, and arranged in the form of a 7187 × 18262 matrix with an S makeup (time in rows and place in columns). After collecting the data, the next step was identifying frosts in each of the cells. In the majority of climate studies, an important part of the research is defining the studied variable because it will influence other research steps. Many researchers have considered temperatures below 0 °C as the cut-off criterion for identifying frosts [26,27]. In the current study, a condition should meet the following three criteria to be considered as an example of frost in Iran:
  • The temperature in the particular day should be less than 0 °C.
  • This low temperature should last for at least two consecutive days.
  • The temperature should have a minimum coverage of 50% (with the assumption of spatial continuity).
Based on the first criterion, only very low temperatures were taken into account for each of the 7187 cells, hence observing the relativity of frost for different areas of the country. Furthermore, the second criterion (i.e., continuity of low temperature for at least two consecutive days) makes it possible to distinguish systematic frosts from local ones that are caused by environmental factors (e.g., height) or clear weather, which leads to radiation cooling.
2.
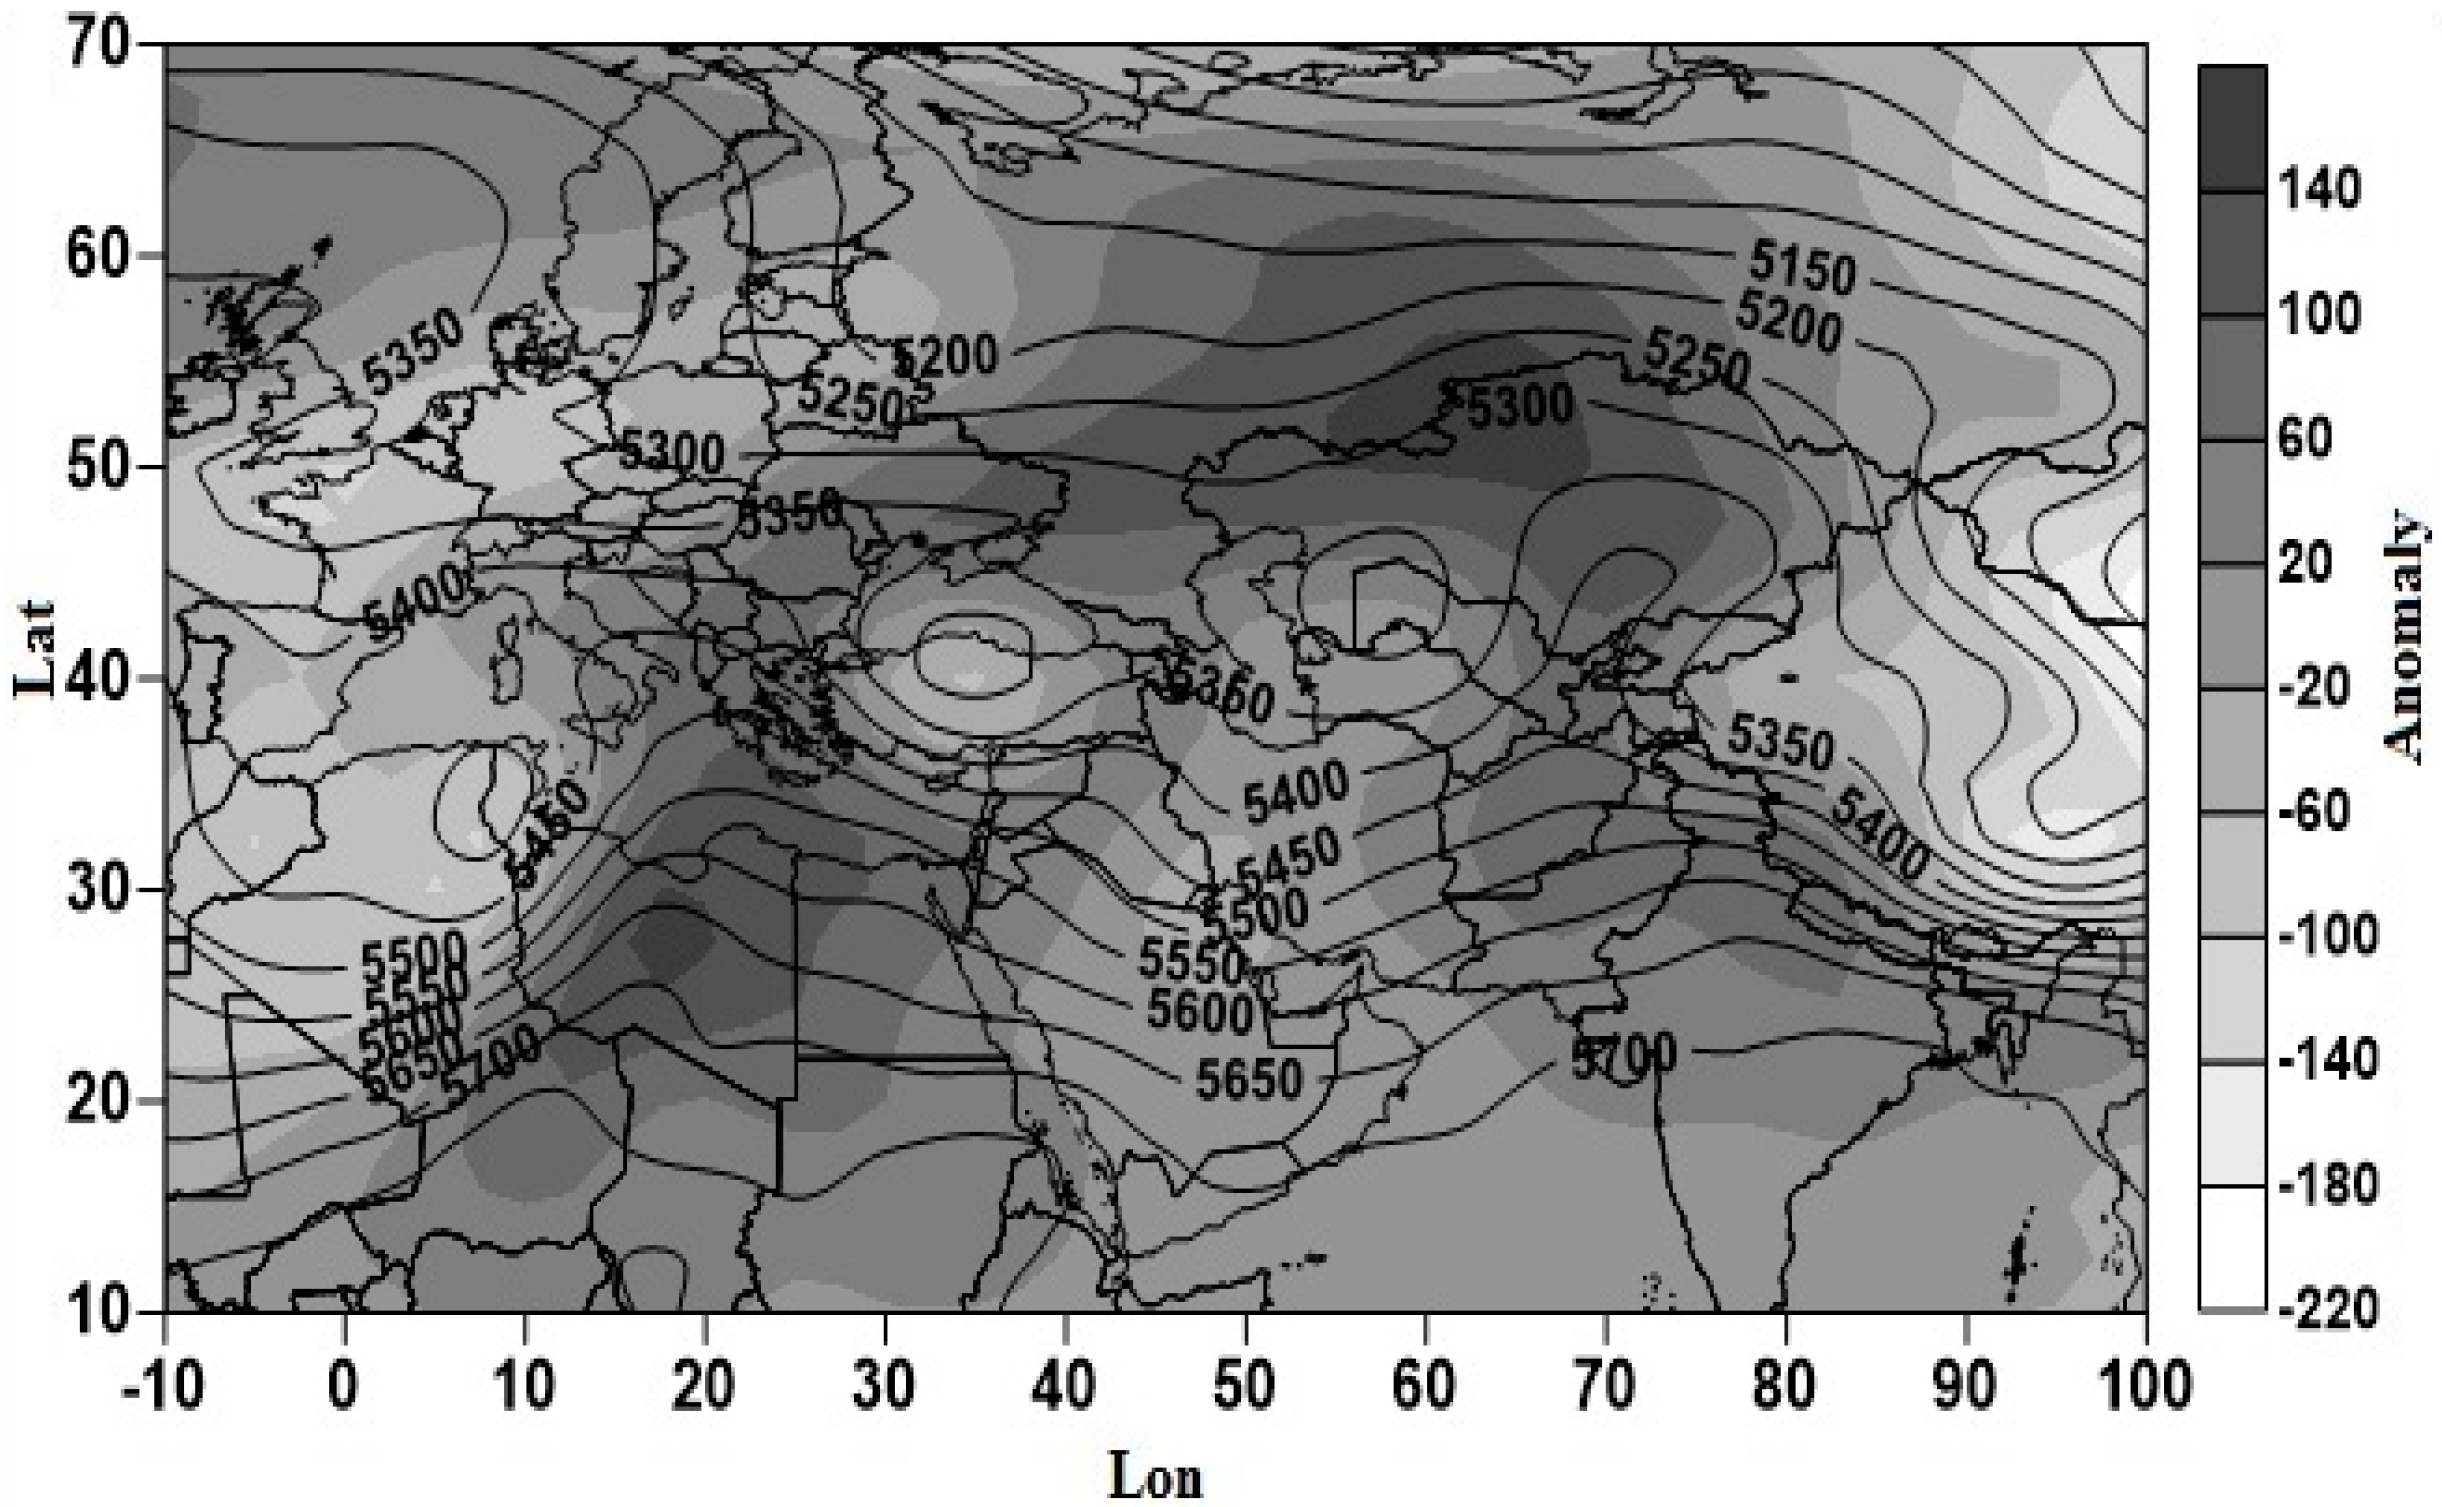
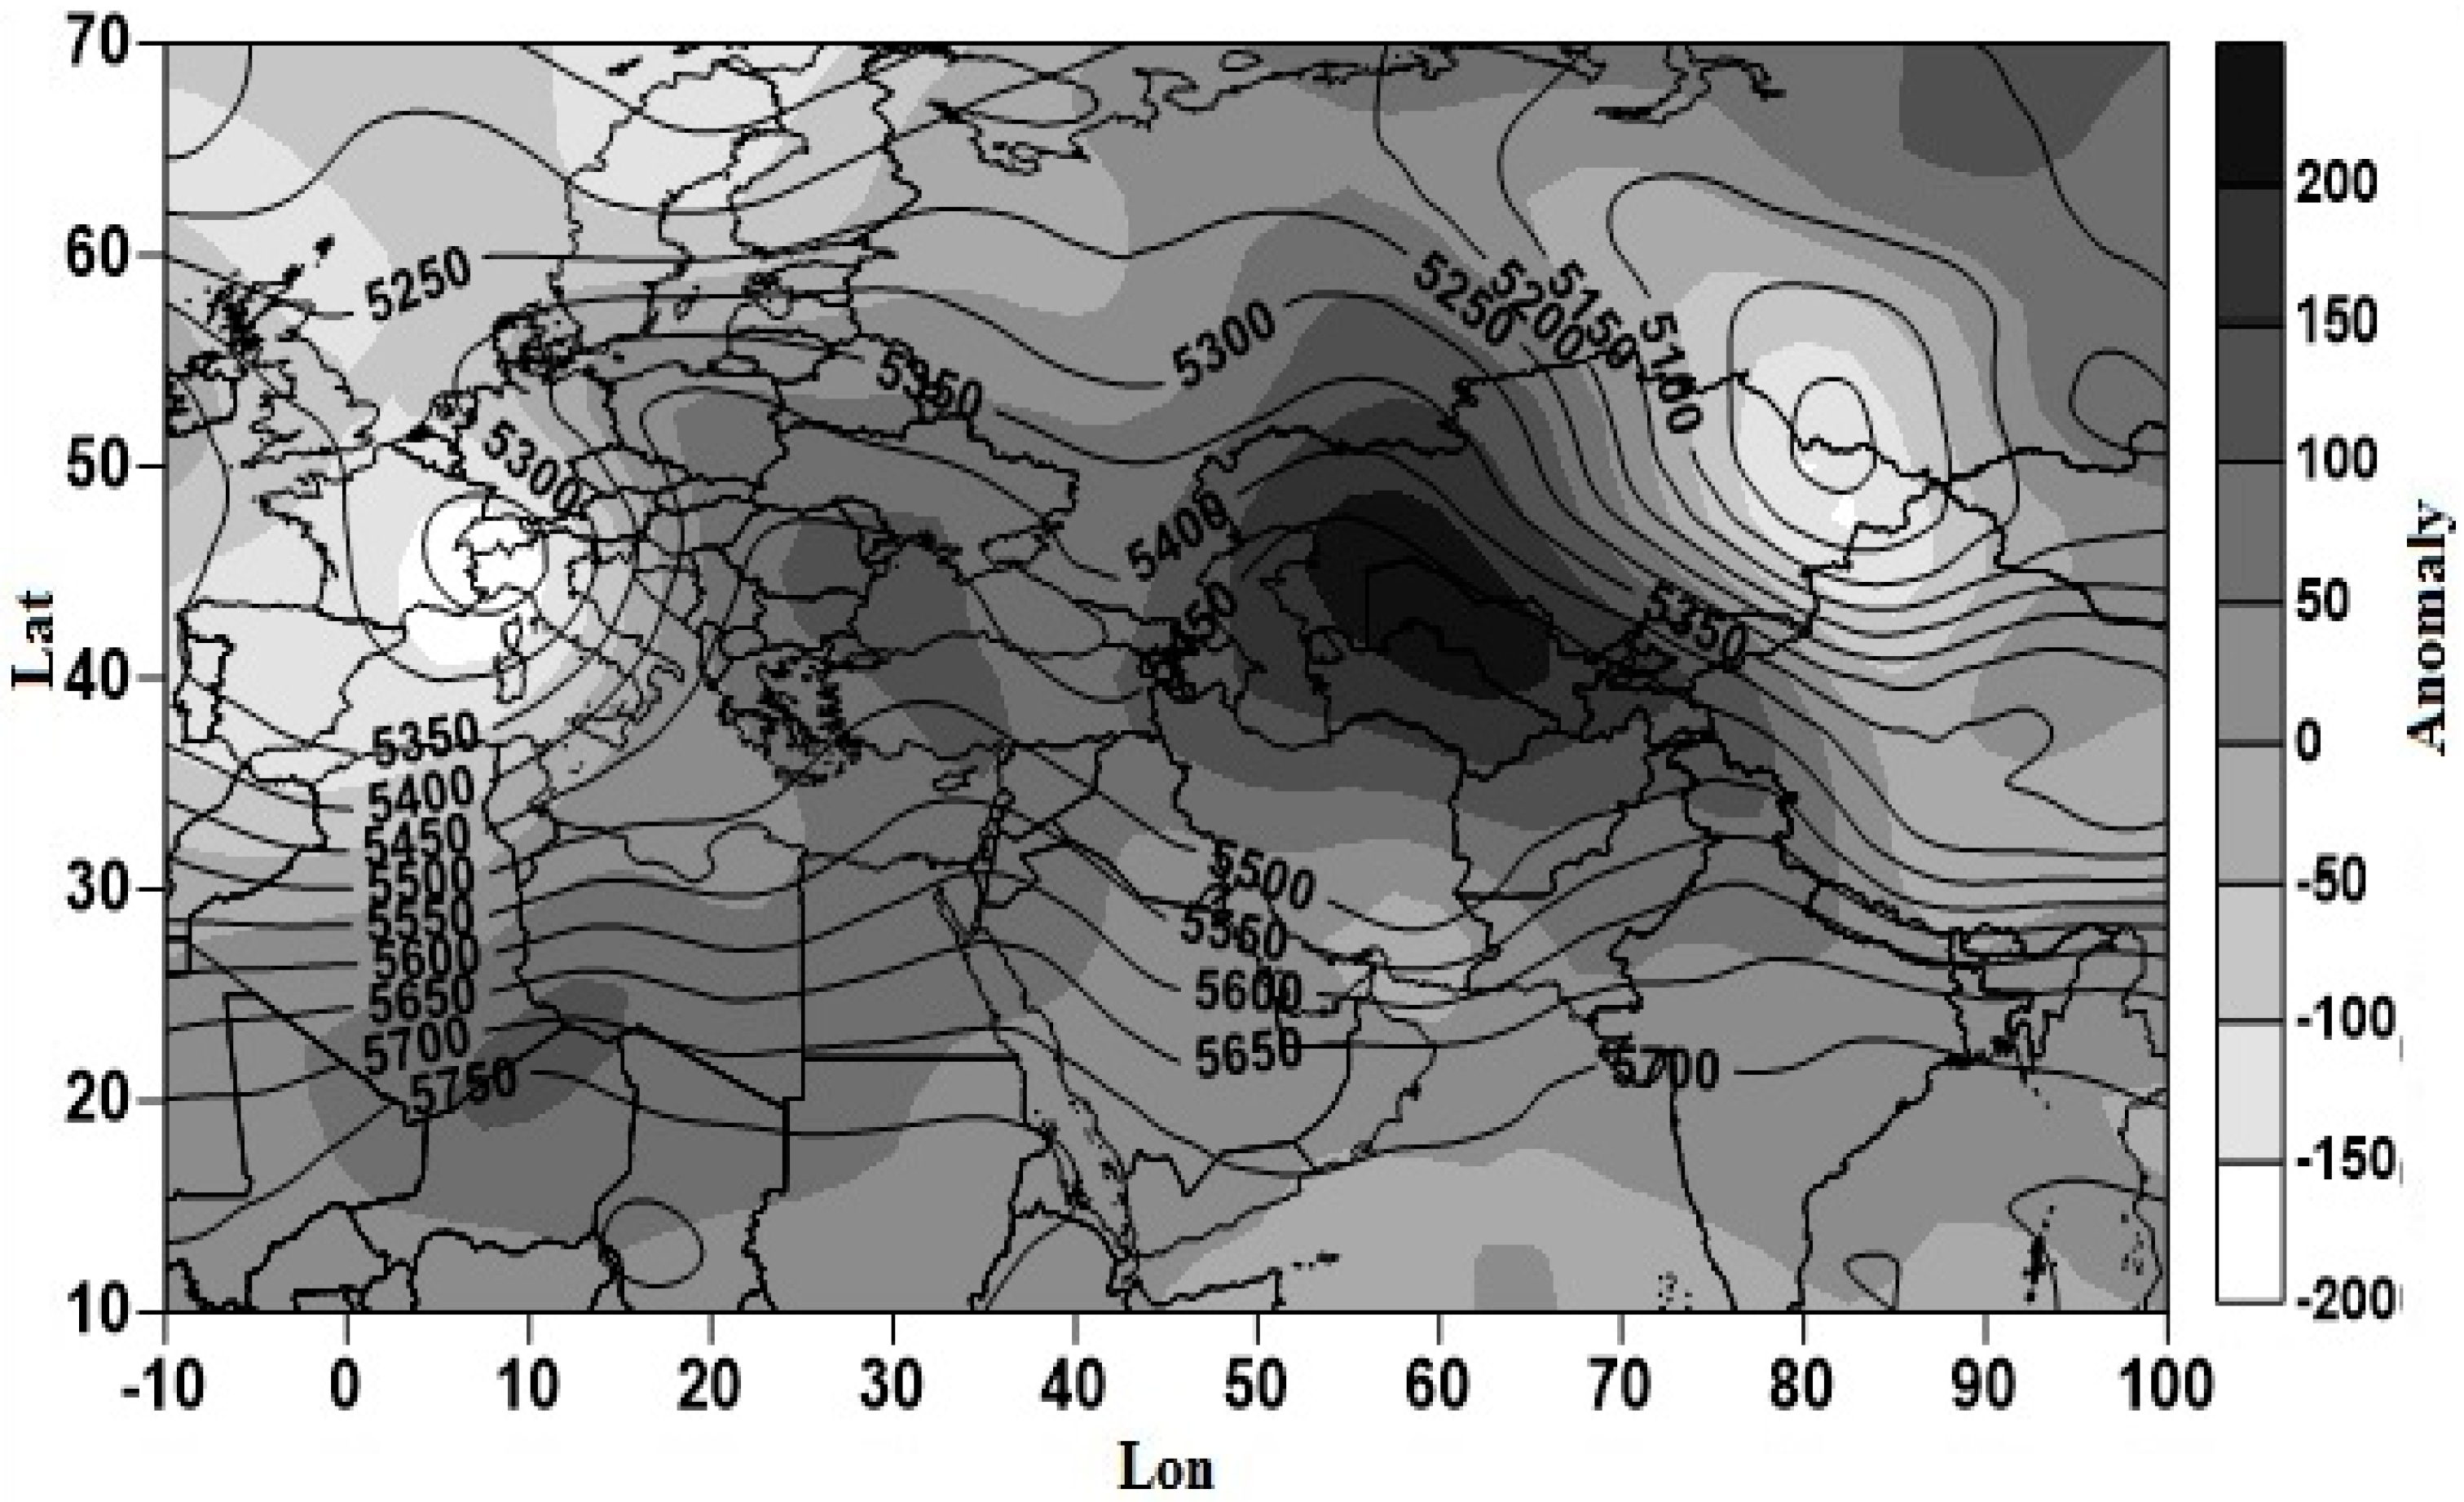
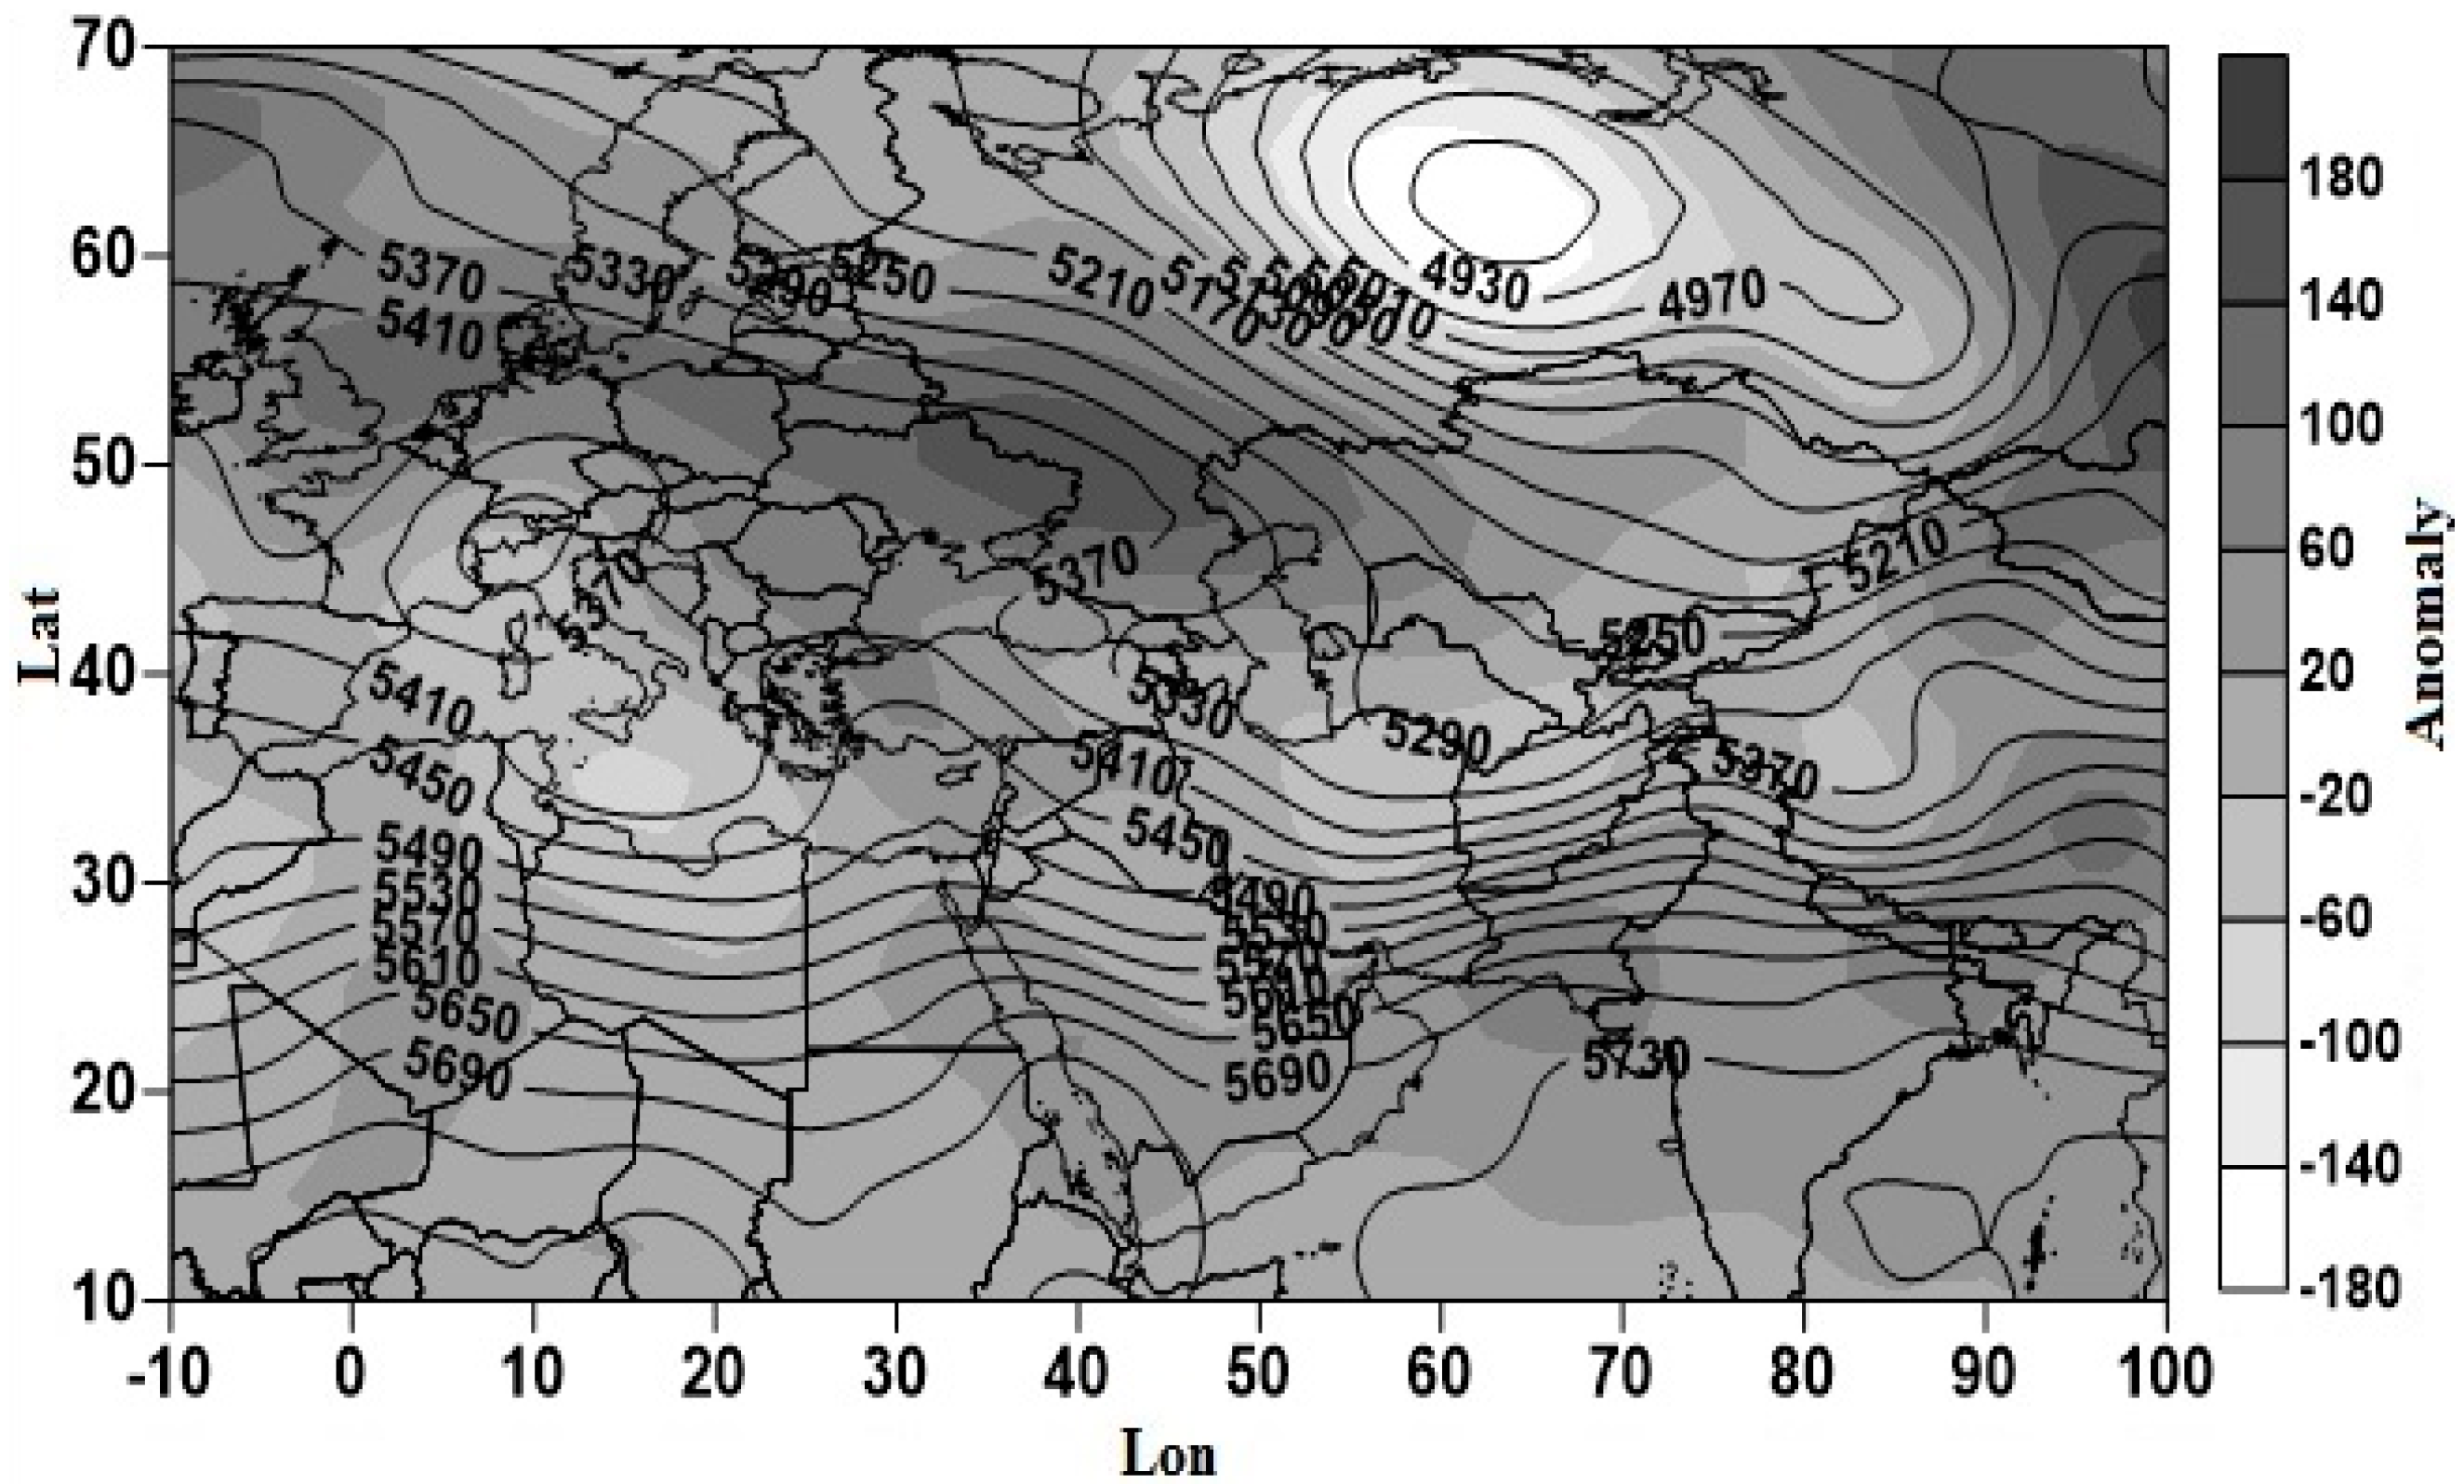
Weather data: This part of the data, which was used for calculating atmosphere thickness, consisted of hPa geopotential height data and were obtained from National Centers for Environmental Prediction/National Center for Atmospheric Research (NCEP/NCAR). These data have a spatial resolution of 2.5 × 2.5 degree of arc. Considering the research topic, the researchers intended to include all of the systems that are effective in the formation and continuation of frost waves in Iran. Therefore, the study covered the atmospheric system ranging from −10 degrees west longitude to 100 degrees east longitude and 10 to 70 degrees north latitude. Another group of maps that is used in synoptic climatology is thickness maps. They indicate atmosphere thickness, which usually ranges from 500 to 100 hPa. This is the thickness that is considered for the entire atmosphere. In other words, studying the thickness between these two layers (500 and 1000 hPa) is representative of the status of all layers. The following equation, which is known as hypsometric equation, is used to calculate atmosphere thickness:
T h i c k e n s s = H G T 500 H G T 100
This study used the environment to circulation approach to identify and analyze the patterns that are effective in the formation and continuation of frosts in Iran.
After identifying atmosphere thickness, cluster analysis was utilized to come up with the thickness pattern of Iran’s frosts. In the next step, cluster analysis was conducted to categorize the thickness pattern data and identify the representative days. Cluster analysis is a data analysis procedure through which data are classified into groups according to predefined features. This procedure is used to reduce complexity by categorizing similar data in a single group. Thus, the minimum and maximum variance can be, respectively, observed in within and between group data. There are different methods for calculating the distance between two points. One of the most popular methods is the Euclidean distance.
The Lund correlation method was used to identify the representative days for each of the atmosphere thickness clusters. That is, the day with the highest degree of similarity to other days of each cluster was used as the representative day of that cluster. Correlation coefficient shows the degree of similarity between the patterns in two different maps. Indices of more than 0.5 are indicative of a strong correlation [7]. Therefore, in the current study, the day that had the highest correlation coefficient with other days of a cluster was selected as the representative day.

3. Results and Discussion

Figure 2 illustrates the dendrogram obtained as a result of conducting cluster analysis on the atmosphere thickness of Iran’s frost events. In this figure, atmosphere thickness maps were drawn for the representative days of different groups (two to five groups). Then, the maps of representative days of different groups were compared and, through trial and error, the appropriate place for cutting the map and selecting suitable groups for extracting patterns were determined. Based on the analysis outcomes, five groups were identified. In total, the number of detected frost events was 1622, and the date and features of the representative days of each group are displayed in Table 1.

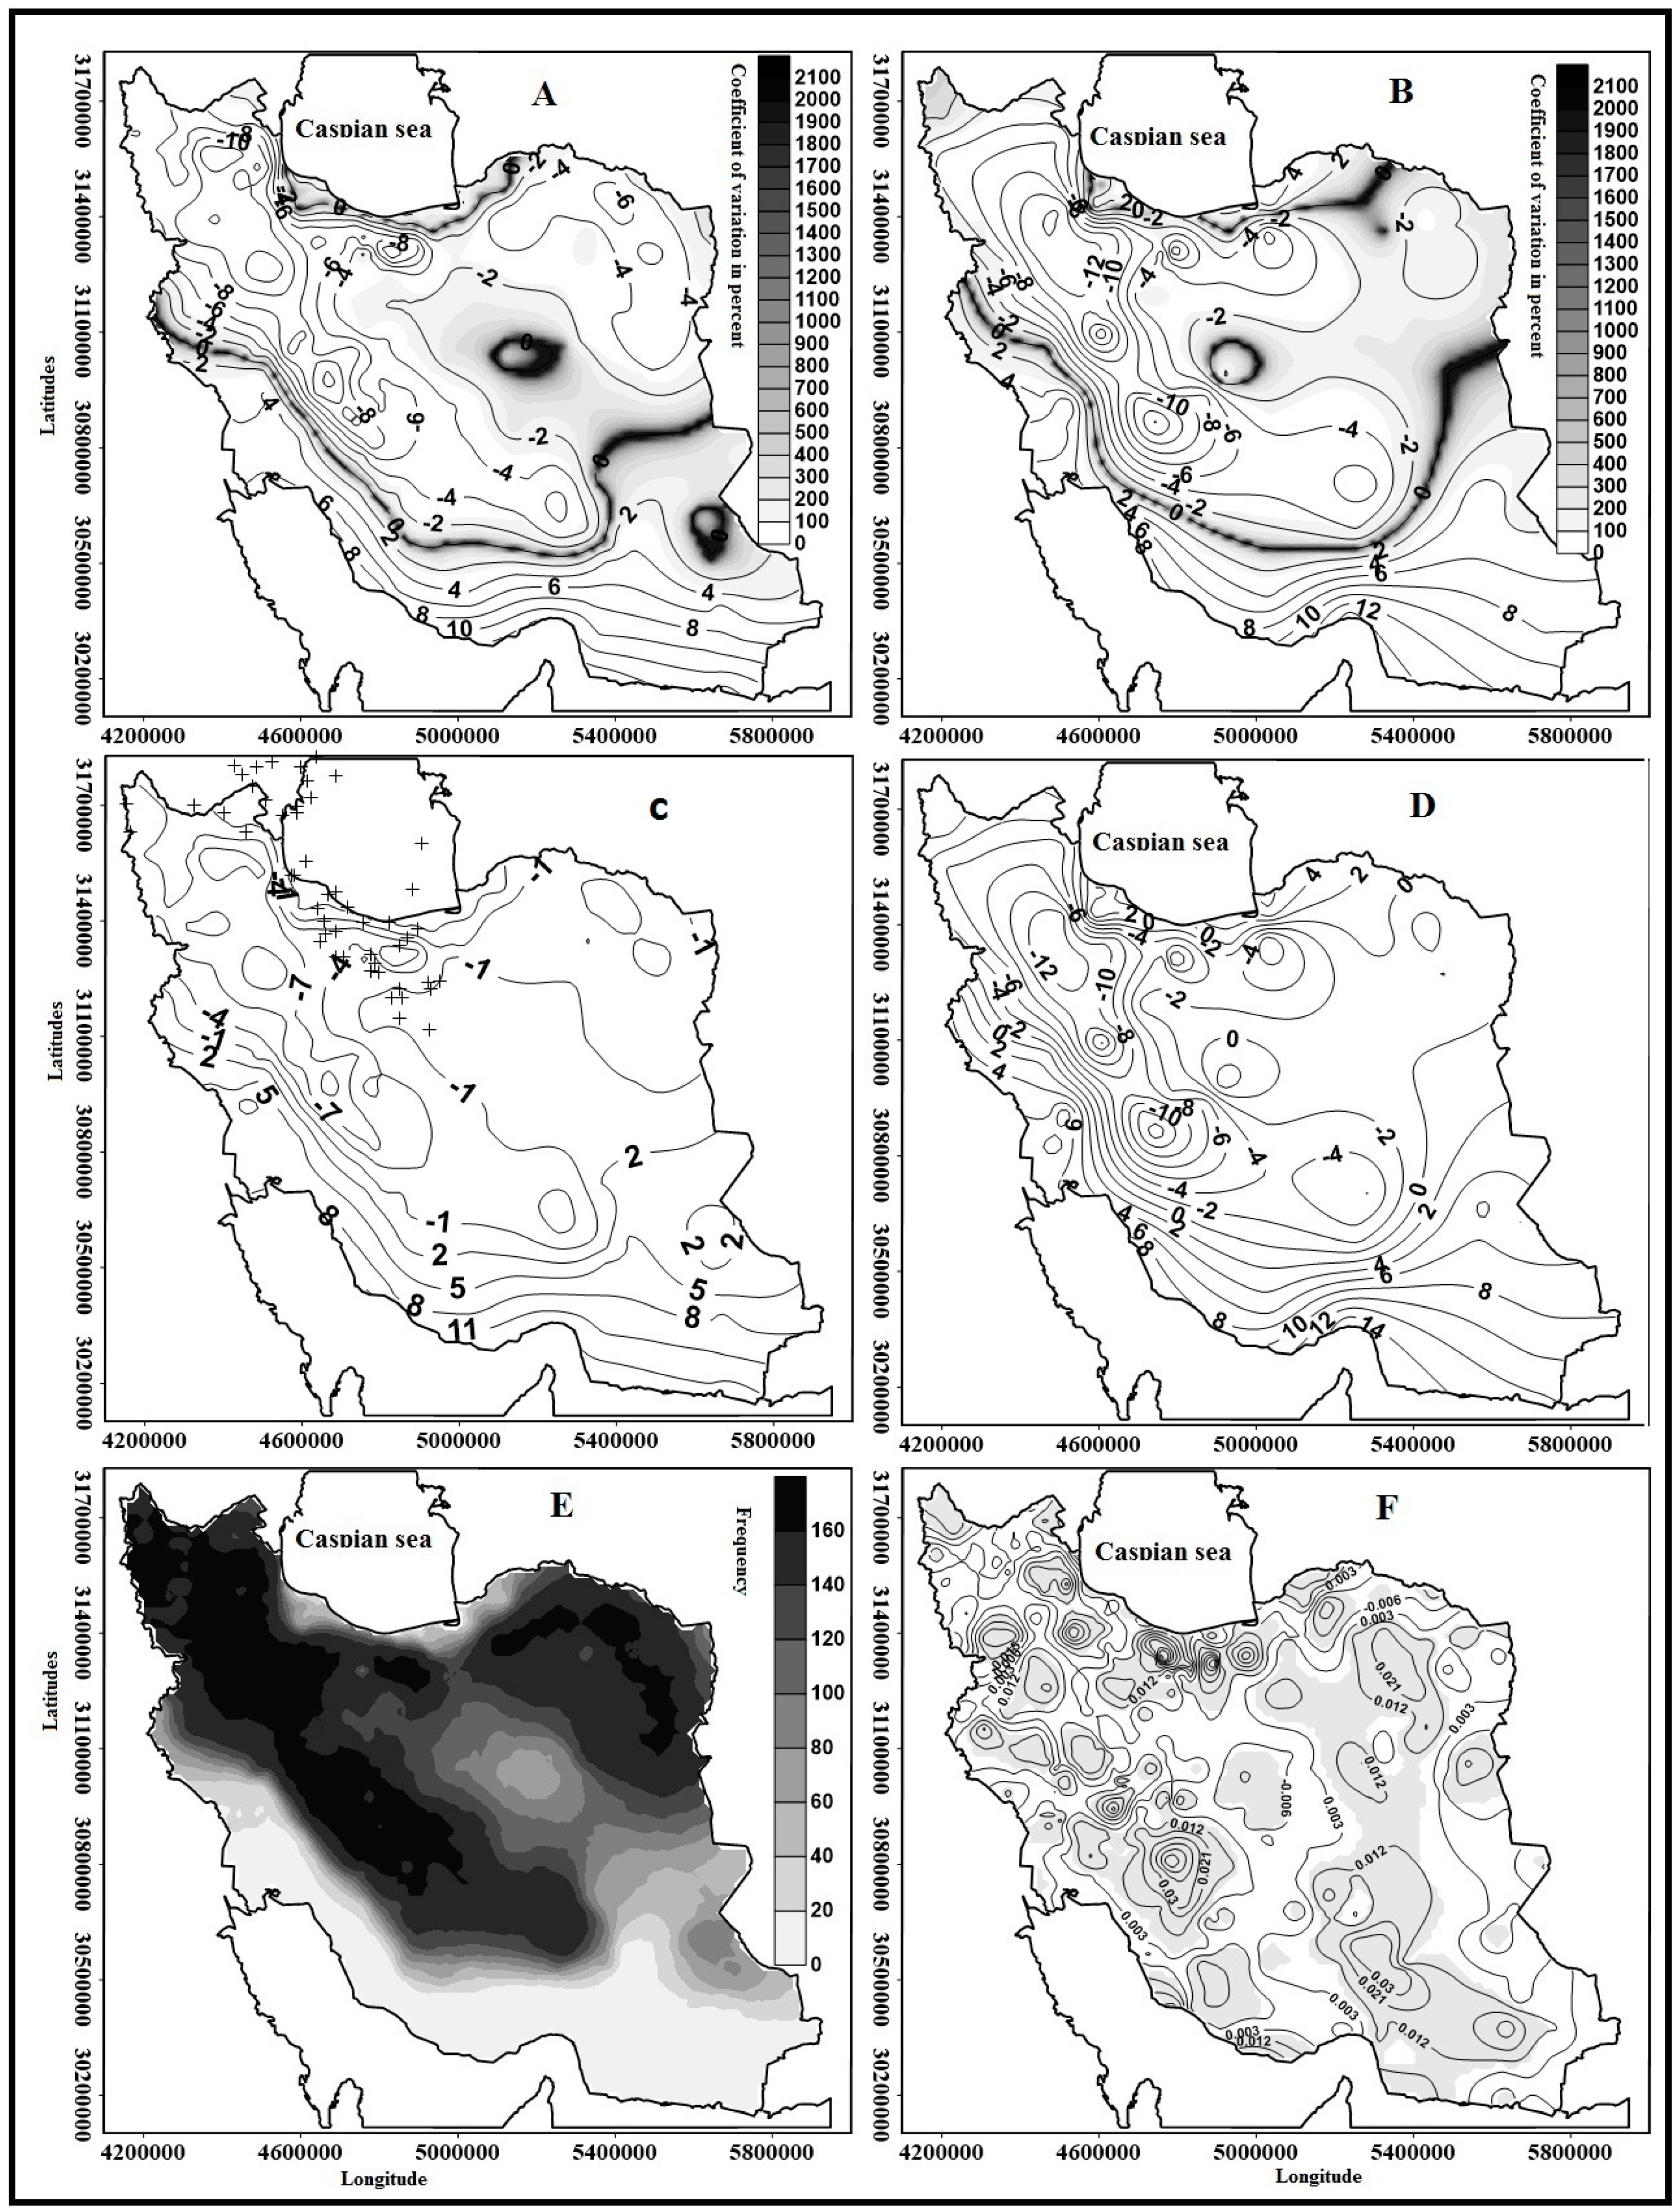
3.1. The First Pattern: Siberian High-Pressure and European High-Pressure

Figure 3 illustrates the atmosphere thickness pattern for the first group. This pattern (i.e., Siberian high-pressure and European high-pressure) covers 20.9% of Iran’s frosts. As the figure indicates, in this pattern, the atmosphere thickness system of Siberian high-pressure stretches from northeast to southwest in most areas of Iran. Thus, the tongue of Siberian high-pressure, which has a thickness of 5250 m, spreads almost to the center of Iran. This tongue leads to the pouring of cold air from northern latitudes. As the thickness Siberian high-pressure tongue increases, the thickness pattern of European low-pressure, with a contour of 5300 m, mainly influences the southern half of the country. Many researchers believe that Lake Baikal is the most important area for Siberian cold high-pressure [28]. However, atmosphere thickness plays a significant role in atmospheric phenomena. As shown by Alijani, thickness maps can be a good guide for estimating precipitation type, the front location, and many other phenomena [27].
In cold weather, air is contracted and atmosphere thickness reduces, whereas, in hot weather, atmosphere thickness increases. Therefore, it is observed that negative anomalies of atmosphere thickness have stretched all over Iran. The tongue of these anomalies reaches −300 m in some areas of Russia. The thickness of this tongue declines in lower latitudes and reaches −100 m in central areas of Iran. The largest intensity of negative anomalies (between −200 and −150 m) can be observed in the northern part of Iran. In addition to the area from which the Siberian high-pressure enters Iran’s atmosphere, local and regional factors, like accumulation of topographies and higher latitudes, provide a suitable condition for intensifying negative anomalies. Thus, only in a small area of southeast of Iran have the atmosphere thickness anomalies reached 50 m on this day. Northwestern areas, which are located in the western part of this pattern, are largely influenced by it. On this day, the average temperature of the northwestern area reached −12 °C (Figure 4B). At the same time, atmosphere thickness has reduced from the east to the west causing a discontinuity. This is the areas where the abovementioned air mass collides with cold weather coming from higher latitudes (northern Russia) and significantly decreases temperature in this area. Based on the pattern of atmosphere thickness lines, masses of cold air have entered Iran from northeast and have moved toward southwest. These masses come from northern parts of the country and Siberia and have caused cold weather in most parts of Iran, hence the reduction of thickness in northern latitudes. Figure 4 displays some statistical features for the first group and its representative day. Figure 4A,B, shows the spatial distribution of mean and coefficients of variation for the first group and its representative day. As the figure illustrates, in the first group, the highest coefficient of spatial variation for Iran’s frosts belong to a strip along the Zagros mountain ranges. In the central part of Iran, the coefficient of variation is more than 1500%, which indicates high variability of frosts in this area. On the other hand, the lowest registered average temperature is −8 °C, which was registered for the central Zagros and northwest of Iran. In the first group, the majority area of the country (around 41%) has an average temperature ranging from −7.69 to −2.17 °C (Table 2). For the representative day, however, almost 50% of the country’s area has experienced a temperature between −11.11 and −2.31 °C, which is the lowest recorded temperature. Thus, in the representative day, the country has experienced very low temperatures to the extent that about 6% of Iran’s area (which is mainly located in northern part of the country) has experienced temperatures lower than −20 °C (Table 2). Figure 4C shows the spatial distribution of frosts’ anomalies and center of masses for the first group. The compact nature of the center of masses shows that frosts follow a regular pattern, while the dispersion of this center indicates that frosts follow an irregular pattern. The center of masses for the first group shows that Iran’s frost distribution which is influenced by the thickness patterns of Siberian high-pressure and European High-pressure follows an irregular distribution. In the first group, 47.2% of the country’s area has negative anomalies (Table 2). However, on the representative day, more than 55% of Iran’s area has negative anomalies (Table 2). In this first group, the severest anomalies of Iran’s frosts happen in the form of a strip along the Zagros mountain ranges and north and northwest topographies. Figure 4D illustrates the distribution of frosts in the first group. Accordingly, in the first group, the largest area of the country has had a frequency of more than 300 days. In contrast, the southern half of the country does not have any frost. Spatial distribution of frosts in the first group indicates that, in almost all parts of the country, frost has experienced a downward trend (Figure 4E).

3.2. The Second Pattern: Deep Trough Pattern of Eastern Europe and Sudanese Low Pressure

This pattern encompasses 11.03% of Iran’s frosts. Based on the thickness map (Figure 5), a high pressure center, with a thickness of 5250 m, is located on central Europe. In addition, the Siberian high pressure, which has a height of 4950 m, is located over Mongolia. A weak tongue of Siberian high pressure has stretched on Iran. However, in this pattern, Iran’s frosts are mainly influenced by the deep trough pattern of Eastern Europe and Sudanese low pressure.
Because of its location, the Siberian high pressure system plays an insignificant role in this pattern. However, the way the European low pressure system is located directs polar cold weather from northwest toward southeast, hence the movement of this cold weather toward Iran. These factors have resulted in the movement of cold weather of northern latitudes toward Iran. Furthermore, the center of these anomalies (with a thickness of −200 m) is located in northern latitudes of the country, especially on the Caspian Sea and the northeastern part of Iran. Many researchers believe that the main origin of northeastern frosts is advection. In the meantime, the Siberian and European migratory high pressure systems play an important role; that is, when these systems dominate Iran’s area, cold weather enters the country from west, northwest, and northeast, causing cold weather in these areas [1,27,29].
Figure 6 illustrates some spatial features for the representative day and the whole second group. Accordingly, when the deep trough patterns of Eastern Europe and Sudanese low pressure dominate the country, in most areas of Iran, the temperature is between −2.31 °C and −11.5 °C during the representative day. This mainly includes latitudes above 30 degrees (Table 3). On the contrary, for the third group, a large area of the country has a temperature between −5.93 °C and −0.76 °C. In this pattern, about 57% of the country’s area experience a temperature that is lower than the average on the representative day (Figure 6A). At the same time, in southern areas of the country, due to lack of frosts, the coefficient of variation is insignificant (Figure 6A,B). In general, the frequency of frost events is insignificant in southern areas of Iran because of the role of dynamic high pressure system [27,30,31], low latitude, and high radiation. The highest frost frequencies belong to high areas of the country, especially Tehran, Tabriz, Adrebil, Hamedan, Zanjan, and Sharekord. Thus, it can be concluded that the frequency of frosts is influenced by height and latitude (Figure 6D). As a result, high areas of the country, like Sahand and Damavand, have the highest frequency of frost occurrence. The areas of the country that are mainly close to the Zagros mountain ranges have mid to high frost frequencies (Figure 6D). Hejazizadeh and Naserzadeh, for example, studied frosts in Lorestan Province and concluded that height is the main factor determining the frequency of frost occurrence in this region [32]. However, some researchers believe that the majority of Iran’s frosts are caused by advection [33].

3.3. The Third Pattern: Dual-Core Pattern of Siberian High-Pressure

The outstanding issue in this pattern is that the lines with the same degree of thickness gradually move from Europe to Iran. For example, the line with the thickness of 5400 m is located in western parts of Europe with a latitude of 44 degrees north, while the same line in Iran is located in the northeastern part with a latitude of 38 degrees north. This indicates that, in this pattern, conditions are suitable for the advection of cold weather from northern Europe to Iran (Figure 7). Cold weather centers that are located on the eastern part of the Caspian Sea and the northwestern part of Iran has further lowered temperature in these areas, hence they experience a colder weather compared to other parts. For example, in these regions, the temperature has reached −26 °C (Figure 8A). Therefore, compared to other patterns, the degree of anomalies in atmosphere thickness has decreased in this pattern, reaching −100 to −200 m during the representative day. This shows a decline of −50 m compared to the second group. This condition indicates that this group has warmer advections compared to other ones. However, on the same day, a large area in Europe experienced the advection of cold weather, an argument that is supported by the −200 meter thickness anomalies. Based on this map, it can be argued that when the low pressure system is located in northern parts of Russia, the two high pressure systems move toward lower latitudes. The interaction between counter clockwise air currents in the low pressure system and clockwise air currents in the tongue of Azores high pressure system draws cold weather from northern parts of Europe toward Iran (Figure 7).
When this system is located over this area, air flow deviate from its direct route and change the direction of western winds from northern parts of Europe toward Iran, thus the movement of cold weather of northern latitudes toward the country. When this pattern dominates Iran, the average temperature of cold waves has a considerable increase in comparison with the previous two patterns. Nevertheless, the formation of this core, especially in the northern part of Iran, leads to recording temperatures between −10.73 °C and −17.06 °C. However, when this pattern dominates Iran, the largest area of the country (45% on average) experience a temperature between 1.92 °C and −4.40 °C (Table 4). On the other hand, considering the whole group, the majority of the country’s area (over 68%) has a temperature between −8.045 °C and 3.52 °C (Table 4). The average temperature in this group (illustrated in Figure 8A) indicates that, in the northeastern part, temperature has reached −2 °C on average, which is not significantly different from the temperature pattern. Nonetheless, compared to the first pattern (when the Siberian high pressure system is dominant), temperature has increased in this area. By the same token, the northwestern part has had a 1 °C increase compared to the first pattern. However, on the representative day, temperature has increased by 2 °C compared to the whole group. As a result, in the northeastern part, temperature reaches −2 °C, while, in the whole group, the average temperature is −4 °C (Figure 8A,B). Anomaly maps further support this argument; that is, the negative anomaly of the representative day increase in comparison with that of the whole group in the northern part of the country (Figure 8B,C). On the other hand, the frequency of frost events in this group is in line with that of the other groups. More precisely, it is like a strip ranging along the Zagros mountain ranges as well as some parts of northwest and northeast (Figure 8D). It is thus concluded that, on average, in this group, 64.5% of the country’s area has negative anomaly (Table 4).

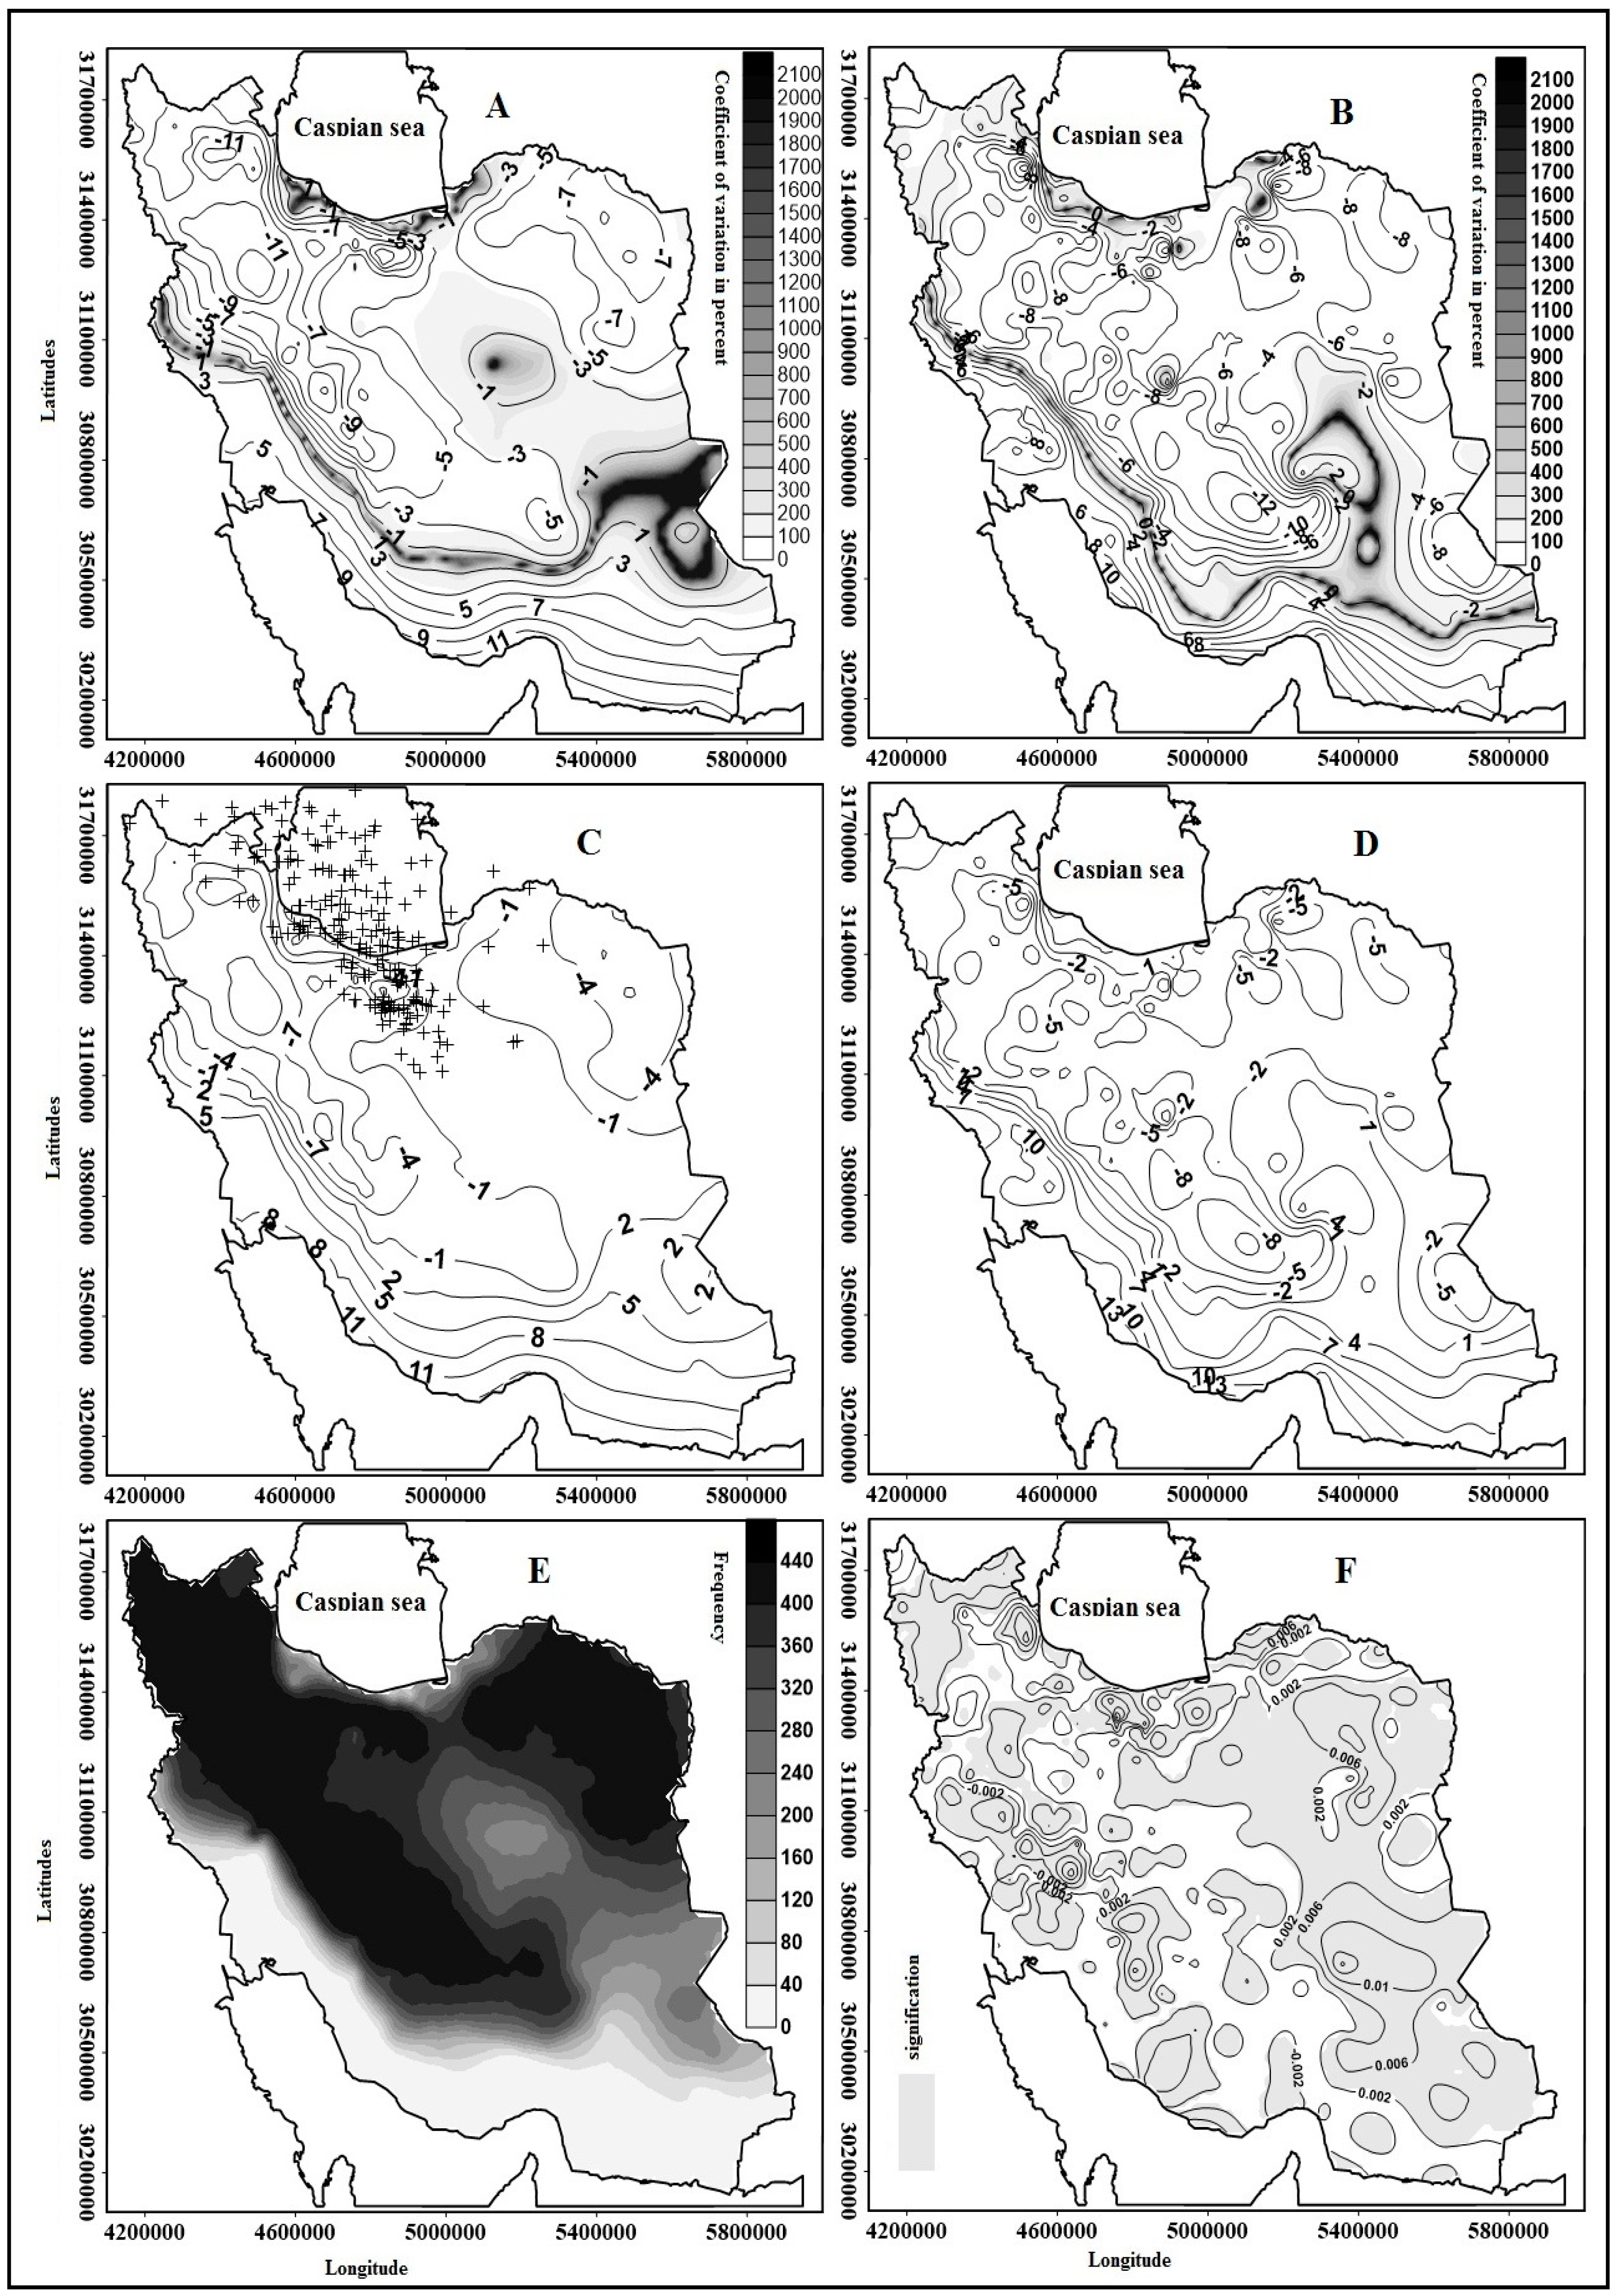
3.4. The Fourth Pattern: Deep Eastern European Trough and Polar Low Pressure Pattern

In this pattern of atmosphere thickness, a relatively deep trough, which has stretched from north to south, can be observed in high latitudes. This trough is extended to the east of the Caspian Sea. It represents the fall of cold weather from the latitude 70 degrees north toward the south of Kazakhstan. On the north of the Caspian Sea, the thick curve is compacted causing temperature gradient. This compactness is the cause of cold weather transfer from higher latitudes to lower ones including the studied area. In addition, from Northern Europe, thin tongues with a thickness of 5330 m, which move from northwest toward southeast, move toward Iran, leading to the fall of cold weather in this area. On this day, height anomalies are negative over this area and are between −60 and −20 m. All these conditions make it possible for cold weather of upper latitudes to create a high trough over Iran, leading to stagnant air and severe cold weather. As a result, the majority area of the country, especially the central part, experiences a temperature between −0.42 and −10.9 °C (Figure 9). Through conducting a synoptic and dynamic study of cold waves in tropical regions of South America, Pezza and Ambrizzi concluded that external tropical cyclones play a significant role in the formation of cold waves in these areas. They also found a relationship between cold waves in this region and changes in the waves of upper atmosphere in eastern parts of the Atlantic Ocean [16]. However, in this pattern, the interaction between low pressure systems of Europe has created a corridor of cold weather which connects northern parts of Europe and northern and western parts of Iran. These air currents move from Northern Europe toward Iran, which therefore result in thickness anomalies of −60 to −20 m over Iran. Furthermore, a core frigid temperature was formed in latitude 60 degrees north with a negative anomaly of −180 m. The positive thickness of Icelandic low pressure, which has a positive anomaly of 20 m, stretched to latitude 45 degrees north. Nonetheless, the poor blocking of Siberian high pressure prevents this tongue from entering northern areas of the country (Figure 9).
In this pattern, 79.95% of the country’s area is covered by this cold wave, which is the highest coverage percentage among representative days. Furthermore, compared to other representative days, the temperature of the country is significantly lower during the dominance of this pattern. In this time, the average temperature of the northeastern part of the country decreases to −5 °C, which indicates a decline of −3 °C in comparison with the fourth pattern. On the other hand, in the northwestern part of the country, this temperature reduction is significant. However, on the representative day, the majority of the country’s area (over 49%) experiences a temperature between −0.42 and −10.9 °C. This mainly includes areas along the Zagros mountain ranges and the northwestern parts of the country. It is then obvious that, in addition to external systems, heights, especially ripples, contribute to the cold weather. The frequency distribution of frosts in these areas (heights) further confirms the findings of this study (Figure 10A). Moreover, due to its typographic features, this part of the country has a high coefficient of variation, a phenomenon that further confirms the findings. In contrast, in southern parts of the country, especially the coasts of the Persian Gulf, fewer cold waves and frosts are experienced because of low latitude and the dynamic influence of subtropical high pressure. Thus, in this pattern, the largest area of the country has a frost frequency of 428 to 342 days (Table 5).

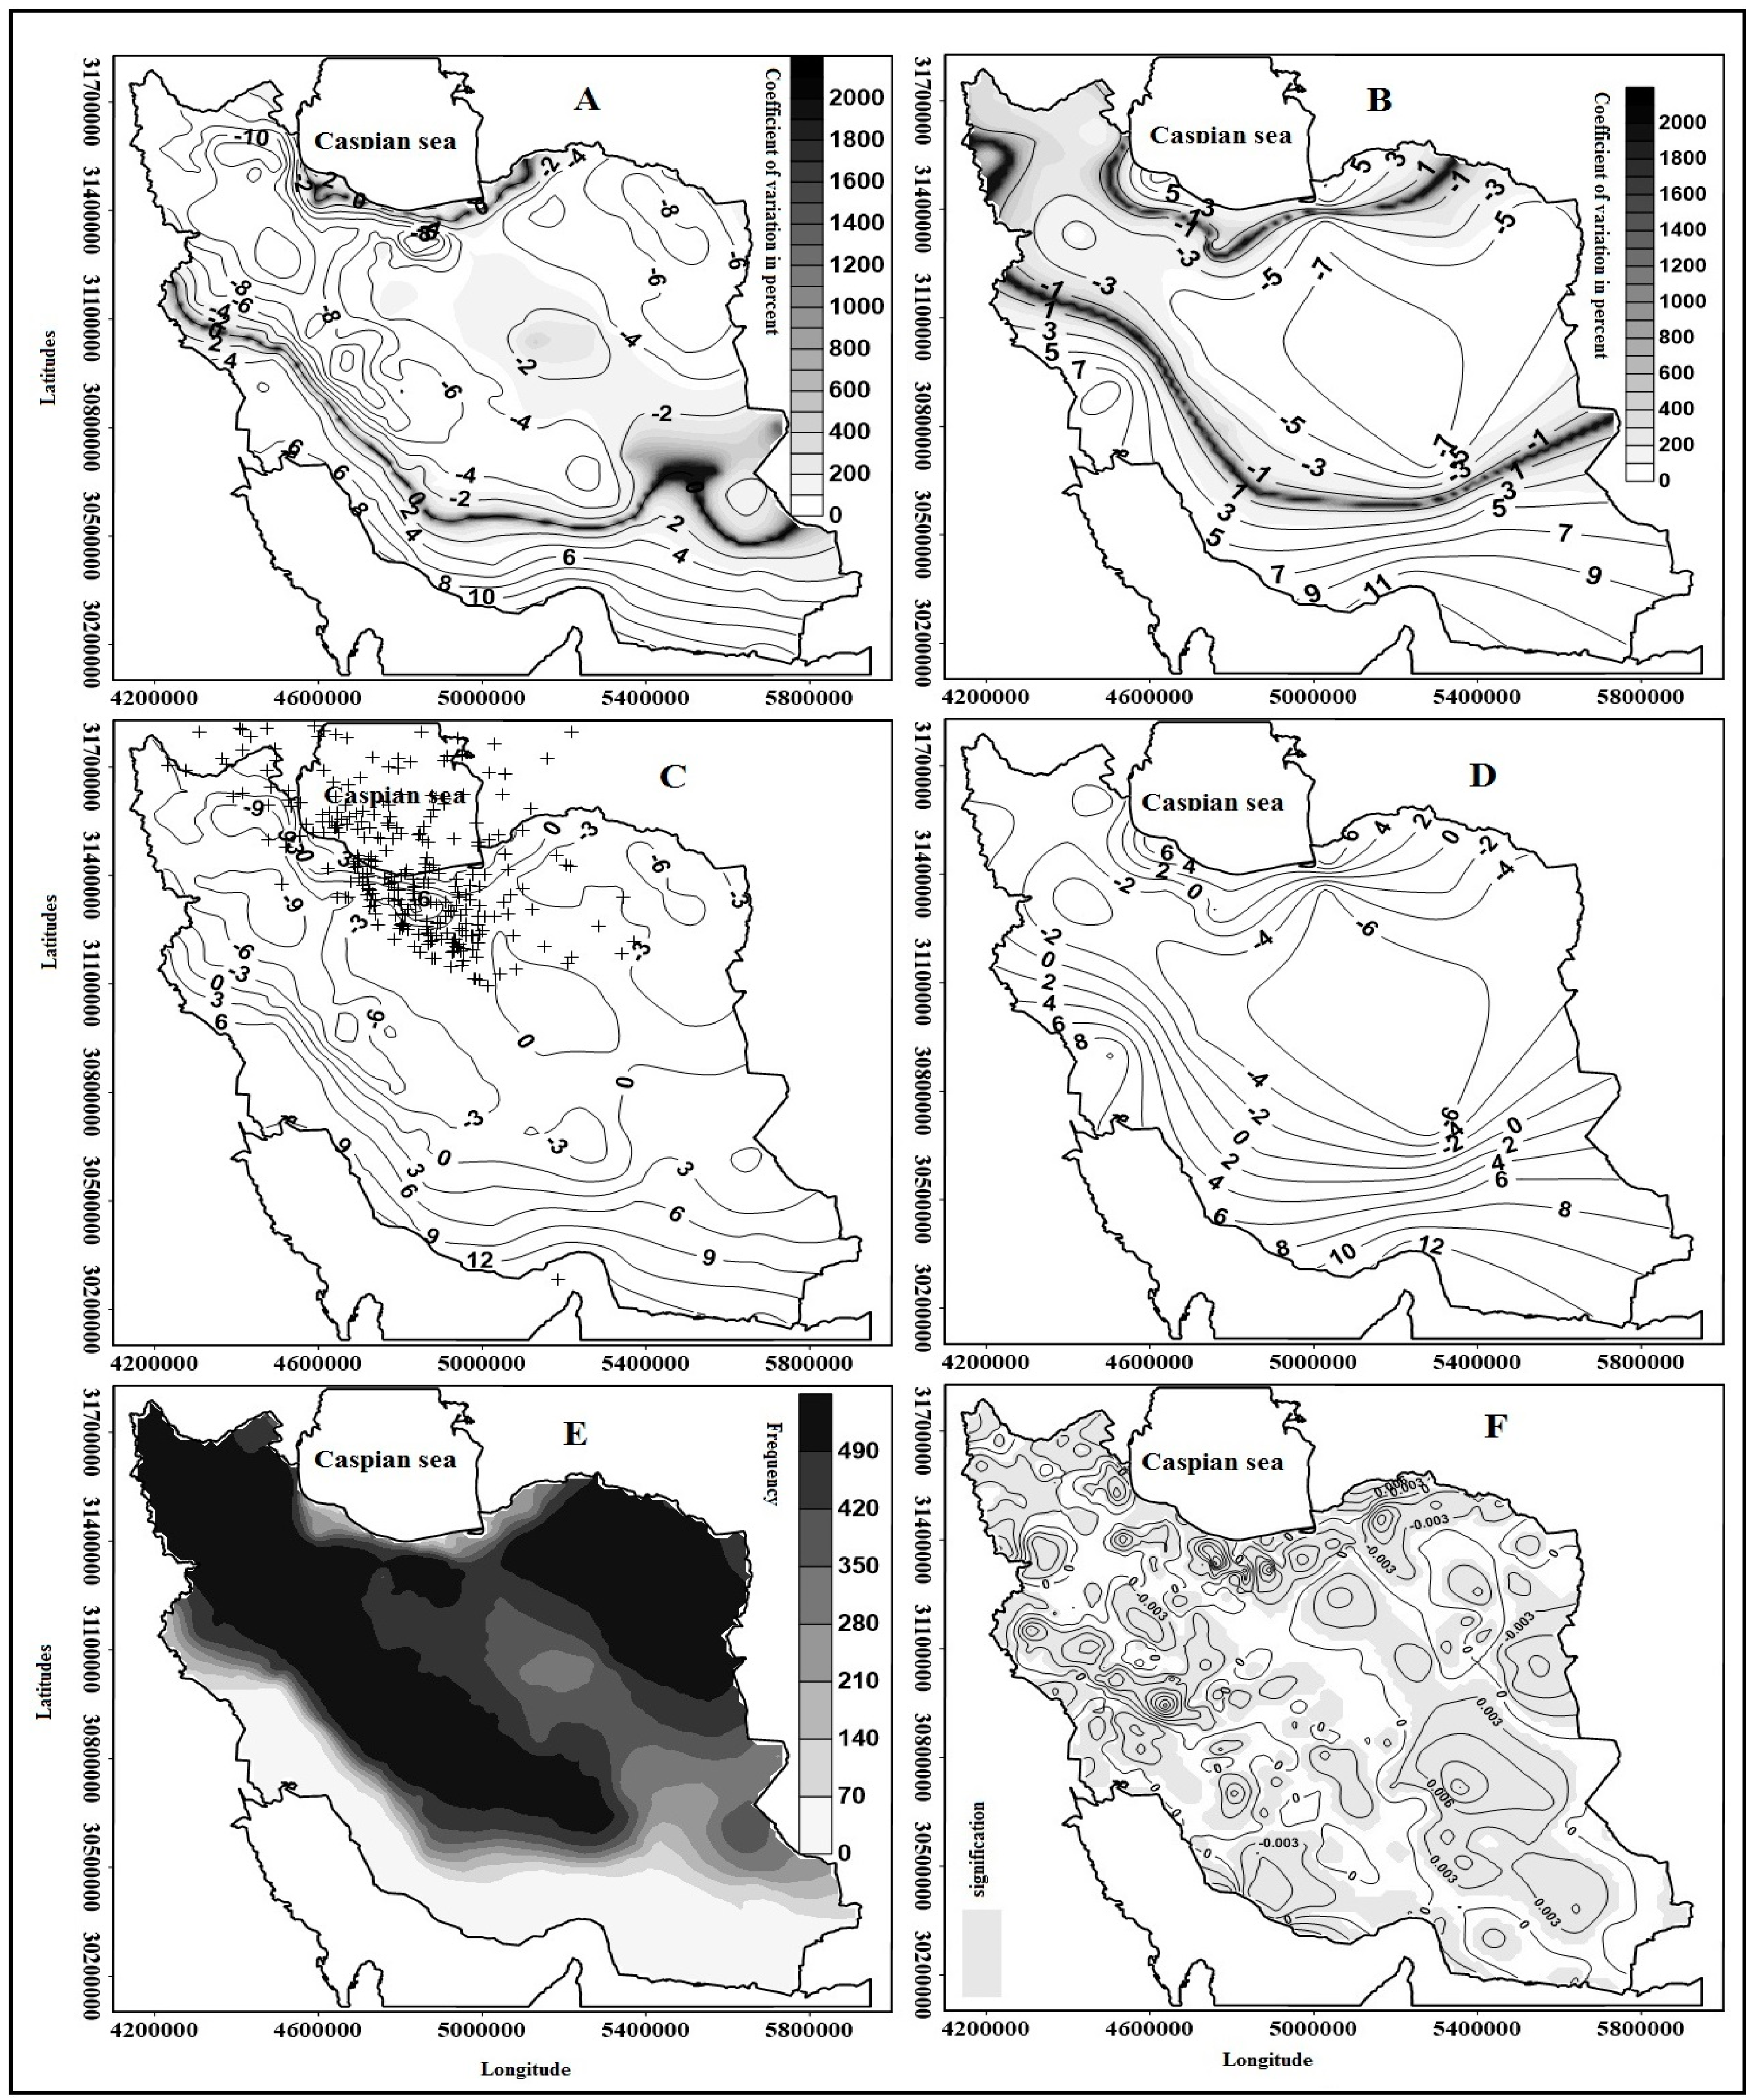
3.5. The Fifth Pattern: Omega Pattern

In this pattern of atmosphere thickness, southern Mediterranean Omega blocking is formed. Since the eastern part of Omega system is located on the east of Europe and the west of the Middle East, cold weather falls from higher latitudes toward these regions and the studied area. As a result of blocking system formation, west winds over western Mediterranean become meridional reaching polar areas. The northwestern part of Iran is in front of the path of this trough and the 5459 meter curve passes over this area. Spatial spread of these currents directs a larger proportion of cold weather from upper latitudes toward lower regions including the studied area. Thus, the temperature in this area significantly declines. On this day, the anomaly over the region was positive and between 150 to 100 m (Figure 11). Garcia conducted synoptic analysis for the north and northeastern frosts of Mexico, concluding that the main reasons for the frosts were the formation of blocking systems on the way of western winds and the existence of cyclone centers in the northeastern part of the United States [34].
Blocking is an atmospheric phenomenon that considerably influences the climate of its affected areas. In middle latitudes, atmospheric currents normally move in the form of waves from west to east. The wave-like movement of these currents can be clearly observed in middle latitudes of mid and upper levels of troposphere. Observing the monthly or seasonal average of these currents on the abovementioned levels shows that the wave-like movement is more regular and larger in cold seasons. A day-to-day study of the phenomenon may not show this regularity. In this type of investigation, the obvious issue is the tongues that are called trough or ridge. These tongues have different sizes and are measured based on their wavelength. In their normal movement, western currents transfer troughs and ridges toward east. These systems move within middle latitudes and along the polar front. Sometimes, the abovementioned systems appear in larger sizes and longer waves, hence moving more slowly. They may even stop moving or move in the opposite direction. This means that the wave does not move eastward and stays in its own place or moves westward. In the evolution process of blockings, the ridge may be associated with high cell or closed cells, while the trough may be accompanied by low cells or closed cells. Such a system may stay around a meridian for a long time (some days or some weeks). It functions as an obstacle disturbing the normal path of western currents in middle latitudes. Thus, because of this system, western currents cannot move through their normal path, hence moving toward northern or southern latitudes. On the other hand, low and high pressure systems of the earth’s surface move around the blocked system based on the currents of mid-tropospheric levels.
According to Figure 12, cold weather reaches southern latitudes of the country, with its impacts observed in almost two third area of the country. For example, a large area of east, southeast, center and west of the country has a temperature of −7 °C. The lowest values of temperature anomaly were observed in central parts of the Zagros mountain ranges. The areas with lowest temperatures were also located in this territory. Negative anomalies were also observed sporadically in southern areas of the country. The coastal areas of the southern part of the country experienced a temperature of 2 °C (Figure 12A,C and Table 6).

4. Conclusions

As an index of heat severity, temperature is one of the essential elements for identifying the weather features. Since the amount of energy that sun radiates to earth follows an irregular pattern, temperature experiences a lot of oscillations in comparison with other meteorological elements. These oscillations (i.e., excessive increases and decreases) can result in the formation of heat and cold waves. In recent decades, climate change has been studied as a global challenge. Abnormal changes in temperature affect precipitation and results in droughts or severe floods. These changes are regarded as a threat to world food security. It is therefore necessary to conduct studies in order to estimate changes in the main climate variables. By so doing, future plans will be designed in the light of specific aims and will yield better results. The present study aimed at synoptic analysis of the atmosphere thickness pattern of Iran’s pervasive frosts. To this end, daily temperature data were obtained from Iran’s Meteorological Organization. The results indicated that the occurrence of frosts was mainly influenced by five patterns, namely Siberian high-pressure and European high-pressure, deep trough pattern of Eastern Europe and Sudanese low pressure, dual-core pattern of Siberian high-pressure, deep Eastern European trough and polar low pressure pattern, and Omega pattern. The severest frosts occurred during the dominance of the Omega pattern. However, Siberian high-pressure and European high-pressure dominated the country for a longer period of time. Studying the Siberian high-pressure pattern revealed that the spread of this pattern’s canon to central parts of Russia and the location of ridges of mid atmosphere levels in this area directed this tongue toward Iran. The formation of counter clockwise currents over the earth’s surface and other atmosphere levels in the region transferred cold weather from northeastern parts of Russia toward Iran. Considering the factors that contribute to frosts in various areas of Iran, the result of this study are largely in line with the ones obtained by [19,33,35,36]. In conclusion, the spread of migratory high pressure and Siberian high pressure tongues to Iran and the location of blocking systems in Eastern Europe as well as atmospheric mid-level troughs over the country are the main factors that cause frosts in Iran. Nevertheless, the results indicated that frosts occur alongside contours that have a thickness of 5300 to 540 geopotential meters. In fact, in all five patterns, pervasive frosts occur alongside these contours that are as thick as the atmosphere (especially the ones that are 530 geopotential meters thick). Finally, the omega pattern (the fifth pattern) and Deep Eastern European trough and polar low pressure pattern (the fourth pattern) were the most dominant and severe frost patterns in Iran, respectively.

Acknowledgments

The daily meteorological data were provided by Iman Rousta of Iran Meteorological Organization (IRIMO). The authors also gratefully acknowledge the NCEP/NCAR data was provided by the NOAA-CIRES Climate Diagnostics Center, Boulder, Colorado, USA.

Author Contributions

Authorship has been limited to those who have made a significant contribution to the Conception, design, execution, and interpretation of the study.

Conflicts of Interest

The authors declare no conflict of interest.

References

  1. Masoodian, S.A.; Darand, M. The relationship two patterns of the North Sea—Caspian and East Europe—North East of Iran with occurrence frequency of extreme frost cold period of year Iran. J. Phys. Earth Space 2013, 2, 171–186. [Google Scholar]
  2. Azizi, Q.; Raziee, T. Zoning precipitation regime west of Iran by using principal components analysis and clustering techniques. J. Res. Water Resour. Iran 2007, 2, 1–4. [Google Scholar]
  3. Mohammadi, B. Identify anomalies spatiotemporal sea level pressure in Iran. Geogr. Res. Q. 2014, 1, 43–58. [Google Scholar]
  4. Chang, C.P.; Erickson, J.E.; Lau, K.M. Northeasterly cold surges and near-equatorial disturbances over the winter MONEX area during December 1974. Part I: Synoptic aspects. Mon. Weather Rev. 1979, 107, 812–829. [Google Scholar] [CrossRef]
  5. Park, T.-W.; Jeong, J.-H.; Ho, C.-H.; Kim, S.-J. Characteristics of atmospheric circulation associated with cold surge occurrences in East Asia: A case study during 2005/06 winter. Adv. Atmos. Sci. 2008, 25, 791–804. [Google Scholar] [CrossRef]
  6. Pandžić, K.; Trninić, D. The relationship between the Sava River basin annual precipitation, its discharge and the large-scale atmospheric circulation. Theor. Appl. Climatol. 1998, 61, 69–76. [Google Scholar] [CrossRef]
  7. Davis, R.E. Predictability of sea surface temperature and sea level pressure anomalies over the North Pacific Ocean. J. Phys. Oceanogr. 1976, 6, 249–266. [Google Scholar] [CrossRef]
  8. Blasing, T.J. Characteristic anomaly patterns of summer sea-level pressure for the northern hemisphere. Tellus 1981, 33, 428–437. [Google Scholar] [CrossRef]
  9. Maheras, P.; Kutiel, H. Spatial and temporal variations in the temperature regime in the mediterranean and their relationship with circulation during the last century. Int. J. Climatol. 1999, 19, 745–764. [Google Scholar] [CrossRef]
  10. Labajo Salazar, J.L.; Piorno, A.; Labajo, A.L.; Ortega, M.T. Analysis of the behavior of the extreme values of minimum daily atmospheric pressure at ground level over the Spanish Central Plateau. Atmosfera 2009, 22, 125–139. [Google Scholar]
  11. Jones, D.A.; Simmonds, I. Time and space spectral analyses of southern hemisphere sea level pressure variability. Mon. Weather Rev. 1993, 121, 661–672. [Google Scholar] [CrossRef]
  12. Rusticucci, M.M.; Venegas, S.A.; Vargas, W.M. Warm and cold events in argentina and their relationship with South Atlantic and South Pacific Sea surface temperatures. J. Geophys. Res. Oceans 2003, 108, 1–10. [Google Scholar] [CrossRef]
  13. Prieto, L.; Herrera, R.G.; Diaz, J.; Hernandez, E.; del Teso, T. Minimum extreme temperatures over Peninsular Spain. Glob. Planet. Chang. 2004, 44, 59–71. [Google Scholar] [CrossRef]
  14. Prieto, L.; Herrera, R.G.; Diaz, J.; Hernandez, E.; del Teso, T. NAO influence on extreme winter temperatures in Madrid (Spain). Ann. Geophys. 2002, 20, 2077–2085. [Google Scholar] [CrossRef]
  15. Guirguis, K.; Gershunov, A.; Schwartz, R.; Bennett, S. Recent warm and cold daily winter temperature extremes in the Northern Hemisphere. Geophys. Res. Lett. 2011, 38, 1–6. [Google Scholar] [CrossRef]
  16. Pezza, A.B.; Ambrizzi, T. Dynamical conditions and synoptic tracks associated with different types of cold surge over tropical South America. Int. J. Climatol. 2005, 25, 215–241. [Google Scholar] [CrossRef]
  17. Shahbaiye Kotanaie, A. Synoptic Analysis of Winter Cold Waves in Iran, Synoptic Climatology. Master’s Thesis, Department of Geography, University of Zanjan, Zanjan, Iran, 2014. [Google Scholar]
  18. Akbari, T.; Masoodian, S.A. Identify role northern hemisphere teleconnection patterns on the temperature of Iran. Isfahan Univ. Res. J. 2007, 12, 117–123. [Google Scholar]
  19. Masoodian, S.A.; Darand, M. Analysis of sea level pressure anomalies on days with extreme frost occurrence Iran. J. Geogr. Environ. Plan. 2012, 1, 1–14. [Google Scholar]
  20. Montazeri, M.; Masoodian, S.A. Detect patterns of thermal advection of cold years Iran. Phys. Geogr. Res. Q. 2010, 74, 79–94. [Google Scholar]
  21. Ghavidel Rahimi, Y. The relationship of at least pervasive extreme temperatures cold period Azerbaijan region with circulation patterns 500 hPa. J. Res. Geogr. Space 2010, 35, 155–184. [Google Scholar]
  22. Azizi, Q.; Akbari, T.; Davodi, M.; Akbari, M. Synoptic analysis of severe cold waves of January 1386 of Iran. Phys. Geogr. Res. Q. 2009, 70, 1–20. [Google Scholar]
  23. Imam Hadi, M.; Alijani, B. Air masses affecting Iran in the cold period of the year. Geogr. Res. J. 2004, 75, 34–53. [Google Scholar]
  24. Khosravi, M.; Doustkamian, M.; Mirmousavi, S.H.; Biat, A.; Biek, R.E. Classification of temperature and precipitation in Iran by using geostatistical methods and cluster analysis. J. Reg. Plan. 2014, 13, 121–132. [Google Scholar]
  25. Khoshhal Dastjerdi, J.; Yazdanpanah, H.; Hatami, K.; Biglo, B. Identification circulation patterns freezing phenomenon by using principal component analysis and cluster analysis (A case study: Fars province). J. Nat. Geogr. 2010, 12, 27–38. [Google Scholar]
  26. Vincent, L.A.; Peterson, T.C.; Barros, V.R.; Marino, M.B.; Rusticucci, M.; Carrasco, G.; Ramirez, E.; Alves, L.M.; Ambrizzi, T.; Berlato, M.A. Observed trends in indices of daily temperature extremes in South America 1960–2000. J. Clim. 2005, 18, 5011–5023. [Google Scholar] [CrossRef]
  27. Alijani, B. Spatial analysis of daily temperatures and precipitation Iran. J. Appl. Res. Geogr. Sci. 2011, 17, 9–30. [Google Scholar]
  28. Takaya, K.; Nakamura, H. Mechanisms of intraseasonal amplification of the cold Siberian high. J. Atmos. Sci. 2005, 62, 4423–4440. [Google Scholar] [CrossRef]
  29. Ghanghermeh, A.A.; Roshan, G.R.; Shahkooeei, E. Evaluation of the effect of Siberia’s high pressure extension on daily minimum temperature changes in Iran. Model. Earth Syst. Environ. 2015, 1, 1–15. [Google Scholar] [CrossRef]
  30. Soleyman, S.; Hosseinzadeh, S.R.; Doostan, R.; Ahangarzadeh, Z. Synoptic analysis of cold waves in the Northeast of Iran. Geogr. Environ. Hazards 2012, 3, 17–19. [Google Scholar]
  31. Masoodian, S.A. The identification of the precipitation regime in Iran to cluster analysis method. Phys. Geogr. Res. Q. 2005, 52, 47–59. [Google Scholar]
  32. Hejazizadeh, Z.; Naserzadeh, M.H. Analysis of frost in Lorestan province. Geogr. Sci. 2006, 6, 31–47. [Google Scholar]
  33. Hojabrpour, G.; Alijani, B. Synoptic analysis of Ardabil provience frosts. Geogr. Dev. 2007, 10, 89–106. [Google Scholar]
  34. García, I.P. Major cold air outbreaks affecting coffee and citrus plantations in the eastern and northeastern México. Atmosfera 2009, 9, 47–68. [Google Scholar]
  35. Lashkari, H.; Yarmoradi, Z. Synoptic analysis Siberian high pressure Location and input paths to Iran in the cold season. Phys. Geogr. Res. Q. 2014, 2, 199–218. [Google Scholar]
  36. Alijani, B.; Farajzadeh, H. Trend analysis of extreme temperature indicators in northern Iran. Geogr. Manag. 2014, 52, 229–256. [Google Scholar]
Figure 1. Distribution pattern of the studied stations.
Climate 04 00041 g001
Figure 2. The dendrogram obtained through conducting group analysis on atmosphere thickness.
Climate 04 00041 g002
Figure 3. Atmosphere anomalies and thickness (in meters) for the representative days of the first pattern.
Climate 04 00041 g003
Figure 4. The first pattern: (A) Spatial distribution of temperature average and coefficient of variation for the whole group; (B) spatial distribution of temperature average and coefficient of variation for the representative day; (C) anomalies and center of masses for the whole group; (D) anomalies for the representative day; (E) frequency of frosts for the whole group; and (F) spatial distribution of the trend of Iran’s frosts for the whole group.
Climate 04 00041 g004
Figure 5. Anomalies and atmosphere thickness (in meters) for the representative day of the second pattern.
Climate 04 00041 g005
Figure 6. The second pattern:(A) Spatial distribution of temperature average and coefficient of variation for the whole group; (B) spatial distribution of temperature average and coefficient of variation for the representative day; (C) anomalies and center of masses for the whole group; (D) anomalies for the representative day; (E) frequency of frosts for the whole group; and (F) spatial distribution of the trend of Iran’s frosts for the whole group.
Climate 04 00041 g006
Figure 7. Anomalies and atmosphere thickness (in meters) for the representative day of the third pattern.
Climate 04 00041 g007
Figure 8. The third pattern: (A) Spatial distribution of temperature average and coefficient of variation for the whole group; (B) spatial distribution of temperature average and coefficient of variation for the representative day; (C) anomalies and center of masses for the whole group; (D) anomalies for the representative day; (E) frequency of frosts for the whole group; and (F) spatial distribution of the trend of Iran’s frosts for the whole group.
Climate 04 00041 g008
Figure 9. Anomalies and atmosphere thickness (in meters) for the representative day of the fourth pattern.
Climate 04 00041 g009
Figure 10. The fourth pattern; (A) Spatial distribution of temperature average and coefficient of variation for the whole group; (B) spatial distribution of temperature average and coefficient of variation for the representative day; (C) anomalies and center of masses for the whole group; (D) anomalies for the representative day; (E) frequency of frosts for the whole group; and (F) spatial distribution of the trend of Iran’s frosts for the whole group.
Climate 04 00041 g010
Figure 11. Anomalies and atmosphere thickness (in meters) for the representative day of the fifth pattern.
Climate 04 00041 g011
Figure 12. The fifth pattern: (A) Spatial distribution of temperature average and coefficient of variation for the whole group; (B) spatial distribution of temperature average and coefficient of variation for the representative day; (C) anomalies and center of masses for the whole group; (D) anomalies for the representative day; (E) frequency of frosts for the whole group; and (F) spatial distribution of the trend of Iran’s frosts for the whole group.
Climate 04 00041 g012
Table 1. Features of the representative days for the five groups.
PatternThe Whole Frost Event (%)The Date of the Representative DayThe Coverage of the Representative Day (%)FrequencyAverage Temperature of the Representative DayAverage Temperature of the Group
Siberian high-pressure and European high-pressure20.91 January 200775.93339−1.73−5.05
Deep trough pattern of Eastern Europe and Sudanese low11.0913 November 197257.84180−1.07−4.20
Dual-core pattern of Siberian high-pressure10.044 January 198663.36163−1.45−0.93
Deep Eastern European trough and polar low pressure pattern25.7722 February 196179.95418−2.060.51
Omega pattern32.1822 December 196059.81522−2.30−3.30
Table 2. Percentage of the covered area of different classes of average temperature, anomalies and frequency of frosts for the first group.
Overall Temperature of the First GroupArea (%)Representative Day TemperaturesArea (%)
−13.21 to −7.6910.8−27.28 to −19.915.3
−2.17 to −7.6941.1−19.91 to −11.1111.8
3.34 to −2.1730.5−11.1 to −2.3148.6
8.87 to 3.3413.1−2.31 to 6.5128.8
14.4 to 8.874.56.51 to 15.325.5
The Frequency of Frost DaysArea (%)Representative Day AnomalyArea (%)
0 to 6920.5Negative anomalies56.4
69 to 1395.5Positive anomalies43.6
139 to 2098.8Anomalies the whole groupArea (in percentage)
209 to 27914.3Negative anomalies47.2
279 to up50.9Positive anomalies52.8
Table 3. Percentage of the covered area of different classes of average temperature, anomalies and frequency of frosts for the second group.
Overall Temperature of the Second GroupArea (%)Representative Day TemperaturesArea (%)
−5.93 to −11.1312.3−19.19 to −28.725.3
−0.76 to −5.9351.4−11.8 to −19.1911.8
4.46 to −0.7621.1−2.31 to −11.848.6
9.66 to 4.4611.16.50 to −2.3128.8
14.87 to 9.664.115.32 to 6.505.5
The Frequency of Frost DaysArea (%)Representative Day AnomalyArea (%)
36 to 021.1Negative anomalies57.9
72 to 366.1Positive anomalies42.1
110 to 728Anomalies the entire groupArea (%)
145 to 11018.5Negative anomalies60.4
145 To up46.3Positive anomalies39.6
Table 4. Percentage of the covered area of different classes of average temperature, anomalies and frequency of frosts for the third group.
Overall Temperature of the Third GroupArea (%)Representative Day TemperaturesArea (%)
−8.45 to −13.8211.3−10.73 to −17.065
−2.26 to −8.4537.1−4.40 to −10.7321.3
3.52 to −2.2633.51.92 to −4.4045.3
9.30 to 3.5213.48.2 to 1.9220.7
15.9 to 9.304.714.59 to 8.27.7
The Frequency of Frost DaysArea (%)Representative Day AnomalyArea (%)
32 to 021.4Negative anomalies69.6
62 to 328.2Positive anomalies30.1
97 to 629.7Anomalies the entire groupArea (%)
130 to 9711.2Negative anomalies64.5
163 to 13049.6Positive anomalies35.5
Table 5. Percentage of the covered area of different classes of average temperature, anomalies and frequency of frosts for the fourth group.
Overall Temperature of the Fourth GroupArea (%)Representative Day TemperaturesArea (%)
−8.4 to −14.313.1−10.9 to −17.394
−2.6 to −8.437−0.42 to −10.949
3.19 to −2.630.82.06 to −0.4229.7
9.02 to 3.1914.18.54 to 2.0614.3
14.87 to 9.02515.04 to 8.543
The Frequency of Frost DaysArea (%)Representative Day AnomalyArea (%)
85 to 020.6Negative anomalies67.7
171 to 855.3Positive anomalies32.3
256 to 1719.7Anomalies the entire groupArea (%)
342 to 25613.2Negative anomalies65.7
428 to 34251.3Positive anomalies34.3
Table 6. Percentage of the covered area of different classes of average temperature, anomalies and frequency of frosts for the fifth group.
Overall Temperature of the Fifth GroupArea (%)Representative Day TemperaturesArea (%)
−8.13 to −13.8613.2−8.19 to −3.835
−2.40 to −8.1343.5−3.8 to 0.5527.5
3.32 to −2.4025.40.55to 4.915.8
9.05 to 3.3213.49.29 to 4.913.6
14.79 to 9.054.59.29 to 13.688.2
The Frequency of Frost DaysArea (%)Representative Day AnomalyArea (%)
106 to 019.9Negative anomalies67.6
212 to 1064.9Positive anomalies32.4
319 to 2127.9Anomalies the entire groupArea (%)
425 to 31913.3Negative anomalies64.5
532 to 42553.9Positive anomalies35.5

