Article

Quantifying Uncertainties in Modeling Climate Change Impacts on Hydropower Production

1
Graduate Research Program (GRP) Climate Change and Water Resources, West African Science Service Center on Climate Change and Adapted Land Use (WASCAL), University of Abomey-Calavi, Abomey-Calavi BP 2008, Benin
2
Center for Development Research (ZEF), University of Bonn, Walter-Flex-Street 3, 53113 Bonn, Germany
3
Ecole Nationale Supérieure des Sciences et Techniques Agronomiques de Djougou, University of Parakou, Parakou BP 123, Benin
4
Department of Soil Science and Land Management, Federal University of Technology, P.M.B 65, Gidan-Kwanu, 920212 Minna, Nigeria
5
Laboratory of Applied Hydrology, National Water Institute, University of Abomey-Calavi, Abomey-Calavi BP 2008, Benin
6
Department of Geography, University of Bonn, Meckenheimer Allee 166, 53115 Bonn, Germany
*
Author to whom correspondence should be addressed.
Climate 2016, 4(3), 34; https://doi.org/10.3390/cli4030034
Submission received: 3 May 2016 / Revised: 7 June 2016 / Accepted: 13 June 2016 / Published: 24 June 2016
(This article belongs to the Special Issue Impact of Climate Change on Water Resources)

Abstract

:
Climate change will have large impacts on water resources and its predictions are fraught with uncertainties in West Africa. With the current global drive for renewable energy due to climate change, there is a need for understanding the effects of hydro-climatic changes on water resources and hydropower generation. A hydrological model was used to model runoff inflow into the largest hydroelectric dam (Kainji) in the Niger Basin (West Africa) under present and future conditions. Inflow to the reservoir was simulated using hydro-climatic data from a set of dynamically downscaled 8 global climate models (GCM) with two emission scenarios from the CORDEX-Africa regional downscaling experiment, driven with CMIP5 data. Observed records of the Kainji Lake were used to develop a hydroelectricity production model to simulate future energy production for the reservoir. Results indicate an increase in inflow into the reservoir and concurrent increases in hydropower production for the majority of the GCM data under the two scenarios. This analysis helps planning hydropower schemes for sustainable hydropower production.

1. Introduction

Continuation of the use of fossil fuels is set to face multiple challenges that include depletion of fossil fuel reserves, environmental concerns, geopolitical and military conflicts as well as instability in fuel prices. The aim of harnessing hydropower and other renewable energy is to focus on the provision of sustainable energy for the economically subjugated fraction of the society, combat energy shortages and provide clean energy from the perspective of the Kyoto directive towards global decarbonization [1]. Hydroelectricity comes from the conversion of potential energy of water through turbines and an electric generator system [2]. Electricity generation from hydropower makes a substantial contribution to meeting today’s increasing world electricity demands. However, only about 4 per cent of Africa’s technically feasible hydro-potential has been developed, and enormous efforts are now being made across the African continent to create an enabling environment for private investment; this is regarded as a major hope for energy development on a large scale [3]. For several decades, most West African countries have suffered from electricity shortages, which constitute a serious handicap for their socio-economic development [4]. The situation has worsened during the last years due to human activities and climate change. Among other sources of energy; natural gas, bio-fuel, wind, solar, etc., hydropower is found to be of high sustainability for energy production [2].
Climate patterns in West Africa have been fraught with high uncertainties. Climate patterns in the historical periods are not properly documented [5], and satellite-based observations have been identified with inherent biases [6]. This has led to contradictory results from climate trend studies at local and sub-regional scales [7]. For future conditions, no consensual agreements of either higher or lower rainfall emerge from global climate model (GCM) products [8]. This was attributed to the complexity of regional climates and the influence of regional geographic features, such as deserts, land cover variations, mountain chains, large lakes, land-sea contrasts and the sea surface temperatures (SSTs) of the surrounding oceans [6]. With the engagement of the Niger basin (West Africa) countries for future expansion of hydropower production [9], there is a critical need for comprehending the influence of future hydro-climatic changes on water resources and hydro-power generation in the basin. This study uses a hydrological model to simulate water inflow under present and future conditions and to evaluate the impacts of potential hydro-climatic changes on electricity production of the largest hydroelectric dam (Kainji) in the Niger Basin. The Kainji dam produces 12 per cent of the current energy needs of Nigeria [1] and is subject to large fluctuations in energy production as a result of variable inflow and other operational reasons. The objectives of the study are to:
  • Develop a hydroelectricity production model;
  • Quantify uncertainties in modeling the impacts of climate change on hydrological properties and hydropower production.

2. Materials and Methods
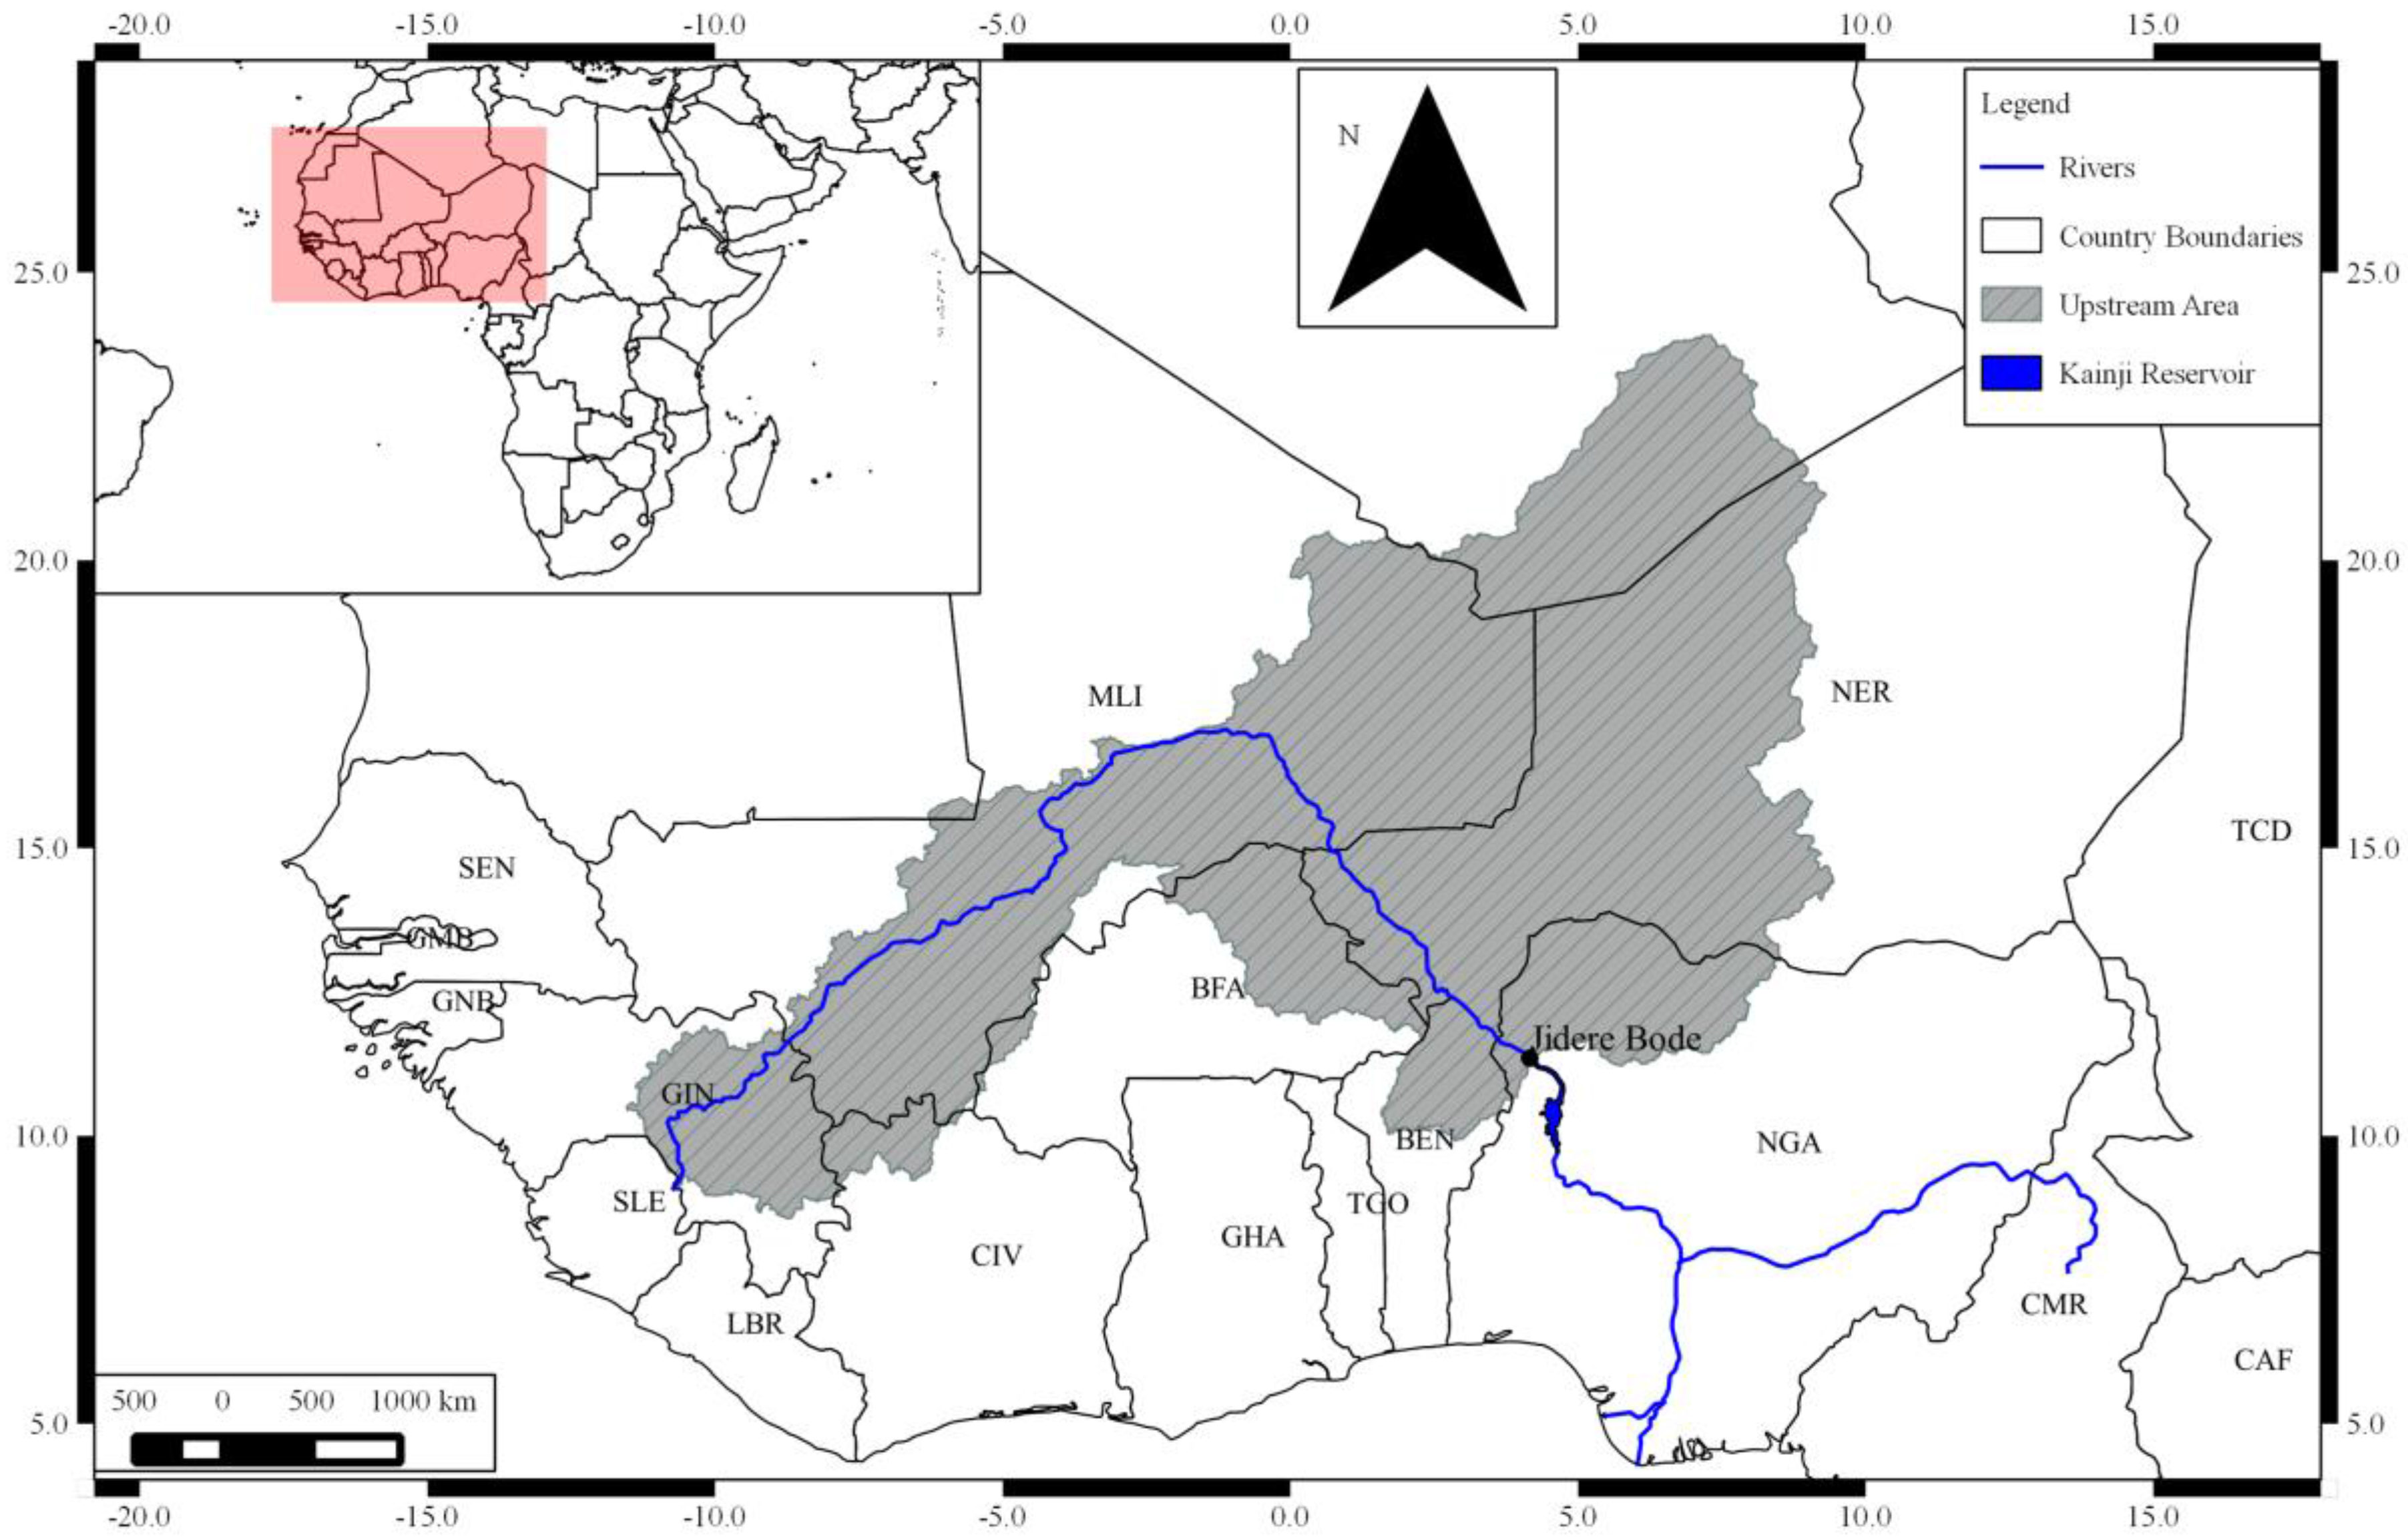
2.1. Study Area

The Niger River Basin covers 2.27 million km2, with the active drainage area comprising less than 50% of the total [10]. At 4200 km in length, the Niger River is the third longest river in Africa and the world’s ninth largest river system. The upstream area of the evaluated lake (Figure 1) covers about 1.61 million km2. Rainfall ranges from 250 to 750 mm/year in the catchment with the length of the rainy season varying from 3 to 7 months [11]. Two flooding regimes are prominent in the basin. During May to October, runoff from northern Benin and some parts of Niamey produce the white flood that arrives at Kainji with a maximum flow of about 3500 m3/s (based on observations from 1980 to 2010). In November, a second flood known as the black flood comes from the river source region of high annual rainfall with a maximum flow of about 2000 m3/s (based on observations from 1980 to 2010).
The Kainji lake is the largest hydropower dam in the basin and resulted from a multipurpose dam project installed in 1968 (Figure 1). The purposes of the reservoir include power generation, navigation, flood control in the Niger valley, and fishery with an estimated fishery production of over 10,000 tons annually. The reservoir has a total storage volume of 15 km³ and a surface area of 1270 km2 at maximum water surface elevation [12]. Kainji dam has a total installed capacity of 760 MW [12] and supplies 12 per cent of the total electricity of Nigeria [1]. The reservoir storage at Kainji relies mainly on the two earlier described flooding regimes (white and black floods).

2.2. Modeling Framework

The scheme used in simulating hydropower production is described as follows. Bias corrected dynamically downscaled GCM datasets were used to drive a hydrological model to generate historical and future reservoir inflow. The inflow was then used to predict the water level by simulating reservoir operations of the dam. The water level was finally used along with other dam properties in projecting future hydropower production.

2.3. Inflow Model Description

The model used in the present study is a lumped parameter, conceptual rainfall-runoff model, based on a unit hydrograph [13], which was implemented in the R package “Hydromad” [14]. Application of a lumped model is easy because it requires only precipitation and evapotranspiration as input data, with little computation and calibration time. On the other hand, physical based models require more atmospheric data, soil data, and land cover data that are either not available or are of limited quality in the region. The model consists of two modules, a non-linear IHACRES loss module to compute conversion of rainfall to effective rainfall. Generally, a sufficient configuration of the IHACRES model in semi-arid regions or for ephemeral streams is a one store-loss module with a simple linear routing model [15]. In this study the IHACRES simple linear routing model was replaced with the auto-regressive, moving average, with exogenous inputs (ARMAX) model [16] to route the effective rainfall to streamflow. This was due to the superiority of the (ARMAX) models over simple linear models witnessed in different catchments around the World [17]. The loss module is defined by just five parameters, which together predict daily effective rainfall [18], while the ARMAX routing module has an additional four parameters [16].
The loss module involves calculation of an index of catchment storage ( s k ), at each time step k (daily in this paper) based upon an exponentially decreasing weighting of precipitation and potential evapotranspiration (PET) (or temperature) conditions [15,18]. It is a metric-type model, where rainfall effectiveness is proportional to a simple antecedent moisture index, and the output is scaled to enforce mass balance [19]. During model calibration, four of the five soil moisture parameters (storage/soil moisture index ( s k ) scale ( c ), modulating factor ( f ) and moisture threshold ( l )) were determined directly from the raw rainfall, streamflow and temperature/PET data. The remaining parameters are power on soil moisture ( p ) and the ARMAX routing parameters (auto-regressive terms a and moving average terms b). The effective rainfall u k was computed from incidence precipitation r k , PET E k , drying rate t w k and storage/soil moisture index s k as described by Ye et al. [15], Jakeman et al. [18] and Andrews [19].
u k = c × ( s k l ) p × r k
s k =   ( 1 1 / t w k ) × s k 1 +   r k
t w k = t w × exp ( 0.062 × f × E k )
The effective rainfall was routed to streamflow ( x k ) using the following ARMAX transfer function [16].
x k =   a 1 x k 1   +   ...   +   a n x k n +   b 0 u k d   +   ...   +   b m u k m d
The order is denoted (n, m), with delay d.
Additional information on the loss module can be found in Ye et al. [15], Andrews [19] and Jakeman and Hornberger [18] while the ARMAX routing module is well described by Andrews [16]. In this study, the optimum model parameters were obtained by an automatic calibration with the “fitByOptim” algorithm in R [14], which selects the optimum parameters that give the best preferred model performance statistics—here taken as the Nash Coefficient. The observed and simulated inflow was compared using the following efficiency coefficients: Nash-Sutcliffe Efficiency (∞ ≤ NSE≤ 1) [20], Index of Agreement (0 ≤ d ≤ 1) [21], Modified Index of Agreement (0 ≤ md ≤ 1) [22], Pearson Correlation coefficient ( −1 ≤ r ≤ 1) [22], Coefficient of Determination (0 ≤ R2 ≤ 1) [22] and Kling-Gupta efficiency (0 ≤ KGE ≤ 1) [23].

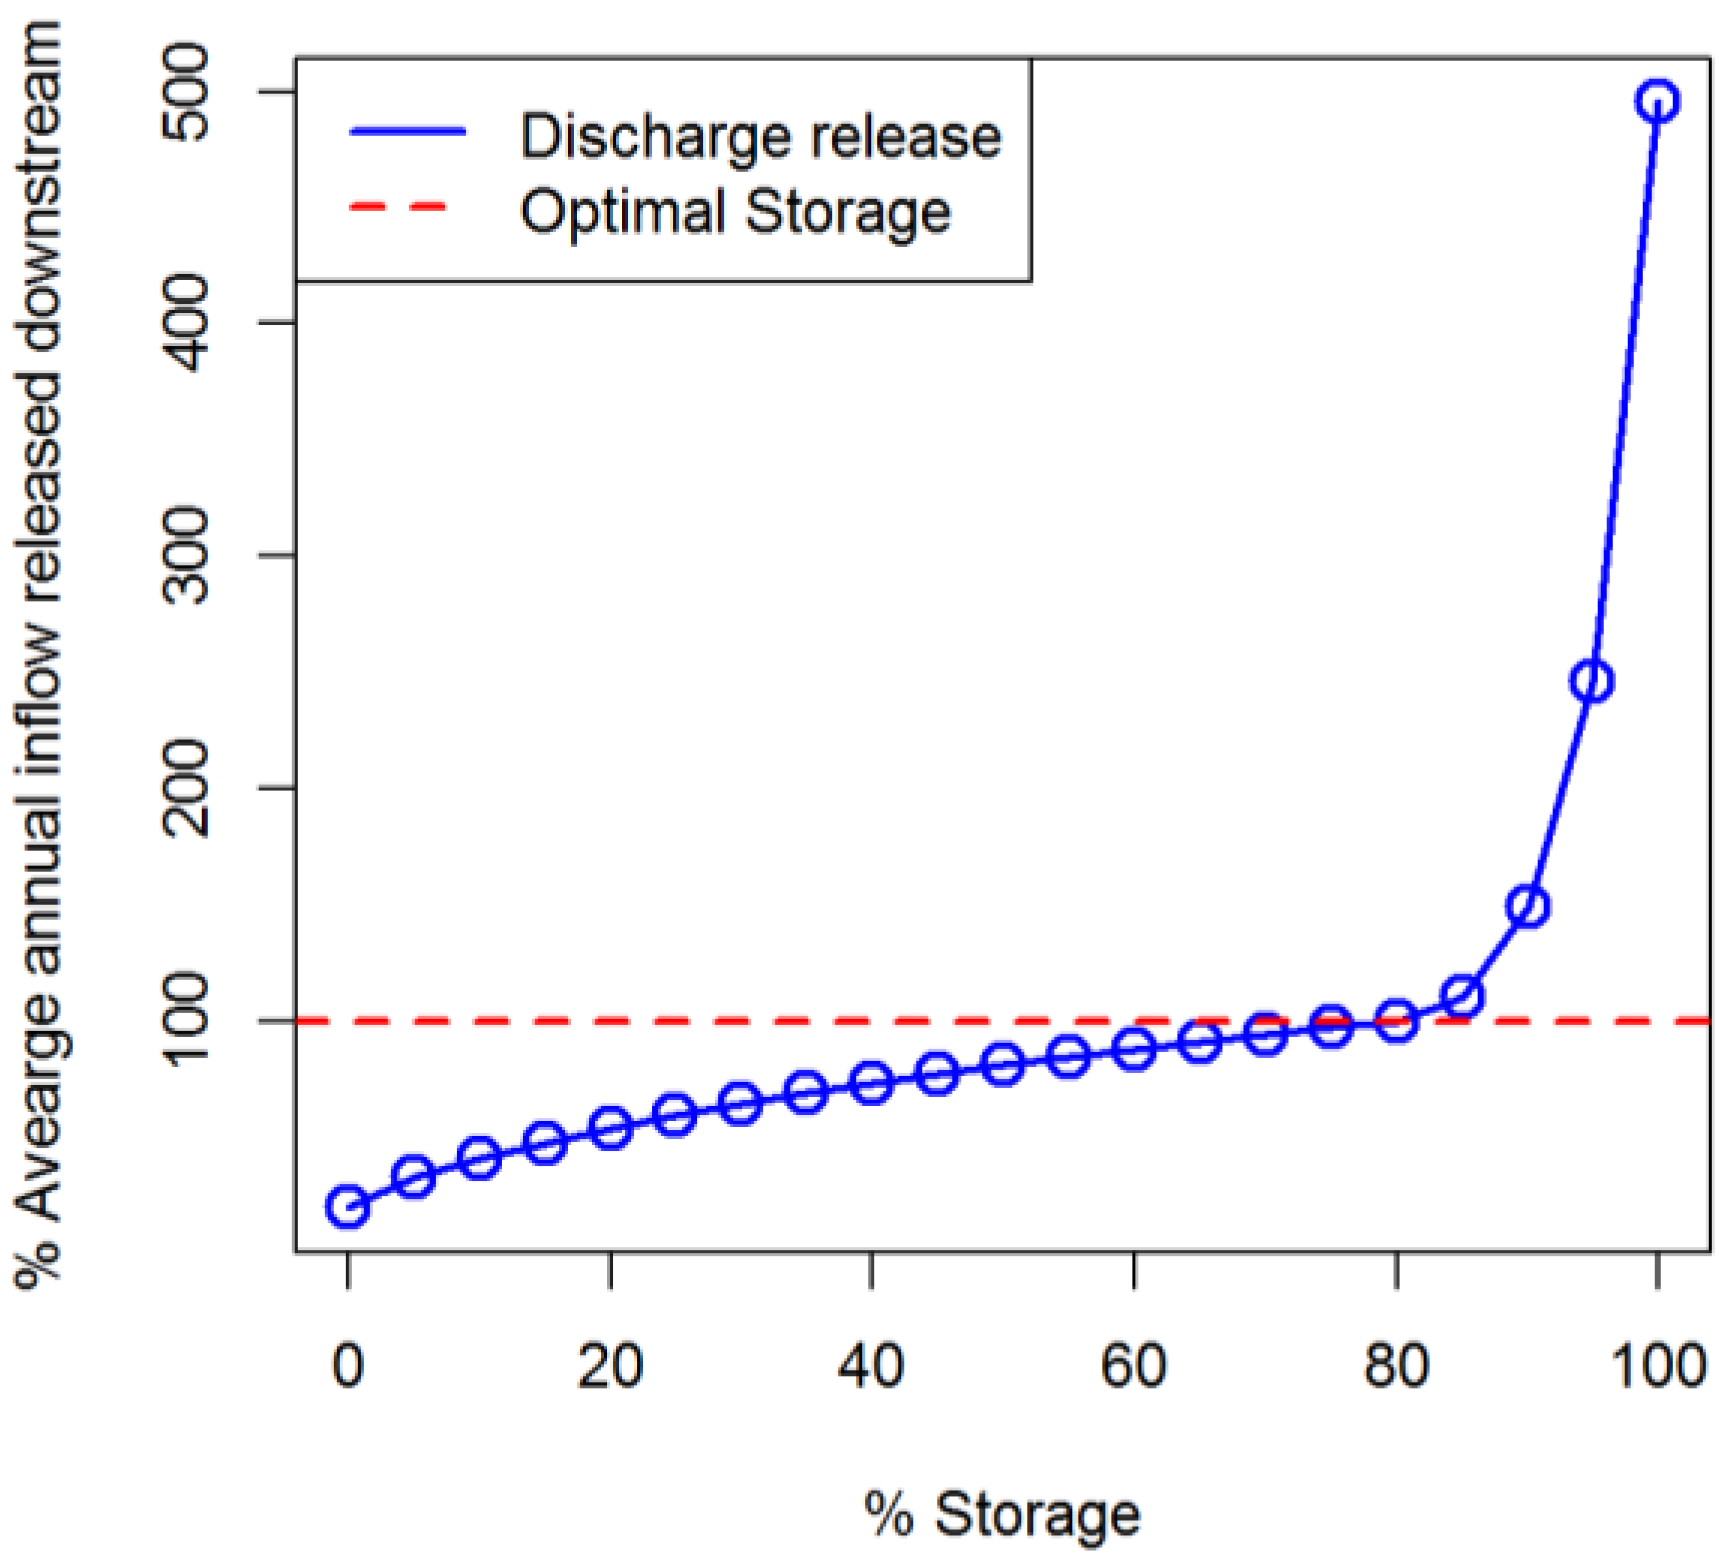
2.4. Hydropower Model Development

Daily hydrological data (reservoir inflow, reservoir release, and reservoir level) of the Kainji reservoir were obtained from Kainji Hydroelectric PLC from 2001–2010 (maximum length of data made available). These were used to develop a hydroelectricity production model to simulate future energy production for the Kainji reservoir (Figure 1). The hydropower model is described below:
The water balance of the reservoir was modeled as:
S t = I D + P E
  • S is the reservoir storage at time t (daily in this study) (m3)
  • I is the reservoir inflow (m3/s)
  • D is the amount of water released out of the reservoir to the turbines (m3/s)
  • P is the lake area precipitation (m3)
  • E is lake evaporation (m3)
There is no large-scale water abstraction around lake Kainji; however, small scale farmers and individuals take water for local uses. This small scale abstraction was ignored in the simulation due to unavailability of records.
D was calculated by simulating the reservoir management of the dam with the approach of Proussevitch et al. [24] displayed in Figure 2.
The rule consists of two segments:
(1)
Rule at reservoir storage below optimal level (80% full, Figure 2): Logarithmic behavior
D = D m i n + ln ( k S   +   1 )   a t   S < S o p t i m a l
(2)
Rule at reservoir storage above optimal level (80% full, Figure 2): Exponential behavior
D = exp ( b ( S S o p t i m a l ) 2 ) a t   S S o p t i m a l  
Dmin = Minimum environmental flow (20% of average annual reservoir inflow) (m3/s).
S = reservoir storage (m3)
k = 1 S o p t i m a l [ e x p ( 1   D m i n ) 1 ]
b and α are model parameters.
Reservoir level of the dam was estimated from reservoir storage using the level-storage relationship of a dammed river [25] shown below:
R e s e r v o i r   l e v e l = S t o r a g e C v m    
where m and C v are constants calibrated as additional model parameters.
Energy production was calculated from the simulated reservoir level using the hydropower equation [26]:
P = e ρ D g h
where
  • P is power in watts (W).
    e is the dimensionless efficiency of the turbine (taken as 80% of installed capacity).
  • ρ is the density of water (kg/m3).
  • D is the water released to the turbine (m3/s).
  • g is the acceleration due to gravity (m/s2).
  • h is the water level above the turbine (reservoir level) (m).
The observed and simulated reservoir level was compared with the same efficiency coefficients as the inflow model (presented earlier).

2.5. Observed Data

The inflow model requires daily precipitation and PET. The Global Precipitation Climatology Project (GPCP) daily precipitation [27] and PET computed from Modern Era Retrospective-analysis for Research and Applications (MERRA) 2 meter temperature [28] were used as boundary conditions. The selection of the products was motivated first by their availability over the region of interest and the fact that they are commonly used in hydrological research studies [29,30,31]. The Hamon model [32] was used for computation of PET from MERRA temperature due to a recent finding that very simple PET models relying on mean daily temperature are effective [32]. Catchment boundary of the Niger basin was obtained from Hydrosheds [33]. Upstream area and boundaries of the Kainji basin (Figure 1) was delineated with a preconditioned DEM from Hydrosheds using the Hortonian drainage networks analysis [34].
Rainfall and temperature distribution in West Africa have been attributed to the back and forth movement of the Inter Tropical Convergence Zone (ITCZ) [35]. The movement of the ITCZ follows the position of maximum surface heating associated with meridional displacement of the overhead position of the sun; lower latitudes experience higher rainfall and lower temperature, whereas higher latitudes experience lower rainfall and higher temperatures. This creates large rainfall and temperature gradients across latitudes, which were considered by computing basin rainfall and temperature as the weighted average of all grid boxes by latitudes.

2.6. Future Projections

Rainfall data from a set of 8 CMIP5 GCMs (Table 1) with two emission scenarios were used. The GCMs were downscaled to 0.45° × 0.45° resolution with the SMHI-RCA (Sveriges Meteorologiskaoch Hydrologiska Institute) Regional Climate Model (RCM) within the CORDEX-Africa regional downscaling experiments. CORDEX is a program sponsored by World Climate Research Program (WCRP) to develop an improved framework for generating regional-scale climate projections for impact assessment and adaptation studies worldwide within the IPCC AR5 timeline and beyond [36]. The climate projection framework within CORDEX is based on the set of new global model simulations planned in support of the IPCC Fifth Assessment Report, referred to as CMIP5 [37]. This set of simulations includes a large number of experiments, ranging from new greenhouse gas scenario simulations for the 21st century, decadal prediction experiments including the carbon cycle and experiments aimed at investigating individual feedback mechanisms [37]. These simulations are based on the reference concentration pathways (RCPs), i.e., prescribed greenhouse-gas concentration pathways throughout the 21st century, corresponding to different radiative forcing stabilization levels by the year 2100. Within CMIP5, the highest-priority global model simulations have been selected to be the RCP4.5 and RCP8.5, roughly corresponding to the IPCC SRES emission scenarios B1 and A1B, respectively. The same scenarios are therefore also the highest priority CORDEX simulations [36]. In this study, basin projection data were extracted as described in section 2.5. (Observed Data). Future PET was also computed from extracted temperature with the Hamon’s model described earlier.

2.7. Evaluation and Bias Correction of RCM/GCM Data

Bias correction aims at eliminating systematic errors in the climate model data when compared against historic observations [23]. It relies either on computing the difference between satellite and gauge precipitation where gauge measurements are available or on a combination of several satellite-based estimates in regions with no gauges [23]. In line with the study of Ravazzani et al. [38], bias correction of precipitation and temperature RCM-GCM datasets was done with quantile mapping [39] at a monthly time step.

3. Results

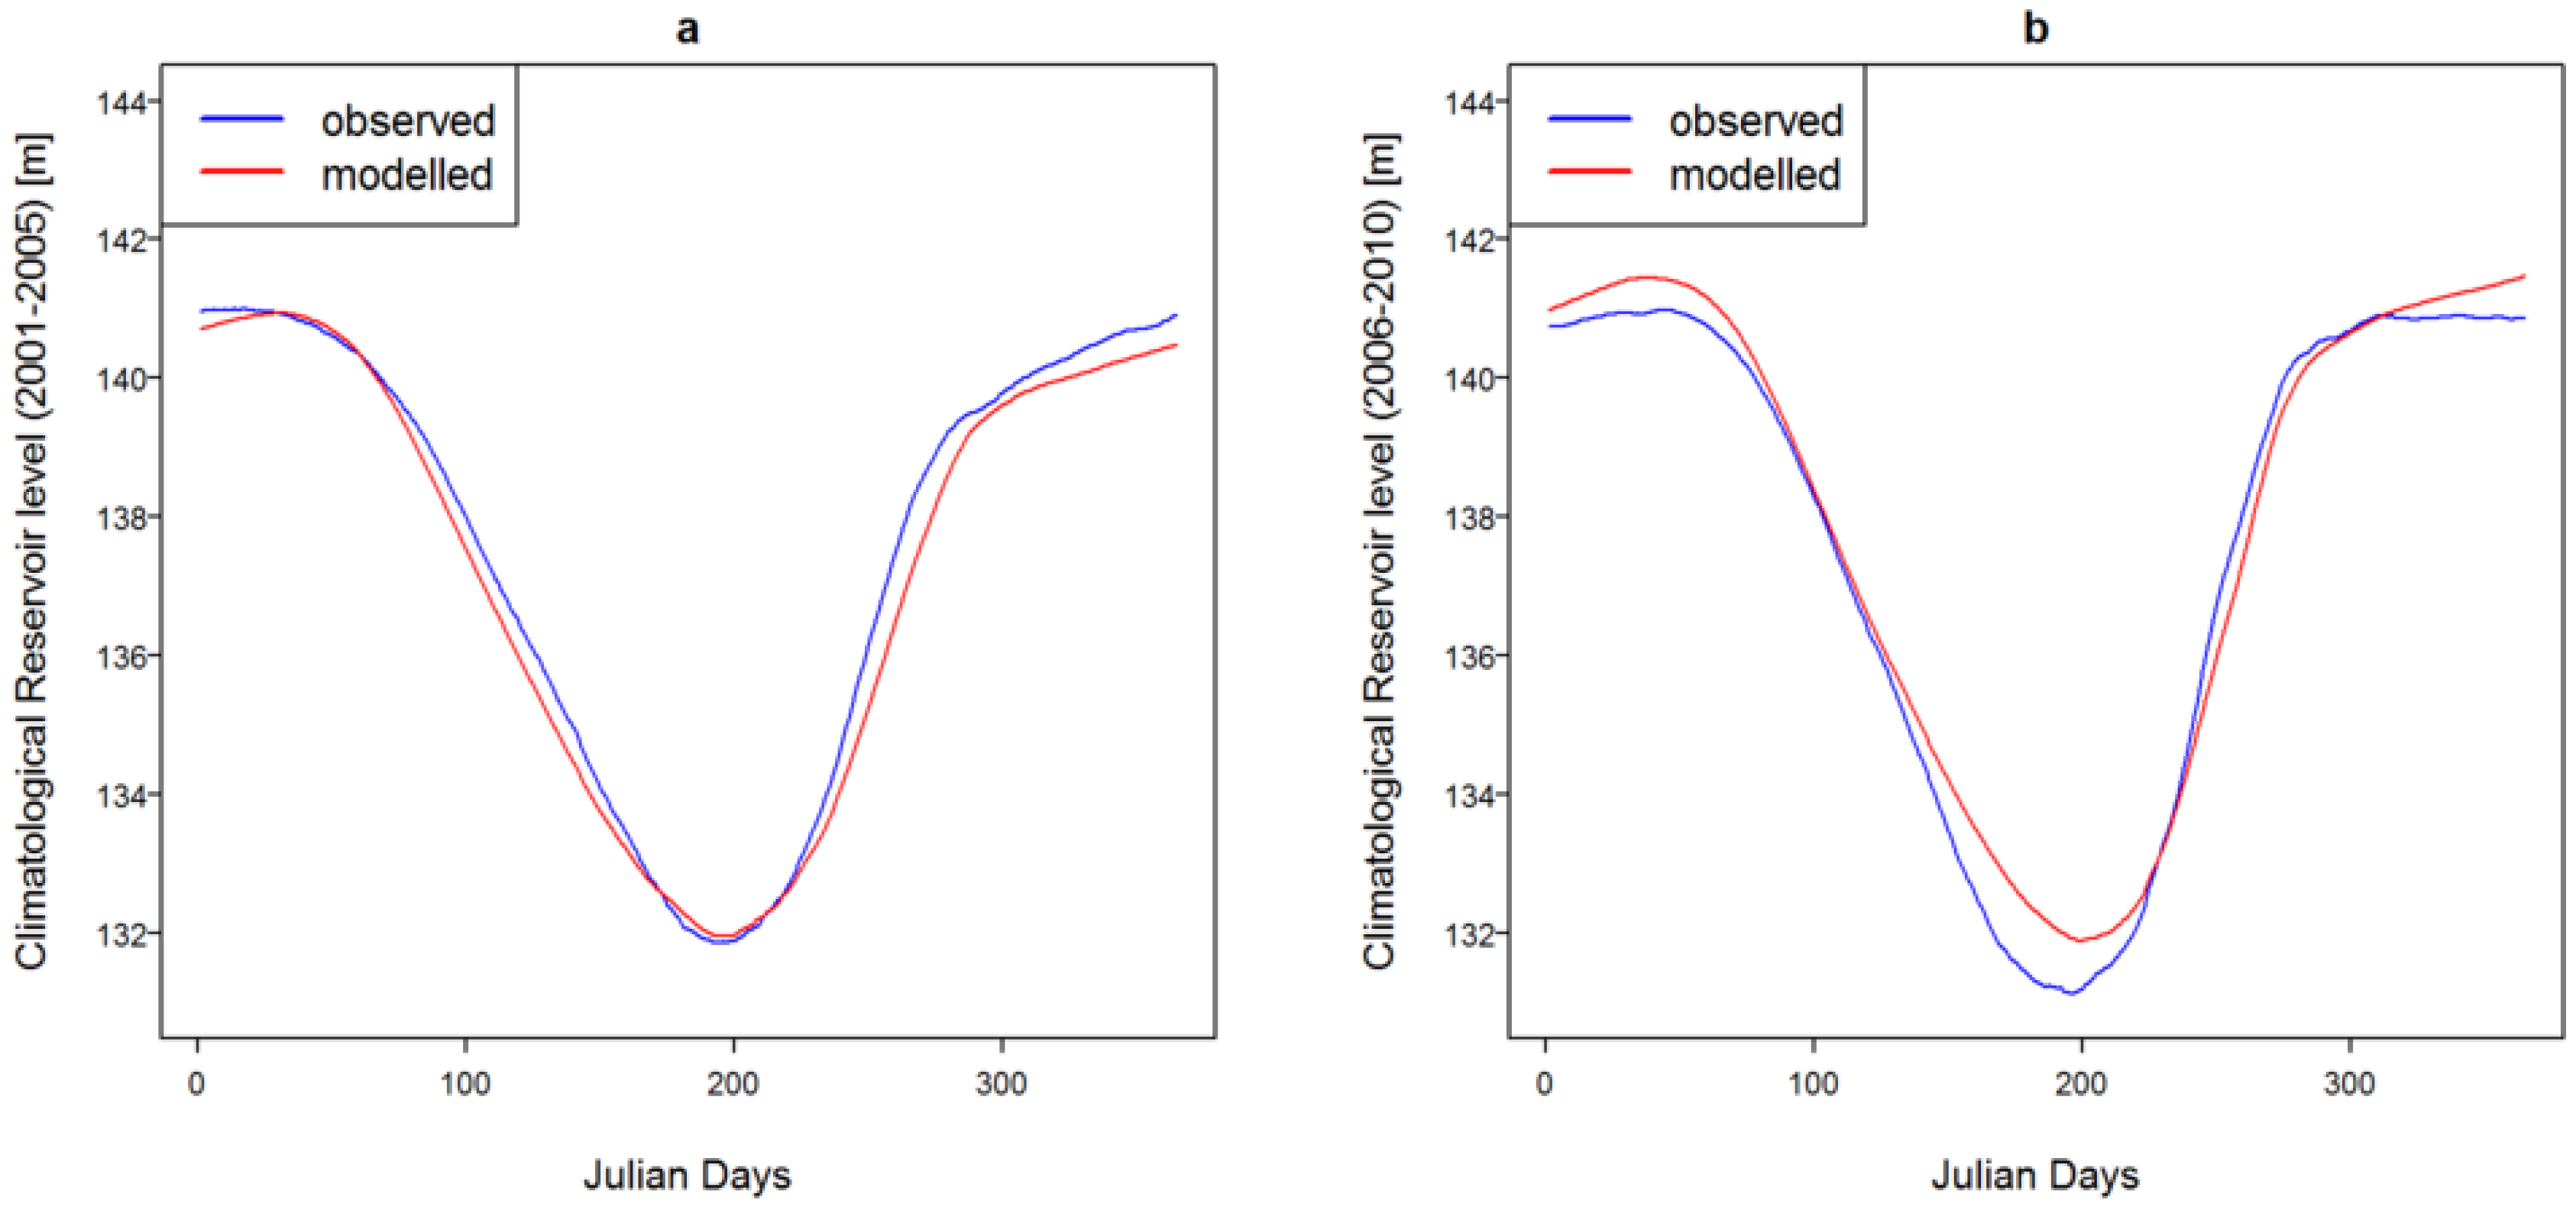
3.1. Model Calibration

The models were calibrated from 2001–2005 and validated from 2006-2010. The following optimum inflow model parameters were deduced from automatic calibration between simulated and observed reservoir inflow: 0.75(tw), 0.24(f), 148.89(c), 0 (l), 1 (p), 1.98 (a_1), −0.98 (a_2), 0.01 (b_0), −0.01 (b_1). This resulted in high calibration correlation efficiency values of 0.72 (NSE), 0.92(d), 0.77 (md), 0.86 (r), 0.73 (R2) and 0.84(KGE) and similar high validation efficiency values of 0.72 (NSE), 0.92(d), 0.75 (md), 0.85 (r), 0.72 (R2) and 0.80(KGE). For the hydropower model, optimum parameters of 40 (b), 0.8 (α), 0.88 (m) and 1.55 × 10⁹ (Cv) were observed during a manual model calibration between simulated and observed reservoir level. High values of calibration correlation efficiency coefficients of 0.83(NSE), 0.96(d), 0.81(md), 0.92(r), 0.85 (R2) and 0.91 (KGE) were recorded with validation efficiencies of 0.80(NSE), 0.95(d), 0.79(md), 0.90(r), 0.81 (R2) and 0.90 (KGE). Since the hydropower model was calibrated for water level simulations, Figure 3 presents climatological simulated and observed reservoir level and it shows vivid high correlations.

3.2. Projected Trends
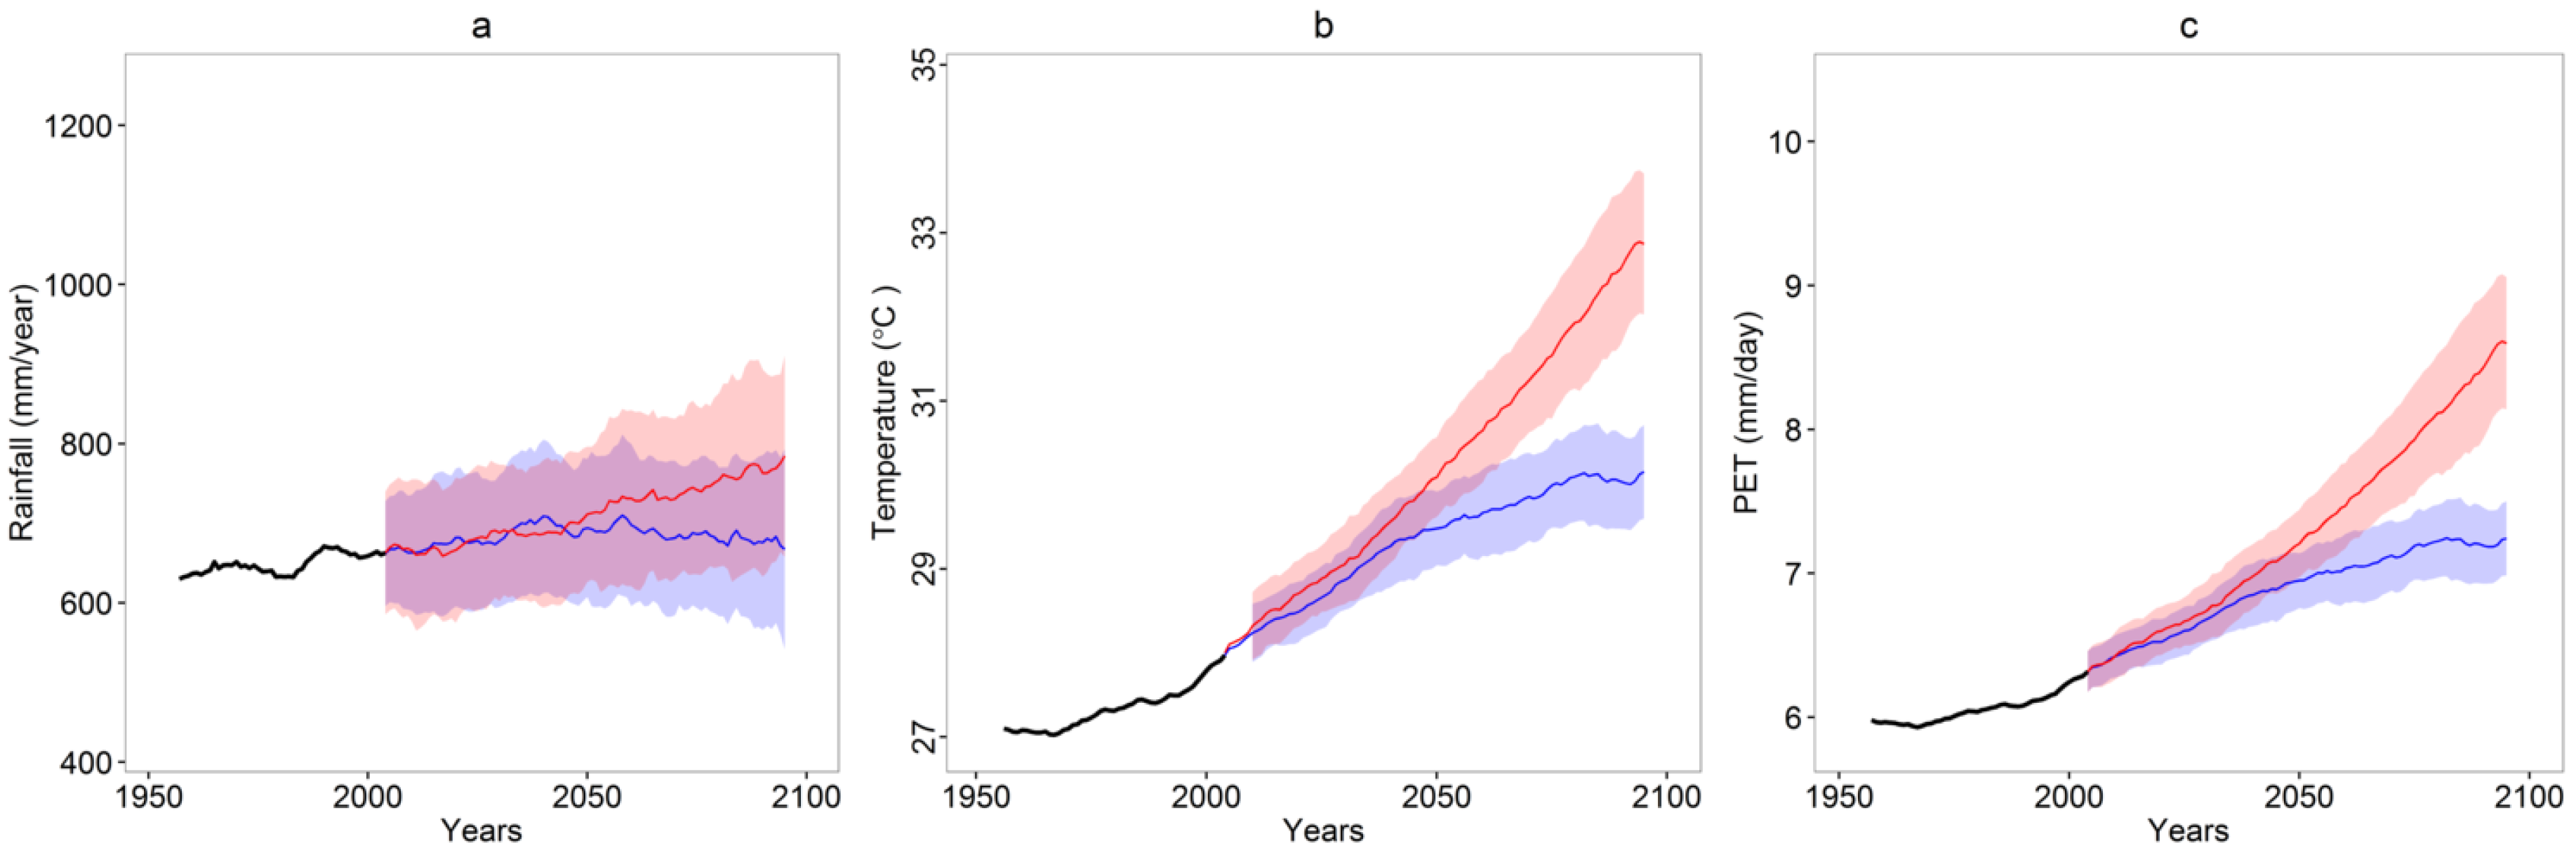
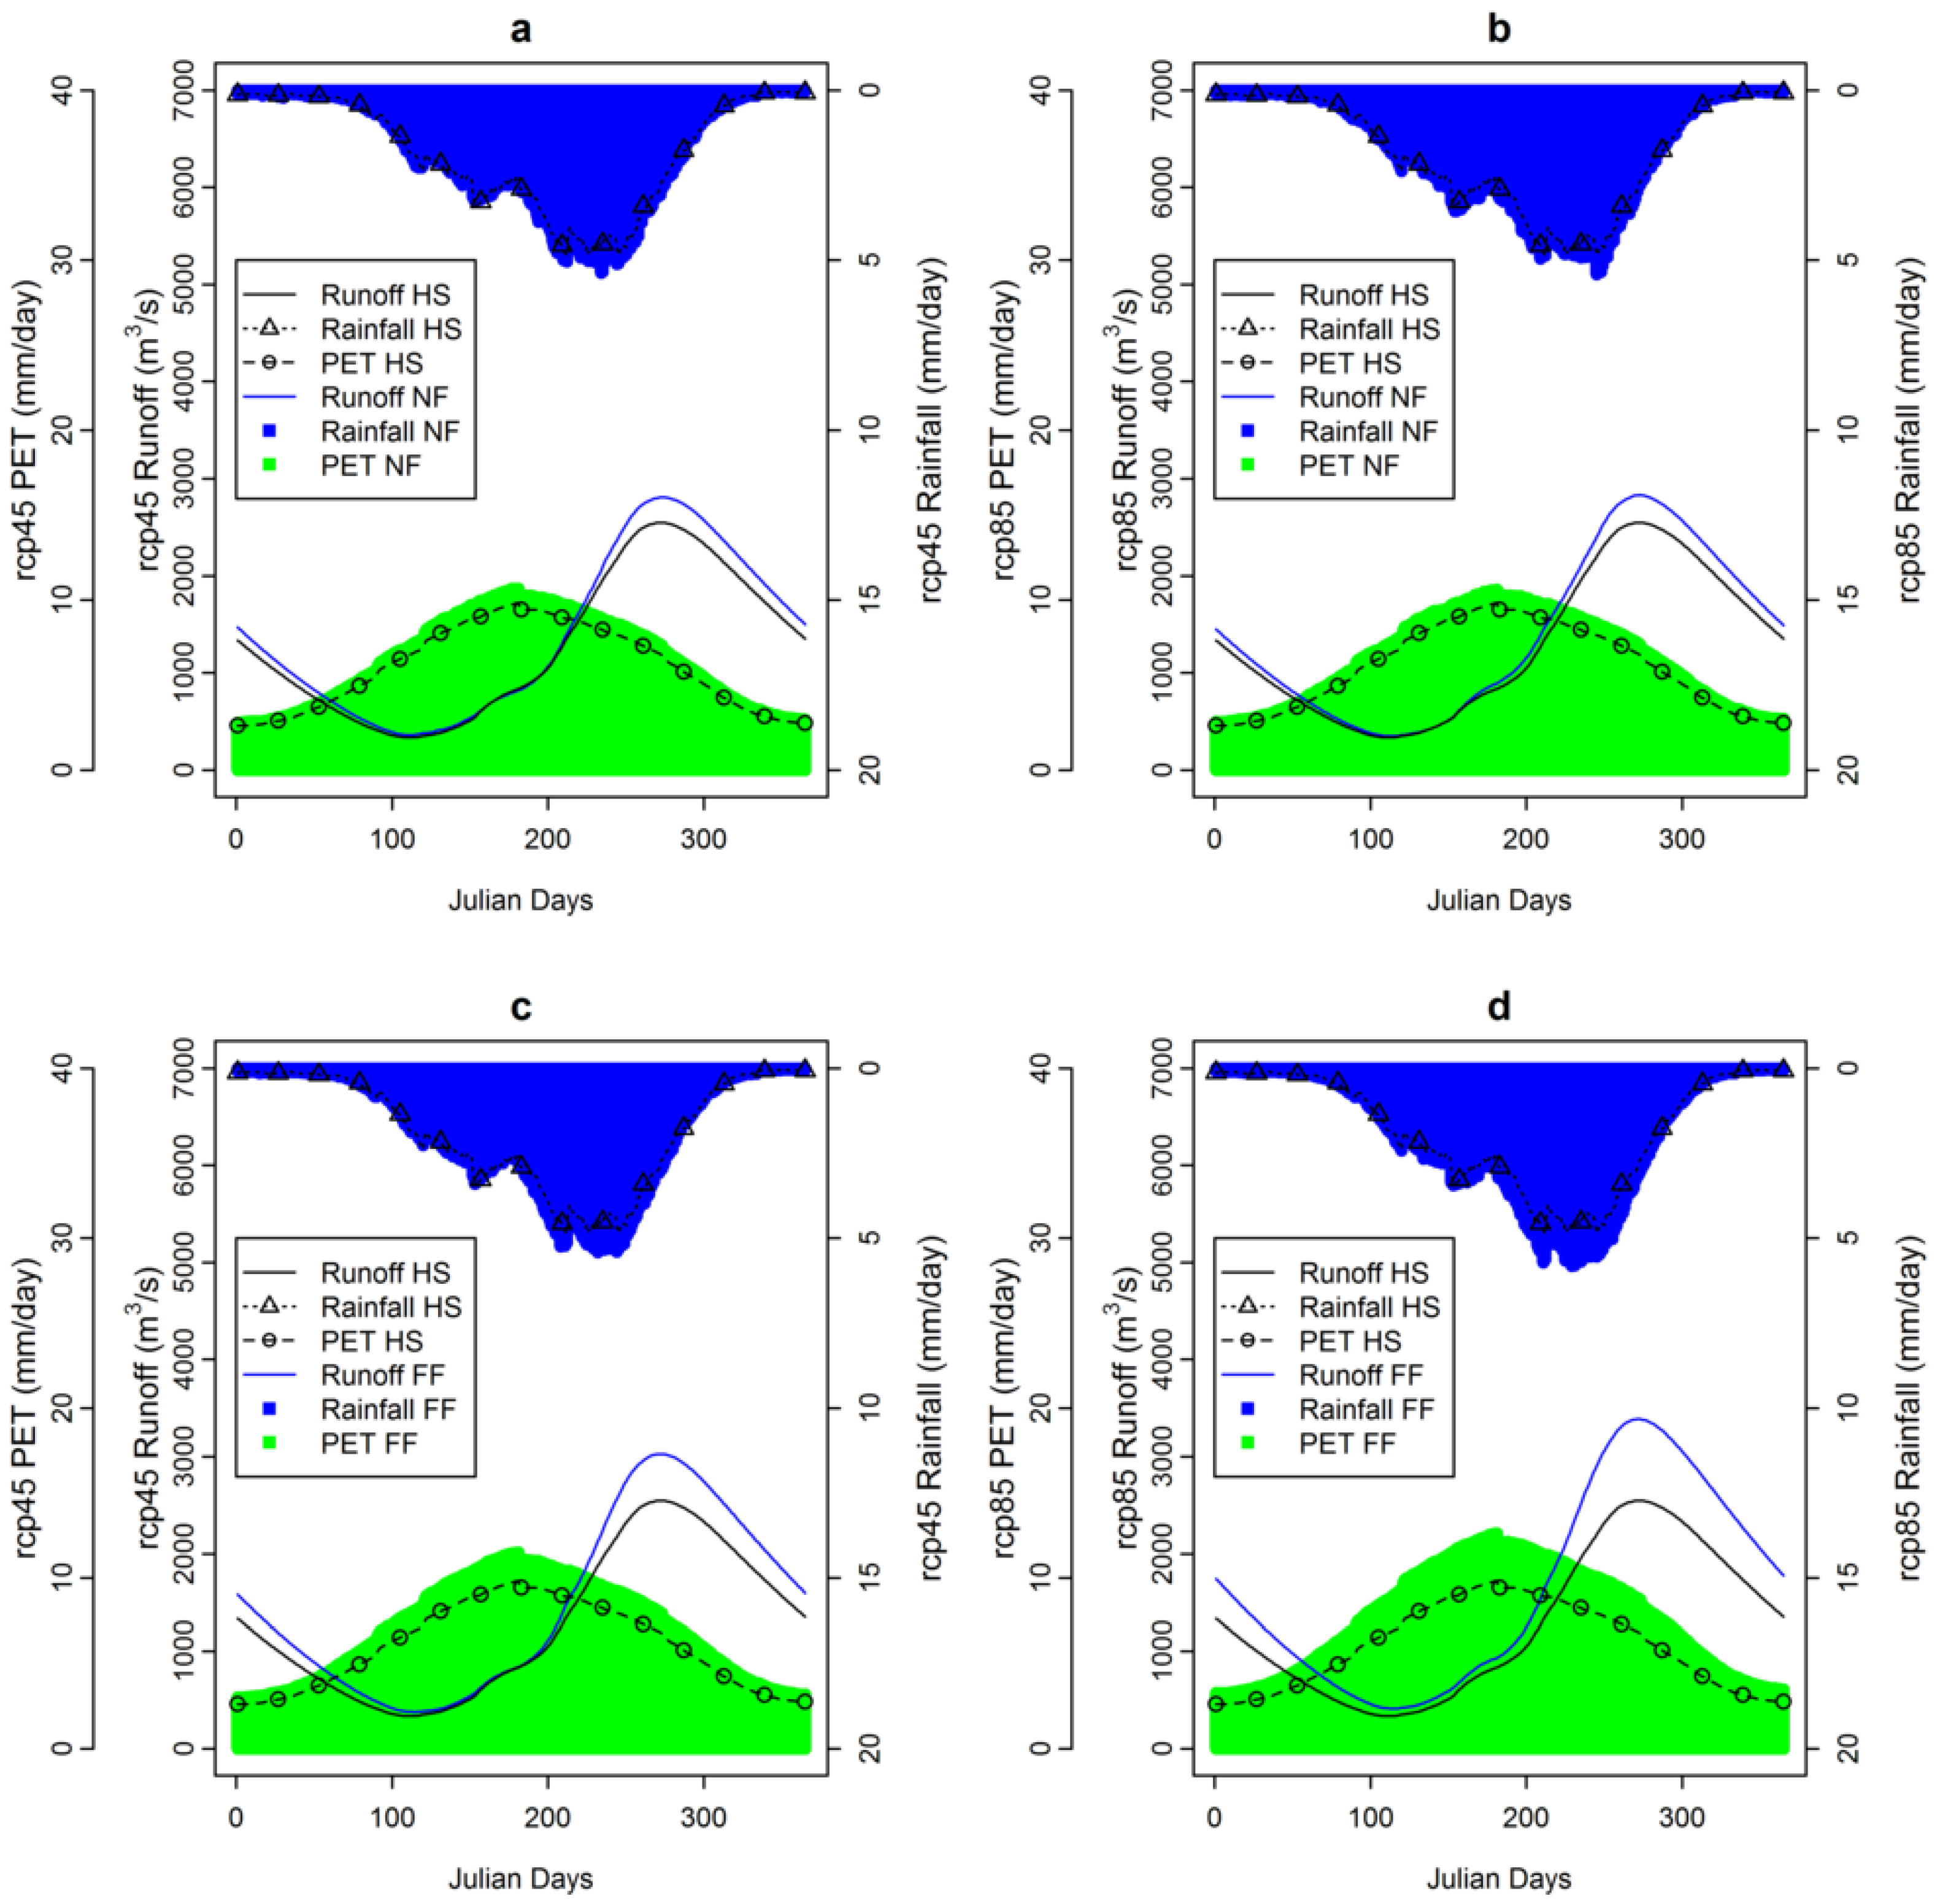
3.2.1. Climate

Annual projected rainfall and PET ensemble median from 8 GCMs for upstream the Kainji Lake are displayed in Figure 4, Figure 5 and Table 2. In the RCP8.5 scenario, there will be more than 100 mm increase in ensemble median rainfall upstream of the Kainji Lake while under RCP4.5, the upstream area will experience a slight increase to mid-century, which will be lost at the end of the century (Figure 4a). However, the magnitude of the rainfall increases is attributed to large standard deviations across the 8 climate models. In the Near Future (Table 2), all models and the ensemble predict increases under the two scenarios except MPI-ESM-LR (RCP4.5) and EC-EARTH (RCP8.5), where slight decreases in rainfall were projected. Near future ensemble daily climatological trends presented in Figure 5 indicated an increase in rainfall throughout the day under the two scenarios. In the Far Future, all models but MPI-ESM-LR (RCP4.5) projected rainfall increases under both scenarios. Far future daily climatological trends follow similar patterns as the Near Future (Figure 5).
Temperature projections are attributed to lower standard deviations among the models compared to rainfall. Temperature will experience a more than 4 °C increase under RCP8.5 around the end of the century while about a 2 °C rise is projected for the RCP4.5 scenario (Figure 4b). Under the RCP8.5 scenario, there will be more than a 2 mm/day increase in ensemble median PET upstream of the Kainji Lake, while under RCP4.5, the upstream area will experience about a 0.5 mm/day increase, which will stabilize by the middle of the century (Figure 4c). In accordance with temperature projection, PET projections are attributed to lower standard deviations across the 8 GCMs. Monthly PET (Table 2) will experience increases based on agreement of all models and the ensemble under both scenarios and future evaluated time slices. Near and far future daily climatological PET trends will increase across the days of the year (Figure 5).

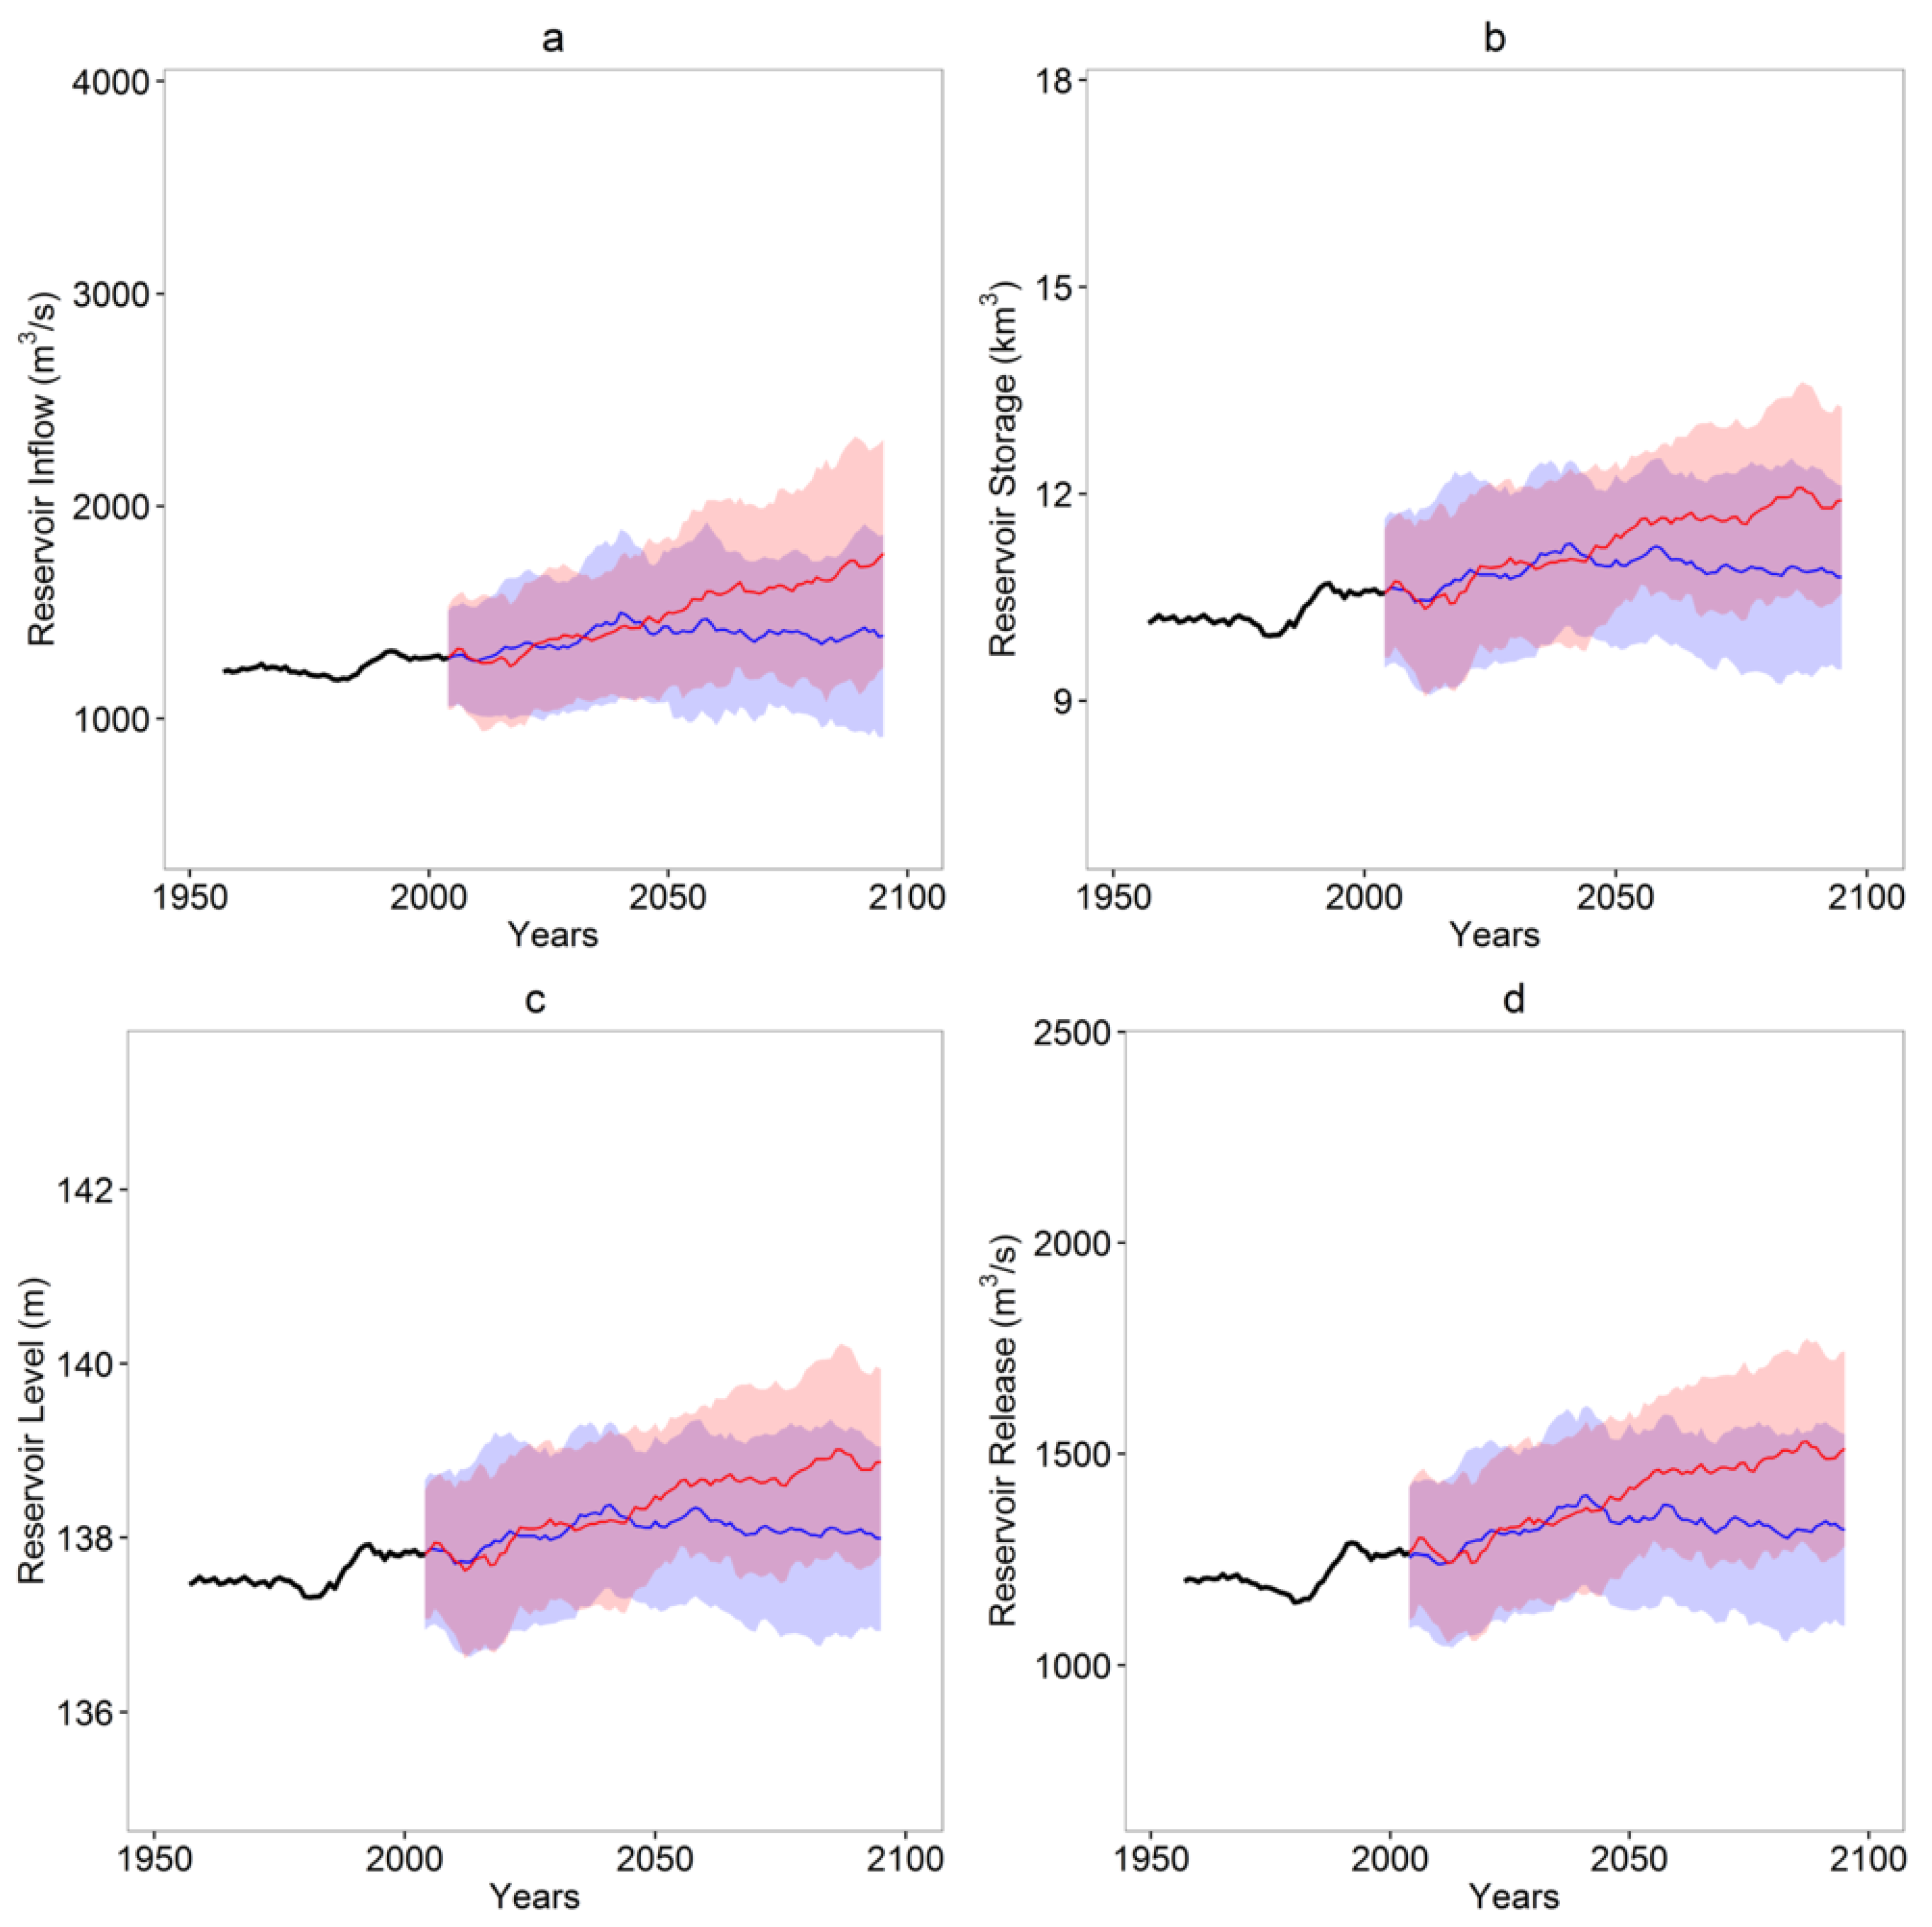
3.2.2. Hydrological Properties of Kainji Lake

Annual projected ensemble median (8 GCMs) climate change impacts on evaluated hydrological properties (reservoir inflow, reservoir storage, reservoir level and reservoir release) of Kainji Lake are displayed in Figure 6. Under the RCP8.5 scenario, there will be a more than 500 m3/s increase in annual average inflow to the Kainji Lake (Figure 6a), while RCP4.5 corresponds to about a 200 m3/s increase through the middle to the end of the century. Projected daily climatological inflow showcased large increases after day 200 (July) under both scenarios in the near future (Figure 5). Far future RCP8.5 daily inflow will experience increases across all days while RCP4.5 follows a similar trend as the near future (Figure 5). For reservoir storage, the RCP8.5 scenario will be associated with about a 2.5 km3 increase in annual average storage while RCP4.5 will be associated with about a 1.25 km3 increase through the middle to the end of the century (Figure 6b). The reservoir level will experience about a 1 m annual average increase at Kainji under RCP8.5 while a 0.5 m increase is expected under the RCP4.5 simulation (Figure 6c). For the controlled release to the turbines, about a 300 m3/s increase is expected at the end of the century under RCP8.5, and there will be about a 150 m3/s increase under the RCP4.5 scenario (Figure 6d). The hydrological projections were associated with a large spread in standard deviation across the contributing 8 climate models.

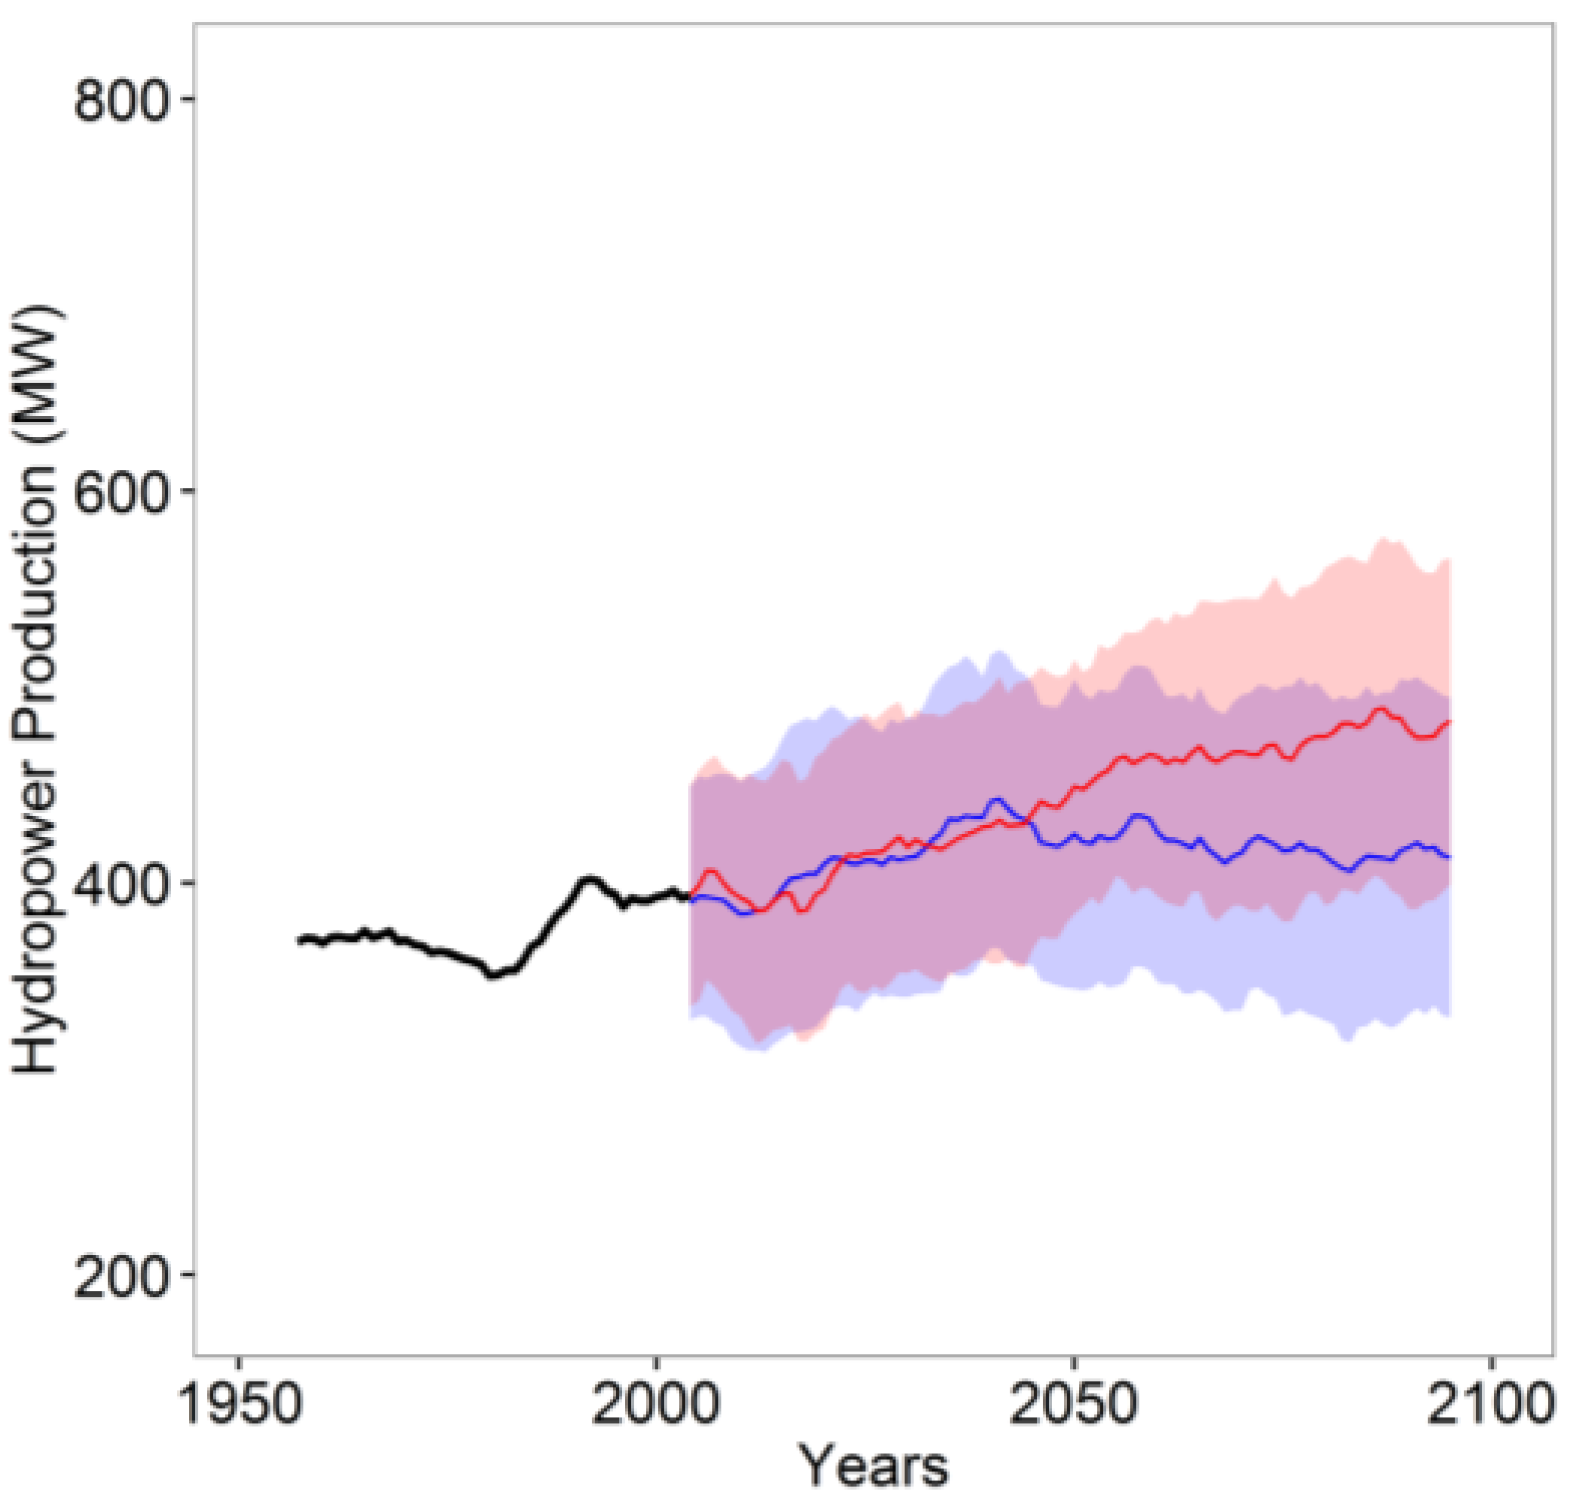
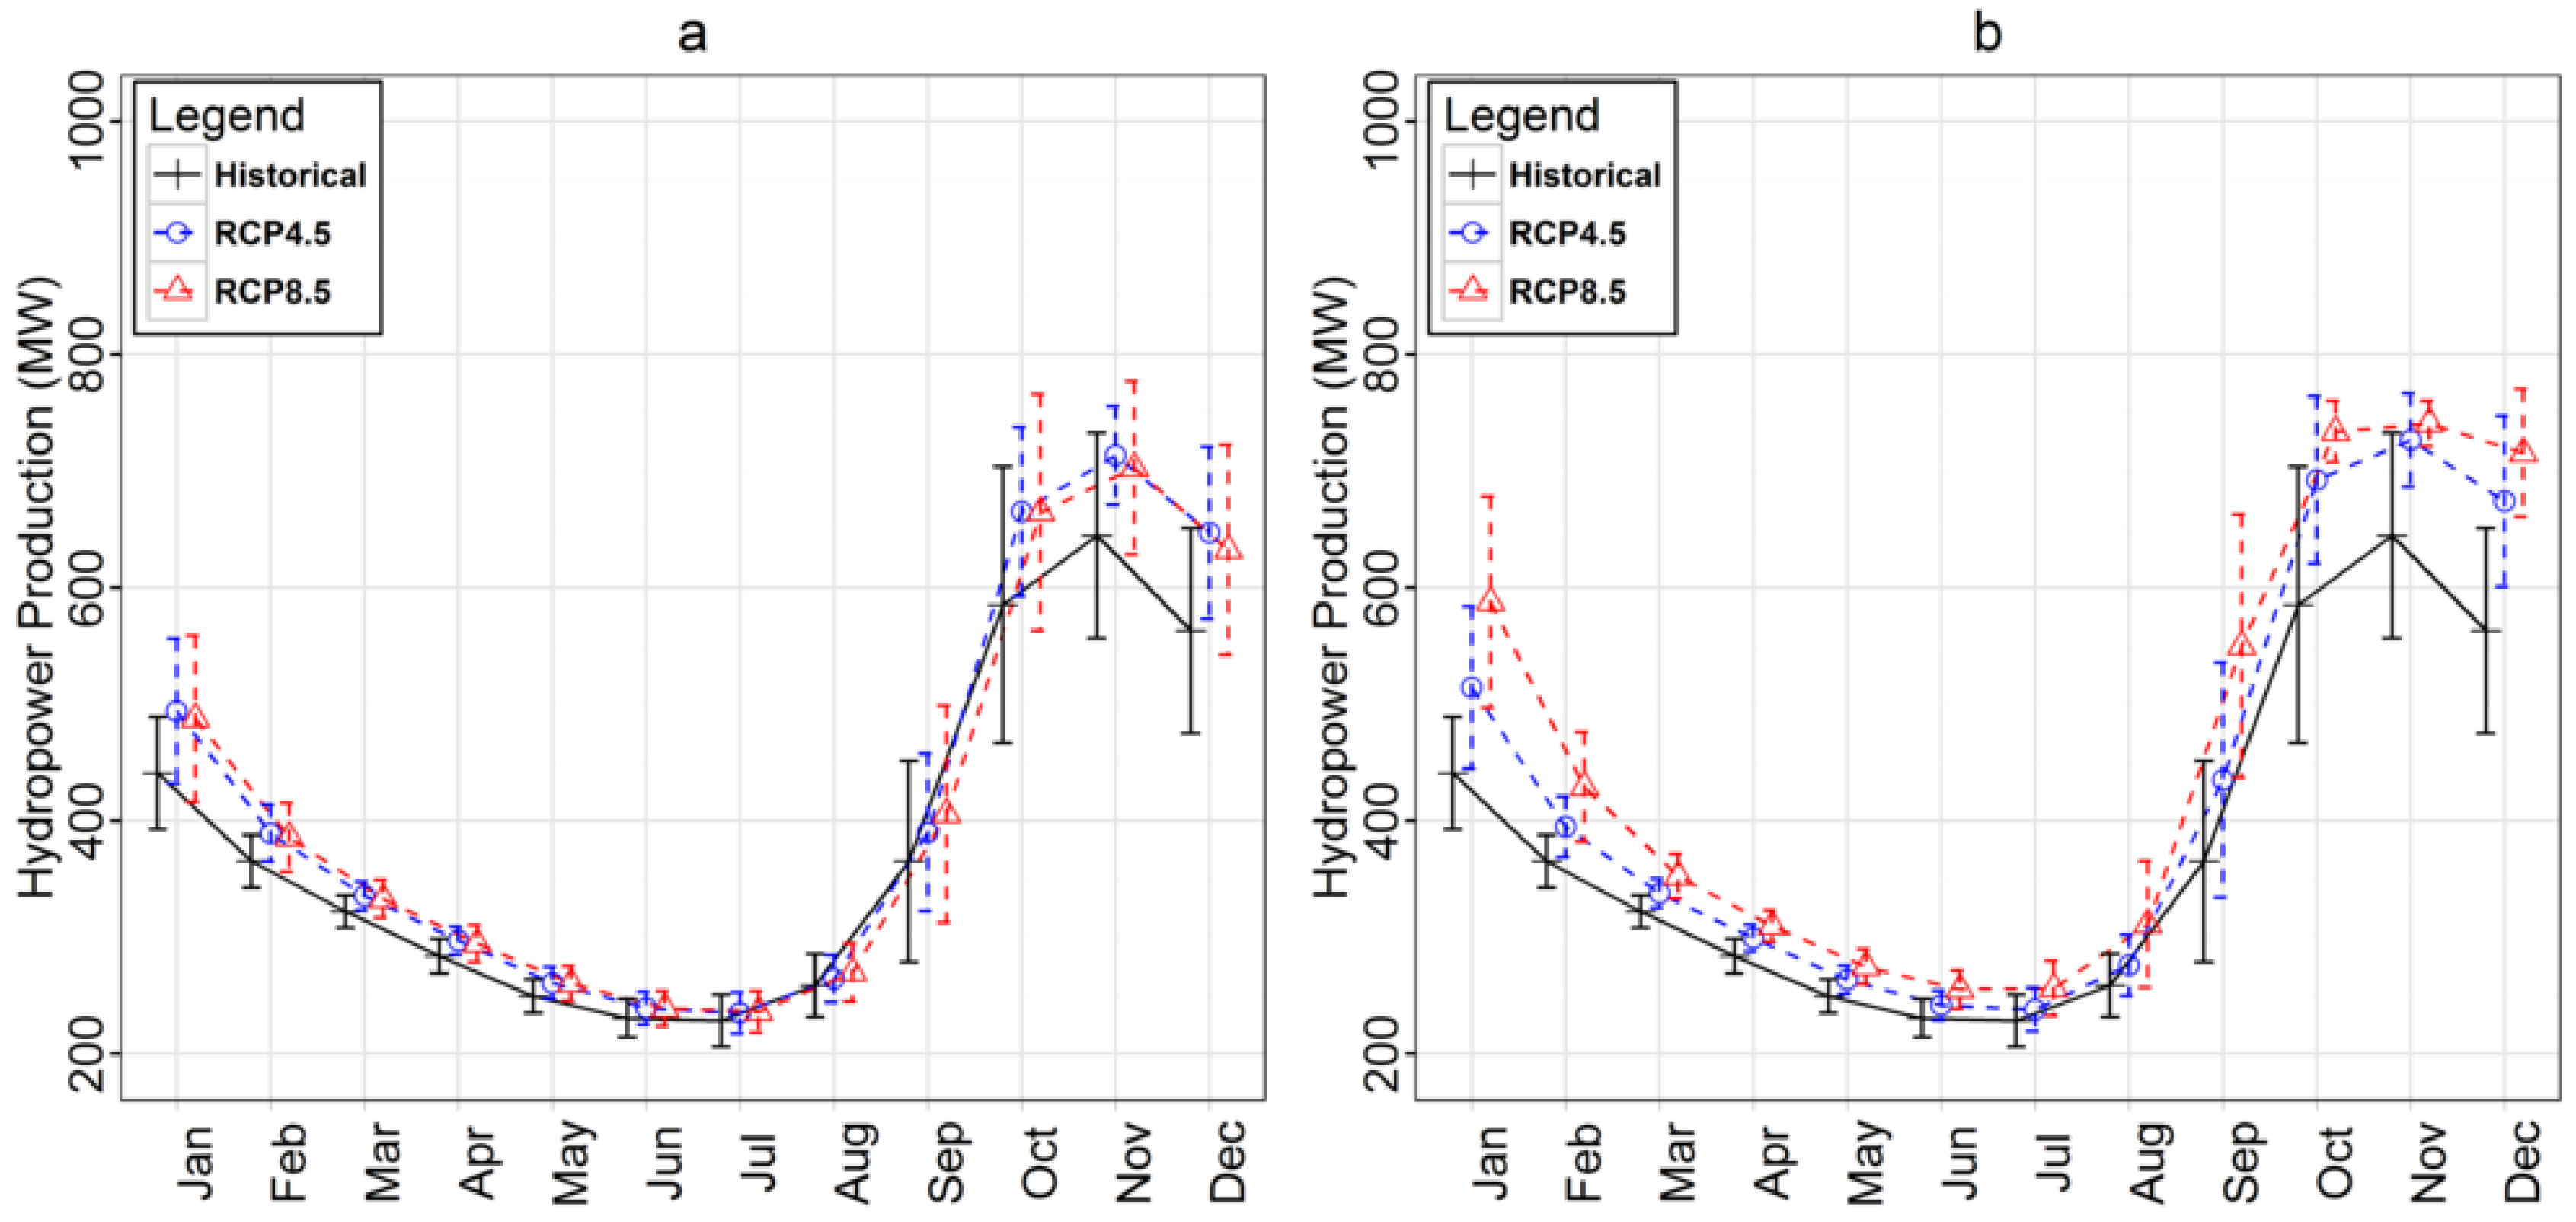
3.2.3. Hydropower Production

Annual projected impacts of climate change on hydropower production in the Kainji Lake based on our model simulation from 8 GCMs are displayed in Figure 7. Energy production will experience about a 100 MW ensemble median increase at the end of the century under RCP8.5, and there will be about a 50 MW increase under the RCP4.5 scenario. The future hydropower projections are associated with large standard deviation among the downscaled GCMs. In the Near Future (Table 2), all models and the ensemble predict increases in the two scenarios except CNRM-CM5 and EC-EARTH where decreases in hydropower are expected. Far Future hydropower production will experience increases with agreements of all models and ensemble except MPI-ESM-LR (RCP 45). Monthly near and far future hydropower trends are presented in Figure 8. In the near future (Figure 8a) under the two scenarios, a highly significant increase (p < 0.01) in hydropower production relative to the historical data will be experienced from January to May and October to December, while significant (p < 0.05) hydropower increase will occur in June. In the far future (Figure 8b), a highly significant increase (p < 0.01) in hydropower will be encountered from January to December under the two scenarios.

4. Discussion

Climate change will drive increases in precipitation and PET upstream of the Kainji dam. This will be due to large patterns of increased rainfall in the Sahelian region [40] due to intensification of the hydrological cycle by increasing atmospheric temperatures, which consequently increase river runoff into the evaluated lake. The study also revealed that the higher the greenhouse gas emissions, the more the hydrological perturbation, as observed in the evaluated RCP4.5 and RCP8.5 emission scenarios. Increasing rainfall due to climate change will consequently drive increases in reservoir inflow and water released downstream. Daily inflow increases will be less prominent before July due to the projected increase in PET and lower rainfall. However, after July, PET decreases and rainfall increases, leading to increases in projected inflows relative to the historical period. This will aggravate the currently challenging August to October downstream flooding at the Kainji dam [7] if proper management measures are not deployed.
The adopted log-exponential reservoir operations rule in this study was suitable for the Kainji Lake based on the reported efficiency criteria of the water level simulation. The same reservoir operations rule was earlier reported to be suitable and to easily fit into different reservoir systems [24], and this was confirmed at Kainji. Rising inflow will drive an increase in the reservoir storage, reservoir level, reservoir release, and consequently, hydropower production. Hydropower systems rely on the potential energy difference between the levels of water in reservoirs, dams or lakes and their discharge tail water levels downstream. The water turbines that convert the potential energy of water to shaft rotation are coupled to suitable generators [41]. A projected increase in hydropower production will add to the untapped African potential for hydropower, which is by far the most established renewable resource for electricity generation and commercial investment [41]. Hydropower systems are easy to run and generally have low maintenance costs compared to other sources of energy.
High uncertainties in the magnitude of changes projected across the 8 dynamically downscaled GCMs were inherited from large discrepancies associated with rainfall projections in West Africa. Sylla et al. [6] ascribed the regional uncertainties in rainfall projections to substantial divergence among the different observational datasets available over the region. Unknown magnitude of potential water abstraction from planned future upstream dams will also add to the uncertainties.

5. Conclusions

Climate change has been a serious challenge and its predictions are associated with high uncertainties in West Africa. With the current global drive for cleaner energy sources, hydropower remains one of the sustainable renewable energy substitutes for fossil fuel. This study evaluated the future impacts of climate change on hydropower production and associated uncertainties based on 8 dynamically downscaled GCMs. Climate change will drive increases in rainfall, PET and hydropower production at the Kainji Lake, thereby adding to untapped hydropower potential in the region. These predictions will help design adaptation strategies for harnessing this important hydropower resource in order to reduce the worsening electricity shortages in the region and enhance socioeconomic developments [3]. Future influence of upstream water abstractions from planned dams and reservoirs on hydropower production in Kainji Lake should be assessed in a following study.

Acknowledgments

This study was funded by the German Ministry of Education and Research (BMBF) through the West African Science Service Center on Climate Change and Adapted Land Use (WASCAL; www.wascal.org), which supports the Graduate Research Program Climate Change and Water Resources at the University of Abomey-Calavi. We thank the ESGF grid (http://esg-dn1.nsc.liu.se/esgf-web-fe/) that provided the CORDEX-Africa future climate projections. We thank the Kainji Hydro-Electric Power Authority for providing the hydro-meteorological data for Kainji Lake. We appreciate the R project (www.r-project.org) and the Hydromad group (www. hydromad.catchment.org) for providing the modeling environments. We thank the anonymous reviewers whose comments have helped in improving the quality of the manuscript.

Author Contributions

Model simulations and analysis was done by Ganiyu Titilope Oyerinde and Dominik Wisser. All figures and tables were done by Ganiyu Titilope Oyerinde, Fabien C.C. Hountondji and Bernd Diekkrüger. Manuscript writing was made by Ganiyu Titilope Oyerinde, Fabien C.C. Hountondji and Bernd Diekkrüger. The PhD thesis where the manuscript was derived from was supervised and examined by Fabien C.C. Hountondji, Ayo J. Odofin, Abel Afouda and Agnide E. Lawin.

Conflicts of Interest

The authors declare no conflict of interest.

References

  1. Mohammed, Y.S.; Mustafa, M.W.; Bashir, N.; Mokhtar, A.S. Renewable energy resources for distributed power generation in Nigeria: A review of the potential. Renew. Sustain. Energy Rev. 2013, 22, 257–268. [Google Scholar] [CrossRef]
  2. Abdulkadir, T.S.; Salami, A.W.; Anwar, A.R.; Kareem, A.G. Modelling of hydropower reservoir variables for energy generation: Neural network approach. Ethiop. J. Environ. Stud. Manag. Vol. 2013, 6, 310–316. [Google Scholar] [CrossRef]
  3. Bartle, A. Hydropower potential and development activities. Energy Policy 2002, 30, 1231–1239. [Google Scholar] [CrossRef]
  4. Gnansounou, E.; Bayem, H.; Bednyagin, D.; Dong, J. Strategies for regional integration of electricity supply in West Africa. Energy Policy 2007, 35, 4142–4153. [Google Scholar] [CrossRef]
  5. Ali, A.; Lebel, T. The Sahelian standardized rainfall index revisited. Int. J. Climatol. 2009, 29, 1705–1714. [Google Scholar] [CrossRef]
  6. Sylla, M.B.; Giorgi, F.; Coppola, E.; Mariotti, L. Uncertainties in daily rainfall over Africa: Assessment of gridded observation products and evaluation of a regional climate model simulation. Int. J. Climatol. 2013, 33, 1805–1817. [Google Scholar] [CrossRef]
  7. Oyerinde, G.T.; Hountondji, F.C.C.; Wisser, D.; Diekkrüger, B.; Lawin, A.E.; Odofin, A.J.; Afouda, A. Hydro-climatic changes in the Niger basin and consistency of local perceptions. Reg. Environ. Chang. 2015, 15, 1627–1637. [Google Scholar] [CrossRef]
  8. Druyan, L.M. Studies of 21st-century precipitation trends over West Africa. Int. J. Climatol. 2011, 31, 1415–1424. [Google Scholar]
  9. Elias, N.N. West Africa Hopes New Hydropower Dams Will Cut Poverty, Climate Risk. Available online: http://news.trust.org//item/20131217125940-0yqo5 (accessed on 27 April 2016).
  10. Ogilvie, A.; Mahéé, G.; Ward, J.; Serpantiéé, G.; Lemoalle, J.; Morand, P.; Barbier, B.; Kaczan, D.; Lukasiewicz, A.; Paturel, J.; et al. Water, agriculture and poverty in the Niger River basin. Water Int. 2010, 35, 594–622. [Google Scholar] [CrossRef]
  11. KFW. Adaptation to Climate Change in the Upper and Middle Niger River Basin. Available online: http://ccsl.iccip.net/niger_river_basin.pdf (accessed on 16 June 2016).
  12. Jimoh, O. Optimized operation of Kainji Reservoir. J. Technol. 2008, 12, 34–42. [Google Scholar]
  13. Jakeman, A.J.; Littlewood, I.G.; Whitehead, P.G. Computation of the instantaneous unit hydrograph and identifiable component flows with application to two small upland catchments. J. Hydrol. 1990, 117, 275–300. [Google Scholar] [CrossRef]
  14. Andrews, F.T.; Croke, B.F.W.; Jakeman, A.J. An open software environment for hydrological model assessment and development. Environ. Model. Softw. 2011, 26, 1171–1185. [Google Scholar] [CrossRef]
  15. Ye, W.; Bates, B.C.; Viney, N.R.; Sivapalan, M. Performance of conceptual rainfall-runoff models in low-yielding ephemeral catchments. Water Resour. Res. 1997, 33, 153–166. [Google Scholar] [CrossRef]
  16. Andrews, F. ARMAX Transfer Function Models. Available online: http://hydromad.catchment.org/man/armax.html (accessed on 30 March 2016).
  17. Dutta, D.; Welsh, W.; Vaze, J.; Kim, S.; Nicholls, D. Improvement in short-term streamflow forecasting using an integrated modelling framework. In Proceedings of 19th International Congress on Model and Simulation, Perth, WA, Australia, 12–16 December 2011.
  18. Jakeman, A.; Hornberger, G. How much complexity is warranted in a rainfall-runoff model? Water Resour. Res. 1993, 29, 2637–2649. [Google Scholar] [CrossRef]
  19. Andrews, F. IHACRES Catchment Wetness Index (CWI) Model. Available online: http://hydromad.catchment.org/man/IHACRES.CWI.model.html (accessed on 31 May 2016).
  20. Nash, J.E.; Sutcliffe, J.V. River flow forecasting through conceptual models part I—A discussion of principles. J. Hydrol. 1970, 10, 282–290. [Google Scholar] [CrossRef]
  21. Legates, D.R.; McCabe, G.J. Evaluating the use of “goodness-of-fit” measures in hydrologic and hydroclimatic model validation. Water Resour. Res. 1999, 35, 233–241. [Google Scholar] [CrossRef]
  22. Krause, P.; Boyle, D.; Bäse, F. Comparison of different efficiency criteria for hydrological model assessment. Adv. Geosci. 2005, 5, 89–97. [Google Scholar] [CrossRef]
  23. Kling, H.; Fuchs, M.; Paulin, M. Runoff conditions in the upper Danube basin under an ensemble of climate change scenarios. J. Hydrol. 2012, 424–425, 264–277. [Google Scholar] [CrossRef]
  24. Proussevitch, A.; Shiklomanov, A.; Frolking, S.; Glidden, S.; Lammers, R.; Wisser, D. Log-Exponential Reservoir Operating Rules for Global and Regional Hydrological Modeling. Available online: http://posters.unh.edu/media/uploads/originals/2013/12/05/2013-12_Fall_AGU.Dams.pdf (accessed on 30 March 2016).
  25. Hirsch, P.E.; Schillinger, S.; Weigt, H.; Burkhardt-holm, P. A hydro-economic model for water level fluctuations: Combining limnology with economics for sustainable development of hydropower. PLoS ONE 2014, 9, 1–26. [Google Scholar] [CrossRef] [PubMed]
  26. Paish, O. Small hydro power: Technology and current status. Renew. Sustain. Energy Rev. 2002, 6, 537–556. [Google Scholar] [CrossRef]
  27. Huffman, G.J.; Adler, R.F.; Arkin, P.; Chang, A.; Ferraro, R.; Gruber, A.; Janowiak, J.; Mcnab, A.; Rudolf, B.; Schneider, U. The Global Precipitation Climatology Project (GPCP) combined precipitation dataset. Bull. Am. Meteorol. Soc. 1997, 78, 5–20. [Google Scholar] [CrossRef]
  28. Rienecker, M.M.; Suarez, M.J.; Gelaro, R.; Todling, R.; Bacmeister, J.; Liu, E.; Bosilovich, M.G.; Schubert, S.D.; Takacs, L.; Kim, G.-K.; et al. MERRA: NASA’s modern-era retrospective analysis for research and applications. J. Clim. 2011, 24, 3624–3648. [Google Scholar] [CrossRef]
  29. Jobard, I.; Chopin, F.; Berges, J.C.; Roca, R. An intercomparison of 10-day satellite precipitation products during West African monsoon. Int. J. Remote Sens. 2011, 32, 2353–2376. [Google Scholar] [CrossRef]
  30. Gosset, M.; Viarre, J. Evaluation of several rainfall products used for hydrological applications over West Africa using two high-resolution gauge networks. Q. J. R. Meteorol. Soc. 2013, 139, 923–940. [Google Scholar] [CrossRef]
  31. Negrón Juárez, R.I.; Li, W.; Fu, R.; Fernandes, K.; de Oliveira Cardoso, A. Comparison of precipitation datasets over the tropical South American and African continents. J. Hydrometeorol. 2009, 10, 289–299. [Google Scholar] [CrossRef]
  32. Oudin, L.; Hervieu, F.; Michel, C.; Perrin, C.; Andréassian, V.; Anctil, F.; Loumagne, C. Which potential evapotranspiration input for a lumped rainfall-runoff model? J. Hydrol. 2005, 303, 290–306. [Google Scholar] [CrossRef]
  33. Lehner, B.; Verdin, K.; Jarvis, A. New global hydrography derived from spaceborne elevation data. EOS Trans. Am. Geophys. Union 2008, 89, 93–94. [Google Scholar] [CrossRef]
  34. Jasiewicz, J.; Metz, M. A new GRASS GIS toolkit for Hortonian analysis of drainage networks. Comput. Geosci. 2011, 37, 1162–1173. [Google Scholar] [CrossRef]
  35. Lucio, P.; Molion, L.; Valadão, C.; Conde, F.; Ramos, A.; Mld, M. Dynamical outlines of the rainfall variability and the ITCZ role over the West Sahel. Atmos. Clim. Sci. 2012, 2, 337–350. [Google Scholar] [CrossRef]
  36. Giorgi, F.; Jones, C.; Asrar, G.R. Addressing climate information needs at the regional level: The CORDEX framework. WMO Bull. 2009, 58, 175–183. [Google Scholar]
  37. Taylor, K.E.; Stouffer, R.J.; Meehl, G.A. An overview of CMIP5 and the experiment design. Bull. Am. Meteorol. Soc. 2012, 93, 485–498. [Google Scholar] [CrossRef]
  38. Ravazzani, G.; Dalla Valle, F.; Gaudard, L.; Mendlik, T.; Gobiet, A.; Mancini, M. Assessing climate impacts on hydropower production: The case of the Toce River Basin. Climate 2016, 4. [Google Scholar] [CrossRef] [Green Version]
  39. Maraun, D. Bias correction, quantile mapping, and downscaling: Revisiting the inflation issue. J. Clim. 2013, 26, 2137–2143. [Google Scholar] [CrossRef]
  40. Sylla, M.B.; Giorgi, F.; Pal, J.S.; Gibba, P.; Kebe, I.; Nikiema, M. Projected changes in the annual cycle of high intensity precipitation events over West Africa for the late 21st century. J. Clim. 2015, 28, 6475–6488. [Google Scholar] [CrossRef]
  41. Rufai, I.A.; Enagi, I.I.; Balami, A.A. Hydropower potential mapping of Niger state. Asian J. Nat. Appl. Sci. 2012, 1, 46–53. [Google Scholar]
Figure 1. Upstream Area of the Kanji Lake.
Climate 04 00034 g001
Figure 2. Adopted reservoir operation scheme; adapted from Proussevitch et al. [24].
Climate 04 00034 g002
Figure 3. Comparison of simulated and observed reservoir level for the (a) calibration and (b) validation periods.
Climate 04 00034 g003
Figure 4. Ensemble median projected annual trends of (a) precipitation, (b) temperature and (c) PET upstream of the Kainji Lake; black lines represents the historical data, red lines are RCP8.5, blue lines are RCP4.5, and standard deviations across 8 GCMs are showcased in the surrounding bounds.
Climate 04 00034 g004
Figure 5. Ensemble (8 GCMs) inflow response to changes in climate variables for (a) near future (NF; 201–2035) RCP4.5, (b) near future RCP8.5, (c) far future (FF; 2036–2099) RCP4.5 and (d) far future RCP8.5 compared with historical data (HS; 1961–2005).
Climate 04 00034 g005
Figure 6. Ensemble median projected annual hydrological properties of Kainji lake; (a) Reservoir inflow, (b) Reservoir storage, (c) Reservoir level, (d) Reservoir release; black lines represent the historical data, red lines are RCP8.5, blue lines are RCP4.5, and standard deviations across the 8 GCMs are showcased in the surrounding bounds.
Climate 04 00034 g006
Figure 7. Ensemble median projected annual hydropower production in Kainji lake; black lines represent the historical data, red lines are RCP8.5, blue lines are RCP4.5, and standard deviations across 8 GCMs are showcased in the surrounding bounds.
Climate 04 00034 g007
Figure 8. Ensemble median projected monthly hydropower production from eight GCMs in (a) the Near future (2010–2035) and (b) far future (2036–2099) compared with historical (1961–2005) data; error bars represent standard deviations across the 8 GCMs.
Climate 04 00034 g008
Table 1. List of CMIP5 models considered in the study.
Modeling Center (or Group)Institute IDModel Name
Canadian Centre for Climate Modeling and AnalysisCCCMACanESM2
Centre National de Recherches Météorologiques/Centre Européen de Recherche et Formation Avancée en Calcul ScientifiqueCNRM-CERFACSCNRM-CM5
NOAA Geophysical Fluid Dynamics LaboratoryNOAA GFDLGFDL-ESM2M
Met Office Hadley Centre (additional HadGEM2-ES realizations contributed by Instituto Nacional de Pesquisas Espaciais) MOHCHadGEM2-ES
Atmosphere and Ocean Research Institute (The University of Tokyo), National Institute for Environmental Studies, and Japan Agency for Marine-Earth Science and TechnologyMIROCMIROC5
Max-Planck-Institut für Meteorologie (Max Planck Institute for Meteorology)MPI-M MPI-ESM-LR
Norwegian Climate CentreNCCNorESM1-M
EC-EARTH consortiumEC-EARTHEC-EARTH
Table 2. Percentage climate and hydropower trends in the near future (NF, 2010–2035) and far future (FF, 2036–2100) relative to the historical (1961–2000) data.
MODELSRainfall (%)PET (%)Hydropower (%)
NFFFNFFFNFFF
RCP 45RCP 85RCP 45RCP 85RCP 45RCP 85RCP 45RCP 85RCP 45RCP 85RCP 45RCP 85
CanESM25.266.459.1118.379.8211.3320.2834.199.779.9517.2828.86
CNRM-CM50.282.355.1714.026.216.5813.4122.66−1.47−0.695.3318.46
EC-EARTH0.44−1.573.696.437.828.5315.8827.22−0.90−4.222.355.67
MIROC511.1910.1515.1928.579.589.9317.6528.0929.0623.3032.8448.24
HadGEM2-ES6.978.804.939.598.9810.8921.4935.8115.6818.1716.9725.55
MPI-ESM-LR−0.753.29−1.553.387.858.4615.9428.911.845.44-0.406.82
NorESM1-M4.014.777.6712.917.248.1415.3223.986.818.4313.5820.23
GFDL-ESM2M2.925.356.199.329.589.6615.3226.204.435.058.578.46
ENSMED4.174.105.8713.288.439.3216.7727.878.728.6312.8124.00

