
Analyses of Observed and Anticipated Changes in Extreme Climate Events in the Northwest Himalaya

Abstract
:1. Introduction
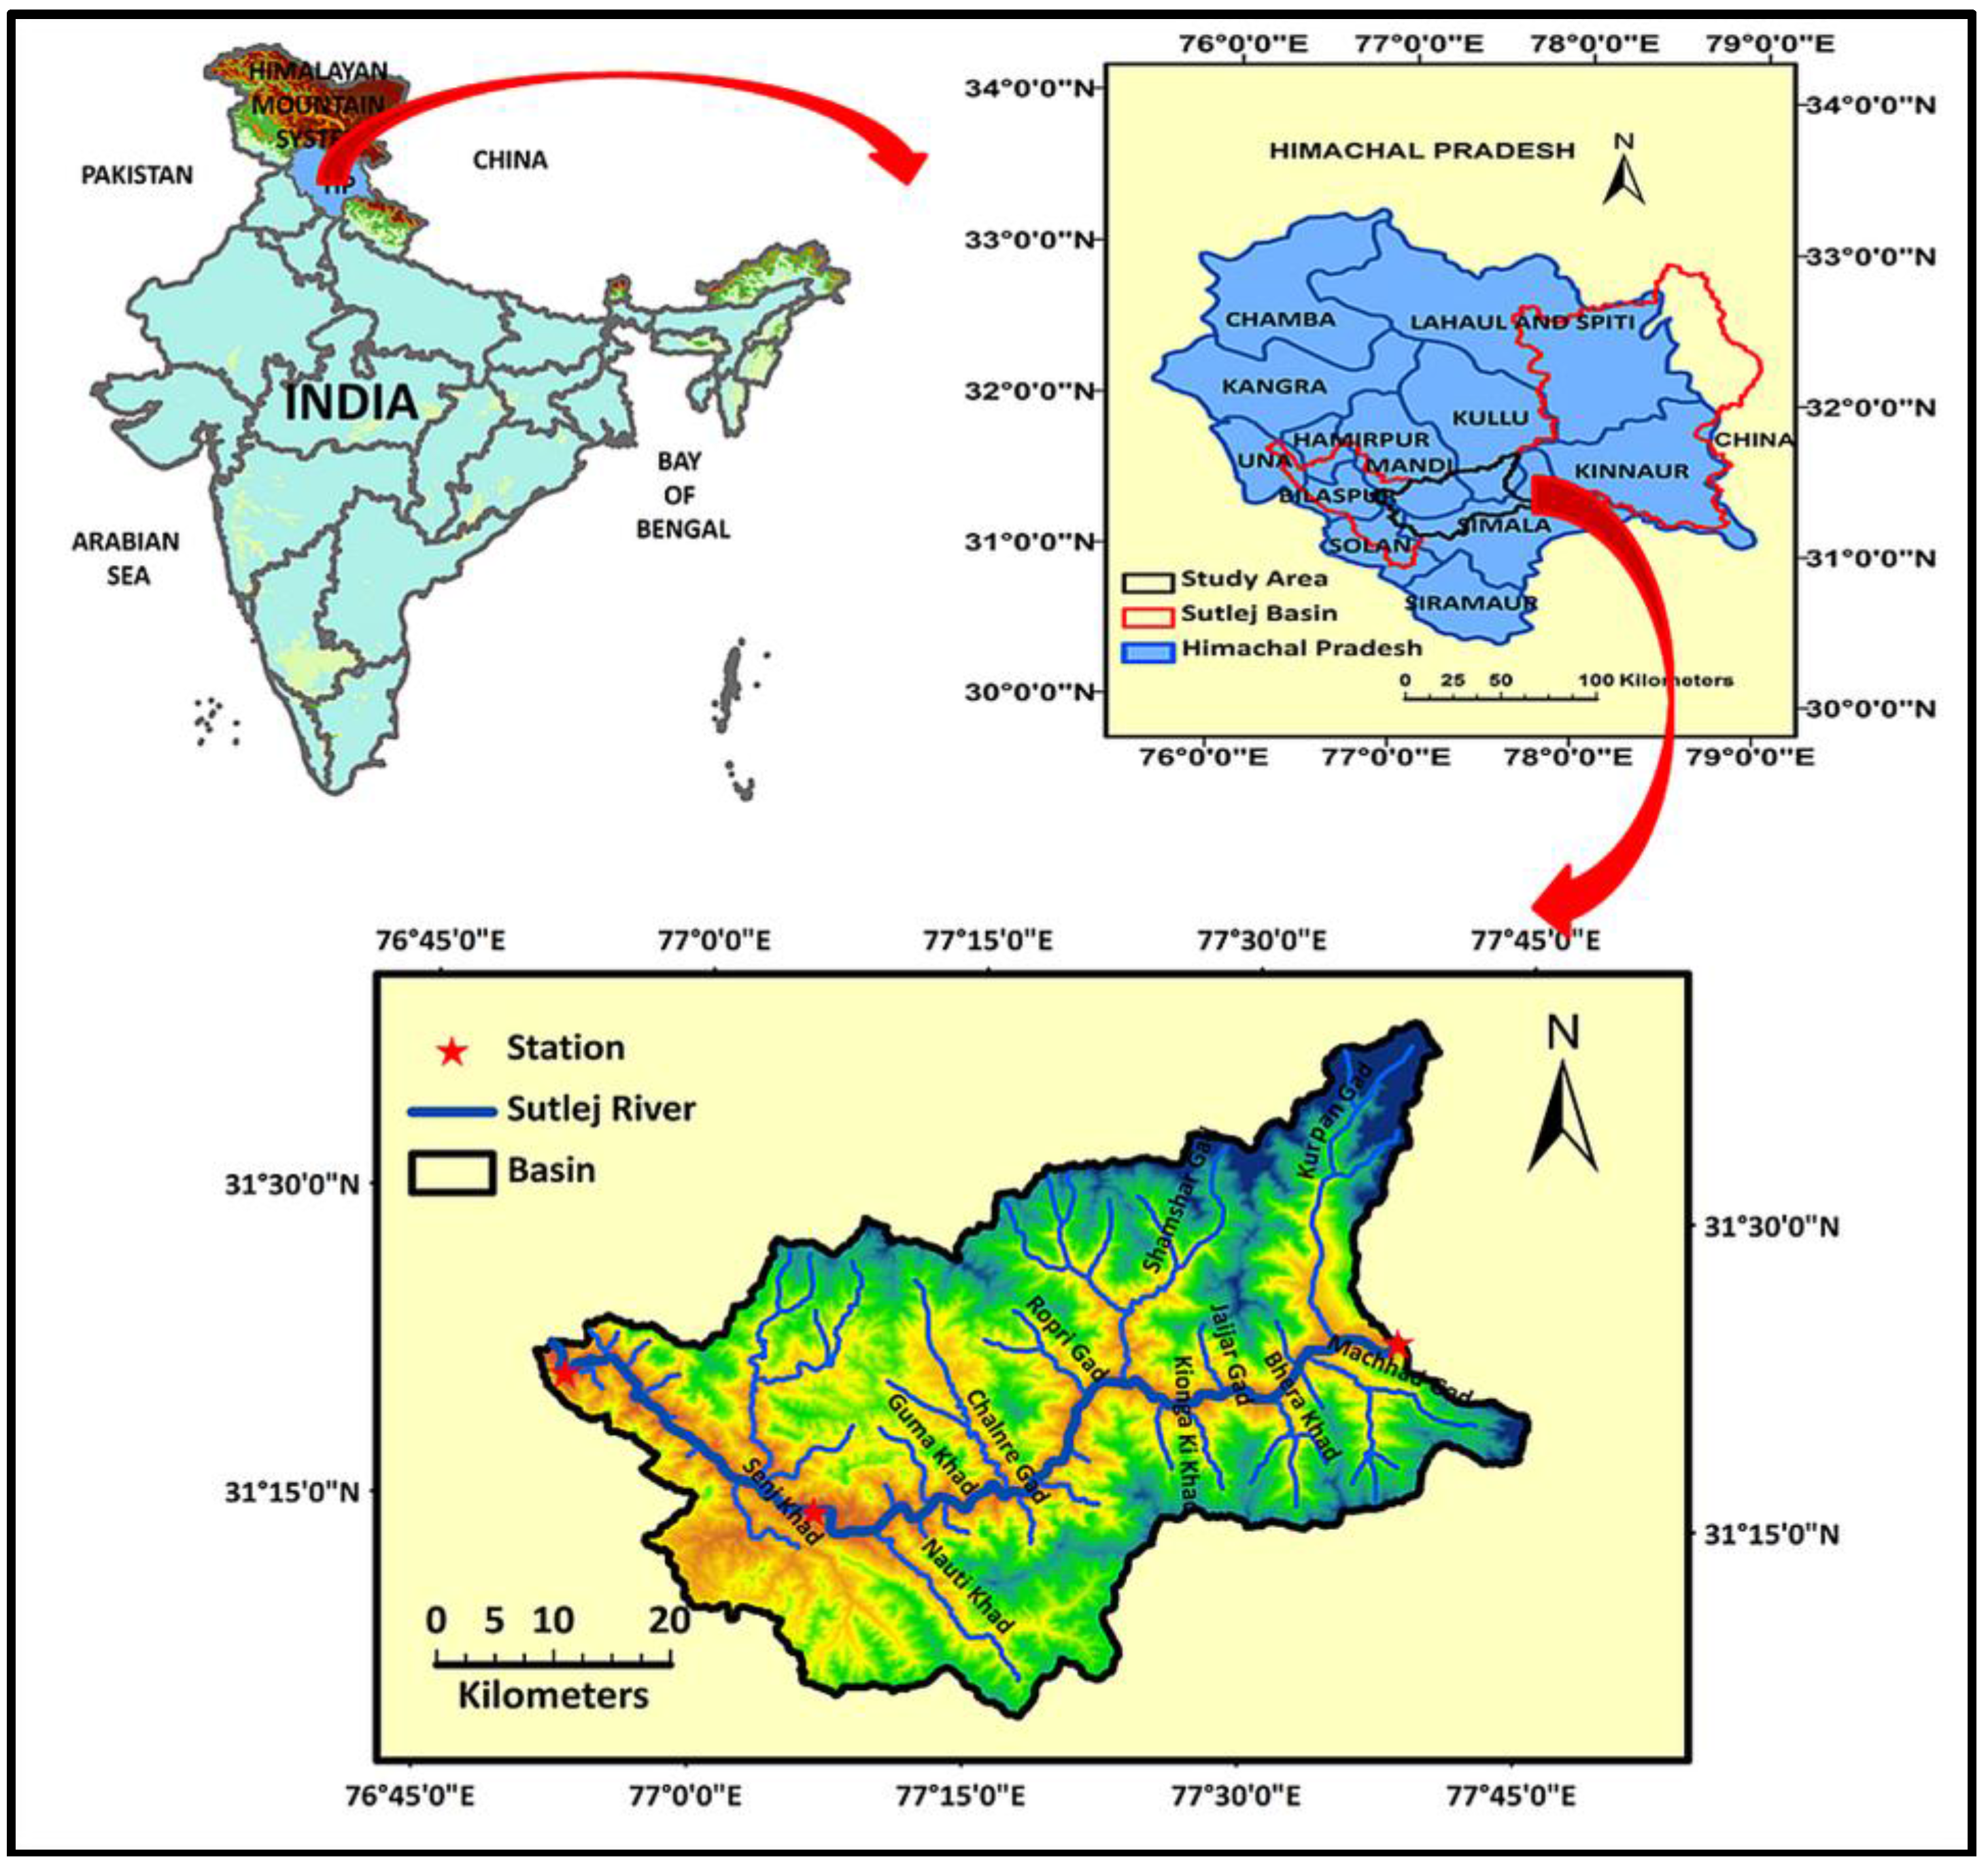
2. Study Area

| Reach | Catchment Area (km2) | Elevation Range (m) | Average Annual Rainfall (mm) | Major Source of Contributions to the Stream Flow |
|---|---|---|---|---|
| Spiti Valley | 7084 | 3300–5300 | Scarce (<50) | Snow and glacier |
| Namgia to Rampur | 6490 | 3000–4800 | Little (<150) | Snow and rainfall |
| Rampur to Sunni | 2068 | 1200–3000 | 1000–1500 | Rainfall |
| Sunni to Kasol | 700 | 900–2000 | 910–1630 | Rainfall |
| Kasol to Bhakhra | 3108 | 600–2000 | 1520 | Rainfall |
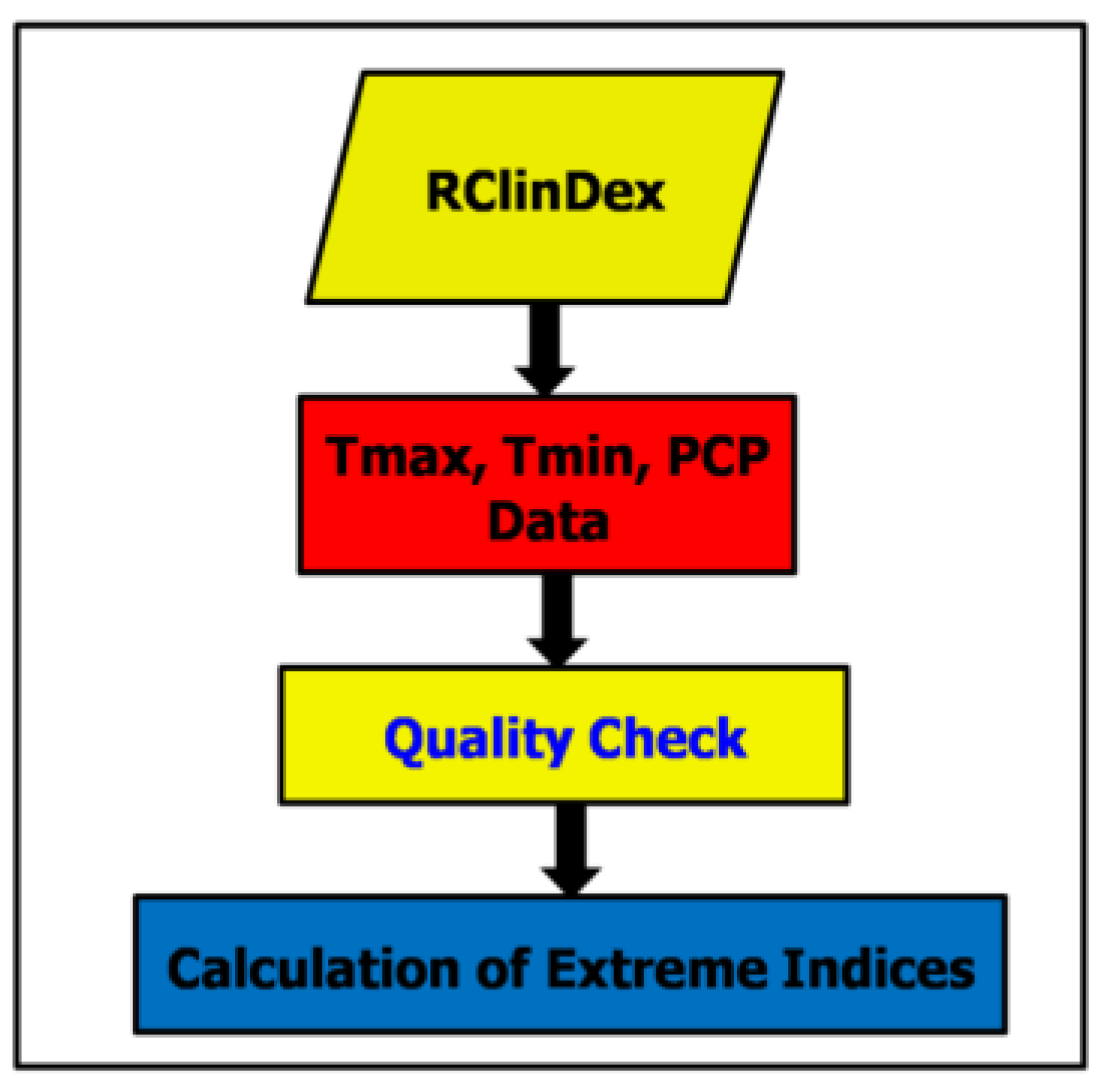
3. Data
4. Methodology
| ID | Indicator Name | Definitions | Units |
|---|---|---|---|
| CSDI | Cold spell duration indicators | Annual count of days with at least 6 consecutive days when TN < 10th percentile | Days |
| DTR | Diurnal temperature range | Monthly mean difference between TX and TN | °C |
| FD0 | Frost days | Annual count when TN(daily minimum) <0 °C | Days |
| ID0 | Ice days | Annual count when TX(daily maximum) <0 °C | Days |
| GSL | Growing season Length | Annual count between first span of at least 6 days with TG >5 °C after winter and first span after summer of 6 days with TG <5 °C | Days |
| SU25 | Summer days | Annual count when TX(daily maximum) >25°C | Days |
| TR20 | Tropical nights | Annual count when TN(daily minimum) >20°C | Days |
| TXx | Max TMax | Monthly maximum value of daily maximum temp | °C |
| TNx | Max TMin | Monthly maximum value of daily minimum temp | °C |
| TXn | Min TMax | Monthly minimum value of daily maximum temp | °C |
| TNn | Min TMin | Monthly minimum value of daily minimum temp | °C |
| TN10p | Cool nights | Percentage of days when TN < 10th percentile | Days |
| TX10p | Cool days | Percentage of days when TX < 10th percentile | Days |
| TN90p | Warm nights | Percentage of days when TN > 90th percentile | Days |
| TX90p | Warm days | Percentage of days when TX > 90th percentile | Days |
| WSDI | Warm spell duration indicators | Annual count of days with at least 6 consecutive days when TX > 90th percentile | Days |
| ID | Indicator Name | Definitions | Units |
|---|---|---|---|
| CDD | Consecutive dry days | Maximum number of consecutive days with RR <1mm | Days |
| CWD | Consecutive wet days | Maximum number of consecutive days with RR ≥1mm | Days |
| PRCPTOT | Annual total wet-day precipitation | Annual total PCP in wet days (RR ≥1mm) | mm |
| RX1day | Max 1-day precipitation amount | Monthly maximum 1-day precipitation | mm |
| Rx5day | Max 5-day precipitation amount | Monthly maximum consecutive 5-day precipitation | mm |
| R10 | Number of heavy precipitation days | Annual count of days when PCP ≥10mm | Days |
| R20 | Number of very heavy precipitation days | Annual count of days when PCP ≥20mm | Days |
| Rnn | Number of days above nn mm | Annual count of days when PCP ≥nn mm, nn is user defined threshold | Days |
| R95p | Very wet days | Annual total PCP when RR > 95th percentile | mm |
| R99p | Extremely wet days | Annual total PCP when RR > 99th percentile | mm |
| SDII | Simple daily intensity index | Annual total precipitation divided by the number of wet days (defined as PRCP ≥1.0mm) in the year | mm /day |
5. Results and Discussions
5.1. Annual Trends in Extreme Indices of Temperature for 1970–2005
| Indicator Name | Kasol | Sunni | Rampur | |||
|---|---|---|---|---|---|---|
| Zs | Q (°C or day/year) | Zs | Q (°C or day/year) | Zs | Q (°C or day/year) | |
| Cold spell duration indicator | (+) | 0.06 | (+) | 0.18 | (−) | 0.24 |
| Diurnal temperature range | (+) | 0.01 | (+) * | 0.05 | (+) * | 0.04 |
| Frost days | NA | NA | (+) | 0.55 | NT | - |
| Summer days | NT | - | NT | - | NT | - |
| Tropical nights | (−) * | −0.67 | (−) * | −0.66 | (+) | 0.19 |
| Max TMax | NT | - | (+) * | 0.11 | (+) | 0.04 |
| Max TMin | (−) | −0.03 | NT | - | NT | - |
| Min TMax | (−) * | -0.06 | (+) | 0.06 | (+) * | 0.07 |
| Min TMin | (−) * | -0.03 | NT | - | (+) | 0.02 |
| Cool nights | NT | - | (+) * | 0.20 | (−) | −0.11 |
| Cool days | (+) * | 0.13 | (−) | −0.07 | (−) | −0.08 |
| Warm nights | (−) * | −0.18 | (−) * | −0.32 | NT | - |
| Warm days | NT | - | NT | - | (+) | 0.2 |
| Warm spell duration indicators | NT | - | NT | - | NT | - |
5.2. Annual Trends in Extreme Indices of Precipitation for 1970–2005
| Indicator Name | Kasol | Sunni | Rampur | |||
|---|---|---|---|---|---|---|
| Zs | Q (mm or day/year) | Zs | Q (mm or day/year) | Zs | Q (mm or day/year) | |
| Consecutive dry days | (+) | 0.26 | (+) | 0.15 | (+) | 0.33 |
| Consecutive wet days | (−) * | 0.11 | (−) * | 0.07 | NT | - |
| Annual total wet-day precipitation | (−) | 2.35 | (−) | 3.80 | (+) | 1.54 |
| Max 1-day precipitation amount | (+) | 0.55 | (−) | 0.23 | (+)* | 0.85 |
| Max 5-day precipitation amount | (−) | 0.72 | (−) | 0.81 | (+)* | 0.87 |
| Number of heavy precipitation days >10 mm | (−) | 0.15 | (−) | 0.15 | (−) | 0.09 |
| Number of very heavy precipitation days >20 mm | (−) | 0.10 | (−) | 0.03 | (+) | 0.08 |
| Number of days above nn mm (nn =5) | (−) | 0.19 | (−) * | 0.33 | (−) | 0.14 |
| Very wet days | (+) | 1.20 | (+) | 0.99 | (+) * | 3.70 |
| Extremely wet days | NT | - | NT | - | (+) * | 1.78 |
| Simple daily intensity index | NT | - | (+) | 0.02 | (+) * | 0.05 |
5.3. Annual Trends in Extreme Indices of Temperature for 2011–2099
| Indices | Kasol | Sunni | Rampur | |||
|---|---|---|---|---|---|---|
| Zs | Q (°C or day/year) | Zs | Q (°C or day/year) | Zs | Q (°C or day/year) | |
| Cold spell duration indicator | (−) | 0.18 | (−) | 0.3 | (−) | 0.18 |
| Diurnal temperature range | NT | - | (−) * | 0.03 | (−) * | 0.02 |
| Frost days | NA | - | (−) | 0.14 | NT | - |
| Summer days | (+) * | 0.41 | (+) * | 0. 21 | (+) * | 0.11 |
| Tropical nights | (+) * | 0.30 | (+) * | 0. 66 | (+) * | 0. 41 |
| Max TMax | (+) * | 0.03 | (+) * | 0.02 | (+) | 0.01 |
| Max TMin | (+) * | 0.02 | (+) * | 0. 05 | NT | - |
| Min TMax | (+) * | 0. 04 | (+) * | 0.02 | NT | - |
| Min TMin | (+) * | 0.02 | (+) * | 0. 04 | NT | - |
| Cool nights | (−) * | 0.12 | (−) * | 0.21 | (−) * | 0.12 |
| Cool days | (−) * | 0.08 | (−) * | 0.03 | NT | - |
| Warm nights | (+) * | 0.13 | (+) * | 0.25 | (+) * | 0. 13 |
| Warm days | (+) * | 0.11 | (+) * | 0.04 | NT | - |
| Warm spell duration indicator | (+) | 0.02 | (+) | 0.07 | (+) | 0.02 |
| Indices | Kasol | Sunni | Rampur | |||
|---|---|---|---|---|---|---|
| Zs | Q (°C or day/year) | Zs | Q (°C or day/year) | Zs | Q (°C or day/year) | |
| Cold spell duration indicator | (−) | 0.14 | (−) | 0.39 | (−) | 0.39 |
| Diurnal temperature range | (−) * | 0.01 | NT | - | (−) * | 0.03 |
| Frost days | NA | - | (−) | 0.09 | NT | - |
| Summer days | (+) * | 0.22 | (+) * | 0.60 | (+) * | 0.29 |
| Tropical nights | (+) * | 0.34 | (+) * | 0.67 | (+) * | 0.84 |
| Max TMax | NT | - | (+) * | 0.08 | (+) * | 0.05 |
| Max TMin | (+) * | 0.03 | (+) * | 0.06 | (+) * | 0.03 |
| Min TMax | (+) * | 0.02 | (+) * | 0.04 | (+) * | 0.02 |
| Min TMin | (+) * | 0.01 | NT | - | (+) * | 0.02 |
| Cool nights | (−) * | 0.01 | (−) * | 0.23 | (−) * | 0.23 |
| Cool days | NT | - | (−) * | 0.14 | (−) * | 0.08 |
| Warm nights | (+) * | 0.10 | (+) * | 0.24 | (+) * | 0.24 |
| Warm days | NT | - | (+) * | 0.12 | (+) * | 0.07 |
| Warm spell duration indicator | (+) | 0.04 | (+) | 0.31 | (+) | 0.10 |
5.4. Annual Trends in Extreme Indices of Precipitation for 2011–2099
| Indices | Kasol | Sunni | Rampur | |||
|---|---|---|---|---|---|---|
| Zs | Q (mm or day/year) | Zs | Q (mm or day/year) | Zs | Q (mm or day/year) | |
| Consecutive dry days | (−) | 0.09 | (−) | 0.04 | NT | - |
| Consecutive wet days | (+) * | 0.10 | (+) * | 0.08 | (+) * | 0.05 |
| Annual total wet-day precipitation | (+) * | 17.39 | (+) * | 10.00 | (+) * | 5.72 |
| Max 1-day precipitation amount | (+) * | 0.98 | (+) * | 0.44 | (+) | 0.08 |
| Max 5-day precipitation amount | (+) * | 1.94 | (+) * | 1.11 | (+) * | 0.39 |
| Number of heavy precipitation days >10 mm | (+) * | 0.31 | (+) * | 0.28 | (+) * | 0.24 |
| Number of very heavy precipitation days >20 mm | (+) * | 0.25 | (+) * | 0.16 | (+) * | 0.08 |
| Number of days above nn mm (nn =5) | (+) * | 0.36 | (+) * | 0.38 | (+) * | 0.31 |
| Very wet days | (+) * | 8.49 | (+) * | 4.83 | (+) * | 1.39 |
| Extremely wet days | (+) | 4.35 | (+) | 1.30 | (+) | 0.55 |
| Simple daily intensity index | (+) * | 0.09 | (+) * | 0.03 | (+) * | 0.01 |
| Indices | Kasol | Sunni | Rampur | |||
|---|---|---|---|---|---|---|
| Zs | Q (mm or day/year) | Zs | Q (mm or day/year) | Zs | Q (mm or day/year) | |
| Consecutive dry days | (+) * | 0.30 | (+) * | 0.12 | (+) * | 0.04 |
| Consecutive wet days | (+) * | 0.20 | NT | - | NT | - |
| Annual total wet-day precipitation | (+) * | 14.64 | (+) | 0.77 | (+) | 0.66 |
| Max 1-day precipitation amount | (+) * | 0.65 | (+) | 0.25 | (+) | 0.03 |
| Max 5-day precipitation amount | (+) * | 1.92 | (+) | 0.33 | (+) | 0.16 |
| Number of heavy precipitation days >10 mm | (+) * | 0.22 | (−) | 0.01 | (+) | 0.03 |
| Number of very heavy precipitation days >20 mm | (+) * | 0.23 | NT | - | NT | - |
| Number of days above nn mm (nn =5) | (+) * | 0.16 | (−) | 0.06 | (+) | 0.02 |
| Very wet days | (+) * | 6.90 | (+) | 1.09 | (+) | 0.06 |
| Extremely wet days | (+) | 3.30 | (+) | 1.12 | (+) | 0.41 |
| Simple daily intensity index | (+) * | 1.11 | (+) * | 0.02 | (+) * | 0.01 |
6. Conclusions
Acknowledgments
Author Contributions
Conflicts of Interest
References
- Parry, M.L.; Canziani, O.F.; Palutikof, J.P.; van der Linden, P.J.; Hanson, C.E. Climate Change (2007): Impacts, Adaptation and Vulnerability; Cambridge University Press: Cambridge, UK, 2007. [Google Scholar]
- Easterling, D.R.; Meehl, G.A.; Parmesan, C.; Changnon, S.A.; Karl, T.R.; Mearns, L.O. Climate extremes: Observations, modeling, and impacts. Science 2000, 289, 2068–2074. [Google Scholar] [CrossRef] [PubMed]
- Kothawale, D.R.; Munot, A.A.; Krishna, K.K. Surface air temperature variability over India during 1901–2007, and its association with ENSO. Clim. Res. 2010, 42, 89–104. [Google Scholar] [CrossRef]
- Sheikh, M.M.; Manzoor, N.; Ashraf, J.; Adnan, M.; Collins, D.; Hameed, S.; Manton, M.J.; Ahmed, U.; Baidya, S.K.; Borgaonkar, H.P.; et al. Trends in extreme daily rainfall and temperature indices over South Asia. Int. J. Clin. Climatol. 2015, 35, 1625–1637. [Google Scholar] [CrossRef]
- Groisman, P.Y.; Knight, R.W.; Easterling, D.R.; Karl, T.R.; Hegerl, G.C.; Razuvaev, V.N. Trends in intense precipitation in the climate record. J. Clim. 2005, 18, 1326–1350. [Google Scholar] [CrossRef]
- Donat, M.G.; Alexander, L.V.; Yang, H.; Durre, I.; Vose, R.; Dunn, R.J.H.; Willett, K.M.; Aguilar, E.; Brunet, M.; Caesar, J.; et al. Updated analyses of temperature and precipitation extreme indices since the beginning of the twentieth century: The HadEX2 dataset. J. Geophys. Res. Atmos. 2013, 118, 2098–2118. [Google Scholar] [CrossRef]
- Klein Tank, A.M.G.; Können, G.P. Trends in indices of daily temperature and precipitation extremes in Europe, 1946–99. J. Clim. 2003, 16, 3665–3680. [Google Scholar] [CrossRef]
- Moberg, A.; Jones, P.D. Trends in indices for extremes in daily temperature and precipitation in central and western Europe, 1901–99. Int. J. Clin. Climatol. 2005, 25, 1149–1171. [Google Scholar] [CrossRef]
- Domonkos, P.; Kyselý, J.; Piotrowicz, K.; Petrovic, P.; Likso, T. Variability of extreme temperature events in south–central Europe during the 20th century and its relationship with large-scale circulation. Int. J. Clin. Climatol. 2003, 23, 987–1010. [Google Scholar] [CrossRef]
- Haylock, M.; Goddess, C. Interannual variability of European extreme winter rainfall and links with mean large-scale circulation. Int. J. Clin. Climatol. 2004, 24, 759–776. [Google Scholar] [CrossRef]
- Moberg, A.; Jones, P.D.; Lister, D.; Walther, A.; Brunet, M.; Jacobeit, J.; Alexander, L.V.; Della-Marta, M.P.; Luterbacher, J.; Yiou, P.; et al. Indices for daily temperature and precipitation extremes in Europe analyzed for the period 1901–2000. J. Geophys. Res. Atmos. 2006, 111. [Google Scholar] [CrossRef] [Green Version]
- Plummer, N.; Salinger, M.J.; Nicholls, N.; Suppiah, R.; Hennessy, K.J.; Leighton, R.M.; Trewin, B.; Page, M.C.; Lough, J.M. Changes in climate extremes over the Australian region and New Zealand during the twentieth century. In Weather and Climate Extremes: Changes, Variations and a Perspective from the Insurance Industry; Karl, T.R., Nicholls, N., Ghazi, A., Eds.; Springer Netherlands: Dordrecht, The Netherlands, 1999; pp. 183–202. [Google Scholar]
- Vincent, L.A.; Peterson, T.C.; Barros, V.R.; Marino, M.B.; Rusticucci, M.; Carrasco, G.; Ramirez, E.; Alves, L.M.; Ambrizzi, T.; Berlato, M.A.; et al. Observed trends in indices of daily temperature extremes in South America 1960–2000. J. Clim. 2005, 18, 5011–5023. [Google Scholar] [CrossRef]
- Vincent, L.A.; Mekis, E. Changes in daily and extreme temperature and precipitation indices for Canada over the twentieth century. Atmosphere-Ocean 2006, 44, 177–193. [Google Scholar] [CrossRef]
- Manton, M.J.; Della-Marta, P.M.; Haylock, M.R.; Hennessy, K.J.; Nicholls, N.; Chambers, L.E.; Collins, D.A.; Daw, G.; Finet, A.; Gunawan, D.; et al. Trends in extreme daily rainfall and temperature in Southeast Asia and the South Pacific: 1961–1998. Int. J. Clin. Climatol. 2001, 21, 269–284. [Google Scholar] [CrossRef]
- Singh, D.; Jain, S.K.; Gupta, R.D. Analysis of Extreme Precipitation Indices over Sutlej Basin, N-W Himalayan Region, India. In Proceedings of National Conference on Recent Advancements and Innovations in Civil Engineering (RAICE-2014), Technocrat Institute of Technology, Bhopal, India, 27–29 June 2014; pp. 137–142.
- Panda, D.K.; Mishra, A.; Kumar, A.; Mandal, K.G.; Thakur, A.K.; Srivastava, R.C. Spatiotemporal patterns in the mean and extreme temperature indices of India, 1971–2005. Int. J. Clin. Climatol. 2014, 34, 3585–3603. [Google Scholar] [CrossRef]
- Subash, N.; Sikka, A.K. Trend analysis of rainfall and temperature and its relationship over India. Theor. Appl. Climatol. 2014, 117, 449–462. [Google Scholar] [CrossRef]
- Sen Roy, S.; Balling, R.C. Trends in extreme daily precipitation indices in India. Int. J. Clin. Climatol. 2004, 24, 457–466. [Google Scholar] [CrossRef]
- Goswami, B.N.; Venugopal, V.; Sengupta, D.; Madhusoodanan, M.S.; Xavier, P.K. Increasing trend of extreme rain events over India in a warming environment. Science 2006, 314, 1442–1445. [Google Scholar] [CrossRef] [PubMed]
- Guhathakurta, P.; Sreejith, O.P.; Menon, P.A. Impact of climate change on extreme rainfall events and flood risk in India. J. Earth Syst. Sci. 2011, 120, 359–373. [Google Scholar] [CrossRef]
- Joshi, S.; Kumar, K.; Joshi, V.; Pande, B. Rainfall variability and indices of extreme rainfall analysis and perception study for two stations over Central Himalaya, India. Nat. Hazards 2014, 72, 361–374. [Google Scholar] [CrossRef]
- Bhutiyani, M.R.; Kale, V.S.; Pawar, N.J. Long term trends in maximum, minimum and mean annual temperatures across the northwestern Himalaya during the twentieth century. Clim. Change 2007, 85, 159–177. [Google Scholar] [CrossRef]
- Revadekar, J.V.; Kulkarni, A. The El Nino-Southern Oscillation and winter precipitation extremes over India. Int. J. Clin. Climatol. 2008, 28, 1445–1452. [Google Scholar] [CrossRef]
- You, Q.; Kang, S.; Aguilar, E.; Yan, Y. Changes in daily climate extremes in the eastern and central Tibetan Plateau during 1961–2005. J. Geophys. Res. 2008, 113. [Google Scholar] [CrossRef]
- Marofi, S.; Sohrabi, M.M.; Mohammadi, K.; Sabziparvar, A.A.; Abyaneh, H.Z. Investigation of meteorological extreme events over coastal regions of Iran. Theor. Appl. Climatol. 2013, 103, 401–412. [Google Scholar] [CrossRef]
- Singh, D.; Jain, S.K.; Gupta, R.D. Statistical Downscaling and Projection of Future Temperature and Precipitation Change in Middle Catchment of Sutlej River Basin, India. J. Earth Syst. Sci. 2015, 124, 843–860. [Google Scholar] [CrossRef]
- RClimDex User Manual. Available online: http://etccdi.pacificclimate.org/software.shtml (accessed on 14 April 2014).
- Hamed, K.H.; Rao, A.R. A modified Mann-Kendall test for auto-correlated data. J. Hydrol. 1998, 204, 182–196. [Google Scholar] [CrossRef]
- Sonali, P.; Kumar, N.D. Review of trend detection methods and their application to detect temperature changes in India. J. Hydrol. 2013, 476, 212–227. [Google Scholar] [CrossRef]
- Revadekar, J.V.; Patwardhan, S.K.; Rupa Kumar, K. Characteristic features of precipitation extremes over India in the warming scenarios. Adv. Meteorol. 2011, 12. [Google Scholar] [CrossRef]
© 2016 by the authors; licensee MDPI, Basel, Switzerland. This article is an open access article distributed under the terms and conditions of the Creative Commons by Attribution (CC-BY) license (http://creativecommons.org/licenses/by/4.0/).
Share and Cite
Singh, D.; Jain, S.K.; Gupta, R.D.; Kumar, S.; Rai, S.P.; Jain, N. Analyses of Observed and Anticipated Changes in Extreme Climate Events in the Northwest Himalaya. Climate 2016, 4, 9. https://doi.org/10.3390/cli4010009
Singh D, Jain SK, Gupta RD, Kumar S, Rai SP, Jain N. Analyses of Observed and Anticipated Changes in Extreme Climate Events in the Northwest Himalaya. Climate. 2016; 4(1):9. https://doi.org/10.3390/cli4010009
Chicago/Turabian StyleSingh, Dharmaveer, Sanjay Kumar Jain, Rajan Dev Gupta, Sudhir Kumar, Shive Prakash Rai, and Neha Jain. 2016. "Analyses of Observed and Anticipated Changes in Extreme Climate Events in the Northwest Himalaya" Climate 4, no. 1: 9. https://doi.org/10.3390/cli4010009