
Effects of Changes in ENSO on Seasonal Mean Temperature and Rainfall in Nigeria

Abstract
:1. Introduction
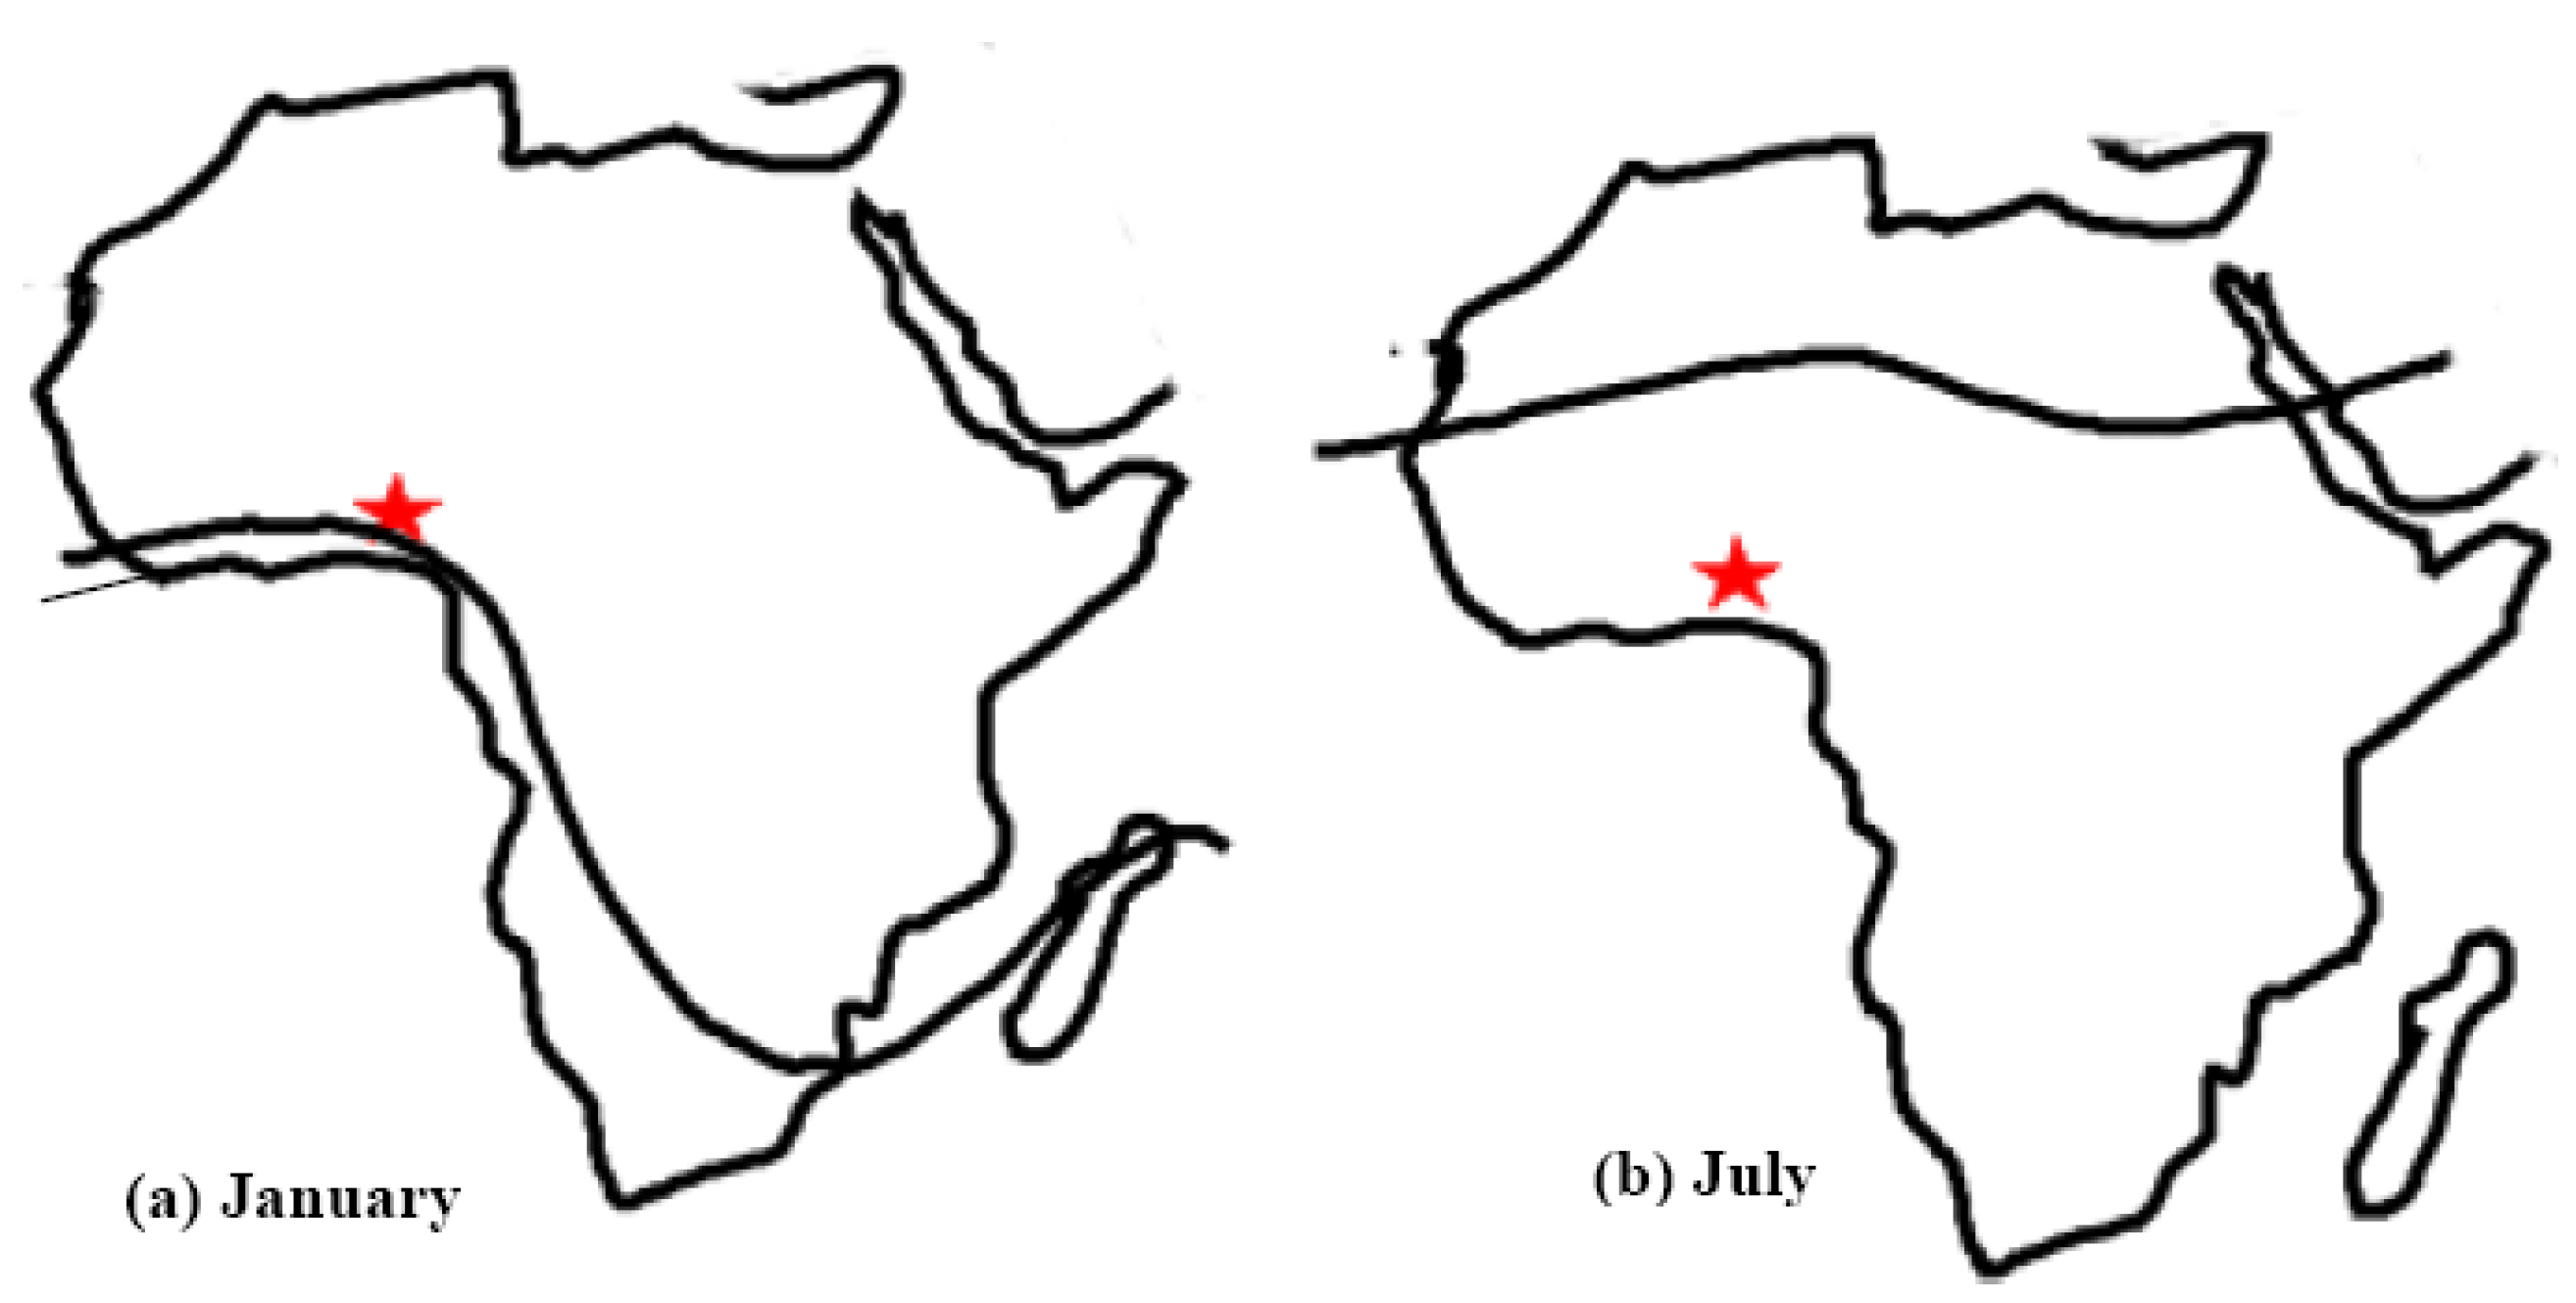
2. The Study Area

3. Data Description
4. Results
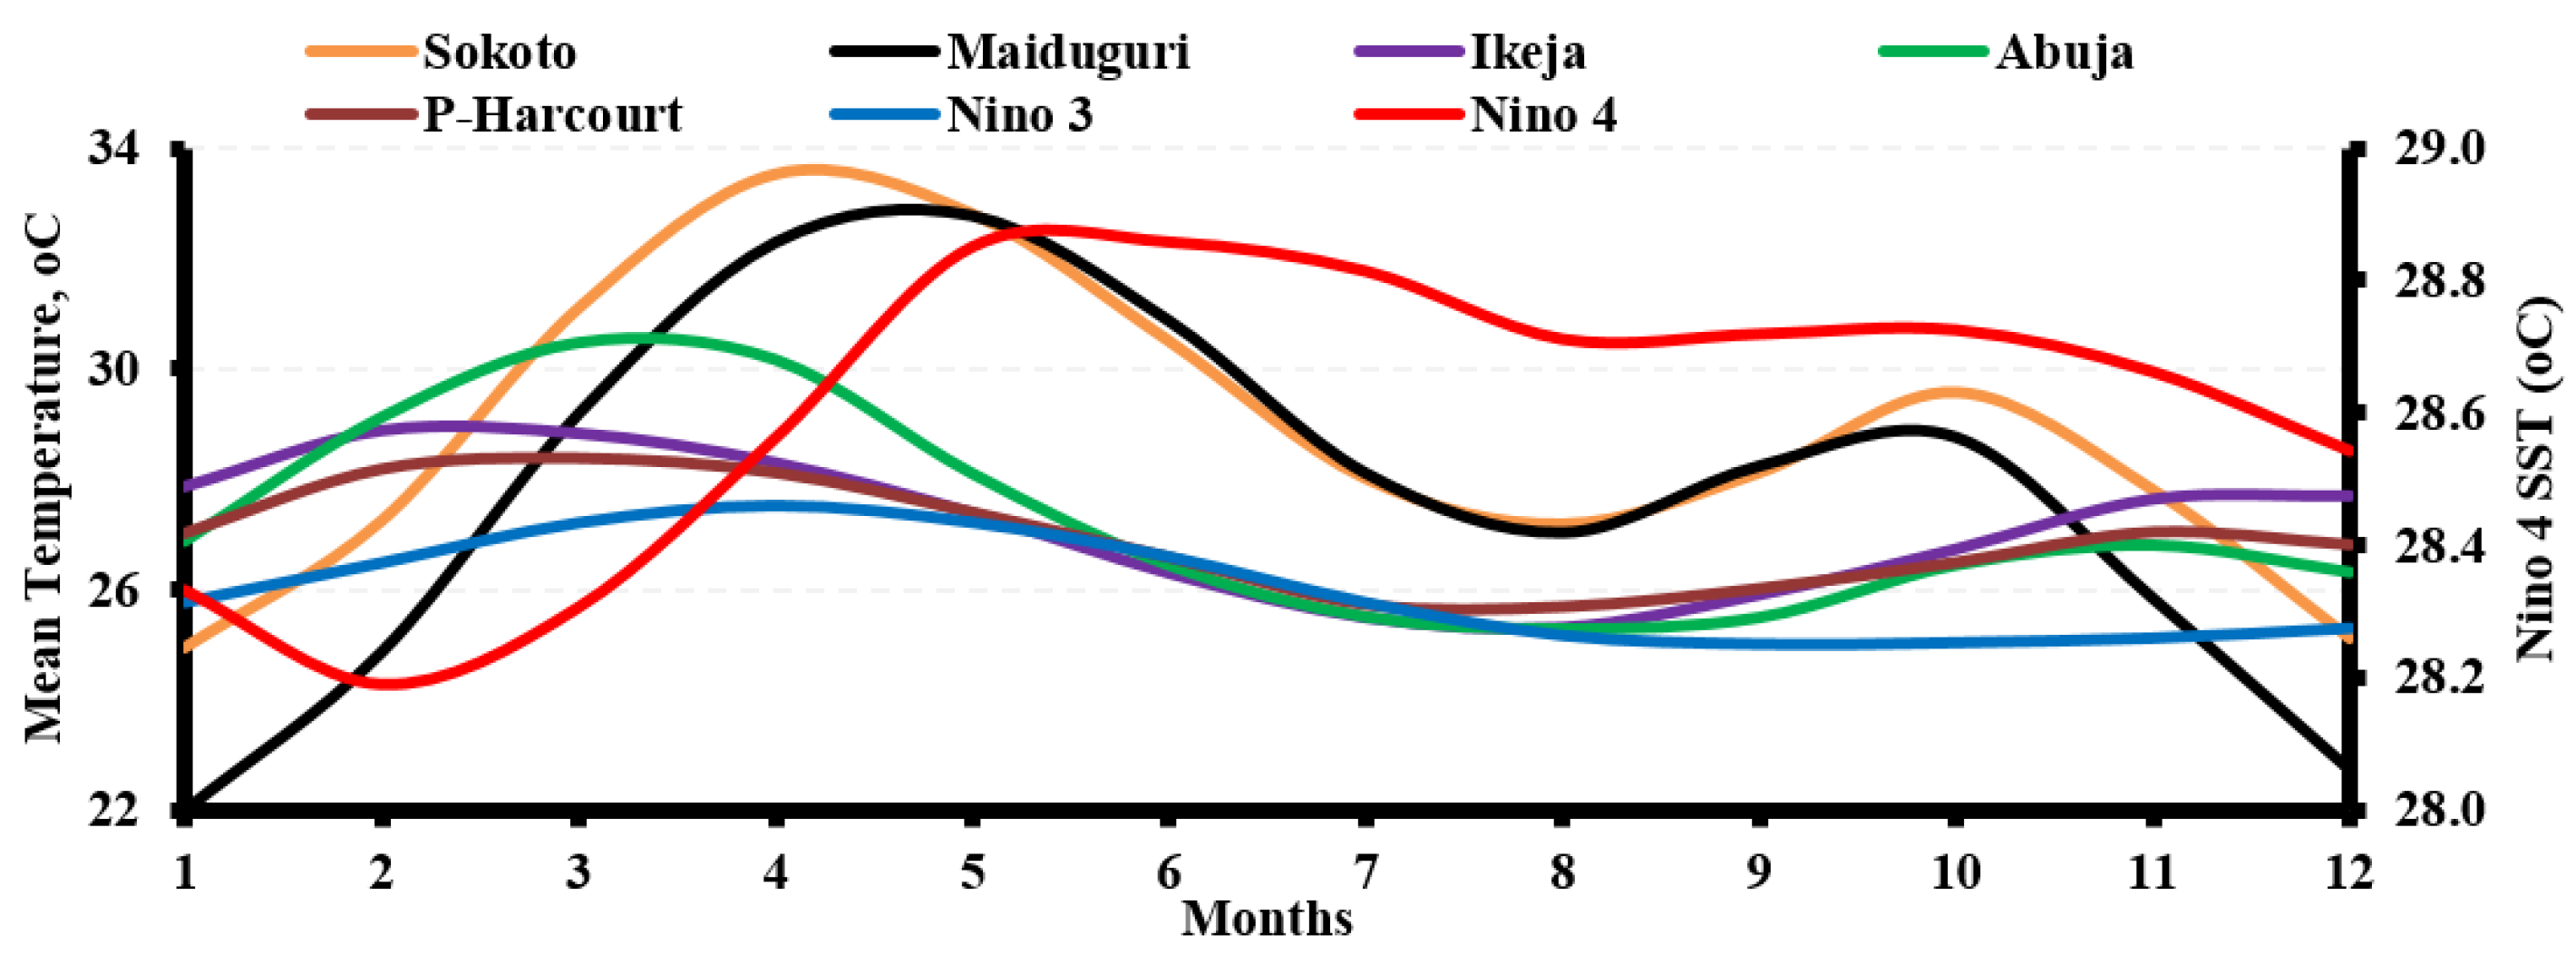
4.1. The Variations in the SST and Temperature

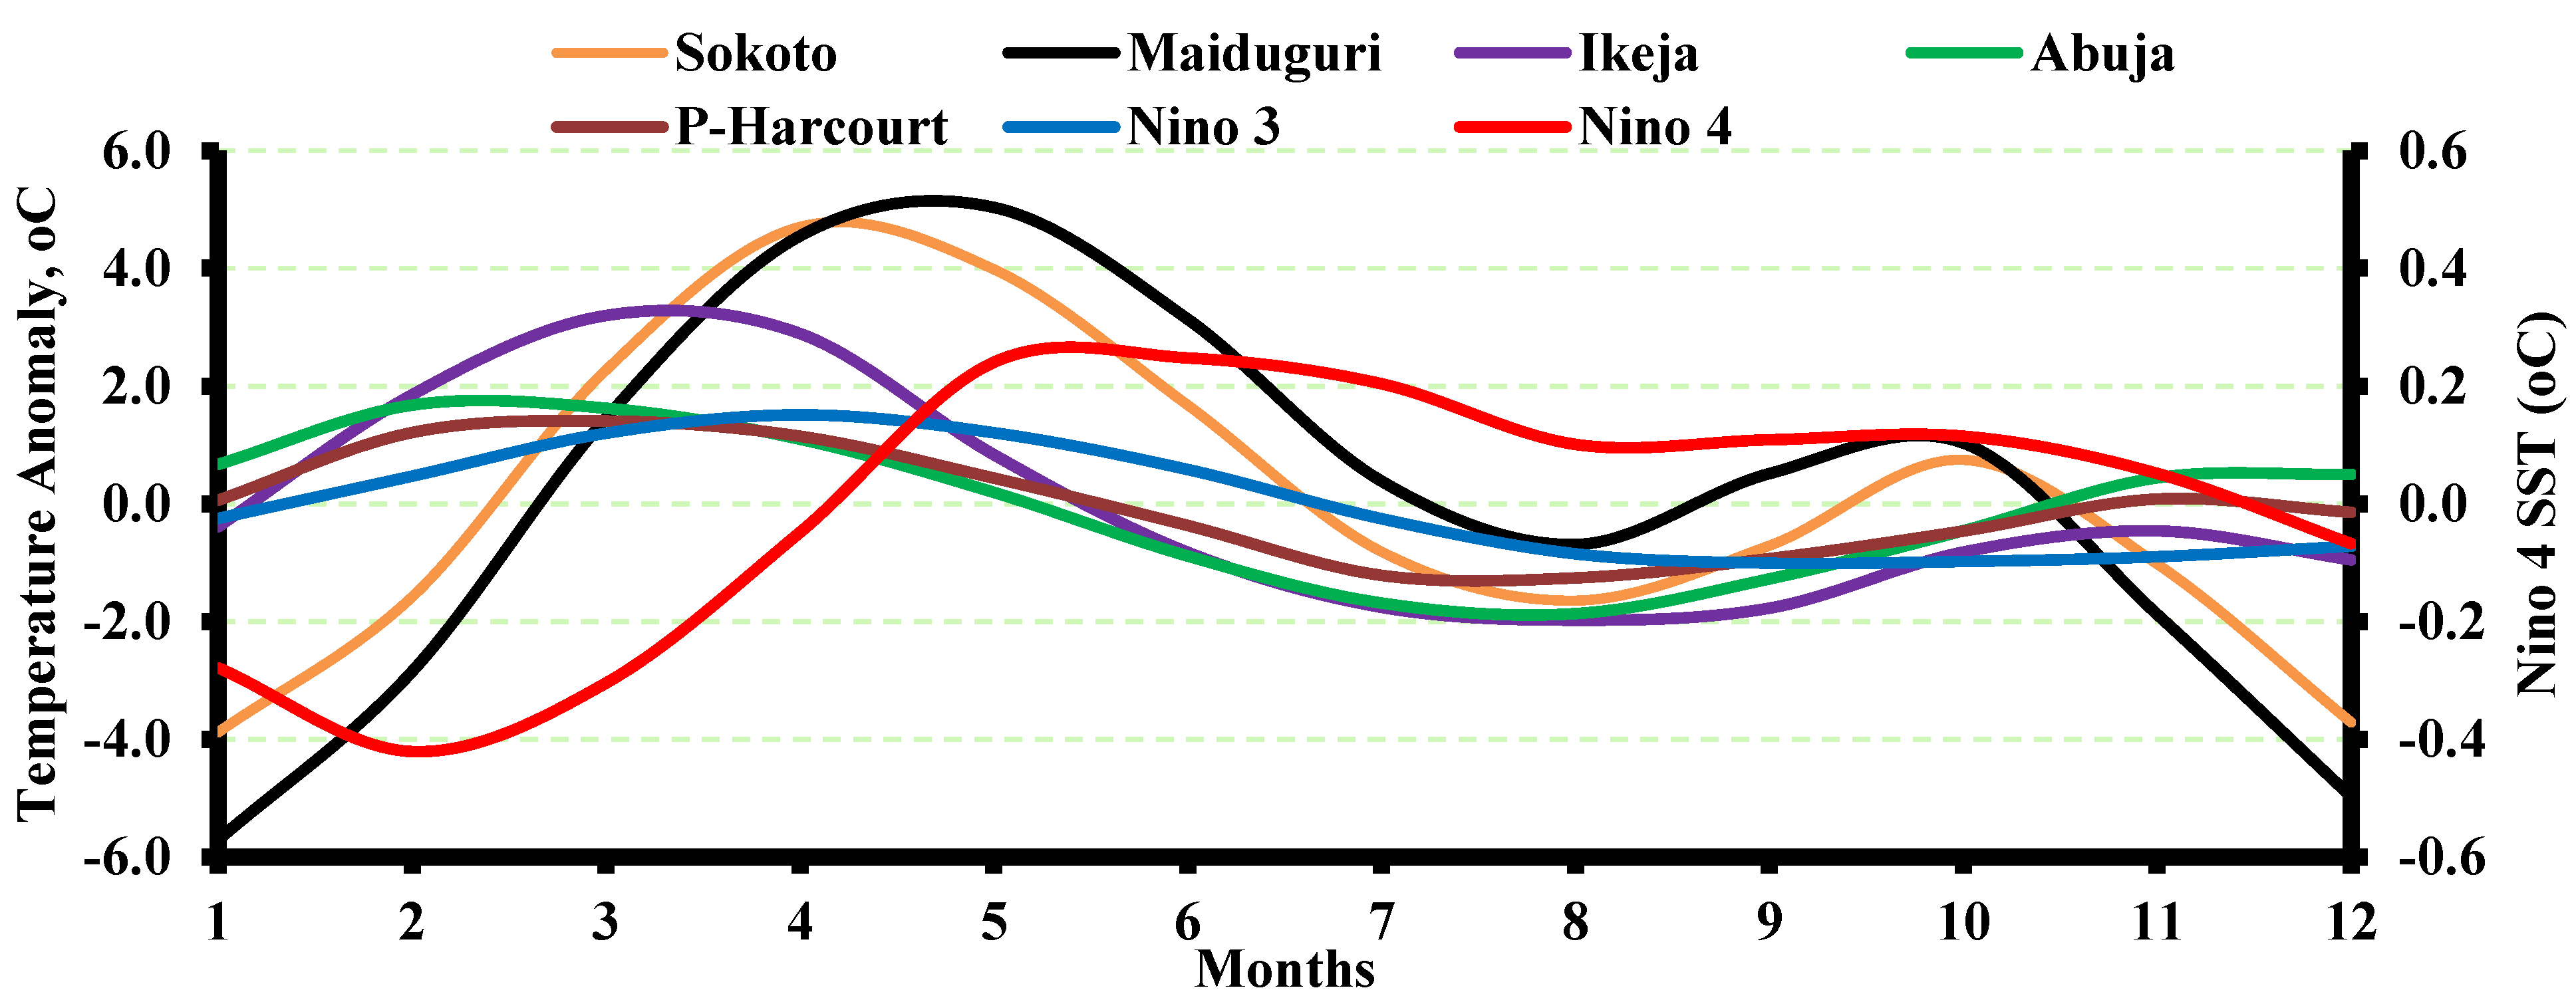
4.2. Comparisons of the Temperature and SST Anomalies

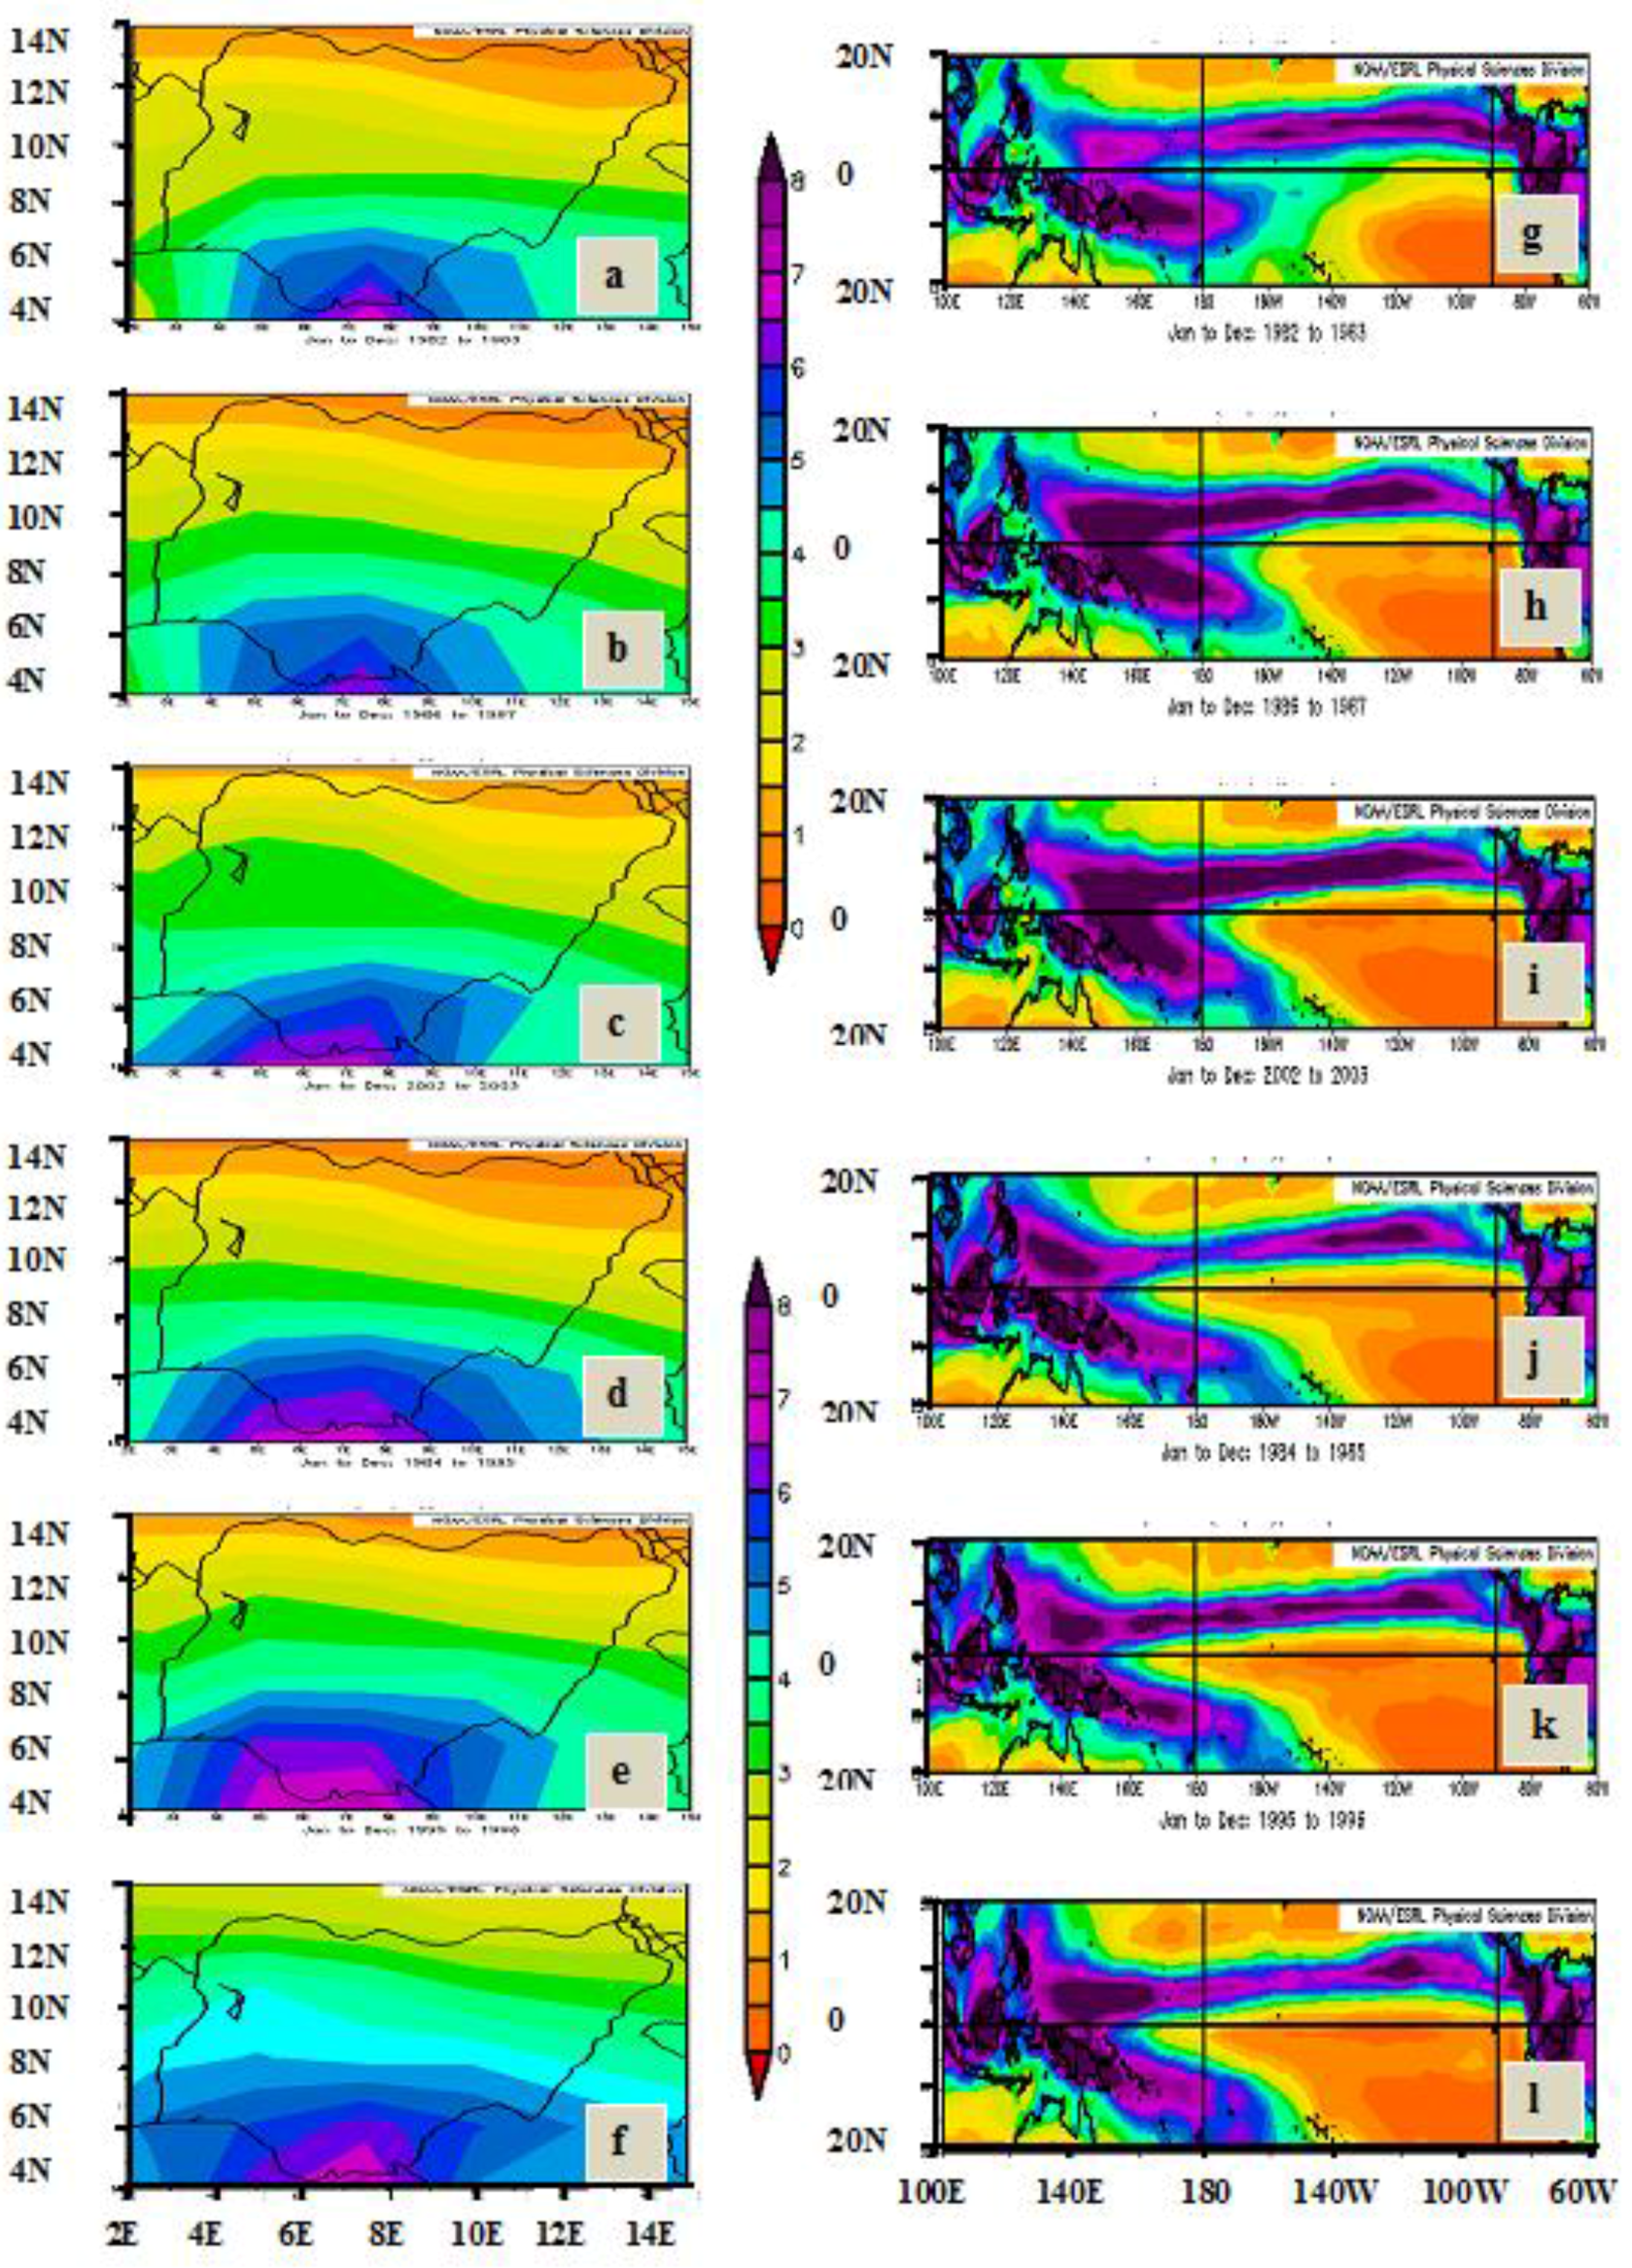
4.3. Comparison of the Results with ENSO Events

5. Discussion of the Results

6. Conclusions
Acknowledgments
Author Contributions
Conflicts of Interest
References
- Chavez, F.P.; Strutton, P.G.; Friederich, G.E.; Feely, R.A.; Feldman, G.C.; Foley, D.G.; McPhaden, M.J. Biological and chemical response of the Equatorial Pacific Ocean to the 1997–98 El Niño. Science 1999, 286, 2126–2131. [Google Scholar] [CrossRef] [PubMed]
- McPhaden, M.J.; Busalacchi, A.J.; Cheney, R.; Donguy, J.R.; Gage, K.S.; Halpern, D.; Ji, M.; Julian, P.; Meyers, G.; Mitchum, G.T.; et al. The tropical Ocean Global Atmosphere observing system: A decade of progress. J. Geophys. Res. 1998, 103, 14169–14240. [Google Scholar] [CrossRef]
- Salau, O.R.; Schneider, B.; Park, W.; Khon, V.; Latif, M. Modeling the ENSO impact of orbitally induced mean state climate changes. J. Geophys. Res. 2012, 117. [Google Scholar] [CrossRef] [Green Version]
- Collins, M.; An, S.-I.; Cai, W.; Ganachaud, A.; Guilyardi, E.; Jin, F.-F.; Jochum, M.; Lengaigne, M.; Power, S.; Timmermann, A.; et al. The impact of global warming on the tropical Pacific Ocean and El Niño. Nat. Geosci. 2010, 3, 391–397. [Google Scholar] [CrossRef]
- Latif, M.; Keenlyside, N.S. El Niño/Southern Oscillation response to global warming. Proc. Natl. Acad. Sci. USA 2009, 106, 20578–20583. [Google Scholar] [CrossRef] [PubMed] [Green Version]
- Philander, S.G.H. El Niño, La Niña, and the Southern Oscillation; Academic Publishing: London, UK, 1990. [Google Scholar]
- Neelin, J.D.; Battisti, D.S.; Hirst, A.C.; Jin, F.F.; Wakata, Y.; Yamagata, T.; Zebiak, S.E. ENSO theory. J. Geophys. Res. Oceans 1998, 103, 14261–14290. [Google Scholar] [CrossRef]
- Wang, C.; Picaut, J. Understanding ENSO physics—A review. In Earth’s Climate: The Ocean-Atmosphere Interaction; AGU: Washington, DC, USA, 2004; pp. 21–48. [Google Scholar]
- Eckert, C.; Latif, M. Predictability of a stochastically forced hybrid coupled model of El Niño. J. Clim. 1997, 10, 1488–1504. [Google Scholar] [CrossRef]
- Fedorov, A.V.; Philander, S.G. Is El Niño changing? Science 2000, 288, 1997–2002. [Google Scholar] [CrossRef] [PubMed]
- Salau, O.R. El Niño, Southern Oscillation during the Holocene and Eemian Warm Periods. Ph.D. Thesis, University of Kiel, Kiel, Germany, 2012. [Google Scholar]
- Phillips, J.; McIntyre, B. ENSO and Interannual rainfall Variability in Uganda: Implications for Agricultural Management. Int. J. Climatol. 2000, 20, 171–182. [Google Scholar] [CrossRef]
- Worldwide Index, Federal Republic of Nigeria (NG). 2010. Available online: www.tageo.com/index-e-ni-cities-NG.htm (accessed on 28 August 2015).
- Eroarome Martin Aregheore (2015), Nigeria, Section 3—Climate and Agro-Ecological Zones Climate. Available online: www.fao.org/ag/agp/agpc/doc/counprof/nigeria/nigeria.htm (accessed on 17 November 2014).
- Adelana, M.; Olasehinde, P.I.; Bale, R.B.; Vrbka, P.; Goni, I.B.; Edet, A.E. An overview of the geology and hydrogeology of Nigeria. In Applied Groundwater Studies in Africa; Taylor & Francis: London, UK, 2014; pp. 171–197. [Google Scholar]
- Okeke, F.N.; Marengo, J.A.; Nobre, C. Investigation of El Niño and La Niña effects and the impact of Atlantic sea surface temperatures (SSTs), on precipitation in Nigeria from 1950 to 1992. Surv. Geophys. 2006, 27, 545–555. [Google Scholar] [CrossRef]
- Olori, T. Environment-Nigeria: El Nino Sets its Sights on Nigeria’s Farms, Inter Press Service, IPS. 2015. Available online: www.ipsnews.net/1997/12/environment-nigeria-el-nino-sets-its-sights-on-nigerias-farms/ (accessed on 28 August 2015).
- Trenberth, K.E. The definition of El Niño. Bull. Am. Meteorol. Soc. 1997, 78, 2771–2777. [Google Scholar] [CrossRef]
- McPhaden, M.J. Genesis and Evolution of the 1997–98 El Niño. Science 1999, 283, 950–954. [Google Scholar] [CrossRef] [PubMed]
- Historical El Niño/ La Niña episodes (1950-present), NOAA’s Climate, Prediction Center. 2015. Available online: www.cpc.ncep.noaa.gov/products/analysis_monitoring/ensost (accessed on 10 December 2015).
- La Niña Information. 2015. Available online: www.publicaffairs.noaa.gov/lanina.html (accessed on 31 July 2015).
- Cold and Warm Episodes by Season. 2015. Available online: http://www.cpc.noaa.gov/products/analysis_monitoring/ensostuff/ensoyears.shtm (accessed on 20 August 2015).
- Adler, R.F.; Huffman, G.J.; Chang, A.; Ferraro, R.; Xie, P.; Janowiak, J.; Rudolf, B.; Schneider, U.; Curtis, S.; Bolvin, D.; et al. The Version 2 Global Precipitation Climatology Project (GPCP) monthly precipitation analysis (1979–present). J. Hydrometeor. 2003, 4, 1147–1167. [Google Scholar] [CrossRef]
- Climate Prediction Center. ENSO FAQ: How Often Do El Niño and La Niña Typically Occur? National Centers for Environmental Prediction. Available online: www.cpc.noaa.gov/products/analysis_monitoring/ensostuff/ensofaq.shtml#HOWOFTEN (accessed on 10 August 2015).
- Okonkwo, G.N.; Nwokoye, A.O.C. Estimating global solar radiation from temperature data in minna location. Eur. Sci. J. 2014, 10, 255–264. [Google Scholar]
- Ododo, J.C. New models for the prediction of solar radiation in Nigeria. In Proceedings of the 2nd OAU/STRC Conference on New, Renewable and Solar Energies, Bamako, Mali, 16–20 May 1994.
© 2016 by the authors; licensee MDPI, Basel, Switzerland. This article is an open access article distributed under the terms and conditions of the Creative Commons by Attribution (CC-BY) license (http://creativecommons.org/licenses/by/4.0/).
Share and Cite
Salau, O.R.; Fasuba, A.; Aduloju, K.A.; Adesakin, G.E.; Fatigun, A.T. Effects of Changes in ENSO on Seasonal Mean Temperature and Rainfall in Nigeria. Climate 2016, 4, 5. https://doi.org/10.3390/cli4010005
Salau OR, Fasuba A, Aduloju KA, Adesakin GE, Fatigun AT. Effects of Changes in ENSO on Seasonal Mean Temperature and Rainfall in Nigeria. Climate. 2016; 4(1):5. https://doi.org/10.3390/cli4010005
Chicago/Turabian StyleSalau, Opeyemi R., Ayodele Fasuba, Kelvin A. Aduloju, Gbenga E. Adesakin, and Adetona T. Fatigun. 2016. "Effects of Changes in ENSO on Seasonal Mean Temperature and Rainfall in Nigeria" Climate 4, no. 1: 5. https://doi.org/10.3390/cli4010005