5.1. Aerosol Optical Depths: Ground-Based Sun Photometer, Microtops and AERONET
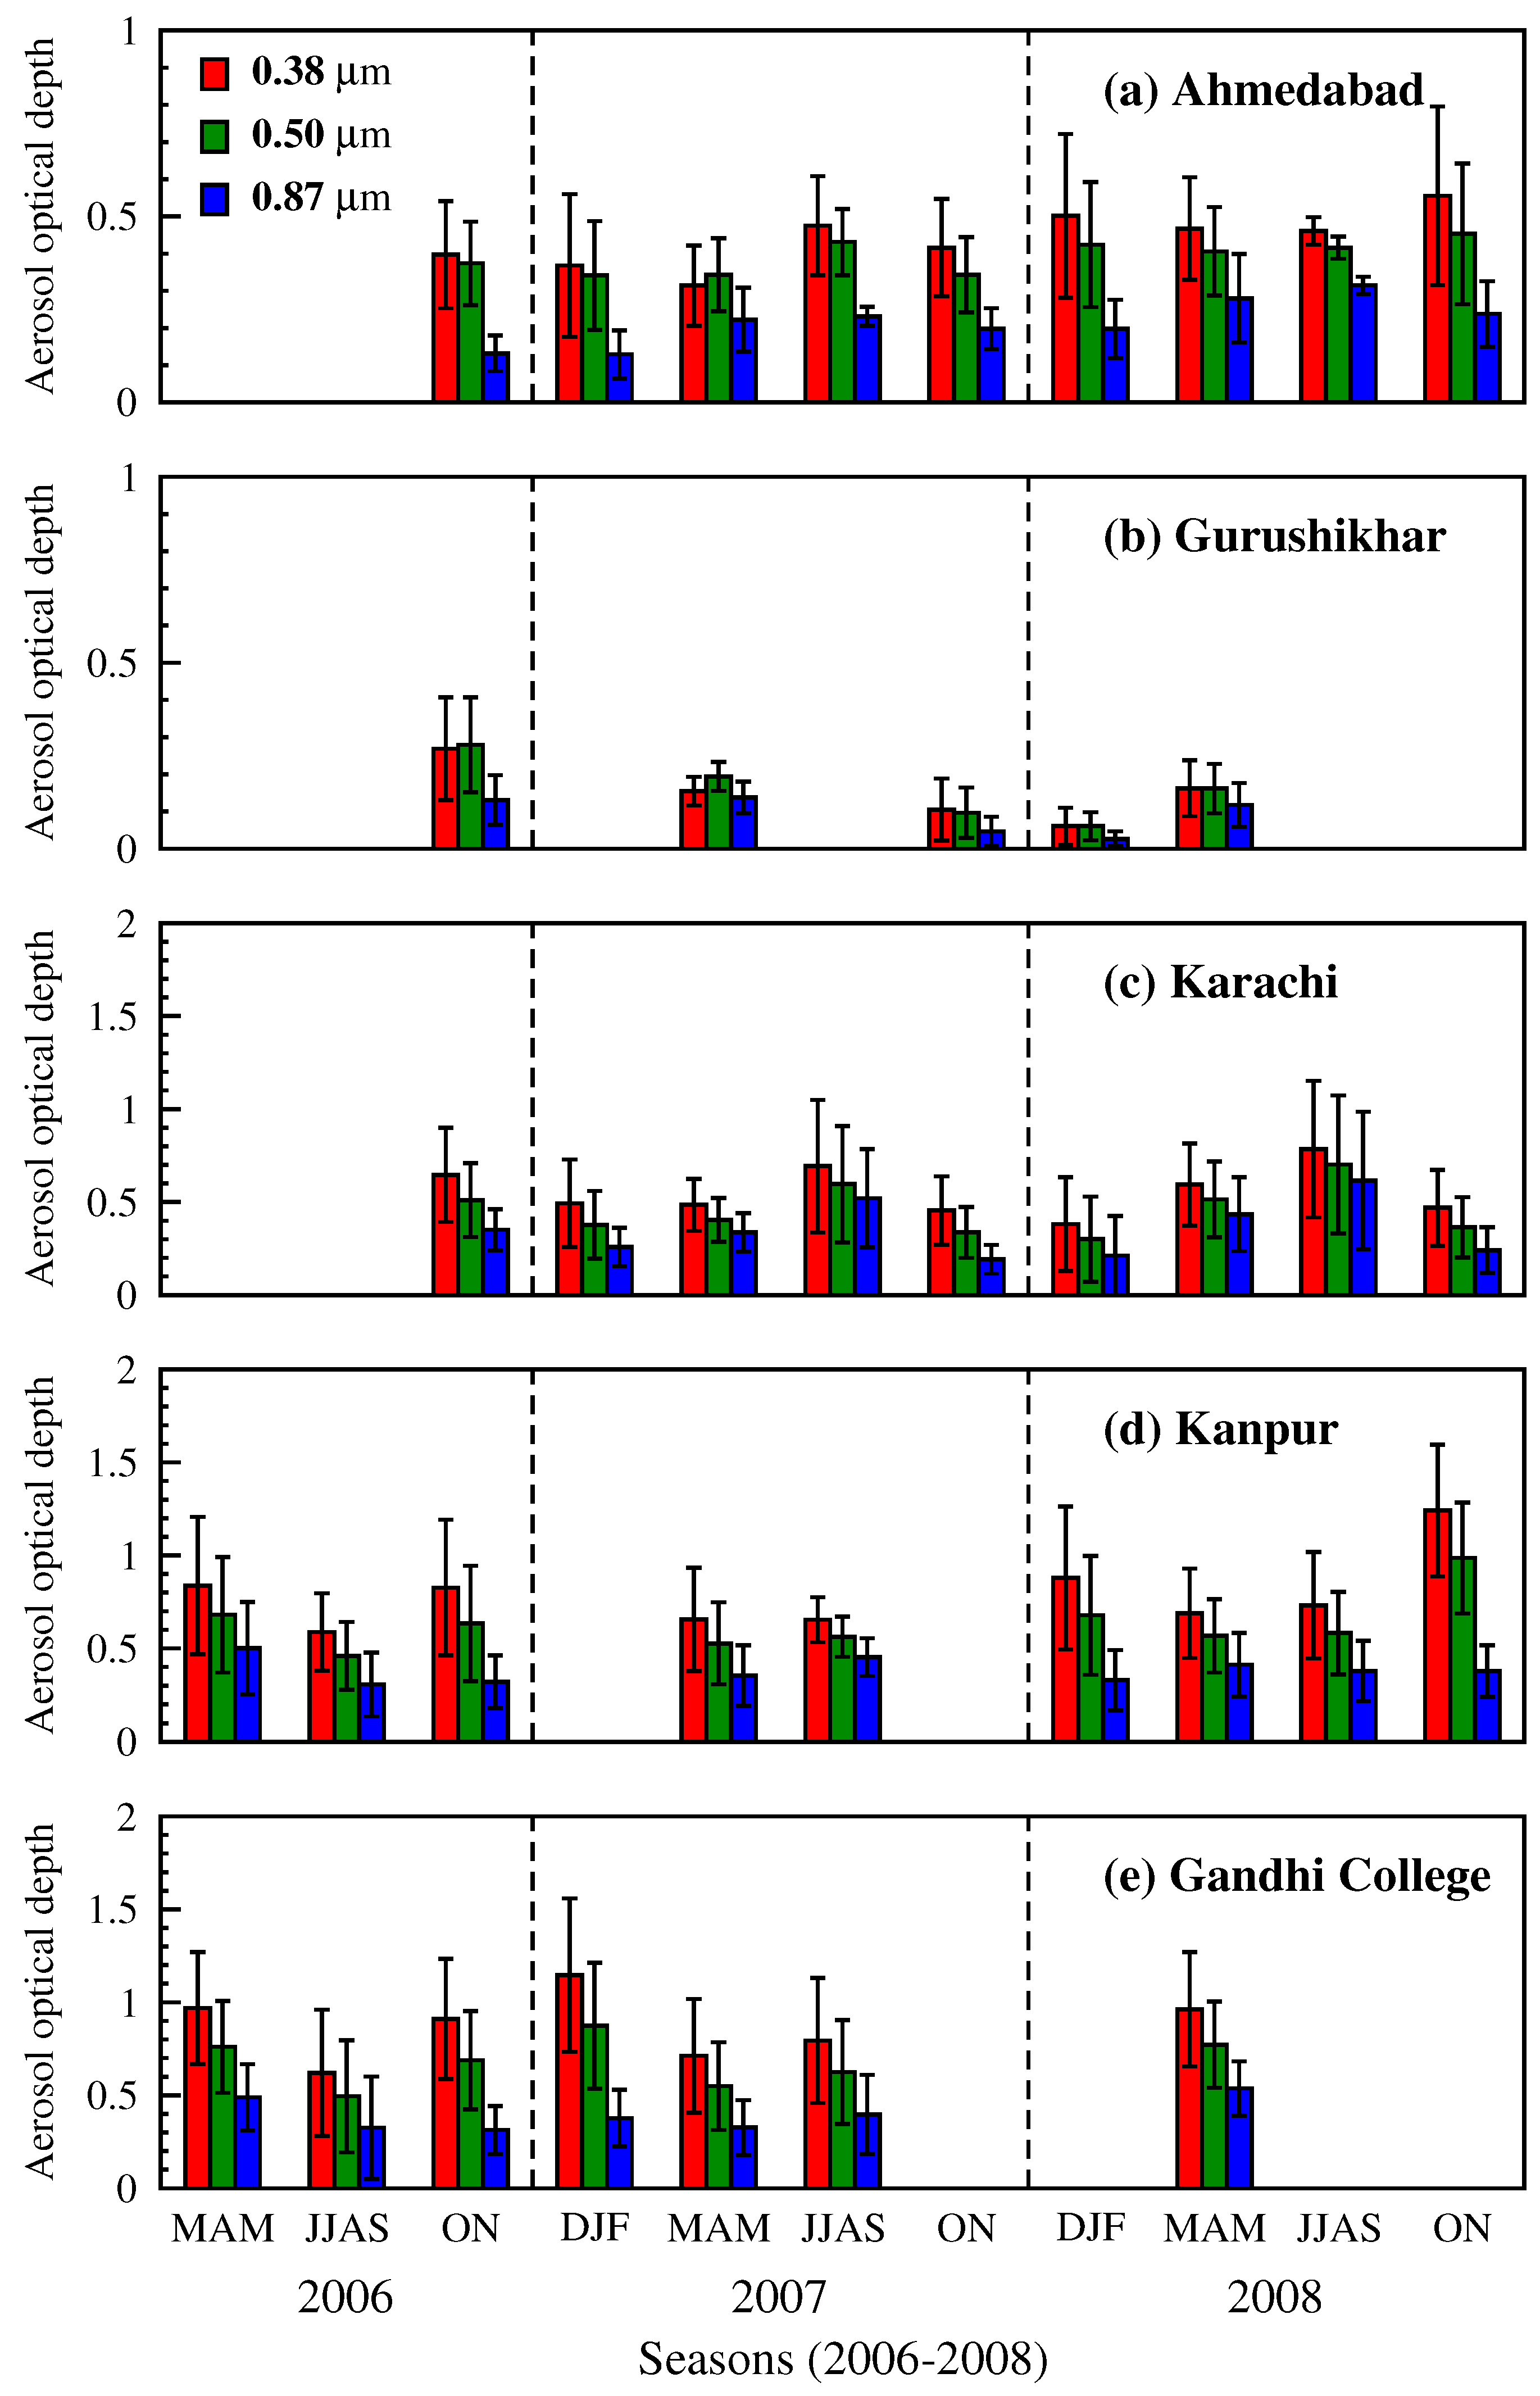
Seasonal mean AODs measured at 0.38, 0.50 and 0.87 μm using hand held sun photometer, Microtops sun photometer, AERONET sun/sky radiometers during 2006–2008 are shown over the five study locations (
Figure 7). The 0.38, 0.50 μm AODs represent the short wavelength region and are expected to be dominated by fine mode particles, while 0.87 μm AODs represent the long wavelength region and will be influenced by coarse mode particles. At the outset, AODs exhibit strong seasonal and wavelength dependence. AODs during winter and premonsoon are lower than that of monsoon season. AODs decrease gradually as wavelength increases (
Figure 7); the gradient in AODs is steeper in Kanpur and Gandhi College. 0.38 and 0.50 μm AODs are higher than that of 0.87 μm AODs during the entire study period (
Figure 7) at all the locations except Gurushikhar. AODs in Ahmedabad are about a factor of two higher than Gurushikhar. AODs in the Indo-Gangetic Plain are higher than that of Ahmedabad, while Karachi AODs are comparable. Higher AODs at lower wavelengths indicate the abundance of smaller size particles. During postmonsoon and winter the boundary layer is shallow and holds the pollutants in a smaller volume near the Earth’s surface when compared to summer. Over the Indian subcontinent the dust activity is found to peak in the spring (March-May) which decreases in summer with the onset of southwest monsoon [
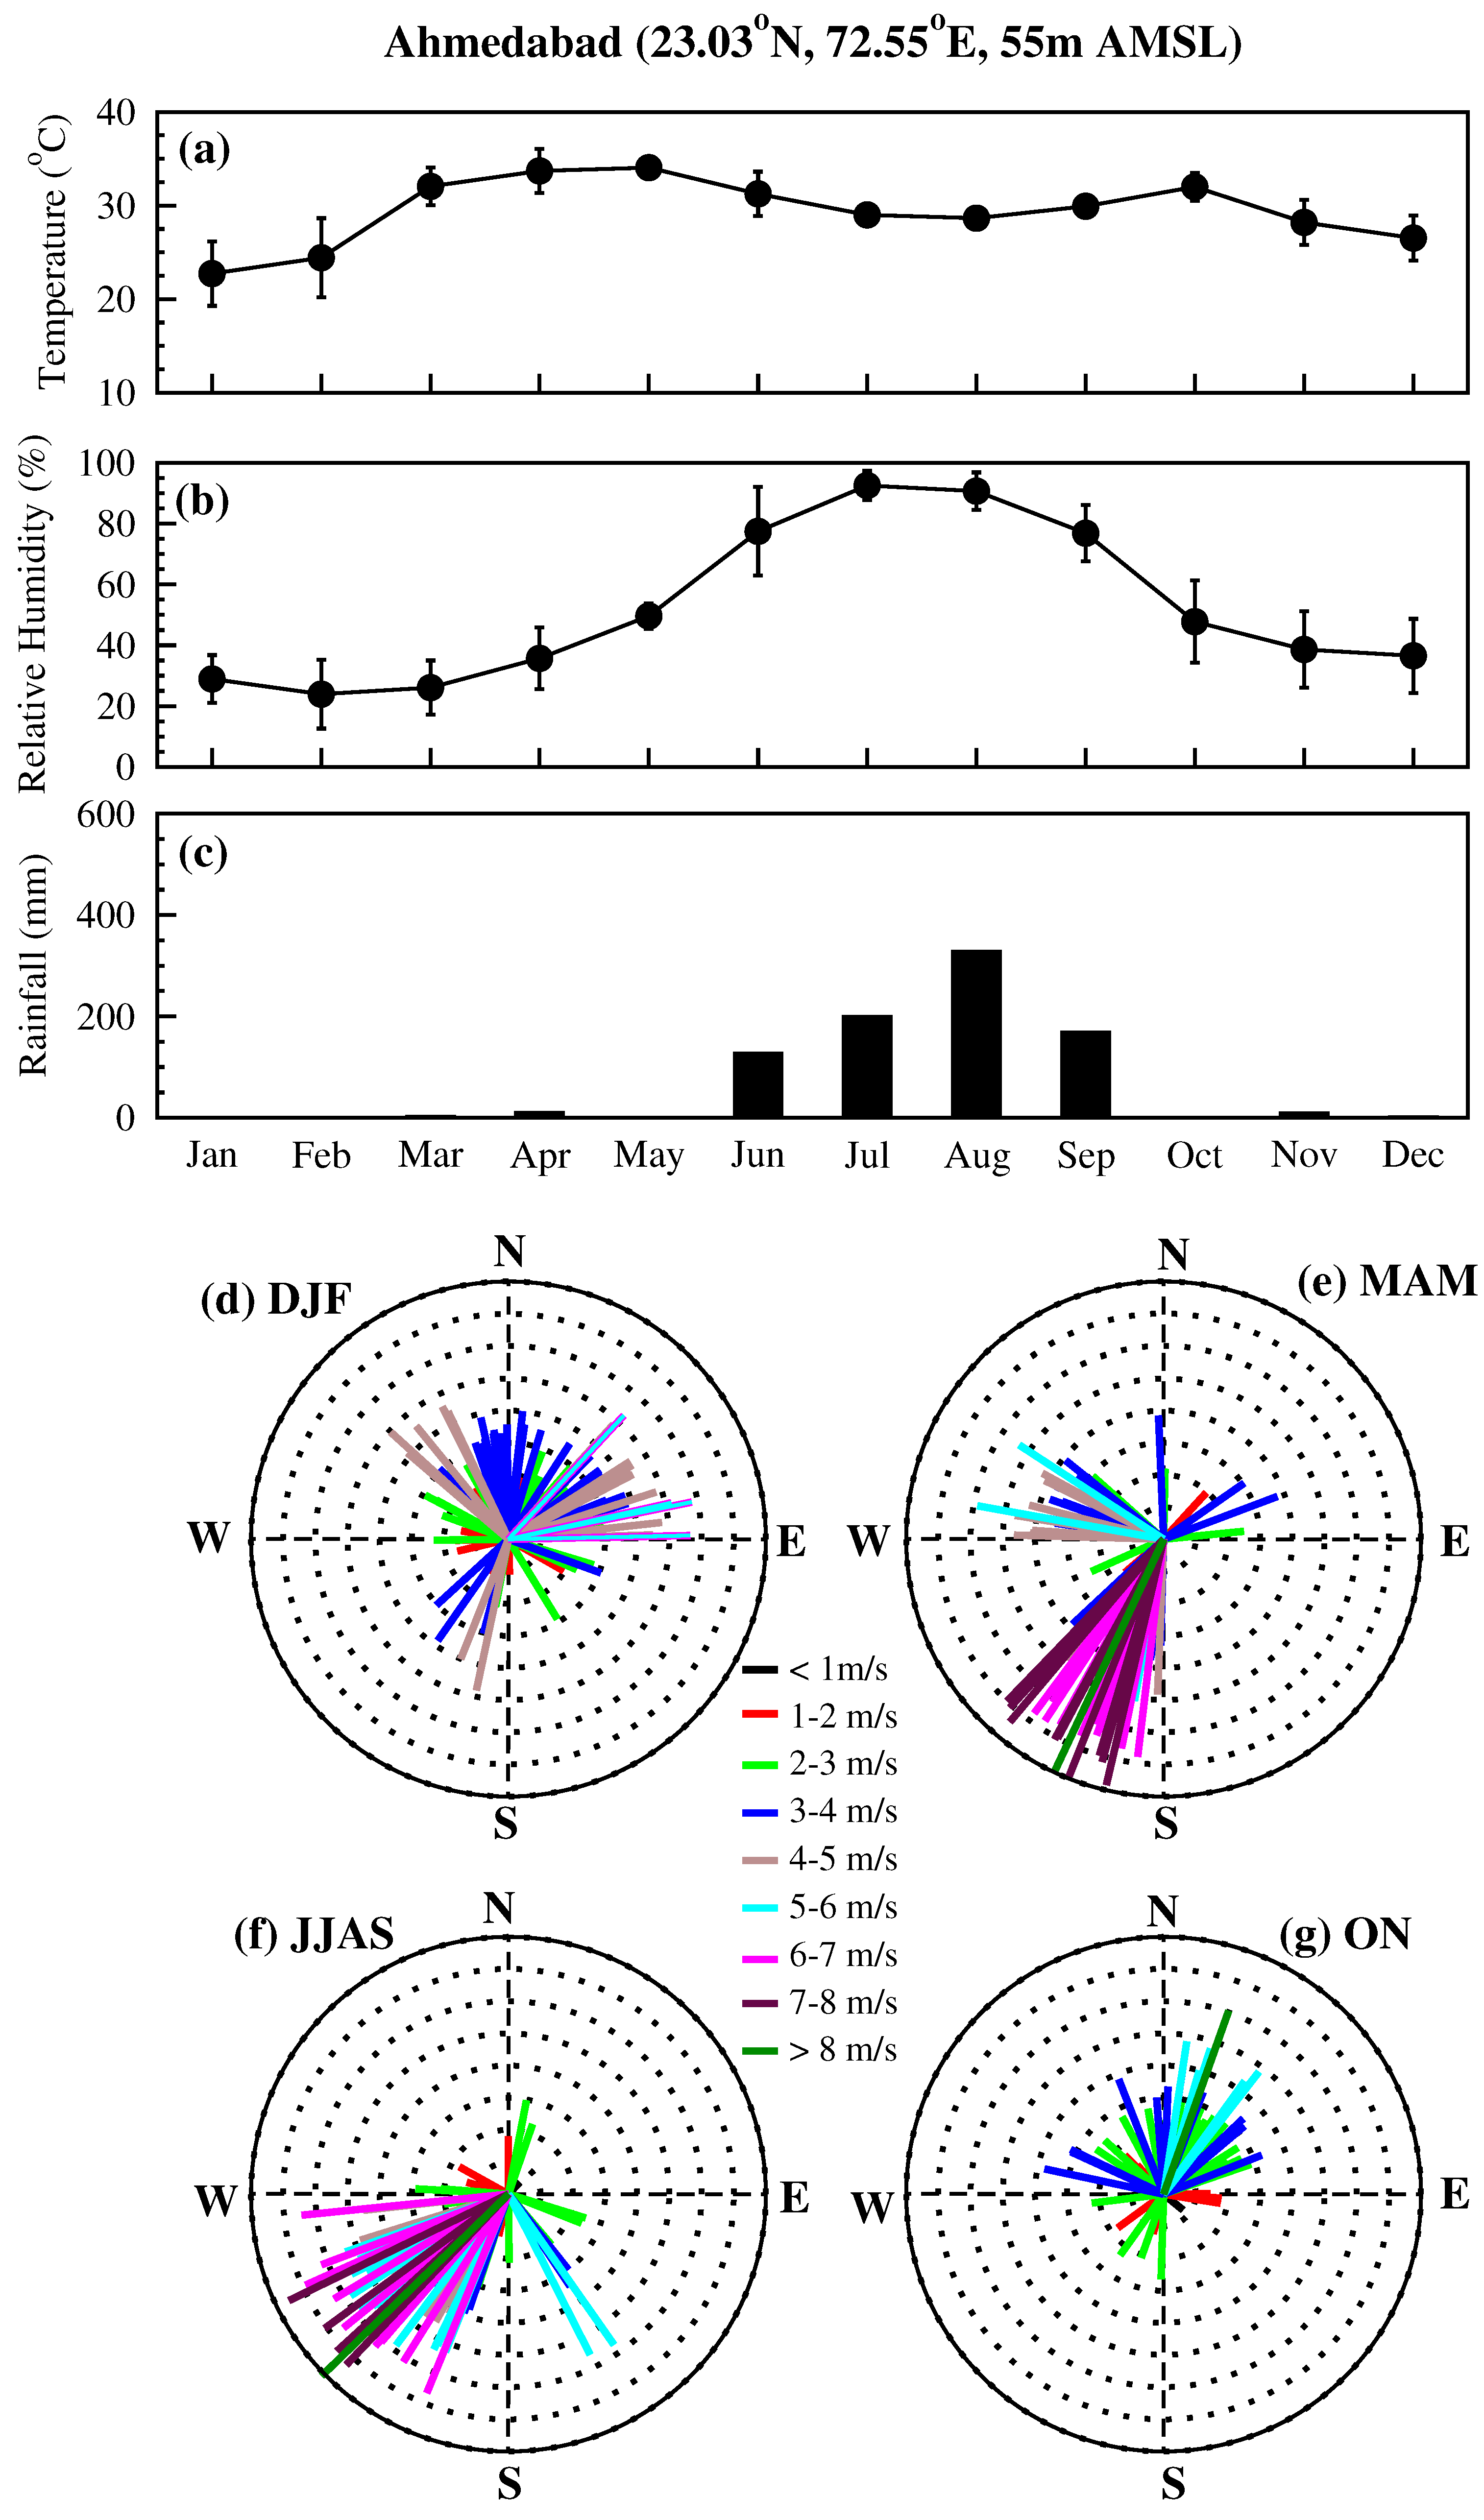
36]. The increase in dust activity accompanied with southwesterly winds contributes to the increase in AODs during premonsoon over Ahmedabad (
Figure 7(a)). Wet deposition by precipitation or wet removal is one of the main mechanisms for removal of aerosols from the atmosphere. Though wet removal is most effective in reducing the near surface aerosol concentration, it has been shown that AOD increases significantly when RH increases mainly due to the hygroscopic growth of water soluble aerosols [
37]. This increase in AOD due to the hygroscopic growth was found to overwhelm the removal of aerosols and addition of sea salt aerosols in the atmosphere during summer monsoon.
Figure 7.
Seasonal mean aerosol optical depths at 0.38, 0.50 and 0.87 μm during 2006–2008 over (a) Ahmedabad; (b) Gurushikhar; (c) Karachi; (d) Kanpur and (e) Gandhi College. Gaps in the figure denote the absence or non availability of sun photometer, Microtops and AERONET sun/sky radiometer aerosol optical depth data. Vertical bars indicate ±1σ deviation from the seasonal mean.
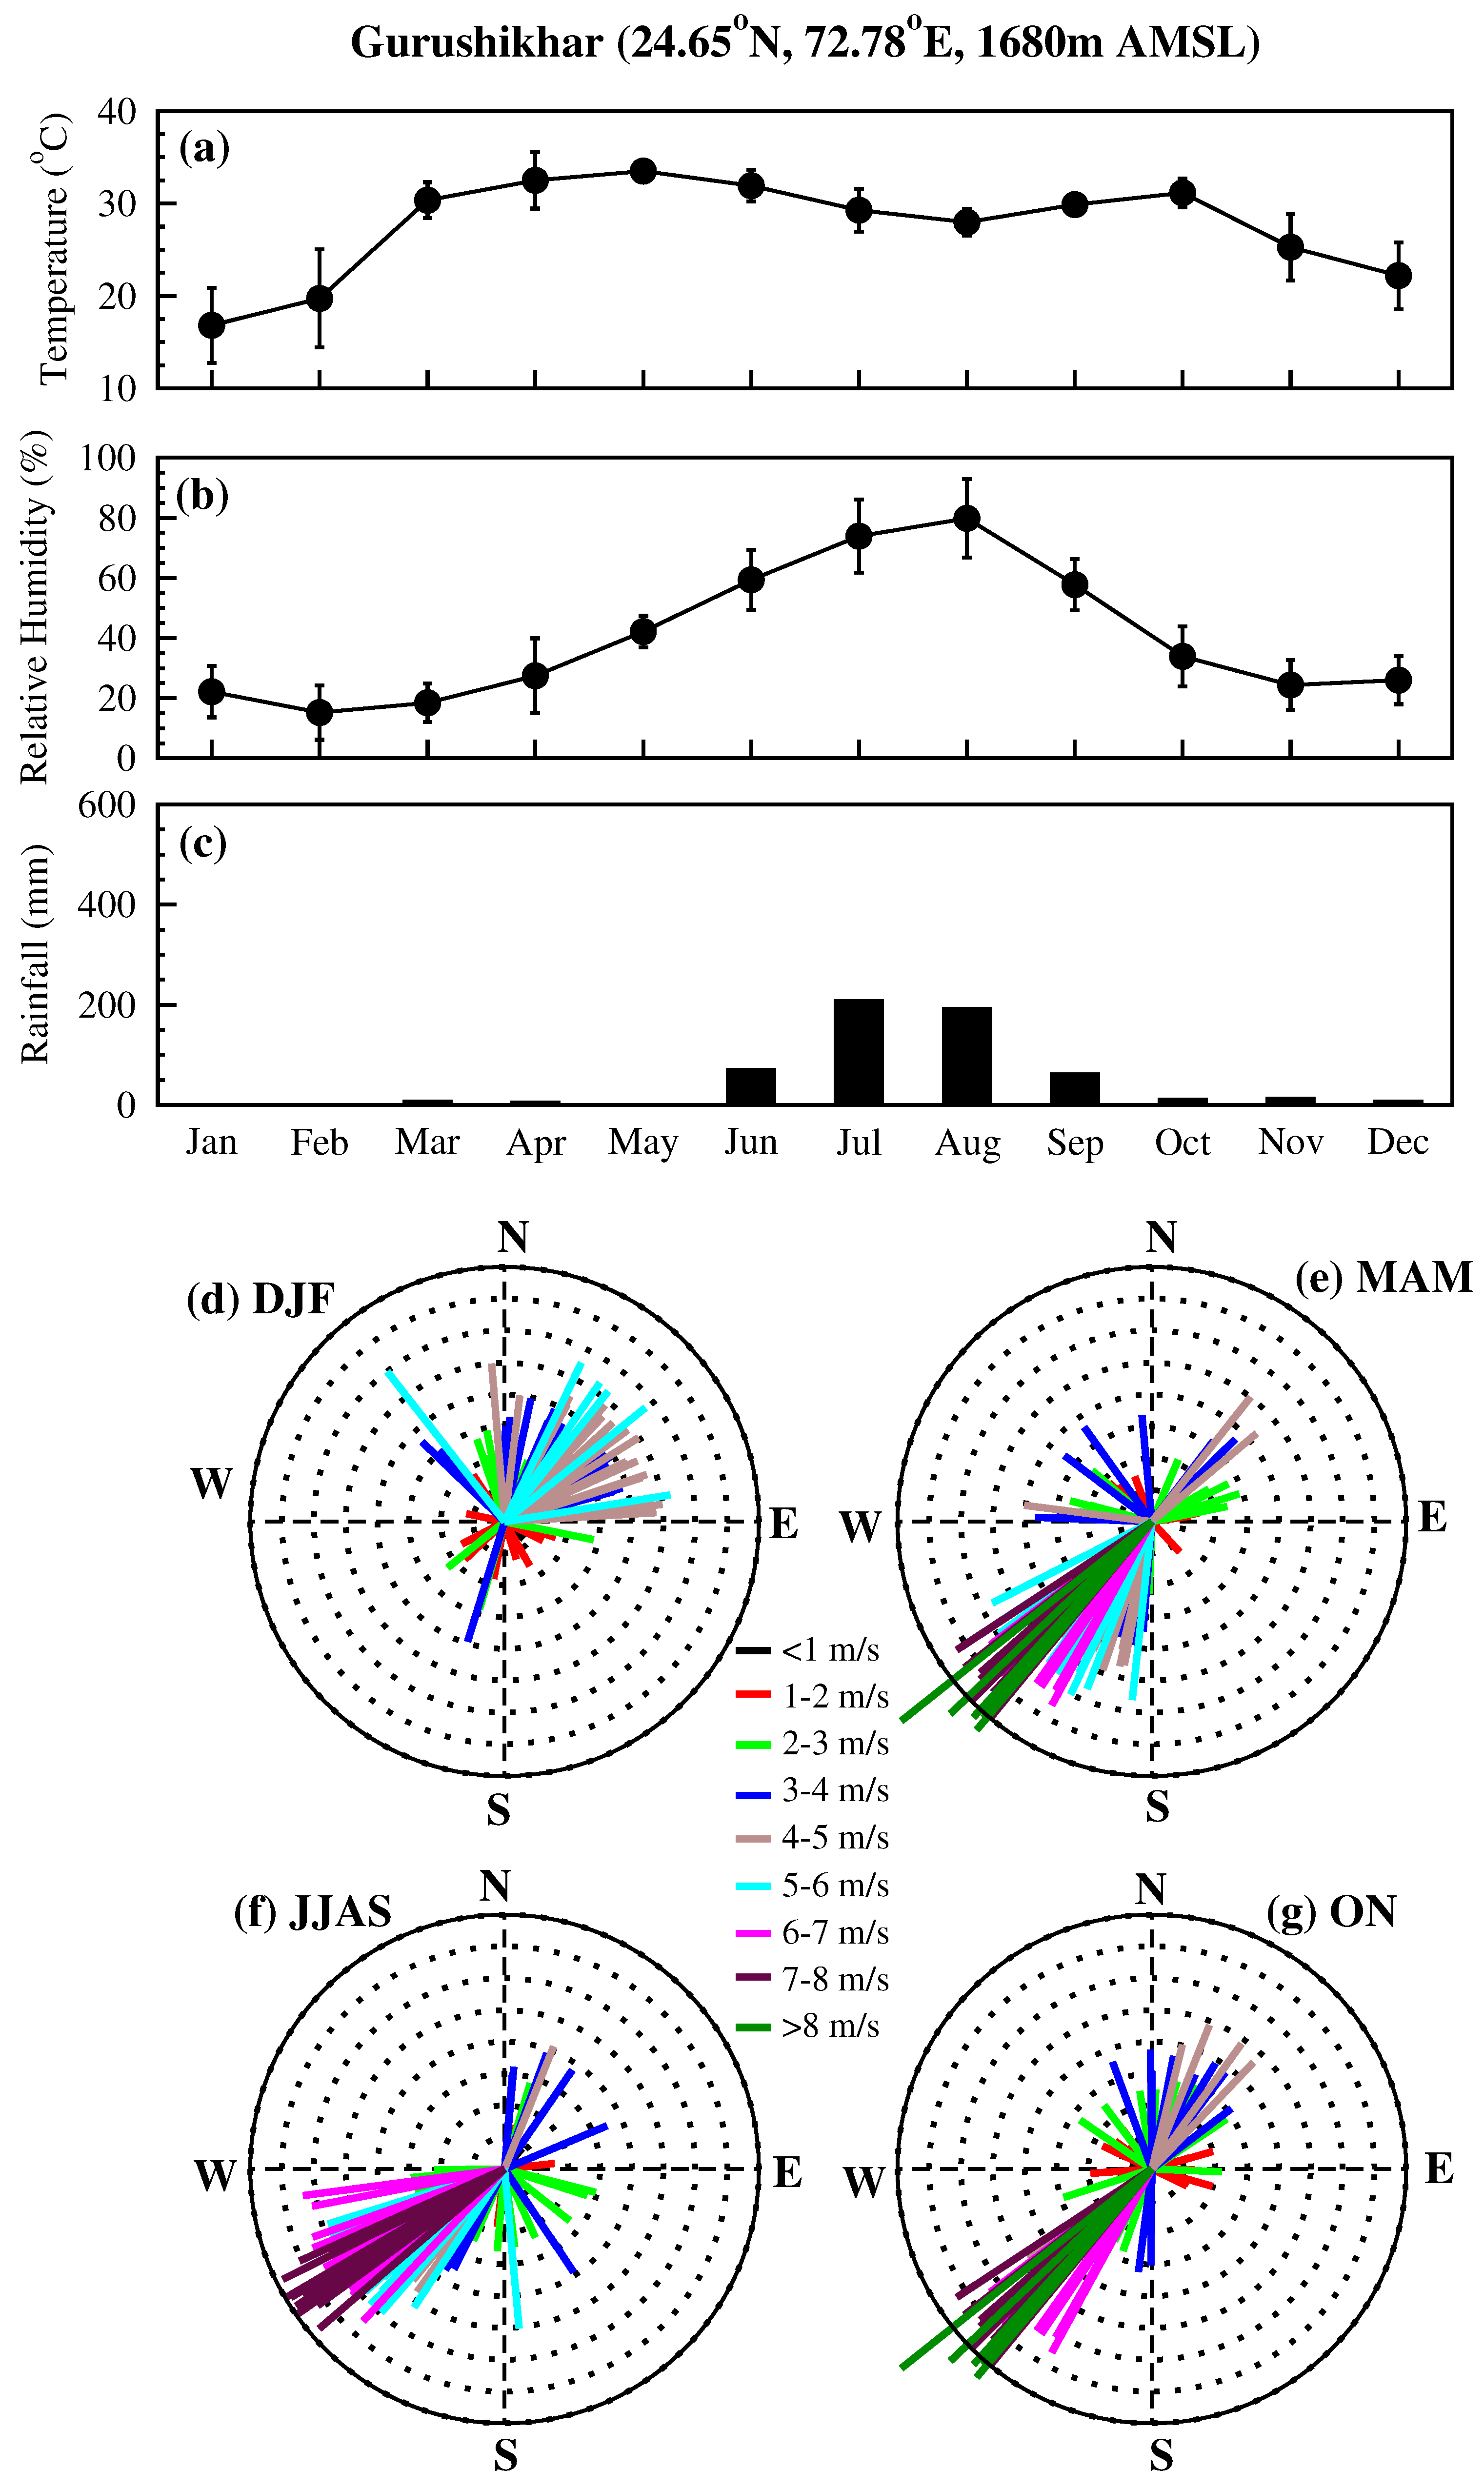
In contrast over Gurushikhar, the difference in AODs at shorter and longer wavelengths is not significant, suggesting lower concentration of fine mode aerosols. AODs could not be measured over Gurushikhar due to cloudy, overcast conditions during monsoon. AODs in the visible wavelength region are more influenced by fine mode aerosols, while when coarse mode aerosols are dominant AODs in the longer wavelength are affected. AODs over Gurushikhar are lowest during winter season as the measurement site remains above the boundary layer. Highest value of AODs are observed during premonsoon, when the measurement site is affected by long range transport of dust particles.
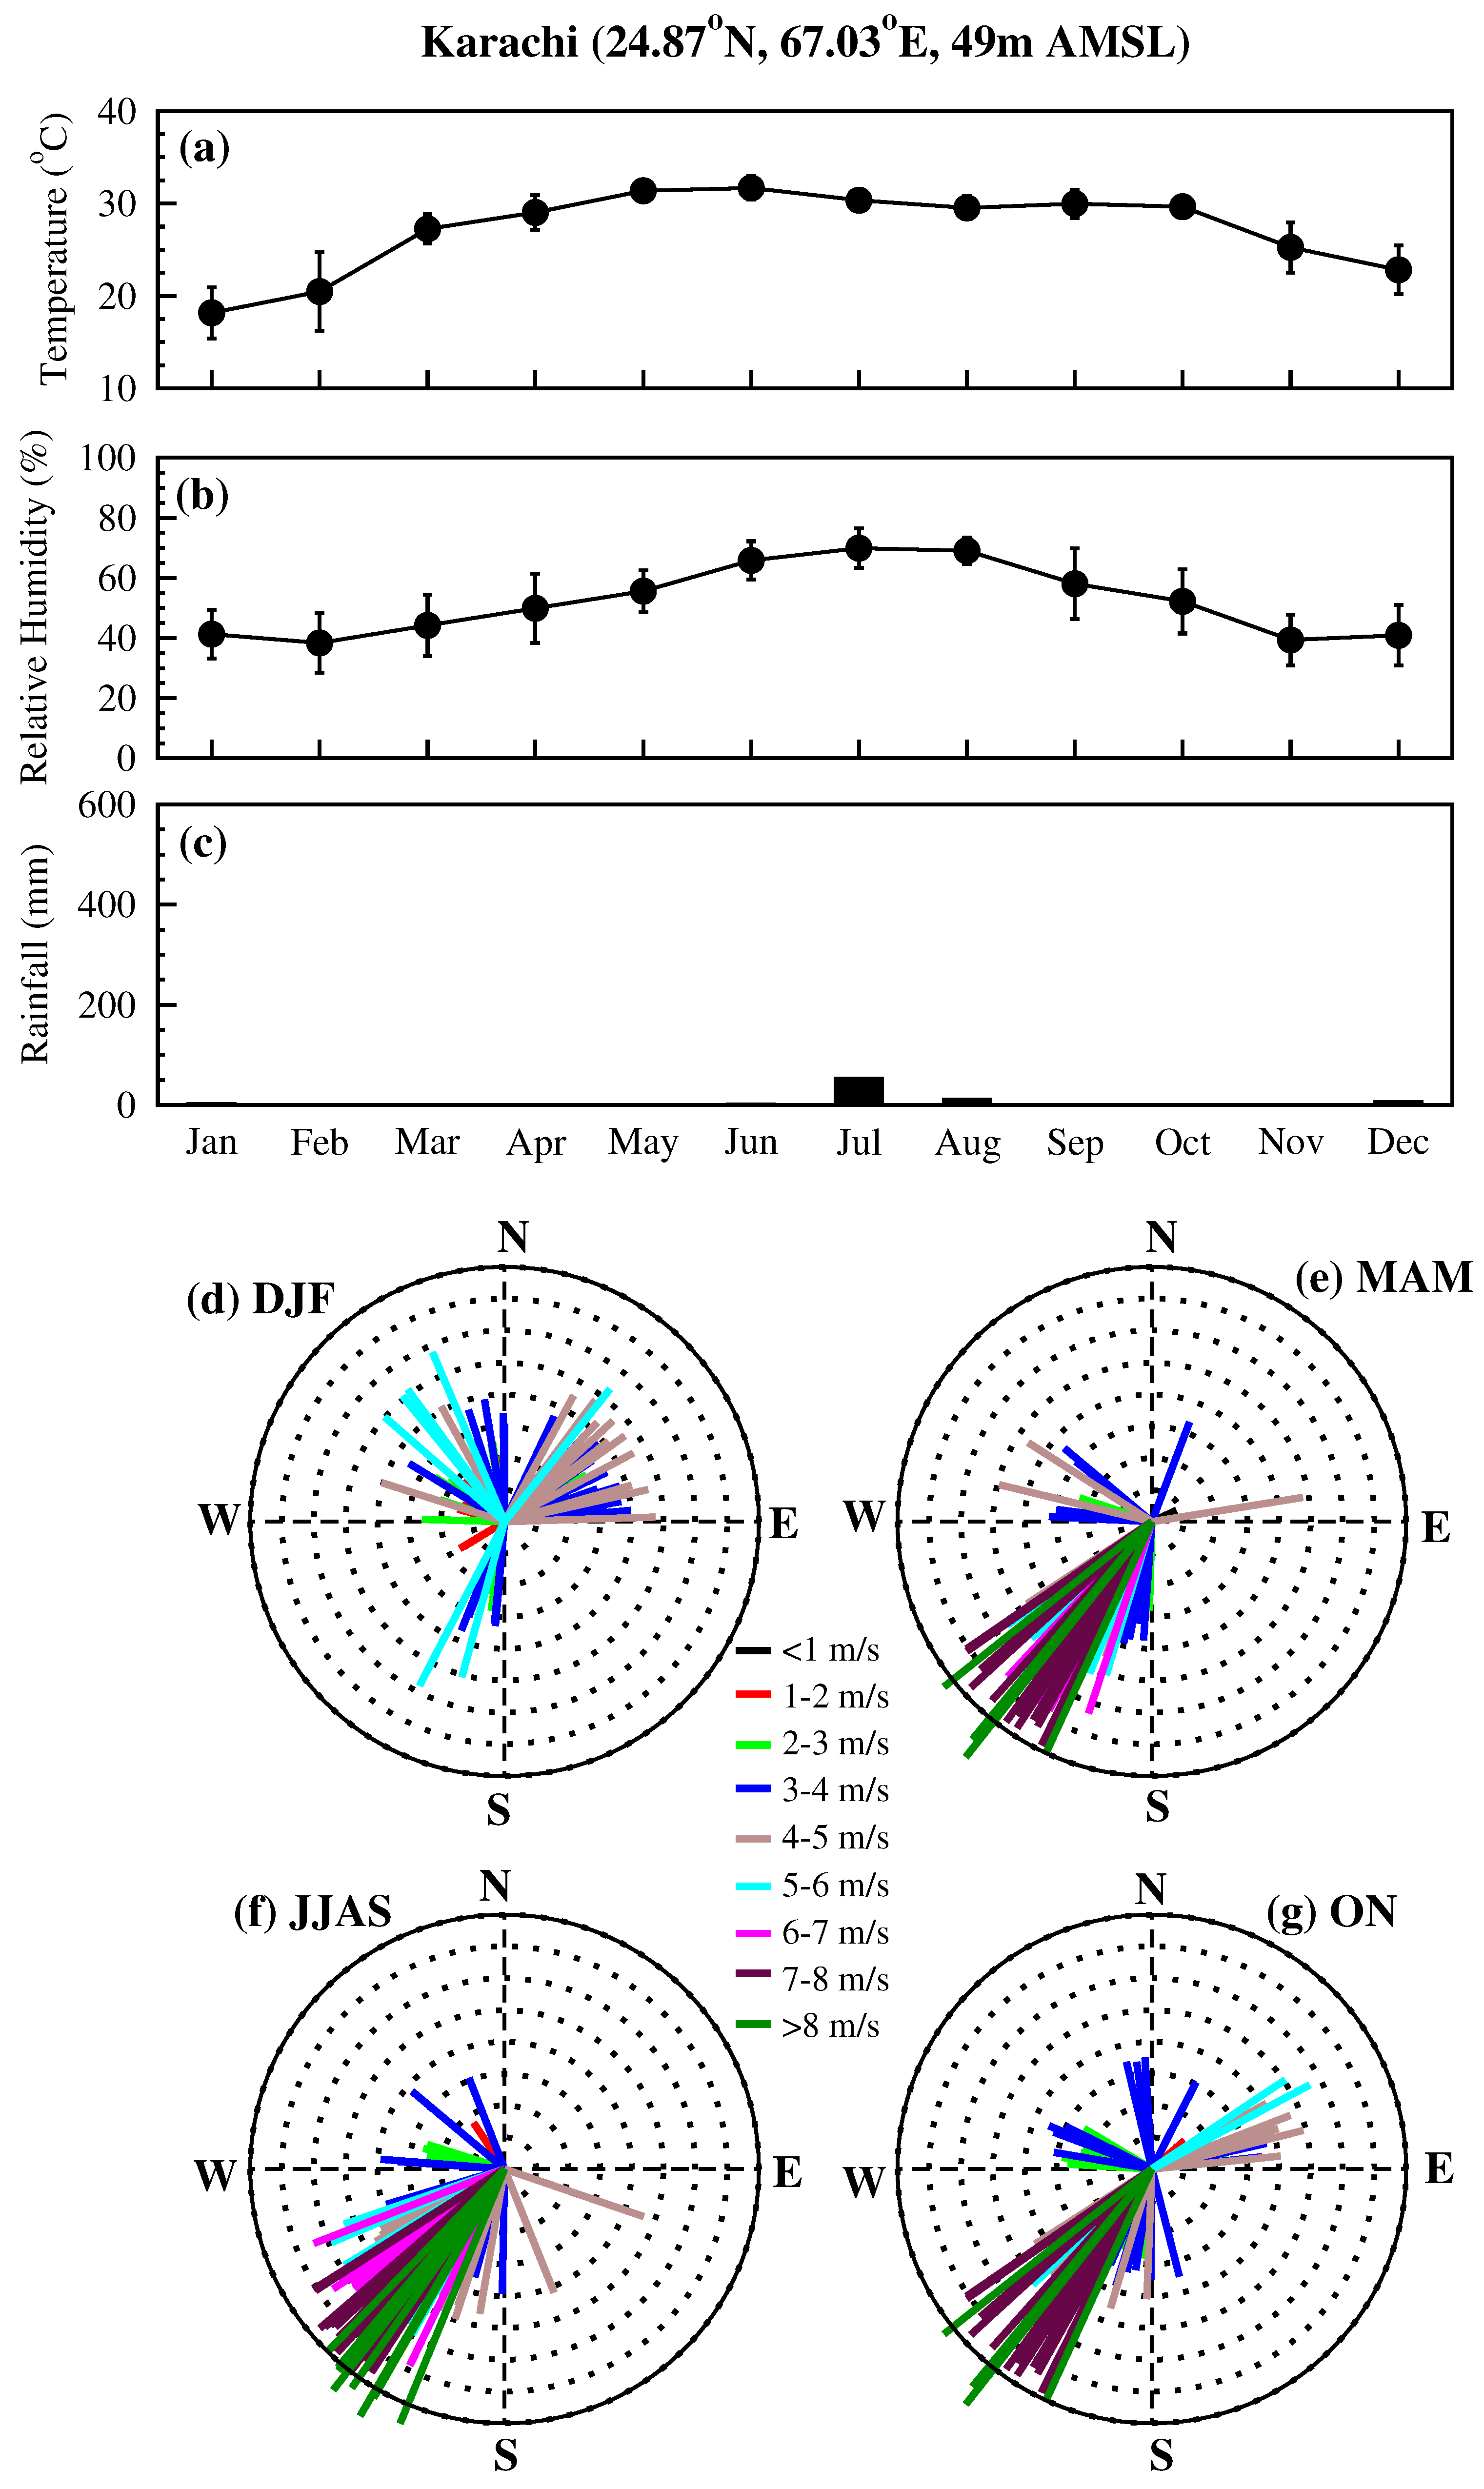
Over Karachi winter, premonsoon and postmonsoon AODs at 0.38 and 0.50 μm are more or less the same in 2007, while in 2008 winter AODs are lower than premonsoon and postmonsoon AODs. AODs during monsoon are higher by about 1.5 times over Karachi (
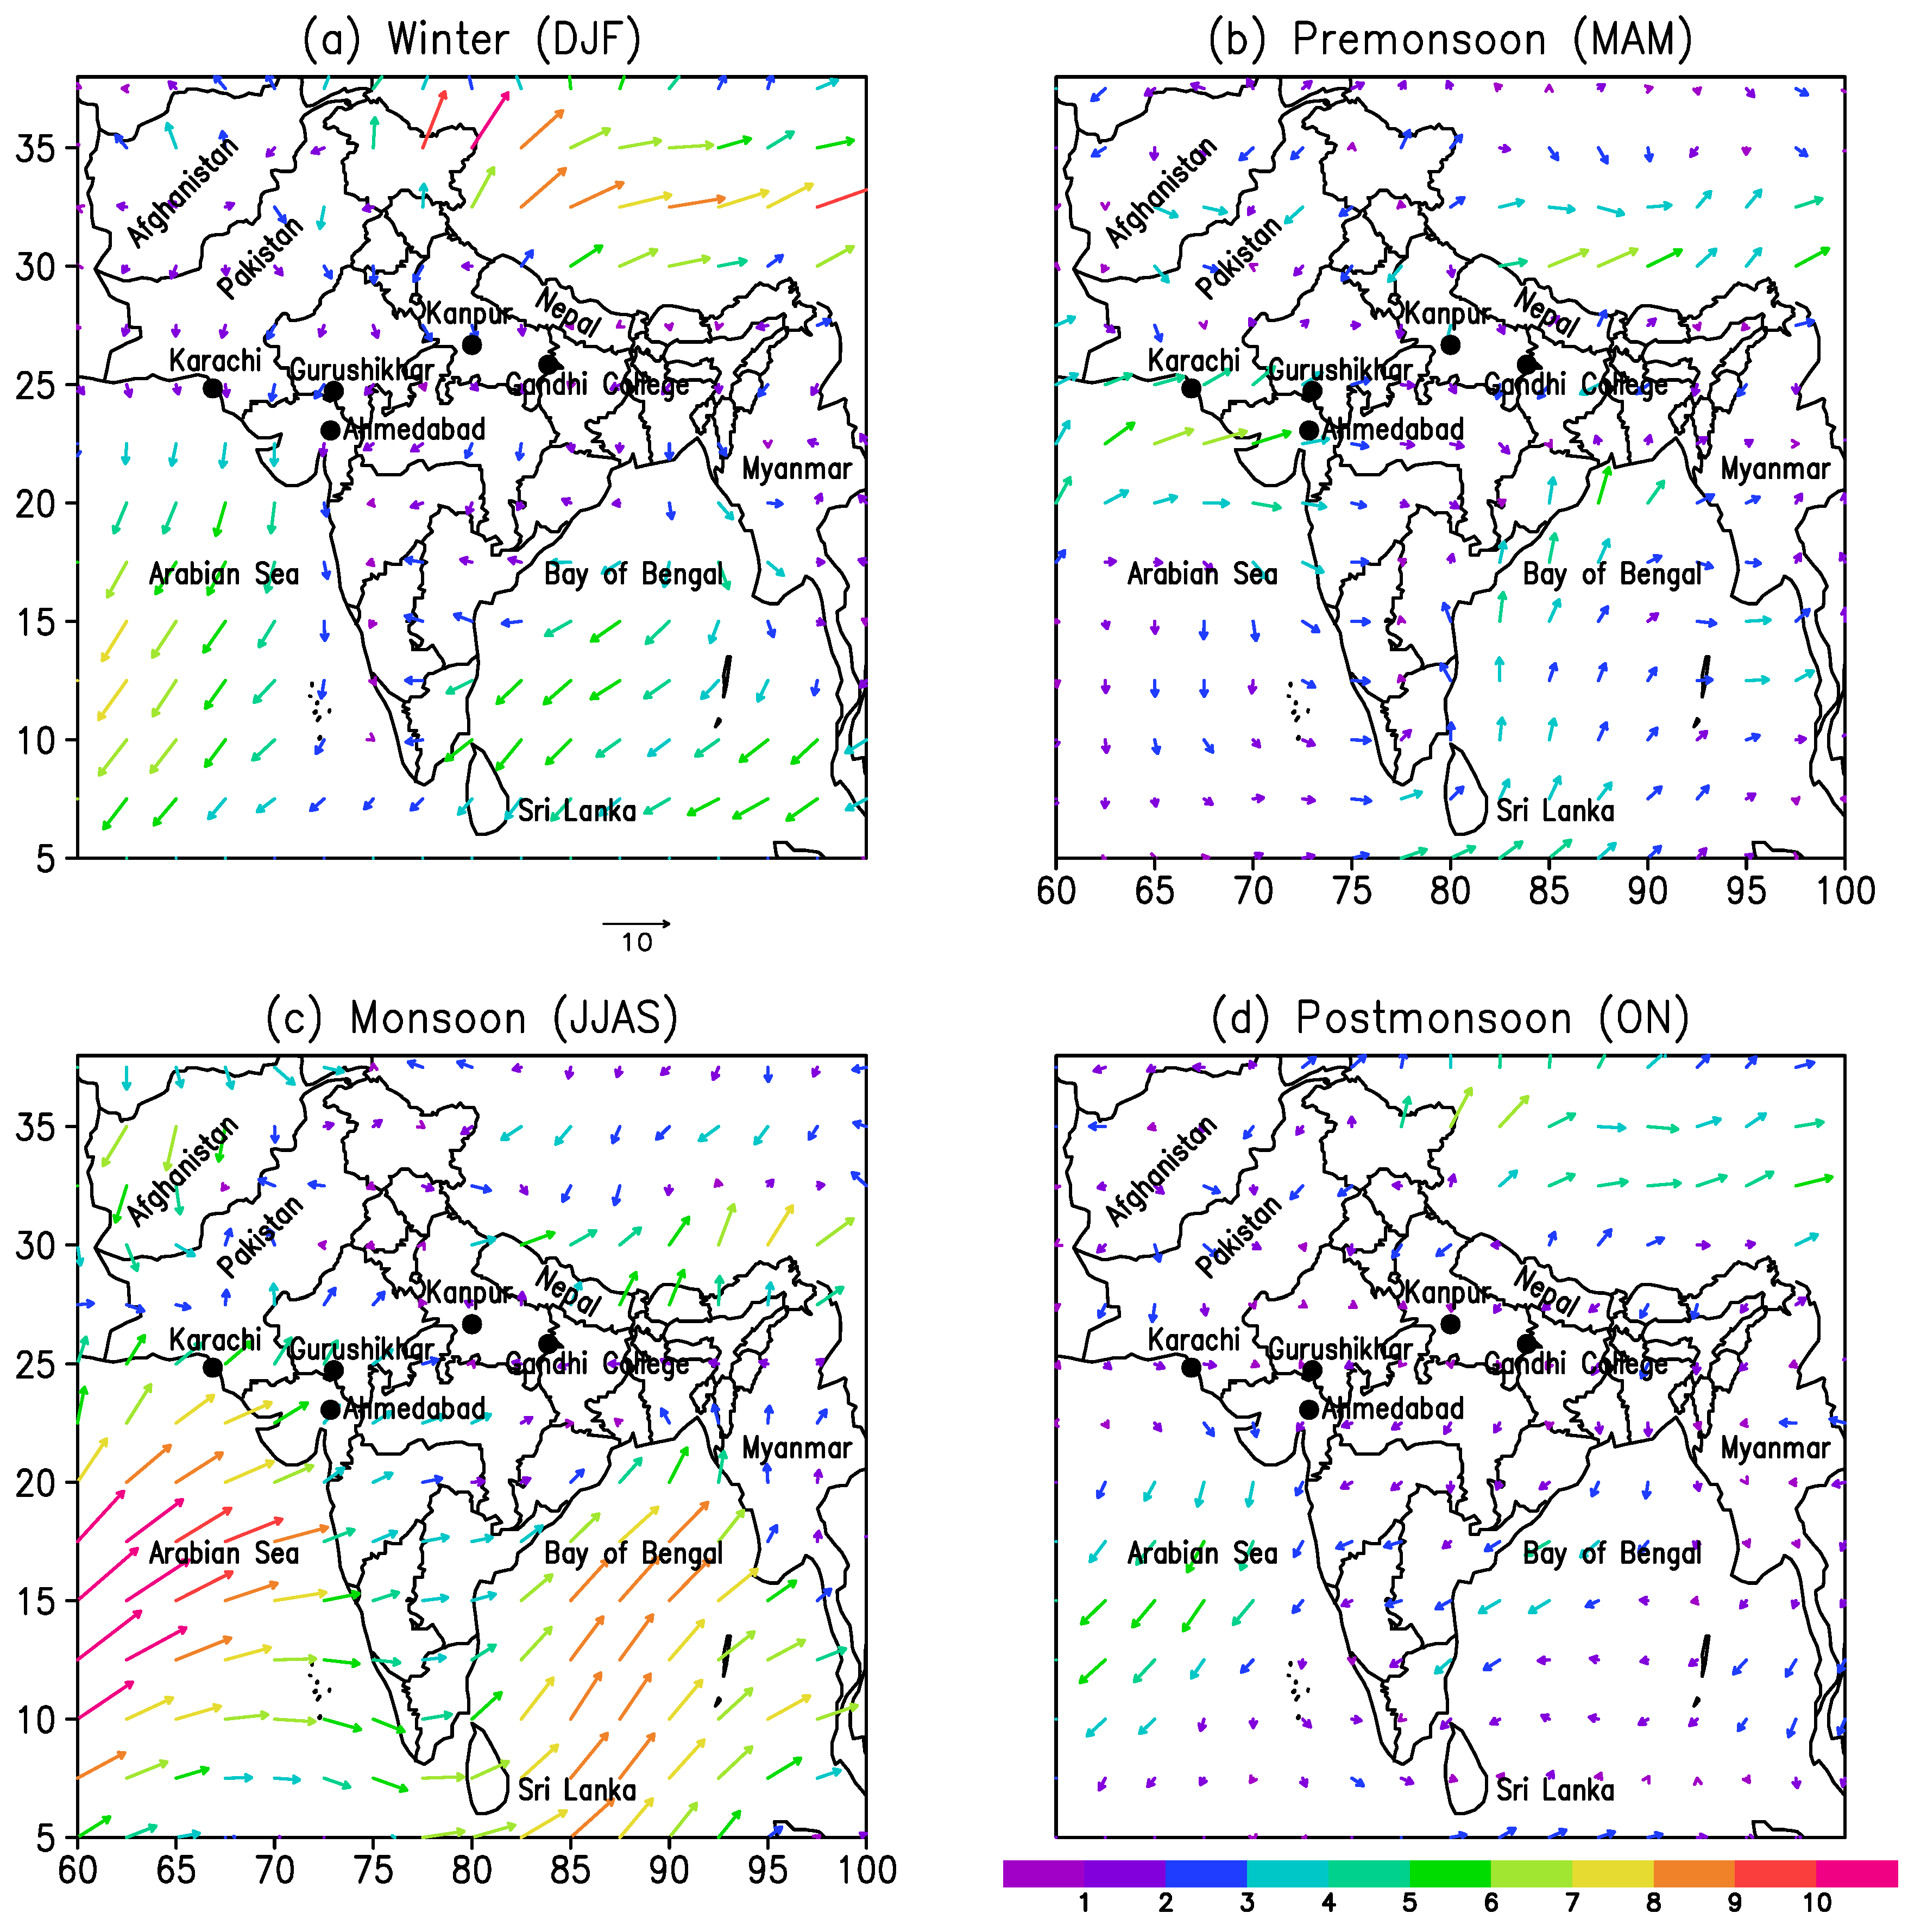
Figure 7(c)). Seasonal and inter-annual variation is similar in short and long wavelength regions in Karachi which indicates that the abundance of fine and coarse mode particles showed similar variabilities. Higher AODs during premonsoon and monsoon occur due to winds coming from the southwest with higher speed (
Figure 4(e),(f)) which increases the concentration of dust and sea salt in the atmosphere respectively. The seasonal cycle in AODs is consistent with aerosol sources and transport effects over Karachi. Over Afghanistan, Iran, Pakistan and China, which are mountainous regions dust sources are found in closed intermountain basins [
36]. The dust activity starts in April–May, becomes strong in June–July, and weakens considerably by September over Pakistan basin [
36]. Karachi, located on the coast of Arabian Sea, witnesses considerable dust activity during premonsoon and monsoon seasons. In addition, during the monsoon season (
Figure 1(a)) winds transport sea salt aerosols over Karachi.
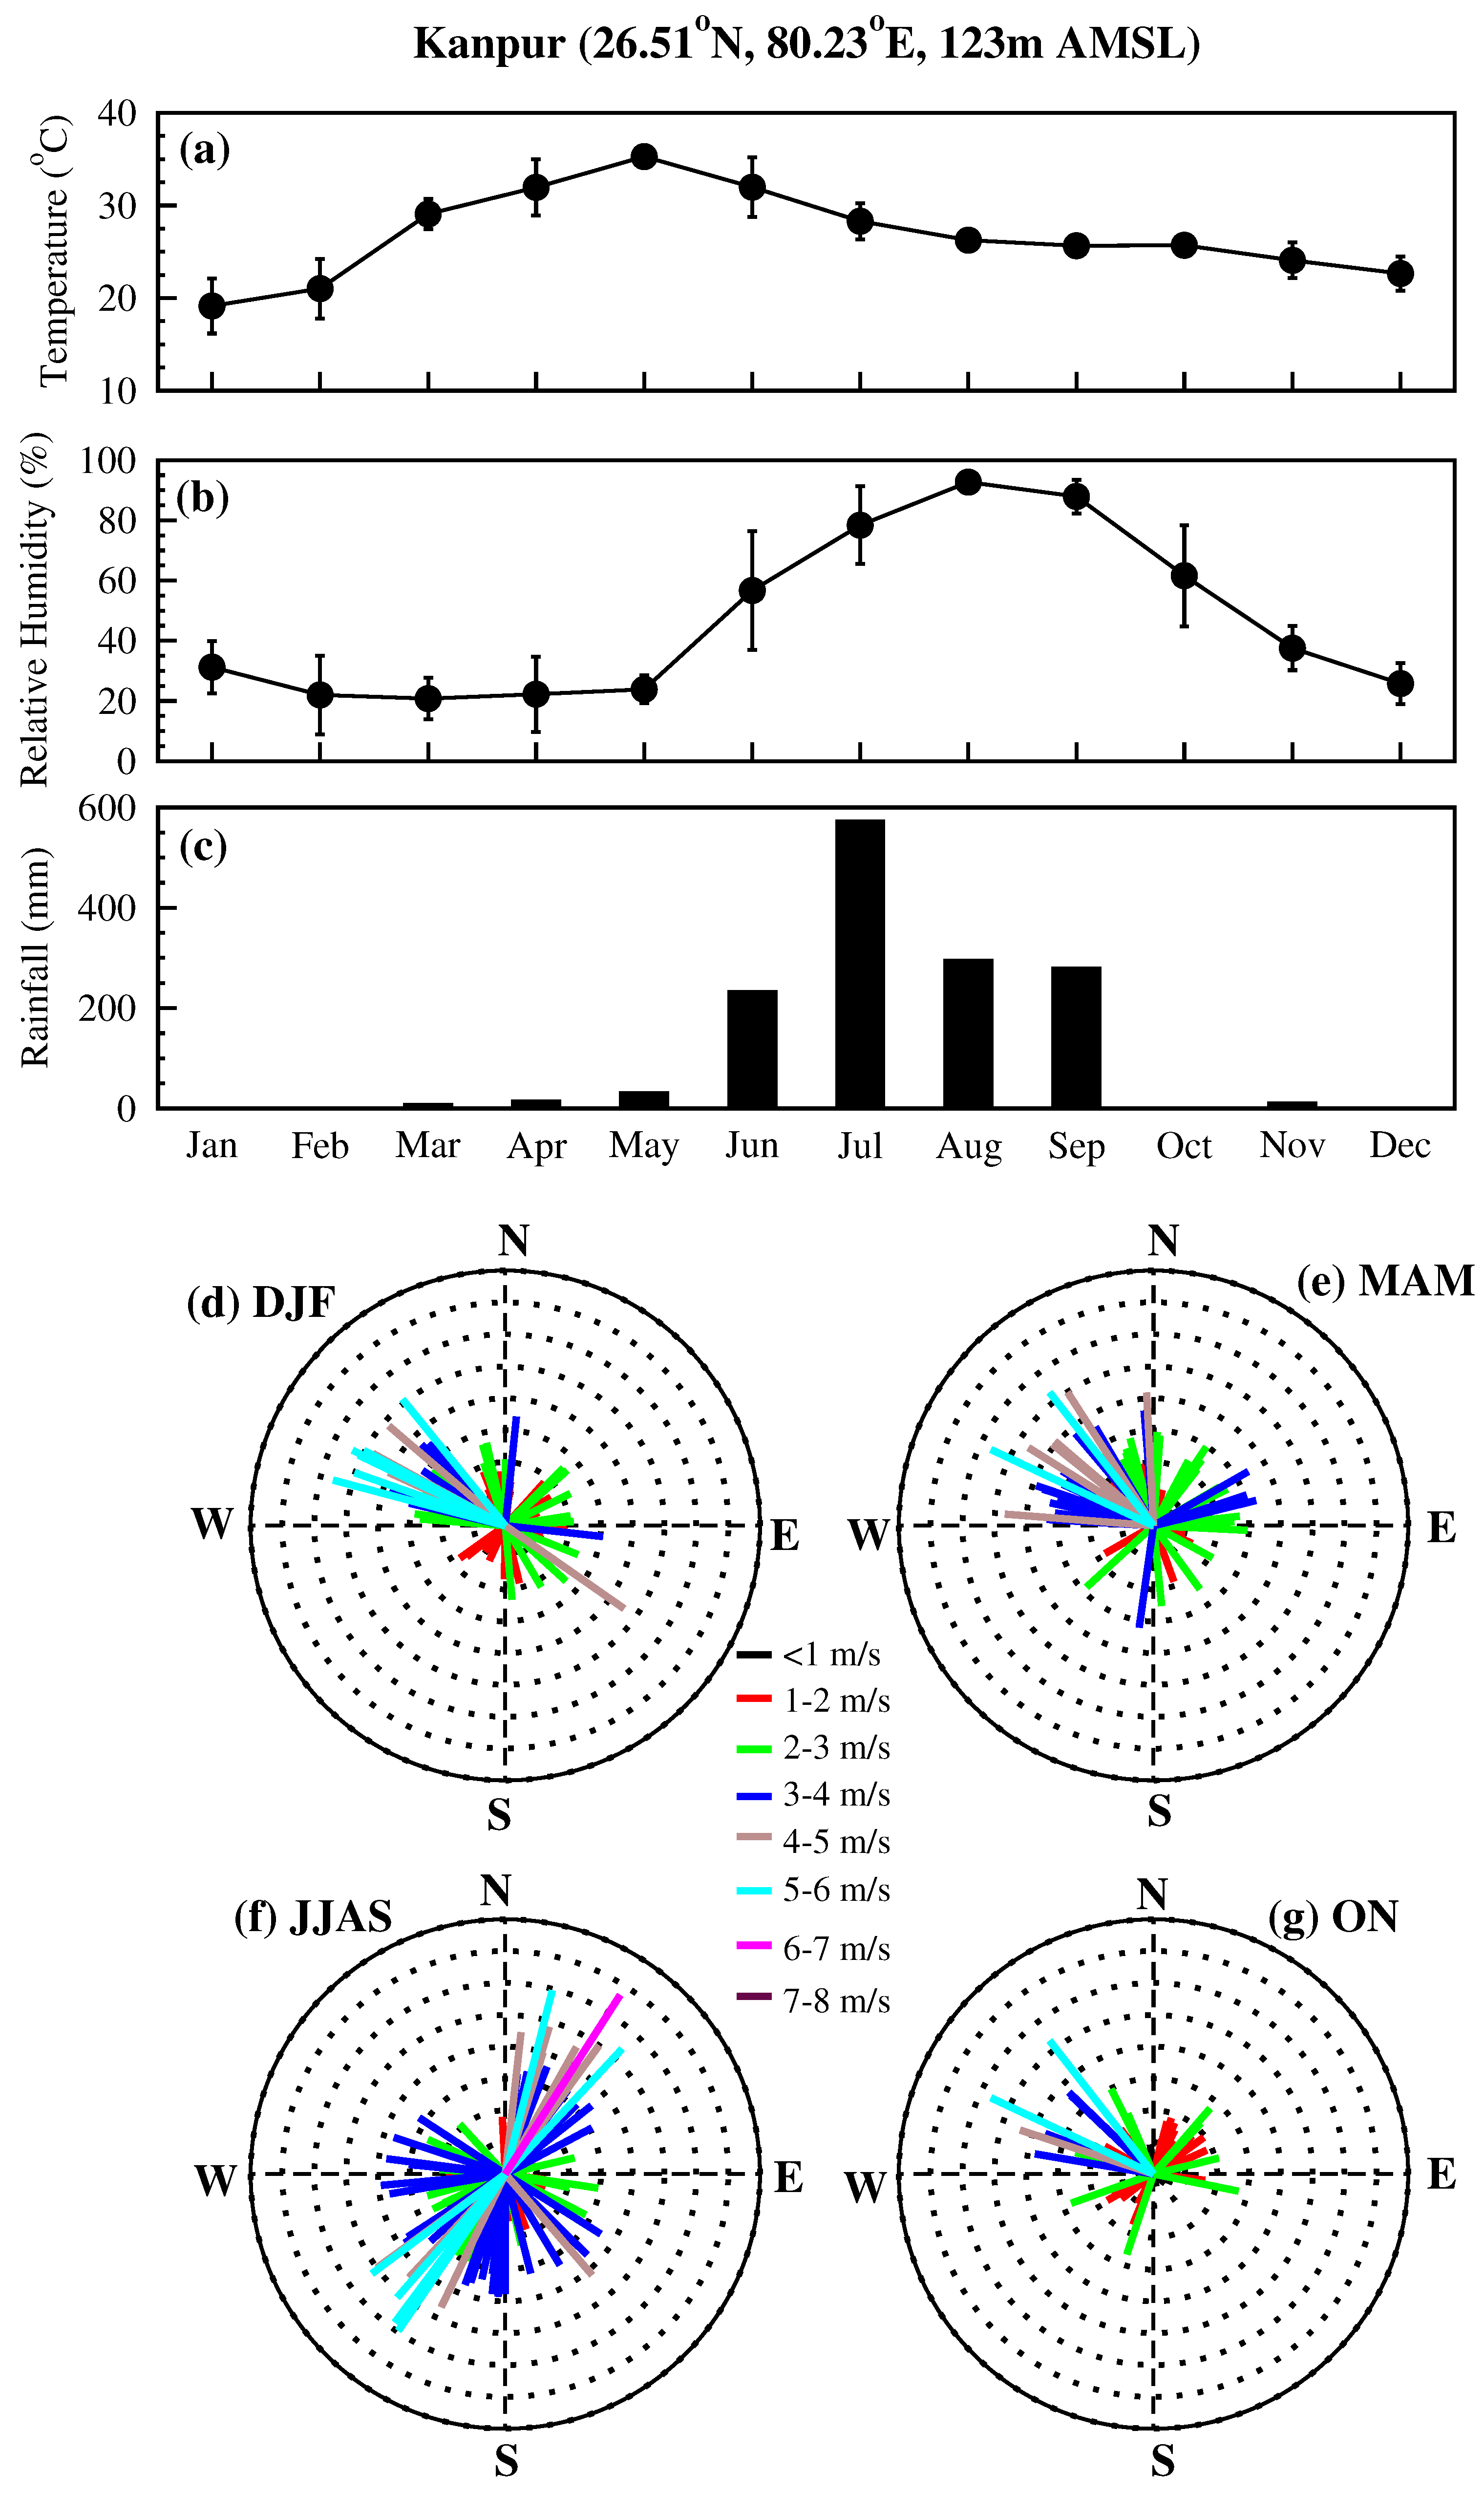
Unlike the other three locations seasonal variation in Kanpur AODs are not so strong while there exists a large inter-annual variability. AERONET AODs during 2001–2003 also showed distinct inter-annual variations over Kanpur [
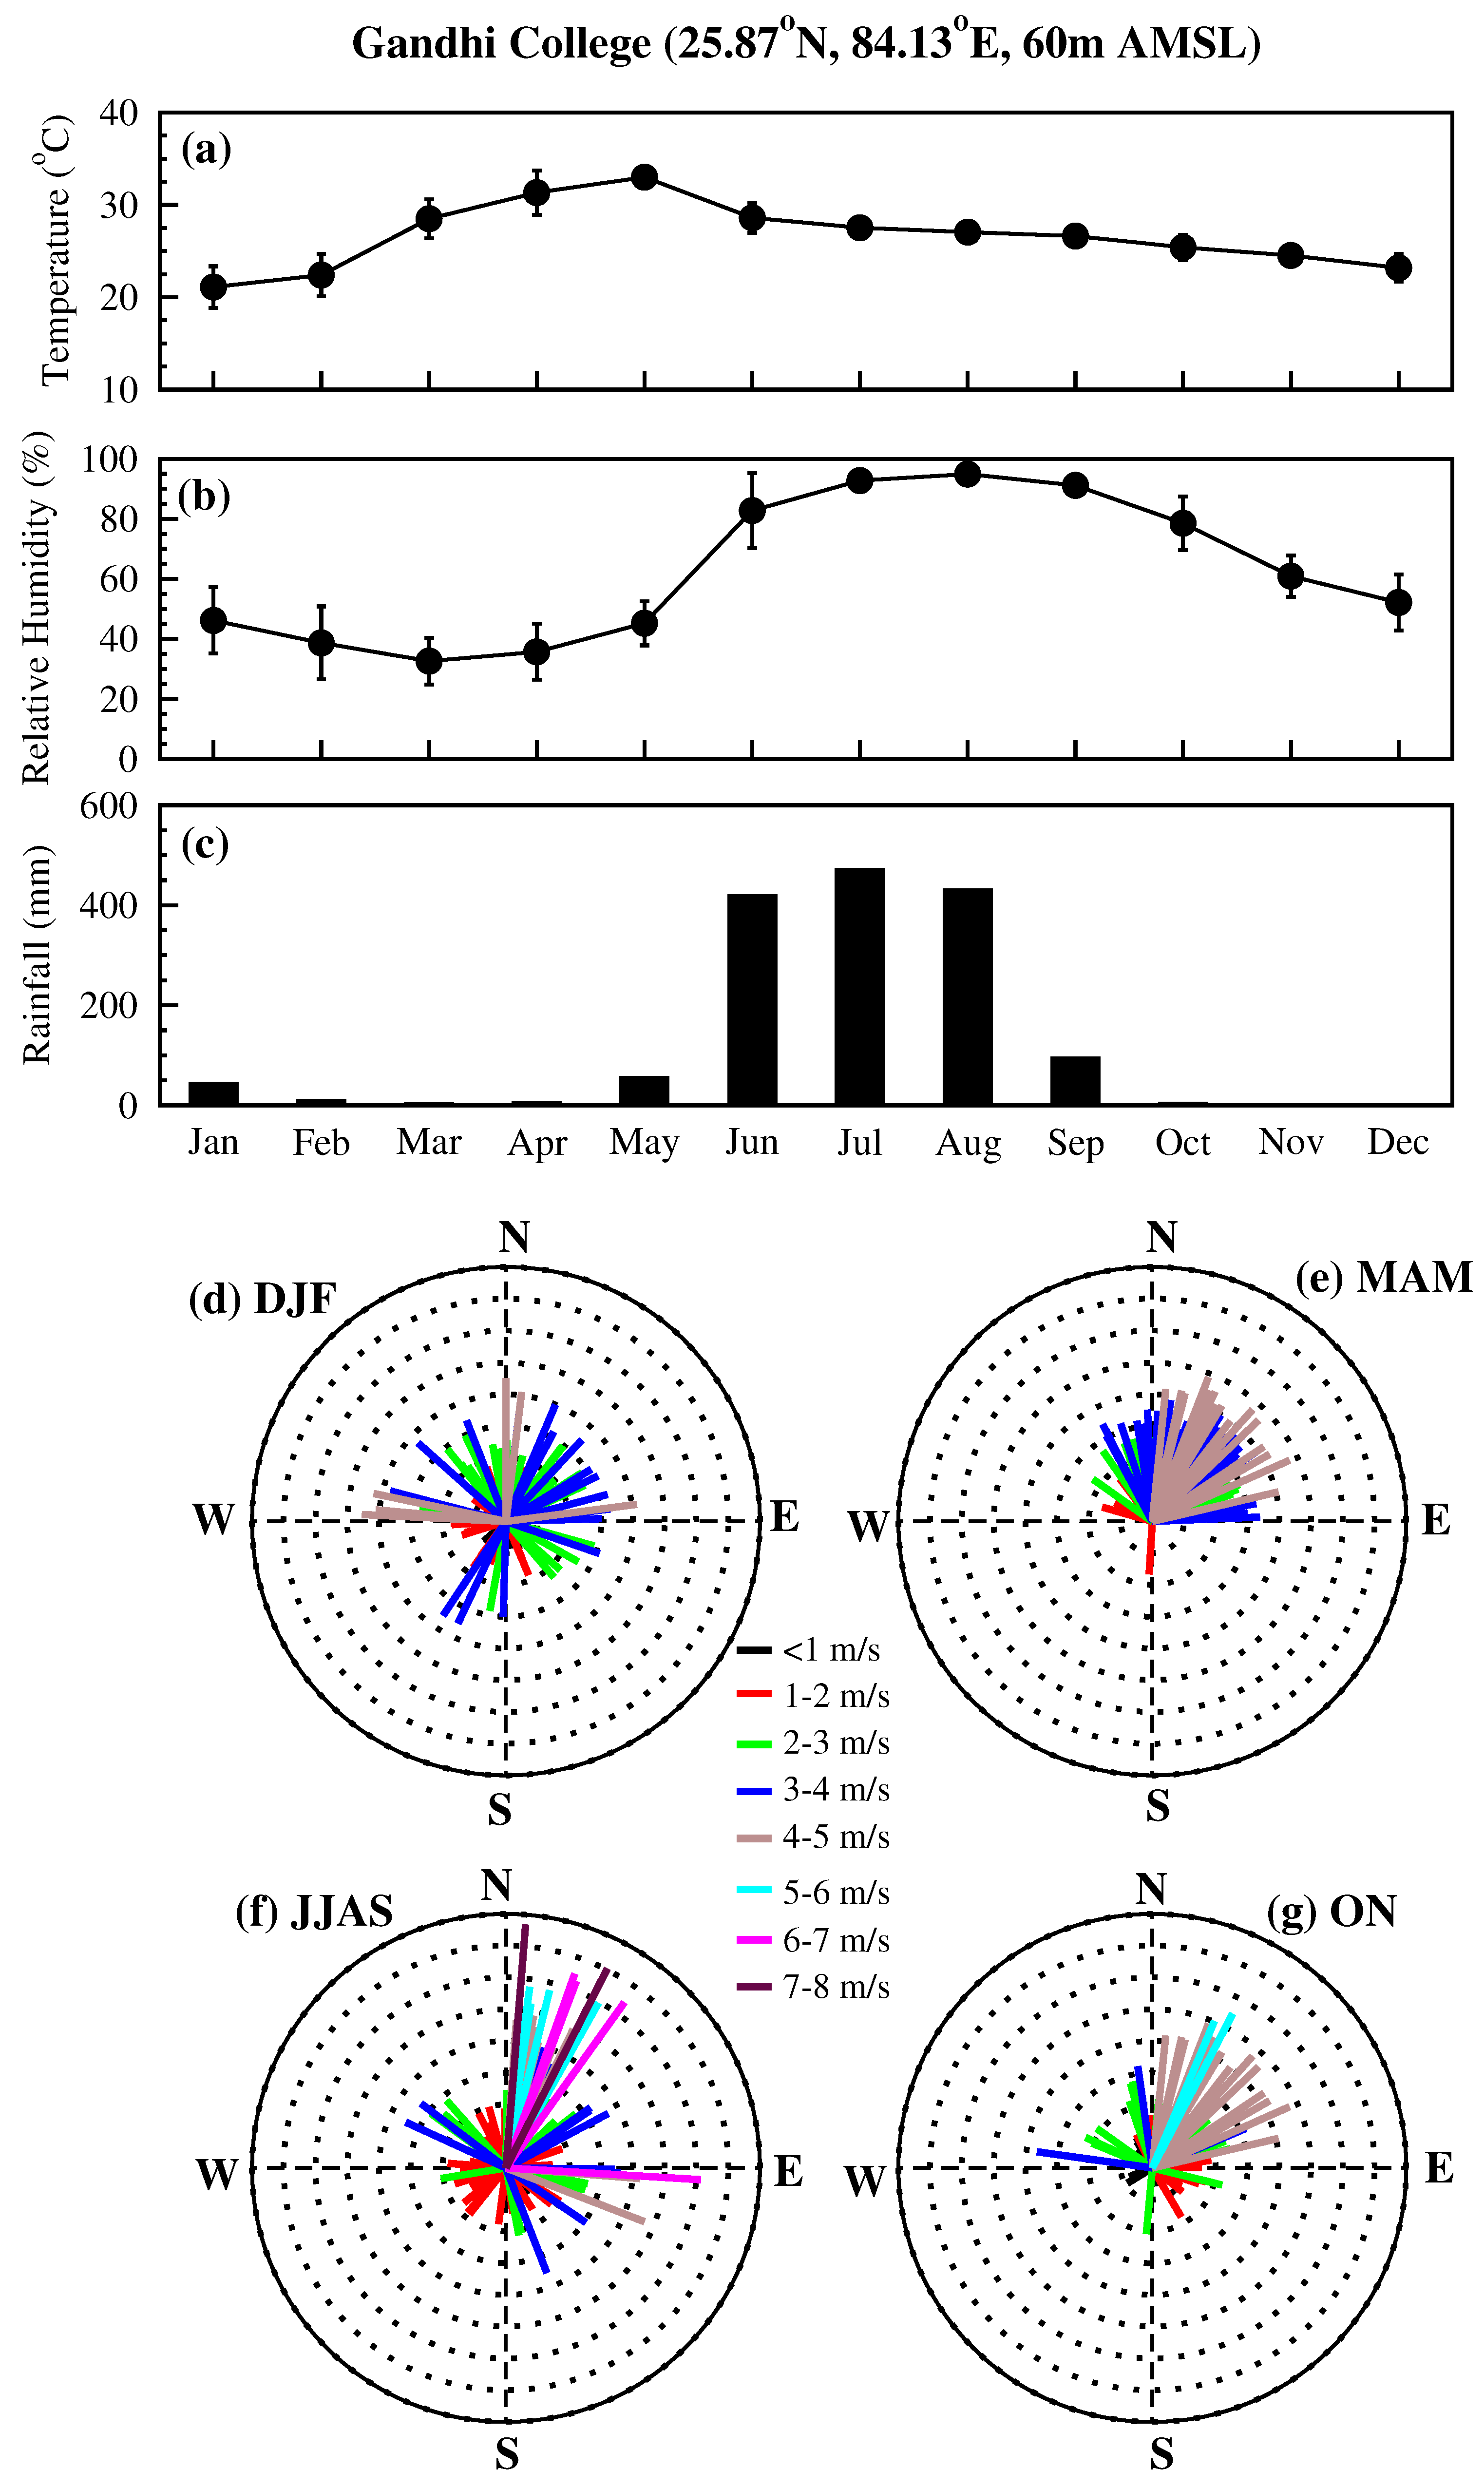
27] as seen here. Gandhi College being a rural, downwind location south of Kanpur exhibits similar features as that of Kanpur. Higher AODs during postmonsoon and winter is a characteristic feature of the locations in Indo-Gangetic basin. Over much of northern India the temperatures are colder in the winter. During postmonsoon and winter the boundary layer is shallow and holds the pollutants in a smaller volume, when compared to summer, which results in confinement of aerosols. The colder temperatures along with the trapping of pollutants give rise to hazy and foggy conditions over Indo-Gangetic basin [
4,
21]. In addition, the dense population in this region contributes to large aerosol sources (due to fossil fuel consumption and bio fuels used for domestic purposes) which produce higher AODs.
Ahmedabad, Gurushikhar and Karachi situated in the western region of South Asia are governed by more or less similar meteorological conditions except for rainfall over Karachi (a factor of ten less when compared to the other two locations), but are distinct in terms of the environment (urban, remote and high altitude, urban/coastal respectively) and therefore are influenced by different types of aerosols and sources. Over this region highest AODs are observed over Karachi; while the lowest AODs are obtained over Gurushikhar. AODs over Ahmedabad and Karachi are at least a factor of two higher than the AODs measured over Gurushikhar. This is due to the fact that Gurushikhar, being a high altitude remote location is dominated by coarse mode aerosols from natural sources (mainly mineral dust) in the atmosphere (
Table 1); while both Ahmedabad and Karachi are densely populated and highly industrialized areas. Among the urban locations, Karachi AODs are higher in all the seasons during 2006–2008 when compared to Ahmedabad. Highest AODs over Karachi could be because of much higher population (∼14 million, when compared to about 5.8 million over Ahmedabad, and about 50,000 in Gurushikhar), industrialization, and in addition, being a coastal station the contribution of sea salt cannot be excluded. Kanpur and Gandhi College in northern India situated in one of the the most polluted and densely populated regions, namely the Indo-Gangetic basin, are influenced by similar meteorological conditions. Kanpur is an urban, industrial city while Gandhi College is a rural location. AODs over the Indo-Gangetic basin are higher than those measured in the western region of South Asia. 0.38 and 0.50 μm AODs over Gandhi College are about 20% higher than Kanpur; while 0.87 μm AODs nearly the same for all the seasons over both the locations. This suggests that though both Kanpur and Gandhi College are located in the Indo-Gangetic basin, Gandhi College AODs can be higher as it is located downwind of major urban centers; also being a rural location the local production due to biomass emissions over Gandhi College could be contributing to the higher AODs.
Table 1.
Seasonal mean 0.5 μm aerosol optical depths (along with ±1σ standard deviation) measured using hand held sun photometer and Microtops over Ahmedabad and Gurushikhar, and from AERONET over Karachi, Kanpur and Gandhi College during 2006–2008. Seasonal mean AODs correspond to year 2007 unless otherwise mentioned.
| Seasons | Ahmedabad | Gurushikhar | Karachi | Kanpur | Gandhi College |
|---|
| Winter | 0.37 ± 0.15 | 0.06 ± 0.03 | 0.38 ± 0.18 | 0.88 ± 0.32 | 0.87 ± 0.34 |
| Premonsoon | 0.31 ± 0.10 | 0.19 ± 0.04 | 0.40 ± 0.12 | 0.66 ± 0.22 | 0.55 ± 0.24 |
| Monsoon | 0.46 ± 0.09 | | 0.60 ± 0.31 | 0.65 ± 0.11 | 0.63 ± 0.29 |
| Postmonsoon | 0.42 ± 0.07 | 0.10 ± 0.06 | 0.34 ± 0.14 | 0.83 ± 0.31 | 0.69 ± 0.26 |
5.2. Ångström Coefficients and AOD Ratio
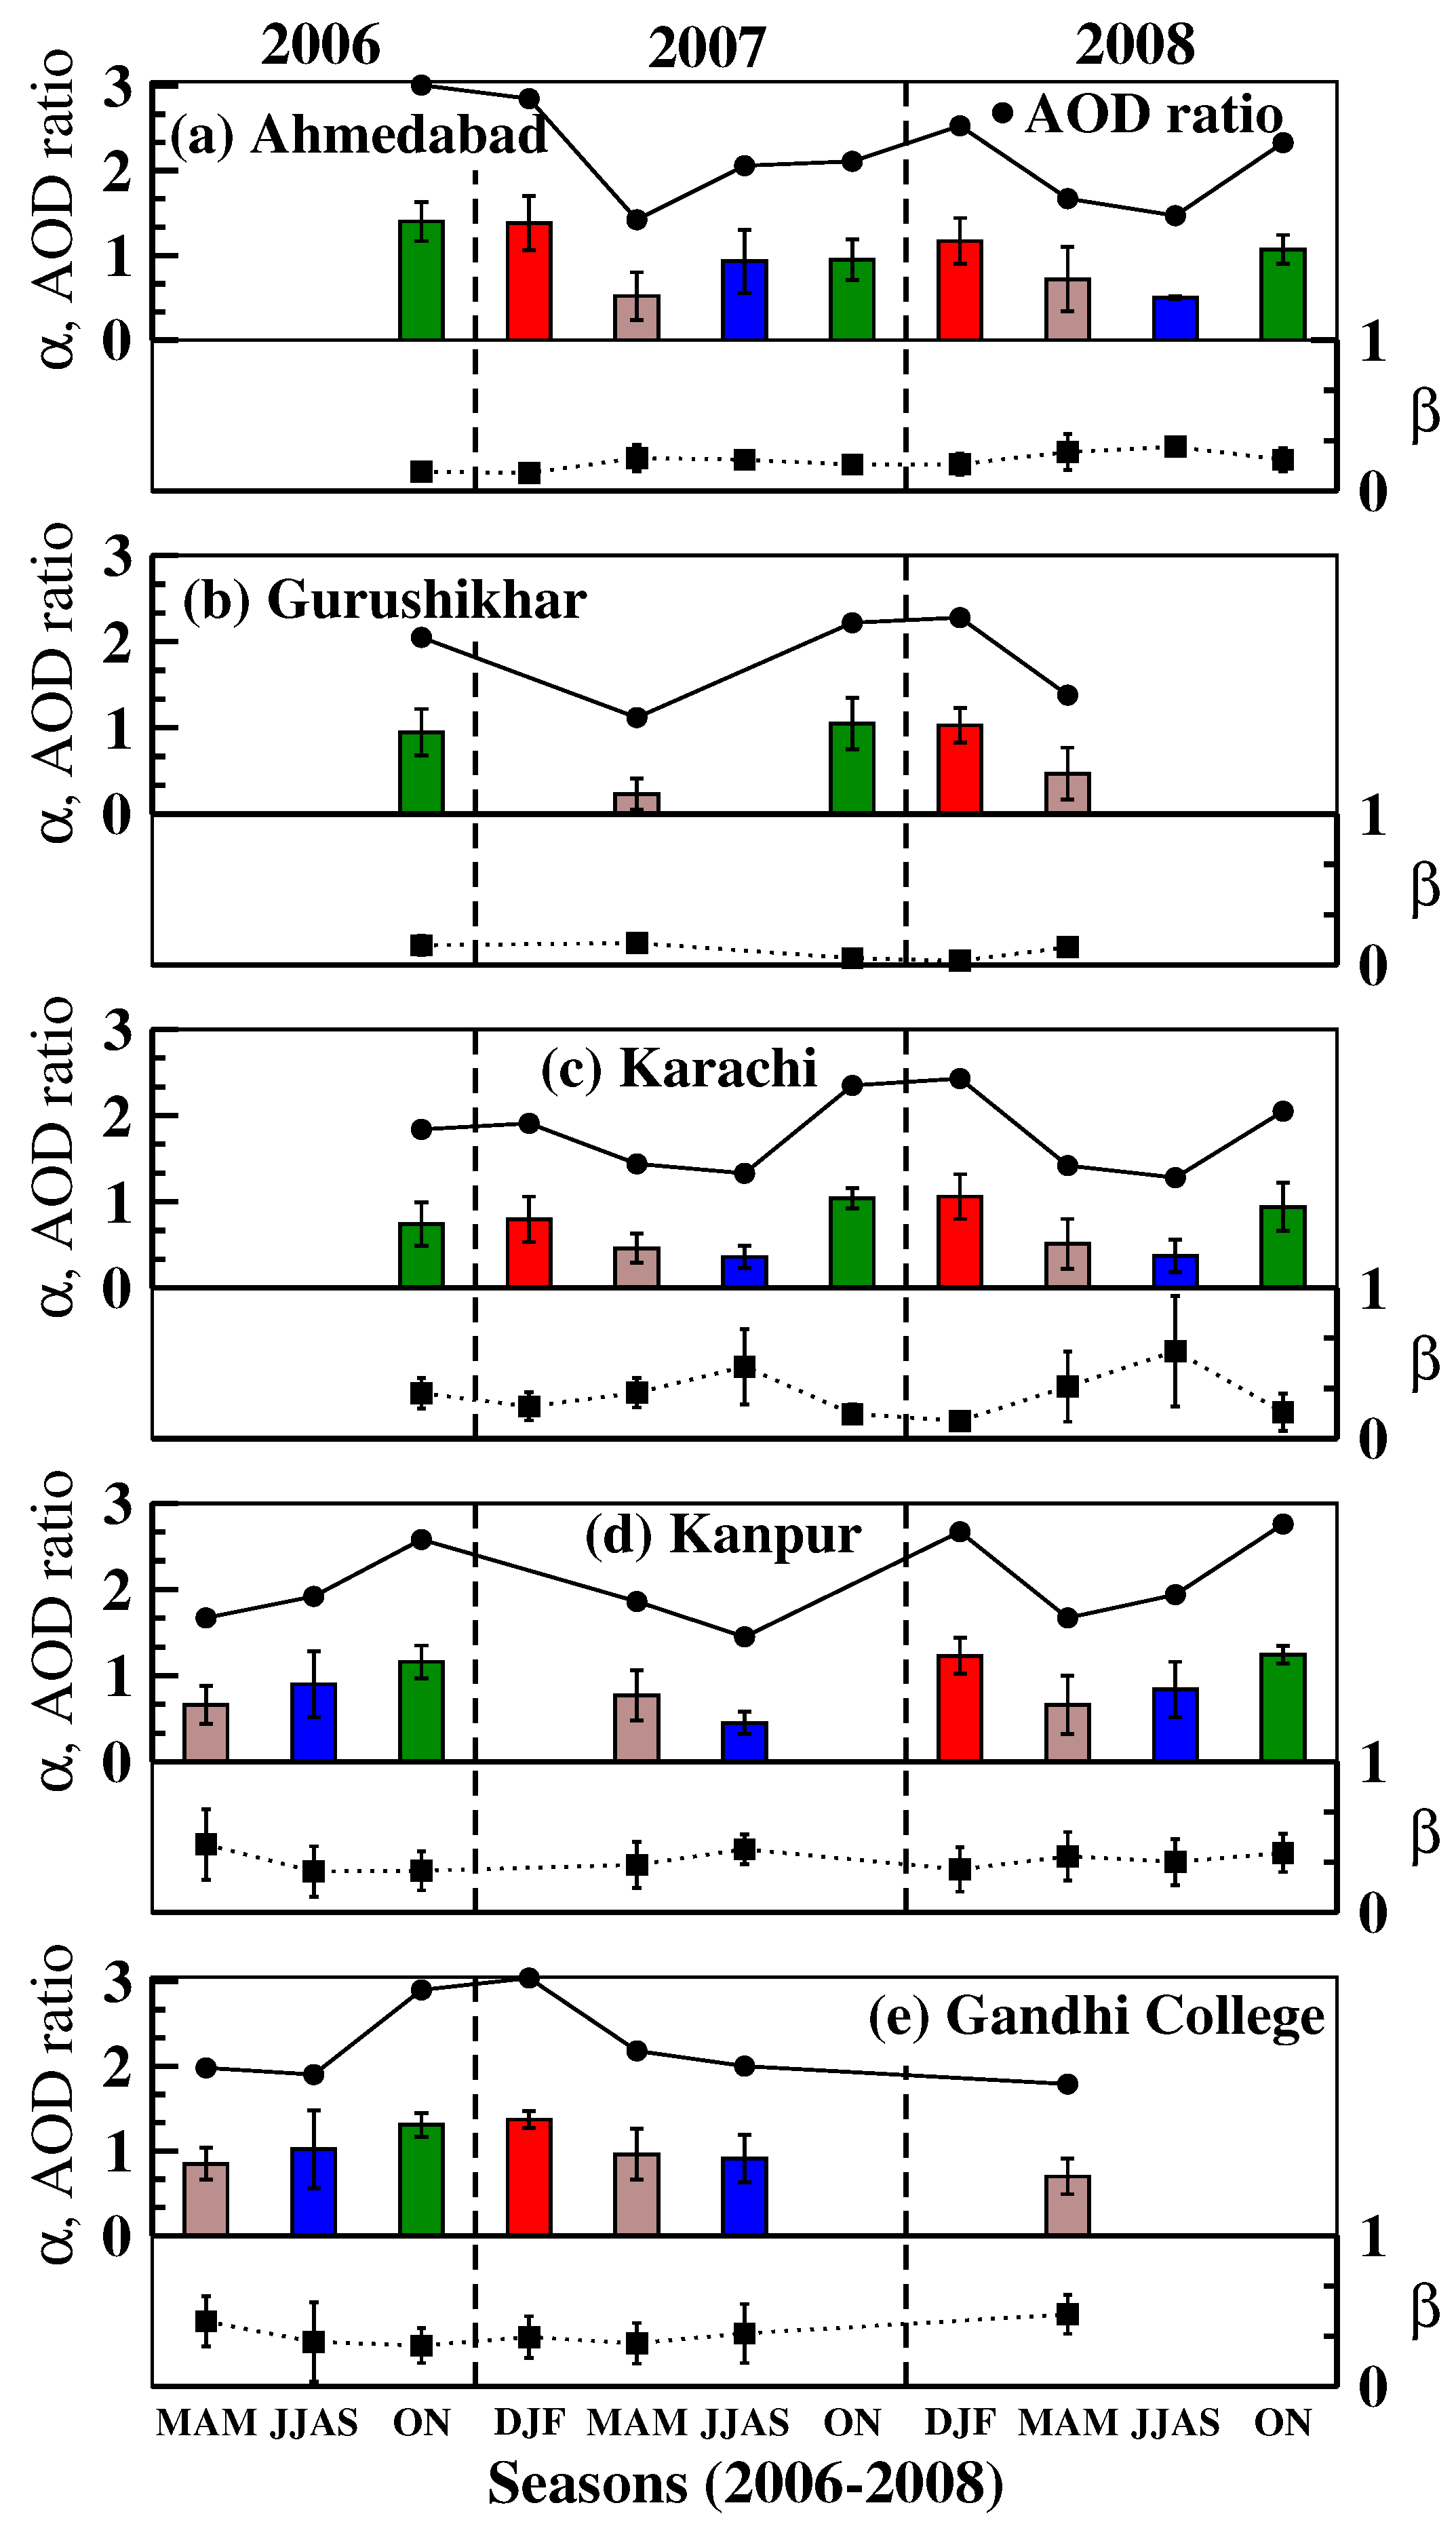
The
α (estimated from the AODs in the 0.38–0.87 μm wavelength range) is found to show strong seasonal, inter-annual as well as spatial variability similar to AODs. Over Ahmedabad,
α is found to be high during postmonsoon and winter season; while during premonsoon and monsoon
α value is lower (
Figure 8(a)) for all the three years. This feature of lower
α value is consistent with the presence of mineral dust and hygroscopically grown water soluble aerosols, which are in the coarse mode, during premonsoon and monsoon respectively. Over Gurushikhar
α is found to be lower than that of Ahmedabad throughout the study period indicating a higher concentration of coarse mode aerosols (
Figure 8(b)). The intra seasonal variation in
α is quite significant over Gurushikhar; premonsoon
α is at least a factor of three lower when compared to postmonsoon and winter. The lower
α during premonsoon highlights the dominance of long range transported dust particles in the atmosphere, while during postmonsoon and winter AODs are lower and fine mode aerosols are present giving rise to higher
α values.
α values over Karachi, an urban, coastal station are lower than those obtained over Ahmedabad (
Figure 8(c)) suggesting the presence of coarse mode (sea salt) aerosols. The
α values over Gurushikhar are significantly lower during premonsoon (
Figure 8(b)), due to the abundance of coarse mode dust particles. In Karachi, the
α values during monsoon are lower during premonsoon and monsoon than during winter and postmonsoon. The monsoon
α values are lower than even premonsoon because in addition to the dust particles that are present during monsoon, sea salt particles get transported (
Figure 1). Thereby, coarse mode particles become more abundant during monsoon in Karachi and give rise to further lower values of
α. Over the Indo-Gangetic basin (Kanpur and Gandhi College)
α value is found to increase from premonsoon to winter (
Figure 8(d,e)). Seasonal differences in the magnitudes of
α over the Indo-Gangetic basin are not quite strong as compared to the other three locations in the west. Higher
α during postmonsoon and winter over the Indo-Gangetic basin arise due to the increase in the abundance of fine mode aerosols contributed mainly by anthropogenic activities, and atmospheric dynamics (shallow boundary layer and colder temperatures help trap the aerosols).
Figure 8.
Ångström coefficients α and β (Equation (3)) derived from the aerosol optical depths measured in the 0.38–0.87 μm wavelength region over (a) Ahmedabad; and (b) Gurushikhar; (c) Karachi; (d) Kanpur; and (e) Gandhi College during 2006–2008 for different seasons. Vertical bars indicate ±1σ deviation from the seasonal mean. Seasonal mean AOD ratio (=0.38 μm AOD/0.87 μm AOD) is also plotted.
The
α values during postmonsoon and winter are higher than those obtained during premonsoon and monsoon in all the locations during 2006–2008 (
Table 2). However, the magnitude of seasonal differences exhibit spatial variation. The higher
α values (≥1) suggest the dominance of fine mode aerosols, mainly from anthropogenic activities (fossil and bio fuel emissions);
α values lower than 1 indicate the dominance and/or contribution of coarse mode particles from natural sources (dust and sea salt) [
35]. While higher
α values in the study locations can be attributed to the dominance of fine mode aerosols over urban areas (Ahmedabad and Kanpur), dust and sea salt aerosols also contribute and dominate (Gurushikhar, Kanpur and Karachi). The
β is anti-correlated with
α over Karachi;
β decreases during post-monsoon and winter while
α increases. This feature is seen in all the study locations, but this anti-correlation feature is more evident and significant over Karachi.
Table 2.
Ångström exponent (α) and ±1σ standard deviation derived from spectral aerosol optical depths measured in the 0.38–0.87 μm wavelength region over Ahmedabad, Gurushikhar, Karachi, Kanpur and Gandhi College. α values correspond to 2007 unless otherwise stated.
Table 2.
Ångström exponent (α) and ±1σ standard deviation derived from spectral aerosol optical depths measured in the 0.38–0.87 μm wavelength region over Ahmedabad, Gurushikhar, Karachi, Kanpur and Gandhi College. α values correspond to 2007 unless otherwise stated.
| Seasons | Ahmedabad | Gurushikhar | Karachi | Kanpur | Gandhi College |
|---|
| Winter | 1.38 ± 0.32 | 1.03 ± 0.20 | 0.80 ± 0.26 | 1.23 ± 0.21 | 1.37 ± 0.10 |
| Premonsoon | 0.52 ± 0.28 | 0.23 ± 0.18 | 0.46 ± 0.17 | 0.77 ± 0.29 | 0.96 ± 0.30 |
| Monsoon | 0.93 ± 0.37 | | 0.36 ± 0.13 | 0.45 ± 0.13 | 0.91 ± 0.28 |
| Postmonsoon | 0.95 ± 0.24 | 1.05 ± 0.30 | 1.04 ± 0.12 | 1.16 ± 0.19 | 1.31 ± 0.14 |
AOD ratio, indicative of the dominance of fine or coarse mode aerosols, is found to show seasonal and spatial variations corroborating the results obtained on AODs (
Table 3). A higher AOD ratio over Ahmedabad when compared to Gurushikhar indicates that fine mode aerosols are less abundant over Gurushikhar. Postmonsoon and winter AOD ratios in the study locations are higher than those obtained during premonsoon and monsoon suggesting the abundance of fine mode aerosols during postmonsoon and winter. Monsoon AOD ratios are the lowest in all the locations corroborating the increase and the dominance of coarse mode aerosols (
Table 3). The magnitudes of AOD ratios exhibit spatial differences indicating that the source strengths of fine and/or coarse mode aerosols over these locations vary (higher or lower) during the year (
Table 3). For example, AOD ratios over Gandhi College are higher than Kanpur throughout the year indicating a higher amount of fine mode aerosols in Gandhi College, which is corroborated by higher
α (
Table 2) values. These results from the detailed analysis of spatial, seasonal and inter annual variations in aerosol characteristics (
Table 1,
Table 2 and
Table 3) over five locations in South Asia highlight the spatial and seasonal variabilities in the contribution of fine and coarse mode particles from different aerosol sources, and the influence of meteorology including the effect of long range transport.
Table 3.
Seasonal mean aerosol optical depth (AOD) ratio (=0.38 μm AOD/0.87 μm AOD) determined from aerosol optical depths measured using hand held sun photometer and Microtops over Ahmedabad and Gurushikhar, and from AERONET over Karachi, Kanpur and Gandhi College during 2006–2008. Seasonal mean AODs correspond to year 2007 unless otherwise mentioned.
| Seasons | Ahmedabad | Gurushikhar | Karachi | Kanpur | Gandhi College |
|---|
| Winter | 2.9 | 2.3 | 1.9 | 2.7 | 3.0 |
| Premonsoon | 1.7 | 1.1 | 1.4 | 1.9 | 2.2 |
| Monsoon | 1.5 | | 1.3 | 1.4 | 2.0 |
| Postmonsoon | 2.1 | 2.2 | 2.4 | 2.6 | 2.9 |
5.3. Comparison of Ground-Based and Satellite AODs
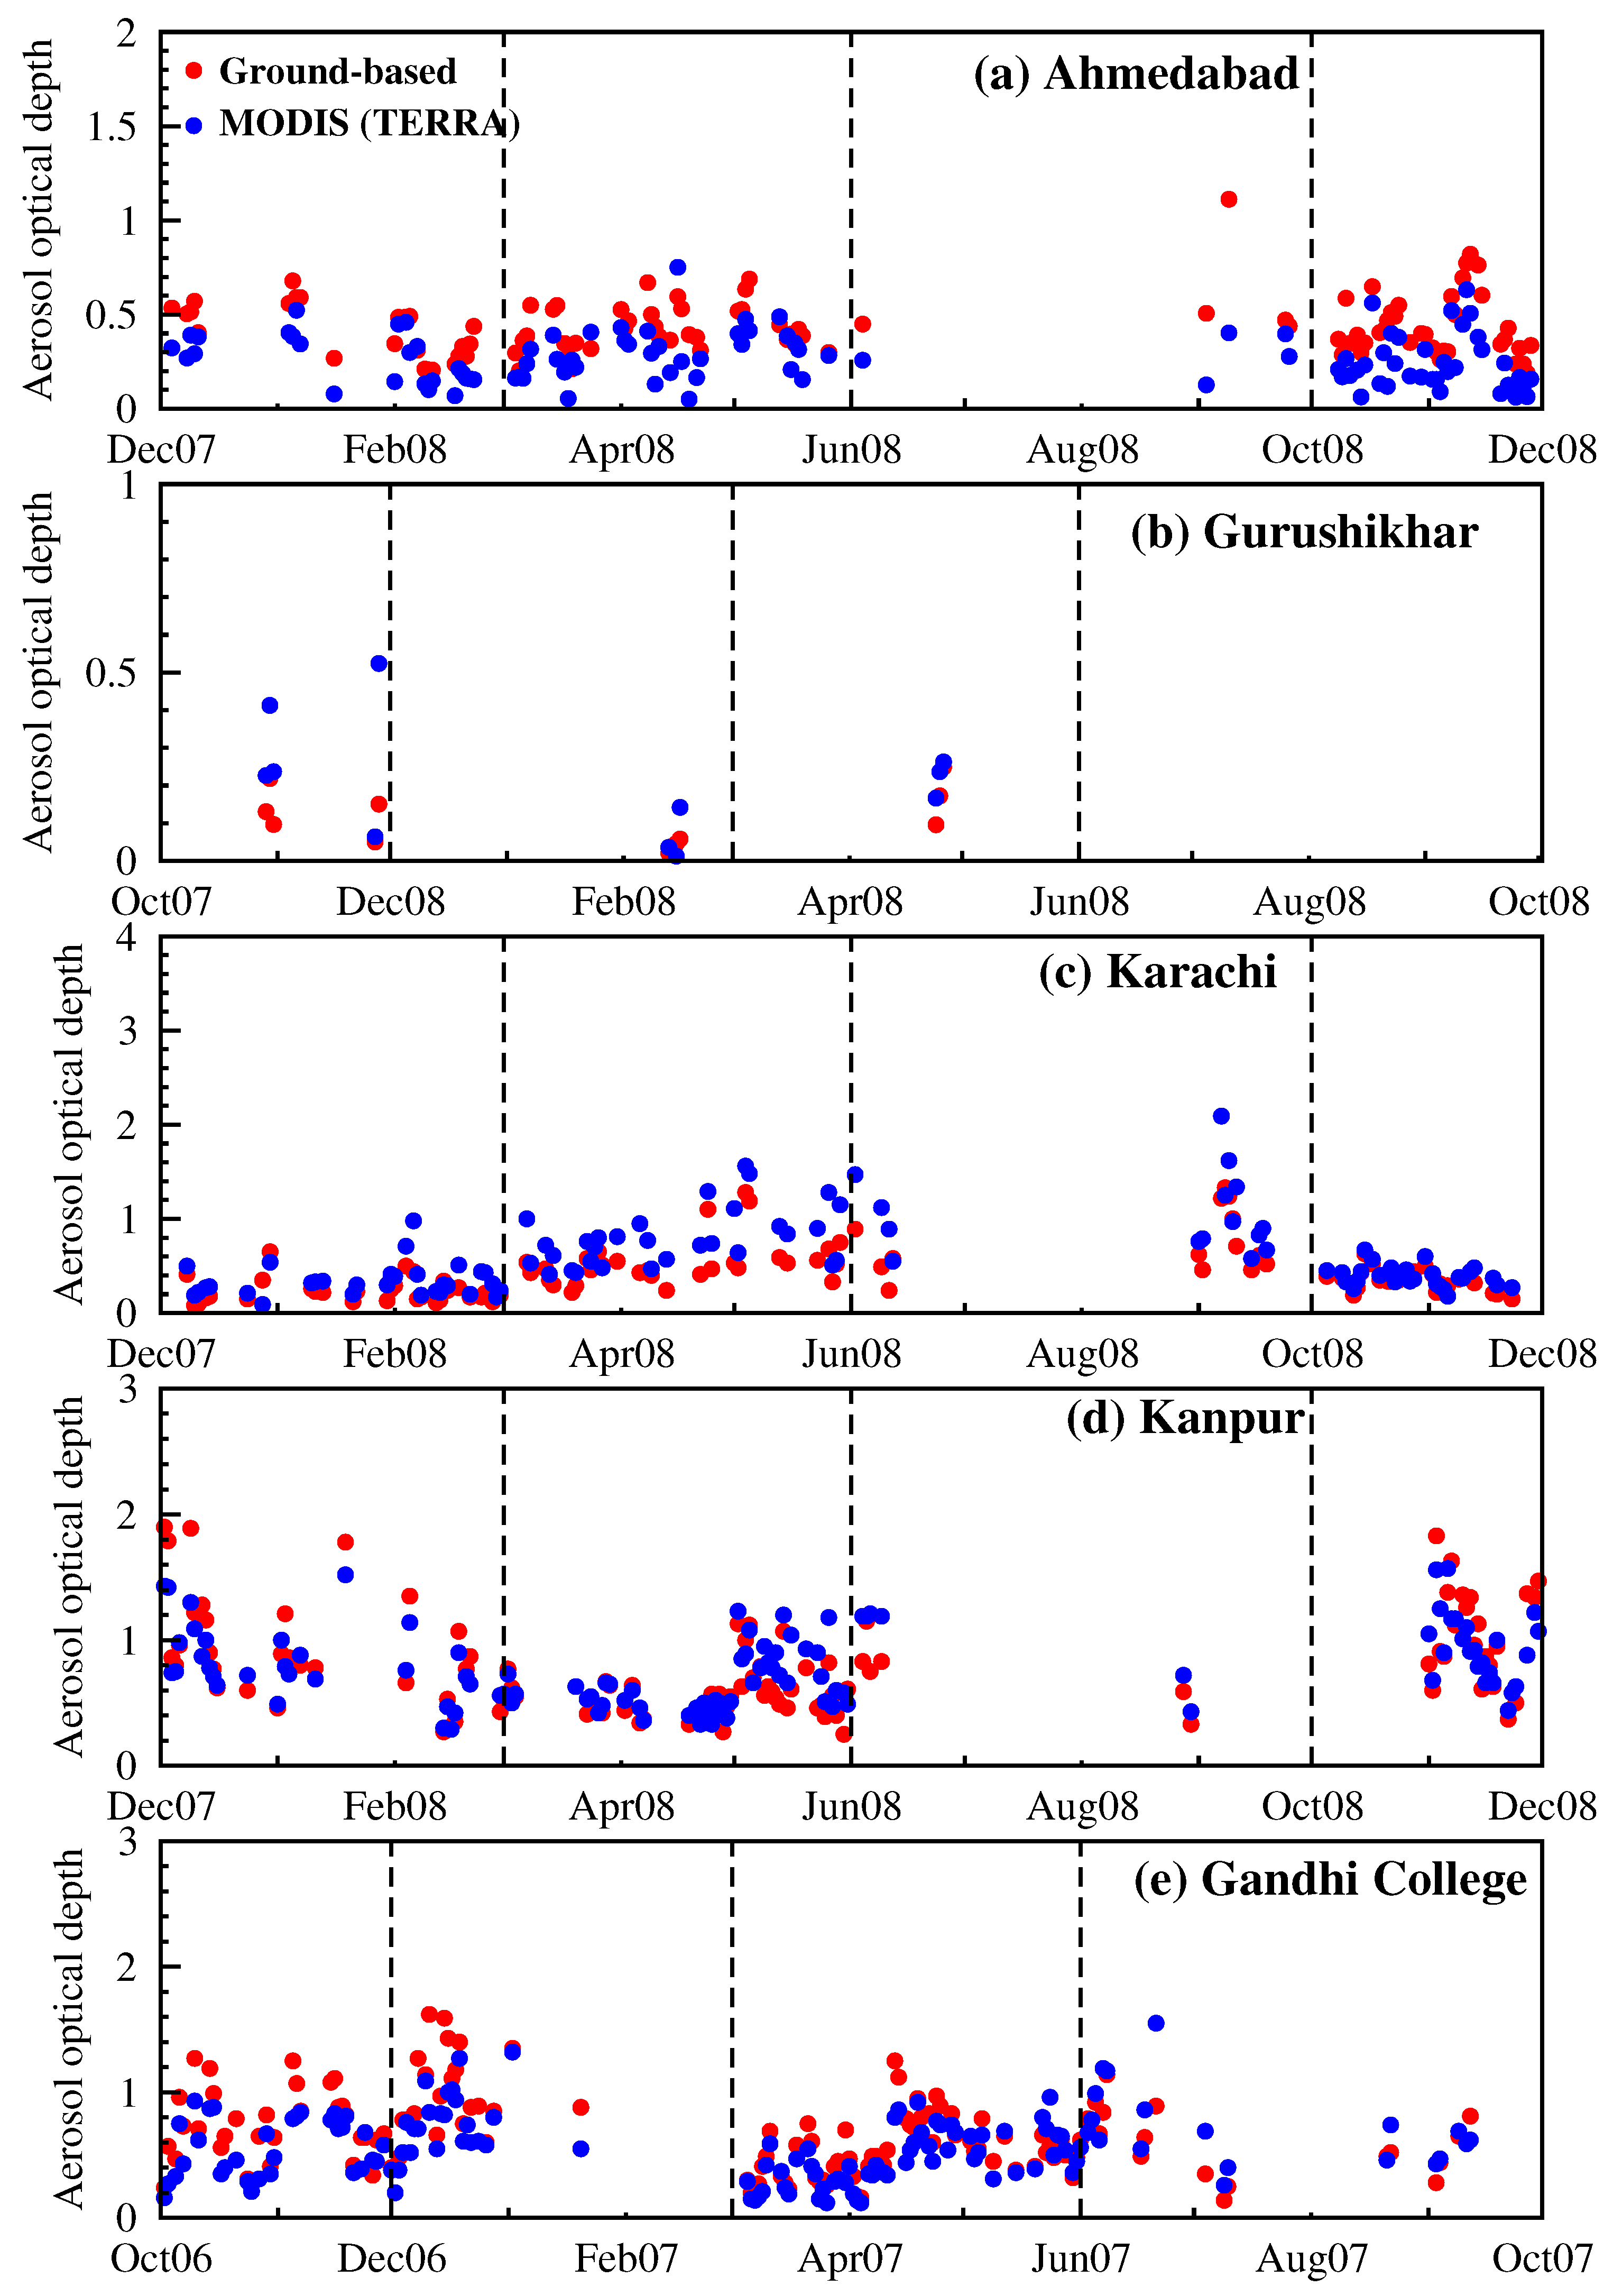
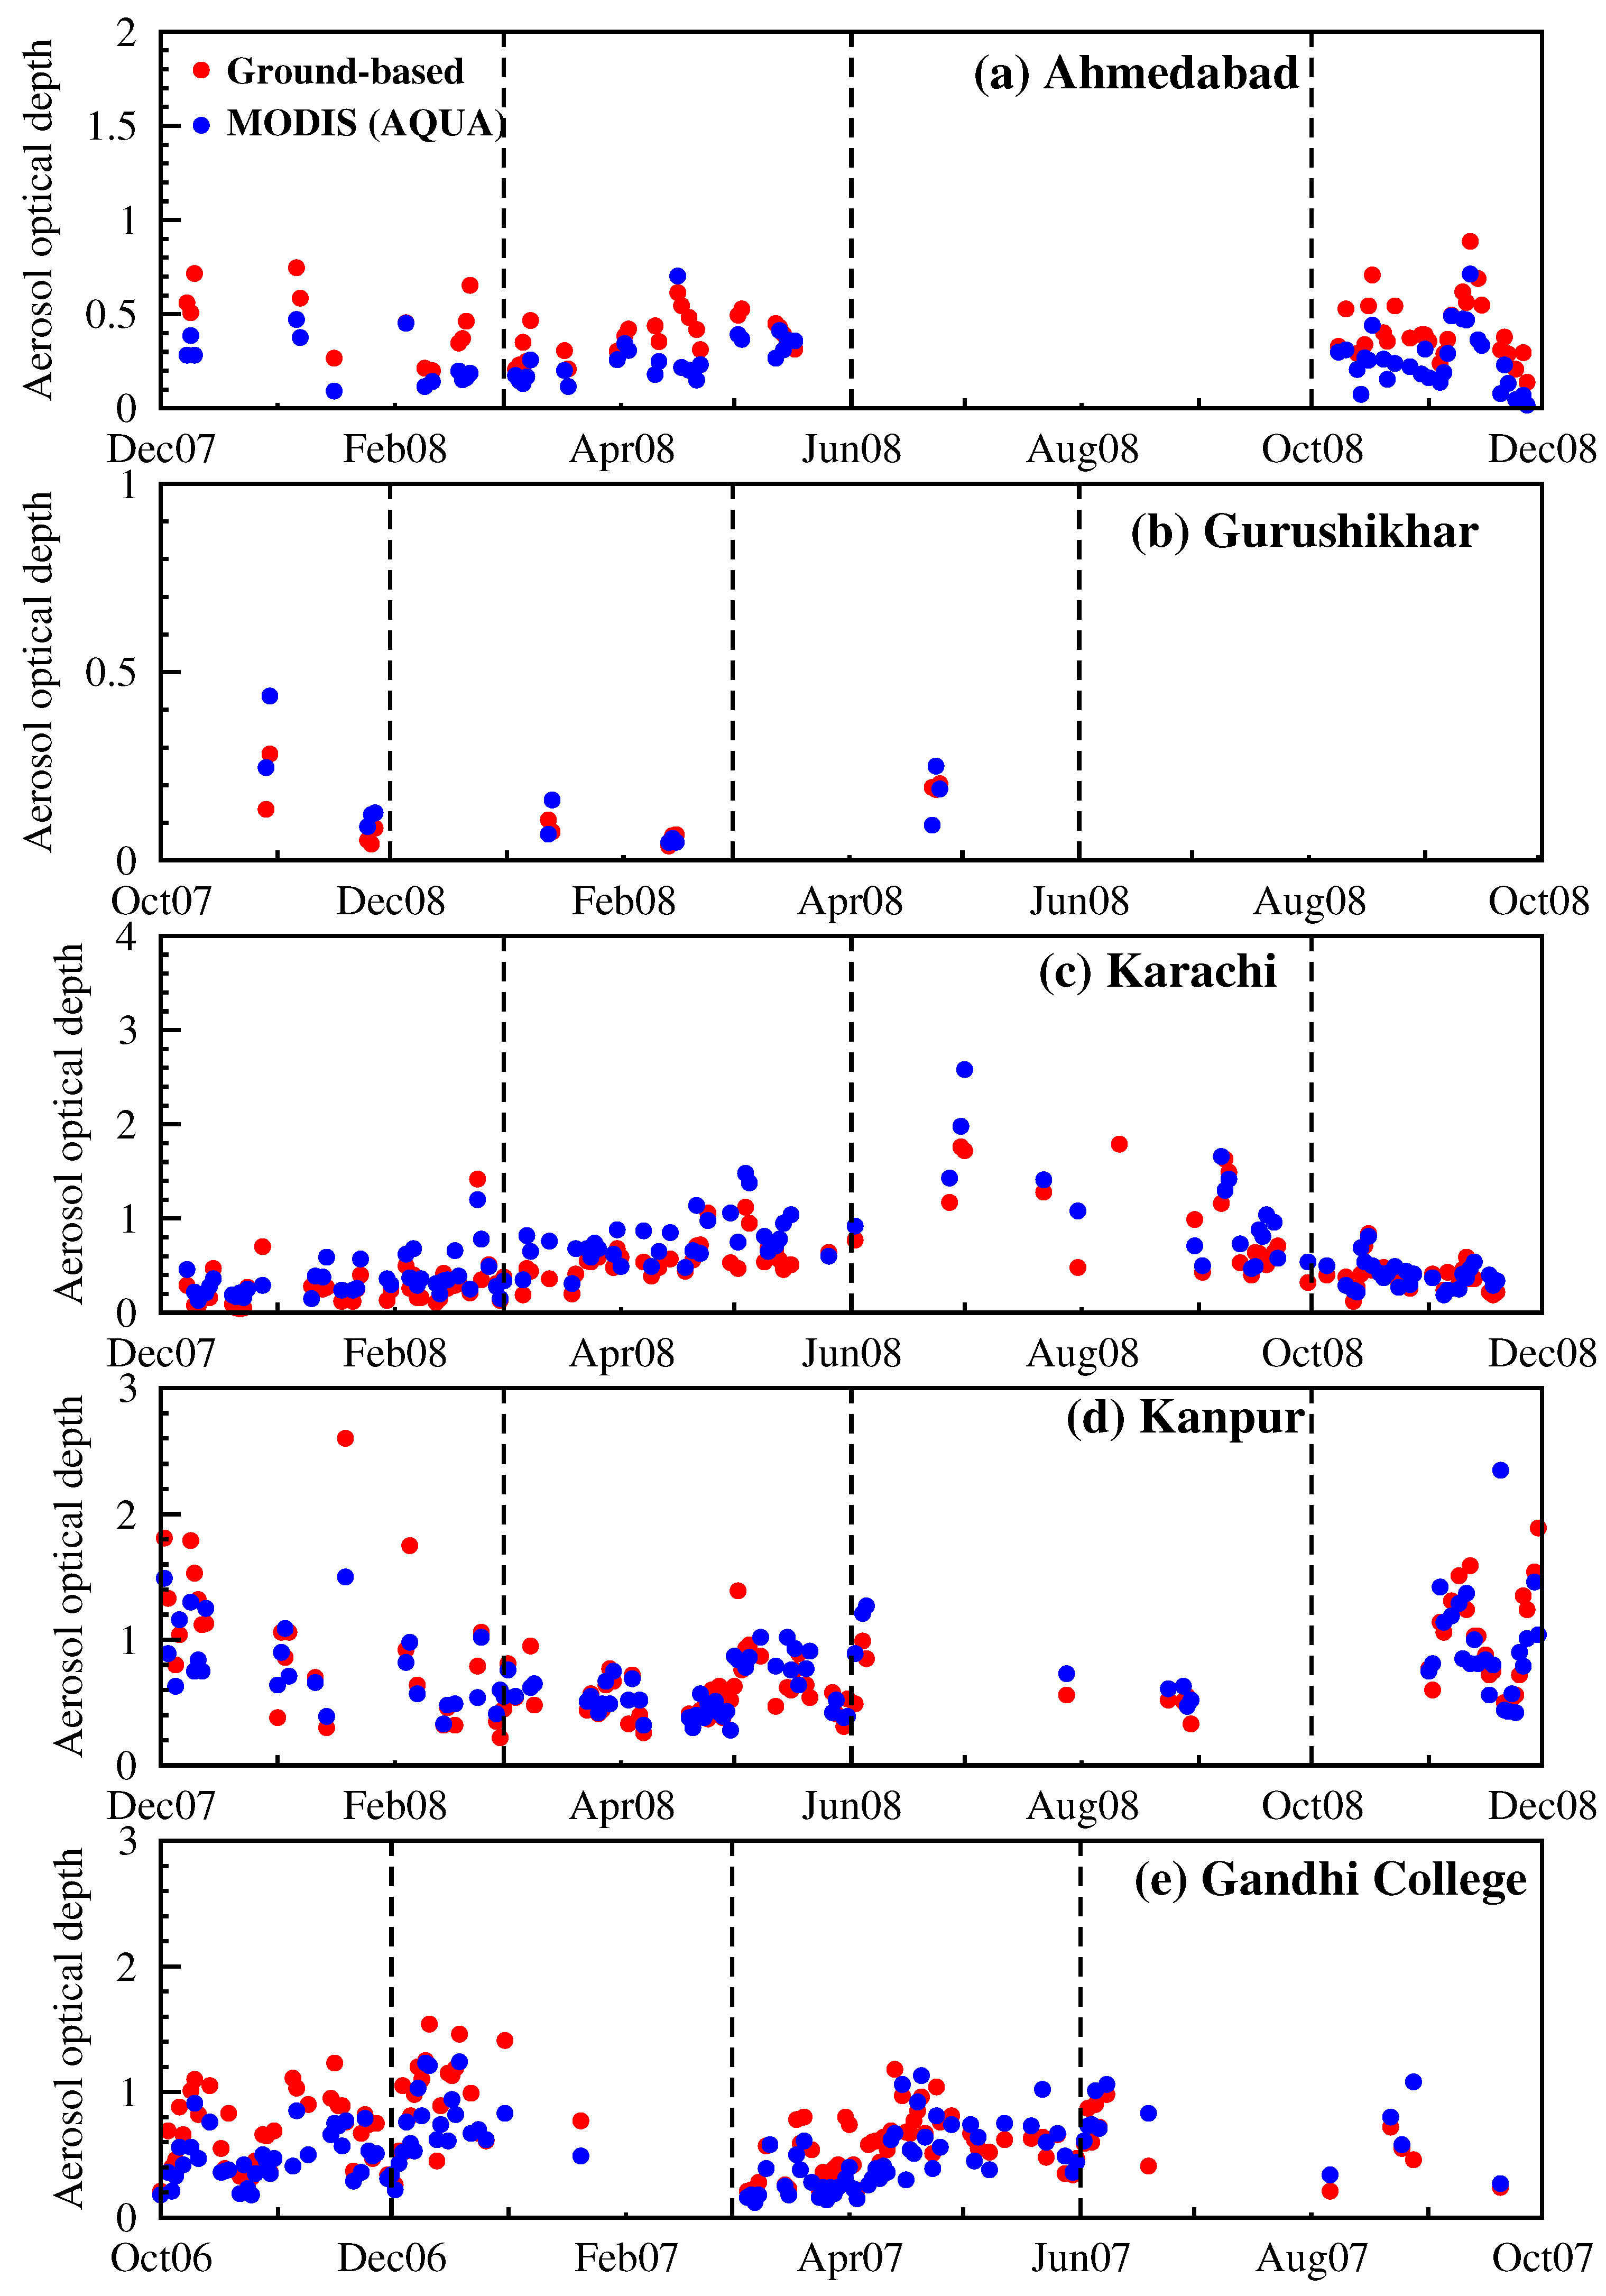
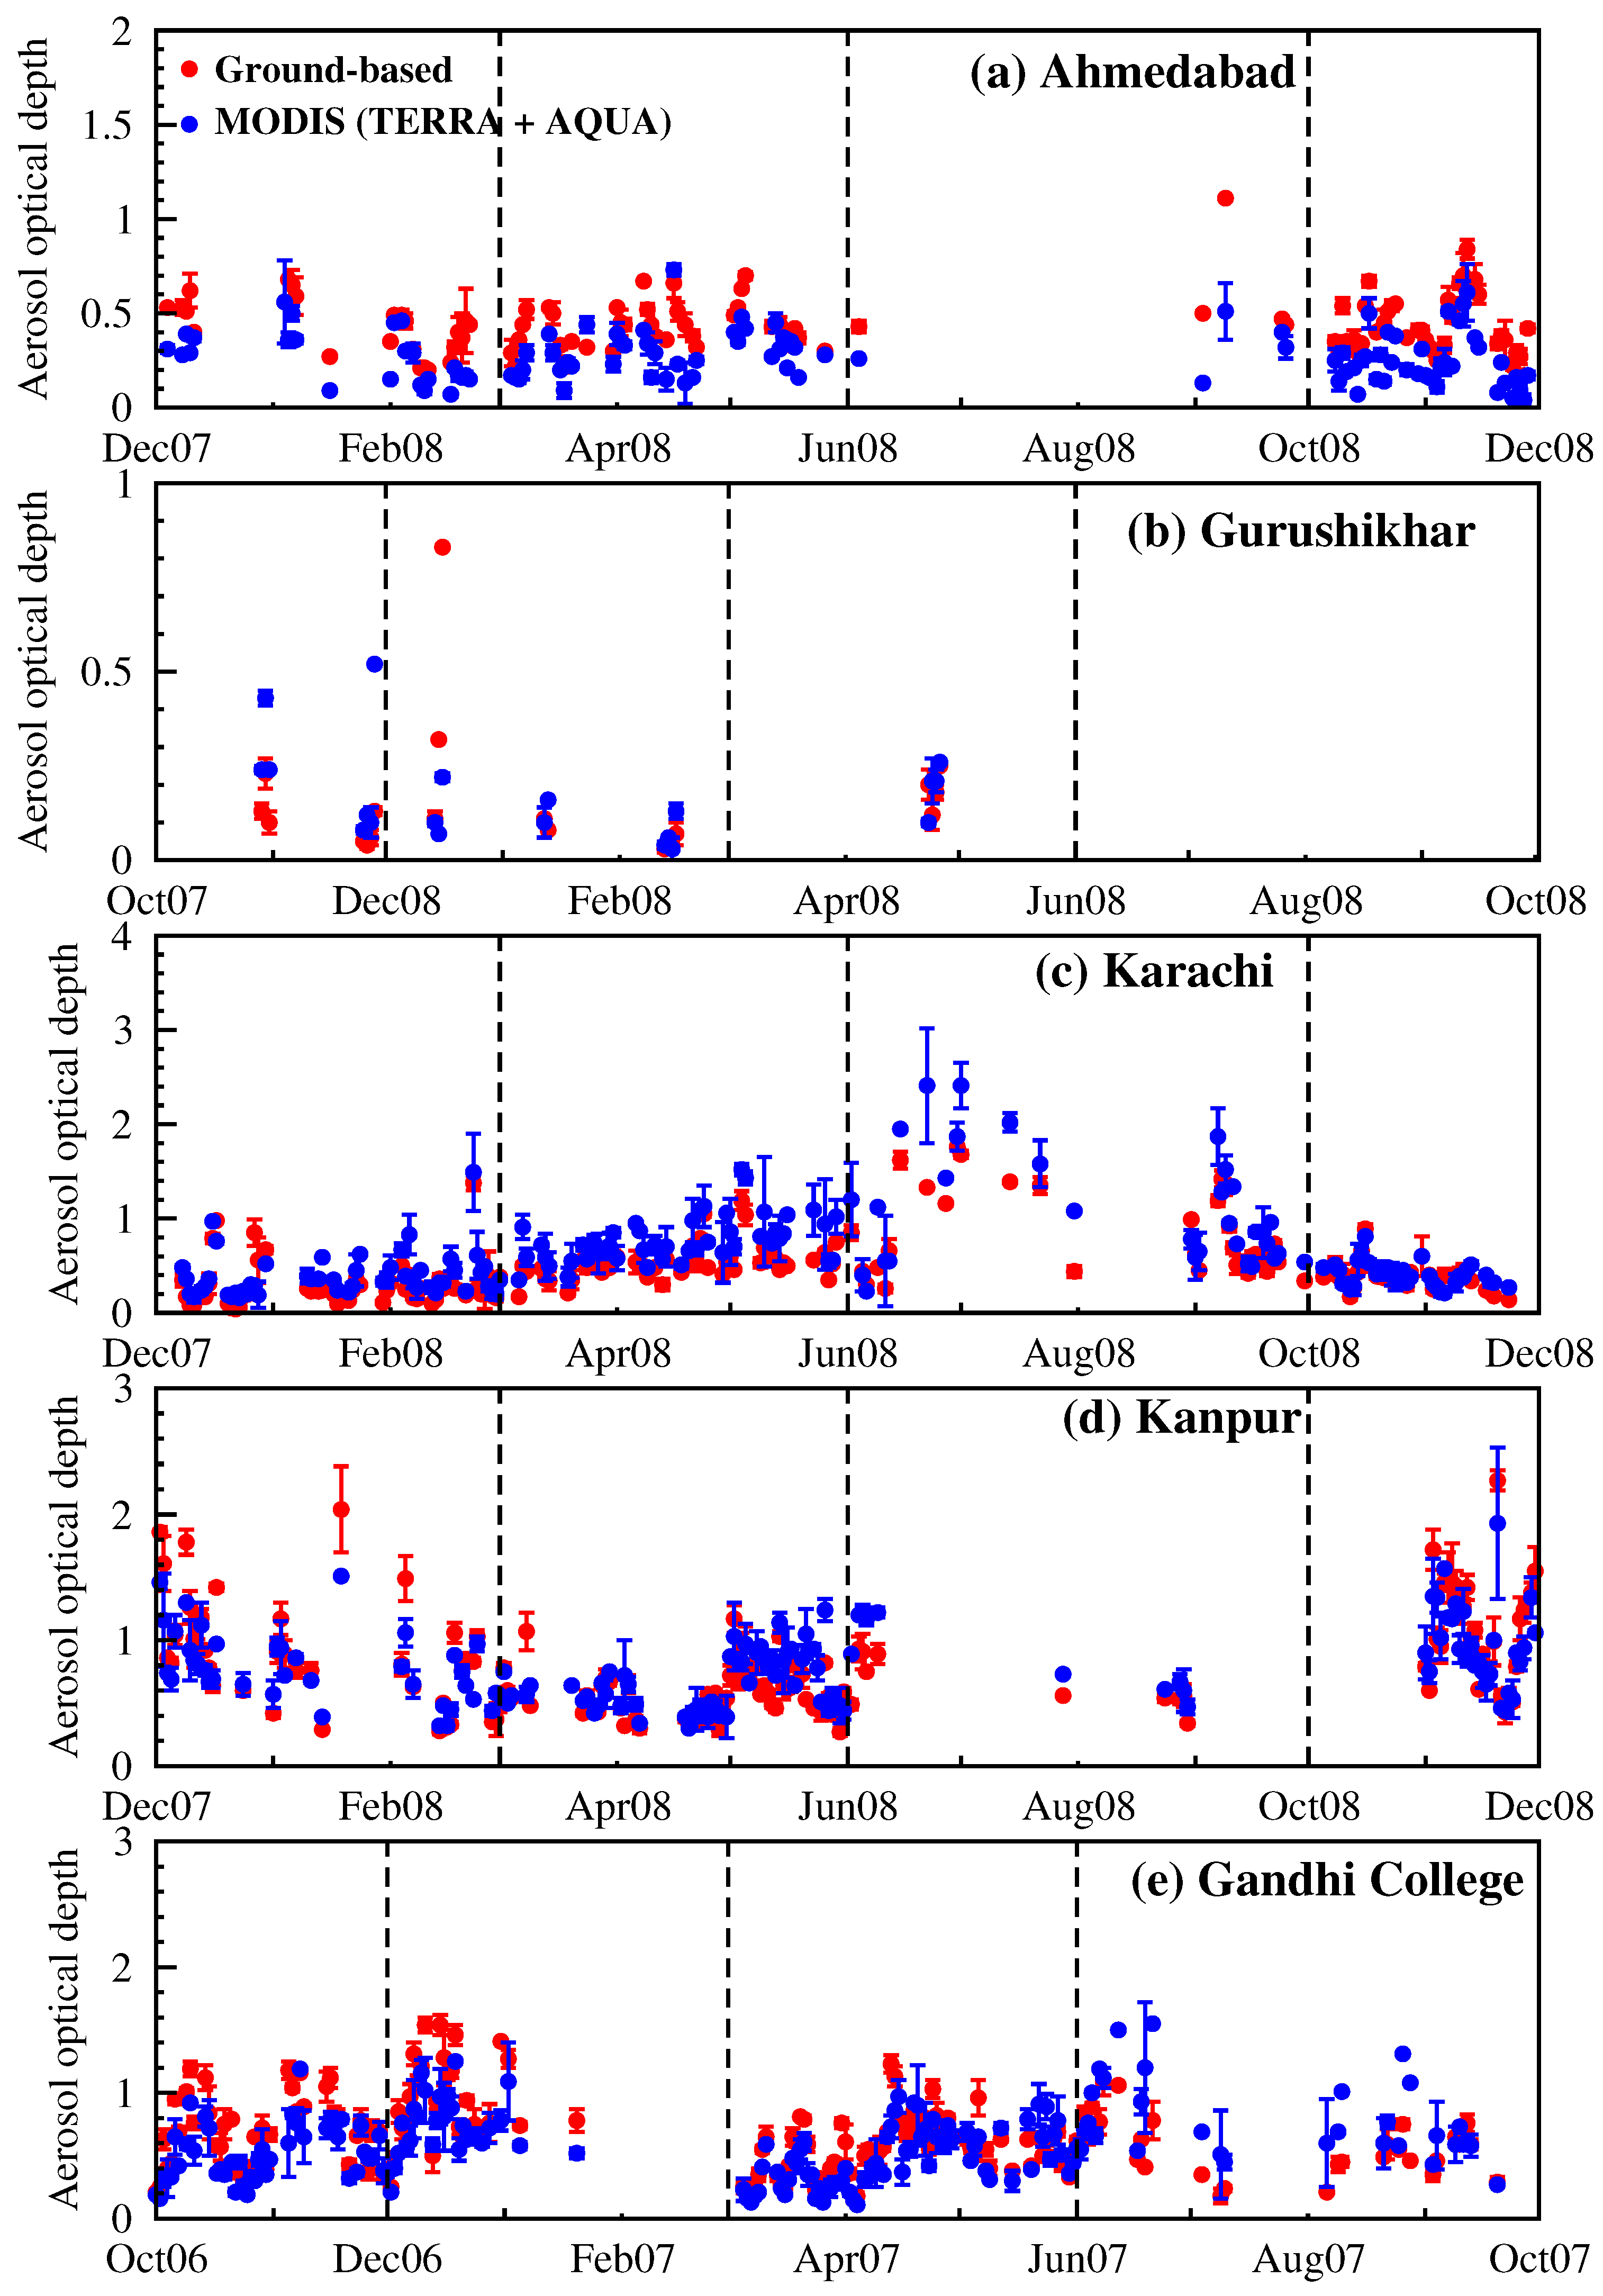
Daily values of ground-based sun photometer AODs are compared with MODIS Terra and Aqua AODs in
Figure 9 and
Figure 10. Since the availability of ground-based AODs at the exact time of Terra and Aqua overpasses which are 10:30 and 13:30 LST respectively is, difficult ground-based sun photometer AODs available within ±5 min of the satellite overpass are used. In
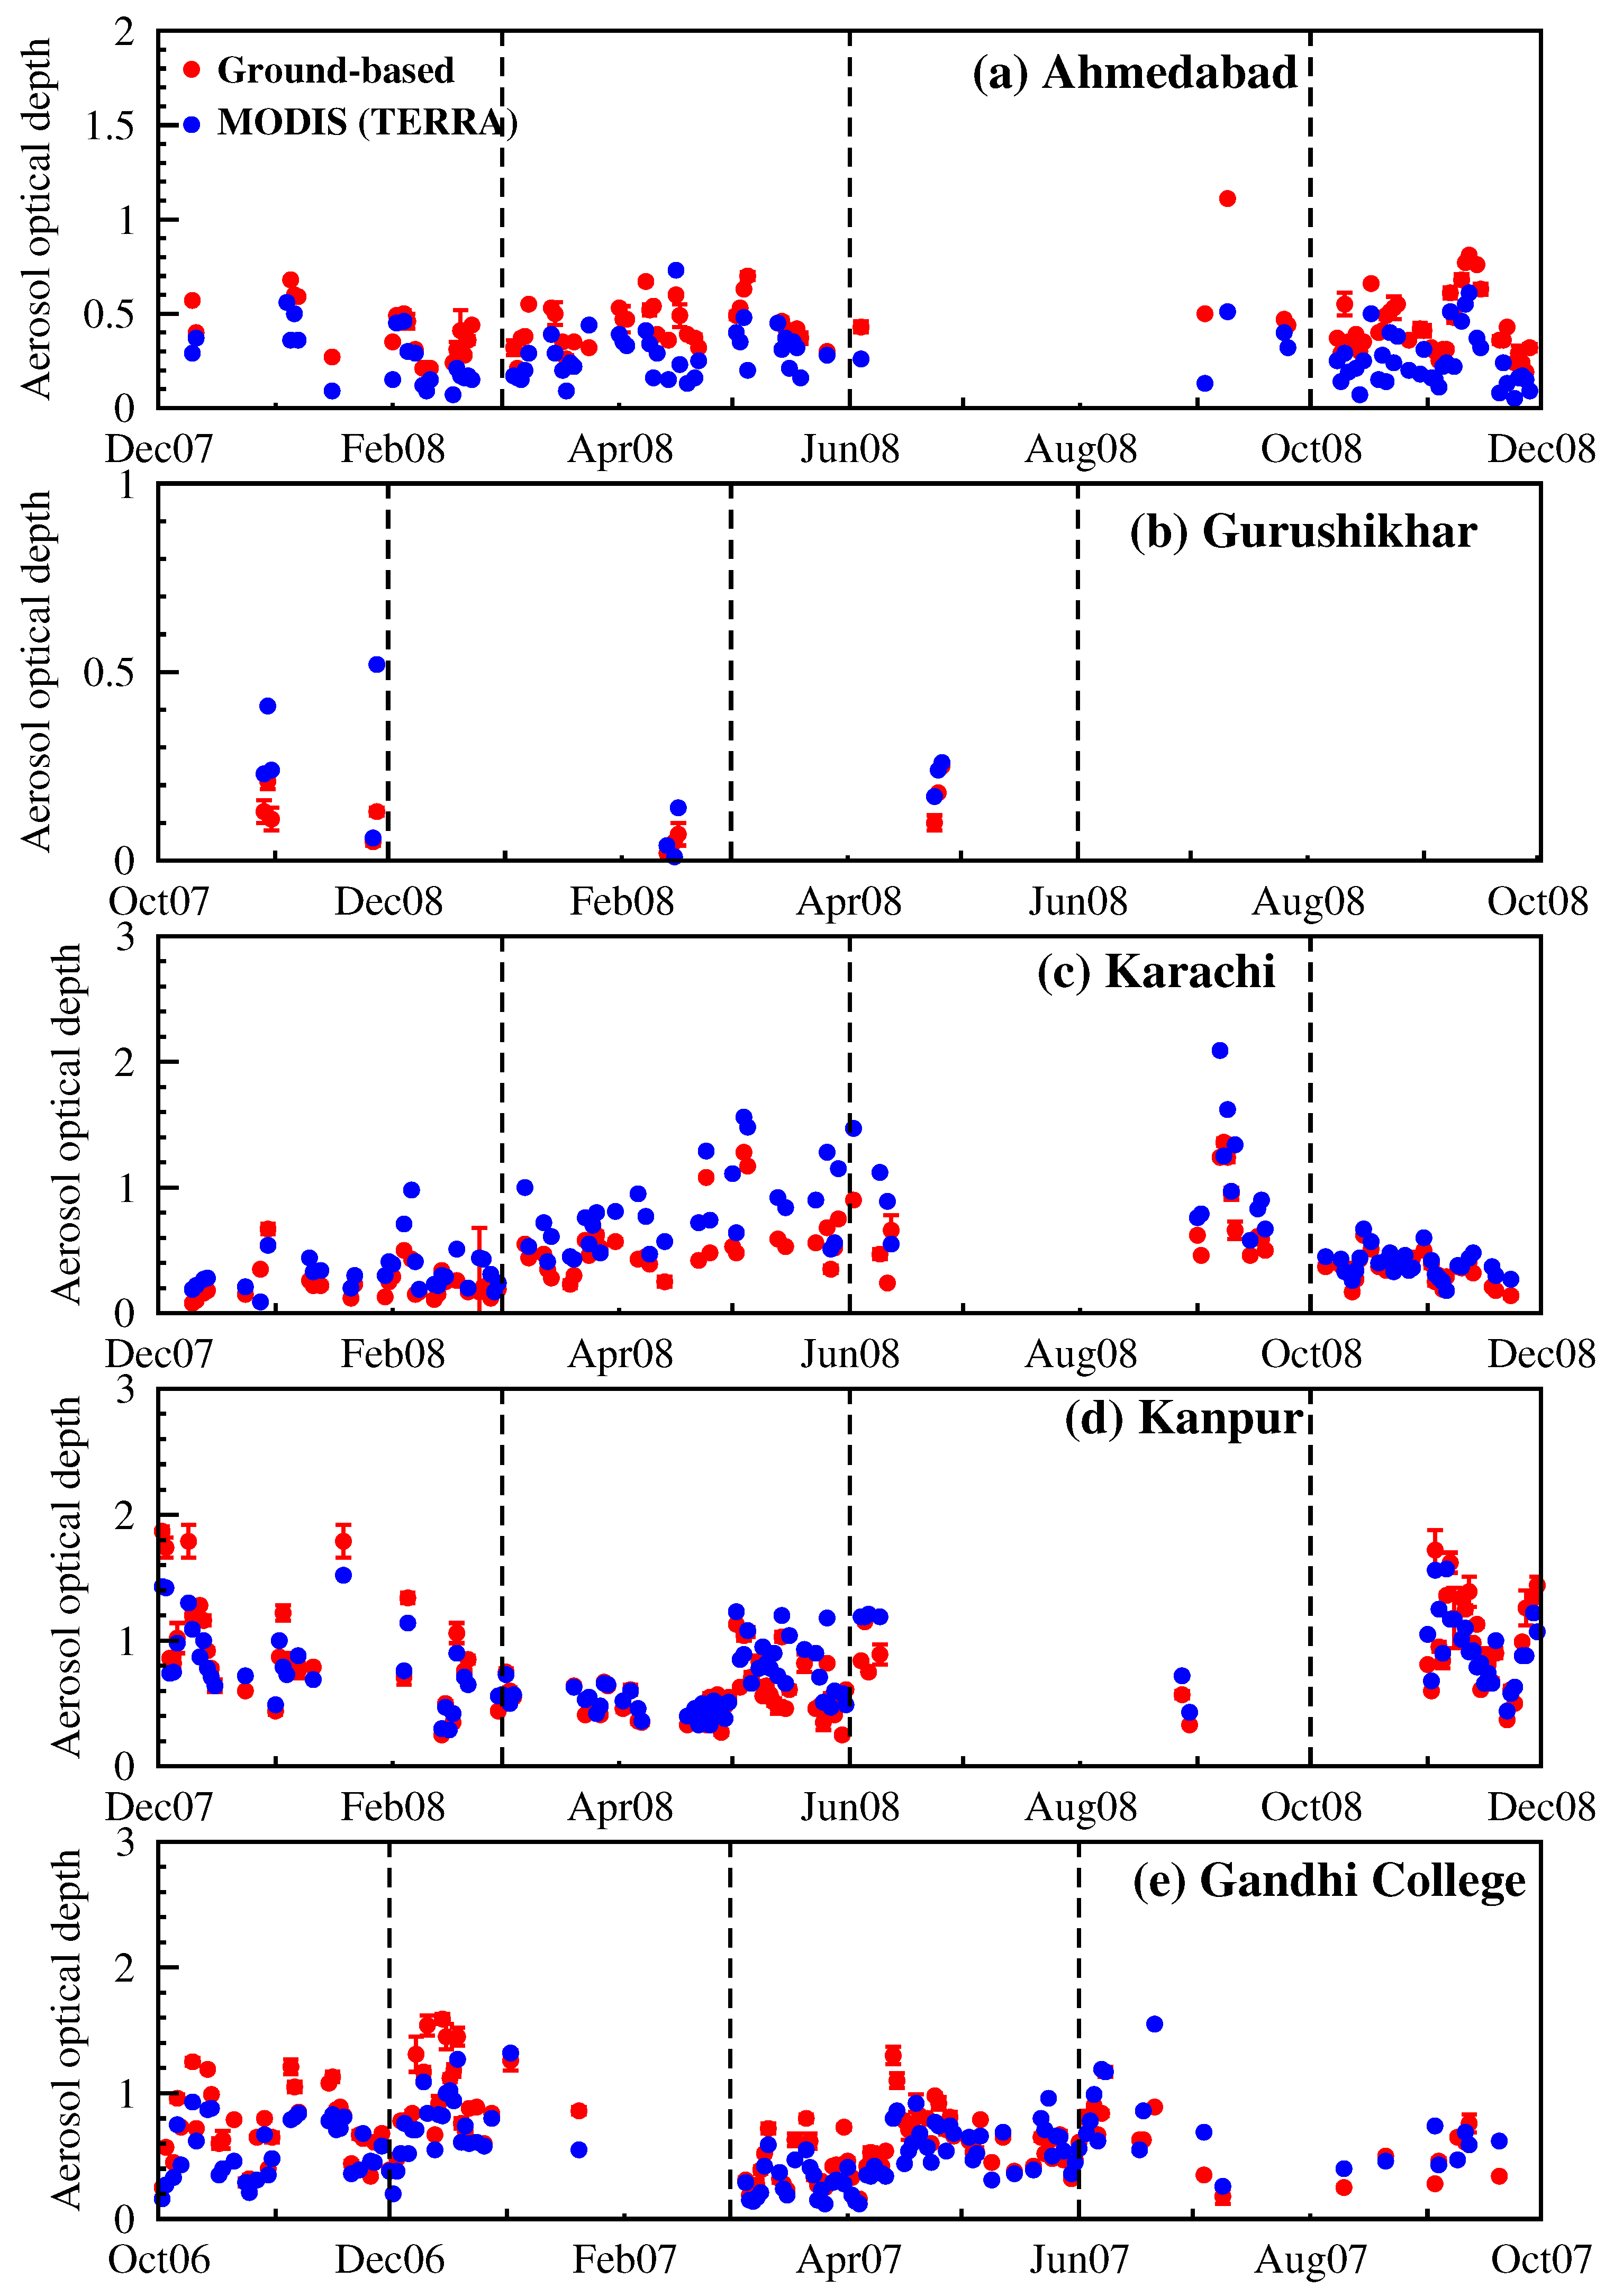
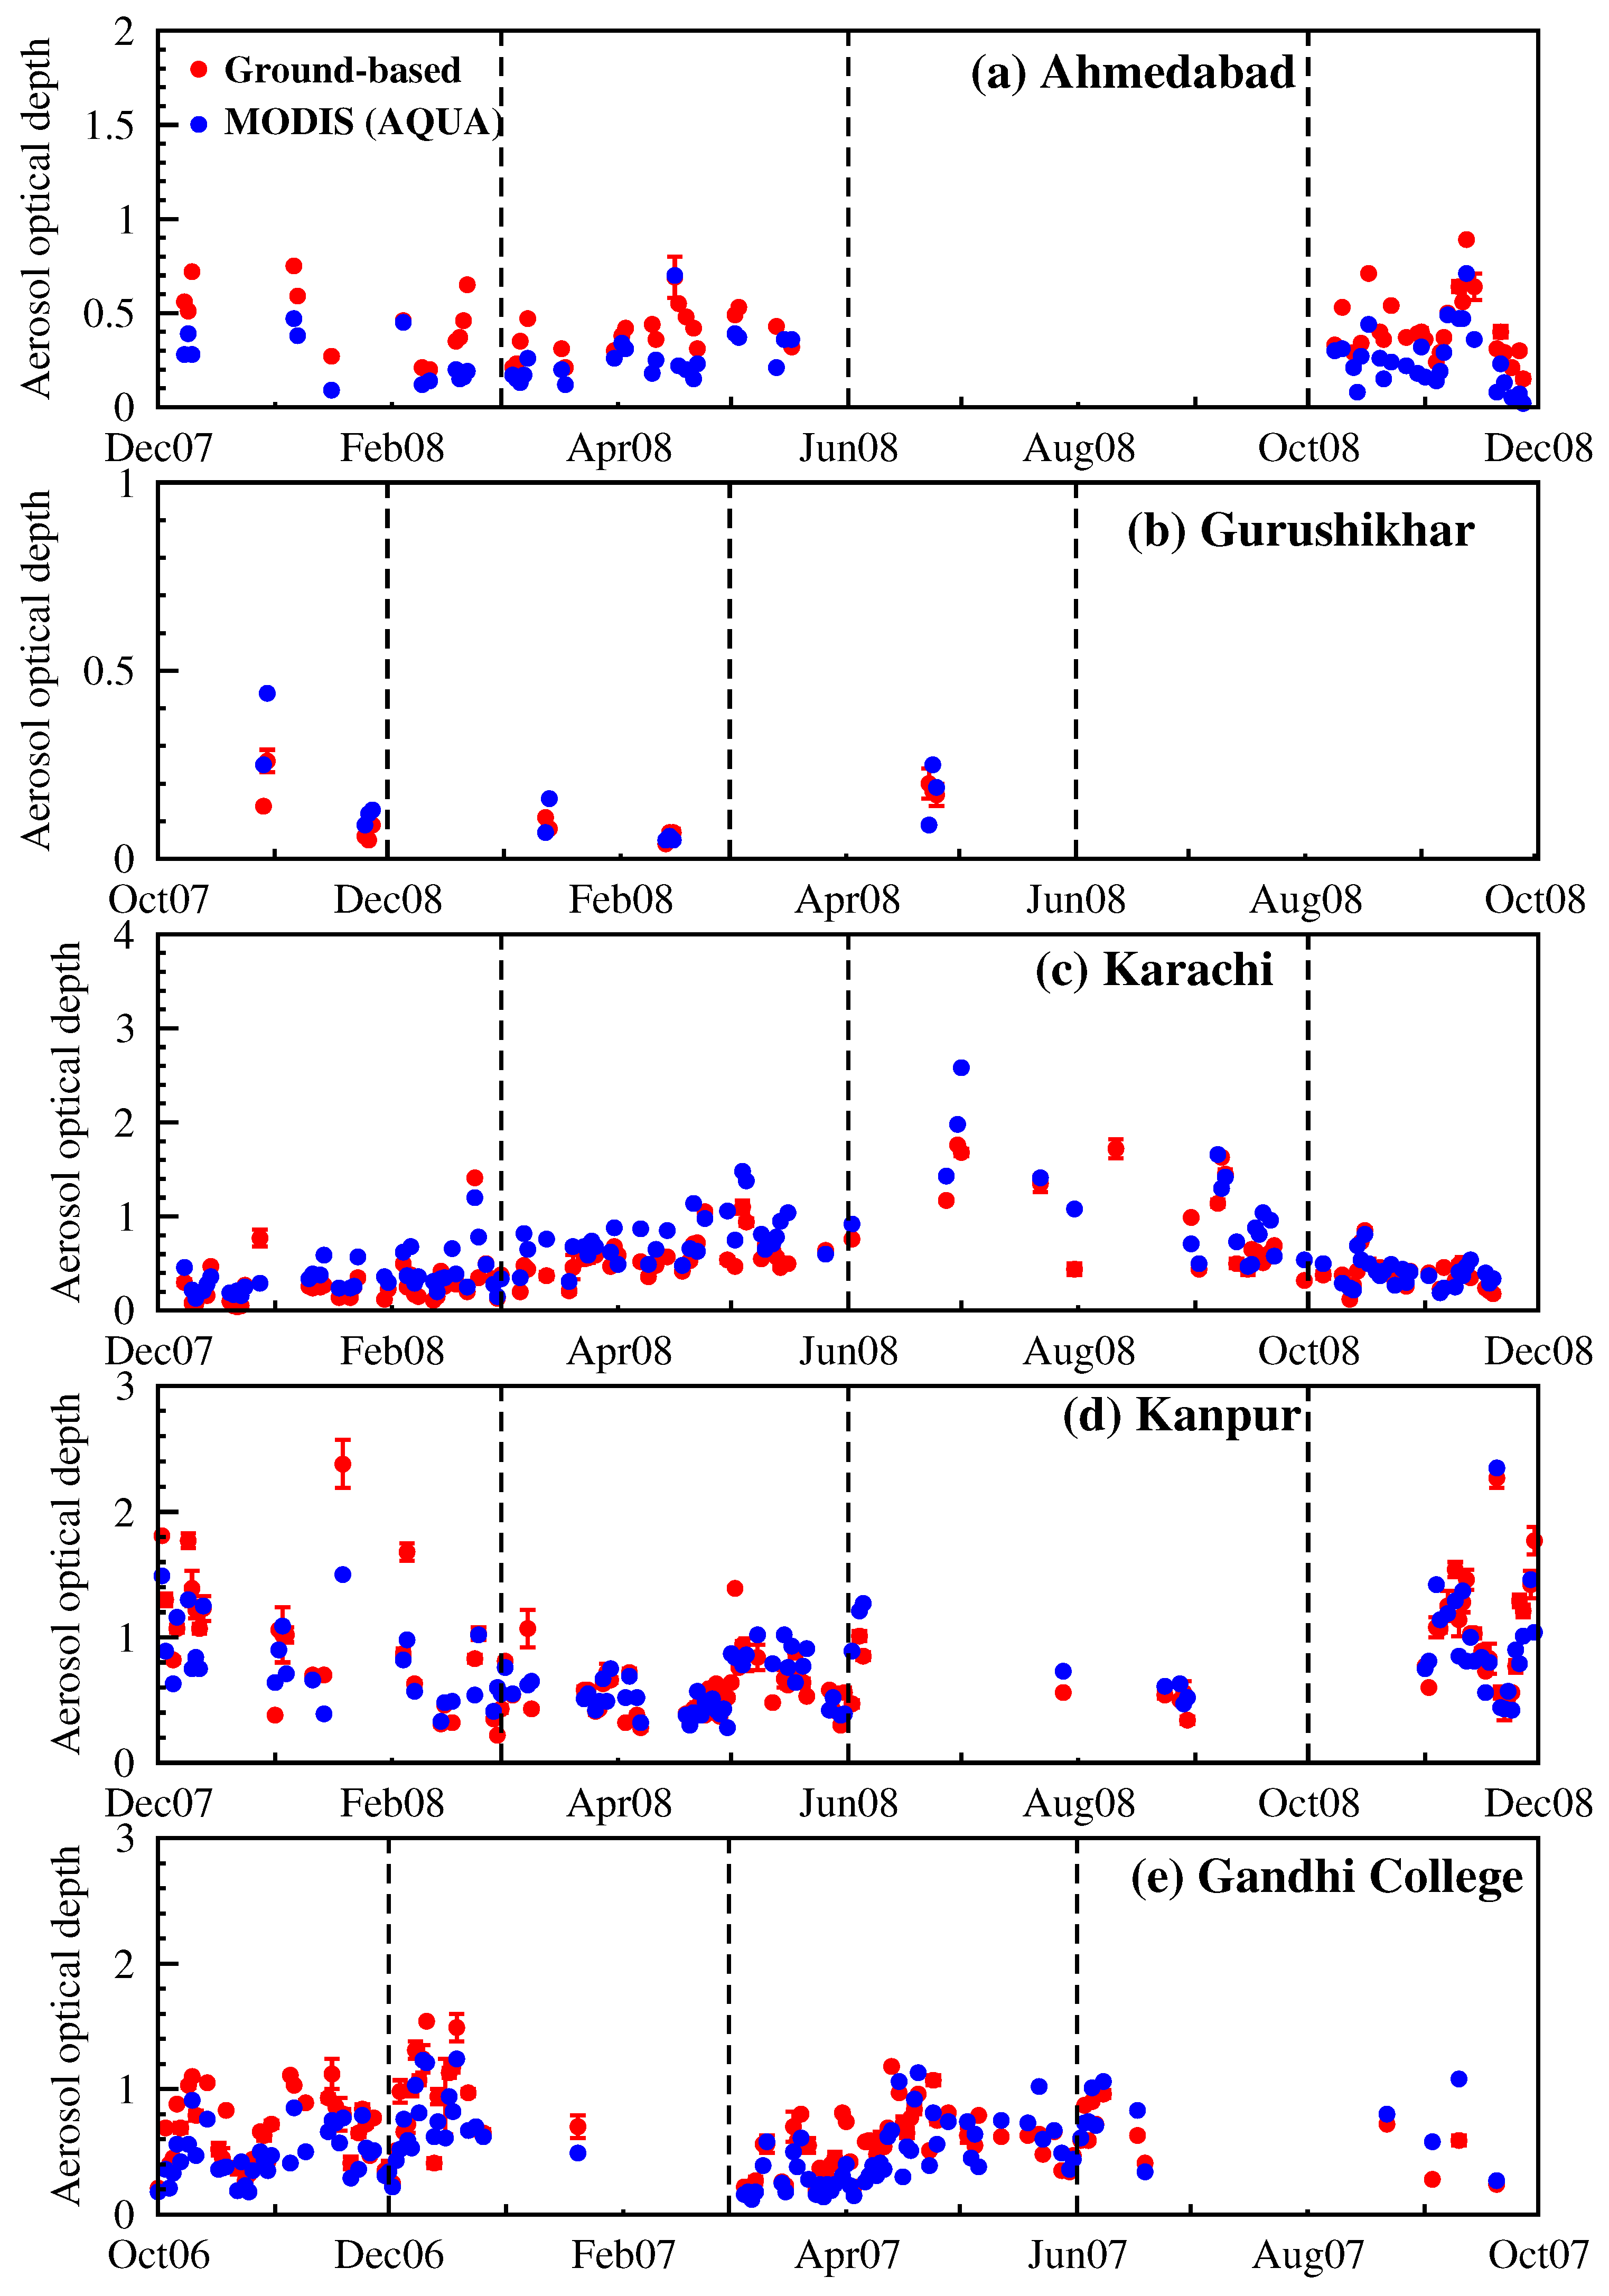
Figure 11 and
Figure 12 ground-based sun photometer AODs averaged during the ±42 min time frame of Terra and Aqua overpasses are compared with Terra and Aqua AODs as a function of season. At the outset, there are no visible differences in seasonal variations in the comparison figures between ground-based AODs measured within ±5 min interval and those that are averaged within the ±42 min with respect to Terra and Aqua AODs (
Figure 9,
Figure 10,
Figure 11 and
Figure 12,
Table 4). This analysis confirms that (i) aerosol optical characteristics do not change significantly within an hour over the observation site (variation within an hour is quite less); (ii) much of the diurnal AOD variation is captured well by the two MODIS instruments during their overpass times and (iii) the temporal difference between the ground-based and remote sensing measurements contributes negligibly to the observed variations/differences in aerosol optical characteristics. The results show that mean of Terra + Aqua AOD may adequately represent the daily mean (
Figure 13). Differences in MODIS Terra and Aqua, and MISR AOD values with respect to those obtained from the ground-based measurements are given in
Table 4 and
Table 5. Over Ahmedabad Terra, Aqua and MISR underestimate the AODs (∼0.05) (
Table 5); and the underestimation (∼0.10) is more on seasonal time scales (
Table 4). On an annual mean (2006–2008) scale, MODIS and MISR underestimate over Gurushikhar, a high altitude site (
Table 5), while on a seasonal mean basis MODIS Terra underestimates, while Aqua overestimates during winter (
Table 4). In Karachi, MODIS overestimates in different seasons (
Table 4) and on annual mean basis by about 0.14, while MISR underestimates by about 0.06 (
Table 5). In Kanpur and Gandhi College, located in the Indo-Gangetic Plain, the features differ; MODIS overestimates by about 0.06, while MISR underestimates by 0.17 (
Table 5). In contrast, over Gandhi College, MODIS underestimates AOD by about 0.07, while MISR overestimates by about 0.2. The mean AODs over Kanpur and Gandhi College are >0.6, and the ±1
σ variation is about 20%. These results quantitatively document the differences between ground-based AOD measurements and remote sensing (MODIS and MISR) over distinctly different environments on a variety of temporal scales.
Figure 9.
Aerosol optical depths measured using ground-based sun photometers compared with MODIS Terra retrieved AODs corresponding to 10:30 LST. AODs are measured using indigenously developed hand held sun photometer and Microtops sun photometer over (a) Ahmedabad and (b) Gurushikhar, while (c) Karachi, (d) Kanpur and (e) Gandhi College AODs are measured using AERONET sun/sky radiometers. For comparison AOD data measured within ±5 min of 10:30 LST are used.
Figure 10.
Aerosol optical depths measured using ground-based sun photometers compared with AODs retrieved from MODIS Aqua corresponding to 13:30 LST. AODs are measured using indigenously developed hand held sun photometer and Microtops sun photometer over (a) Ahmedabad and (b) Gurushikhar; while (c) Karachi, (d) Kanpur and (e) Gandhi College AODs are measured using AERONET sun/sky radiometers. For comparison AOD data measured within ±5 min of 13:30 LST are used.
Figure 11.
Daily aerosol optical depths measured using ground-based sun photometers compared with MODIS Terra AODs at each study location. AODs are measured using indigenously developed hand held sun photometer and Microtops sun photometer over (a) Ahmedabad and (b) Gurushikhar, while (c) Karachi, (d) Kanpur and (e) Gandhi College AODs are measured using AERONET sun/sky radiometers. For the intercomparison of MODIS and sun photometer AODs the ground based AODs measured between 09:48 and 11:12 LST (corresponding to Terra) taking into account the longitudinal dependence are averaged and drawn.
Figure 12.
Daily aerosol optical depths measured using ground-based sun photometers compared with MODIS Aqua AODs at each study location. AODs are measured using indigenously developed hand held sun photometer and Microtops sun photometer over (a) Ahmedabad and (b) Gurushikhar, while (c) Karachi, (d) Kanpur and (e) Gandhi College AODs are measured using AERONET sun/sky radiometers. For the intercomparison of MODIS and sun photometer AODs the ground based AODs measured between 12:48 and 14:12 LST (corresponding to Aqua) taking into account the longitudinal dependence are averaged and drawn.
Table 4.
Comparison of seasonal mean AODs in 2006–2008 obtained from ground-based measurements with AODs retrieved from MODIS Terra and Aqua. Ground-based AODs corresponding to within ±5 min of Terra and Aqua overpass times of 10:30 and 13:30 LST, and after averaging the measurements made during ±42 min corresponding to Terra and Aqua satellite pass tracks.
| Source | Ahmedabad |
| | DJF 2007–2008 | MAM 2008 | JJAS 2008 | ON 2008 |
| Ground-based (10:30 ± 5 min) | 0.41 | 0.43 | 0.47 | 0.43 |
| Ground-based (10:30 ± 42 min avg) | 0.41 | 0.43 | 0.46 | 0.43 |
| MODIS (Terra) | 0.27 | 0.30 | 0.33 | 0.30 |
| Ground-based (13:30 ± 5 min) | 0.47 | 0.39 | | 0.42 |
| Ground-based (13:30 ± 42 min avg) | 0.47 | 0.40 | | 0.41 |
| MODIS (Aqua) | 0.27 | 0.27 | | 0.28 |
| | Gurushikhar |
| | DJF 2008 | MAM 2008 | JJAS 2008 | ON 2007 |
| Ground-based (10:30 ± 5 min) | 0.23 | 0.17 | | 0.13 |
| Ground-based (10:30 ± 42 min avg) | 0.23 | 0.17 | | 0.13 |
| MODIS (Terra) | 0.10 | 0.22 | | 0.29 |
| Ground-based (13:30 ± 5 min) | 0.08 | 0.20 | | 0.12 |
| Ground-based (13:30 ± 42 min avg) | 0.08 | 0.18 | | 0.12 |
| MODIS (Aqua) | 0.08 | 0.18 | | 0.20 |
| | Karachi |
| | DJF 2007–2008 | MAM 2008 | JJAS 2008 | ON 2008 |
| Ground-based (10:30 ± 5 min) | 0.22 | 0.54 | 0.73 | 0.35 |
| Ground-based (10:30 ± 42 min avg) | 0.23 | 0.54 | 0.73 | 0.35 |
| MODIS (Terra) | 0.34 | 0.80 | 1.03 | 0.39 |
| Ground-based (13:30 ± 5 min) | 0.30 | 0.56 | 0.93 | 0.39 |
| Ground-based (13:30 ± 42 min avg) | 0.27 | 0.56 | 0.93 | 0.39 |
| MODIS (Aqua) | 0.37 | 0.75 | 1.21 | 0.40 |
| | Kanpur |
| | DJF 2007–2008 | MAM 2008 | JJAS 2008 | ON 2008 |
| Ground-based (10:30 ± 5 min) | 0.79 | 0.57 | 0.75 | 1.03 |
| Ground-based (10:30 ± 42 min avg) | 0.81 | 0.57 | 0.76 | 1.02 |
| MODIS (Terra) | 0.82 | 0.65 | 0.99 | 0.95 |
| Ground-based (13:30 ± 5 min) | 0.81 | 0.59 | 0.60 | 1.09 |
| Ground-based (13:30 ± 42 min avg) | 0.83 | 0.59 | 0.62 | 1.06 |
| MODIS (Aqua) | 0.82 | 0.60 | 0.78 | 0.96 |
| | Gandhi College |
| | DJF 2006–2007 | MAM 2007 | JJAS 2007 | ON 2006 |
| Ground-based (10:30 ± 5 min) | 0.94 | 0.54 | 0.61 | 0.74 |
| Ground-based (10:30 ± 42 min avg) | 0.94 | 0.55 | 0.61 | 0.74 |
| MODIS (Terra) | 0.73 | 0.46 | 0.71 | 0.56 |
| Ground-based (13:30 ± 5 min) | 0.92 | 0.56 | 0.60 | 0.68 |
| Ground-based (13:30 ± 42 min avg) | 0.89 | 0.56 | 0.62 | 0.68 |
| MODIS (Aqua) | 0.72 | 0.46 | 0.73 | 0.47 |
Figure 13.
Diurnal mean aerosol optical depths measured using ground-based sun photometers compared with MODIS Terra and Aqua mean AODs at each study location. AODs are measured using indigenously developed hand held sun photometer and Microtops sun photometer over (a) Ahmedabad and (b) Gurushikhar, while (c) Karachi, (d) Kanpur and (e) Gandhi College AODs are measured using AERONET sun/sky radiometers. For the day to day intercomparison of MODIS and sun photometer AODs the ground based AODs measured between 09:48 and 11:12 LST (corresponding to Terra), and 12:48 and 14:12 LST (corresponding to Aqua) taking into account the longitudinal dependence are averaged and drawn.
Table 5.
Comparison of average (2006–2008) AODs obtained from ground-based measurements with AODs retrieved from MODIS Terra, Aqua, their mean (Terra + Aqua) and MISR. Mean AODs from ground-based measurements corresponding to Terra and Aqua satellite passing times, and the overall mean for 2006–2008 are given. AODs obtained from ground-based measurements are subtracted from MODIS and MISR (2006–2008) mean AODs. A positive value indicates overestimate of AOD by that amount by MODIS/MISR with respect to the ground-based measurement, while a negative value indicates an underestimate.
| Source | Ahmedabad | Gurushikhar | Karachi | Kanpur | Gandhi College |
|---|
| Ground-based (09:42-11:12 h mean) | 0.44 | 0.18 | 0.41 | 0.78 | 0.67 |
| MODIS (Terra) | −0.08 | +0.01 | +0.16 | 0.00 | −0.10 |
| Ground-based (12:48-14:12 h mean) | 0.44 | 0.12 | 0.52 | 0.80 | 0.66 |
| MODIS (Aqua) | −0.08 | +0.03 | +0.14 | −0.05 | −0.13 |
| Ground-based (Mean) | 0.39 ± 0.04 | 0.16 ± 0.08 | 0.46 ± 0.13 | 0.63 ± 0.15 | 0.68 ± 0.13 |
| MODIS (Terra + Aqua) | −0.07 | −0.04 | +0.13 | +0.06 | −0.07 |
| MISR | −0.05 | −0.02 | −0.06 | −0.17 | +0.20 |
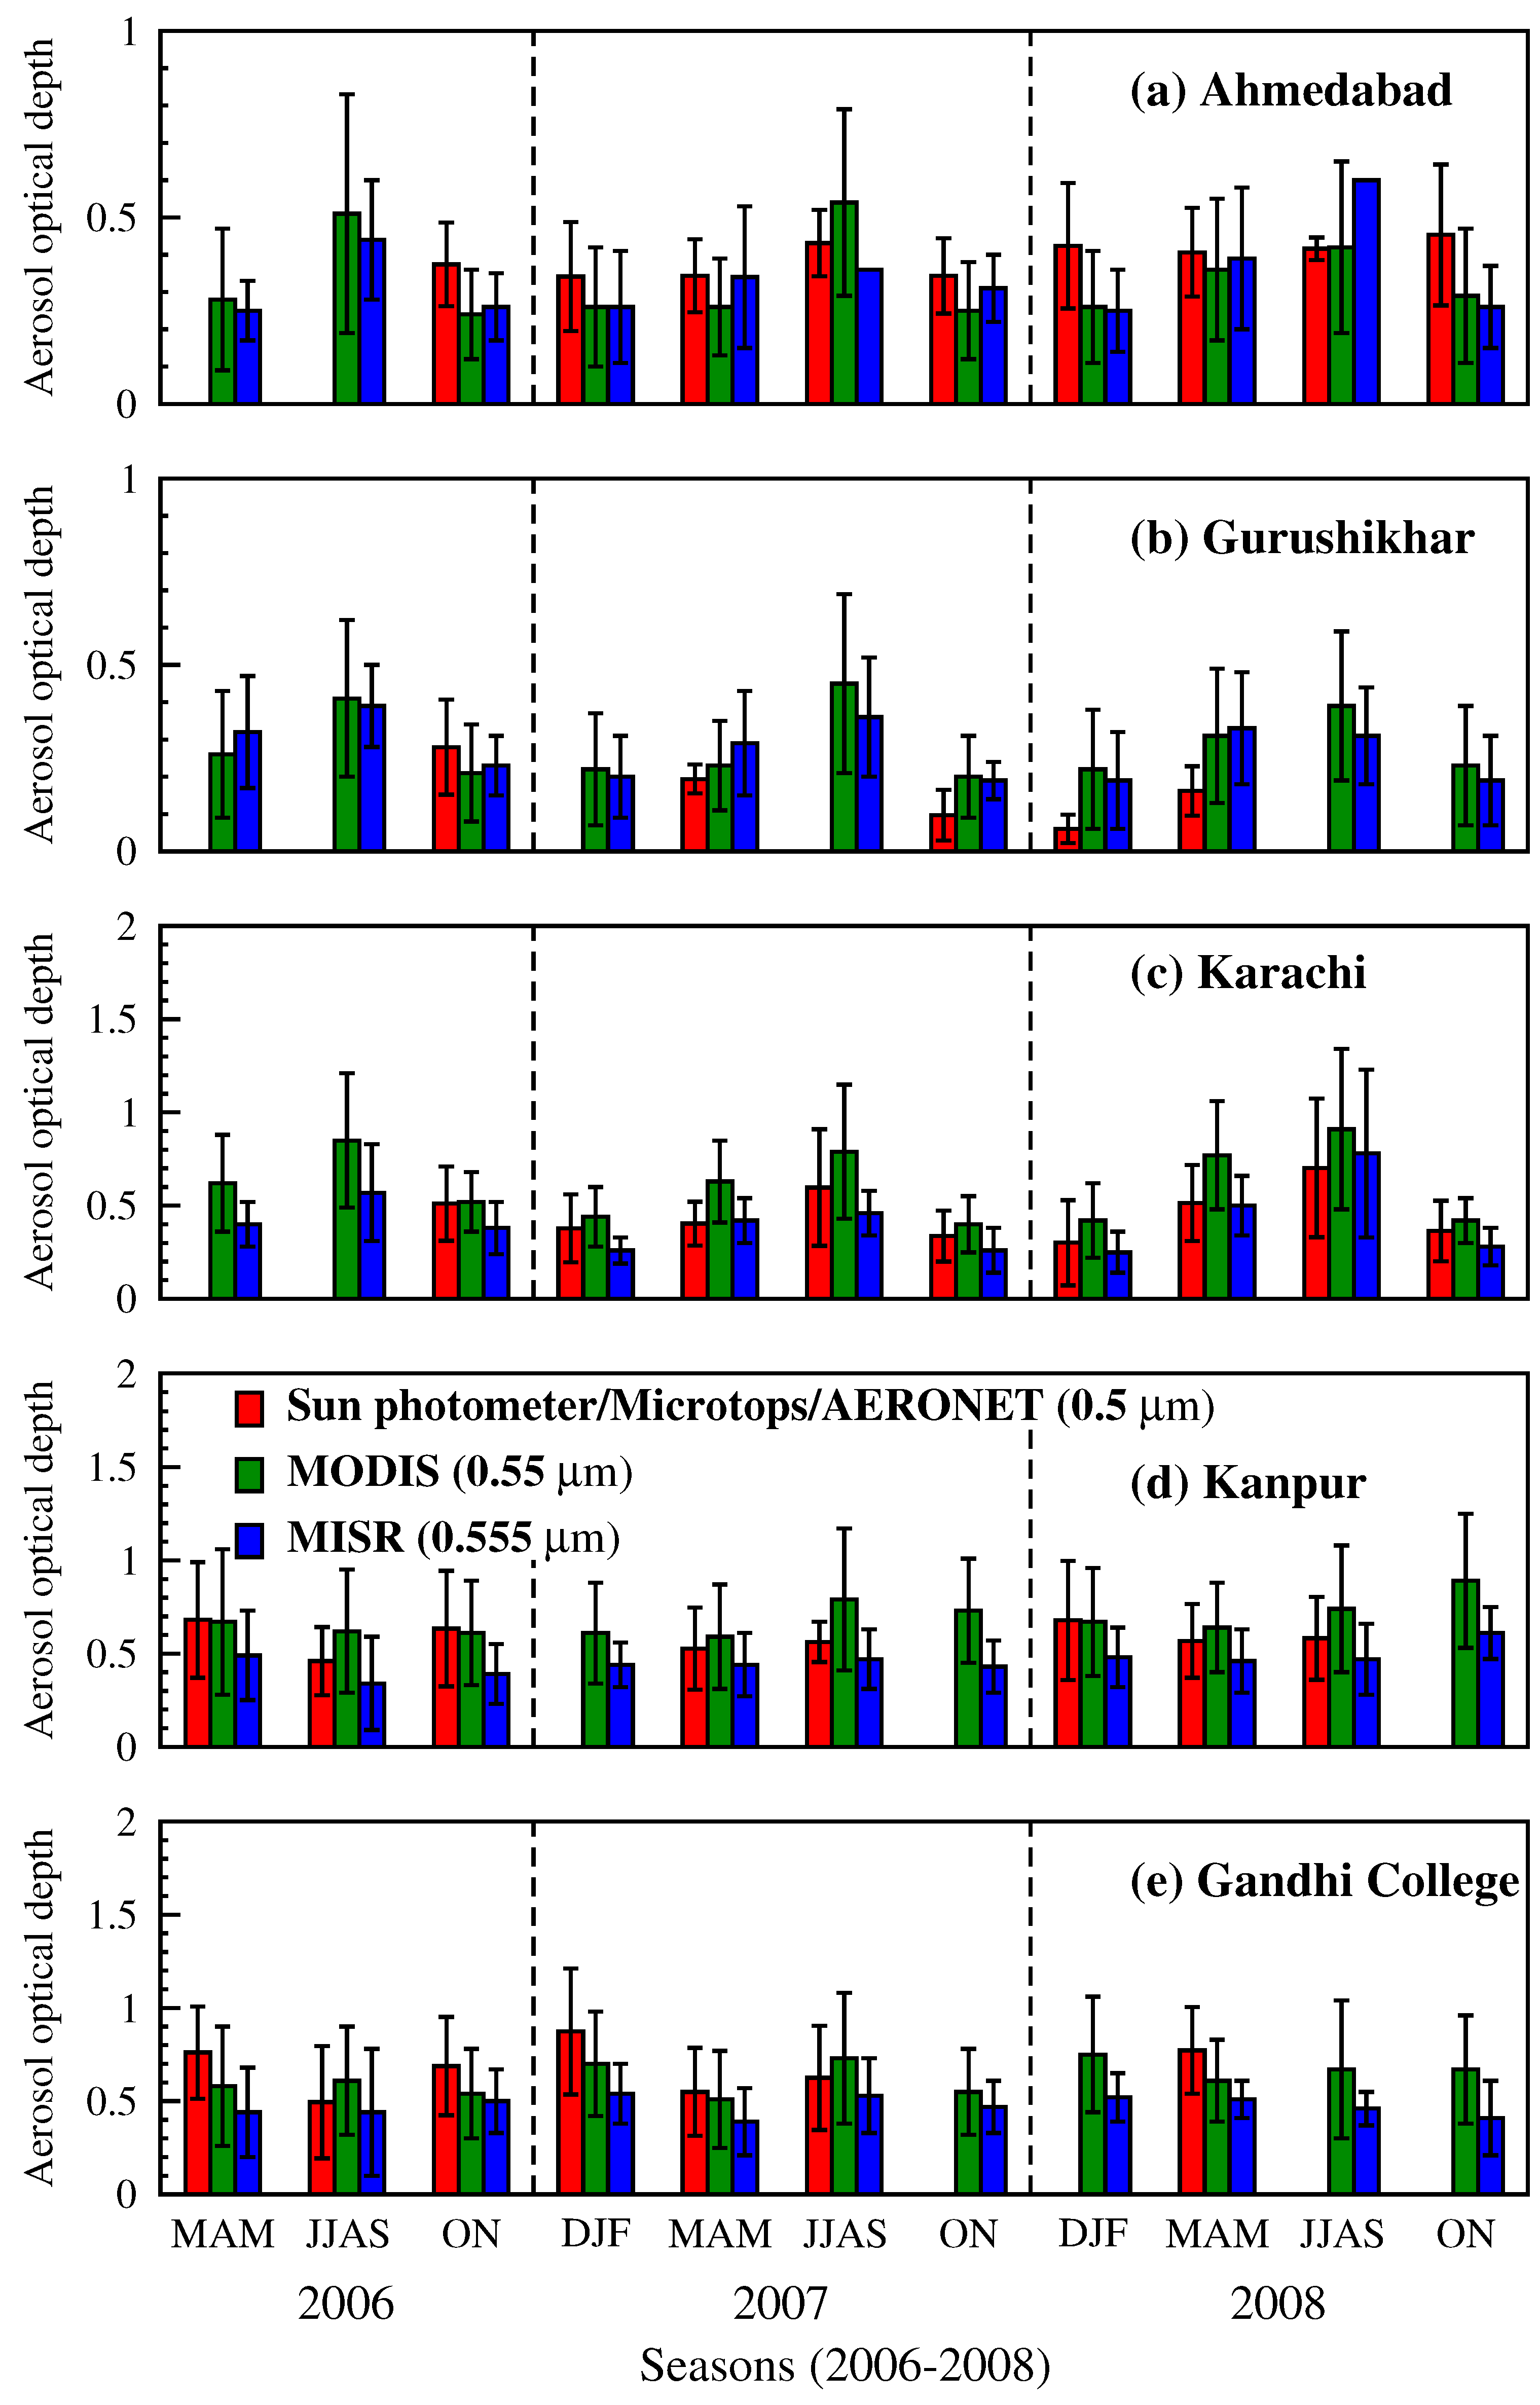
In
Figure 14 seasonal means of sun photometer, Microtops and AERONET measured 0.5 μm AODs are compared with MODIS and MISR retrieved AODs at 0.55 μm and 0.555 μm respectively, over Ahmedabad, Gurushikhar, Karachi, Kanpur and Gandhi College. During the entire study period and for all the study locations MODIS and MISR AODs are broadly able to capture the seasonal variations (
Figure 14), for example, the winter and postmonsoon low in AODs and the premonsoon and monsoon high in AODs. However, the magnitude of AODs are found to exhibit distinct behavior. MODIS underestimates AODs in Ahmedabad, Gurushikhar and Gandhi College by at least 0.04 in absolute magnitude, while it overestimates by about 0.06 in Kanpur and by 0.13 in Karachi. On the other hand, MISR underestimates AODs at all the locations except Gandhi College (
Table 5). Over Kanpur and Gandhi College, separated by about 200-300 km, MODIS overestimates while MISR underestimates in Kanpur; MODIS underestimates while MISR overestimates over Gandhi College. Interestingly the over or underestimation in AODs by the two satellites over this region is almost the same in terms of the amount (
Table 5).
Figure 14.
Comparison of seasonal mean aerosol optical depths obtained from ground-based (sun photometer, Microtops and AERONET sun/sky radiometers), and satellites (MODIS and MISR) during 2006–2008 over (a) Ahmedabad; (b) Gurushikhar; (c) Karachi; (d) Kanpur; and (e) Gandhi College. Ground based aerosol optical depths correspond to 0.5 μm, while MODIS and MISR retrieved aerosol optical depths are at 0.55 and 0.555 μm respectively. Vertical bars denote ±1σ deviation from the seasonal mean.
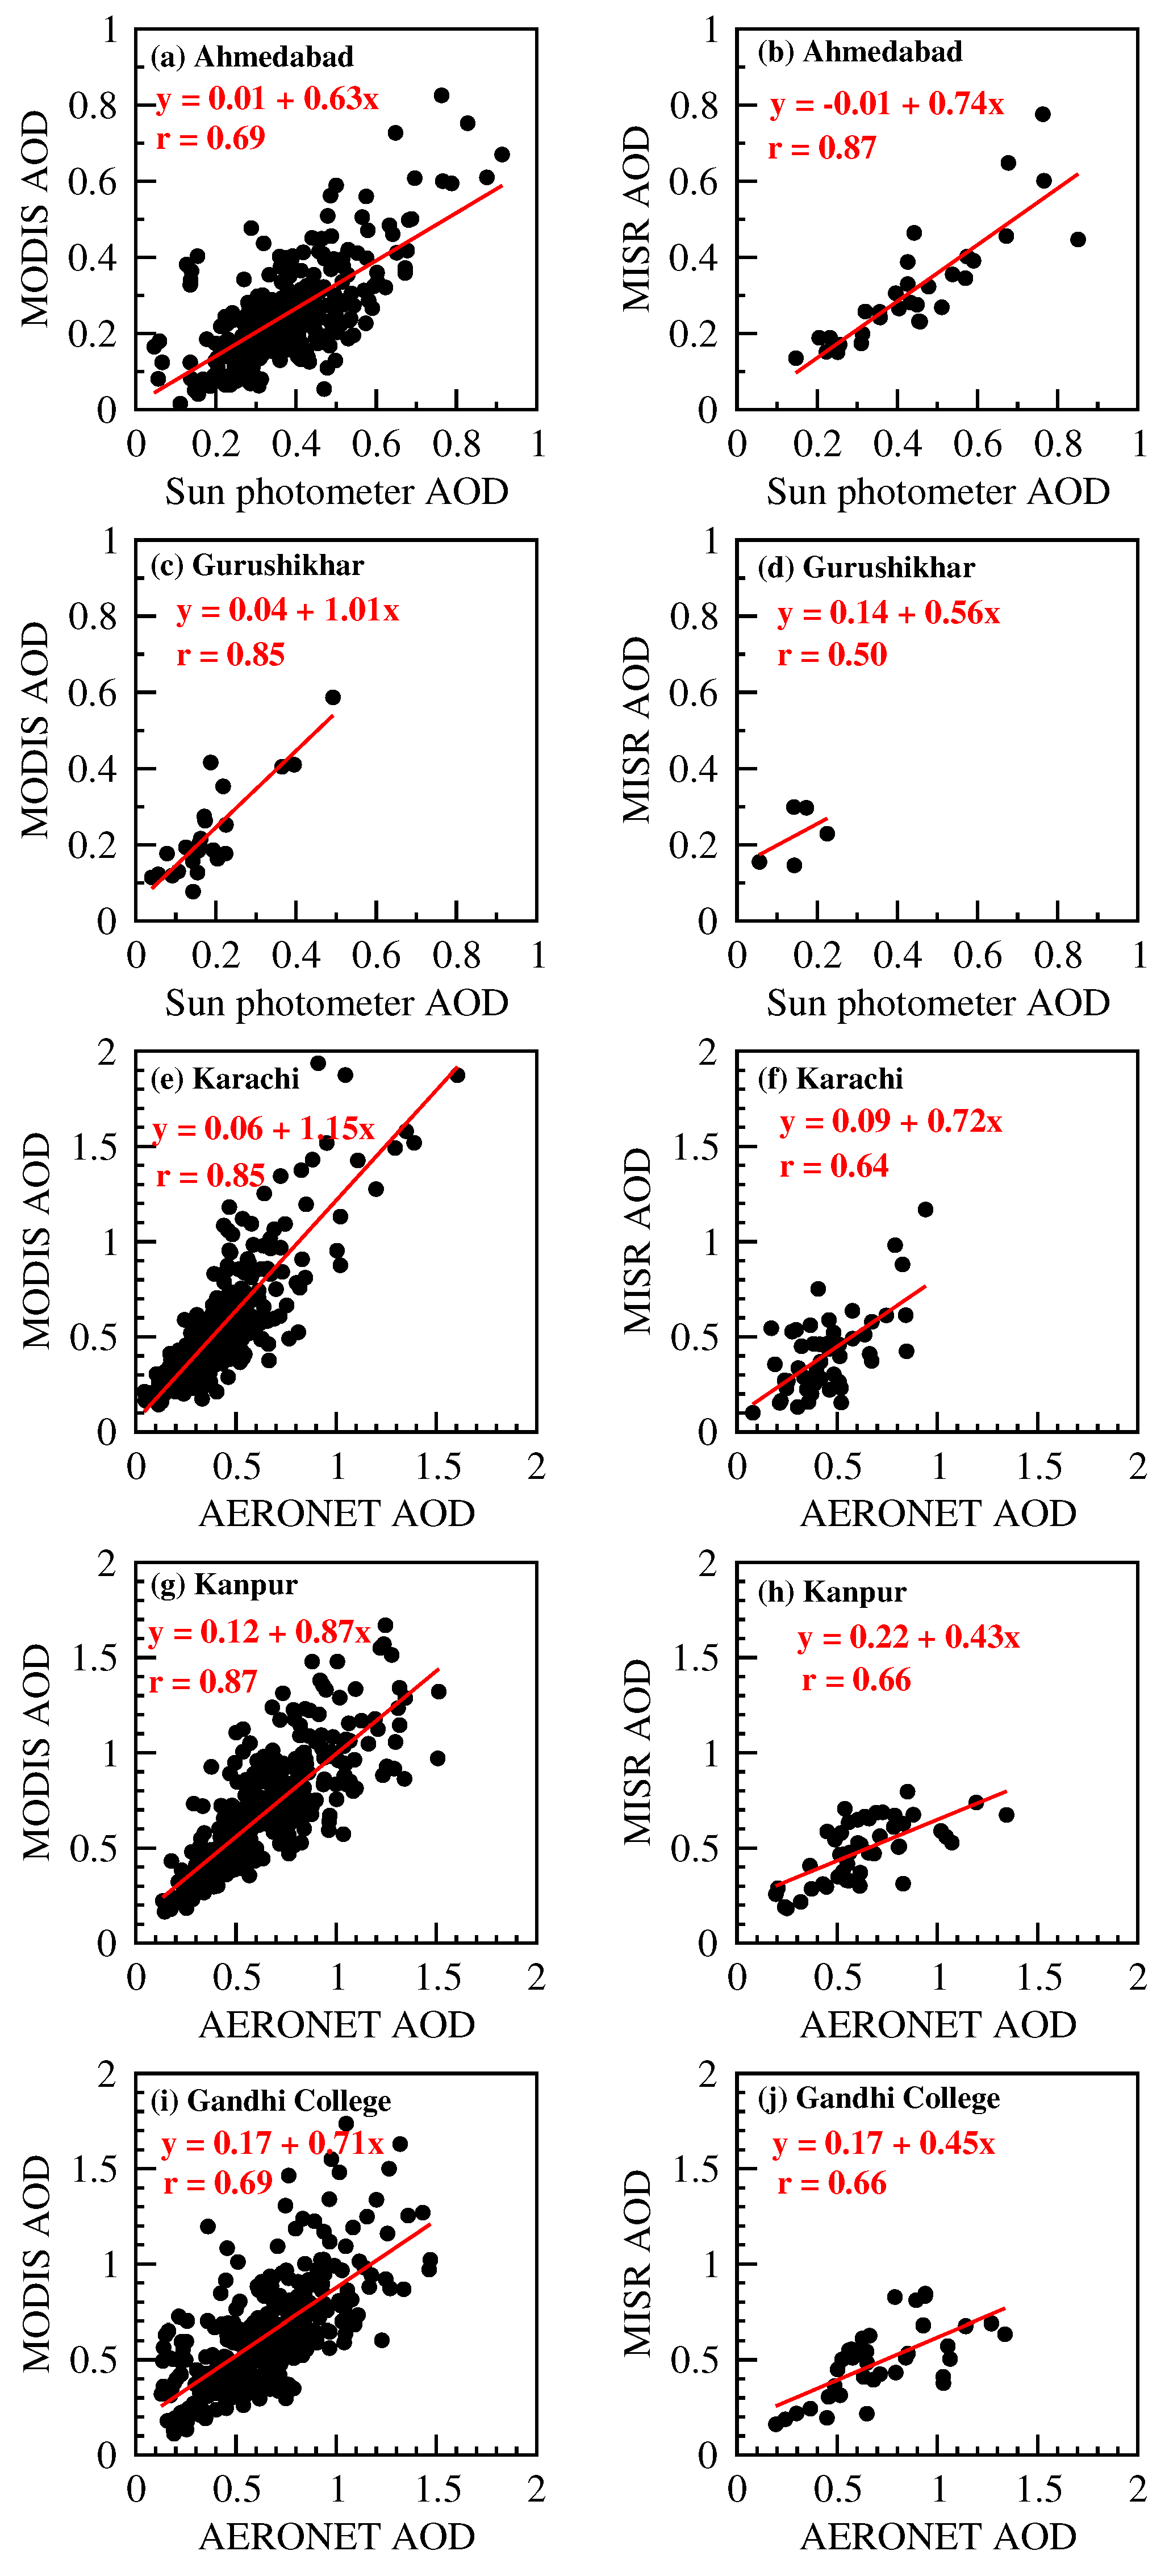
Figure 15.
Correlation between ground-based sun photometer, Microtops and AERONET sun/sky radiometers measured AODs and satellite (MODIS and MISR) retrieved AODs during 2006–2008 over Ahmedabad (a,b); Gurushikhar (c,d); Karachi (e,f); Kanpur (g,h); and Gandhi College (i,j). Ground-based AODs correspond to 0.5 μm, while MODIS and MISR retrieved AODs are at 0.55 and 0.555 μm respectively.
A one-on-one correlation between the collocated daily mean AODs obtained over each study location from ground-based (sun photometer, Microtops, and sun/sky radiometers) and satellite (MODIS and MISR) measurements (
Figure 15) is shown. Correlation coefficients lie in the range of 0.50–0.87 in the study locations (
Figure 15). The correlations are not so strong due to the differences between the AODs retrieved from MODIS, MISR and ground-based instruments. The plausible causes that could contribute to the differences between ground-based and satellite retrieved AODs include: (1) spatial difference between the two measurements (point,
vs. grid); (2) uncertainties associated in deriving AODs from both ground-based and satellite retrievals; and (3) differences in the wavelengths (0.50 μm in case of sun photometer/Microtops/sun/sky radiometers, 0.55 μm from MODIS, and 0.555 μm from MISR) [
2,
28]. It should be noted that while MODIS provides a near global coverage daily [
38], MISR can provide the global coverage once in 9 days, which reduces the number of days on which AODs can be compared (
Figure 15). A comparison of coincident MODIS, MISR and AERONET AODs revealed that instrument sampling, sampling differences, assumptions made in the MODIS and MISR standard algorithms about boundary conditions, missing particle property or mixing options, reflectances used in the retrievals, in addition to cloud screening could be contributing to differences in AODs between the ground-based and satellite measurements [
39]. For example, it has been found that the dust models used in MISR retrievals are too absorbing, therefore, revised dust models including a wider range of bimodal, non-absorbing mixtures are being considered [
40]. The analysis on the correlation between ground-based and remote sensing suggests that improvements to be made in retrievals including the surface reflectance and aerosol properties will enhance the correlation between ground-based and satellite retrieved AODs. The results on the spatio-temporal variations in aerosol optical characteristics over five locations governed by different sources, and the comparison between ground-based and remote sensing AODs will be useful in remote sensing to improve the retrieval algorithms, and in assessing the aerosol impact on climate.


