
Is Benford’s Law a Universal Behavioral Theory?

1
Department of Agricultural and Resource Economics, University of California, Berkeley, CA 94720, USA
2
National School of Development, Peking University, Beijing 100871, China
3
Department of Agricultural and Resource Economics and Graduate School, University of California, Berkeley, CA 94720, USA
*
Author to whom correspondence should be addressed.
Econometrics 2015, 3(4), 698-708; https://doi.org/10.3390/econometrics3040698
Submission received: 16 September 2015
/
Revised: 13 October 2015
/
Accepted: 14 October 2015
/
Published: 22 October 2015
Abstract
:In this paper, we consider the question and present evidence as to whether or not Benford’s exponential first significant digit (FSD) law reflects a fundamental principle behind the complex and nondeterministic nature of large-scale physical and behavioral systems. As a behavioral example, we focus on the FSD distribution of Australian micro income data and use information theoretic entropy methods to investigate the degree that corresponding empirical income distributions are consistent with Benford’s law.
Keywords:
first significant digits; Benford’s law; information theoretic methods; empirical likelihood; minimum divergence measureJEL Classification:
C1; C10; C241. Introduction
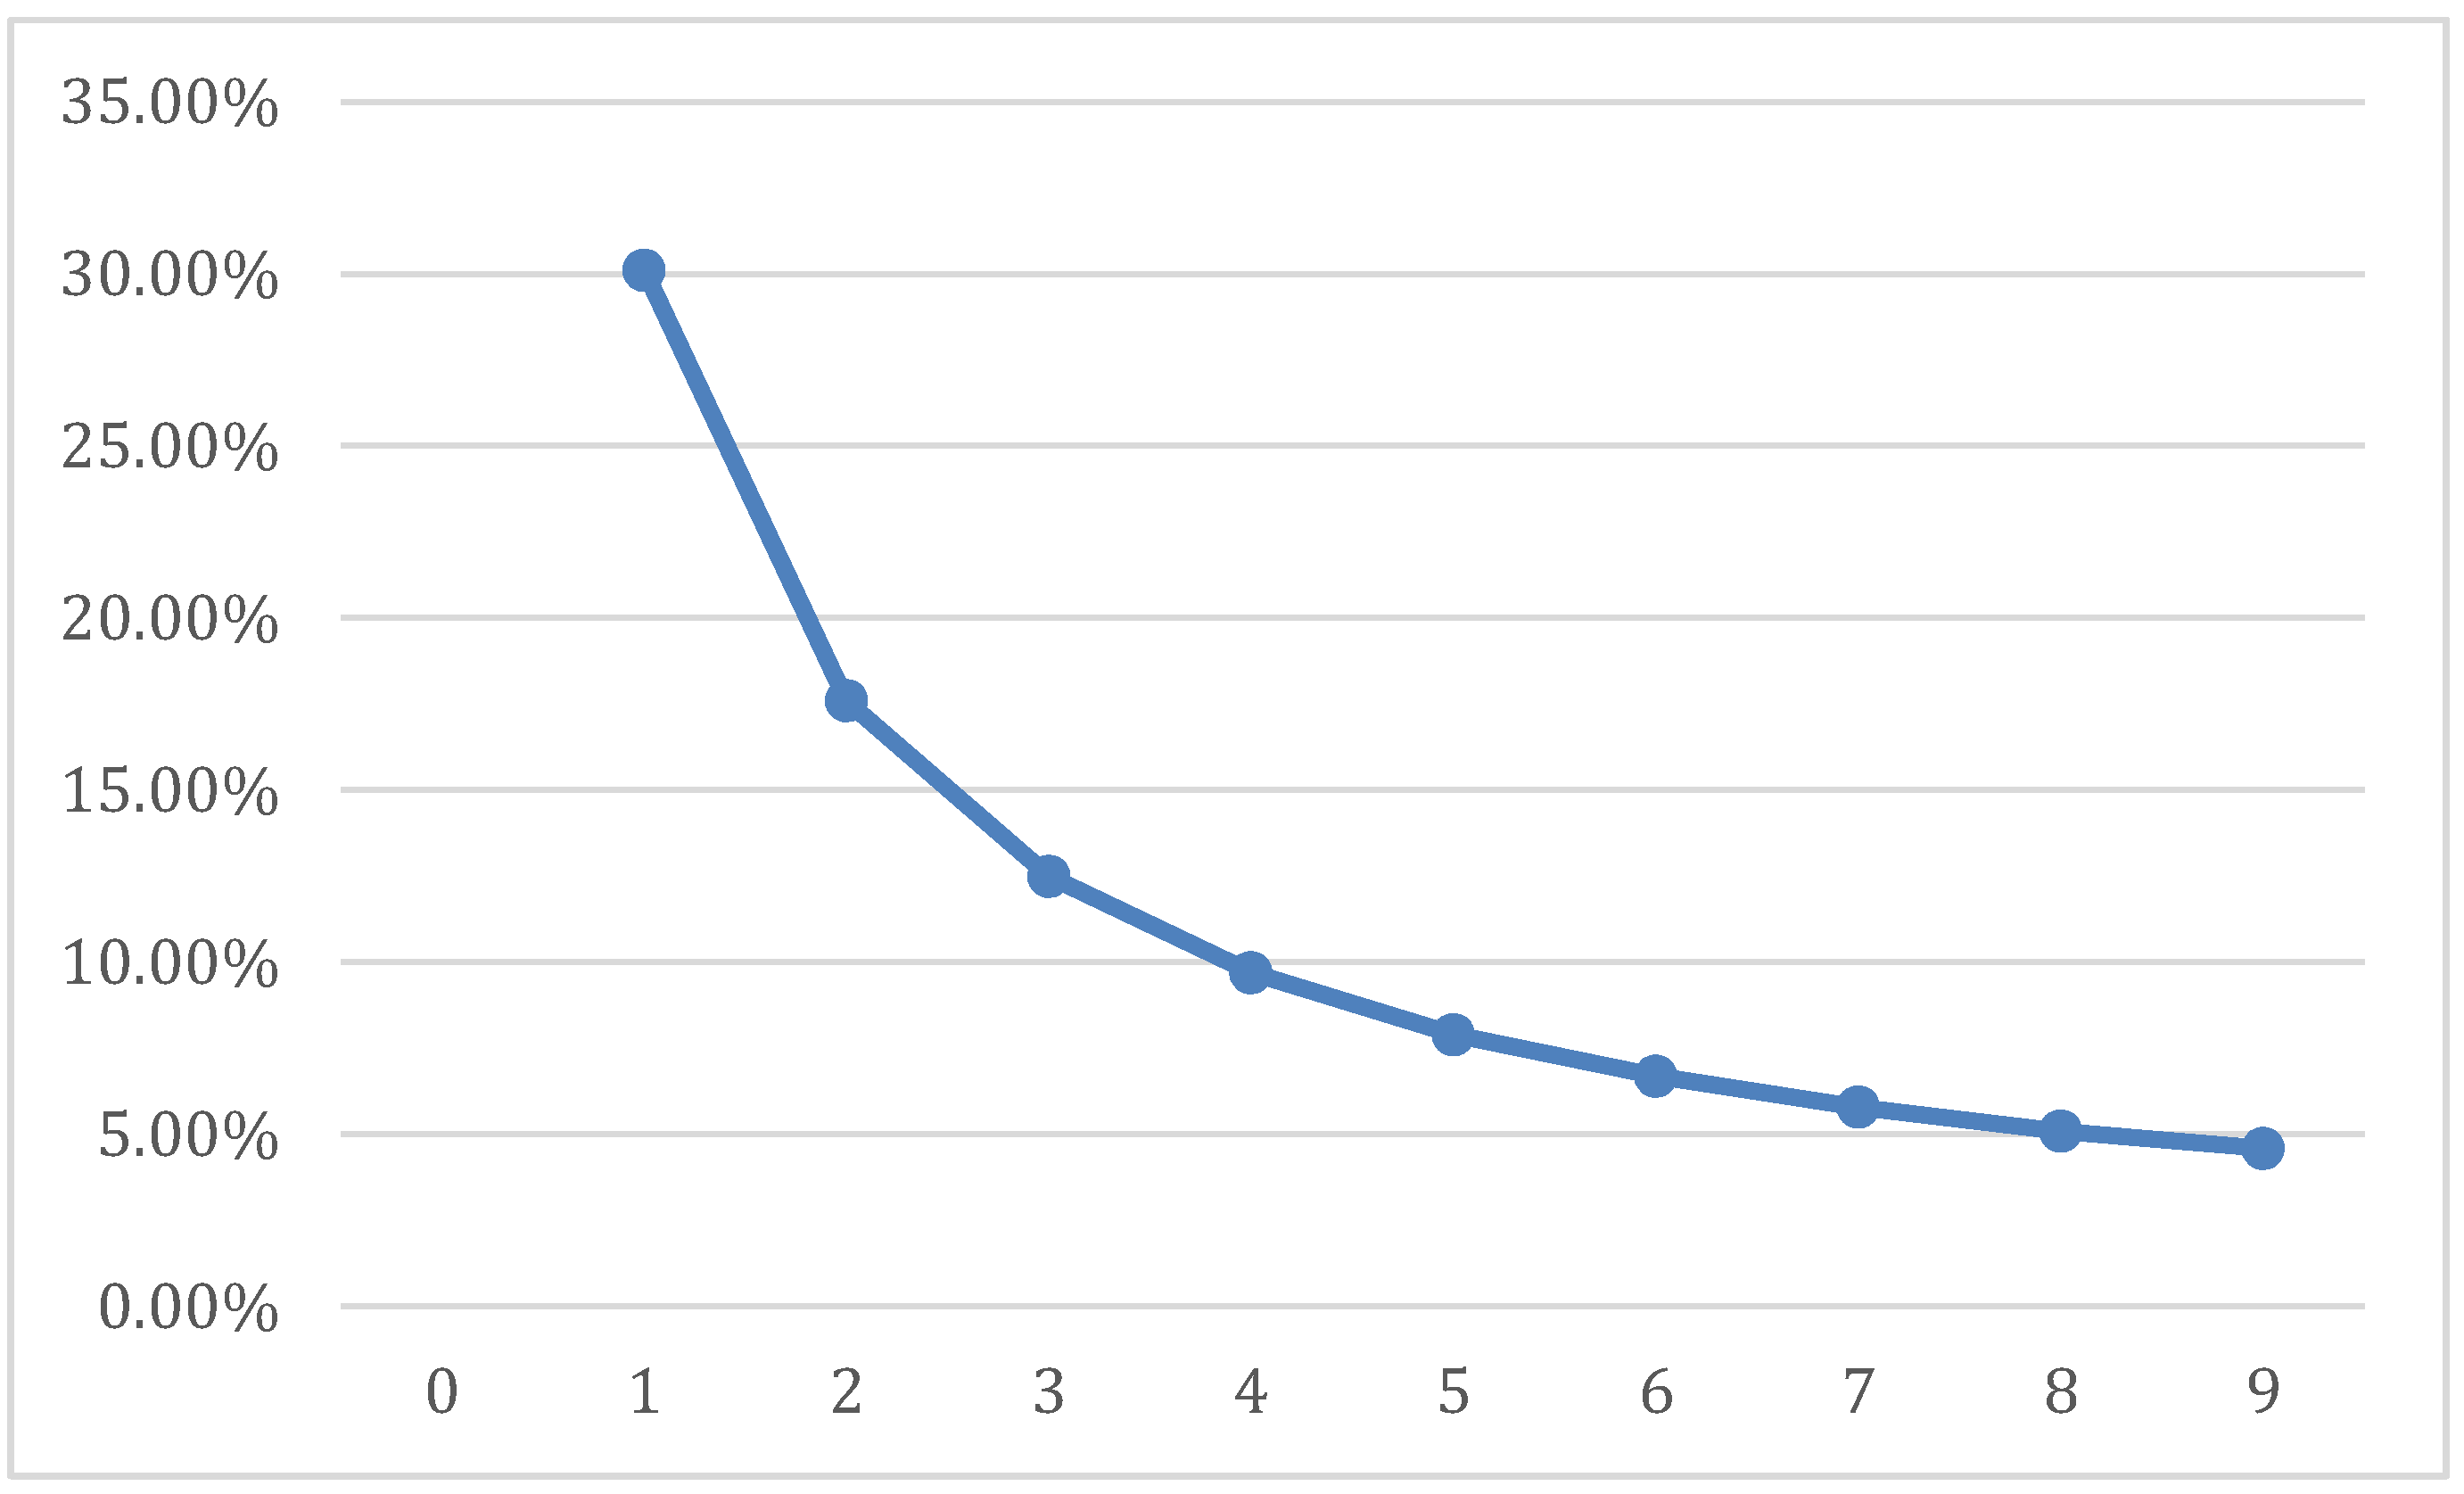
In 1881, Simon Newcomb, an astronomer and mathematician, conjectured that in natural data sets, the first digits did not occur with equal frequency. Rather, he suggested that the occurrence of numbers is such that the functional points of their common logarithms are equally probable. This led him to suggest the following expression for the empirical distribution of first digits, , with P (d = 1, 2, …, 9) = (0.301, 0.176, 0.125, 0.097, 0.0790, 0.0670, 0.058, 0.051, 0.046), and the resulting distribution of first significant digits (FSD) that is displayed in Figure 1.
Figure 1.
First digit frequencies.

Fifty-seven years later, physicist Frank Benford empirically demonstrated that a large number of seemingly unrelated sets of numbers provided a good fit to the FSD exponential distribution and gave it law status. Since then, others have published studies showing that “Benford’s Law” applies to a surprisingly large number of natural-behavioral data sets and has the positive properties of being scale and base invariant (e.g., [1,2]) 1. Even when FSD data sets deviate from the Benford pattern, the lower digits are favored and decline monotonically. Given the nature of the distribution, it has been suggested that Benford’s law is from a family of power laws and thus a way of generalizing FSD distributions. Furthermore, in [3] it was demonstrated that in physical statistics, the Boltmann-Gibbs (BG) and Fermi-Derac (FD) distributions, which relate to the temperature of a system, fluctuate around the Benford distribution and that the Bose-Einstein (BE) distribution exactly conforms to it.
Over the years, in spite of these and the productive efforts of many, a bit of mystery remains concerning Benford’s FSD distribution outcome. In statistical physics and behavioral economics, one might naively expect that outcomes of admissible microstates of physical and behavioral systems are equally probable over long periods of time. Alternatively, Benford’s law ([4,5]) suggests for these and many other real world situations, the occurrence of nonzero digits are not uniformly distributed but favor the smaller digits in a scale and base invariant exponential way. Given this digit distributional difference found in numerous physical systems, in this paper, we consider the question, “Does Benford’s exponential first significant digit (FSD) law also reflect a fundamental principle behind the complex and nondeterministic nature of large scale behavioral systems?”
In the sections ahead, we review Benford’s law, and given first moment FSD data-based information, we use entropy-based information theoretic methods to recover the corresponding exponential Benford’s distribution in behavioral economics. As a behavioral example, we focus on Australian micro level income data over a range of years and use information theoretic methods to recover the exponential distribution from samples of income data. We also employ information theoretic entropy methods to demonstrate that the corresponding empirical exponential income distributions are consistent with Benford’s law. While others have shown that Benford’s law holds in the physical sciences, we extend the existing literature and examine whether the law holds in a major allocation and distribution behavioral system as well. 2
2. A Behavioral System Example
In the previous section, we discussed the Benford FSD distribution and noted in physical systems the Boltmann-Gibbs, Fermi-Derac, and Bose-Einstein distribution connections. As noted in Section 1, the Bose-Einstein statistic is concerned with the ways in which a collection of non-interacting particles may occupy a set of discrete energy states at thermodynamic equilibrium. Similarly, this paper considers a behavioral system in which we analyze the equilibrium distribution of micro income data and note its connection to Benford’s law.
The study of income distributions in developed countries has a long history. Pareto originally used this distribution to describe the allocation of wealth among individuals, demonstrating that a larger portion of the wealth of any society is owned by a small percentage of the people. This idea is sometimes expressed more simply as the Pareto principle or the “80-20 rule”—which says that 20% of the population controls 80% of the wealth. Subsequent studies have often disputed the Pareto conjecture. For instance, [6] proposed a weak Pareto law applicable only asymptotically to the high incomes. Many other distributions of income have been proposed, including the exponential distribution [7] and the log-normal distribution [8]. In the following subsection, we model the distribution of Australian micro income data for the sample of years 2008–2013 using an exponential function, and demonstrate the degree to which micro income FSD Australian data agree with Benford’s law.
2.1. Australia’s Income Distribution
As a database for the micro income information, we use the Australian income survey, called the Household Income and Labor Dynamics in Australia (HILDA). 3 The HILDA survey is a household-based panel study that began in 2001. It collects information about economic and subjective well-being, labor market dynamics and family dynamics. Each year, there are over 7000 households and almost 20,000 individuals. Interviews are conducted annually with all adult members of each household and the panel members are followed over time. The dataset is chosen due to the high quality of the data over time for individual level income observations, given that our approach needs information from micro level data instead of aggregate income distributions.
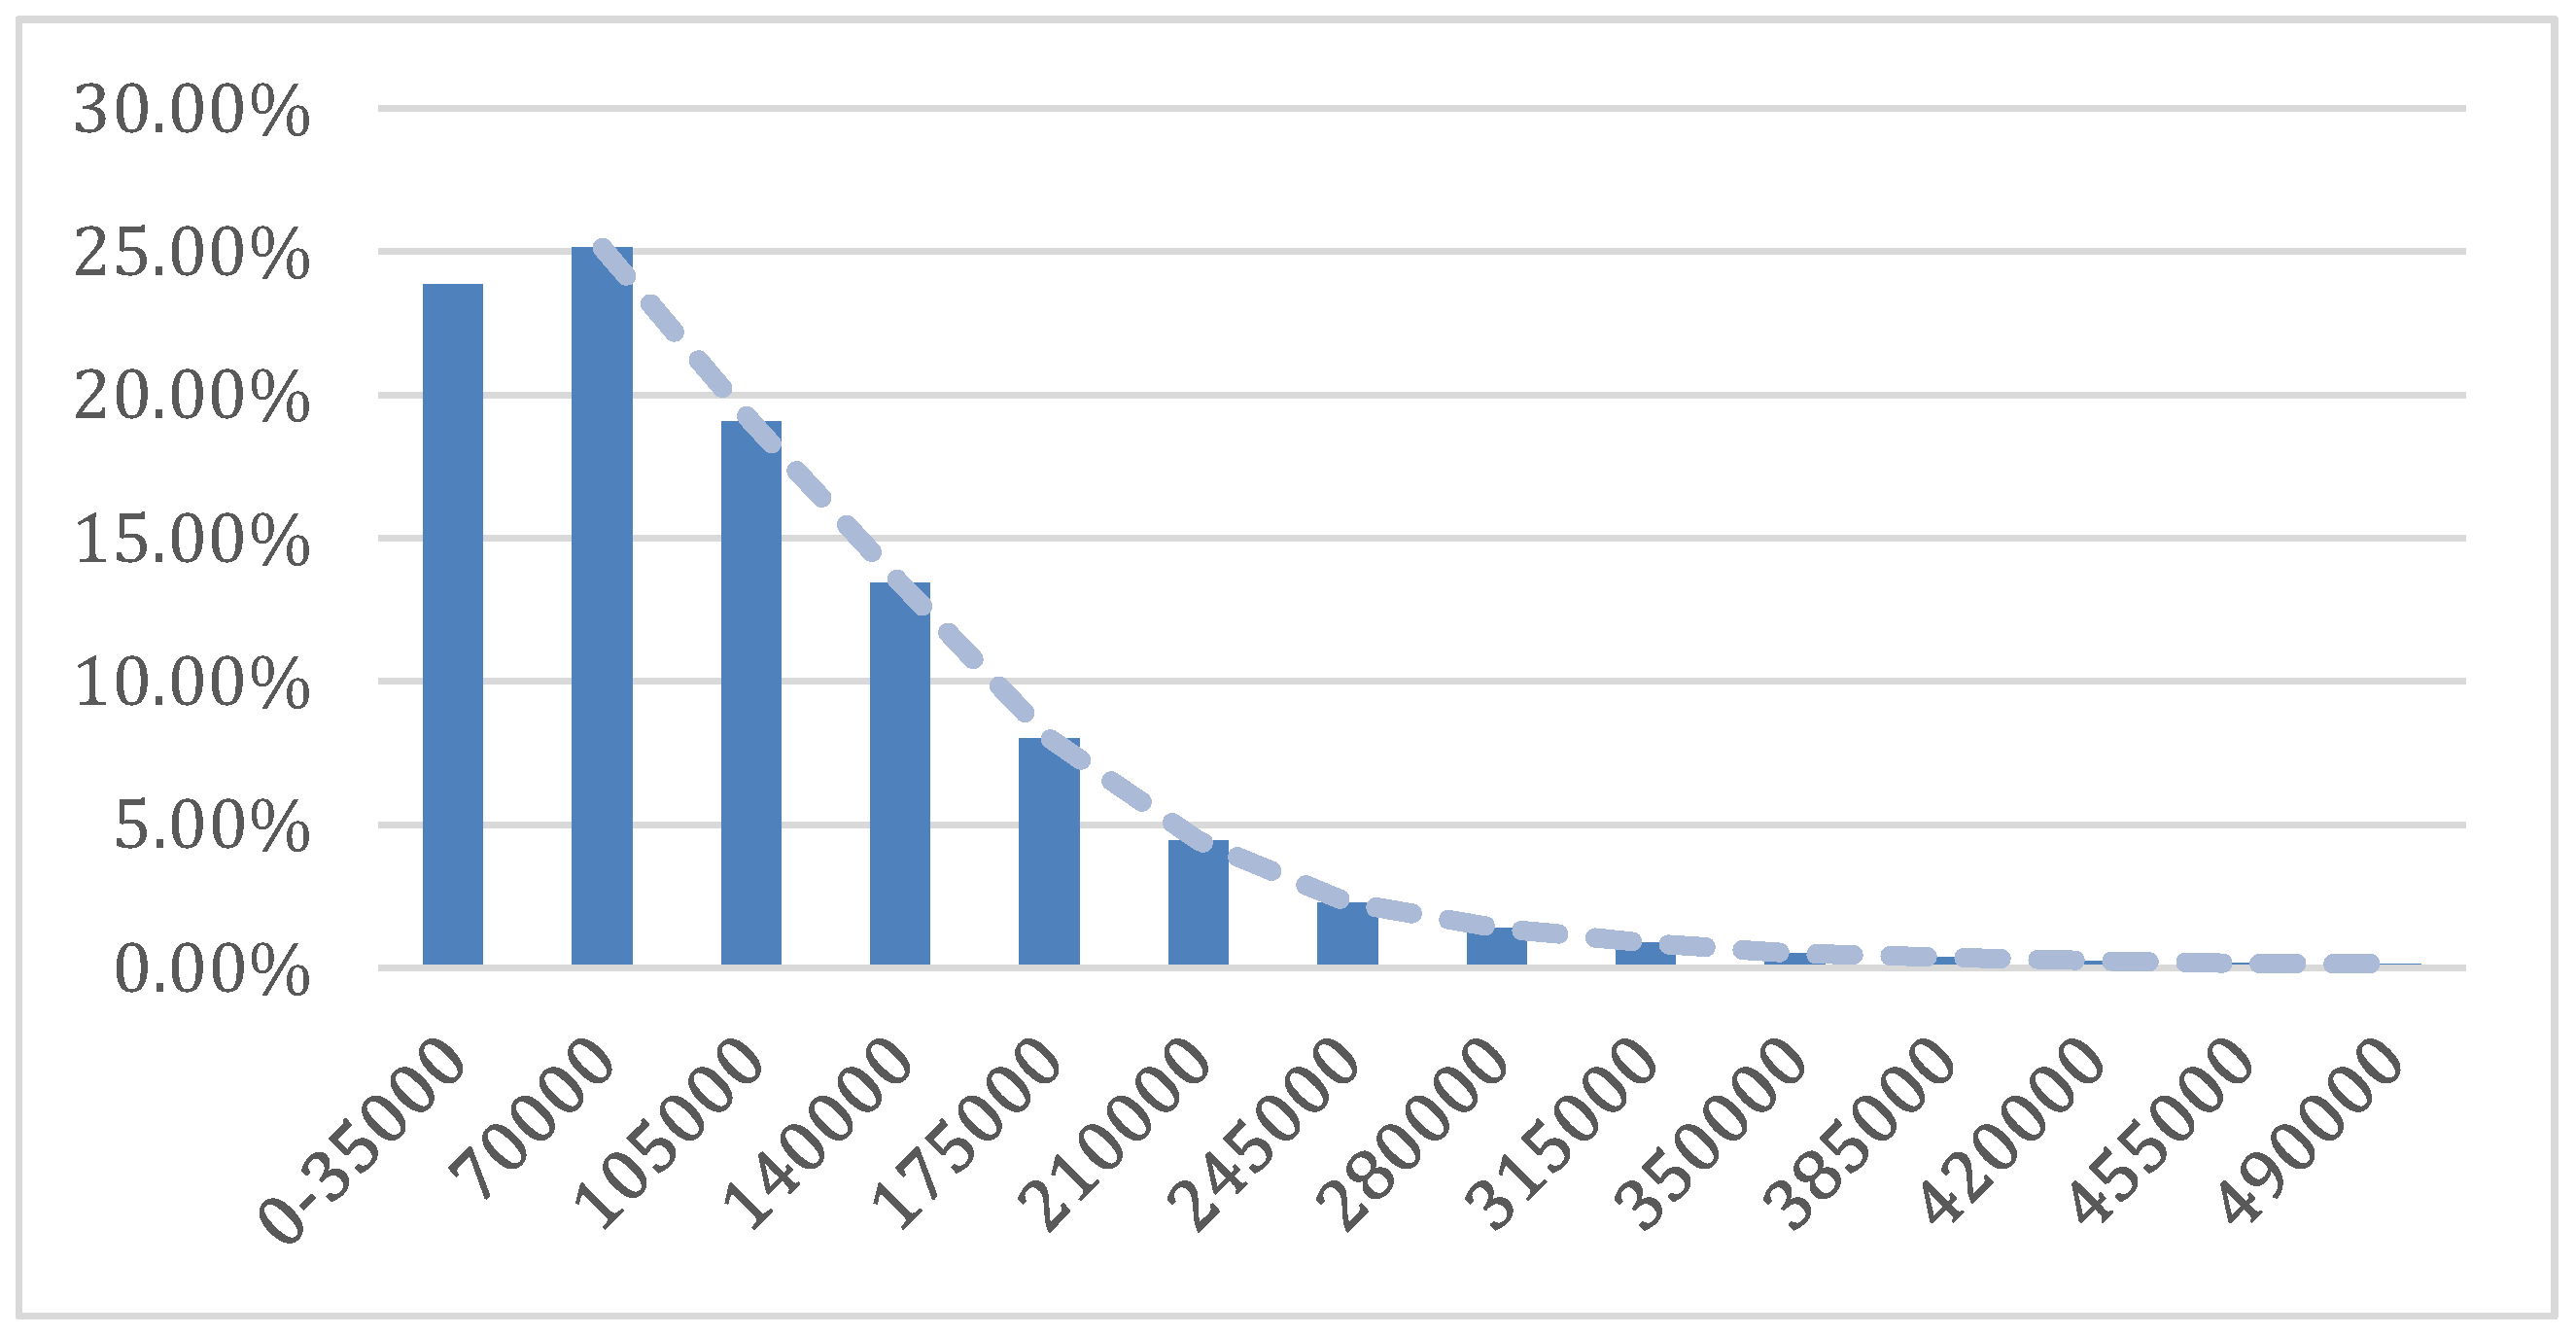
Based on the sample of years 2008–2013, the resulting Australian aggregate income distribution is displayed in Figure 2. The exponential nature of the Australian income distribution is in general agreement with Pareto, and it is the distribution that one might expect from the allocative and distributive impacts of economic activity. The exponential distribution is also consistent with the distribution of energy in physical systems.
Figure 2.
Aggregate distribution of macro income data for Australia, for the years 2008–2013.
2.2. FSD Distributions for Australia
Using data from the Australian income survey from the years 2008 to 2013, we extracted the first significant digit for all survey responses and computed the frequency of each digit for each year. The year-by-year frequencies and Benford first digit distributions are presented in Figure 3.
Figure 3.
The distribution of Australian income FSDs for the years 2008–2013 and Benford Distribution.
Figure 3.
The distribution of Australian income FSDs for the years 2008–2013 and Benford Distribution.
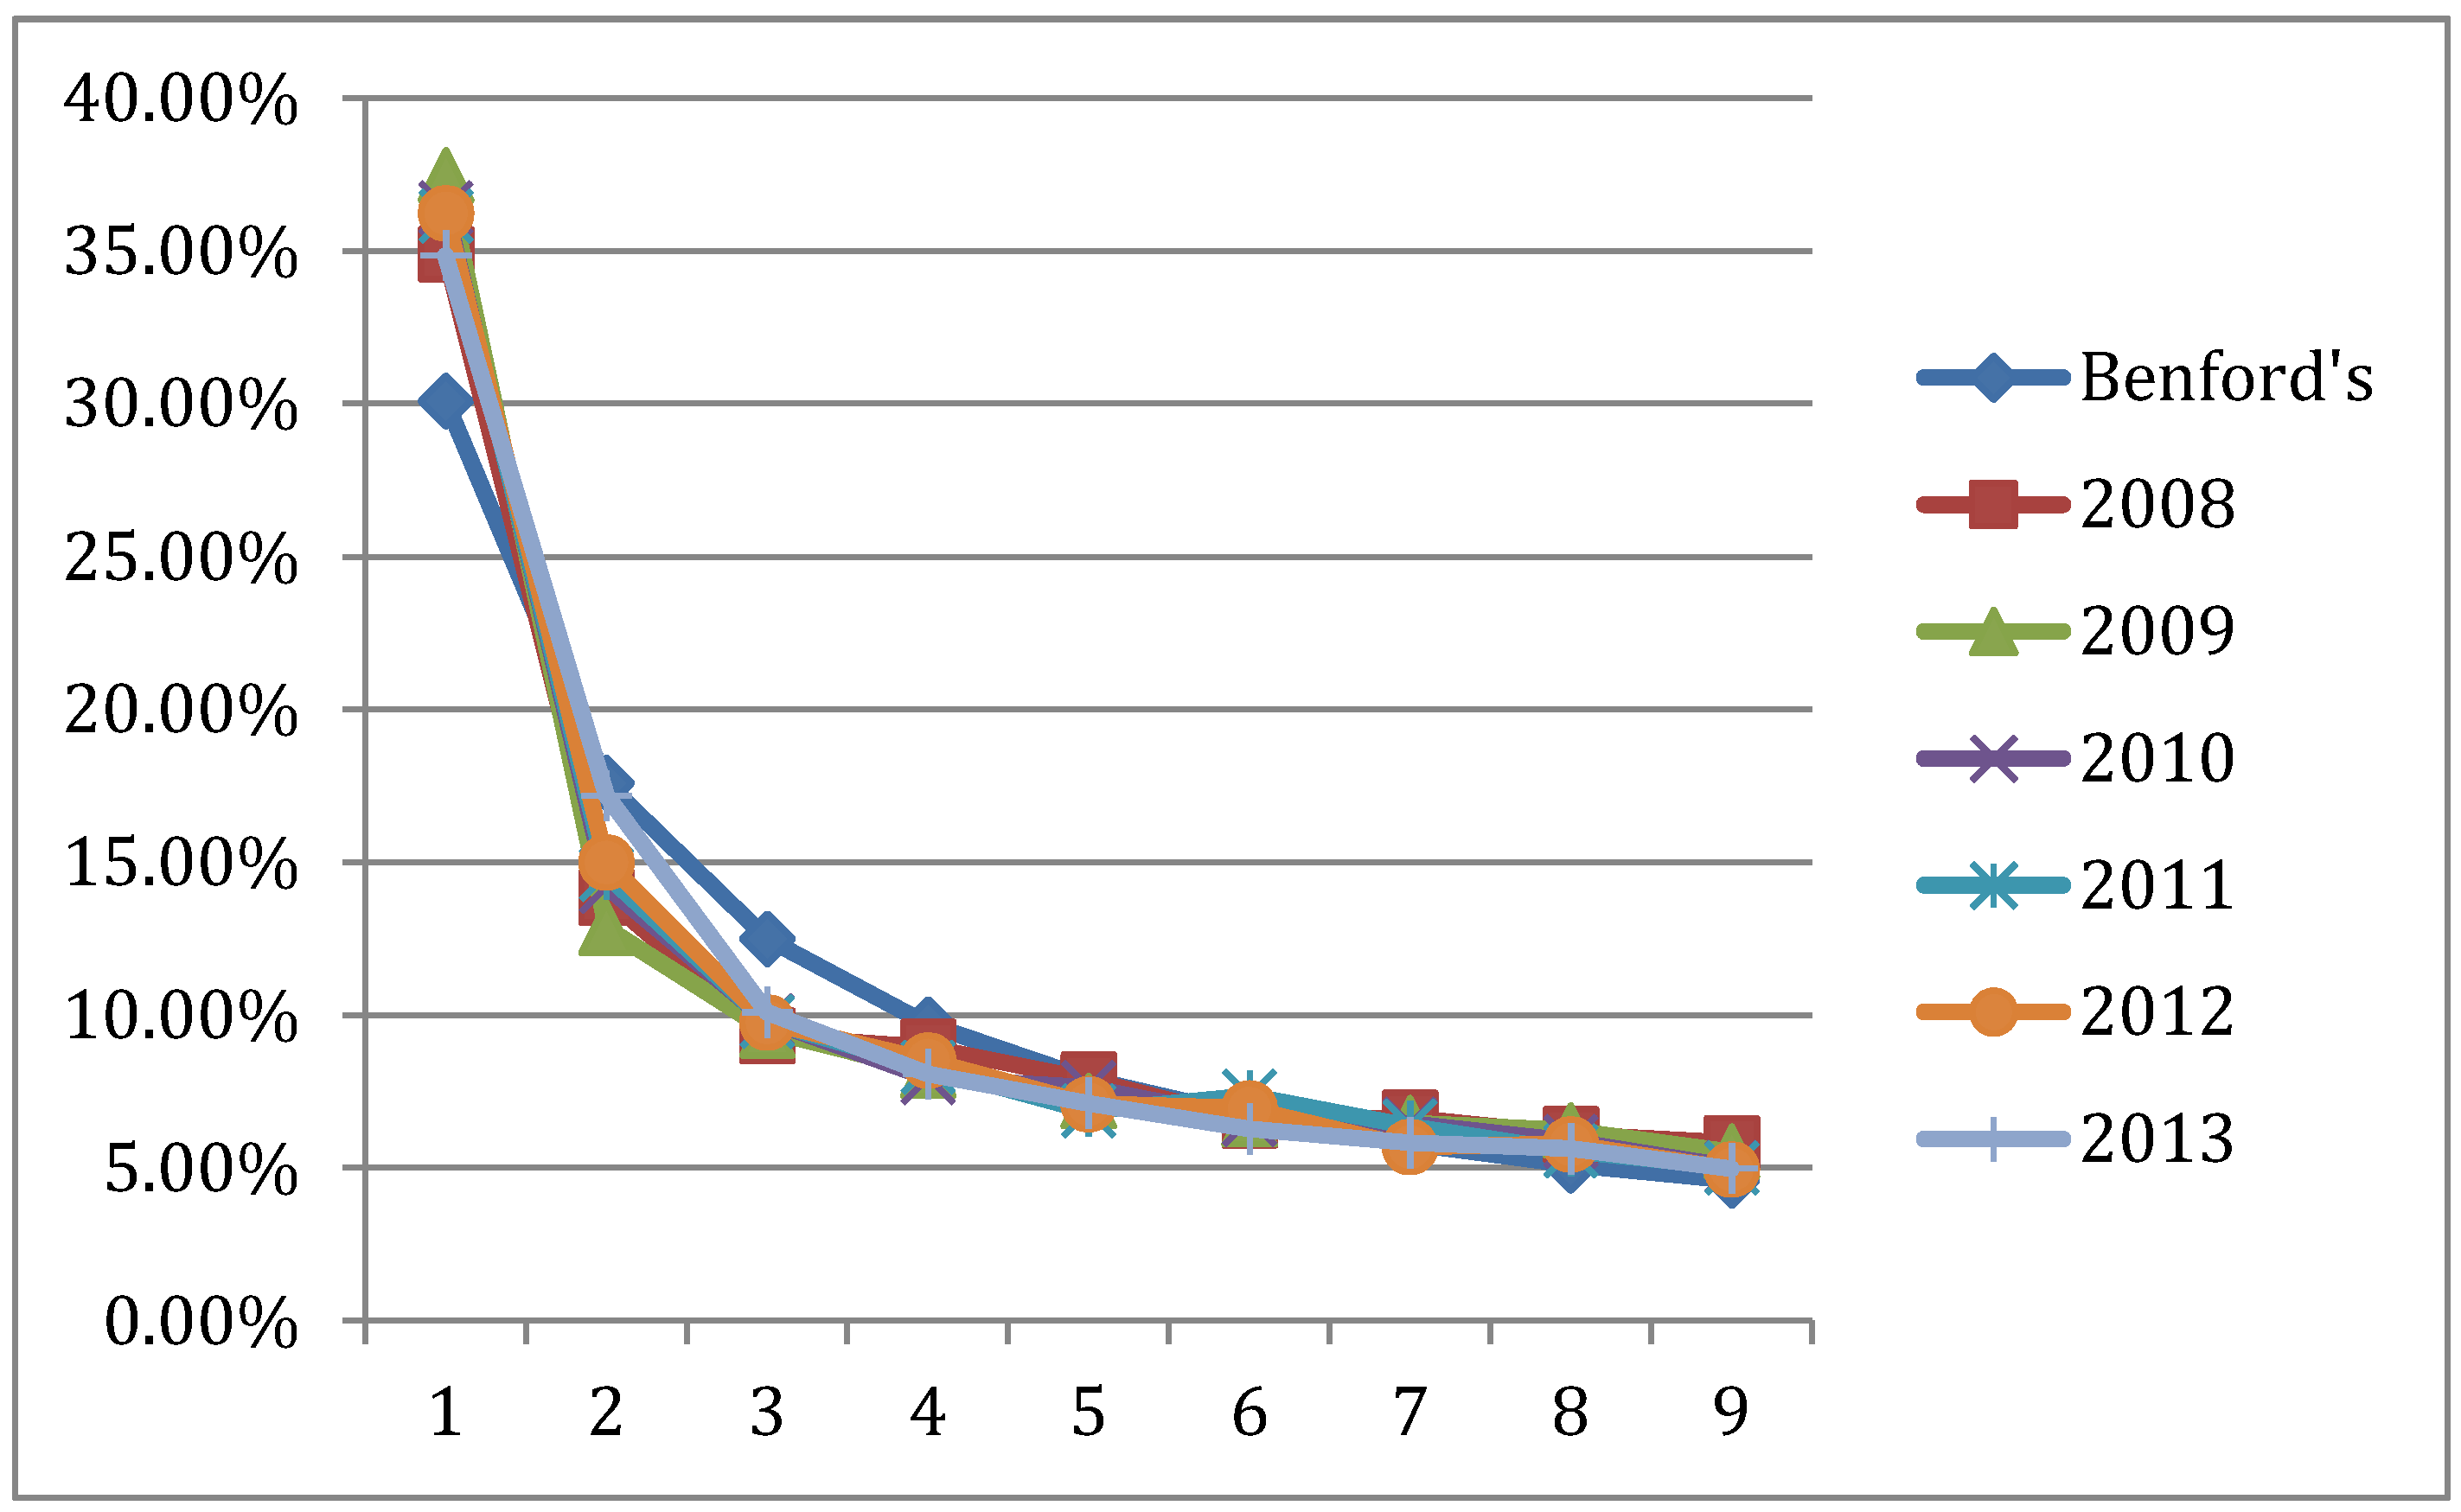
The Chi-square goodness of fit test is commonly used when comparing data distributions with the Benford law distribution. In our case, we match in Figure 3 the yearly income FSDs frequencies to the Benford distribution. The goodness of fit is noted by Chi-square test statistics comparisons of the empirical digit distribution and the Benford reference distribution, as presented in Table 1.

Table 1.
Chi-square and correlation between Benford’s and income first significant digit (FSD), 2008–2013.
| Statistic | 2008 | 2009 | 2010 | 2011 | 2012 | 2013 |
|---|---|---|---|---|---|---|
| Chi-square | 0.031 | 0.046 | 0.031 | 0.029 | 0.026 | 0.017 |
| Correlation | 0.965 | 0.953 | 0.968 | 0.971 | 0.975 | 0.987 |
| Significance | 0.999 | 0.999 | 0.999 | 0.9999 | 0.9999 | 0.9999 |
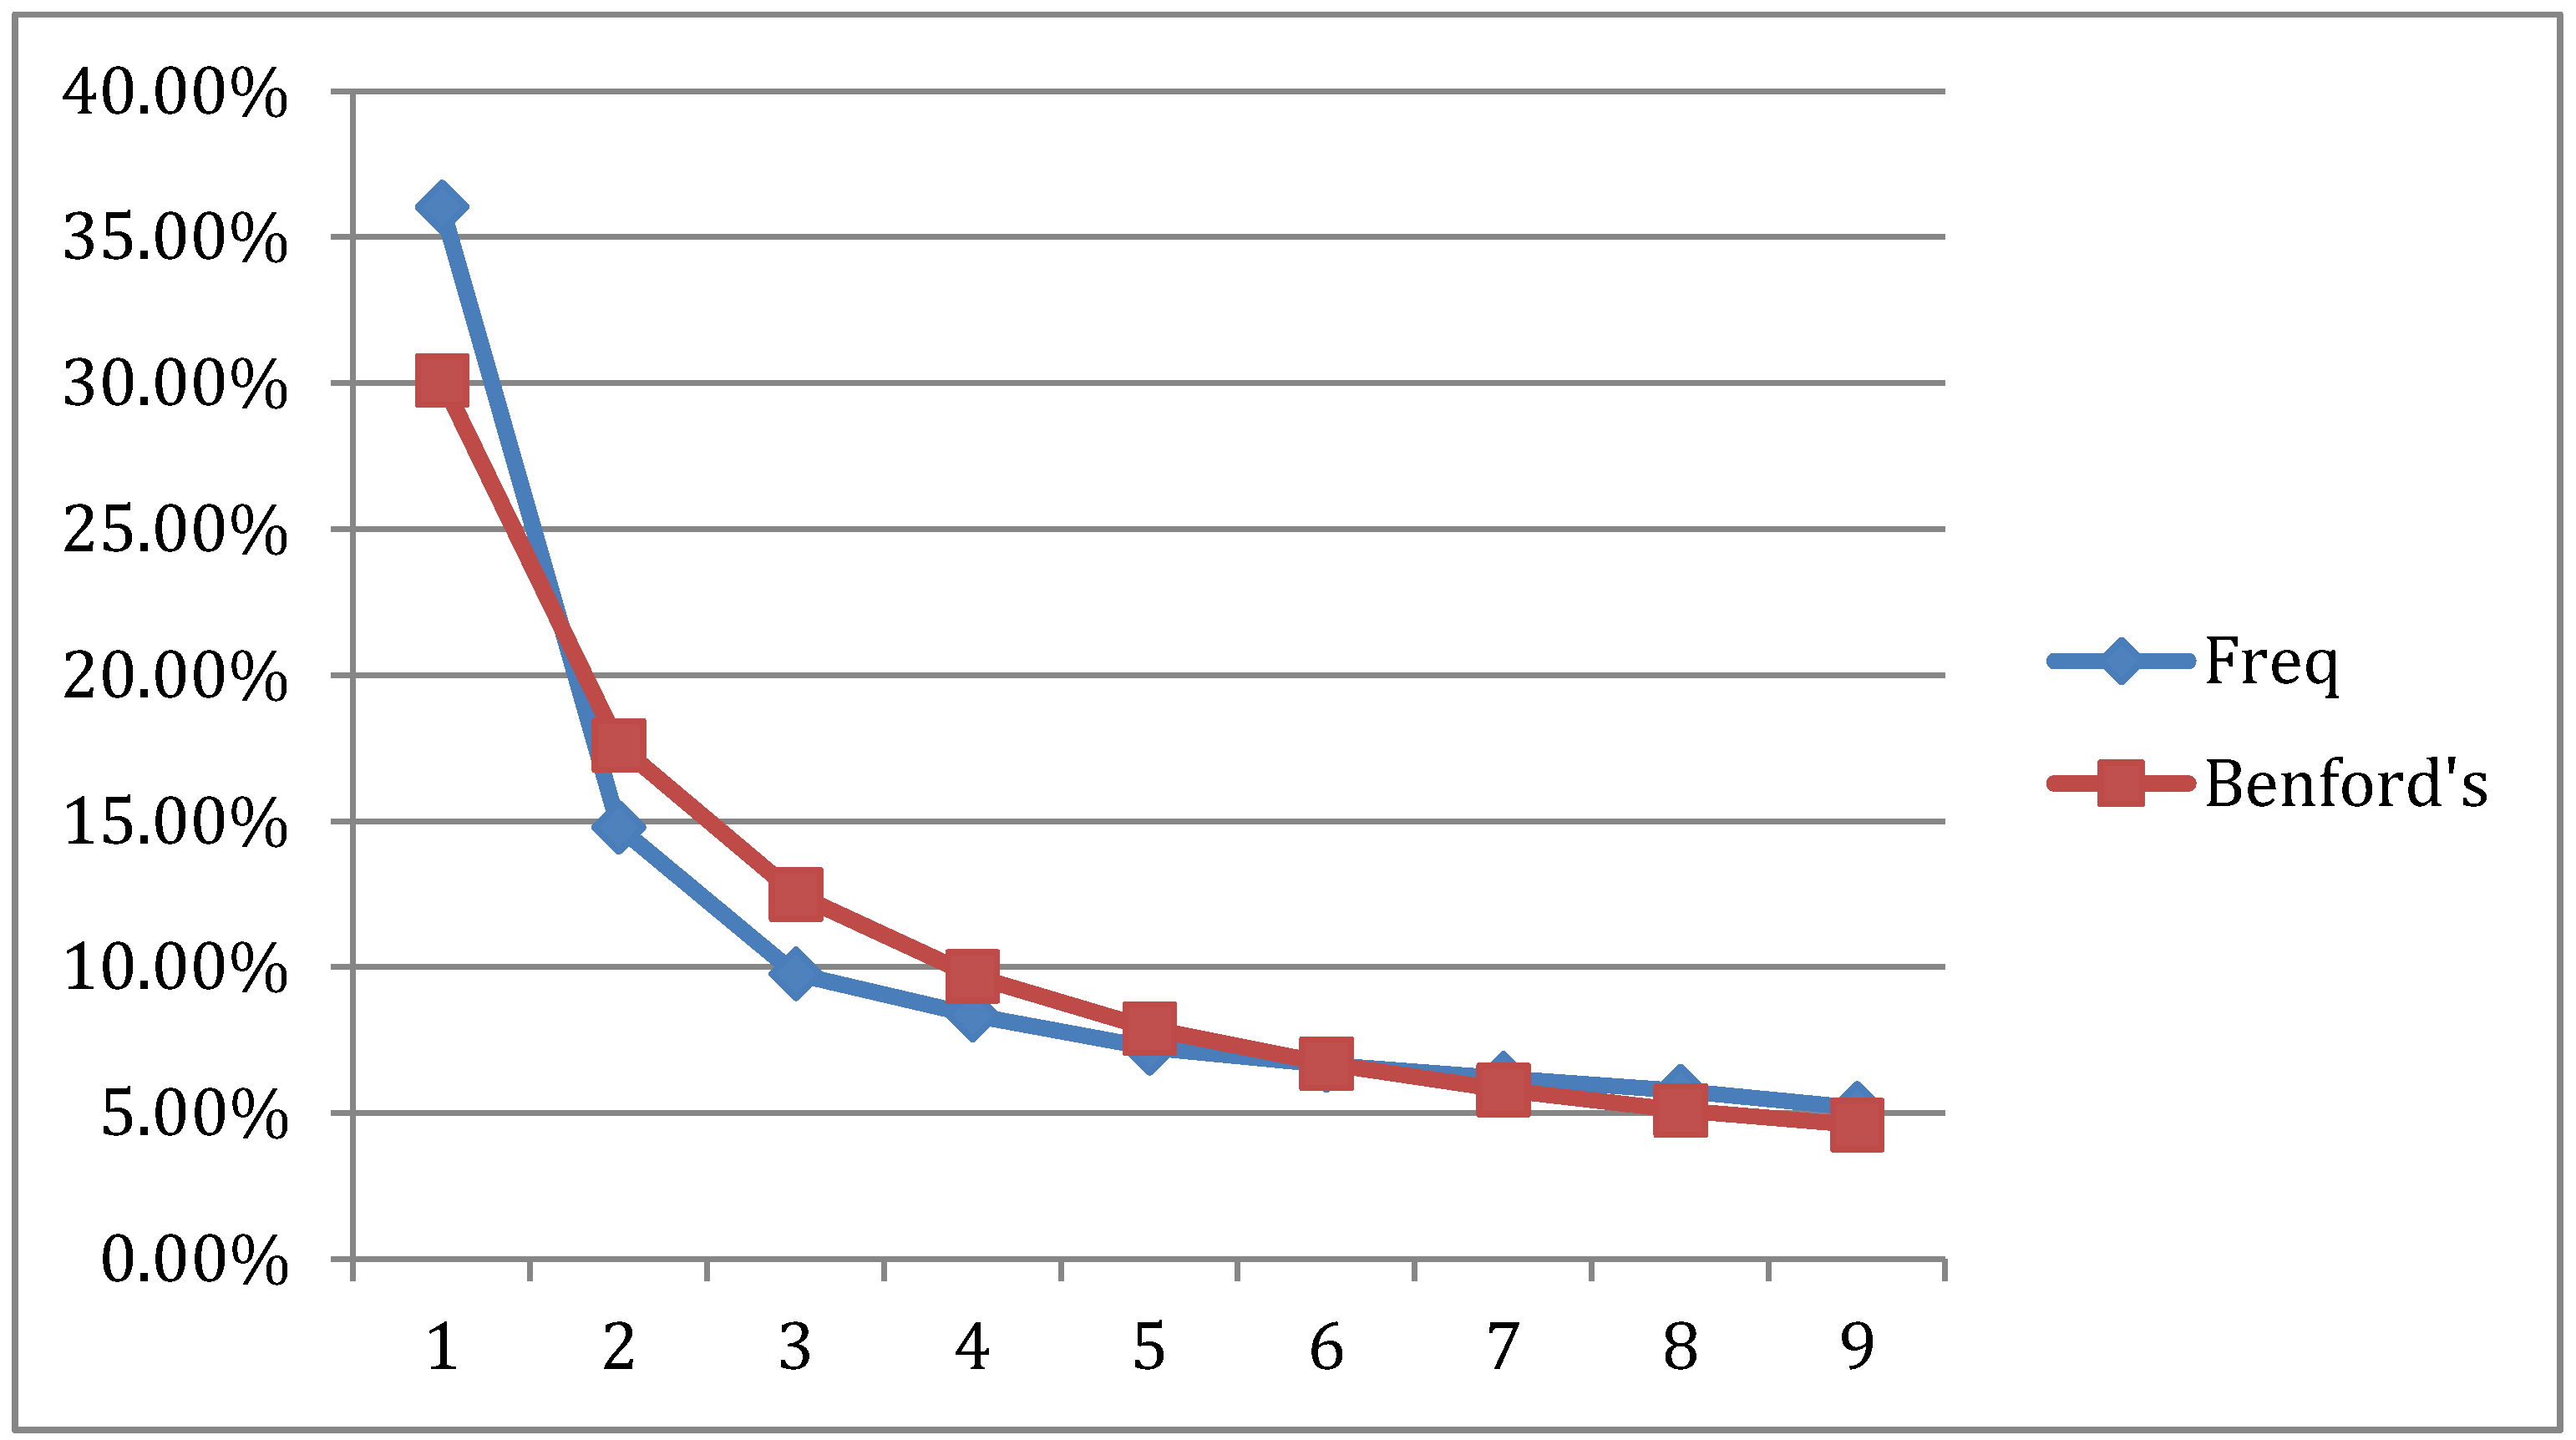
In Table 1, the goodness of fit Chi-square values for all years are well below the 0.05 critical value, and this suggests the high correlation between Australia’s 2008–2013 income FSD and Benford’s law. As another FSD comparison, we combine the Australian income data for a sample of six years and compute the combined FSD frequencies for each digit. This aggregate FSD distribution is depicted in Figure 4. Once again, the goodness of fit between Benford and the empirical first digit distribution is excellent and reflected by a significant Chi-square value of 0.026.
Figure 4.
Australia 2008–2013 aggregate income FSD and Benford’s Distribution.
Macro and microeconomics are two usual ways we analyze and summarize the information in economic systems and choices, and, in this case, income distributions. These empirical Australian income distribution results suggest that Benford’s FSD distribution is another way to exhibit and summarize economic behavior and its allocative and distributional impact on economic activity in a behavioral system. Recognizing the Benford-like distributional nature of behavioral systems, we next investigate whether there is a possible entropy connection between adaptive behavior and entropy maximization.
3. Entropy Based Estimation and Inference
In seeking a new way to analyze the question posed at the end of Section 2, we follow [9] and recognize the connection between adaptive intelligent behavior, causal entropy maximization and self-organized equilibrium seeking behavior in an open dynamic economic behavioral system. In the behavioral area, causal entropy maximization is a link that leads us to believe that an economic behavioral system with a large number of agents, interacting locally and in finite time, is in fact optimizing itself [10]. The connection between causal adaptive behavior and entropy maximization, based on a causal generalization of entropic forces, suggests that economic social systems do not evolve in a deterministic or a random way but tend to adapt behavior in line with an optimizing principle. As we seek a new way to think about Benford’s FSD system and information recovery in the causal adaptive behavior of large complex and dynamic micro economic systems, we use entropy as the systems optimizing criterion-status measure.
3.1. Problem Formulation and Solution
In the previous section, we discussed the Newcomb-Benford approach to determining the seemingly general exponential distribution of FSDs. Pre-analysis knowledge suggests that the FSD distribution of a sequence of positive real numbers from scale-independent multiplicative data should vary with the phenomena in question. In this context, information theoretic methods offer a natural way to establish a data based link and capture the varying monotonically decreasing nature of the FSDs.
To use information theoretic methods to recover the FSD distribution from a sequence of positive real numbers, we follow [11] and assume for the discrete random variable (for ) that at each trial, one of nine digits is observed with probability . Suppose after trials, we have first-moment information in the form of the average value of the FSD:
For illustration purposes, it may be helpful to think about the Benford-like recovery problem, within the context of a nine-sided die. The sample of realized values or the sequence of positive real numbers are then the result of rolling the die times. Based only on the , , and information, the problem cannot be solved for a unique solution. In such a situation, it seems useful to have an approach that permits the investigator to use sample based information recovery methods without having to choose a parametric family of probability densities on which to base the FSD function.
3.2. An Information Theoretic Approach
One way to solve this ill-posed inverse problem for the unknown , without making a large number of assumptions or introducing additional information, is to formulate it as an extremum problem. A solution is achieved by minimizing the divergence between the two sets of probabilities and optimizing a goodness-of-fit criterion, subject to data-moment constraint(s). One attractive set of divergence measures is the Cressie-Read (CR) power divergence family of statistics ([12,13]):
where is an arbitrary unspecified parameter. In the context of recovering the unknown FSD distribution, use of the CR criterion (2) suggests we seek a solution to the following extremum problem:
When the converges to an estimation criterion equivalent to the empirical likelihood (EL) criterion . As γ varies, power law behavior is efficiently described and the resulting estimators that minimize power divergence exhibit qualitatively different sampling behavior.
3.3. CR () Mean Related FSD Distribution
In terms of the information-theoretic variants of the CR , we demonstrate for the Benford problem the case of the CR criterion with a uniform reference distribution (). First moment information is used as a basis for recovering discrete FSD probability distributions. As noted above, under the criterion CR , the CR converges to the empirical likelihood criterion metric and the extremum likelihood function
The corresponding Lagrange function is
with solution
for the th outcome. As the mean of the significant first digits varies over a range of data sets, an exponential family of distributions results.
Using the CR(formulation and information about the mean, the resulting FSD distributions, first noted and analyzed by [11], are presented in the Table 2. For mean FSD values less than 5, the resulting estimated distributions reflect the monotonic decreasing FSD probabilities exhibited by the Benford distribution. As the FSD mean approaches the Benford mean 3.44, the CR-EL and FSD distributions are approximately equal. If we use the CR() criterion under a Benford reference distribution as , then with the first moment condition of 3.44, the Benford FSD distribution is exactly reproduced.
Table 2.
Estimated empirical likelihood (EL) distributions (with uniform reference distribution) for the FSD problem and their correlation (r) with Benford’s distribution.
| FSD Mean | r | |||||||||
|---|---|---|---|---|---|---|---|---|---|---|
| 3.0 | 0.395 | 0.173 | 0.111 | 0.082 | 0.065 | 0.053 | 0.046 | 0.040 | 0.035 | 0.990 |
| 3.44 | 0.300 | 0.177 | 0.125 | 0.097 | 0.079 | 0.067 | 0.058 | 0.051 | 0.046 | 1.000 |
| 4.0 | 0.208 | 0.161 | 0.132 | 0.111 | 0.096 | 0.085 | 0.076 | 0.068 | 0.062 | 0.980 |
3.4. Discussion
The relationship between the CR minimum divergence entropy measures and Benford’s FSD distribution, and the [14] physical statistics results, provide a basis for recovering information regarding the unknown micro behavioral parameters. In seeking an optimizing criterion with behavioral data, we have followed [9] and recognized the connection between adaptive intelligent behavior, causal entropy maximization and self-organized equilibrium seeking behavior. As noted in Section 3, the connection between causal adaptive behavior and entropy maximization, based on a causal generalization of entropic forces, suggests that behavioral systems do not evolve in a deterministic or a random way but tend to adapt behavior in line with an optimizing principle. As we think about the connection between Benford’s FSD distribution and information recovery in the causal adaptive behavioral of large complex and dynamic micro economic systems, entropy emerges as the systems status measure and a basis for gauging performance. Given the entropy-adaptation behavior connection method, we now return to the empirical example of the Australian income data and analyze the resulting income and the information theoretic behavioral distributions.
4. An Information Theoretic Example
Year by year comparisons between the Informational Theoretic Empirical Likelihood (EL) FSD distributions and the Benford FSD distribution are presented in Figure 5. As indicated by the Chi-Square and correlation values in Table 3, the year-by-year goodness of fit with Benford are excellent. In contrast, the information theoretic results statistically dominate the results reported in Figure 3 and Table 1.
Figure 5.
Australian yearly EL distributions and the Benford FSD distribution.
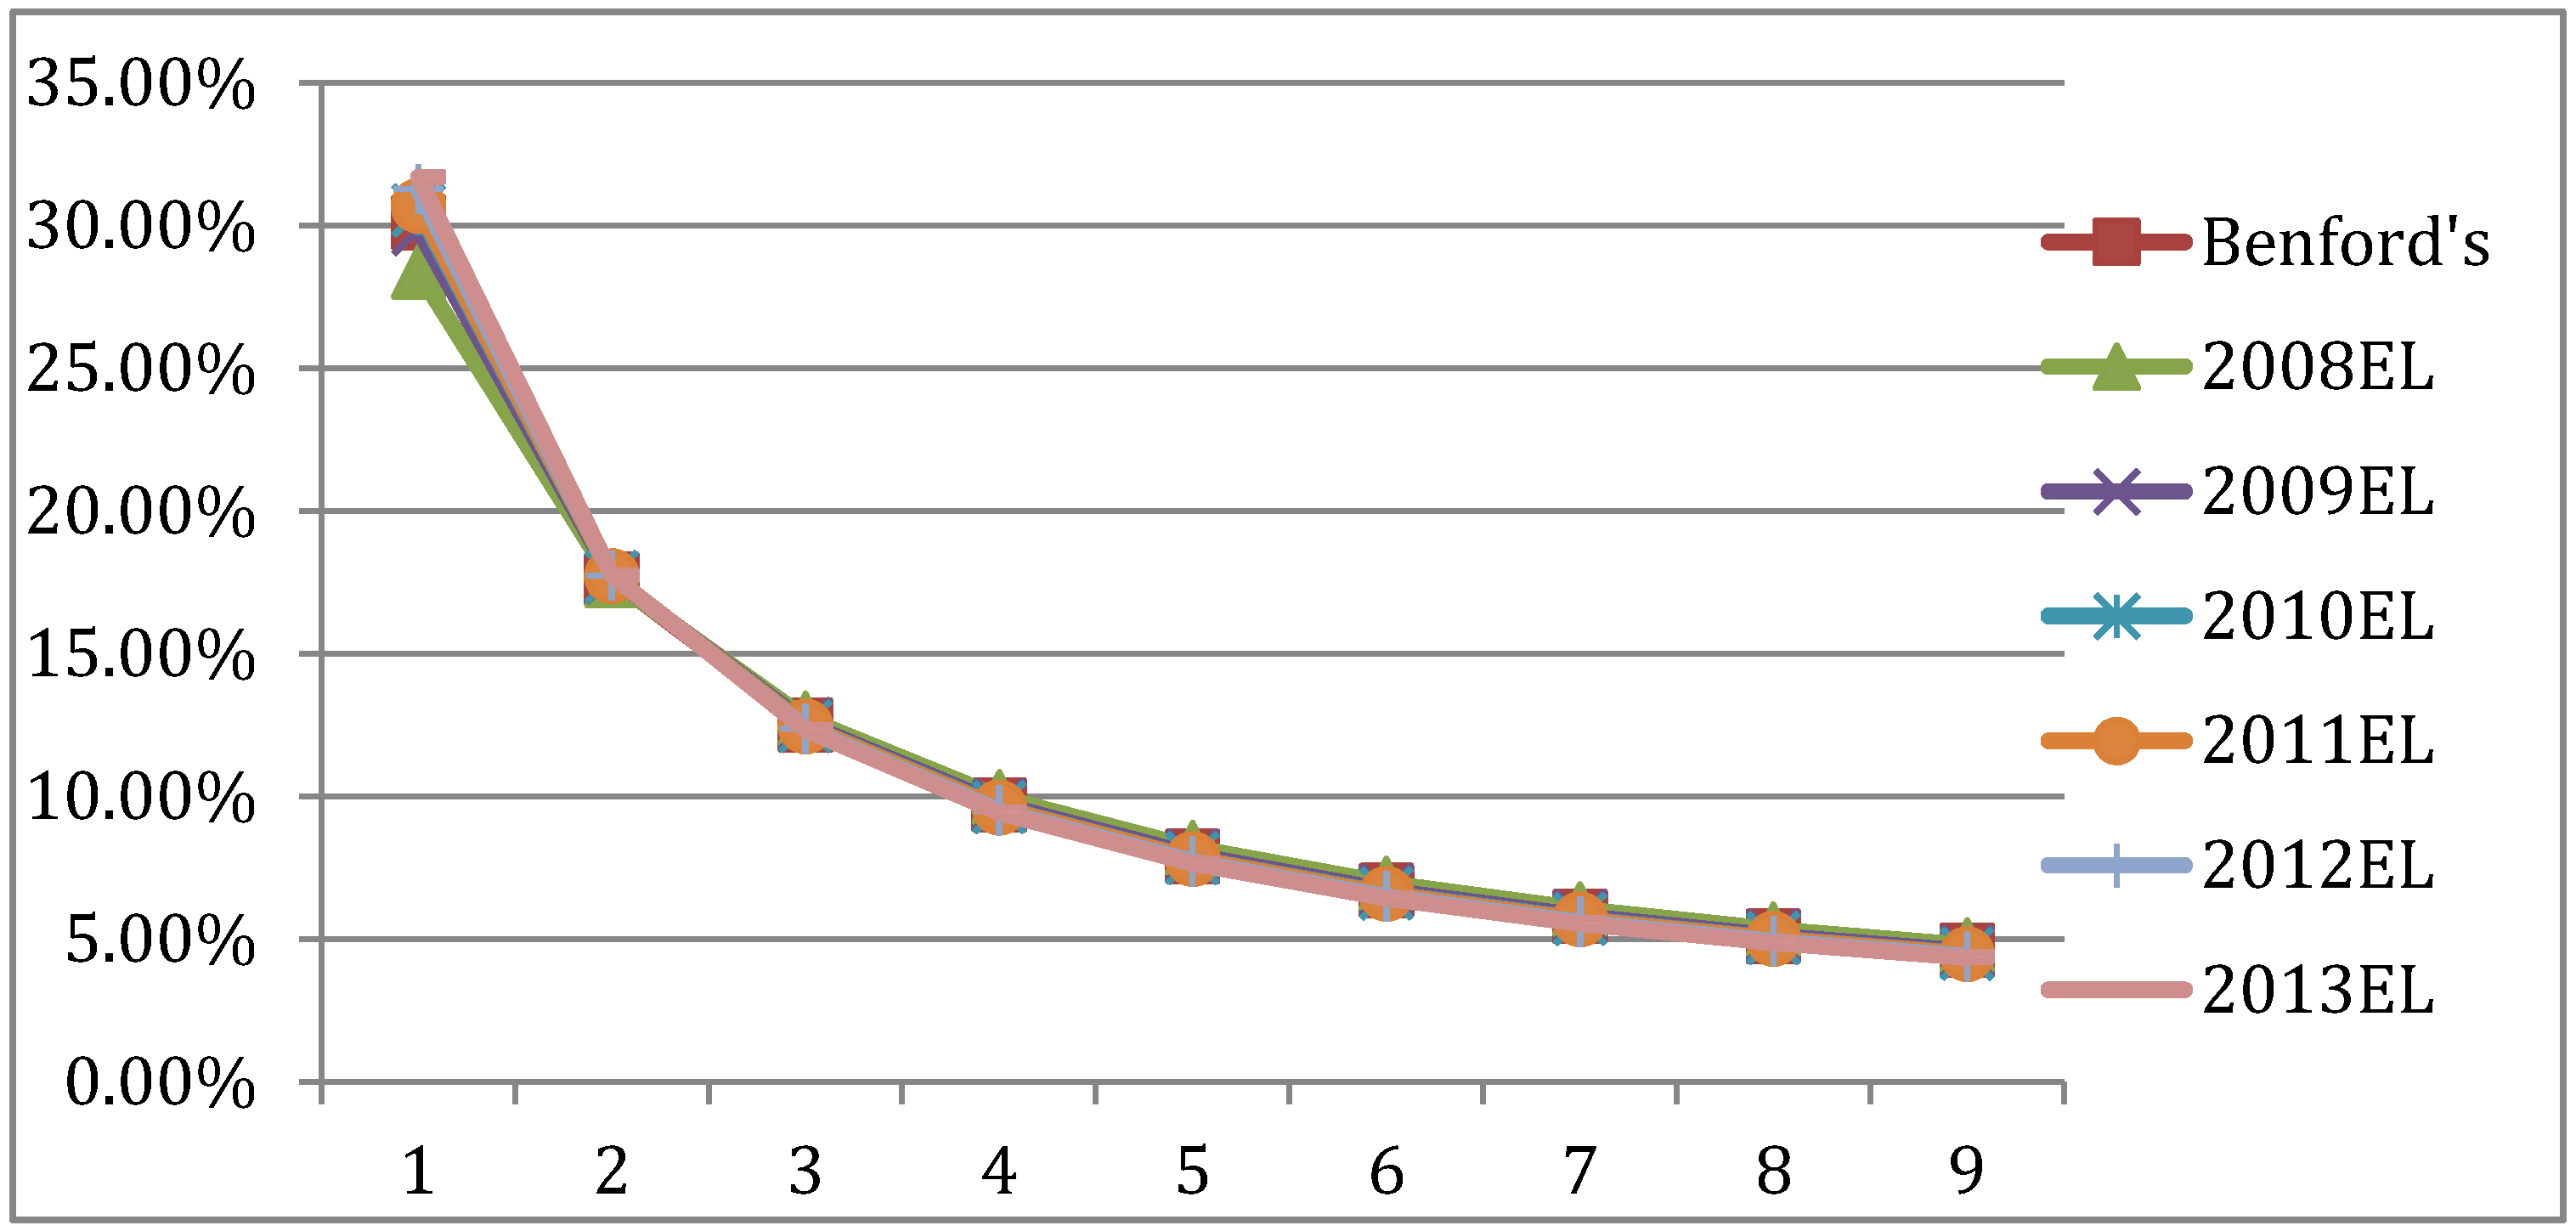
Table 3.
Chi Square values, correlations and significance for Australian yearly empirical likelihood (EL) distributions and the Benford FSD distributions.
| Statistic | 2008EL | 2009EL | 2010EL | 2011EL | 2012EL | 2013EL |
|---|---|---|---|---|---|---|
| Chi square | 0.0016 | 0.0000 | 0.0001 | 0.0002 | 0.0009 | 0.0015 |
| Correlation | 0.9994 | 1.0000 | 1.0000 | 1.0000 | 0.9998 | 0.9997 |
| Significance | 1.00 | 1.00 | 1.00 | 1.00 | 1.00 | 1.00 |
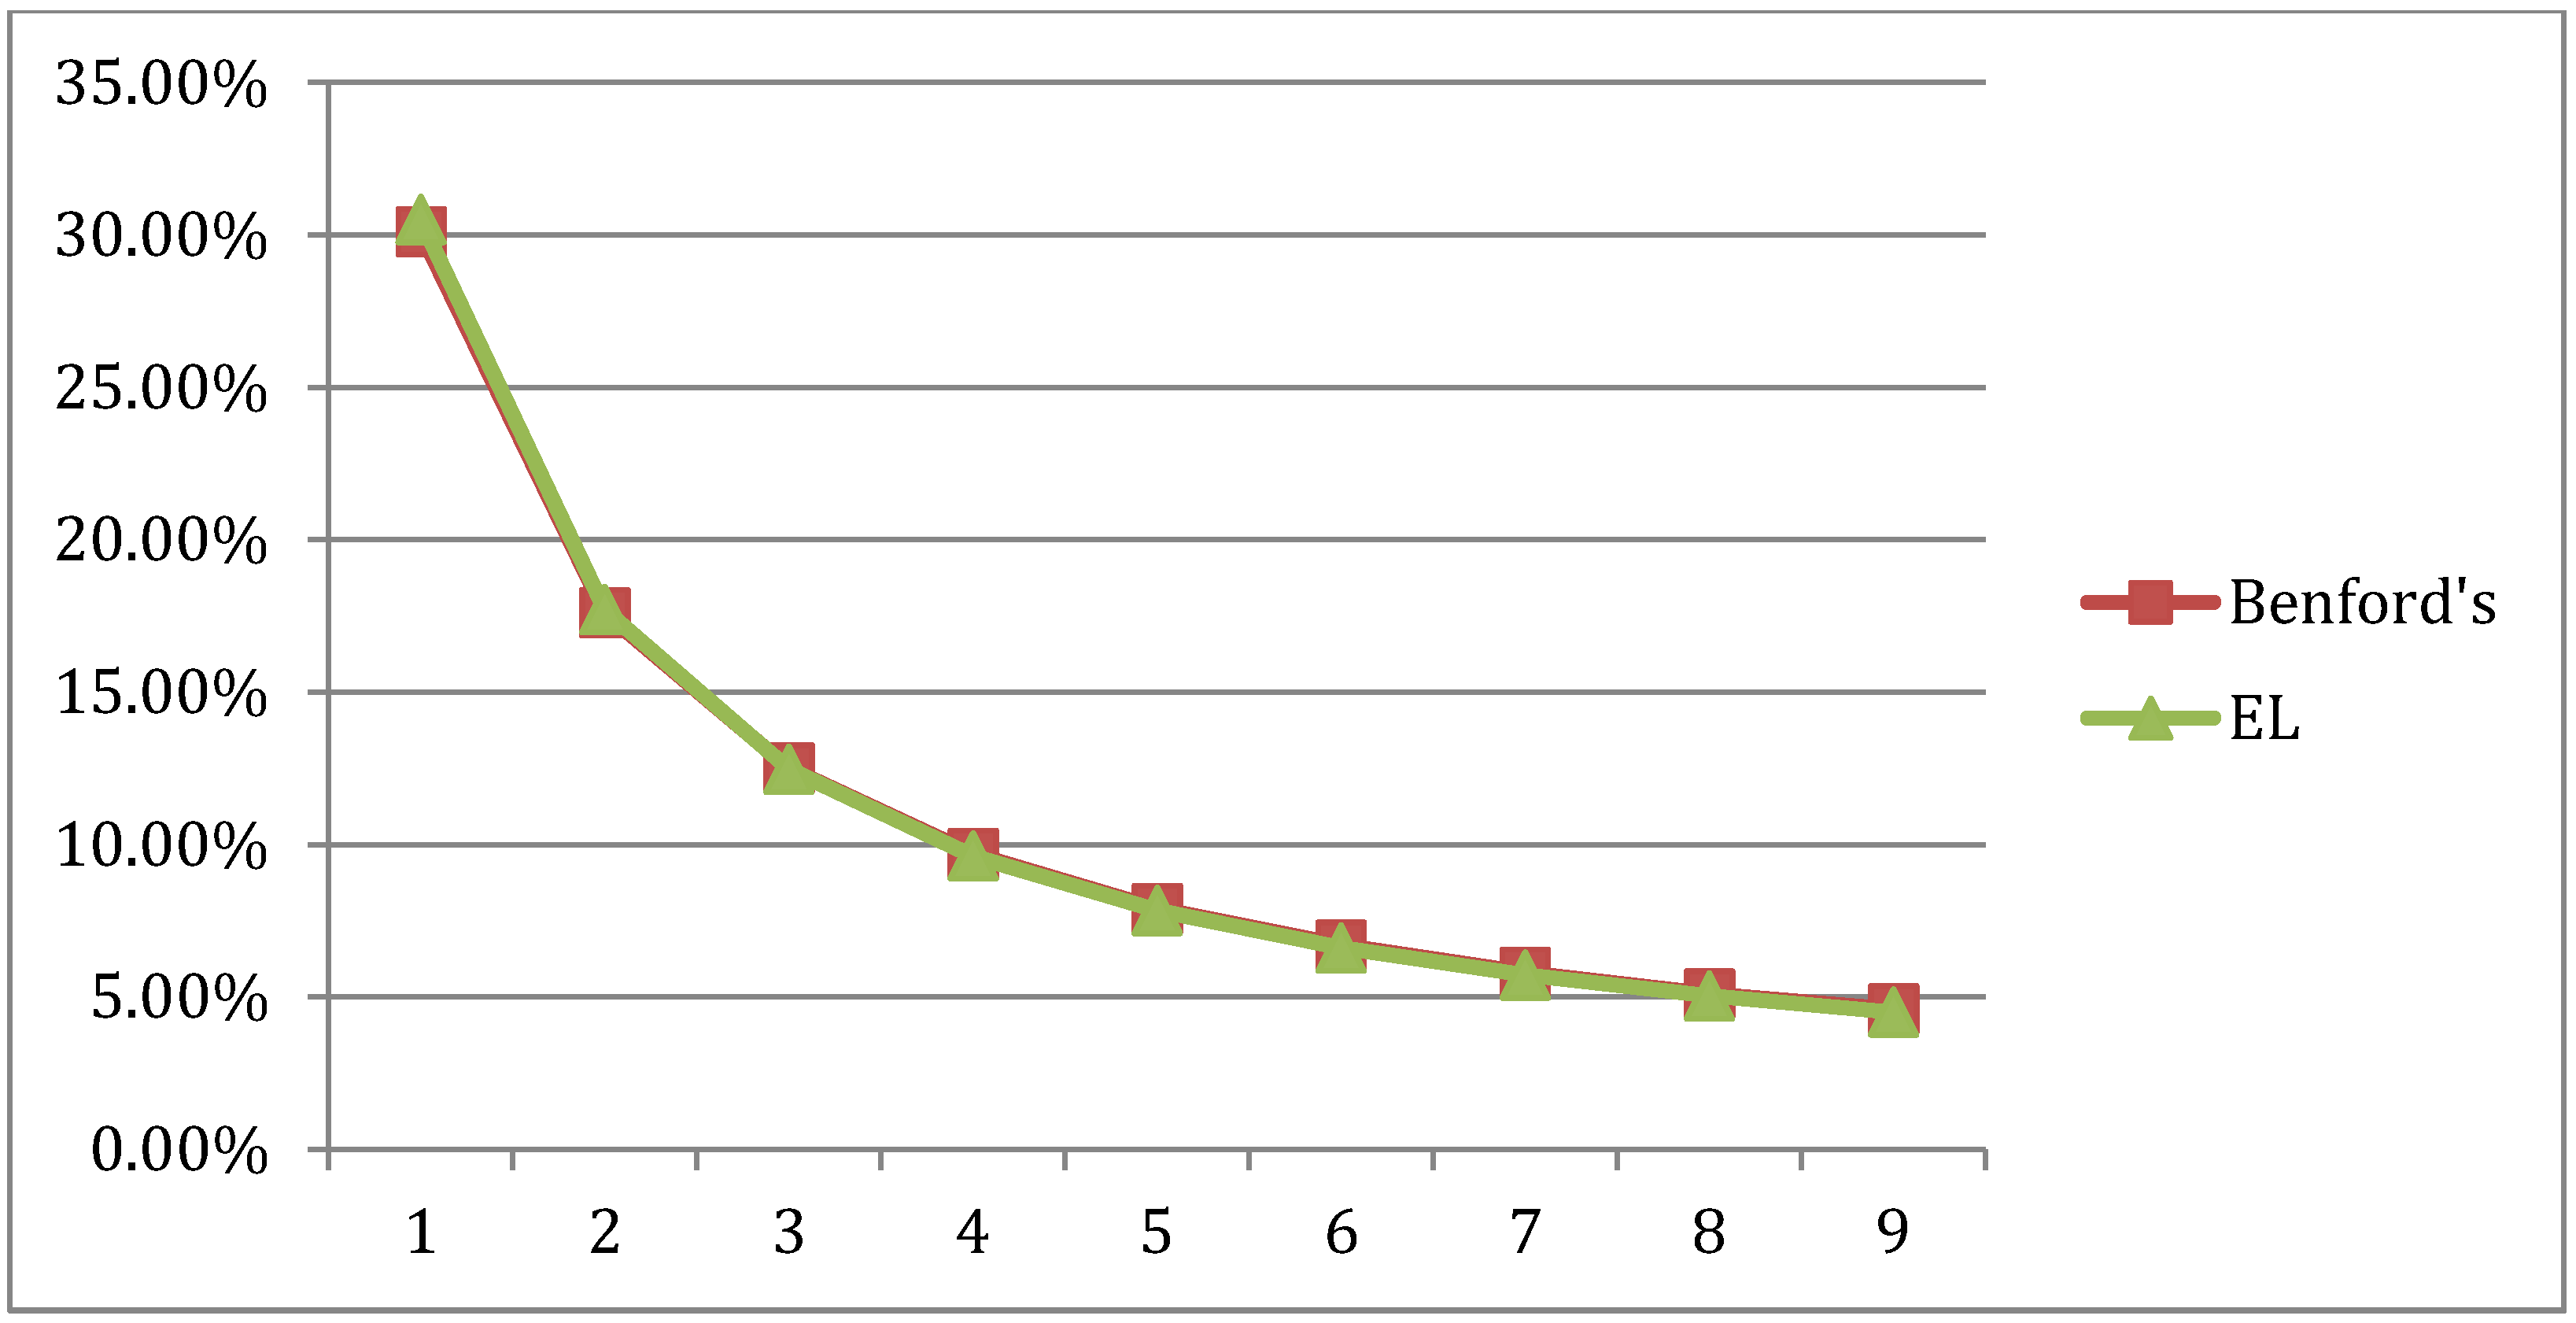
The result is that in terms of the goodness of fit, the Benford and aggregate EL distributions shown in Figure 6 are identical, as noted by a Chi square value of 0.000128 and correlation of 0.999. In this case, the EL distribution is the minimum distance solution since it satisfies all the constraints. It also identifies the Benford distribution as the base solution for the Australian aggregate income distribution in the behavioral system. For the comparable Maximum Entropy solution, see Appendix.
Figure 6.
Australian aggregate EL distributions and the Benford FSD distribution.

5. Conclusions
This paper has two main contributions: a new economic dataset (Australian micro income data); and a theoretical argument (minimizing entropy, Cressie-Read statistic) for why Benford’s Law might arise in large-scale behavioral systems—systems that do not evolve in a deterministic or a random way. In this context, in this paper we have presented evidence that important distributions in behavioral systems are closely linked to Benford’s FSD distribution, similar to what others have shown of physical systems. From the behavioral systems area, we have emphasized the correlation between the income distribution of micro data in Australia and Benford’s FSD law. These results that relate to important distributions from both the physical and social-behavioral worlds, add another bit of evidence in the direction that Benford’s law is not an artifact but a natural law. As we have demonstrated in the CR family of entropic functionals, in the limit as →−1, the empirical likelihood distribution with a Benford as the reference distribution exactly follows the Benford distribution. Although not presented, other members of the CR family of entropy distributions also reflect the exponential nature of the distribution of income in behavioral systems and appear to denote the universal nature of Benford’s law. From a methodological standpoint, we have demonstrated in a behavioral systems context, how information theoretic methods may be used in identifying and making distributional comparisons with Benford’s law. Looking ahead, we are assembling income micro datasets for the U.S., OECD, and China to investigate the extent that the Benford result is present in those behavioral income data sets.
Acknowledgments
We thank the editor and two anonymous referees for their suggestions and Scott Kaplan and Rebecca Taylor for helpful comments. We are thankful for support from the Giannini Foundation. We thank Kathryn Ryan for helping us access the HILDA dataset.
Author Contributions
All authors contributed equally to this paper.
Conflicts of Interest
The authors declare no conflict of interest.
Appendix
Maximum Entropy Distribution
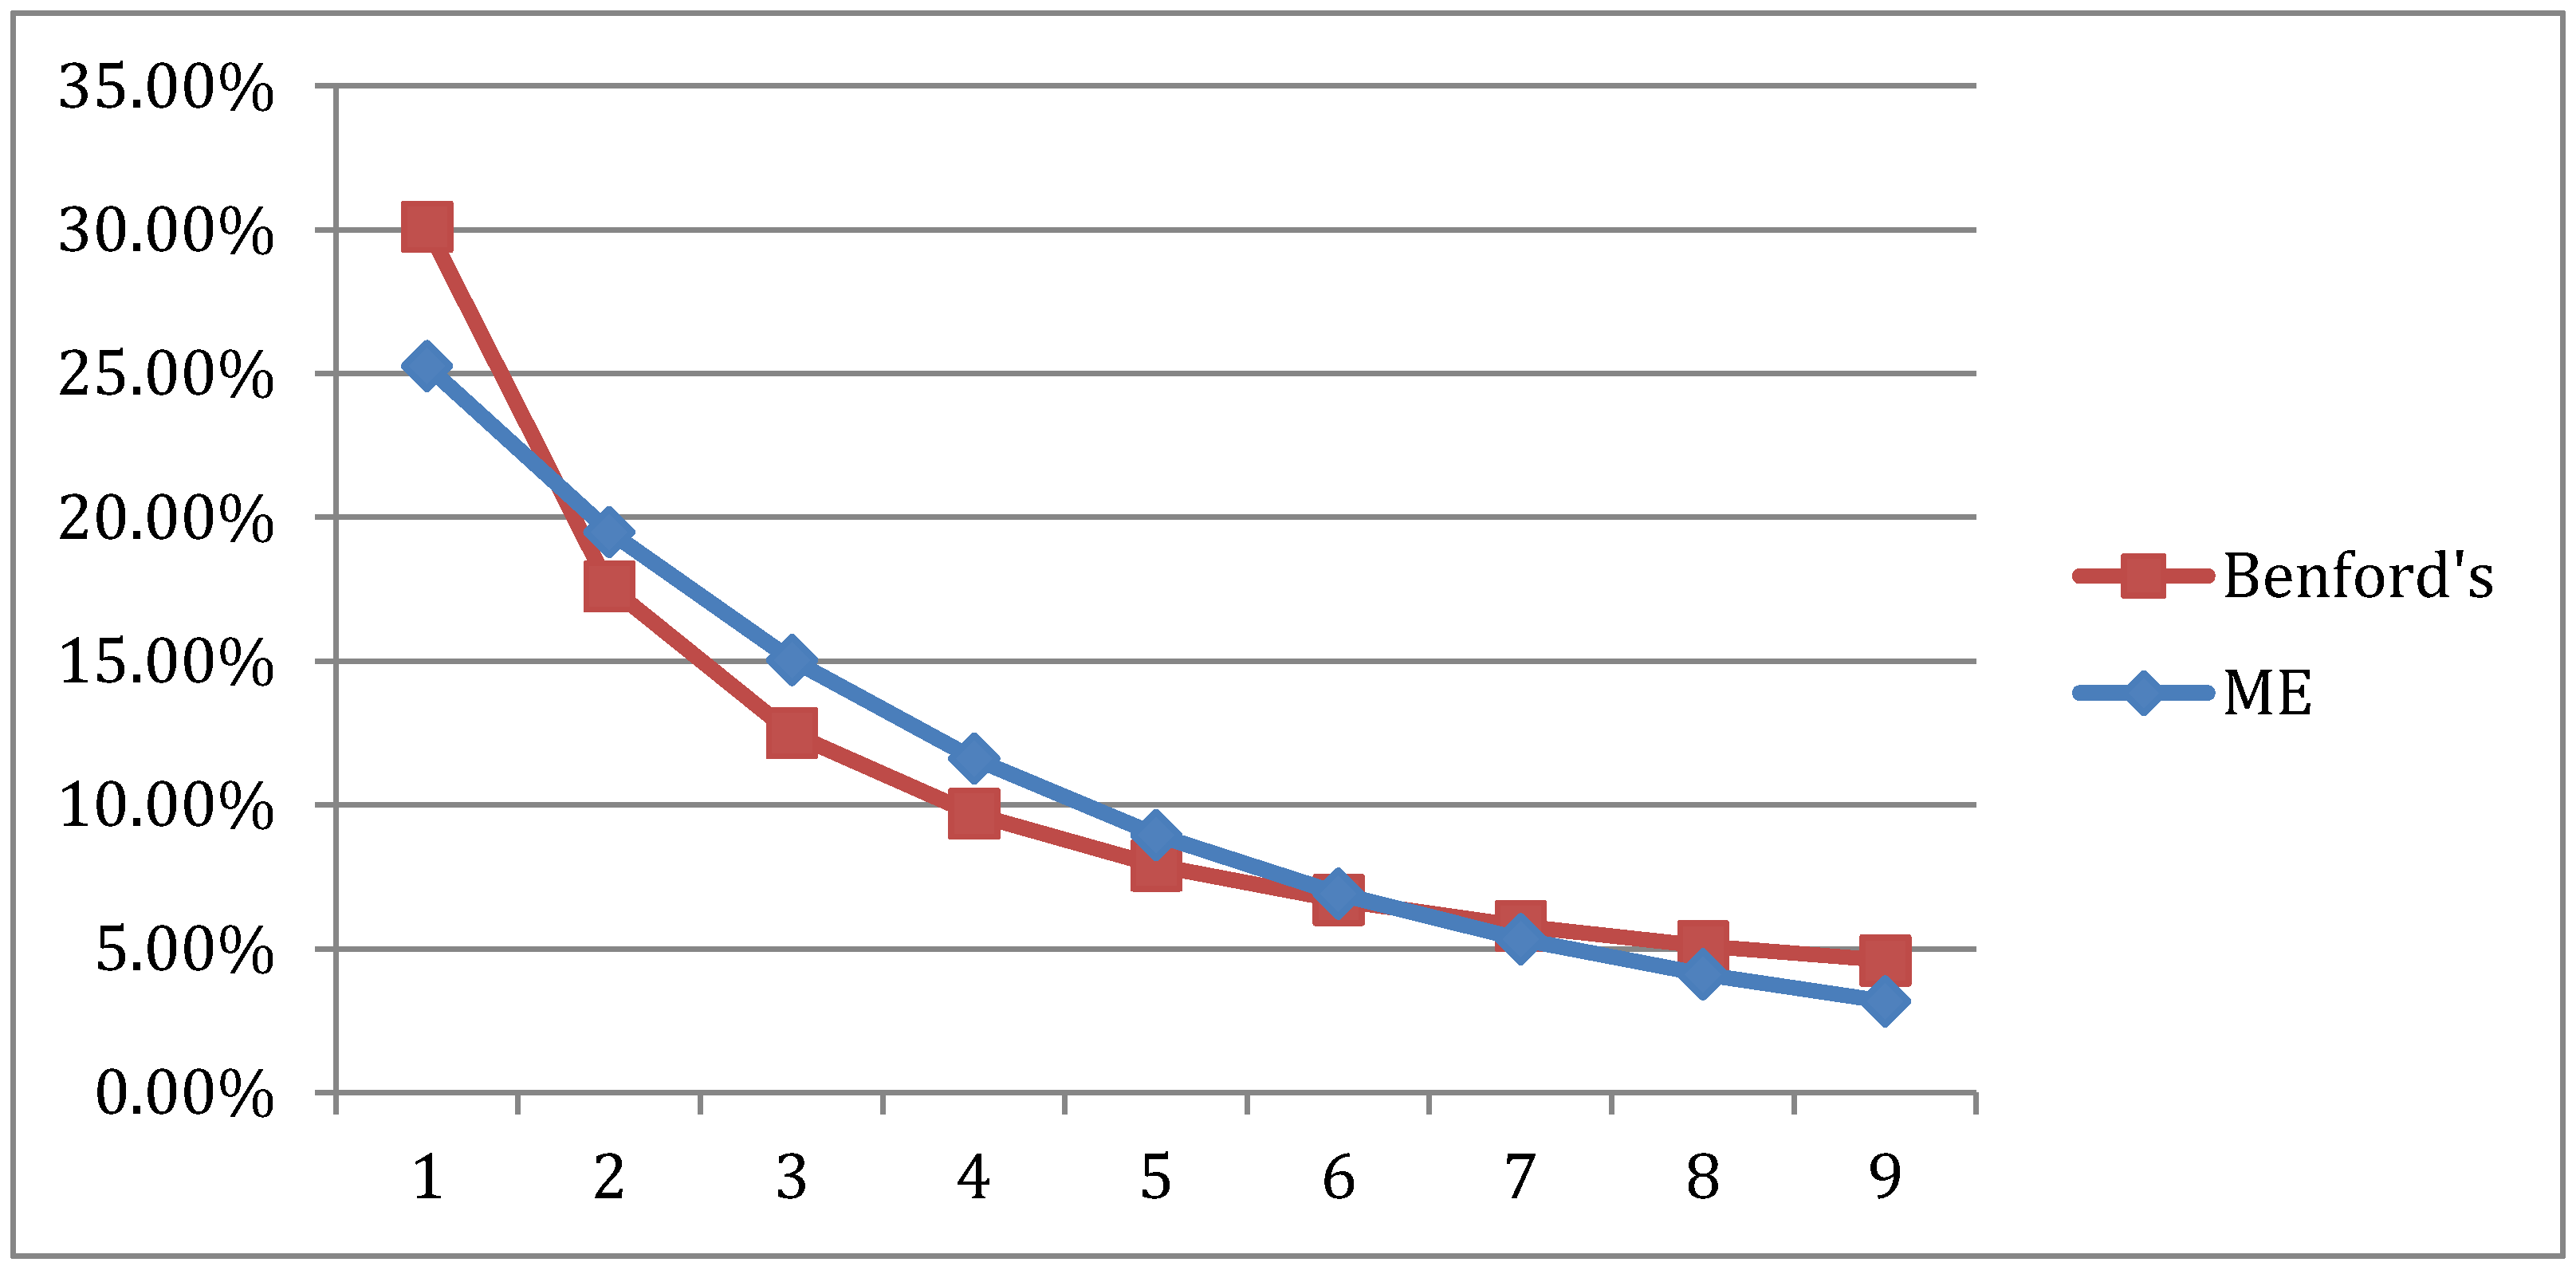
In Section 4, we made use of the CR family (Equation (2) in Section 3.2.) to analyze the performance of EL likelihood with the aggregate sample of Australian income microeconomic data. In this Appendix, we use the Maximum Entropy likelihood, when , from the CR family to compare the data FSD distribution with the Benford distribution. In Figure A1, the resulting Maximum Entropy distribution is compared to the Benford distribution and, relative to Figure 5, the goodness of fit leaves something to be desired.
Figure A1.
Australian Maximum Entropy Distribution and Benford FSD Distribution for the aggregate years 2008–2013. Chi square: 0.026945346, Correlation: 0.962189049.
Figure A1.
Australian Maximum Entropy Distribution and Benford FSD Distribution for the aggregate years 2008–2013. Chi square: 0.026945346, Correlation: 0.962189049.

However, when we use the Benford distribution as the reference distribution, the resulting Bayesian Maximum Entropy distribution exactly matches the Benford distribution with a Chi-square of 0.0001181 and a correlation of 0.999999999. Once again, this identifies the Benford distribution as the base solution for the income behavioral system.
References
- H. Varian. “Benford’s Law.” Am. Stat. 26 (1972): 65. [Google Scholar]
- S. Miller, ed. Benford’s Law: Theory and Applications. Princeton, NJ, USA: Princeton University Press, 2015.
- L. Shao, and B.-Q. Ma. “The Significant Digit Law in Statistical Physics.” Physica A 389 (2010): 3109–3116. [Google Scholar] [CrossRef]
- S. Newcomb. “Note on the Frequency of Use of the Different Digits in Natural Numbers.” Am. J. Math. 4 (1881): 39–40. [Google Scholar] [CrossRef]
- F. Benford. “The Law of Anomalous Numbers.” Proc. Am. Philos. Soc. 78 (1938): 551–572. [Google Scholar]
- B.B. Mandelbrot. “New Methods in Statistical Economics.” J. Polit. Econ. 71 (1963): 421–440. [Google Scholar] [CrossRef]
- A. Cho. “Physicists say it’s Simple.” Science 344 (2014): 828. [Google Scholar] [CrossRef] [PubMed]
- A. Salem, and T. Mount. “A Convenient Descriptive Model of Income Distribution: The Gamma Density.” Econometrica 42 (1974): 1115–1127. [Google Scholar] [CrossRef]
- A.D. Wissner-Gross, and C.E. Freer. “Causal entropic forces.” Phys. Rev. Lett. 110 (2013): 168702. [Google Scholar] [CrossRef]
- G. Judge. “Entropy Maximization as a basis for Information Recovery in dynamic Economic Behavioral systems.” Econometrics 3 (2015): 91–104. [Google Scholar] [CrossRef]
- M. Grendar, G. Judge, and L. Schechter. “An Empirical Non-Parametric Likelihood Family of Data-Based Benford-Like Distributions.” Physica A 380 (2007): 429–438. [Google Scholar] [CrossRef]
- N. Cressie, and T. Read. “Multinomial goodness-of-fit tests.” J. R. Stat. Soc. Ser. B (Methodol.) 46 (1984): 440–464. [Google Scholar]
- G. Judge, and R. Mittelhammer. An Information Theoretic Approach to Econometrics. New York, NY, USA: Cambridge University Press, 2012. [Google Scholar]
- L. Shao, and B.-Q. Ma. “First Digit Law in Non Extensive Statistics.” Phys. Rev. E 82 (2010). [Google Scholar] [CrossRef]
- 2Among many who have used Benford’s law to check the validity of purported scientific data in the social sciences see [1,2] for a survey. For instance, the law has been used in census data, eBay auction prices, users of on-line social networks, voting fraud, macroeconomic data, and religious activity.
- 3The data can be obtained from the webpage http://www.melbourneinstitute.com/hilda/data/ by submitting a request for access.
© 2015 by the authors; licensee MDPI, Basel, Switzerland. This article is an open access article distributed under the terms and conditions of the Creative Commons Attribution license ( http://creativecommons.org/licenses/by/4.0/).
Share and Cite
MDPI and ACS Style
Villas-Boas, S.B.; Fu, Q.; Judge, G. Is Benford’s Law a Universal Behavioral Theory? Econometrics 2015, 3, 698-708. https://doi.org/10.3390/econometrics3040698
AMA Style
Villas-Boas SB, Fu Q, Judge G. Is Benford’s Law a Universal Behavioral Theory? Econometrics. 2015; 3(4):698-708. https://doi.org/10.3390/econometrics3040698
Chicago/Turabian StyleVillas-Boas, Sofia B., Qiuzi Fu, and George Judge. 2015. "Is Benford’s Law a Universal Behavioral Theory?" Econometrics 3, no. 4: 698-708. https://doi.org/10.3390/econometrics3040698