Genus-Specific Real-Time PCR and HRM Assays to Distinguish Liriope from Ophiopogon Samples
by
 and
and
Eva Masiero
1, 
Dipanwita Banik
1,2,
John Abson
3,
Paul Greene
3,
Adrian Slater
1 and
Tiziana Sgamma
1,* 1
Biomolecular Technology Group, Allied Health Sciences, Faculty of Health and Life Sciences, De Montfort University, Leicester LE1 9BH, UK
2
CSIR-North East Institute of Science & Technology, Jorhat 785006, Assam, India
3
Environmental Industries and Business, Brooksby Melton College, Brooksby Campus, Brooksby, Leicestershire LE14 2LJ, UK
*
Author to whom correspondence should be addressed.
Plants 2017, 6(4), 53; https://doi.org/10.3390/plants6040053
Submission received: 20 September 2017
/
Revised: 17 October 2017
/
Accepted: 19 October 2017
/
Published: 26 October 2017
(This article belongs to the Special Issue Medicinal Plants and Natural Product Research)
Abstract
:Liriope and Ophiopogon species have a long history of use as traditional medicines across East Asia. They have also become widely used around the world for ornamental and landscaping purposes. The morphological similarities between Liriope and Ophiopogon taxa have made the taxonomy of the two genera problematic and caused confusion about the identification of individual specimens. Molecular approaches could be a useful tool for the discrimination of these two genera in combination with traditional methods. Seventy-five Liriope and Ophiopogon samples from the UK National Plant Collections of Ophiopogon and Liriope were analyzed. The 5′ end of the DNA barcode region of the gene for the large subunit of ribulose-1,5-bisphosphate carboxylase/oxygenase (rbcLa) was used for the discrimination of the two genera. A single nucleotide polymorphism (SNP) between the two genera allowed the development of discriminatory tests for genus-level identification based on specific PCR and high-resolution melt curve (HRM) assays. The study highlights the advantage of incorporating DNA barcoding methods into plant identification protocols and provides simple assays that could be used for the quality assurance of commercially traded plants and herbal drugs.
1. Introduction
Plants belonging to the genera Liriope Lour. and Ophiopogon Ker Gawl. are collectively known by the English common name liriopogon [1,2,3]. The collective name itself indicates the close relationship and morphological similarities between the two genera and the potential for misidentification. Liriopogon are widely cultivated as ornamentals and ground cover plants for garden landscaping due to their hardiness, and pest and disease resistance. However, mishandling, mislabelling, and mismanagement of nursery practices can lead to sexual propagation of cultivars, hybridisation, plant substitution, and finally degradation of the morphological/phenotypic identity of the cultivars [4].
Tubers of a few species of both Liriope and Ophiopogon are used in traditional medicines across East and South Asia for the treatment of respiratory ailments, diabetes, thirst, and as an aphrodisiac [5]. In the Chinese and Korean traditions, substitution of Liriope for Ophiopogon is permissible, although the Chinese Pharmacopoeia considers them to be separate remedies [6]. In contrast, the Japanese Pharmacopoeia stipulates that the traditional medicine “Bakumondo” must be derived from O. japonicus tubers, i.e., material derived from Liriope is not a legal substitute. The close similarity in the morphological characteristics of their leaves and tubers makes it difficult to distinguish between members of the two genera in both the horticultural and phytopharmaceutical industries [4]. Methods for discrimination of samples from the two genera are therefore important for quality assurance in these commercial sectors.
Authentication of plant material used for herbal medicines typically relies on chemical analysis. Liriopogons are characterised by their content of steroidal saponins and homoisoflavonoids [6,7,8]. TLC methods are straightforward and suitable for multiple samples. A TLC assay to distinguish the two genera has been developed, but is limited by low sensitivity and resolution [9]. More precise analysis of the saponin and flavonoid components has been achieved by HPLC-UV [10] and HPLC-UV-ELSD [8], but these require a long run time for each individual sample. Recent comparison of the two genera by LC-MS/MS also showed that differences in the profiles of steroidal saponins and homoisoflavonoids could be used to discriminate between Ophiopogon and Liriope [6].
DNA-based tests have emerged as a powerful system for authentication of medical plants and commercial herbal products [11,12,13]. Many of these target “DNA barcode” regions of the plant genome. DNA barcoding is a technique for identifying biological specimens using short DNA sequences from either the nuclear or organelle genome, termed DNA barcodes. In plants, the major DNA barcode candidates are the plastid matK, rbcL, and trnH-psbA loci and the nuclear ribosomal ITS region (nrITS) [14,15,16,17]. DNA tests have been developed to distinguish Liriope from Ophiopogon, including the use of SCAR [18] and EST-SSR [19] markers. A barcoding approach targeting a SNP in the 3′ region of the rbcL region was developed by Ito et al. (2015) [20]. Digestion with the restriction enzyme HincIII cut amplicons from Liriope into two fragments, but left Ophiopogon amplicons intact. This is an effective assay, but the digestion and gel electrophoresis steps are time-consuming and limit the throughput of the assay.
The current study proposes a new strategy for the identification of Ophiopogon and Liriope species by designing specific real-time PCR and high-resolution melt curve (HRM) assays targeting genus-specific single nucleotide polymorphisms (SNPs) in the rbcL barcode region. These techniques are ideally suited for the design of quick, reliable, robust, and affordable identification assays that could be incorporated into industrial quality control procedures for herbal medicines [13].
This project arose from a collaboration to verify the identity of accessions in the UK National Collections of Ophiopogon and Liriope by DNA barcoding [21]. However, to date, there are few examples of DNA techniques being applied to the classification of cultivated ornamental plants. An identification test based on DNA barcoding would be much faster than the traditional botanical methods of identification, which require growing the target plants to the flowering stage, in parallel with control plants. This new affordable method could also be useful for nurseries and plant collections and the wider horticultural community of professional and amateur gardeners.
2. Results
2.1. DNA Barcoding of the rbcLa Region of Liriope and Ophiopogon Accessions
The plastid rbcLa barcode region of 75 National Collection Ophiopogon and Liriope specimens was analysed (Table S1). Genomic DNA was extracted from all the samples and amplified by conventional PCR using rbcLa generic primers. The expected fragment of about 700 bp was clearly visualised in all of the Ophiopogon and Liriope samples (Figure 1).
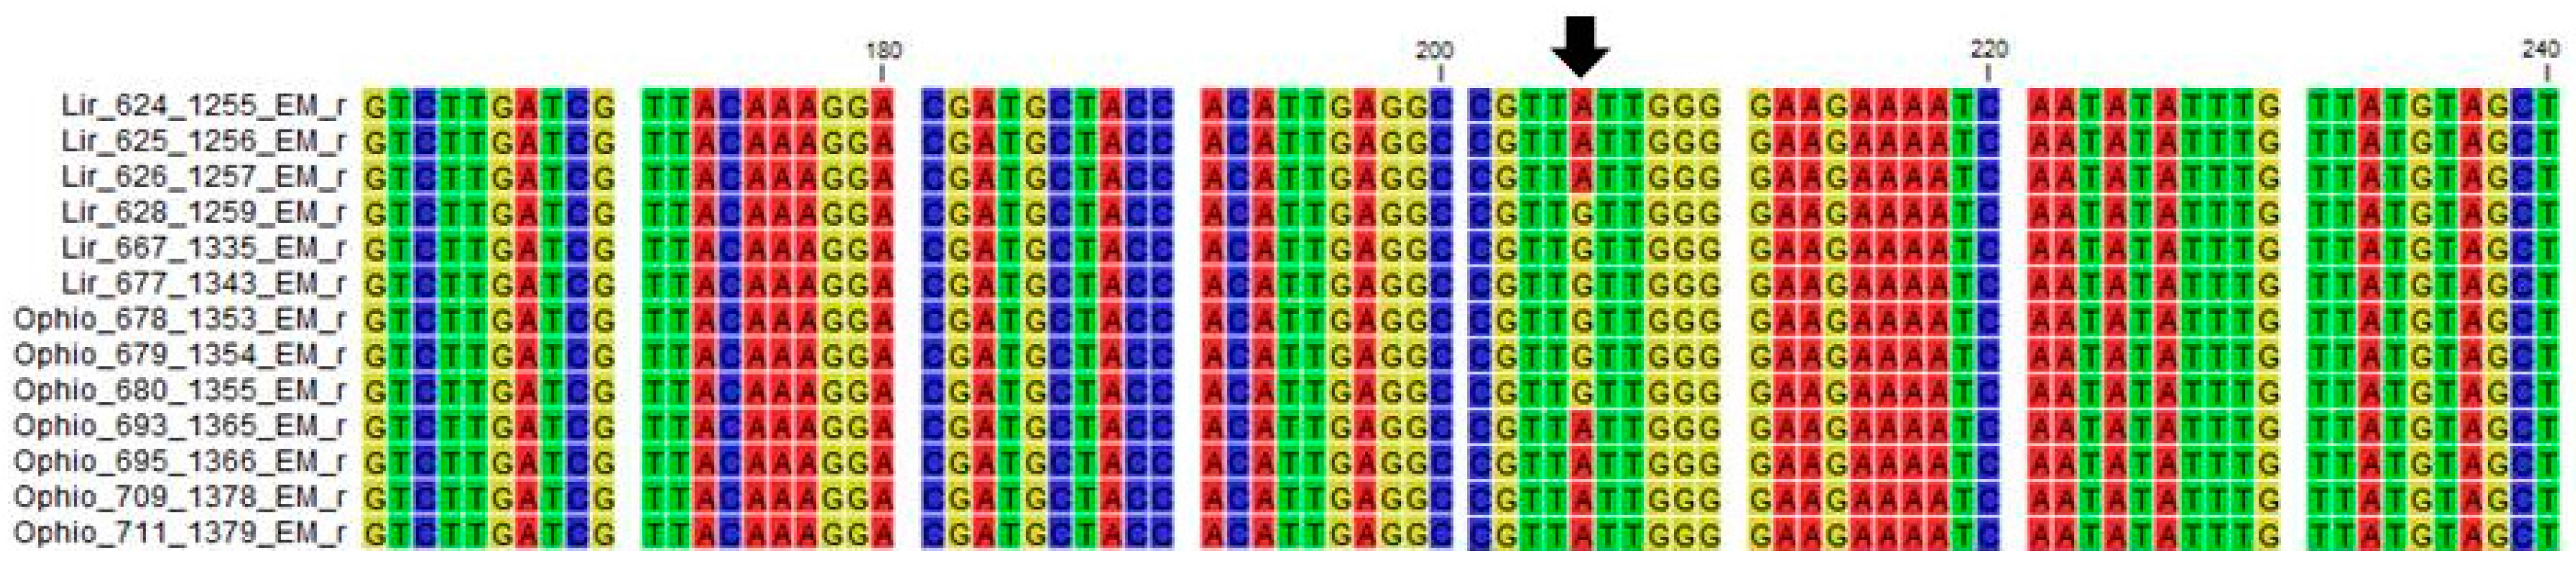
In order to confirm the genus and the species, the rbcLa amplicons were sequenced from the rbcLa primer. A multiple sequence alignment was generated, combining sequences from the GenBank database with the newly generated sequences (Figure S1). The alignment showed very little sequence variation between species of the same genus, with just three single nucleotide polymorphic (SNP) positions observed. One was found to vary between the two genera, with the guanine predominantly present in the Ophiopogon samples substituted by an adenine in the Liriope samples (Figure 2).
Only four Ophiopogon samples (693, 695, 709, and 711) and three Liriope samples (628, 667, and 677) did not fit this SNP pattern, having instead an adenosine and a guanine, respectively (Figure 2). One explanation is that these accessions had been misidentified. Three of the atypical Ophiopogon accessions had been classified as the same species, O. japonicus, but the three atypical Liriope accessions were originally classified as different species: L. graminifolia, L muscari, and L spicata. Morphological analysis of these specimens was not able to resolve this, since the vegetative aerial parts share common morphological characters (Figure S2).
In order to resolve the anomaly, the identity of these specimens was determined by DNA barcoding of the nrITS region (data not shown). The nrITS sequences of all seven specimens confirmed the genus assignment indicated by the rbcLa SNP, i.e., the plants did appear to have been mislabelled or misidentified. The consistent genus-specificity of the SNP confirmed by these results presented an opportunity to discriminate the Ophiopogon and Liriope genera by designing specific PCR primers to target this SNP.
2.2. The rbcL Feature Provides a Target for Simple Genus Discriminatory Tests
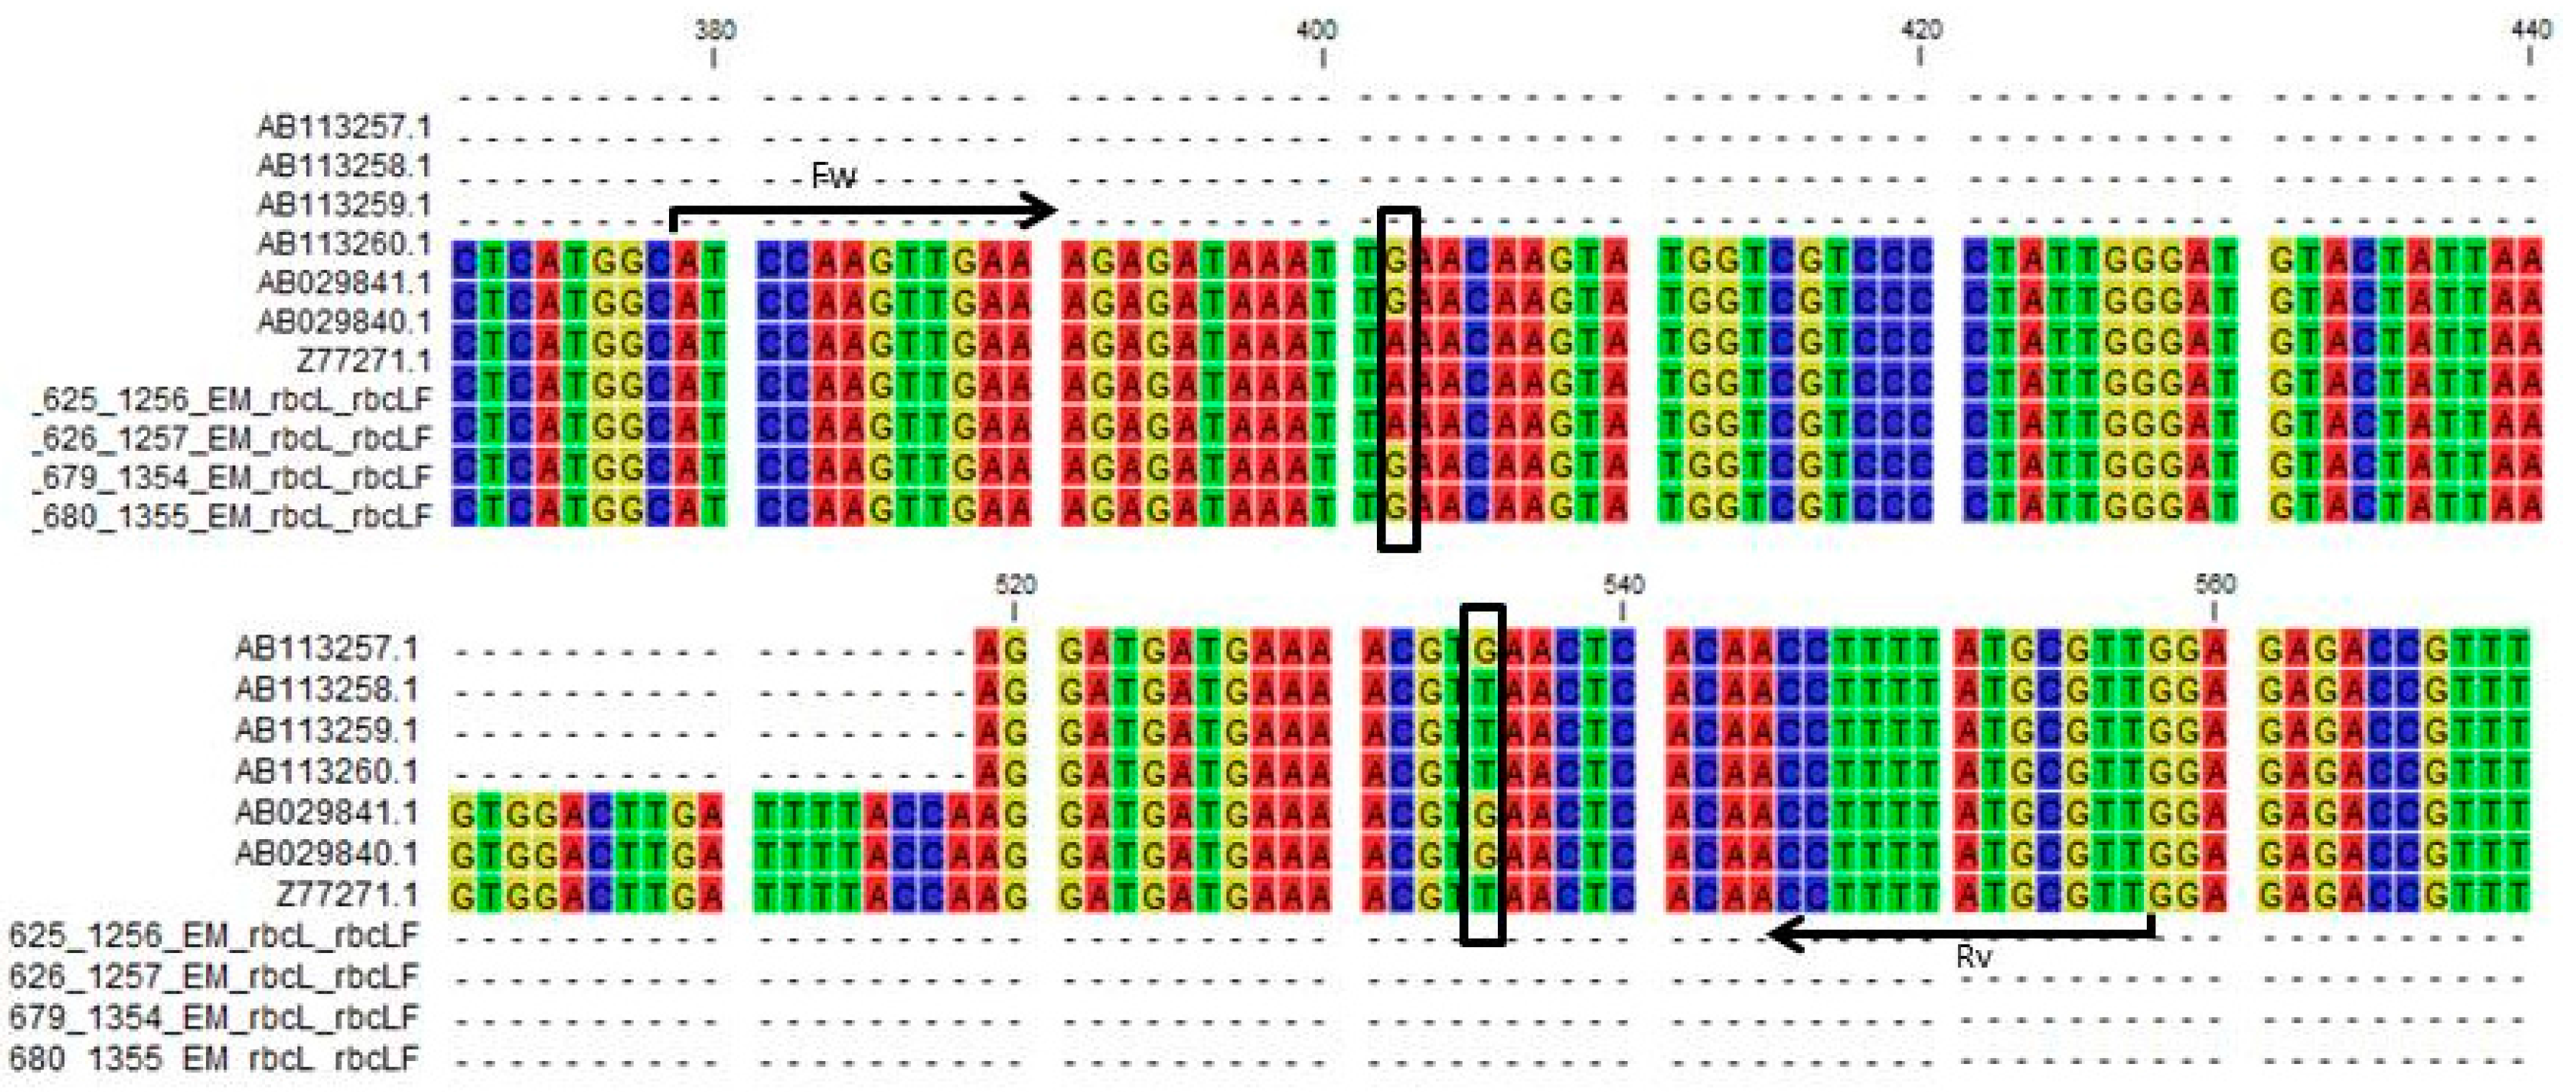
In a study conducted by Ito et al. (2015) [21] it was reported that the two genera showed a single nucleotide variation in the rbcLb region and they designed a restriction-enzyme-based assay to target their SNP in order to discriminate the two genera. Their SNP is about 120 bp downstream from the one reported here. In order to develop a new and more robust assay for discriminating the two genera, two sets of genus-specific primers were designed to incorporate both SNPs. Thus, the Ophiopogon-specific forward primer was designed to end with the guanine base, while the reverse primer was designed to end with a cytosine corresponding to the guanine in the plus strand. Conversely, the Liriope-specific forward primer was designed to end with the adenosine base, while the reverse primer was designed to end with an adenosine corresponding to the thymidine in the plus strand (Figure 3).
Conventional PCR was performed with samples from the target and non-target genera in order to confirm the specificity of the primers (Figure 4). The annealing temperature of the PCR was optimised for each specific primer pair such that a prominent amplicon was produced with the correct template, but no product was visible with a template from the opposite genus. For example, in Figure 4a, DNA from the confirmed Ophiopogon Samples 678 and 679 (Lane 1 and 2) produce clear bands with the Ophiopogon-specific primers, but no bands are seen in these lanes in Figure 4b.
The assay was then used to test those samples that showed a different nucleotide base compared to their original classification. The Ophiopogon-specific primers clearly showed that Samples 693, 695, 709, and 711 did not belong to the genera to which they had been first allocated (Figure 4a), and the Liriope-specific primers confirmed that these samples belonged to the Liriope genus. In the same way, the specific assays confirmed that Samples 628 and 677 belong in the Ophiopogon genus and not in the Liriope genus to which they were originally assigned (Figure 4b).
To confirm the accuracy of the initial sampling of these specimens, a repeat collection of samples was carried out and the repeat DNA extractions were tested with the specific PCR assay. The results again confirmed that Samples 693, 695, and 709 belong to the Liriope genus and 628, 667, and 677 to Ophiopogon (Figure S3a,b). Our new discriminatory test, using genus-specific primers, permits us to identify Ophiogon and Liriope samples with an easy and economic system by conventional PCR.
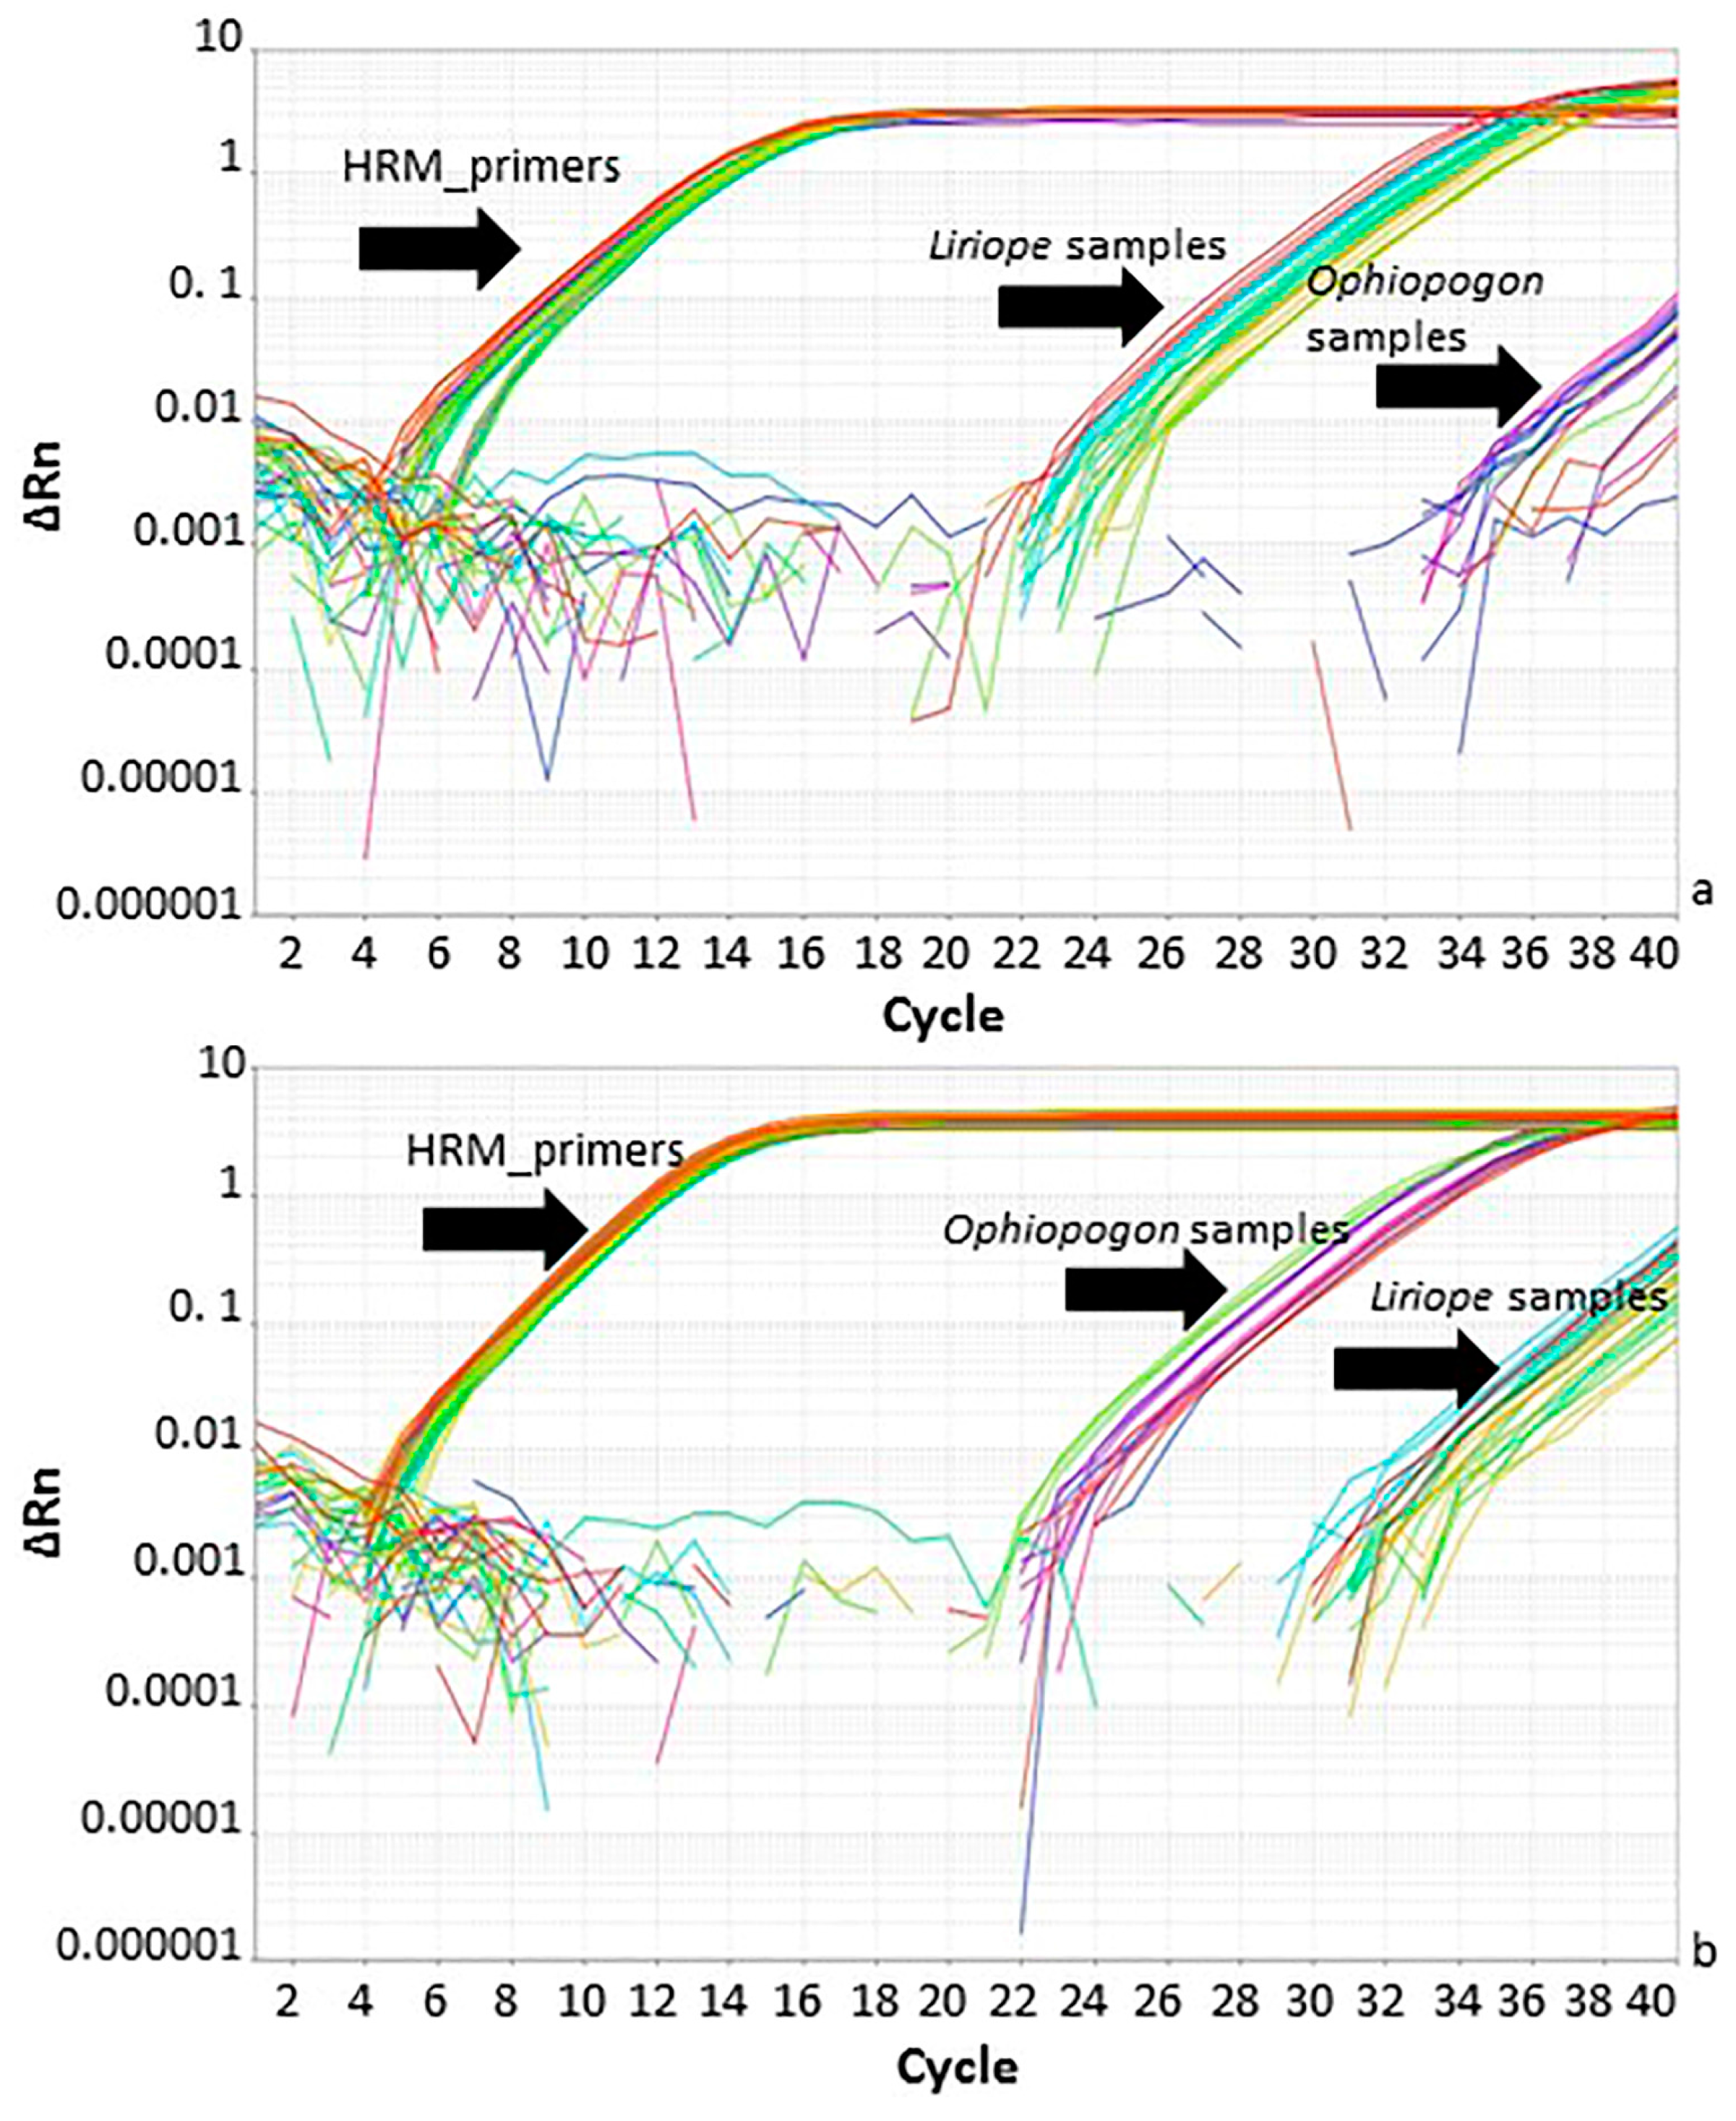
The specific primers targeted two genus-specific SNPs within a short region of the rbcL barcode sequence and were designed so that they were also suitable for use in real-time PCR analysis. The speed, simplicity, and sensitivity of real-time PCR assay are ideally suited to industrial quality control tests [13]. Real-time PCR was performed using the genus-specific primers after optimising the thermocycling programs and primer concentrations. The amplification plots for the Liriope-specific primers showed a marked difference in Ct value (around 12 cycles) between Liriope and Ophiopogon samples (Figure 5a). The Ophiopogon-specific primers were less efficient, but careful optimisation of the annealing temperature allowed a difference in Ct values between the two genera of around 10 cycles to be achieved. (Figure 5b).
In order to normalise the Ct values to allow for differences in the amount of DNA template, the HRM primers described in the next section were tested for their suitability as generic/universal primers. Real-time PCR with the HRM_primers did not show any significant variation in the Ct values obtained from samples from the two genera. The Ct value obtained with the generic primers was subtracted from the specific primer Ct to obtain a ΔCt value for comparison between different DNA samples. In order to identify an unknown sample as Liriope or Ophiopogon, the ΔCt value for a reference sample was subtracted from the unknown to produce a ΔΔCt value. It is expected that the ΔΔCt value from the correct specific primers will be ≤2.0, whilst that for an incorrect genus would be >7.0. A ΔΔCt > 7.0 is arbitrarily chosen as the threshold because it represents the equivalent of detection of the correct template at a dilution of one molecule in one thousand. The results in Table 1 clearly show that the ΔΔCt values correspond to the genus identity of each sample.
Thus, for example, each known or suspected Liriope sample produces a ΔΔCt value close to zero with the Liriope primers, whilst the Ophipogon primers produces a corresponding ΔΔCt value above seven.
2.3. Identification of Liriope and Ophiopogon Samples by Using the HRM System
The rbcLa SNP also provides a useful target for developing a single tube assay to discriminate between the two genera using HRM analysis. This technology can discriminate between sequences containing a difference of a single base if it has a significant effect on the melting temperature. HRM primers were designed to the conserved regions of the rbcL sequence on either side of the SNP (Figure 6).
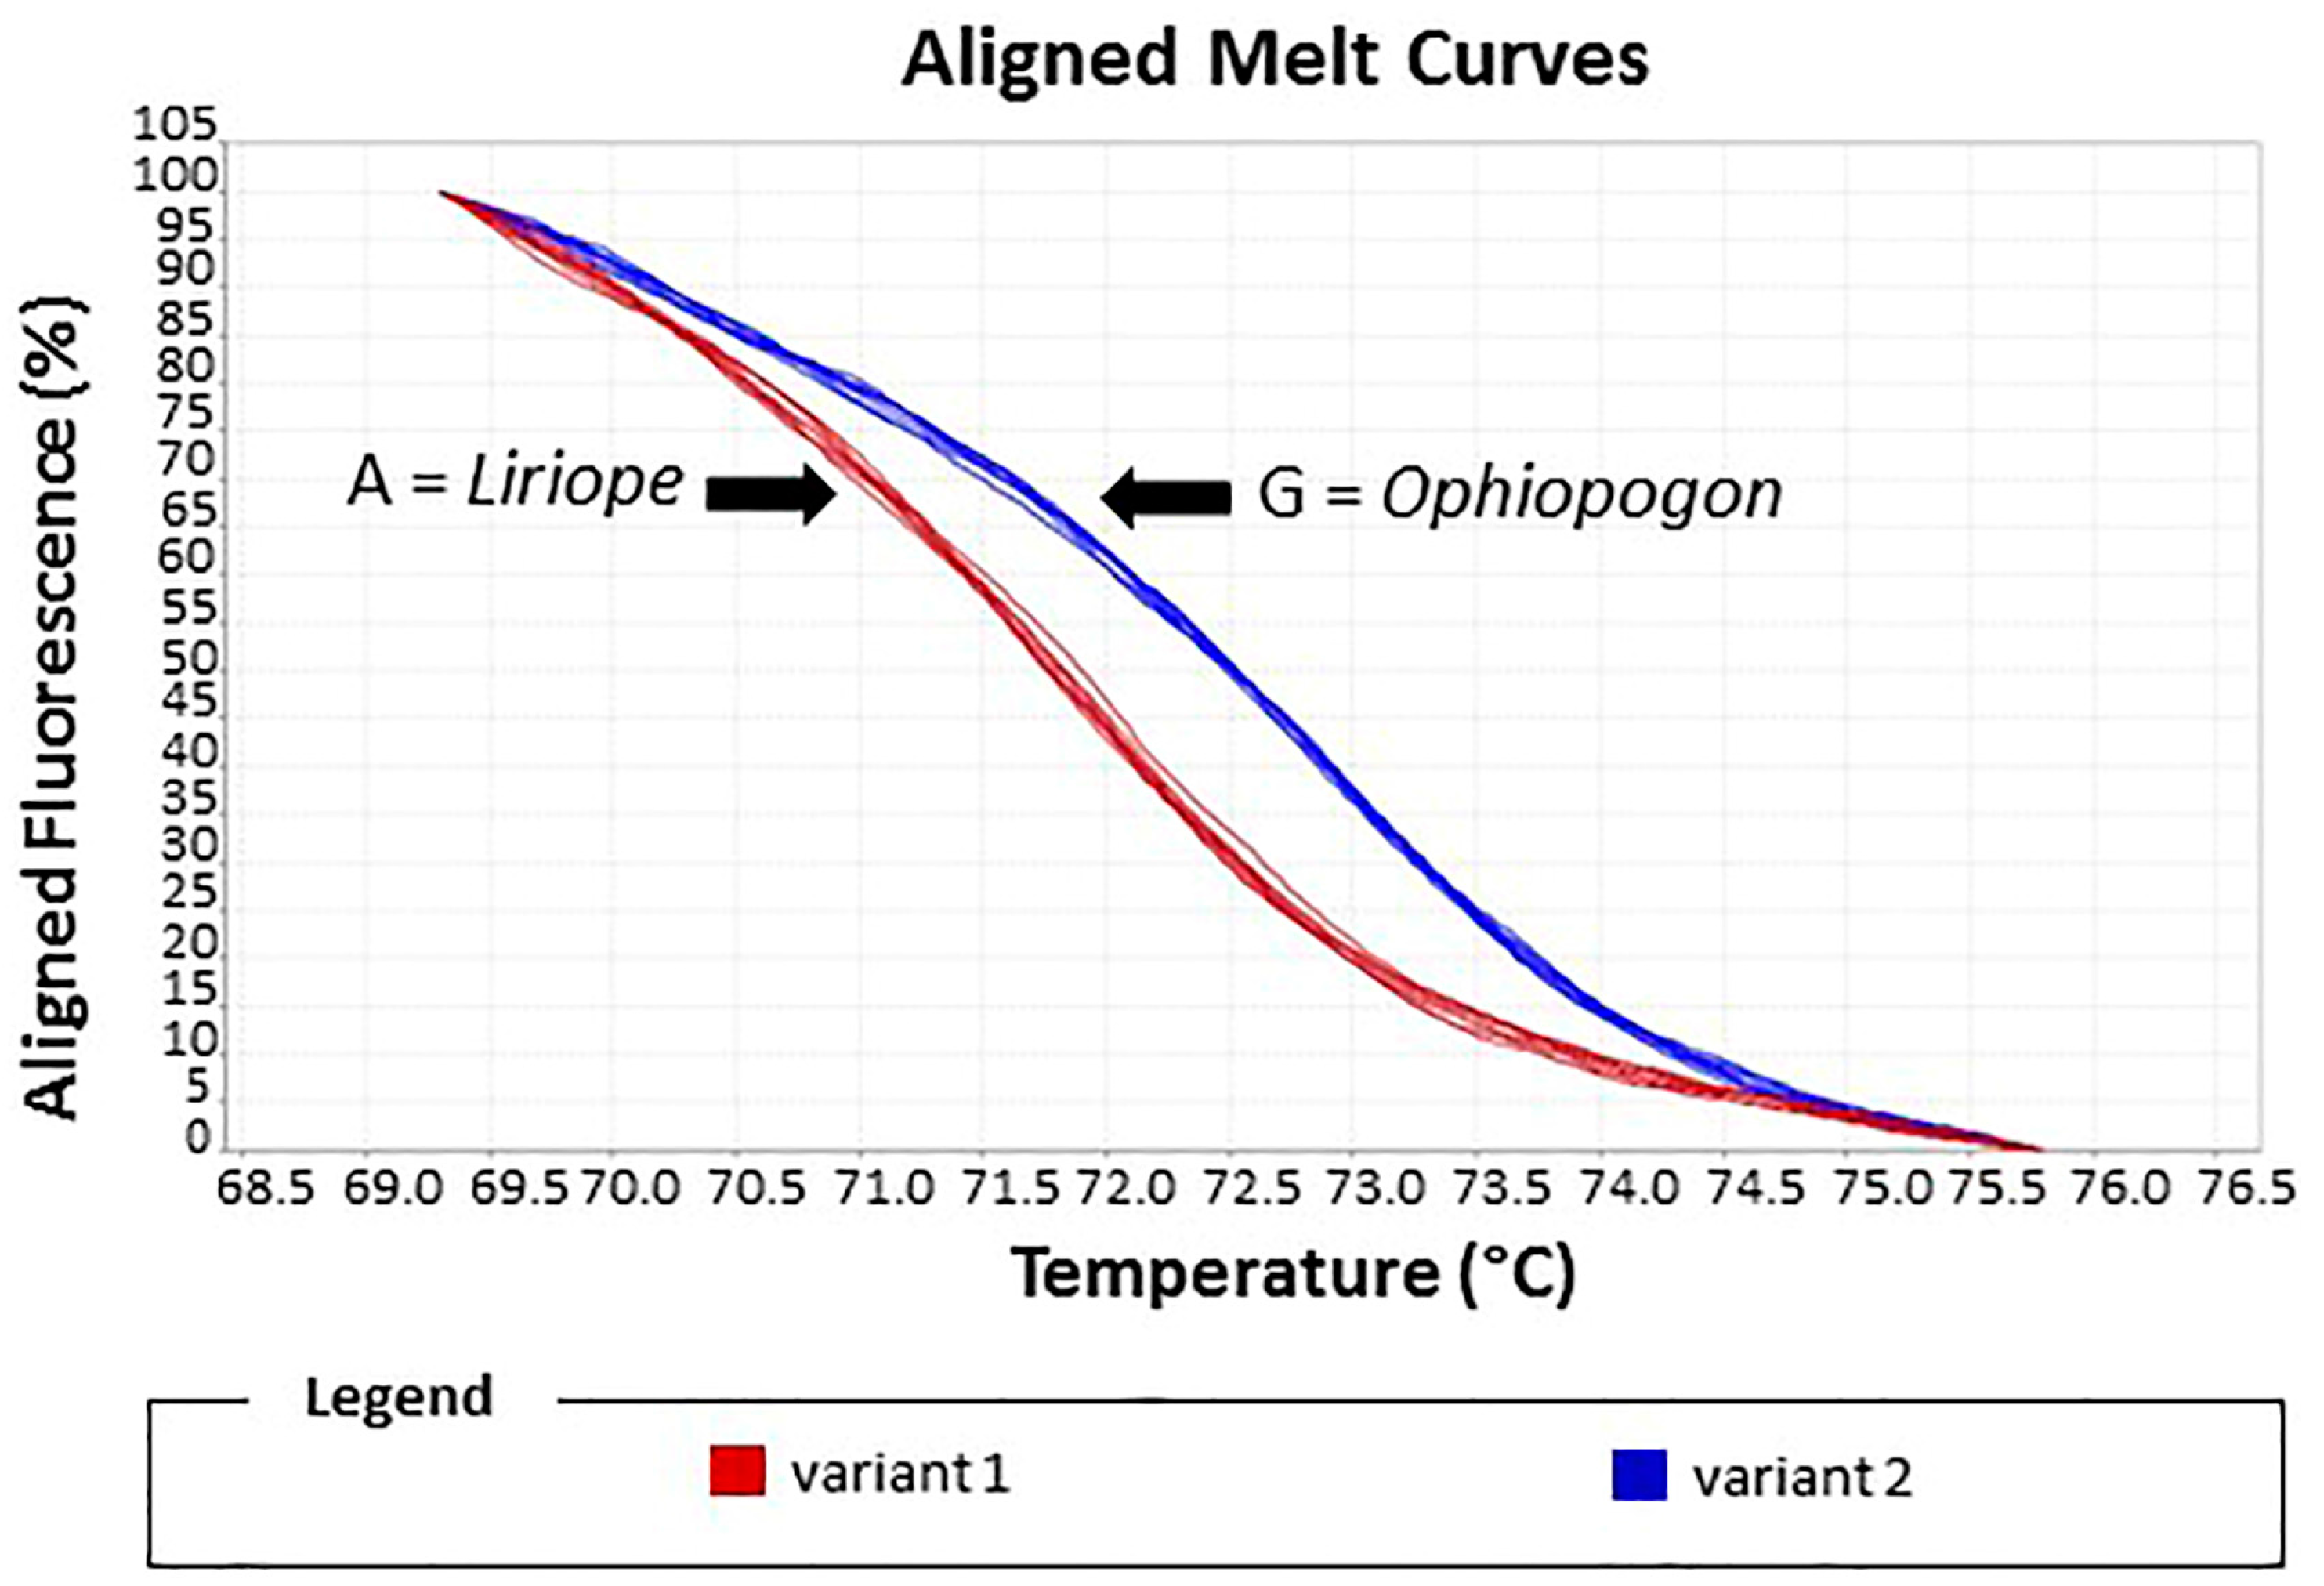
After the optimisation of the PCR conditions by conventional PCR (Figure S4), the HRM curves produced from Liriope and Ophiopogon samples were compared. The results revealed that there was a difference in Tm of 2 °C, allowing the two genera to be easily distinguished from each other. A difference plot of the melting curves showed two distinct variants that corresponded to samples from the two genera (Figure S5).
The reliability of the assay was assessed by a blind experiment in which the identities of ten samples were unknown to the operator. Alignment of the melting curves allowed the two variants to be easily discriminated. In Variant 1, four unknown samples were matched with the Ophiopogon controls, whilst 6 unknown samples in Variant 2 matched the Liriope controls (Figure 7). These ten samples included the seven misidentified samples.
This assay confirmed the correct genus of these samples, supporting the results of the genus-specific real-time PCR assay.
3. Discussion
Sequencing of the rbcLa barcode region of 75 samples of Ophiopogon and Liriope from the UK National Plant Collections of these two genera provided a large dataset for analysis. Multiple alignment of the sequences revealed that the region is very highly conserved, with only three SNPs observed, one of which distinguishes the genus Liriope from the genus Ophipogon. This reflects the findings of [22] who reported the high degree of conservation of the rbcLb, though they observed five genus-specific SNPS in this downstream section of the gene. The rbcLb region has been noted as being more variable than the rbcLa region in a number of plant groups [23]. Ito et al. (2015) [20] targeted one of these genus-specific rbcLb SNPs using a restriction-enzyme-digestion-based approach for the identification of the two genera. This SNP was around 100 bases downstream of ours in the rbcLb region, so proved ideal for the design of pairs of specific real-time PCR primers.
Our analysis of the sequence data indicated that our rbcLa SNP might not be entirely genus-specific because three Liriope and four Ophiopogon samples had the “wrong” base at this position. There are a number of possible biological explanations for this including homoplasy and hybridisation, but human errors of identification or labelling appeared more likely. Sequencing of the nrITS barcode region of these specimens showed that the genus identification agreed with the rbcL SNP, indicating that they had been misidentified (data not shown). This confirmed that the SNP was entirely genus-specific across the collection.
In order to develop rapid, reliable Ophiopogon and Liriope identification tests, the SNP identified in our study and that targeted by Ito et al. (2015) [20] allowed the design of genus-specific primers for a simple PCR-based test. The primers were designed to incorporate the variable base at the 3′ end of the primer for conventional and real-time PCR. This strategy has been used in the design of a number of PCR tests for the authentication of herbal medicines [13,15]. The specificity of the primers was confirmed by conventional PCR; bands were only seen with template DNA from the corresponding genus.
The genus-specific primers were also designed for use in real-time PCR. The Liriope-specific primers could distinguish DNA from the two genera by a difference in Ct value of 12 cycles, when normalised with the HRM generic primers. The Ophiopogon primers showed a similarly large difference in Ct values after the annealing temperature of the PCR was optimised for specificity. It is noticeable that the Ct values obtained with the specific primer pairs were considerably higher than the Ct obtained with the generic HRM primers. This is the result of a number of factors. The design of the specific primers is constrained by the position of the polymorphic base at the 3′ end. The only flexibility in design is variation of the total length of the primer. In addition, the optimisation of specificity often requires that the annealing temperature of the PCR is higher than optimal for amplification efficiency. Nevertheless, the results indicate that the design constraints and sub-optimal conditions do not affect the ability of the assay to identify Ophiopogon and Liriope samples in a quick and consistent way. The value of the assay was highlighted when it was used to rapidly confirm the genus of the misidentified accessions after resampling.
Under optimal conditions, HRM assays can discriminate between sequences containing a difference of a single base and can rapidly and accurately identify species from a diverse range and quality of materials [13]. In our study, the HRM assay also proved to be a simple and reliable method for the identification of the two genera. The results grouped the samples into two distinct variants due to base-pair mismatching between the two species causing a Tm shift of 2 °C. For testing the accuracy of this assay, a blind experiment was performed using a range of samples including some of the misidentified sample. The results showed a clear discrimination of the two variants. The results confirmed the re-classification of those samples into the correct genus, supporting the results with the specific primers.
All together these results proved the specificity and reliability of both techniques in the identification of Ophiopogon and Liriope samples. The PCR assays are limited by the requirement to design-specific primers for each known target plant and likely adulterant. The HRM assay has the ability to detect unknown contaminants provided they share the same genetic sequences and could be used to analyse admixtures in a single tube. However, genus-specific PCR primers and HRM are both powerful assays for a rapid genus-level screen without having to go through the entire DNA barcoding process for the identification of Ophiopogon and Liriope species. These two assays could be good tools for the discrimination of genus, species, or cultivars based on individual SNPs.
4. Materials and Methods
4.1. Plant Material and Total DNA Extraction
Fresh leaves were collected from 75 different species of Ophiopogon and Liriope at Brooksby Melton College (Melton Mowbray, Leicestershire, UK) from the UK National Plant Collections for Ophiopogon and Liriope. Details of the genus, species, and accession number are in Table S1. Samples were stored at −80 °C. DNA was extracted from 100 mg of frozen material, previously ground to a fine powder in liquid nitrogen with mortar and pestle, using DNeasy Plant Mini Kit (Qiagen Inc., Germantown, MD, USA) following the manufacturers’ guidelines.
4.2. PCR Protocols
PCRs were carried out using different primers as detailed in Table 2.
PCR reaction mixes contained 1X MyTaq Red Mix (Bioline), 0.2 μM of each forward and reverse primer, and 1 μL of gDNA as template. A G-Storm GS1 Thermal Cycler (G-Storm Ltd., Somerton, UK) was used with the following program:
- rbcLa PCR: initial denaturation step of 5 min at 95 °C followed by 35 cycles consisting of 30 s at 95 °C, 20 s at 52 °C, and 50 s at 72 °C, with a final extension period of 5 min at 72 °C.
- Ophiopogon-specific rbcL PCR: initial denaturation step of 5 min at 95 °C followed by 40 cycles consisting of 30 s at 95 °C, 30 s at 62.5 °C, and 45 s at 72 °C, with a final extension period of 5 min at 72 °C.
- Liriope-specific rbcL PCR: initial denaturation step of 5 min at 95 °C followed by 35 cycles consisting of 30 s at 95 °C, 30 s at 61 °C, and 30 s at 72 °C, with a final extension period of 5 min at 72 °C.
- HRM (generic) rbcL PCR: initial denaturation step of 5 min at 95 °C followed by 35 cycles consisting of 30 s at 95 °C, 30 s at 60 °C, and 30 s at 72 °C, with a final extension period of 5 min at 72 °C.
PCR products were run on 2% (w/v) agarose, 1X TBE gels with 1 μL SYBR® Safe DNA Gel Stain (Invitrogen, Paisley, UK) at 100 V for 30 min and analysed in a Gel Doc™ EZ Gel Documentation System (BioRad, Oxford, UK).
4.3. DNA Sequence Analysis
Published Liriope and Ophiopogon rbcL DNA sequences were obtained from the National Center for Biotechnology Information (NCBI) GenBank database (http://www.ncbi.nlm.nih.gov/). A multi alignment was generated using CLC Main Workbench 7.5.1 software (Qiagen, Germantown, MD, USA).
4.4. Real-Time PCR Analysis
Each real-time PCR reaction contained 1 μL of gDNA, 1X Sensifast SYBR green Hi-Rox mix (Bioline), 0.1 μM of each forward and reverse primer in a total volume of 10 mL made up with sterile distilled water. A StepOnePlus™ Real-Time PCR thermocycler machine (Applied Biosystem) was used. Amplification conditions were as follows: 95 °C for 2 min followed by 40 cycles of 5 s at 95 °C and 30 s at the primer specific Ta (Table 1). The melting curve was obtained by melting the amplified template from 65 to 95 °C increasing the temperature by 0.5 °C per cycle. No-template controls were included. Three technical replicates were used for each sample. Internal StepOne software (Applied Biosystems) was used for the analysis of the results [24].
4.5. High-Resolution Melt Curve Analysis (HRM) Methods
HRM primers were designed to match the conserved sequences of the rbcL gene on either side of the genus-specific SNP (Figure 7). Each HRM real-time PCR reaction contained 1 μL of gDNA, 1X MeltDoctor™ HRM Master Mix (Applied Biosystem), 0.1 μM of each HRM_rbcL_forward and reverse primer (Table 1) in a total volume of 10 μL made up with sterile distilled water. A StepOnePlus™ Real-Time PCR thermocycler machine (Applied Biosystem) was used. Amplification conditions were as follows: 95 °C for 10 min followed by 40 cycles of 15 s at 95 °C and 30 s at 60 °C. The fluorescent data for PCR amplification was recorded during the extension step. The final melting curve was obtained by melting the amplified template 65 to 95 °C increasing the temperature by 0.3 °C per cycle with a 15 s hold time for each acquisition step. No-template controls were included. Three technical replicates were used for each sample.
HRM software (Applied Biosystem) has been used to analyse the results. For each sample, a melting curve plot, a melting peak plot and difference plot was generated [25].
Supplementary Materials
The following are available online at www.mdpi.com/2223-7747/6/4/53/s1. Figure S1: Multiple alignment of the rbcLa region of all of the Liriope and Ophiopogon samples tested, Figure S2: Agarose gel electrophoresis of PCR products of a re-sampled specimens using Ophiopogon- and Liriope-specific primers, Figure S3: Agarose gel electrophoresis of PCR products using HRM primers.
Acknowledgments
The authors are grateful to Joanne Wilkes for role in the cultivation of the Liriope and Ophiopogon national collections. They also acknowledge the role of Plant Heritage in coordinating and supporting the UK National Plant Collection scheme. This project was funded in part by De Montfort University HEIF funds.
Author Contributions
J.A. and P.G. curated the national collections of Liriope and Ophipogon, J.A. and A.S. conceived the project; T.S. and A.S. designed and supervised the experimental strategy, and edited the paper; E.M. performed the experiments, analysed the data, and wrote most of the paper; D.B. photographed and sampled the collections, and wrote part of the paper.
Conflicts of Interest
The authors declare no conflict of interest. The funding sponsors had no role in the design of the study; in the collection, analyses, or interpretation of data; in the writing of the manuscript; or in the decision to publish the results.
Abbreviations
| nrITS | nuclear ribosomal internal transcribed spacer |
| rbcL | large subunit of ribulose-1,5-bisphosphate carboxylase/oxygenase gene |
| HRM | high-resolution melt curve assay |
References
- Fantz, P.R. Species of Liriope Cultivated in the Southeastern United States. HortTechnology 2008, 18, 343–348. [Google Scholar]
- Fantz, P.R. Names and Species of Ophiopogon Cultivated in the Southeastern United States. HortTechnology 2009, 19, 385–394. [Google Scholar]
- Nesom, G.L. Overview of Liriope and Ophiopogon (Ruscaceae) naturalized and commonly cultivated in the USA. Phytoneuron 2010, 56, 1–31. [Google Scholar]
- Lattier, J.D.; Ranney, T.G. Identification, Nomenclature, Genome Sizes, and Ploidy Levels of Liriope and Ophiopogon Taxa. HortScience 2014, 49, 145–151. [Google Scholar]
- Mabberley, D.J. A Portable Dictionary of Plants, Their Classification and Uses; Cambridge University Press: Cambridge, UK, 2008. [Google Scholar]
- Wu, Y.; Dong, Z.; Wu, H.; Ding, W.; Zhao, M.; Shi, Q.; Wang, Q. Comparative studies on Ophiopogonis and Liriopes based on the determination of 11 bioactive components using LC–MS/MS and hierarchical clustering analysis. Food Res. Int. 2014, 57, 15–25. [Google Scholar] [CrossRef]
- Wang, K.; Zhang, H.; Shen, L.; Wang, W. Novel steroidal saponins from Liriope graminifolia (Linn.) Baker with anti-tumor activities. Carbohydr. Res. 2011, 346, 253–258. [Google Scholar] [CrossRef] [PubMed]
- Li, N.; Che, Y.; Zhang, L.; Zhang, J.; Zhou, Y.; Jiang, Y.; Tu, P. Fingerprint analysis of Ophiopogonis Radix by HPLC-UV-ELSD coupled with chemometrics methods. J. Chin. Pharm. Sci. 2013, 22, 55–63. [Google Scholar] [CrossRef]
- Tang, X.; Cheng, Z.; Yu, B. Qualitative and quantitative studies on Chinese drug Maidong. China J. Chin. Mater. Med. 1999, 24, 390–445. [Google Scholar]
- Zeng, P.; Zhou, H.; Zheng, Y.; Xu, X.; Fu, S. Simultaneous determination of three homoisoflavonoids in Ophiopogon japonicus by HPLC. China J. Chin. Mater. Med. 2012, 37, 71–74. [Google Scholar]
- Mishra, P.; Kumar, A.; Nagireddy, A.; Mani, D.N.; Shukla, A.K.; Tiwari, R.; Sundaresan, V. DNA barcoding: An efficient tool to overcome authentication challenges in the herbal market. Plant Biotechnol. J. 2016, 14, 8–21. [Google Scholar] [CrossRef] [PubMed]
- Coutinho Moraes, D.F.; Still, D.W.; Lum, M.R.; Hirsch, A.M. DNA-Based Authentication of Botanicals and Plant-Derived Dietary Supplements: Where Have We Been and Where Are We Going? Planta Med. 2015, 81, 687–695. [Google Scholar] [CrossRef] [PubMed]
- Sgamma, T.; Lockie-Williams, C.; Kreuzer, M.; Williams, S.; Scheyhing, U.; Koch, E.; Slater, A.; Howard, C. DNA Barcoding for Industrial Quality Assurance. Planta Med. 2017, 83, 1117–1129. [Google Scholar] [CrossRef] [PubMed]
- Kazi, T.; Hussain, N.; Bremner, P.; Slater, A.; Howard, C. The application of a DNA-based identification technique to over-the-counter herbal medicines. Fitoterapia 2013, 87, 27–30. [Google Scholar] [CrossRef] [PubMed]
- Howard, C.; Bremner, P.D.; Fowler, M.R.; Isodo, B.; Scott, N.W.; Slater, A. Molecular identification of Hypericum perforatum by PCR amplification of the ITS and 5.8S rDNA region. Planta Med. 2009, 75, 864–869. [Google Scholar] [CrossRef] [PubMed]
- Singh, H.K.; Parveen, I.; Raghuvanshi, S.; Babbar, S.B. The loci recommended as universal barcodes for plants on the basis of floristic studies may not work with congeneric species as exemplified by DNA barcoding of Dendrobium species. BMC Res. Notes 2012, 5, 42. [Google Scholar] [CrossRef] [PubMed]
- Cameron, K.M.; Chase, M.W.; Whitten, W.M.; Kores, P.J.; Jarrell, D.C.; Albert, V.A.; Yukawa, T.; Hills, H.G.; Goldman, D.H. A phylogenetic analysis of the Orchidaceae: Evidence from rbcL nucleotide. Am. J. Bot. 1999, 86, 208–224. [Google Scholar] [CrossRef] [PubMed]
- Li, G.; Park, J.Y. SCAR markers for discriminating species of two genera of medicinal plants, Liriope and Ophiopogon. Genet. Mol. Res. 2012, 29, 2987–2996. [Google Scholar] [CrossRef] [PubMed]
- Li, G.; Ra, W.; Park, J.-W.; Kwon, S.-W.; Lee, J.; Park, C.; Park, Y. Developing EST-SSR markers to study molecular diversity in Liriope and Ophiopogon. Biochem. Syst. Ecol. 2011, 39, 241–252. [Google Scholar] [CrossRef]
- Ito, M.; Sato-Masumoto, N.; Kobayashi, F.; Matsumura, K. Distinguishing Ophiopogon and Liriope tubers based on DNA sequences. J. Nat. Med. 2015, 69, 555–564. [Google Scholar] [CrossRef] [PubMed]
- Abson, J. Botany, medicine and mistaken identity. Plant Heritage J. 2017, 25, 41–43. [Google Scholar]
- Shiba, M.; Yamaji, H.; Kondo, K.; Ichiki, H.; Sakakibara, I.; terabayashi, S.; Amagaya, S.; Aburada, M.; Miyamoto, K. Discrimination of Maidong Derived from Ophiopogon and Liriope Species by rbcL Sequences, and Their Chemical Components and Tuber Anatomy. Nat. Med. 2004, 58, 15–21. [Google Scholar]
- Dong, W.; Cheng, T.; Li, C.; Xu, C.; Long, P.; Chen, C.; Zhou, S. Discriminating plants using the DNA barcode rbcLb: An appraisal based on a large data set. Mol. Ecol. Res. 2013, 14, 336–343. [Google Scholar] [CrossRef] [PubMed]
- Applied Biosystems StepOne™ and StepOnePlus™ Real-Time PCR Systems Reagent Guide. Available online: https://assets.thermofisher.com/TFS-Assets/LSG/manuals/cms_046739.pdf (accessed on 25 October 2017).
- Applied Biosystems High Resolution Melting Getting Started Guide. Available online: https://tools.thermofisher.com/content/sfs/manuals/cms_050347.pdf (accessed on 25 October 2017).
Figure 1.
Agarose gel electrophoresis of PCRs using rbcL generic primers. Gel lanes: L. Easy Ladder I (Bioline) 1. Ophiopogon Sample 678; 2. Ophiopogon Sample 679; 3. Ophiopogon Sample 680; 4. Ophiopogon Sample 682; 5. Liriope Sample 626; 6. Liriope Sample 627; 7. Liriope Sample 631; 8. Liriope Sample 632; 9. Negative (no template) control.
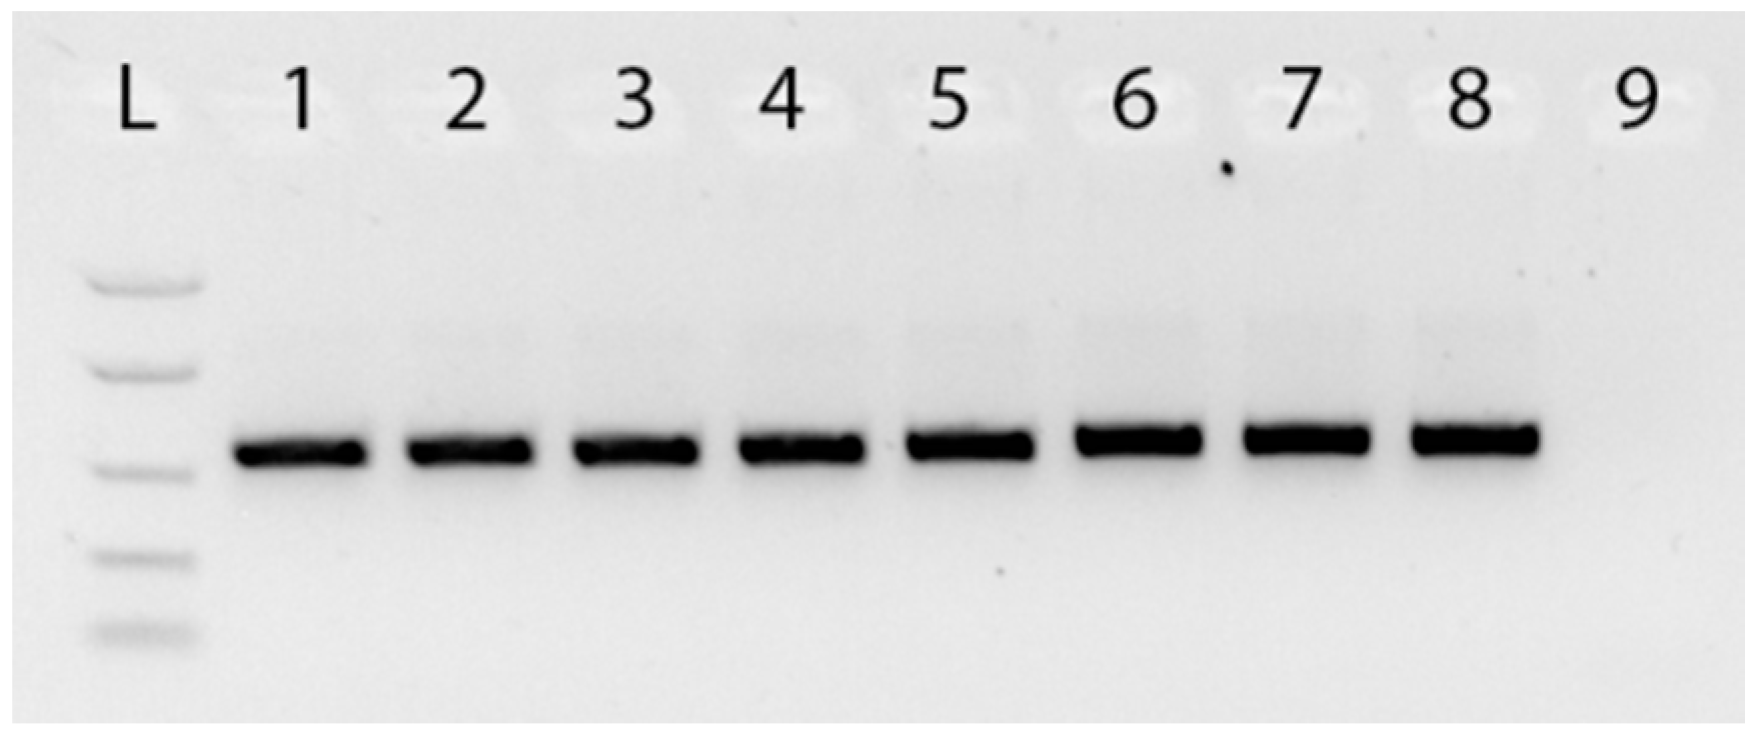
Figure 2.
Fragment of a multiple alignment of the rbcL region from a selection of Liriope and Ophiopogon samples, highlighting a number of atypical samples. Liriope Samples 624, 625, and 626 match the consensus Liriope sequence. Ophiopogon Samples 678, 679, and 680 match the Ophiopogon consensus. Liriope Samples 628, 667, and 677 and Ophiopogon Samples 693, 695, 709, and 711 are atypical in the SNP position highlighted by the black arrow.

Figure 3.
Graphical representation of the location of genus-specific primers. The figure shows a multiple alignment with 4 Liriope and 4 Ophiopogon rbcLa consensus sequences joined to the rbcLb sequences published by Ito et al. (2012) using three rbcL sequences from the database that bridge the rbcLa and rbcLb regions. The black arrow indicates where the forward and reverse primers were designed. The black boxes indicate the two SNPs incorporated into the 3′ position of the primer sequences.

Figure 4.
Agarose gel electrophoresis of PCR using rbcL_Ophiopogon and rbcL_Liriope specific primers. (a) rbcL_Ophiopogon specific primers. (b) rbcL_Liriope specific primers. Gel lines: 1. Ophiopogon Sample 678; 2. Ophiopogon Sample 679; 3. Ophiopogon Sample 693; 4. Ophiopogon Sample 695; 5. Ophiopogon Sample 709; 6. Ophiopogon Sample 711; 7. Liriope Sample 624; 8. Liriope Sample 628; 9. Liriope Sample 677; 10. Negative (no template) control; L. Easy Ladder I (Bioline).

Figure 5.
Real-time PCR amplification using Ophiopogon-specific, Liriope-specific and generic high-resolution melt curve (HRM) primers. (a) Amplification plot of Liriope-specific and HRM primers. (b) Amplification plot with Ophiopogon-specific and HRM primers. The black arrows indicate the primer/template combinations: HRM_primers: Ophiopogon and Liriope templates with the generic primers; Liriope samples: Liriope templates with specific primers; Ophiopogon samples: Ophiopogon templates with specific primers.

Figure 6.
Schematic representation of the location of the HRM primers. The black arrow indicate the position of the SNP.
Figure 6.
Schematic representation of the location of the HRM primers. The black arrow indicate the position of the SNP.
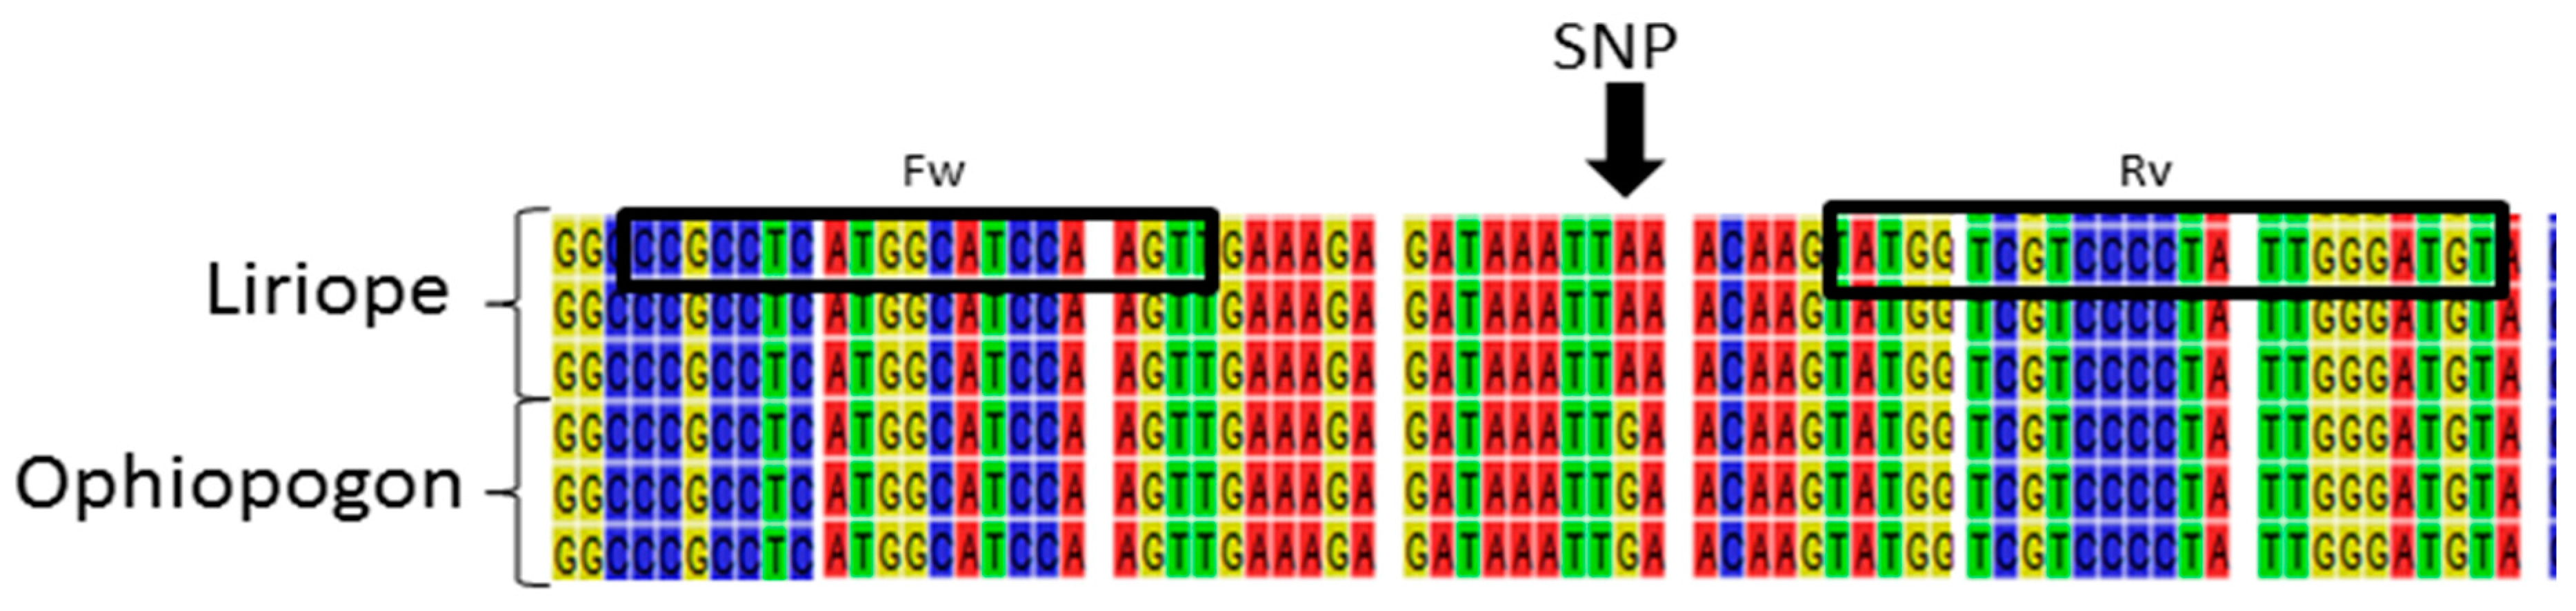
Figure 7.
HRM assay of reference standards and test samples. The melting curve plot showed two distinct variants: Variant 1, Liriope standards; Variant 2, Ophiopogon standards. Test samples were assigned to the Liriope or Ophiopogon genus according to which variant curve they matched.
Figure 7.
HRM assay of reference standards and test samples. The melting curve plot showed two distinct variants: Variant 1, Liriope standards; Variant 2, Ophiopogon standards. Test samples were assigned to the Liriope or Ophiopogon genus according to which variant curve they matched.


Table 1.
Results of real-time PCR assay using Ophiopogon- and Liriope-specific primers. The Ct value obtained for each specific primer pair was normalised by subtracting the Ct value obtained for the same sample with the generic (HRM) primers, giving the ΔCt (genus-specific − generic) value. The ΔCt (genus-specific − generic) value for a reference standard was then subtracted from the ΔCt genus-specific value for each sample, giving the ΔΔCt [(genus-specific − generic)sample − (genus-specific − generic)standard] value. The reference standard for Liriope was chosen as Sample 624 and for Ophiopogon was Sample 678.
| Sample Number | ΔCt Liriope-Specific | ΔCt Ophiopogon-Specific | ΔΔCt Liriope-Specific | ΔΔCt Ophiopogon-Specific |
|---|---|---|---|---|
| 624 | 12.41 | 23.53 | 0 | 8.61 |
| 626 | 13.28 | 24.21 | 0.87 | 9.29 |
| 628 | 25.51 | 13.00 | 13.10 | −1.92 |
| 633 | 12.28 | 23.64 | −0.13 | 8.72 |
| 634 | 11.67 | 22.91 | −0.74 | 7.99 |
| 667 | 24.74 | 15.17 | 12.33 | 0.25 |
| 677 | 24.46 | 13.87 | 12.05 | −1.05 |
| 678 | 24.34 | 14.92 | 11.92 | 0 |
| 679 | 25.89 | 15.45 | 13.48 | 0.53 |
| 693 | 13.76 | 25.68 | 1.35 | 10.76 |
| 695 | 14.43 | 25.62 | 2.02 | 10.70 |
| 709 | 13.03 | 24.33 | 0.62 | 9.41 |
| 711 | 12.56 | 22.55 | 0.15 | 7.63 |
Table 2.
List of primers with relative Ta and predict band size.
| Primers | Sequences | Annealing Temperature (Conventional PCR) | Annealing Temperature (Real-Time PCR) | Amplicon Size (bp) |
|---|---|---|---|---|
| rbcLFw | ATGTCACCACAAACAGAGACTAAAGC | 52 °C | N/A | 700 |
| rbcLRv | GTAAAATCAAGTCCACCRCG | |||
| rbcL_Liriope_Fw | ATCCAAGTTGAAAGAGATAAATTA | 61 °C | 61 °C | 180 |
| rbcL_Liriope_Rv | AACGCATAAAAGGTTGTGAGTTA | |||
| rbcL_Ophiopogon_Fw | ATCCAAGTTGAAAGAGATAAATTG | 62.5 °C | 64.5 °C | 180 |
| rbcL_Ophiopogon_Rv | AACGCATAAAAGGTTGTGAGTTC | |||
| HRM_rbcL_Fw | CGCCTCATGGCATCCAAGT | 61 °C | 61 °C | 80 |
| HRM_rbcL_Rv | AATAGGGGACGACCATACTTG |
© 2017 by the authors. Licensee MDPI, Basel, Switzerland. This article is an open access article distributed under the terms and conditions of the Creative Commons Attribution (CC BY) license (http://creativecommons.org/licenses/by/4.0/).
Share and Cite
MDPI and ACS Style
Masiero, E.; Banik, D.; Abson, J.; Greene, P.; Slater, A.; Sgamma, T. Genus-Specific Real-Time PCR and HRM Assays to Distinguish Liriope from Ophiopogon Samples. Plants 2017, 6, 53. https://doi.org/10.3390/plants6040053
AMA Style
Masiero E, Banik D, Abson J, Greene P, Slater A, Sgamma T. Genus-Specific Real-Time PCR and HRM Assays to Distinguish Liriope from Ophiopogon Samples. Plants. 2017; 6(4):53. https://doi.org/10.3390/plants6040053
Chicago/Turabian StyleMasiero, Eva, Dipanwita Banik, John Abson, Paul Greene, Adrian Slater, and Tiziana Sgamma. 2017. "Genus-Specific Real-Time PCR and HRM Assays to Distinguish Liriope from Ophiopogon Samples" Plants 6, no. 4: 53. https://doi.org/10.3390/plants6040053
Note that from the first issue of 2016, this journal uses article numbers instead of page numbers. See further details here.