GIS-Assisted Prediction and Risk Zonation of Wildlife Attacks in the Chitwan National Park in Nepal


1
Department of Regional Development and Public Administration, Faculty of Regional Development and International Studies, Mendel University in Brno, Třída Gen. Píky 7, 61300 Brno, Czech Republic
2
Department of Environmental Studies and Natural Resources, Faculty of Regional Development and International Studies, Mendel University in Brno, Třída Gen. Píky 7, 61300 Brno, Czech Republic
3
Department of National Park and Wildlife Conservation, Institute of Forestry, Tribhuvan University, Pokhara Campus-15, Hariyokharka, Pokhara 33700, Nepal
*
Author to whom correspondence should be addressed.
ISPRS Int. J. Geo-Inf. 2018, 7(9), 369; https://doi.org/10.3390/ijgi7090369
Submission received: 26 July 2018
/
Revised: 27 August 2018
/
Accepted: 5 September 2018
/
Published: 7 September 2018
(This article belongs to the Special Issue GIS for Safety & Security Management)
Abstract
:Population growth forces the human community to expand into the natural habitats of wild animals. Their efforts to use natural sources often collide with wildlife attacks. These animals do not only protect their natural environment, but in the face of losing the potential food sources, they also penetrate in human settlements. The research was situated in the Chitwan National Park (CNP) in Nepal, and the aim of this study was to investigate possible geospatial connections between attacks of all kinds of animals on humans in the CNP and its surroundings between 2003 and 2013. The patterns of attacks were significantly uneven across the months, and 89% of attacks occurred outside the park. In total, 74% attacks occurred in the buffer zone forests and croplands within 1 km from the park. There was a strong positive correlation among the number of victims for all attacking animals with a maximum of one victim per 4 km2, except elephant and wild boar. The density of bear victims was higher where the tiger and rhino victims were lower, e.g., in the Madi valley. The data collected during this period did not show any signs of spatial autocorrelation. The calculated magnitude per unit area using the kernel density, together with purpose-defined land use groups, were used to determine five risk zones of wildlife attacks. In conclusion, it was found that the riskiest areas were locations near the forest that were covered by agricultural land and inhabited by humans. Our research results can support any local spatial decision-making processes for improving the co-existence of natural protection in the park and the safety of human communities living in its vicinity.
1. Introduction
Human–wildlife conflict (HWC) has been a common phenomenon, and it is one of the most critical conservation challenges facing protected areas (PAs) across the world. HWC refers to the interaction between wild animals and people and the resultant negative impact on people or their resources, or wild animals or their habitat. It occurs when wildlife needs overlap with those of human populations and vice versa, creating costs to residents and wild animals [1,2,3]. The conflict occurs when the needs and behavior of wildlife impact negatively on the goals of humans or when the goals of humans negatively impact the needs of wildlife [4]. According to the US Geological Survey, human–wildlife conflicts occur due to increased human ambitions, and consequently threaten the safety and survival of wildlife [5]. Some wildlife species, such as large carnivores and mega-herbivores, cause considerable harm to the people, as well as damage to their properties [4,6,7,8,9,10,11]. The damages result in people’s negative attitudes toward the species responsible for the losses [10,11,12,13,14]. Conflicts or co-existence between human and wildlife are influenced by a complex interaction of numerous factors, including biological, geographic, political, social, institutional, financial, cultural, and historical features [4]. An overlap of resource usage occurs between animals and people in the same landscapes. The establishment of protected areas (PAs) has come into direct conflict with traditional linkages and the immediate needs of local livelihoods. Wild animals moving out from the parks, and the cases of livestock depredation, crop damages, and property loss and human injury or death, have increasing rapidly in recent years [15,16,17].
In the countries like Nepal, where about 90% of the population live at the interface between farm and forest, the restriction or denial of access to the park’s resources would obviously cause economic and social hardship for local livelihoods, leading to serious conflict between the local people and the park management [9,10,11,16,18,19]. The situation is being solved by rural communities, nature conservation authorities, and administrative authorities. Improving the impact of human activity is negatively reflected on wildlife and their habitats, often leading to frequent occurrences of wildlife outside the protected area. The conflict between humans and wildlife is attributed to the loss, degradation, and fragmentation of wildlife habitats through human activities such as logging, animal husbandry, agricultural expansion, and development projects.
In order to decrease the number of victims, some measures must be developed. Understanding spatial interactions between humans and wildlife cannot be done without spatial mapping and geospatial analyses. A spatial statistical approach identifying high-priority conflict hotspots is also widely adopted [20]. Spatial risk models can quantify landscape attributes that correlate with incident sites. However, these models are mainly based on incident data, and describe the possible risk that is associated with the examined landscape attributes. When applied to wildlife–human interactions, spatial risk models reveal the locations that are associated with the specific land use category.
2. Conceptual Background
To address the human–wildlife conflicts, including human casualties, major reform was made in Nepal’s conservation policies to create buffer zones around the protected areas through the involvement of the local people since the 1990s. However, the buffer zone in Nepal is mainly concerned with sustaining park revenue sharing for local developments. This model might be too restrictive, as local communities do not directly initiate or support the wider management of prevention, mitigation, and compensation schemes. Previous studies, e.g., [21], also suggested that current policy does not address needy communities, and buffer zone resources have been exploited by elite groups. Heinen and Mehta [22] stated that Nepal’s buffer zone legal aspect has granted local participation, but that the managerial structure remains largely top-down with the Park’s Warden regulatory role. Inadequate empowerment and involvement of the poor, uneducated, and marginalized groups in decision making, transparency, and an adequate benefit-sharing system, are major drawbacks of the buffer zone program [23].
However, there is no any simple formula for combining conservation objectives with local needs [24]. On the contrary, the participation of local people in decision-making processes can potentially create a sense of stewardship, where the local people’s collaboration with park managers fosters to conserve biodiversity and ameliorates local people’s livelihoods [25]. According to Parker et al. [26], people’s behavior to a large extent depends highly on incentives; formulating an incentive mechanism in a society that would promote the intended behavior among people is very important. The studies suggested that vulnerabilities to the lives and livelihoods of the people to attack are influenced not only by the biology of animals, but also by socio-economic factors, gender, activities, the age of victims [4,8,9,10,11,14,19,27], the attitude and perceptions of the people, the place, season and time, the population, and the movement of conflicting wildlife species.
Several studies (e.g., tiger: [14,19,28,29] and elephant: [9,30]) have been made on the issues of wildlife attacks on people and recorded injury and death cases in the landscapes of the CNP and its neighborhoods. Often, these studies are mainly focused on single species and the results of the studies indicate that the local life and livelihoods are becoming more vulnerable in the buffer zone. Despite these efforts, injury severity, hardship lives and livelihoods of the victims, and factors involved in attacks with all attacking wildlife species are still questionable and have not been examined in a comprehensive way. The outputs of this research will help to refine existing plans and practices to reduce human–wildlife conflicts, particularly wildlife attacks, and to improve the victims’ livelihoods and to better create the environment of co-existence in the landscapes of national parks and their neighborhoods.
Wild animals’ attacks on humans depend on the spatial situation and the distribution of different animal species. From 2008 to 2012, 135 cases of human casualties were reported in the CNP in Nepal [31]. Most researches in the CNP were focused on tigers and their prey [28,29]. Attacks by tigers were significantly and positively associated with forest fragmentation. In recent years, the elephant has also become one of the research priorities [9]. In the past, several studies have been conducted on socio-economic and political issues in the CNP [18,23]. Several studies have already attempted to address the issues of wildlife attacks on humans, to improve conservation practices in the surrounding territory of the park. Often, these studies have focused on a single species. There were several studies on socio-economic and policy issues [18,23], and on ecosystem and landscapes. However, the studies carried out so far are less comprehensive, and they are inadequate in the current context, for human wildlife conflict management, especially for attacks on people. This is because some of them only focused on a single species, whereas there are many wildlife species involved in the conflicts. Some studies are very conventional, and their results need to be updated. For example, the studies made so far have not looked into various factors that are involved in attacks on people, the extent of injuries and victims’ livelihood conditions, and the victim’s perceptions towards management practices.
A literature review revealed that many studies based on similar topics used correlation modeling approaches, and generalized linear models, logistic regression, or discriminant-function analysis. Most of them also conducted validation test to measure the accuracy of model predictions [20]. Within human–bear conflicts, Baruch-Mordo et al. [32] used Getis-Ord G and G* statistics. The same methods were used by Davie et al. in their study of mapping the influence of landscape factors on livestock predation by wolves [33]. Risk probability extrapolation was used by Shrader et al. when they mapped landscapes of fear of free-ranging domestic goats [34]. It is clear that correlation modeling, spatial association, and spatial interpolation belong to the three most frequently used methods. Correlation modeling is very popular in the wildlife biology for examining animal resource use. Spatial association is used for examining the clustering incident sites and for identifying significant hotspots. These techniques assign significant values to neighborhood units and provide clustering across the study area. Spatial interpolation provides a spatial layer of continuous data for a given variable, but it does not examine the correlations between multiple variables and their associations. This is why it is suitable for descriptive examination, and additionally, interpolation is a very data sensitive method [20]. Because many incident sites have point geometry, kernel density estimation (KDE) is also a possibility for hotspot mapping [35,36]. The growing availability of KDE in GIS (Geographic Information System) applications, the perceived accuracy of its hotspot identification, and the aesthetically pleasing and easily understandable output make KDE very popular [36]. According to Rosenshein [37], kernel Density and Getis-Ord Gi* are two different geospatial analyses, in which kernel density performs calculations by considering arbitrary search radius and the cell size while Getis-Ord Gi* considers the magnitude of each feature in the dataset in the context of its neighbors’ values. Chainey et al. [38] compared Gi* to other hotspot mapping techniques, including kernel density, for crime hotspot mapping. Based on the prediction accuracy index (PAI), Gi* gave results in predicting the spatial extension of crime hotspots. Moreover, Getis-Ord Gi* was the best mapping technique for capturing local clusters, and thus the identification of statistically significant hotspots. Getis-Ord Gi* is also widely used in other disciplines, essentially in health research, incident prevention, and biodiversity distribution. Wubuli et al. [39], used the Getis-Ord statistic for detecting the spatial clustering of pulmonary tuberculosis (TB) incidences in Xinjiang, China.
The aim of this study is to investigate the possible geospatial connections between attacks of all kinds of animals on humans in the CNP and its surroundings between 2003 and 2013, in order to implement the results into park management strategy. Fundamental wildlife attacks on humans have taken place in the collection of forest resources in forests, and the movement of wildlife to the human landscape. One of the solutions may be the knowledge of types of locations, where the attacks are concentrated. The results of spatial analysis are presented in the following text.
3. Materials and Methods
3.1. Study Area
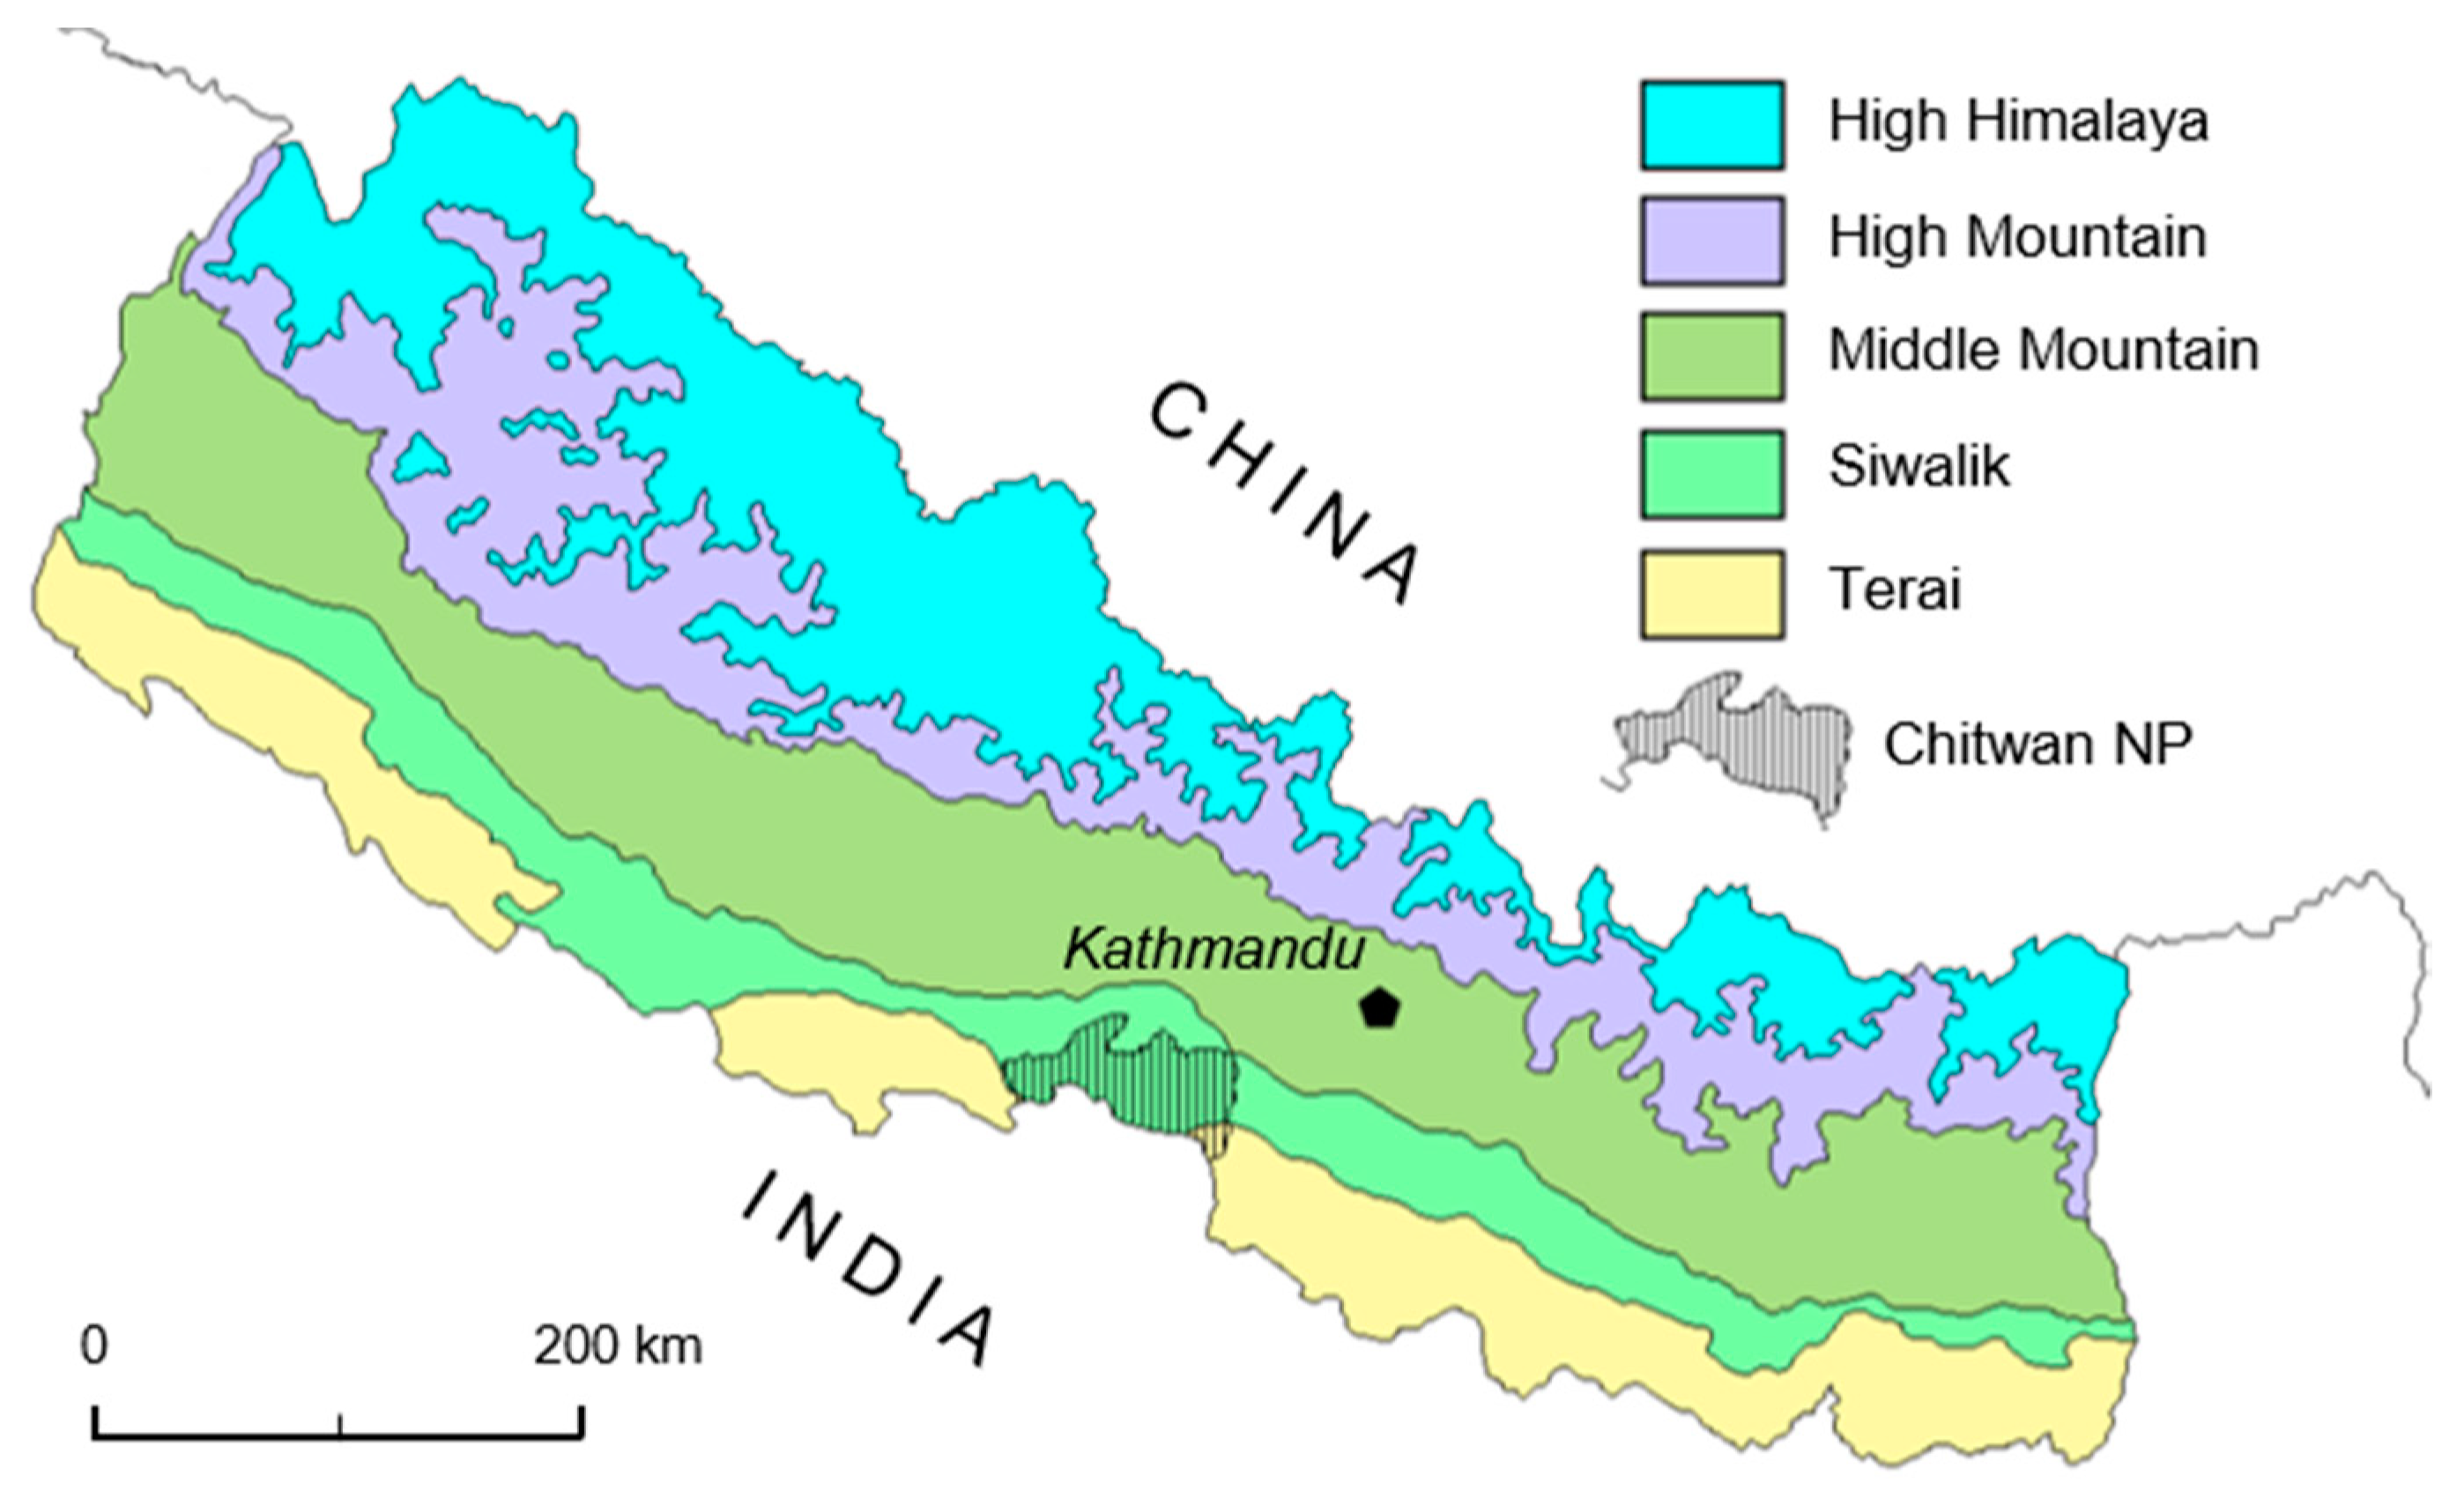
The following study was carried out on the territory of CNP and its buffer zone in southern central Nepal (Figure 1). The Chitwan National Park (CNP) hosts a rich assemblage of large animals, and it is also known as one of the most well-researched protected areas in Nepal; and probably in the South Asia as a whole. The park covers both tropical and sub-tropical habitat mosaics, which are pristine for the most endangered wildlife species such as rhino, tiger, elephant, and varieties of bird and reptile [16]. Since CNP has been internationally well recognized because of its ecological importance, it is accredited as a UNESCO World Heritage Site, a Ramsar Wetland Site and a WWF Global 200 eco-region. This is the government’s highest source of revenue collections among the parks, and at the same time it equally faces one of the largest numbers of human wildlife conflict issues, including human casualties, annually [31].
The Park was founded in 1973 as the first protected area of Nepal. The Park protects the Terai lowland ecosystems and the adjacent parts of the Siwalik Mountains, with a total area of 932 km2 on the territory of four administrative districts: Chitwan, Nawalparasi, Parsa, and Makawanpur. This park crosses the border to the untouched natural area of the Valmiki Tiger Reserve in neighboring India. On the north, foothills of the Mahabharata Mountains., the CNP is connected via the Brandabhar biocorridor, which is the only remaining link between the mountains and the lowlands that allows for the migration of wild animals. This park is a part of an internationally recognized network of basic large-scale protected areas due to its ecological significance; it belongs to the Ramsar Wetland Site and it is on the world natural heritage list registered by UNESCO. In its untouched environment, many endangered animals live, such as rhinoceros (Rhinoceros unicornis), tiger (Panthera tigris), leopard (Panthera pardus), wild elephant (Elephas maximus), sloth bear (Melursus ursinus), wild boar (Sus scrofa), gaur bison (Bos gaurus), sambar deer (Rusa unicolor), and marsh crocodile (Crocodylus palustris). The diversity of birds and reptiles is high. CNP generates a high amount of income, but every year it registers victims of human wildlife attacks. Human accidents occurred in CNP represent the majority in all protected areas in Nepal [31].
The buffer zone (BZ) of CNP covers an area of 750 km2, covering 45% of forests and 55% of agricultural land that is adjacent to the park. The buffer zone is defined to meet local community requirements for forest products, and it was designed to reduce the park’s pressure on local communities and vice versa. There are 0.25 million inhabitants in BZ who hold more than 0.15 million livestock animals, partly depending on forest resources [16].
3.2. Research Design
The individual methodological steps (Figure 3) involved both fieldwork associated with the collection of primary data, and subsequent geospatial analysis based on the design and verification of hypothetical postulates.
Before conducting field work, the government of Nepal, Ministry of Forest and Soil Conservation, the Department of National Parks and Wildlife Conservation, in coordination with the CNP and the Buffer Zone Management Committee (BZMC) issued the permissions for this study, because they are the main legal entities that are responsible for providing relief to the victims from wildlife attacks, and dealing research issues under the protected areas. For this study, both injuries and fatal cases of wildlife attacks on people in and around CNP for the period between 2003 and 2013, were considered. We made preliminary field visits, organized meetings of concerned people for group discussions, and performed key stakeholder interviews to collect primary information about wildlife attacks between September 2013 and March 2014. The verification of the data was ascertained through triangulation or a combination of methodologies that could strengthen the study. The study area is extensive, and several kinds of data such as household information and spatial locations of the incident sites were collected simultaneously.
The Global Positioning System (GPS) coordinates for each incident site were recorded with the help of the victim (minor injuries) or the victim’s representatives/or eye witnesses. The GPS points of the victim’s household were not recorded; however, when attack occurred at home, it was recorded. In addition, land cover and information like attack site distance to the forest, water body, park boundary, crop land, and human settlement were also recorded from the incident sites. Topographic map of the CNP and buffer zone (having the digital map layers like land cover, soil, contour lines, roads, rivers etc.), was obtained from the Survey Department, the Ministry of Land Reform and Management, Nepal.
Based on incident data (Table 1), descriptive temporal data analysis was conducted, followed by examining spatial patterns of attacks and dependencies between incidents and landscape characteristics in order to predict zones with different levels of attack risk.
This study relies on analyzing point data in terms of spatial statistics and spatial analysis for risk assessment of their spatial patterns using geostatistical techniques. At the beginning, we examined appropriate spatial statistics parameters using ArcGIS spatial statistics tools. Regarding the extent of studied area represented by rectangle of 84 × 44 km following statistic tests were tested: Spatial autocorrelation using Moran’s Index (Global Moran’s I) and Hot Spot analysis.
Global Moran’s I was used to measure spatial autocorrelation based on the spatial grid as a spatial unit of feature locations and feature values; it evaluates whether the pattern expressed is clustered, dispersed, or random. Global Moran’s I Summary gave these results: Moran’s I Index, the p-value, the z-score and variance. Because Global Moran’s I represents an inferential statistic, the null hypothesis states that the attribute being analyzed is randomly distributed among the features in our study area. The p-value is a probability that the observed spatial pattern was created by some random process. The lower the p-value, the higher is the probability for rejecting the null hypothesis. Typically, the p-value associated with a 95 percent confidence level is 0.05.
In the case of animal attacks, we considered discrete point values bearing information about this event. A useful GIS analysis that enables the identification of event hotspots are kernel density and Getis-Ord Gi*. The kernel is an estimator and it functions by generalizing or smoothing discrete point data into a continuous surface area [35,36,37,38]. KDE is one of these techniques that are used to create a surface to indicate the intensity of the events or the phenomenon. After Bailey and Gatrell [40], assuming that s1 ... sn are the locations of the events, then (s), the intensity of the event can be estimated by:
where τ is the bandwidth or the size of the kernel, and k is the kernel function determining the shape of the kernel. The kernel function is a bivariate probability density function, which may take different forms (e.g., quartic kernel); different specifications of the function can provide equally reasonable results. However, the size of the kernel, or the bandwidth, may have a more significant impact on the results. In general, using a smaller bandwidth will limit the density estimation to the local situation. The intensity that is estimated for the locations will be limited to the events or density in the immediate neighbor, if a relatively small bandwidth is used. Generating the intensity surface of a given event is quite useful for exploratory data analysis, not just in event mapping. Often, the density surface identifies or exposes hot spots when events are spatially clustered to a local area, or cold spots, where the events are much less frequent in the area.
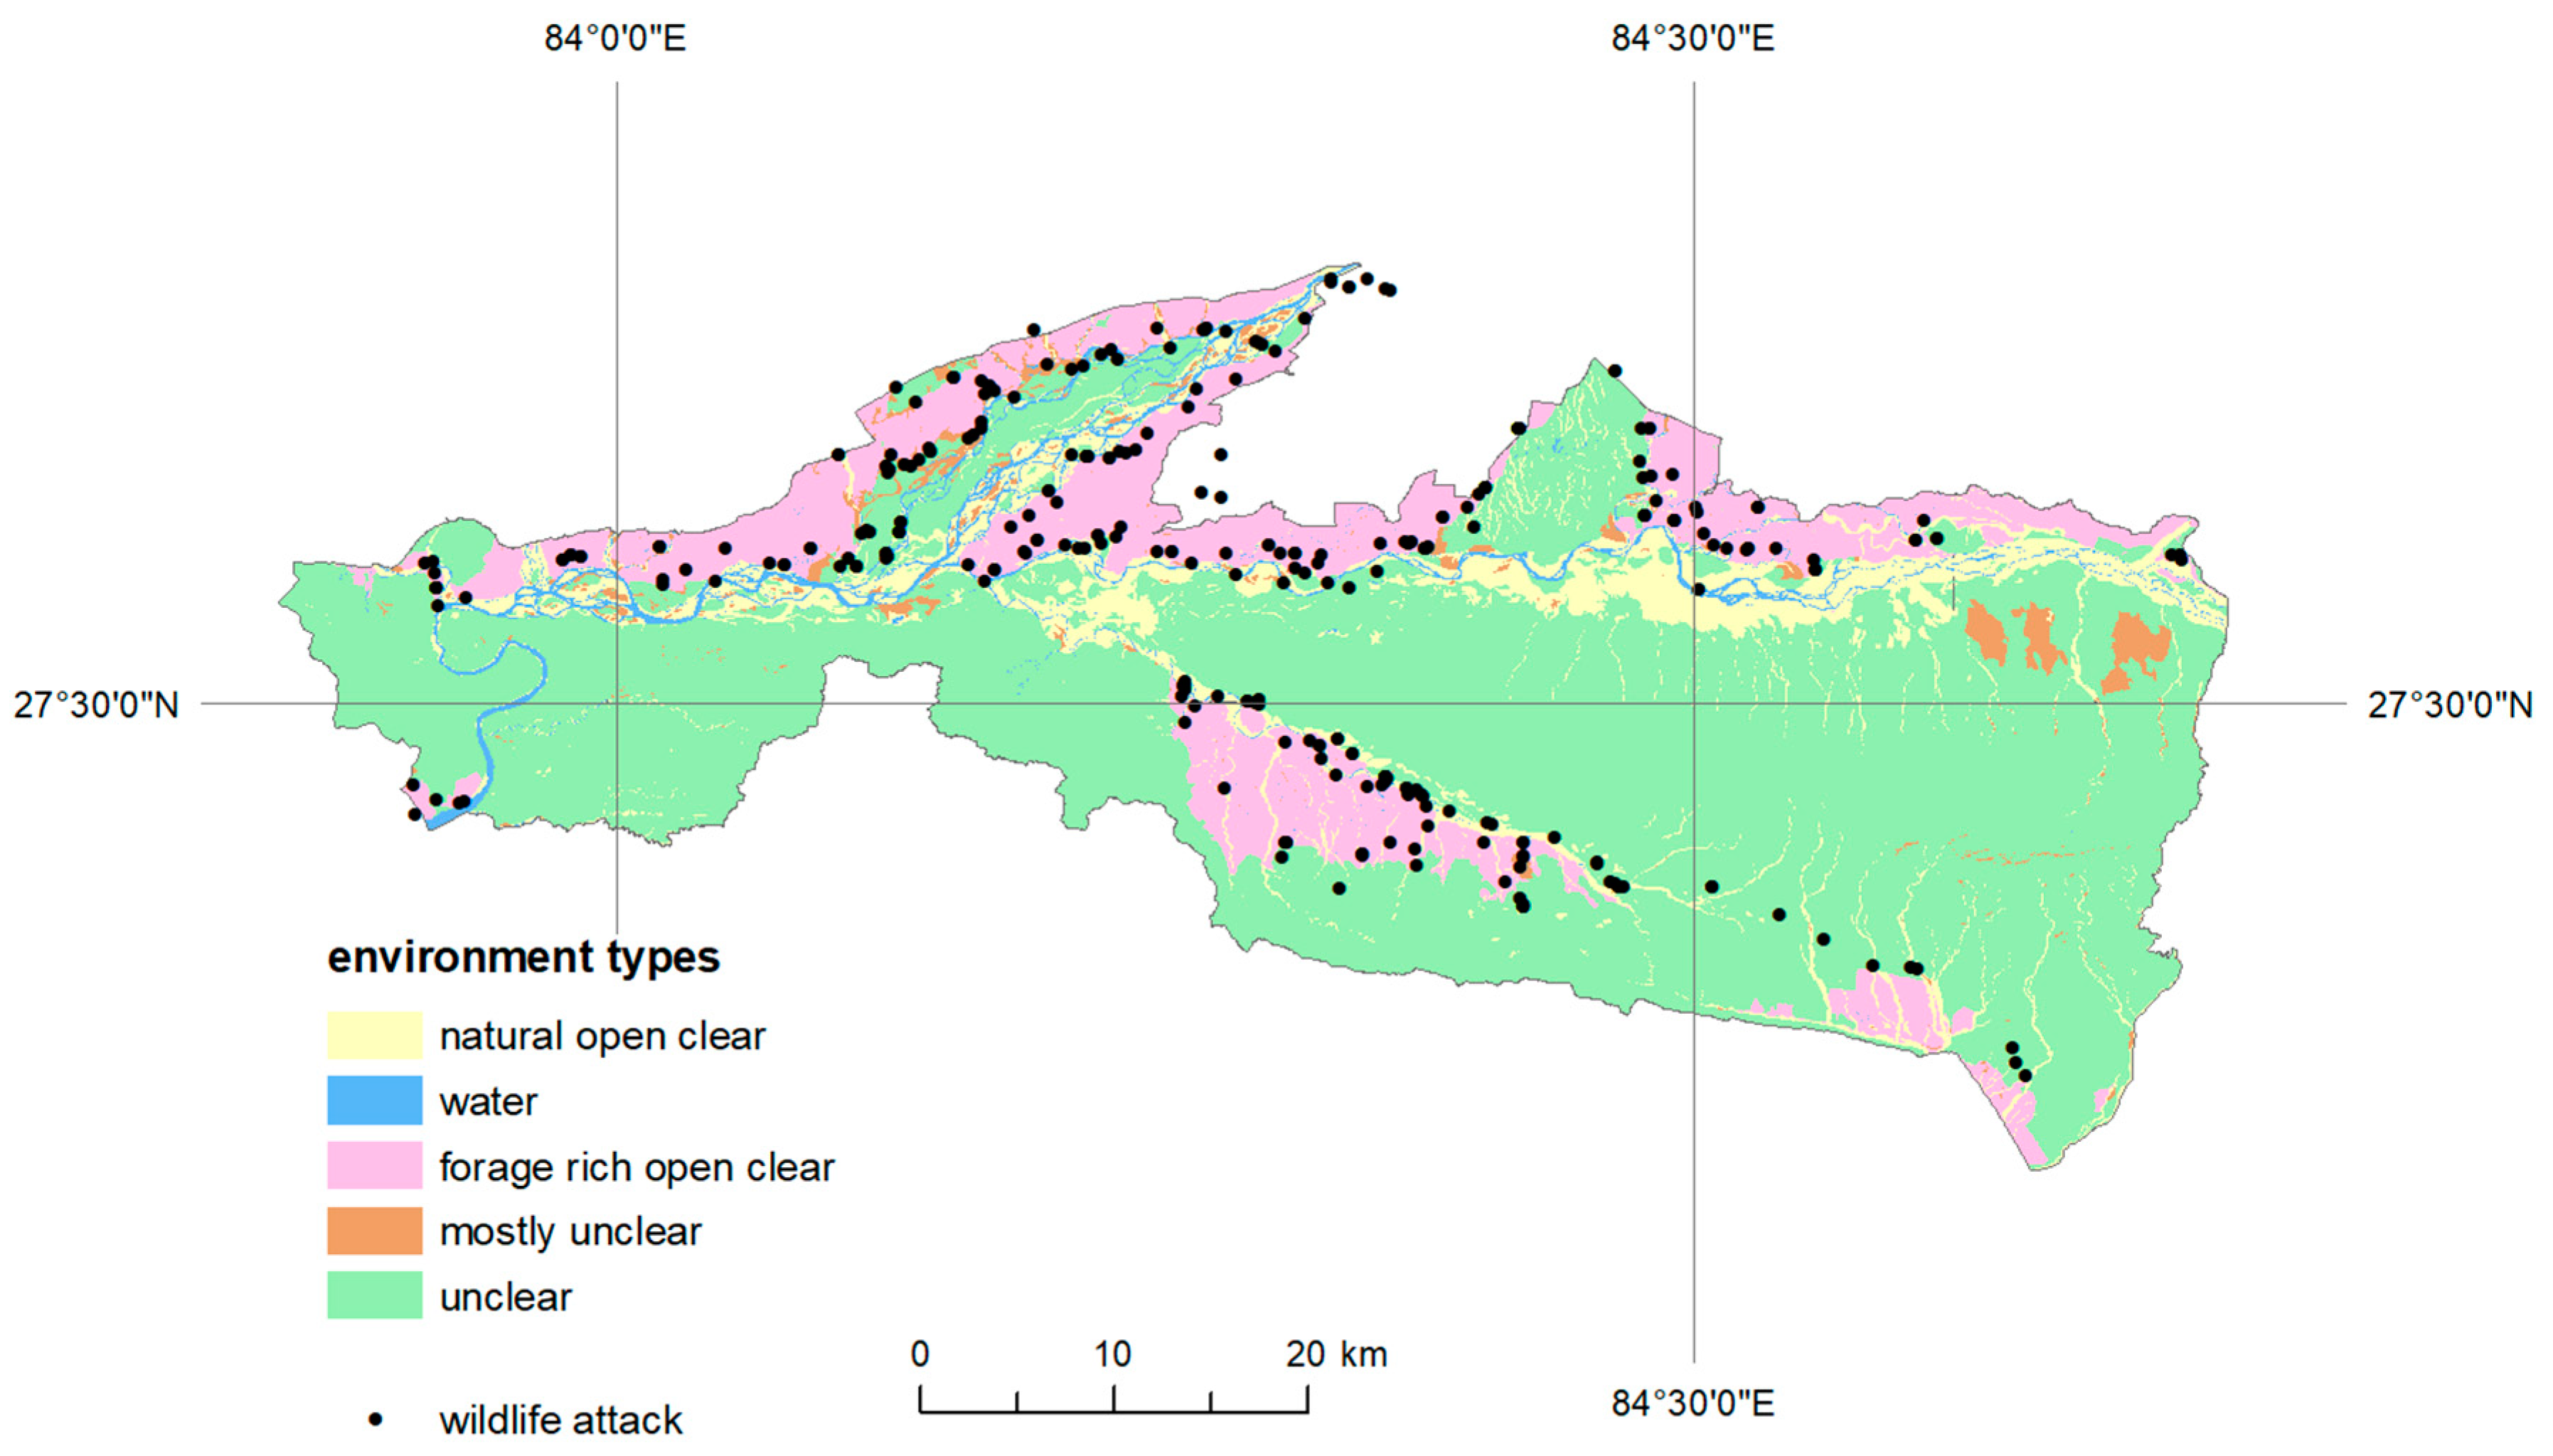
Subsequently, we worked with the hypothetical postulate that animal attacks on humans are mostly located differently in present environment (e.g., accessible and rich in food land use categories). Available land use categories, provided in vector data format by the authority of the Chitwan National Park, were grouped into the following environment categories, considering their potential for different movement conditions and food access (Figure 4):
Environment Land Use Categories
- (a)
- unclear forest land
- (b)
- mostly unclear bush/shrub, scattered trees, nursery, orchard
- (c)
- natural open clear barren land, grassland, sandy area
- (d)
- forage rich open clear cultivated land, airports, built up areas
- (e)
- water pond or lakes, waterbodies, river cutting/cliffs
For this purpose, a kernel density scale reclassified into five risk categories was used, which subsequently allowed the identification of individual degrees of risk in partial environment types. The obtained results were visualized and further refined with regard to the frequency of the attacks, and their distance from the forest environment (the frequency of attacks in individual animals was considered to be up to 50% and over 50%), which forms a natural cover.
4. Results
4.1. Incident Site Distributions
This study listed nine wildlife species that attack humans; they were rhinoceros, tiger, sloth bear, elephant, wild boar, leopard, gaur bison, sambar deer (Rusa unicolor), and marsh crocodile (Crocodylus palustris) in and around CNP between the period of 2003 and 2013 (Table 1). Rhinoceros were responsible for the highest number of attacks, followed by tiger, sloth bear, elephant, wild boar, leopard, and very few attacks by other animals (gaur bison, sambar deer, and marsh crocodile).
The highest (n = 48) and lowest (n = 16) number of attacks occurred in 2010 and 2006, respectively. There was considerable variation between the years, with a mean of 30 (st. dev = 3.13) attacks every year. The number of attacks fluctuated, but there was a steady increase in attacks since 2008. The potential causes of those attacks include increased the populations of the main attacking species (rhinoceros, tiger), increased the mobility of elephants, and caused habitat destruction as a result of invasive plant species (e.g., Mikania micrantha) inside the park, and habitat improvement in the buffer zone community forests [9,16]. Grassland coverage inside the park decreased from 20% to 12% from 1970–2013 [16].
Most of the attacks (89%) occurred outside the park boundary. An increase in attacks in the buffer zone community forests (BZCFs) and croplands [16,23,29] indicates that attacking animals, including rhinoceros and bears, are moving out of the park as it has become increasingly difficult to find suitable food, shelter, and breeding sites within the park, as a result of habitat destruction and human interference.
The majority of the attacks (74%) occurred in the buffer zone within 1 km of the park boundary. More than one-third of the attacks (37%) occurred in the BZCFs, followed by villages, cropland, and other areas (e.g., water sources, trails). These results indicated that the number of attacks increased over time in the BZCFs. In the early 1990s, forests adjoining the park were degraded as a result of overexploitation, and a large number of cattle grazed freely, but livestock predation and human casualties rarely occurred. Since 1996, however, local communities have taken responsibility for conserving buffer zone forests, and wildlife habitats have improved [16,23,29], with palatable grasses, due to regular management interventions such as plantation, weeding, and cleaning. The increased availability of resources in the forests may have attracted both local communities and wildlife, resulting in an increase in human–wildlife conflict.
According to the given results from the Global Moran’s I statistic, the p-value was 0.29 which means that we cannot reject the null hypothesis and the distribution dealing with the number of deadly animal attacks is random. For normal data distribution, the z-scores are standard deviations, and mostly are associated with p-values. The z-score between −1.96 and +1.96 indicates random distribution. This statement can be confirmed by the given results where the z-score is 1.05. Similarly, Moran’s I index (I = 0.09) belonging to the interval −1 to +1 proves that the pattern does not appear to be significantly different than random. Given a set of weighted features, Hot Spot Analysis identifies statistically significant hot spots and cold spots using the Getis-Ord Gi* statistic. The Gi* statistic returned for each feature in the dataset is a z-score. For statistically significant positive z-scores, the larger the z-score is, the more intense the clustering of high values and hot spots. For statistically significant negative z-scores, the smaller the z-score is, the more intense the clustering of low values–cold spots. This was given that results revealed that only 5% of input points that were mostly localized in the northern part of the study area were evaluated as significant hot spots. The rest did not prove statistically significant spatial clustering. Incremental spatial autocorrelation also did not indicate the distances where spatial processes promoting clustering were most pronounced.
This study showed that injury severity of the attacks was significantly correlated to the major attackers. Of the total fatalities, about 40% were caused by tigers, 38% by rhinos, 20% by elephants, and the remaining by sloth bears and wild boars. However, the rates of injury severity within major attackers significantly varied. The highest rate of fatalities was found to be by elephant attacks (68%), followed by tiger (57%), rhino (29%), and sloth bear and wild boar (4% each). The attacks by the rest of the attackers resulted in minor to serious injuries.
4.2. Temporal Patterns of Wildlife Attacks
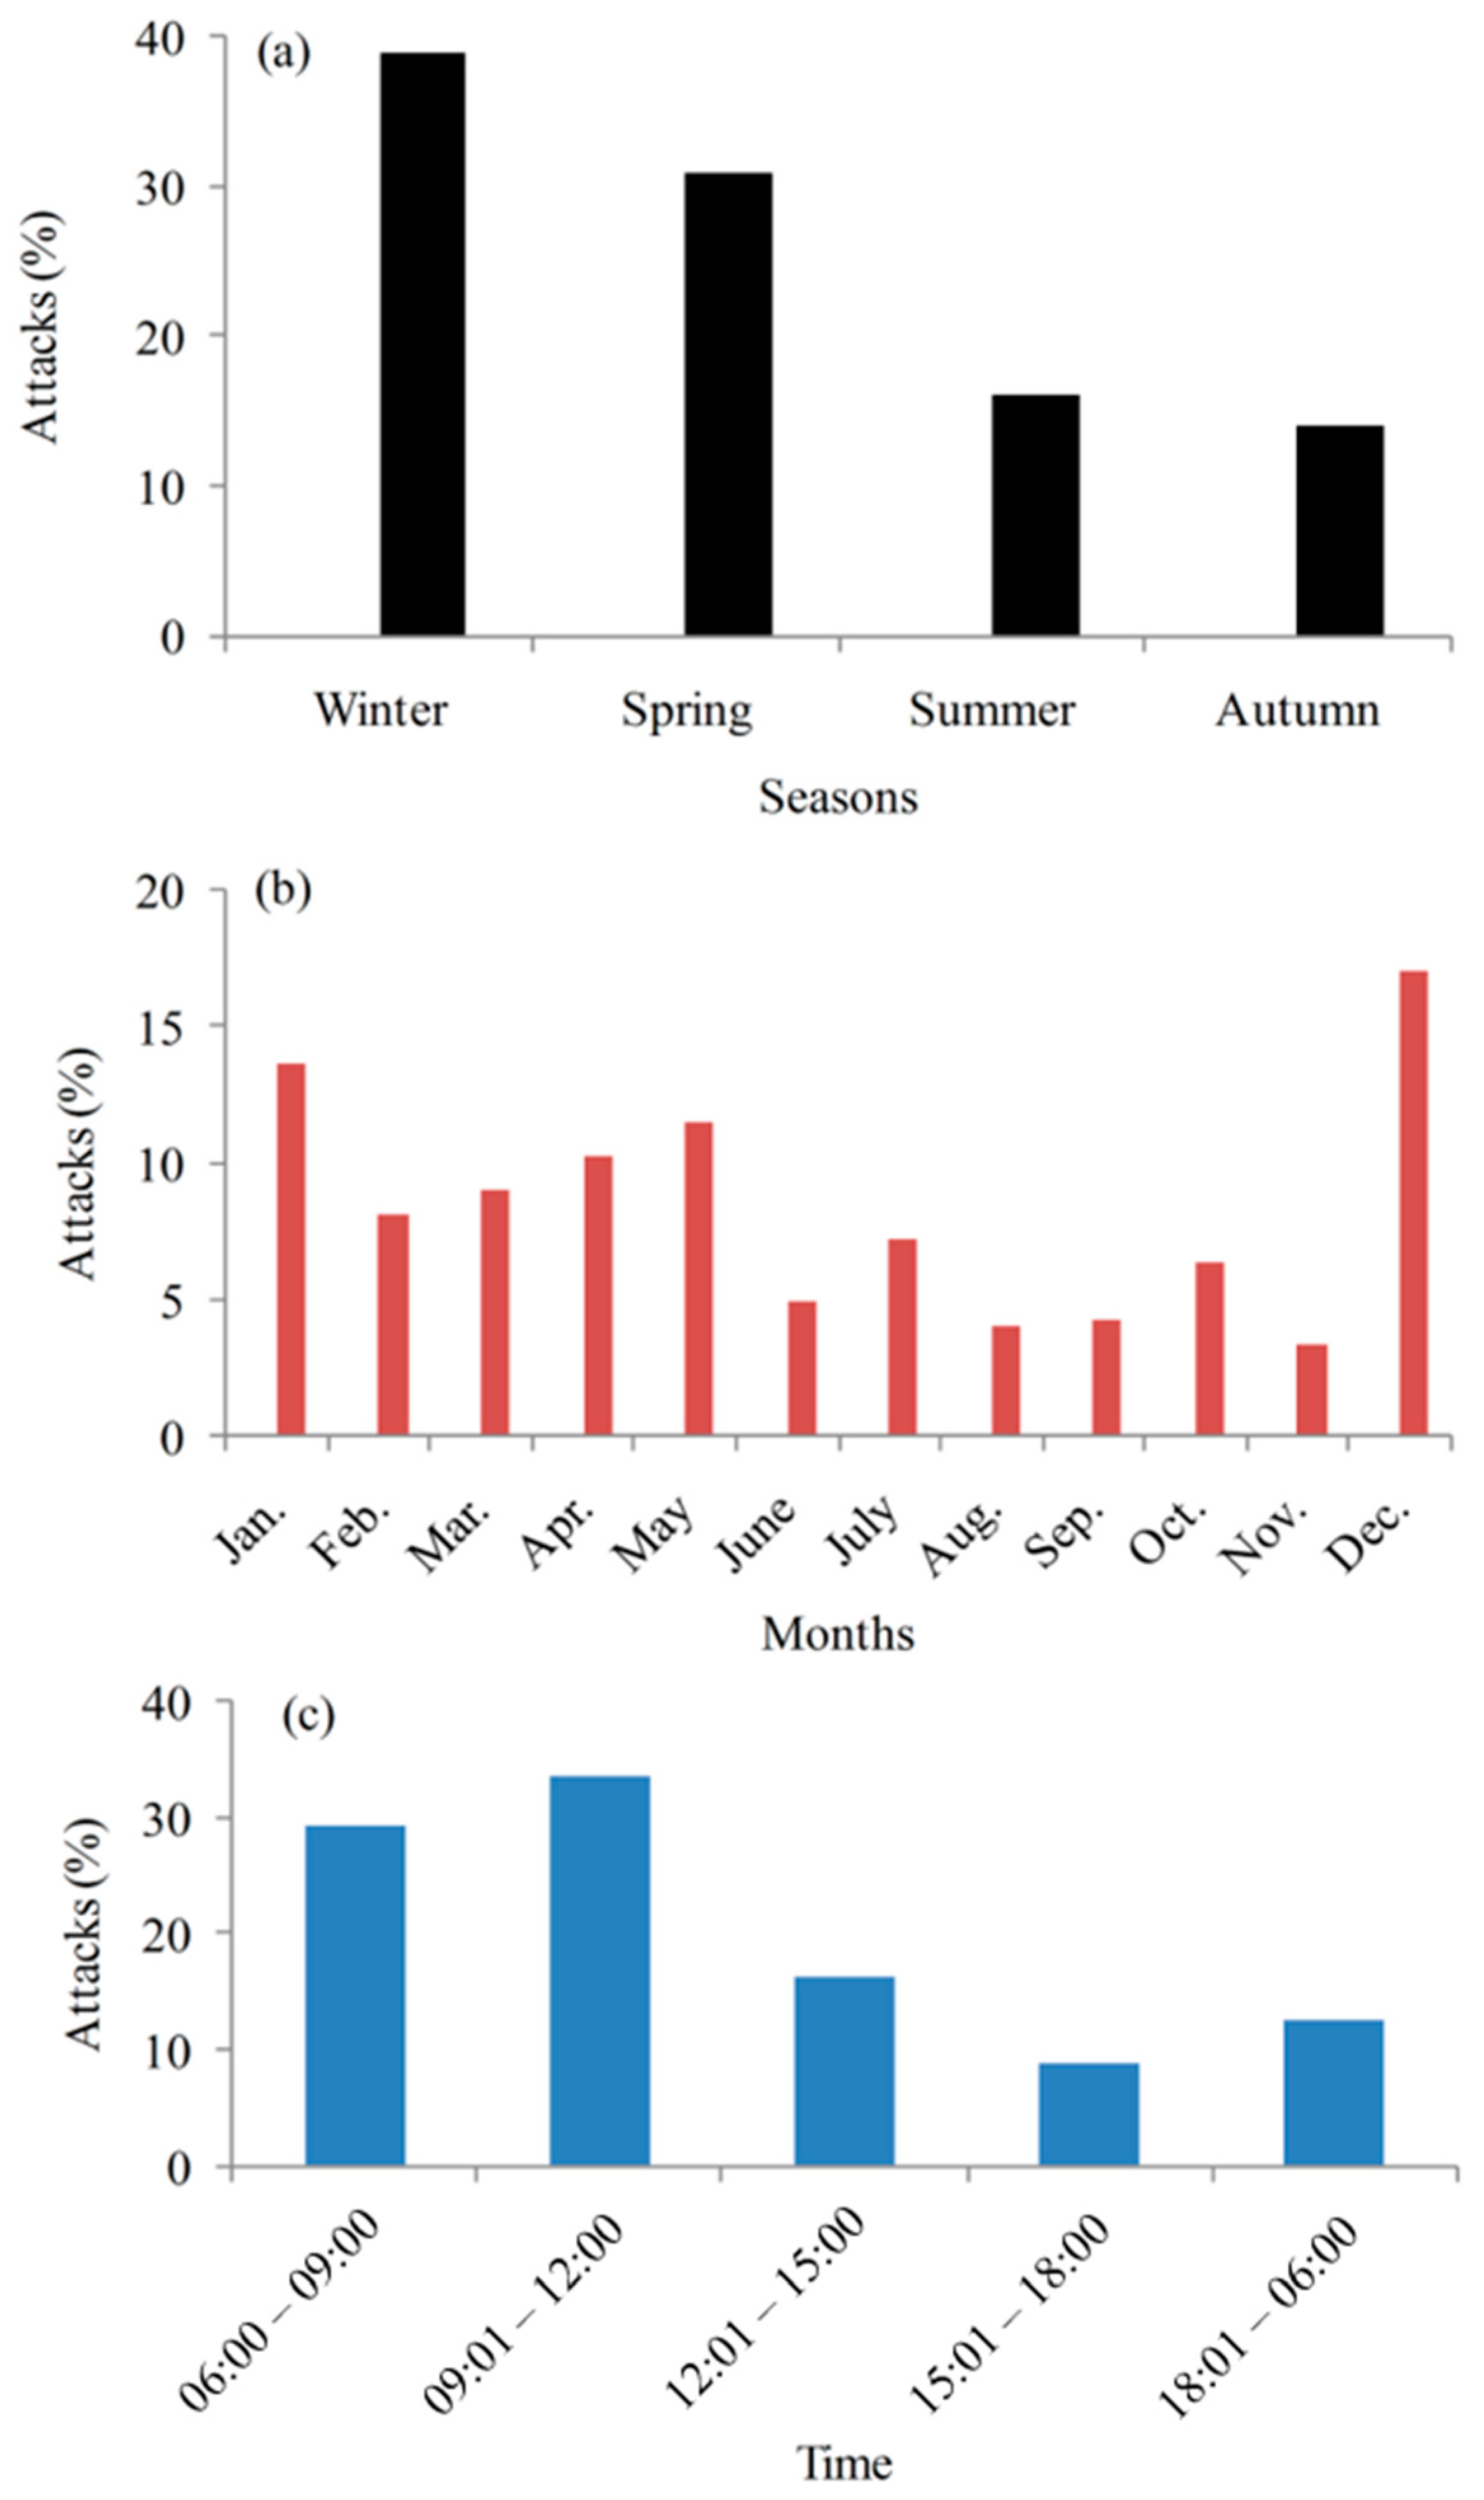
The attacks inside and outside the park boundary varied by years and seasons (Figure 5a). The attacks recorded were significantly unevenly patterned across the seasons and months. More than one-third of the attacks occurred during winter (39%) and a few incidents took place during autumn (14%). The highest number of attacks occurred in December (17%), followed by January, May, and April (Figure 5b). Most of the attacks (63%) occurred during the late morning, followed by early morning. However, the patterns of the attacks varied between the wildlife species. Most of the attacks (tiger 41%, leopard 61%, sloth bear 39%, and wild boar 38%) occurred in late morning and afternoon. About half of the attacks from rhinos were in the early morning (48%) and late morning (22%). However, it was reported that 50% of the attacks by elephants occurred during the night, followed by 31% of attacks in the late morning. These results corroborate the attacks in central Nepal [9].
Similarly, encounters between human and rhinos occur in the early morning, when rhinos are leaving the croplands to the forests after foraging on paddy, wheat, and lentils. In addition, attacks might be caused during foggy weather, which reduces visibility, then accidental collision occurs between humans and animals. Outside the park, more incidents occurred during the late morning (33%), with relatively fewer during the early morning (31%) (Figure 5c). However, most of the attacks occurred inside the park during the late morning (38%), with fewer during the afternoon (24%). People mostly used to enter the park for livestock foraging and the collection of firewood and grasses in either the late morning or afternoon.
The attacks occurred throughout the year and 24 hours a day but the rate of the injury severities differed by months. The relationship between the wildlife species and the monthly injury severities varied significantly (p < 0.006, χ2-test). In November, most of the attacks (91%) were caused by mainly three mega wildlife species: tiger (37%), rhino (27%), and elephant (27%). Of the total cases in the respective months, the highest fatalities (55%) also occurred in November, followed by August (46%), June (38%), and September (36%). This result coincides with the highest rate of elephant attacks reported by the previous study [9] in November. This may be attributed to coincide with the paddy maturation period, which substantially attracts elephants. Of the total attacks, more than 39% occurred in the winter season (December to February); however, about 34% of total fatalities occurred during the rainy seasons (June to July). It was reported that victims face transportation problems due to a lack of motorways during rainy season that delay the approach to a hospital.
4.3. Distribution of Wildlife Attacks on Humans
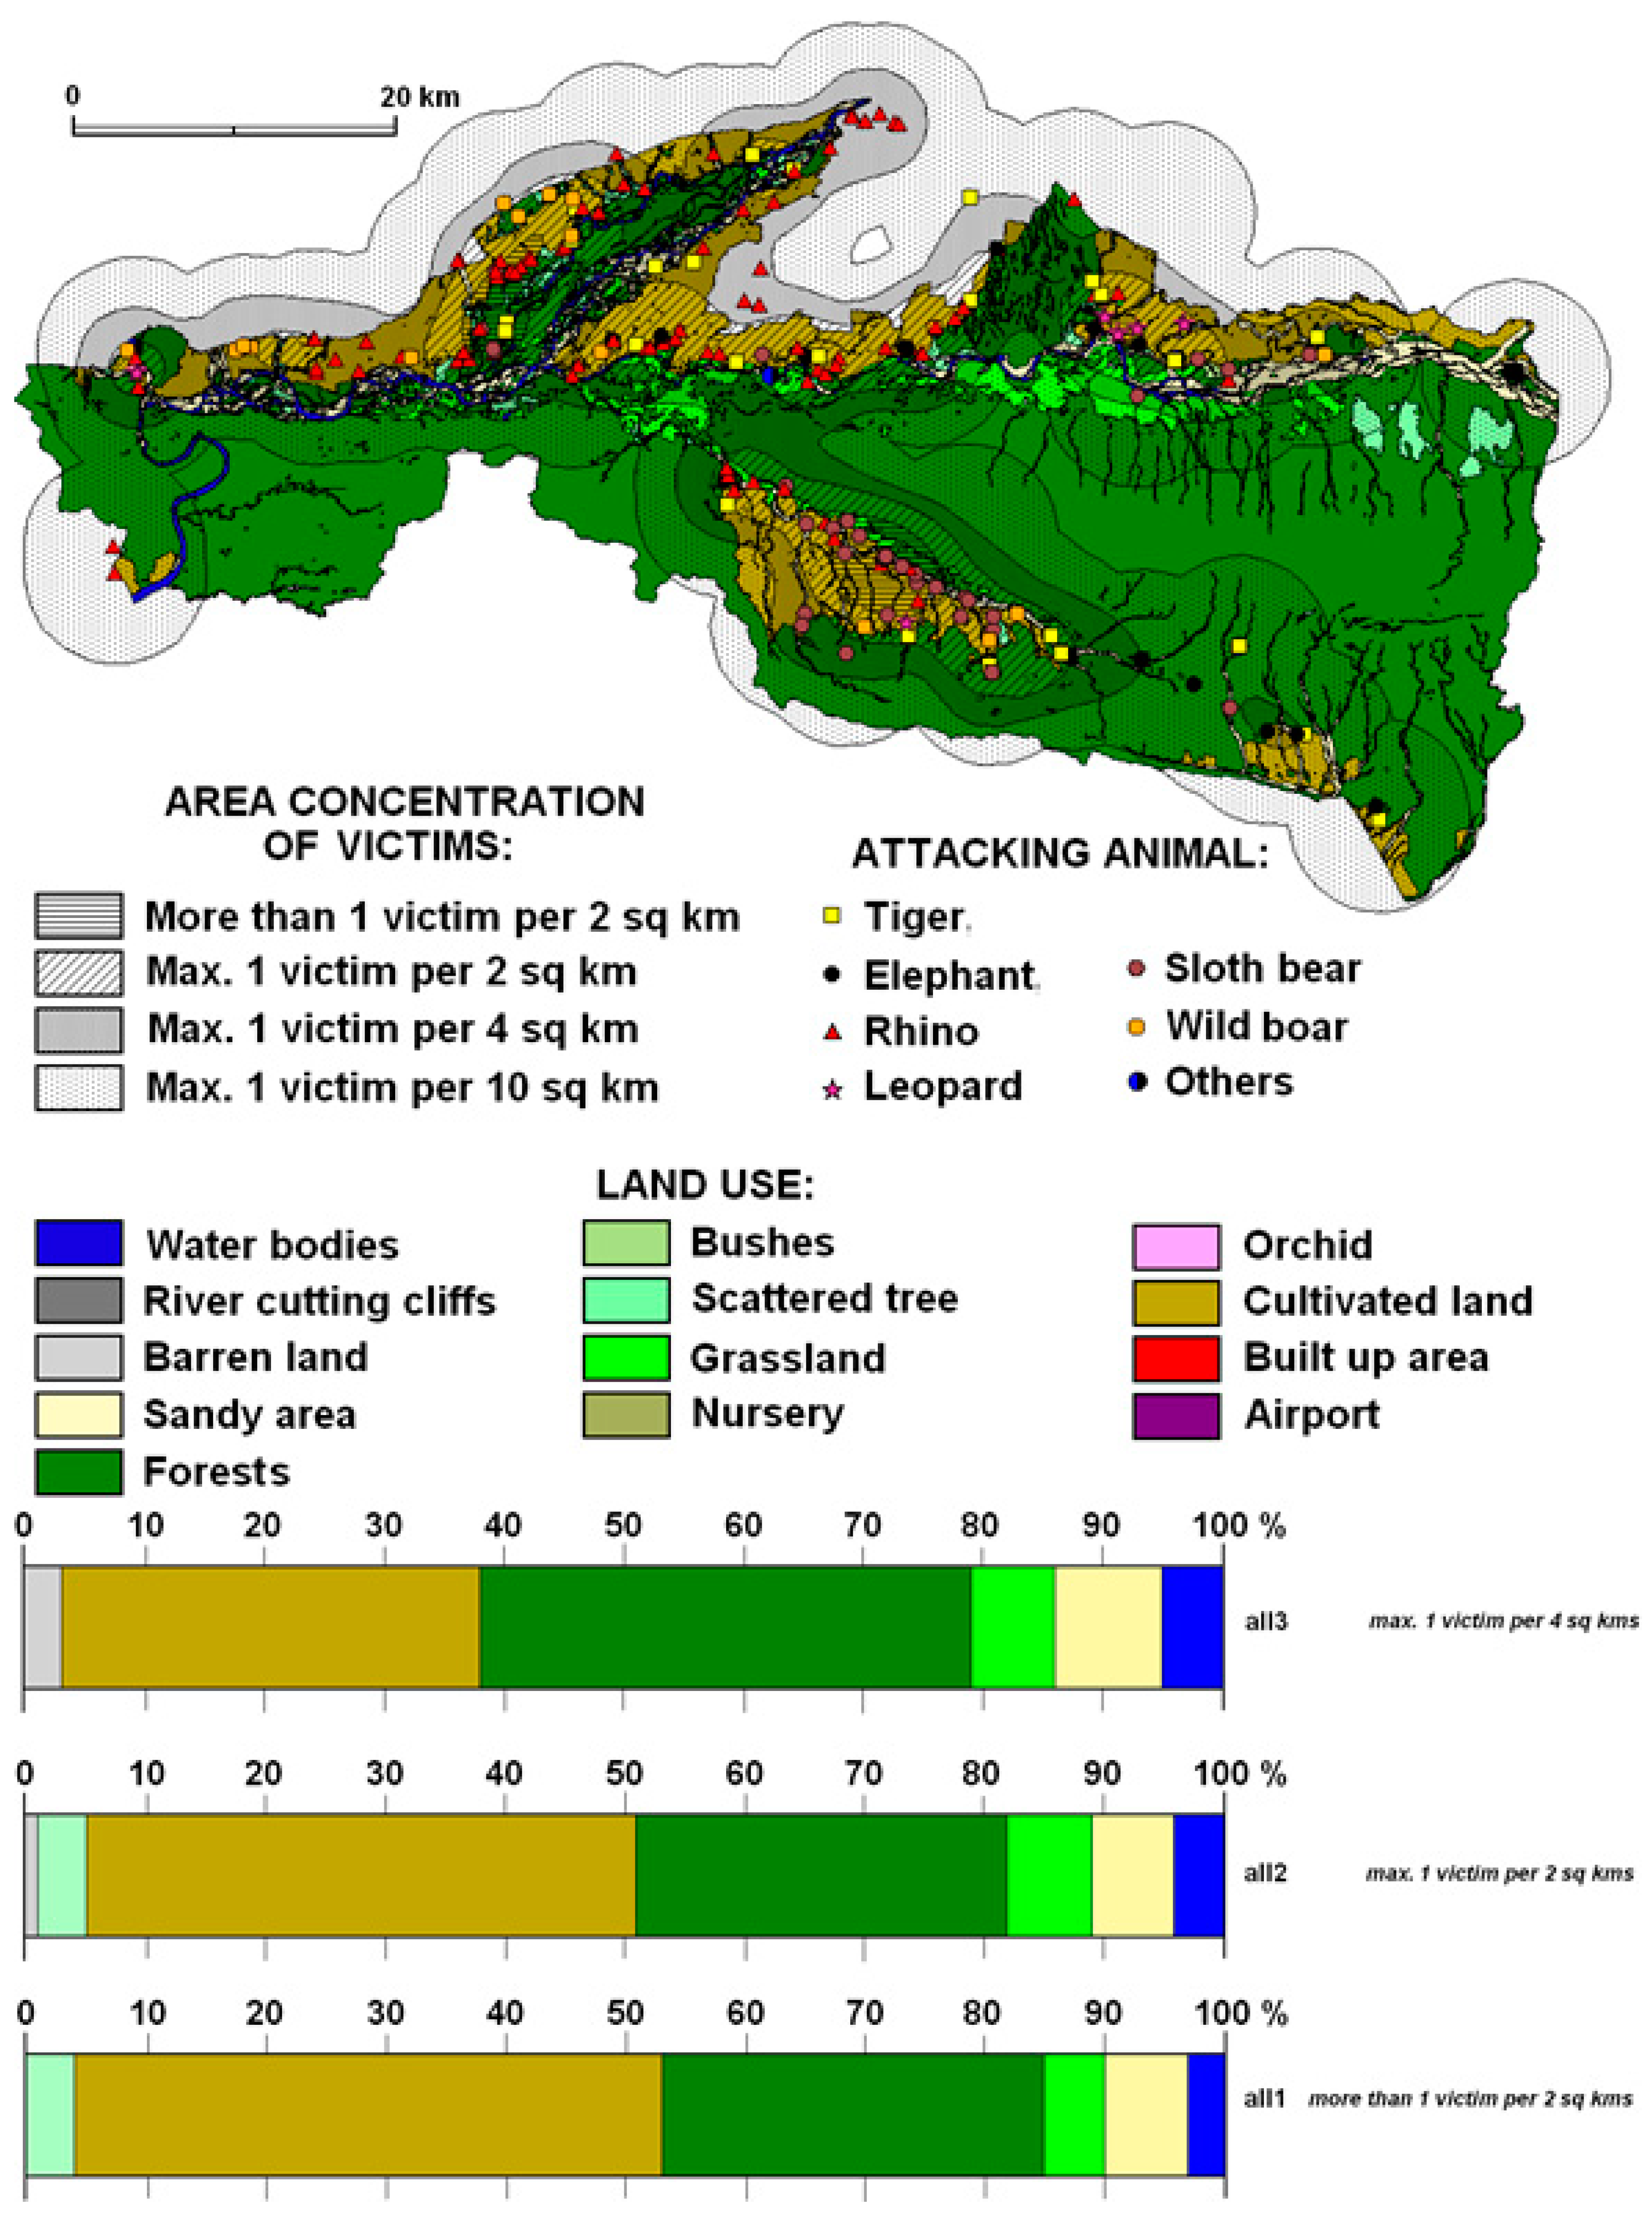
Habitat features determine the movements of territorial animals; sometimes they reduce and sometimes they expand the size of their habitats in search of feeding and breeding territories. Such flexible territorial behavior is often confronted with by humans for competing resource use and sharing common grounds. This can be seen most clearly in the context of feeding territories, where animals and people compete to share the same territory. In the territory of CNP and its neighborhoods, rhinos, tigers, sloth bears, elephants, wild boars, and leopards are responsible for major attacks, and have caused both death and injuries to humans. However, rhinos, tigers, and sloth bears seem to have superseded other animals (Figure 6). As a result, a maximum of one or more victims per 2 km2 occur more commonly in the cultivated land of the Kashara sector compared to others.
Most of the attacks were concentrated on the edge of the forest and cultivated land near buffer zone forests (Figure 7). The generalized models suggest three typical relationships between the maximum concentration of attacks and their position in the area where they meet forests and cultivated land at different distances, and vice versa. The highest share of incidences was more than one victim per 2 km2 (49%) on cultivated land, followed by 31% on forest land, 6% in sandy areas, 5% in grassland, 4% in bush/shrubland, and only a few on orchard and barren land.
According to the correlation coefficient by Pearson, there is little relationship between the dominating land use and the occurrence of wildlife attacks. In this case, the low level of animals specializing in land use is demonstrated by very small values of the correlation coefficient (r < 1). The medium level of the relationship between dominating land use and animal attacks is represented by r values of between 0.3 and 0.7. A relatively important correlation between land use and animal attacks is visible in the cases of the sloth bear (r = 0.79, the highest territorial concentration of victims caused by bears) and the leopard (r = 0.81, the highest concentration of victims caused by leopard). Both these animals have their operation range (finished with attacks) in the open cultivated countryside. This probable explanation can be related with a generally small site of these animals and their necessity for having a wider territorial range when moving in the area. In general, there is no strong relationship between animal attacks and land use in the CNP and its buffer zone, with r greater than 0.82.
Following the correlation between all areas with different concentration of victims of all animal attacks (individual variations of more than one victim per 2 km2, a maximum of one victim per 2 km2, and a maximum of one victim per 4 km2 were examined) informs us of the relative similarities between the action ranges (given by the percentage of the individual’s shares of land use forms, with 1% and more share in the attack density areas) of individual animals with the same concentration of victims (Table 2). Only action ranges with the same concentration of victims caused by different animals can be mutually compared. Most of the r-values exceeded 0.9. This means that most areas where wildlife attacks occur are very similar from the viewpoint of the land use structure to each other. The attacking animals move in the same type of the landscape. The values of r from 0.70 to 0.79 show strong relationships between the land use structure of the attacking animal’s movement ranges—the differences between areas of attack are very small. The r values were slightly above average (r = 0.50 to 0.69), representing areas with similar land uses that differed statistically with each other; however, they differed very little from the landscape view. Relatively important land use differences that were slightly more below the average between the action ranges of attacking animals could be seen under r values ranging from 0.30 to 0.49. A different area land use structure was represented by a r value below 0.30. Exceptional r values were typical for the area of elephant attacks (maximum of one victim per 4 km2) if comparing with other areas of all attack on the same attack density level. A partially similar view was provided by a comparison of areas of leopard attacks (a maximum of one victim per 2 km2), with areas of attacks of other animals. In conclusion to Table 2, the following expression can be written: The action range of an attacking elephant is exceptionally different from attacking areas of other animals. The area with a maximum of one victim per 2 km2 caused by the leopard showed an important difference in the land use structure of the attack ranges of other animals.
The density of sloth bear victims was high, whereas there were fewer densities of tiger and rhino victims. This meant that the victims of sloth bears were both numerous and territorially the most concentrated. There was also a very strong positive correlation among land use in the attack areas of all animals, as indicated by the correlation coefficient (r > 0.9 for all except elephant_3 and wildboar_3). This means that on the level of the lowest territorial attack concentrations, the land use area composition was very similar to each other. This could be a result both of the generalization process (see Figure 5), while expanding the victim’s (attack) concentration area to lower concentrations, as well of the similarity of the attacking animal’s activity range on this density level. The strongest relationship was found between land use in the attack areas of leopard_3 and of rhino_3 (r = 0.9927). However, the correlation coefficient between elephant_3 and wildboar_3 was a minimum among all (r = 0.4575), and the relationship was still positive. This probably meant that the action areas of these attacking animals were different from the others from the view point of land use composition, even with a quite low density of attacks.
4.4. Safety Analysis of Wildlife Attacks on Humans
Because previous geospatial analysis confirmed random data distribution and no cluster significance, the application of the kernel density tool followed. We used kernel density to calculate a magnitude-per-unit area from attacks, using a kernel function to fit a smoothly tapered surface to each point, because suitable reclassification can generate significant zones showing a higher probability of wildlife attacks (Figure 8). The kernel density attack raster layer was reclassified using the geometric interval algorithm (the frequency distribution was exponential, therefore geometric intervals were most appropriate) into five categories: very low, low risk, medium risk, high risk, and very high risk.
Further statistical examining cleared up that only elephants attacked 50% of their victims in an unclear environment. The attacks of other animals (considering the range 51–95%, where 5% was considered as the usual statistical reserve) took place in different buffer zones around forests mostly in an natural open clear environment and forage rich open clear environments (Table 3 and Table 4). Forests were chosen as an input polygon for creating buffer zones, because this land use category covers more than 60% of study area. These results were examined by chi-quadrat test where the null hypothesis states that different environment does not influence the number of attacks. According to given results the null hypothesis was rejected at the confidence level 0.05. The test proved that different environment influences the number of attacks. From this point of view, the riskiest environments are natural open clear environment (regarding the highest share of attacks up to 50% and second highest share of attacks up to 95% of victims) and forage-rich open clear environment (highest share of attacks up to 95% of victims).
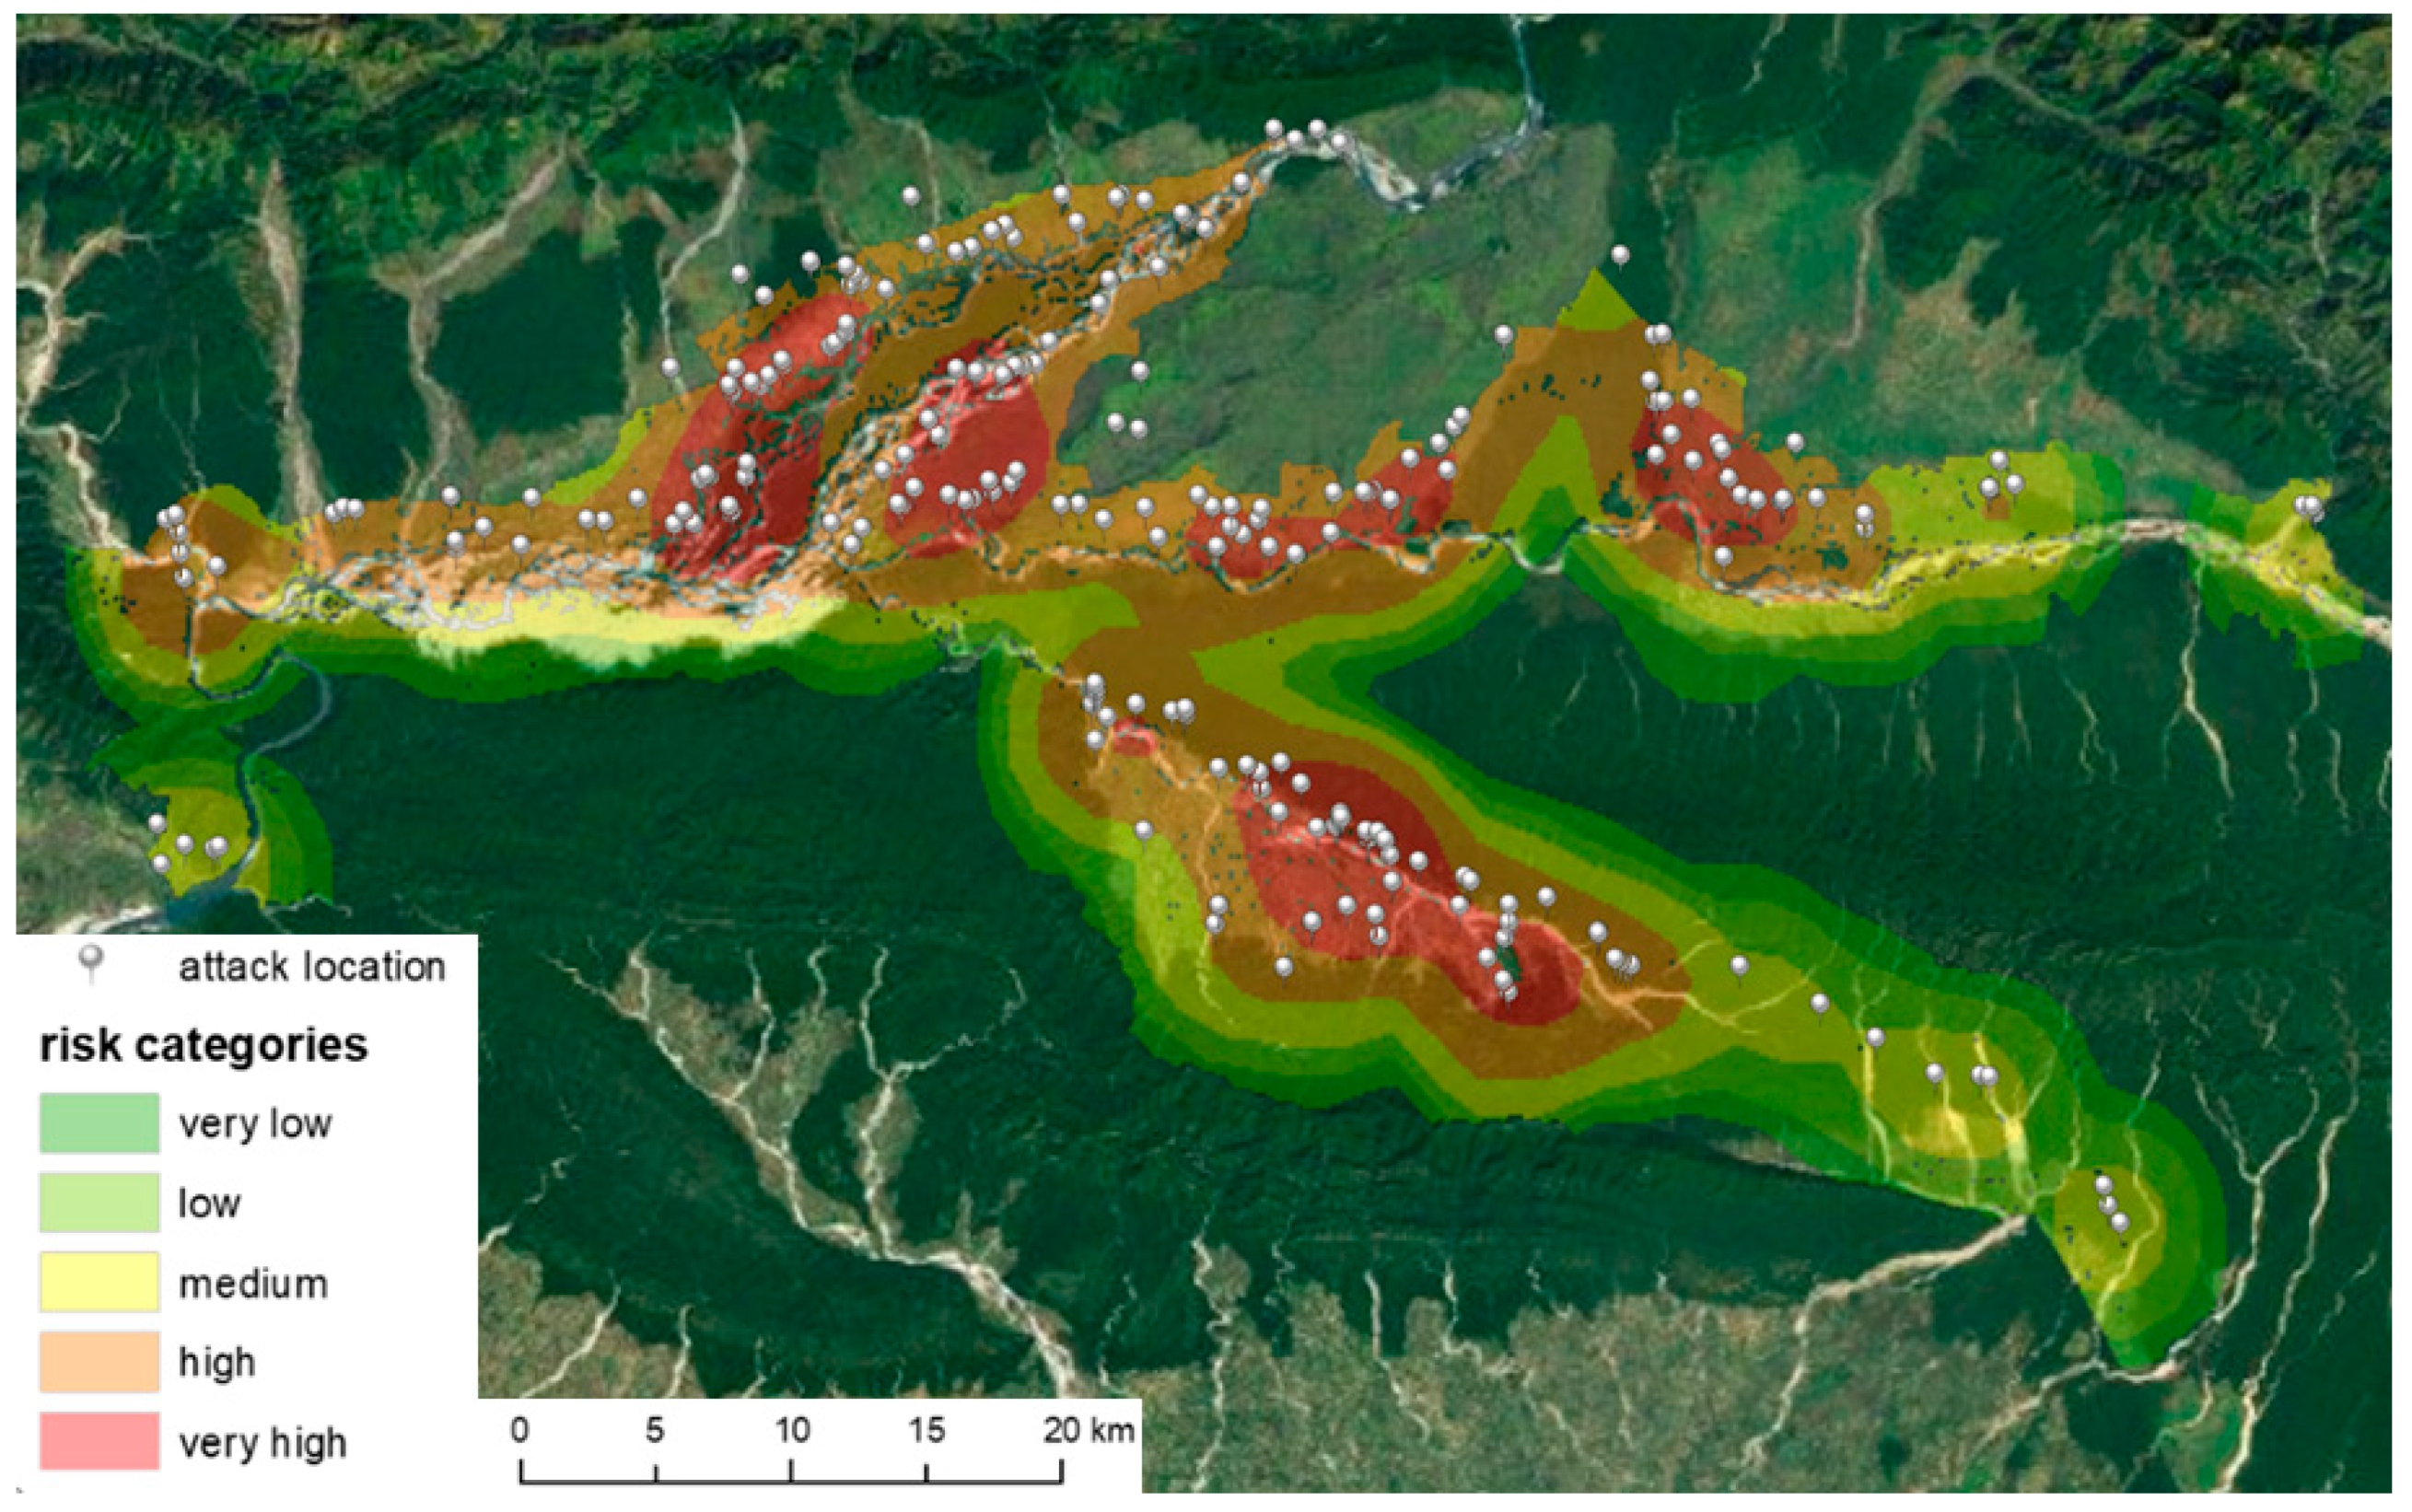
Although cluster analysis did not show statistically significant clusters, and the kernel function application allowed identification of core regions and distinguished areas with a lower risk of wildlife risk attack. Combining the kernel density surface and statistically derived land use environments brought significant results generating final risk categories (Figure 9). The points on the map are attack locations, and color zones represent the intersection of the kernel density layer (wildlife attacks on humans) with three purpose-defined land use groups (forests—the darkest areas under the risk zones, open—the lightest areas in the ortophoto, and the cultivated landscape) with regard to the degree of clarity for migrating animals and moving humans, and the potential source of food. By spatial analysis of the spatial relationships of the three information layers (places of attacks), their spatial concentrations over land use types, it was possible to determine the most threatened areas of human wildlife attacks (of course, on the basis of previous recorded events). The majority of the attacks took place near the boundary of the forest, mostly up to 500 m towards the cultivated landscape and less into the forest. If there are human farms in this area, the risk of wildlife attacks is relatively high. If the species of the attacking animal are taken into account, it is mainly wild boar, rhinoceros, and probably leopard who seek the food on fields and near human settlements which are increasingly becoming conflict hotspots [41].
The results of the above-mentioned spatial analysis can be motivated by the recommendation that priority should be given to the risk of attacks in the riskiest areas. The risk, after the stabilization of one site, could be moved to a less dangerous site by now, if the situation forces animals to leave the park as they do now. However, the risk may be moved to a hitherto less dangerous site after stabilizing one site, if the situation forces the animals to abandon the park to the same extent as before e.g., unregulated growth of the stock of high-risk game species). It is evident that the risk reduction can only be achieved by a comprehensive combination and selection from the activities mentioned above, since conflict with wildlife can never be completely ruled out.
5. Discussion
The discussion will be divided into two parts: the comparison of thematical foundations, and methodological comparison among similar studies.
The number of people killed by tigers over 2003–2013 (3.5 per year) was lower than that reported for 1998–2006 (7.2 per year; [29]), and higher than that reported in Bardia National Park for 1994–2007 (0.9 per year; [42,43]). The tiger population in CNP increased from an estimated population of 91 individuals in 2009, to 120 in 2013 [16]. Likewise, a higher number of attacks by rhinos were recorded, compared with previous studies due to an increase in rhino populations from 372 in 2005 to 605 in 2015 [16]. In between 1998 and mid-2003, rhinos attacked 65 people (>6 people year−1) in the buffer zone of the CNP and 12 of them died. However, this study shows a much higher number of rhino attacks i.e., about 12 people annually. Of them, 29% were death cases. Among the serious cases, the attacks by rhinos were reported to be the highest (41%), followed by bears (29%), tigers, and elephants (12% each). However, this result does not corroborate the previous studies. Pant et al. [9] reported that death cases caused by elephant were higher (88%) in the central Nepal, but the death cases caused by tigers were lesser (54%) in the Tadoba-Tiger Reserve in India [27]. Mayer [44] stated about three-fold more fatalities (15%) caused by wild boar attacks than the recorded fatalities caused by wild boars (4%) in CNP. It might be concluded that the attacks by mega wildlife species (e.g., elephant, rhino, tiger) caused much more severe injuries and more chances of deaths occurred than from attacks by smaller wildlife species (e.g., sloth bears, wild boars, deers, crocodiles).
Most of the attacks occurred less than 1 km from park boundaries in the buffer zone. Like other studies [9,27,29], this study also indicated an inverse relationship between the distance from the park boundary and a similar frequency of the wildlife attacks in the territory of CNP and its neighborhoods. However, the rate of fatalities was the highest (41%) beyond 3 km from the park boundary, and the lowest within 2–3 km during 2003–2013, where the attacking species involved are mega vertebrates (rhino, elephant, tiger), covering much wider territorial ranges to find food, water, and shelter beyond the park. Similarly, the rate of fatality among site environments was found the highest inside the buffer zone forests (39%) followed by park-forest, village, farmland, and others (water sources, trail). The buffer zone community forests have become attractive extended habitats outside parks to the mobile wildlife species and also become alternative forest for local people to collect forest resources [27,29,43,45]. This has resulted in increased wildlife people interactions in the BZCFs, which are common places for both wildlife, and communities for their usages.
Different approaches have been developed and applied, in order to examine and map the predicted risk connected with wildlife attacks. As was stated in chapter 2 (Conceptual Background), correlation modeling, spatial association, and spatial interpolation are frequently used. Considering the mapping predicted risk, we derived risk categories based on KDE results and environment types, together with statistical clarification, which, according to our findings, has not been yet applied within wildlife attacks issues. Other similar studies [46,47] that were used, mostly portrayed the risk at different scales and management units. Kissling et al. [46] developed a rule-based habitat model in GIS to predict the distribution of puma habitats using generalized linear regression. Treves et al. [47] applied a strictly defined square grid combined with a weighted multicriterial analysis. Both methods have their limitations (the extent of the area and grid size, generalization, weights setting etc.) which did not fit our conditions. Spatial associations examining the clustering for identifying hotspots work well, especially with smaller datasets and in areas without random distribution [32,48], and can be improved following computation, as Baruch-Mordo et al. [32] did when they tabulated conflicts by superimposing a grid on the analysis extent, counting the number of conflicts within each grid cell per year, and summing the number of conflicts over the 18-year data span. In our case, we were not able to use spatial autocorrelation, but we used environment types and statistical descriptions illustrating the dependence or independence of attacks on the forest area. On the other hand, only hotspot mapping was not sufficient. This connects both approaches (using spatial autocorrelation and KDE mapping), because when hotspots are mapped, additional analyses connected with landscape attributes are needed [32].
Besides that, other methodologies appeared. Lamichhane et al. [49] analyzed the characteristics of the problem-causing tigers in Chitwan National Park and used a binomial logistic regression by constructing a generalized linear mixed model to test the hypothesis that conflict-causing tigers have different characteristics than those in the source population. Almost the same approach, but with many variables, were used by Miller et al. [50] for assessing the spatial patterns of predator–prey interactions.
6. Conclusions
The geospatial analysis of very rear available data about the wildlife–human conflicts in the Chitwan NP and in its neighborhood not only provides the local with the information about the most endangered sites, and about typical risky environments from the point of view of wildlife attacks, but also provides the local communities with some kind of inspiration on how to actively prevent or reduce possible conflicts.
In the case of population explosions, increasing the pressure on natural resources is inevitable. Obviously, the problem of wildlife attacks on humans has a very complex background. The results of the analysis can provide an idea of the appropriate responses to the dangers arising from the coexistence of the human community in the neighborhood of the NP and wildlife:
- (a)
- Move residential buildings as far as possible from the NP border, especially if it is represented by a forest.
- (b)
- Separate economic objects from residential areas, because stored food and products (alcohol) are a wildlife decanter.
- (c)
- Ensure the observation of open agricultural areas from secured watchtowers.
In the light of other general knowledge and experience, it is possible to create a sequence of tasks that are designed to address the results of the demonstrated analysis, and to require state or regional administrations. A sequence of current proposals can be stated according to the degree of generality and urgency:
- (1)
- Reduce the population increase of the local community.
- (2)
- Intensify economic development.
- (3)
- Reduce the use of biomass in the NP by humans to keep it specifically for wild animals, which can reduce their motivations to leave the park for food.
- (4)
- Prevent animal migration outside the park by technical means. The former primitive electric fence was easily overcome by elephants.
- (5)
- Concentrate the protection of residential and commercial buildings.
The results of the above-mentioned spatial analysis can motivate the recommendations where priority should be given to the risk of attacks in the most endangered areas. However, the risk, after stabilization of one site, can be moved to a less dangerous site by now, if the situation forces animals to leave the park as they do now. Then, the new situation will force the animals to abandon the park to the same extent as before e.g., unregulated growth of the stock of high-risk game species. It is evident that the risk reduction can only be achieved by comprehensive combination and selection from the activities mentioned above, since conflict with wildlife can never be completely ruled out.
Author Contributions
Conceptualization, A.R. and J.K.; Methodology, A.R. and J.K.; Software, A.R.; Validation, T.S.; Formal Analysis, T.S.; Investigation, T.S..; Resources, T.S.; Data Curation, T.S.; Writing-Original Draft Preparation, A.R., T.S. and J.K.; Writing-Review & Editing, A.R.; Visualization, A.R. and J.K.
Funding
This research received no external funding.
Conflicts of Interest
The authors declare no conflict of interest.
References
- Conover, M.R. Resolving Human-Wildlife Conflicts: The Science of Wildlife Damage Management; CRC Press, Taylor & Fancis Group: Boca Raton, FL, USA, 2001; ISBN 9781566705387. [Google Scholar]
- Liu, F.; McShea, W.J.; Garshelis, D.L.; Zhua, X.; Wanga, D.; Shaod, L. Human-wildlife conflicts influence attitudes but not necessarily behaviors: Factors driving the poaching of bears in China. Biol. Conserv. 2011, 144, 538–547. [Google Scholar] [CrossRef]
- Batavia, C.; Nelson, M.P. Heroes or thieves? The ethical grounds for lingering concerns about new conservation. Environ. Stud. Sci. 2016, 7, 394–402. [Google Scholar] [CrossRef]
- Madden, F. Creating co-existence between humans and wildlife: Global perspectives on local efforts to address human–wildlife conflict. Hum. Dimens. Wildl. 2004, 9, 247–257. [Google Scholar] [CrossRef]
- Cline, R.; Sexton, N.; Stewart, S.C. A Human-Dimensions Review of Human-Wildlife Disturbance: A Literature Review of Impacts, Frameworks and Management Solutions; US Geological Survey: Reston, VA, USA, 2007. Available online: https://www.fort.usgs.gov/sites/default/files/products/publications/21567/21567.pdf (accessed on 20 June 2018).
- Treves, A.; Karanth, K.U. Human carnivore conflict and perspectives on carnivore management worldwide. Conserv. Boil. 2003, 17, 1491–1499. [Google Scholar] [CrossRef]
- Linkie, M.; Dinata, Y.; Nofrianto, A.; Leader-Williams, N. Patterns and perceptions of wildlife crop raiding in and around Kerinci Seblat National Park, Sumatra. Anim. Conserv. 2007, 10, 127–135. [Google Scholar] [CrossRef] [Green Version]
- Inskip, C.; Zimmermann, A. Human felid conflict: A review of pattern and priorities worldwide. Oryx 2009, 43, 18–34. [Google Scholar] [CrossRef]
- Pant, G.; Dhakal, M.; Pradhan, N.M.B.; Leverington, F.; Hockings, M. Nature and extent of human–elephant Elephas maximus conflict in central Nepal. Oryx 2015, 50, 724–731. [Google Scholar] [CrossRef]
- Silwal, T.; Kolejka, J.; Sharma, R.P. Injury severity of wildlife attacks on humans in the vicinity of Chitwan National Park, Nepal. J. Biodivers. Manag. For. 2016, 5. [Google Scholar] [CrossRef]
- Silwal, T.; Shrestha, B.P.; Bhatta, B.P.; Devkota, B.P. Revenue distribution pattern and park-people conflict in Chitwan National Park, Nepal. Banko Janakari 2013, 23, 35–41. [Google Scholar] [CrossRef] [Green Version]
- Nyhus, P.J.; Sumianto, R.T. Crop-raiding elephants and conservation implications at Way Kambas National Park, Sumatra, Indonesia. Oryx 2000, 34, 262–274. [Google Scholar] [CrossRef]
- Bagchi, S.; Mishra, C. Living with large carnivores: Predation on livestock by the snow leopard (Uncia uncia). J. Zool. 2006, 268, 217–224. [Google Scholar] [CrossRef]
- Carter, N.H.; Riley, S.J.; Shortridge, A.; Shrestha, B.K.; Liu, J. Spatial assessment of attitudes toward tigers in Nepal. AMBIO 2014, 43, 125–137. [Google Scholar] [CrossRef] [PubMed]
- Nyhus, P.J.; Tilson, R. Characterizing human tiger conflicts in Sumatra, Indonesia. Oryx 2004, 38, 68–74. [Google Scholar] [CrossRef]
- Chitwan National Park Office (CNP). Available online: https://www.chitwannationalpark.gov.np/ (accessed on 20 June 2018).
- Karanth, K.K.; Gopalaswamy, A.M.; DeFries, R.; Ballal, N. Assessing patterns of human-wildlife conflicts and compensation around a central Indian protected area. PLoS ONE 2012, 7. [Google Scholar] [CrossRef] [PubMed]
- Sharma, B.K.; Chalise, M.K.; Solanki, G.S. Large wildlife population in Bagmara community forest, Nepal. Ecoprint Int. J. Ecol. 2011, 18, 55–60. [Google Scholar] [CrossRef]
- Dhungana, R.; Savini, T.; Karki, J.B.; Bumrungsri, S. Mitigating human-tiger conflict: An assessment of compensation payments and tiger removals in Chitwan National Park, Nepal. Trop. Conserv. Sci. 2016, 9, 776–787. [Google Scholar] [CrossRef]
- Miller, J.R.B. Mapping attack hotspots to mitigate human-carnivore conflict: Approaches and applications of spatial predation risk modeling. Biodivers. Conserv. 2015, 24, 2887–2911. [Google Scholar] [CrossRef]
- Agrawal, A.; Shah, S.G.; Karmacharya, M.; Karna, B.K. Conservation with Communities: A Research on the Park People Program in Nepal; Research Report Submitted to United Nations Development Program; CNP: Kashara, Nepal, 2000. [Google Scholar]
- Heinen, J.T.; Mehta, J.N. Emerging issues in legal and procedural aspects of buffer zone management with case studies from Nepal. Environ. Dev. 2000, 9, 45–67. [Google Scholar] [CrossRef]
- Budhathoki, P. Linking communities with conservation in developing countries: Buffer zone management initiatives in Nepal. Oryx 2004, 38, 334–341. [Google Scholar] [CrossRef]
- Andrade, G.S.M.; Rhodes, J.R. Protected areas and local communities: An inevitable partnership toward successful conservation strategies? Ecol. Soc. 2012, 17. [Google Scholar] [CrossRef]
- Horowitz, L.S. Integrating indigenous resource management with wildlife conservation: A case study of Batang Ai National Park, Sarawak, Malaysia. Hum. Ecol. 1998, 26, 371–403. [Google Scholar] [CrossRef]
- Parker, S.K.; Williams, H.M.; Turner, N. Modelling the antecedents of proactive behaviour at work. J. Appl. Psychol. 2006, 91, 636–652. [Google Scholar] [CrossRef] [PubMed]
- Dhanwatey, H.; Crawford, J.; Abade, L.; Dhanwatey, P.; Nielsen, C.; Sillero-Zubiri, C. Large carnivore attacks on human in central India: A case study from the Tadoba-Adhari Tiger Reserve. Oryx 2013, 47, 221–227. [Google Scholar] [CrossRef]
- Smith, J.L.D.; Ahern, S.C.; McDougal, C. Landscape analysis of tiger distribution and habitat quality in Nepal. Conserv. Boil. 1998, 12, 1338–1346. [Google Scholar] [CrossRef]
- Gurung, B.; Smitha, J.L.D.; McDougal, C.; Karki, J.B.; Barlow, A. Factors associated with human-killing tigers in Chitwan National Park, Nepal. Boil. Conserv. 2008, 141, 3069–3078. [Google Scholar] [CrossRef]
- Koirala, R.K.; Ji, W.; Aryal, A.; Rothman, J.; Raubenheimer, D. Dispersal and ranging patterns of the Asian elephant (Elephas maximus) in relation to their interactions with humans in Nepal. Ethol. Ecol. Evol. 2015. [Google Scholar] [CrossRef]
- Department of National Parks and Wildlife Conservation (DNPWC). Annual Report, Yearbook and Performance Highlights. Available online: https://www.dpaw.wa.gov.au/about-us/annual-report-and-yearbook (accessed on 20 June 2018).
- Baruch-Mordo, S.; Breck, S.W.; Wilson, K.R.; Theobald, D.M. Spatiotemporal distribution of black bear–human conflicts in Colorado. Wild. Manag. 2008, 72, 1853–1862. [Google Scholar] [CrossRef]
- Davie, H.S.; Murdoch, J.D.; Lhagvasuren, A.; Reading, R.P. Measuring and mapping the influence of landscape factors on livestock predation by wolves in Mongolia. J. Arid Environ. 2014, 103, 85–91. [Google Scholar] [CrossRef]
- Shrader, A.M.; Brown, J.S.; Kerley, G.I.H.; Kotler, B.P. Do free-ranging domestic goats show ‘‘landscapes of fear’’? Patch use in response to habitat features and predator cues. J. Arid Environ. 2008, 72, 1811–1819. [Google Scholar] [CrossRef]
- Silverman, B. Density Estimation for Statistics and Data Analysis; Chapman and Hall: New York, NY, USA, 1986; ISBN 9780412246203. [Google Scholar]
- Hart, T.C.; Zandbergen, P.A. Kernel density estimation and hotspot mapping: Examining the influence of interpolation method, grid cell size, and bandwidth on crime forecasting. Polic. Int. J. Police Strateg. Manag. 2014, 37, 305–323. [Google Scholar] [CrossRef]
- Rosenshein, L. Spatial Statistics. Available online: https://geonet.esri.com/thread/12214 (accessed on 4 January 2018).
- Chainey, S.P.; Reid, S.; Stuart, N. When is a Hotspot a Hotspot? A Procedure for Creating Statistically Robust Hotspot Maps of Crime. In Innovations in GIS 9 Socio-Economic Applications of Geographic Information Science; Higgs, G., Ed.; Taylor & Francis: London, UK, 2002; pp. 21–36. ISBN 978-0415279109. [Google Scholar]
- Wubuli, A.; Xue, F.; Jiang, D.; Yao, X.; Upur, H.; Wushouer, Q. Socio-demographic predictors and distribution of pulmonary tuberculosis (TB) in Xinjiang, China: A spatial analysis. PLoS ONE 2015, 10. [Google Scholar] [CrossRef] [PubMed]
- Bailey, T.C.; Gatrell, A.C. Interactive Spatial Data Analysis; Longman: London, UK, 1995; ISBN 978-0582244931. [Google Scholar]
- Acharya, K.P.; Paudel, P.K.; Neupane, P.R.; Köhl, M. Human-Wildlife Conflicts in Nepal: Patterns of Human Fatalities and Injuries Caused by Large Mammals. PLoS ONE 2016, 11. [Google Scholar] [CrossRef] [PubMed]
- Bhattarai, B.R.; Fisher, K. Human–tiger Panthera tigris conflict and its perception in Bardia National Park, Nepal. Oryx 2014, 48, 522–528. [Google Scholar] [CrossRef]
- Silwal, T.; Kolejka, J.; Bhatta, B.P.; Rayamajhi, S.; Sharma, R.P.; Poudel, B.S. When, where and whom: Assessing wildlife attacks on people in Chitwan National Park, Nepal. Oryx 2017, 51, 370–377. [Google Scholar] [CrossRef]
- Mayer, J.J. Wild pig attacks on humans. In Proceedings of the 15th Wildlife Damage Management Conferences 2013; Armstrong, J.B., Gallagher, G.R., Eds.; University of Nebraska: Lincoln, NE, USA, 2013; pp. 17–35. Available online: http://digitalcommons.unl.edu/icwdm_wdmconfproc/151 (accessed on 25 March 2018).
- Budhathoki, P. A category V protected landscape approach to buffer zone management in Nepal. Parks 2003, 13, 22–30. [Google Scholar]
- Kissling, W.D.; Fernández, N.; Paruelo, J.M. Spatial risk assessmentof livestock exposure to pumas in Patagonia, Argentina. Ecography 2009, 32, 807–817. [Google Scholar] [CrossRef] [Green Version]
- Treves, A.; Naughton-Treves, L.; Hareper, E.K.; Mladenoff, D.J.; Rose, R.A.; Sickley, T.A.; Wydeven, A.P. Predicting Human-Carnivore Conflict: A Spatial Model Derived from 25 Years of Data on Wolf Predation on Livestock. Conserv. Boil. 2004, 18, 114–125. [Google Scholar] [CrossRef]
- Dale, M.R.; Fortin, M.J. Spatial Analysis: A Guide for Ecologists; Cambridge University Press: Cambridge, UK, 2014; ISBN 9780521143509. [Google Scholar]
- Lamichhane, B.R.; Persoon, G.A.; Leirs, H.; Poudel, S.; Subedi, N.; Pokheral, C.P.; Bhattarai, S.; Thapaliya, B.D.; de Iongh, H.H. Spatio-temporal patterns of attacks on human and economic losses from wildlife in Chitwan National Park, Nepal. PLoS ONE 2018, 13. [Google Scholar] [CrossRef] [PubMed]
- Miller, J.R.B.; Jhala, Y.V.; Jena, J.; Schmitz, O.J. Landscape-scale accessibility of livestock to tigers: Implications of spatial grain for modeling predation risk to mitigate human–carnivore conflict. Ecol. Evol. 2015, 5, 1354–1367. [Google Scholar] [CrossRef] [PubMed]
Figure 1.
Nepal: The location of Chitwan National Park and the buffer zone, with coverage of the physiographic zones (Legend: 1. High Himalaya, 2. High Mountain, 3. Mid-Mountain, 4. Siwalik, 5. Terai).
Figure 1.
Nepal: The location of Chitwan National Park and the buffer zone, with coverage of the physiographic zones (Legend: 1. High Himalaya, 2. High Mountain, 3. Mid-Mountain, 4. Siwalik, 5. Terai).

Figure 2.
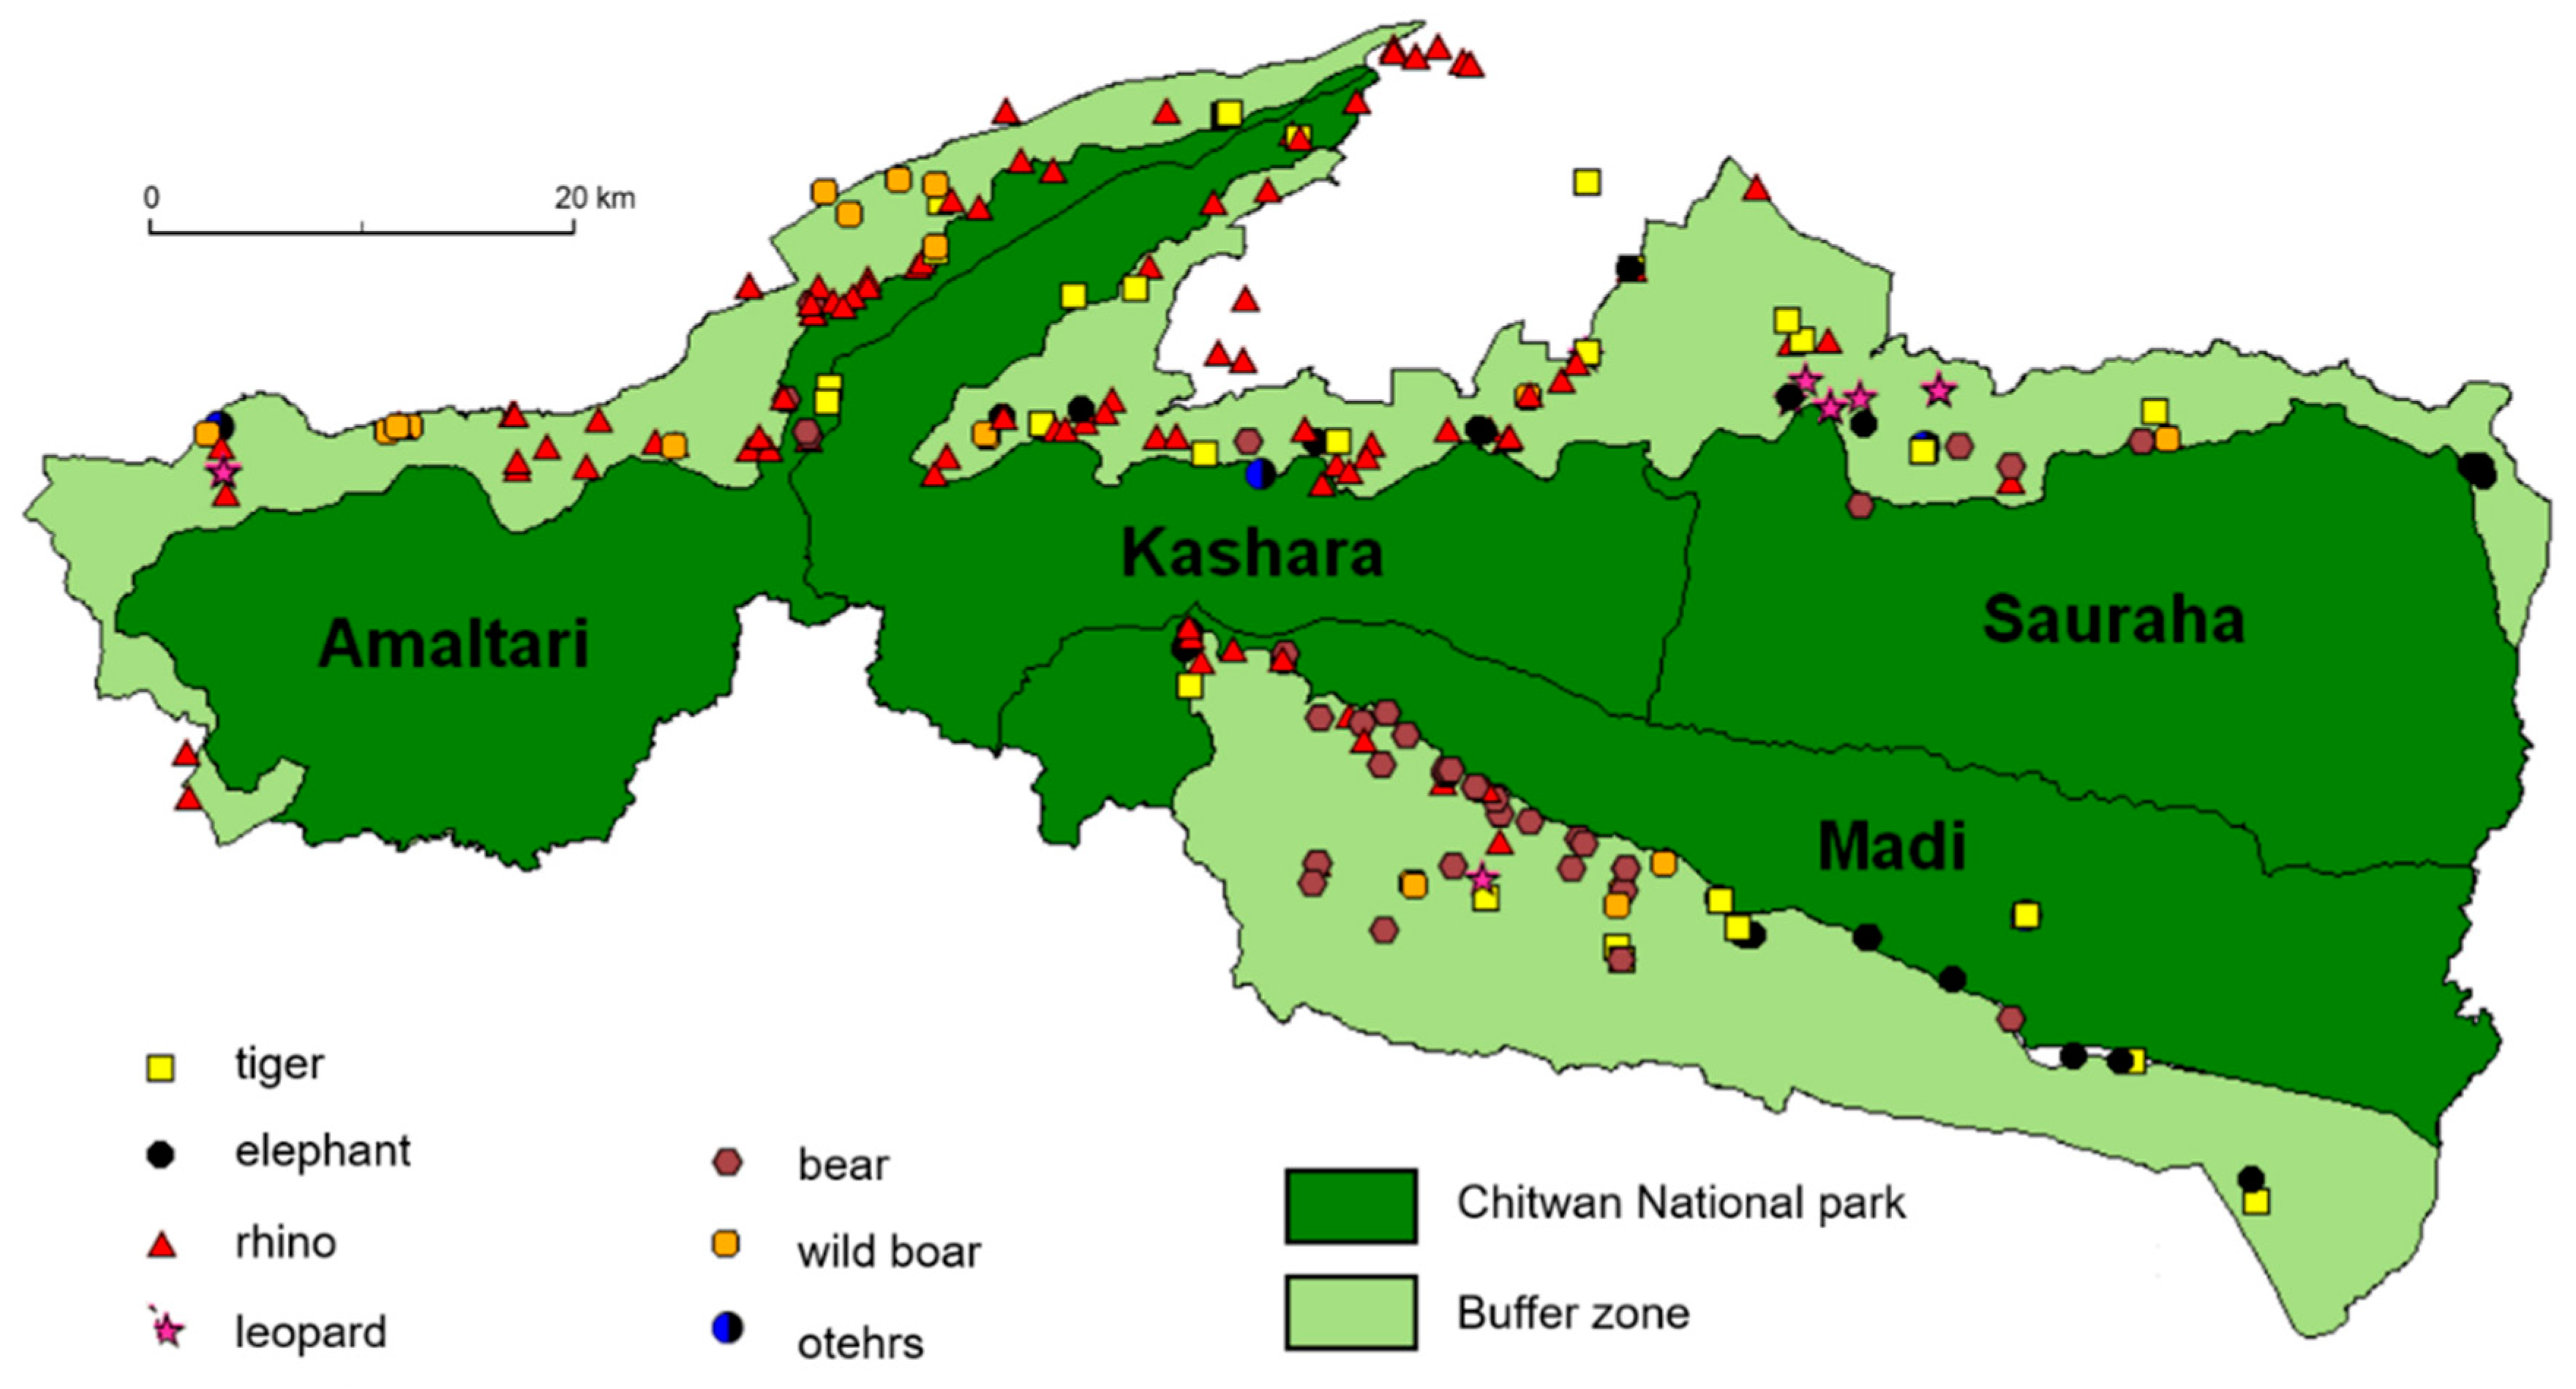
Location of incident sites in and around Chitwan National Park during 2003–2013.

Figure 3.
Methodological flowchart of the research.
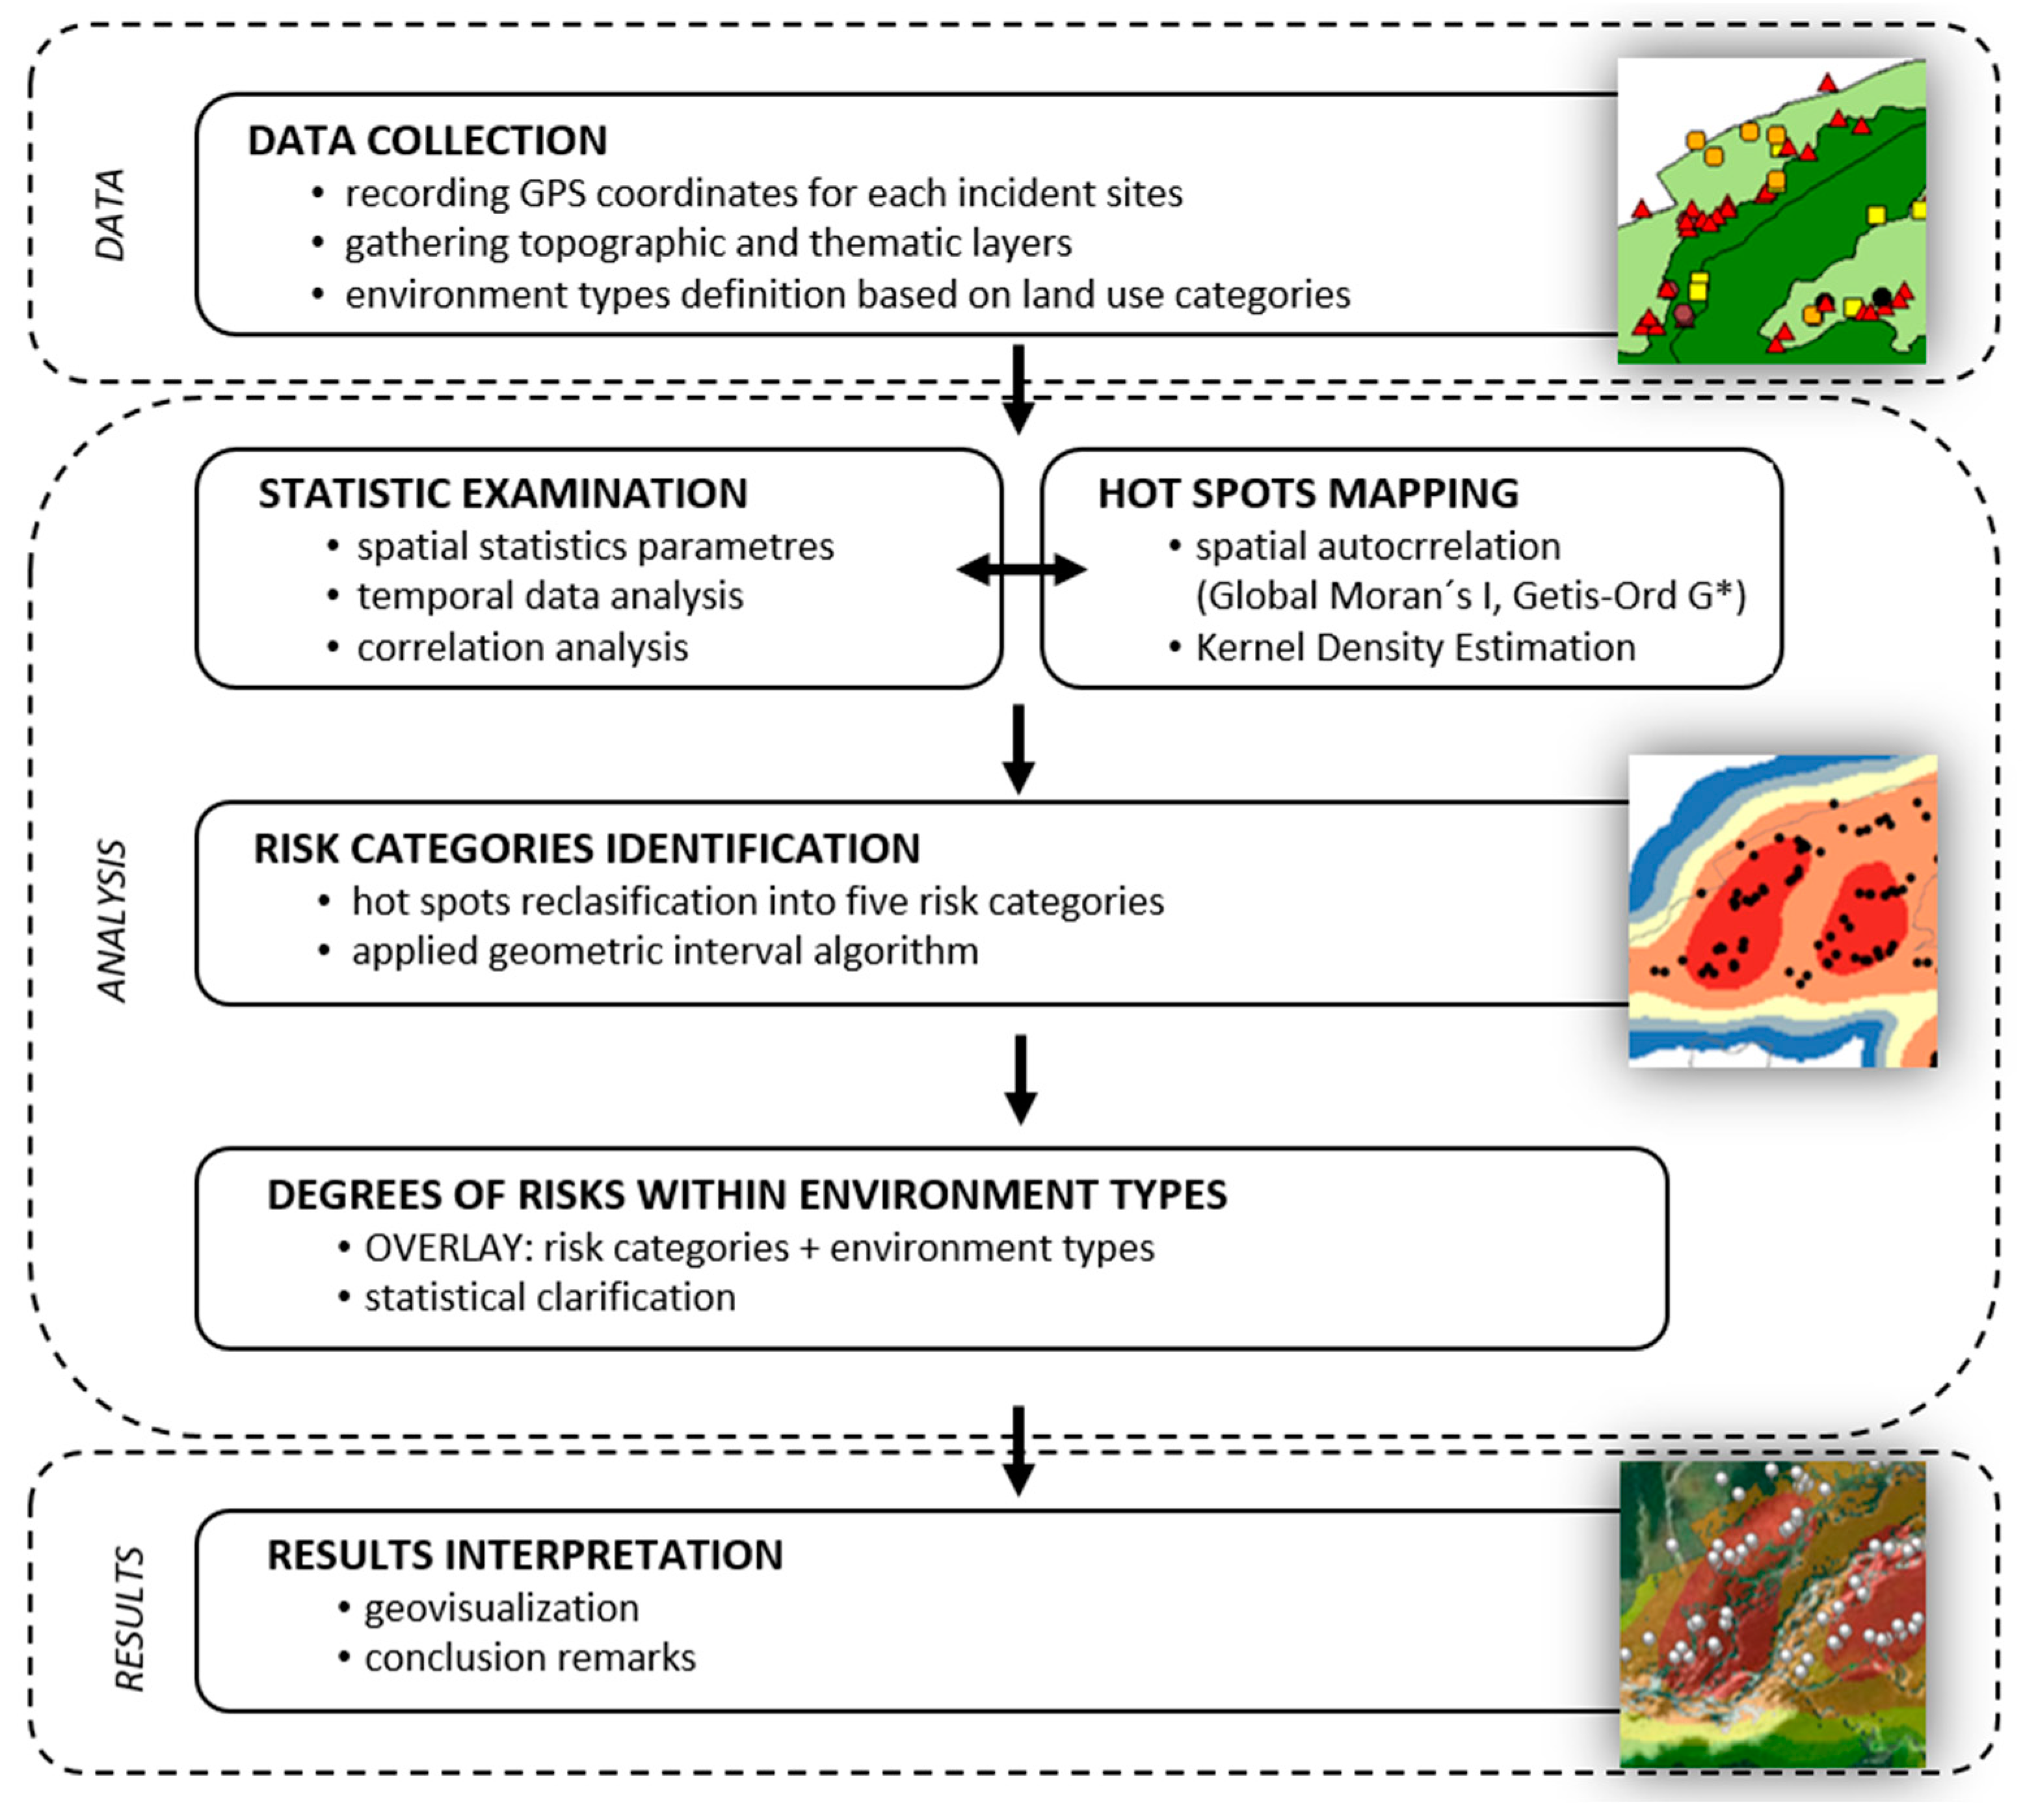
Figure 4.
Environment types of Chitwan National Park (NP) and the buffer zones.

Figure 5.
Temporal patterns of wildlife attacks on people by (a) season, (b) month, and (c) time.

Figure 6.
Land use of Chitwan National Park and buffer zone overlaid with the operational areas of all recorded attacking animals with different territorial densities of the victims (Note: Diagrams (strips) all1, all2, and all3 illustrate the total land use (presenting land use forms making one or more% share in outlined victim density area) of the three territorial densities of attacks of respective animals. Diagrams (strips) show the land use structure in individual zones, characterized by the different densities of the victims of all attackers).

Figure 7.
Generalized models of the relationships between positions of attack sites and two main land use forms (forested and cultivated land) in areas derived by GIS tools using attack sites as attacking animal action ranges. Numbers (1,2,3) depict three small strips on the right side of the models showing the results of the generalizing process running as a consequence of the delineation of animals’ action ranges with decreasing attack density (a–c). Generalization leads to consequent growth of the share of the originally minor land use form.

Figure 8.
Reclassified kernel density results of wildlife attacks in Chitwan NP and the buffer zones.
Figure 8.
Reclassified kernel density results of wildlife attacks in Chitwan NP and the buffer zones.
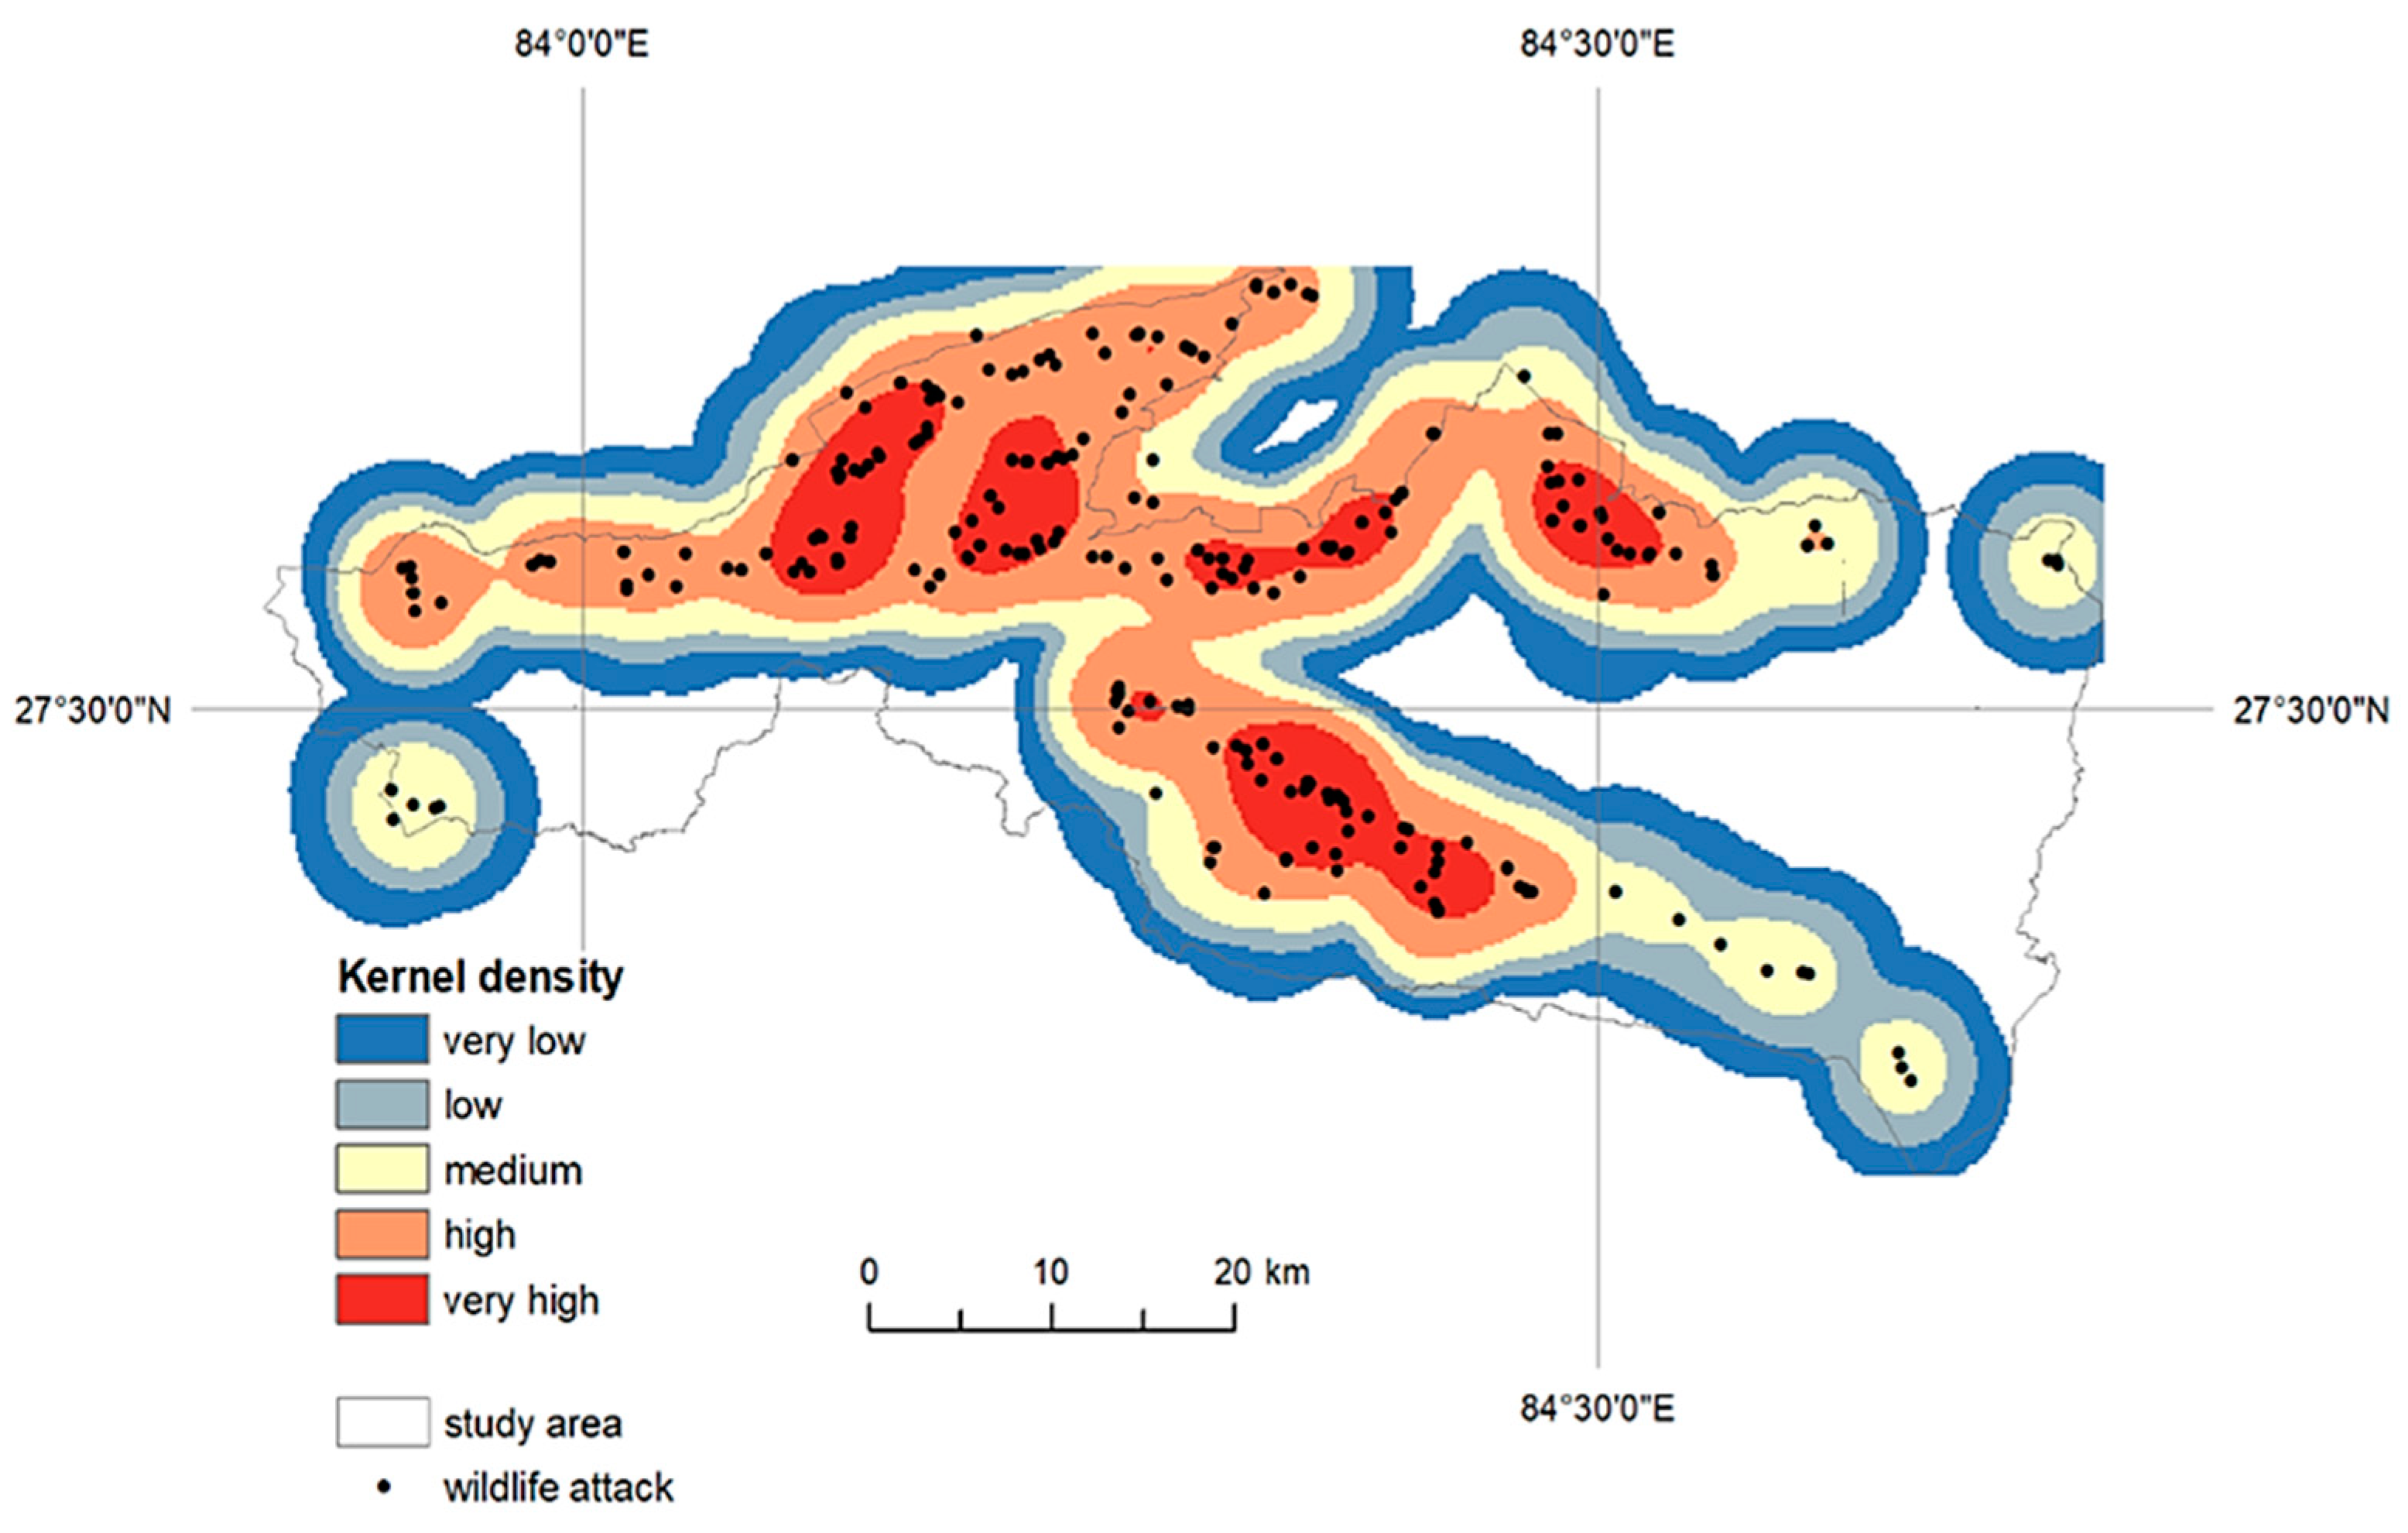
Figure 9.
Risk analysis of wildlife attacks in Chitwan National Park and buffer zones.


Table 1.
Annual number of attacks by wildlife species on people in and around Chitwan National Park, Nepal, source data during 2003–2013.
Table 1.
Annual number of attacks by wildlife species on people in and around Chitwan National Park, Nepal, source data during 2003–2013.
| Year | Rhino | Tiger | Sloth Bear | Elephant | Wild Boar | Leopard | Others | Total |
|---|---|---|---|---|---|---|---|---|
| 2003 | 17 | 5 | 1 | 3 | 0 | 0 | 0 | 26 |
| 2004 | 7 | 9 | 8 | 2 | 0 | 0 | 0 | 26 |
| 2005 | 14 | 5 | 7 | 1 | 1 | 4 | 1 | 33 |
| 2006 | 6 | 2 | 6 | 2 | 0 | 0 | 0 | 16 |
| 2007 | 8 | 4 | 1 | 1 | 3 | 1 | 1 | 19 |
| 2008 | 12 | 4 | 4 | 2 | 2 | 6 | 0 | 30 |
| 2009 | 12 | 9 | 6 | 1 | 7 | 0 | 0 | 35 |
| 2010 | 15 | 5 | 10 | 9 | 2 | 6 | 1 | 48 |
| 2011 | 11 | 5 | 8 | 2 | 2 | 1 | 0 | 29 |
| 2012 | 13 | 11 | 5 | 4 | 4 | 0 | 1 | 38 |
| 2013 | 11 | 9 | 3 | 1 | 5 | 0 | 0 | 29 |
| Total | 126 (38%) | 68 (21%) | 59 (18%) | 28 (9%) | 26 (8%) | 18 (5%) | 4 (1%) | 329 |
Table 2.
Correlation between all areas with different concentrations of victims of all animal attacks (name_1: more than one victim per 2 km2, name_2: max. one victim per 2 km2, name_3: max. one victim per 4 km2).
Table 2.
Correlation between all areas with different concentrations of victims of all animal attacks (name_1: more than one victim per 2 km2, name_2: max. one victim per 2 km2, name_3: max. one victim per 4 km2).
| all_1 | all_2 | all_3 | bear_3 | elephant_3 | leopard_3 | rhino_3 | tiger_3 | wildboar_3 | bear_1 | bear_2 | leopard_2 | rhino_2 | |
|---|---|---|---|---|---|---|---|---|---|---|---|---|---|
| all_1 | X | 0.9985 | 0.9438 | 0.9512 | 0.7313 | 0.9898 | 0.9971 | 0.8987 | 0.9308 | 0.9267 | 0.9942 | 0.8328 | 0.9718 |
| all_2 | X | 0.9569 | 0.9597 | 0.7550 | 0.9951 | 0.9982 | 0.9153 | 0.9170 | 0.9148 | 0.9916 | 0.8127 | 0.9611 | |
| all_3 | X | 0.9938 | 0.9107 | 0.9605 | 0.9452 | 0.9597 | 0.7704 | 0.7636 | 0.9216 | 0.6136 | 0.8605 | ||
| bear_3 | X | 0.9019 | 0.9547 | 0.9456 | 0.9370 | 0.7801 | 0.7741 | 0.9309 | 0.6300 | 0.8756 | |||
| elephant_3 | X | 0.7636 | 0.7282 | 0.8739 | 0.4575 | 0.4363 | 0.6889 | 0.2462 | 0.6039 | ||||
| leopard_3 | X | 0.9927 | 0.9356 | 0.9047 | 0.9089 | 0.9862 | 0.8010 | 0.9370 | |||||
| rhino_3 | X | 0.9058 | 0.9287 | 0.9242 | 0.9896 | 0.8291 | 0.9884 | ||||||
| tiger_3 | X | 0.7699 | 0.7349 | 0.8751 | 0.6124 | 0.8103 | |||||||
| wildboar_3 | X | 0.9771 | 0.9378 | 0.9644 | 0.9645 | ||||||||
| bear_1 | X | 0.9516 | 0.9712 | 0.9357 | |||||||||
| bear_2 | X | 0.8634 | 0.9603 | ||||||||||
| leopard_2 | X | 0.8797 |
Table 3.
Attack environment—specific land use structure of wildlife attacks considering up to 95% of victims attacked by each animal in buffer zones around the forest.
Table 3.
Attack environment—specific land use structure of wildlife attacks considering up to 95% of victims attacked by each animal in buffer zones around the forest.
| Attackers | Buffer Zone around Forests (in Meters) | Share of Attacks in Forests (%) | Specific Land Use Structure Buffer Zone around Forest (%) | ||||
|---|---|---|---|---|---|---|---|
| Unclear | Mostly Unclear | Natural Open Clear | Forage Rich Open Clear | Water | |||
| tiger | 1150 | 24.42 | 0 | 8.286 | 39.452 | 42.568 | 9.694 |
| elephant | 850 | 50 | 0 | 9.278 | 43.033 | 37.07 | 10.619 |
| rhinoceros | 2250 | 14.29 | 0 | 7.047 | 34.082 | 50.508 | 8.363 |
| bear | 900 | 23.08 | 0 | 9.089 | 42.321 | 38.148 | 10.442 |
| leopard | 1785 | 5.56 | 0 | 7.318 | 35.437 | 48.543 | 8.702 |
| wild boar | 1100 | 7.69 | 0 | 8.425 | 39.92 | 41.843 | 9.812 |
Table 4.
Attack environment—specific land use structure of wildlife attacks, considering up to 50% of victims are attacked by each animal in buffer zones around the forest.
Table 4.
Attack environment—specific land use structure of wildlife attacks, considering up to 50% of victims are attacked by each animal in buffer zones around the forest.
| Attackers | Buffer Zone around Forests (in Meters) | Share of Attacks in Forests (%) | Specific Land Use Structure Buffer Zone around Forest (%) | ||||
|---|---|---|---|---|---|---|---|
| Unclear | Mostly Unclear | Natural Open Clear | Forage Rich Open Clear | Water | |||
| tiger | 200 | 24.42 | 0 | 12.286 | 56.679 | 17.797 | 13.238 |
| elephant | 0 | 50 | 100 | 0 | 0 | 0 | 0 |
| rhinoceros | 380 | 14.29 | 0 | 11.469 | 51.987 | 23.932 | 12.612 |
| bear | 150 | 23.08 | 0 | 12.463 | 58.365 | 15.801 | 13.371 |
| leopard | 490 | 5.56 | 0 | 10.91 | 49.558 | 27.479 | 12.053 |
| wild boar | 470 | 7.69 | 0 | 11.02 | 49.985 | 26.838 | 12.157 |
© 2018 by the authors. Licensee MDPI, Basel, Switzerland. This article is an open access article distributed under the terms and conditions of the Creative Commons Attribution (CC BY) license (http://creativecommons.org/licenses/by/4.0/).
Share and Cite
MDPI and ACS Style
Ruda, A.; Kolejka, J.; Silwal, T. GIS-Assisted Prediction and Risk Zonation of Wildlife Attacks in the Chitwan National Park in Nepal. ISPRS Int. J. Geo-Inf. 2018, 7, 369. https://doi.org/10.3390/ijgi7090369
AMA Style
Ruda A, Kolejka J, Silwal T. GIS-Assisted Prediction and Risk Zonation of Wildlife Attacks in the Chitwan National Park in Nepal. ISPRS International Journal of Geo-Information. 2018; 7(9):369. https://doi.org/10.3390/ijgi7090369
Chicago/Turabian StyleRuda, Aleš, Jaromír Kolejka, and Thakur Silwal. 2018. "GIS-Assisted Prediction and Risk Zonation of Wildlife Attacks in the Chitwan National Park in Nepal" ISPRS International Journal of Geo-Information 7, no. 9: 369. https://doi.org/10.3390/ijgi7090369
Note that from the first issue of 2016, this journal uses article numbers instead of page numbers. See further details here.