Capturing Flood Risk Perception via Sketch Maps
by
 , and
, and
Carolin Klonner
1,2,* ,
,
Tomás J. Usón
1,
Sabrina Marx
1,
Franz-Benjamin Mocnik
1 and
Bernhard Höfle
1,2,3,4 1
Institute of Geography, Heidelberg University, 69120 Heidelberg, Germany
2
Heidelberg Academy of Sciences and Humanities (HAW), 69117 Heidelberg, Germany
3
Interdisciplinary Center for Scientific Computing (IWR), Heidelberg University, 69120 Heidelberg, Germany
4
Heidelberg Center for the Environment (HCE), Heidelberg University, 69120 Heidelberg, Germany
*
Author to whom correspondence should be addressed.
ISPRS Int. J. Geo-Inf. 2018, 7(9), 359; https://doi.org/10.3390/ijgi7090359
Submission received: 12 June 2018
/
Revised: 3 August 2018
/
Accepted: 20 August 2018
/
Published: 30 August 2018
(This article belongs to the Special Issue Volunteered Geographic Information: Emerging Applications in Public Science and Citizen Participation)
Abstract
:The fact that an increasing number of people and local authorities are affected by natural hazards, especially floods, highlights the necessity of adequate mitigation and preparedness within disaster management. Many governments, though, have only insufficient monetary or technological capacities. One possible approach to tackle these issues is the acquisition of information by sketch maps complemented by questionnaires, which allows to digitally capture flood risk perception. We investigate which factors influence information collected by sketch maps and questionnaires in case studies in an area prone to pluvial flooding in Santiago de Chile. Our aim is to gain more information about the methods applied. Hereby, we focus on the spatial acquisition scale of sketch maps and personal characteristics of the participants, for example, whether they live at this very location of the survey (residents) or are pedestrians passing by. Our results show that the choice of the acquisition scale of the base map influences the amount and level of detail of information captured via sketch maps. Thus, detail base maps lead to more precise results when compared to reference data, especially in the case of residents. The results also reveal that the place of living of the respondents has an effect on the resulting information because on the neighborhood level the risk perception of residents is more detailed than the one of pedestrians. The study suggests that the integration of citizens via sketch maps can provide information about flood risk perception, and thus can influence the flood mitigation in the area.
1. Introduction
Climate change, urban expansion and the resulting land-use changes and growing number of settlements in areas at risk lead to increasing numbers of people affected by natural hazards [1,2,3]. The European Flood Directive 2007/60/EC [4], amongst other international conventions, emphasize the integration of citizens and more public participation in the hazard analysis, especially the flood management [5,6]. Such geodata play an important part specifically, for example, on the one hand, in countries where only sparse funding for flood management is available, or, on the other hand, in remote areas where it is difficult to gain information for the mitigation and preparedness phase due to a lack of historic data or technical limitations.
Recently, the integration of data provided by citizens into disaster-related workflows has gained increasing attention [7,8,9]. For instance, the European Flood Directive suggests the EU member states to make use of local information provided by citizens in situ, for example, about flood extent [10] or water level [11]. People have knowledge about several flood related topics due to their experience, which can be a useful additional data input for mitigation processes. A review by Assumpção, Popescu, Jonoski and Solomatine [8] gives an overview of current studies addressing this issue within the context of flood modelling. Citizens can give input for hydrodynamic models, among others, by providing data about water level values, flood extent or topography. The flood extent, for example, can be gained via an analysis of videos and pictures from social media [9] or via maps indicating the flood risk perception of residents [12,13].
In the last-mentioned approach, people can draw their perception of their surroundings on a spatially referenced map. These sketch maps are a well-established research tool in public participation geographic information systems (PPGIS) because spatial experiences and knowledge of groups and individuals are cartographically represented by markings on the base map [14], and therefore, we also apply this tool for our investigations in this study.
The main challenge for the integration of data provided by citizens is the fact that these geo-graphic data might not be in line with the standards typically applied when collecting authoritative data. Thus, it is important to evaluate the tools for data collection in an adequate way, for example, by analyzing influencing factors on the resulting data. We want to find out to what degree different spatial acquisition scales influence the collected risk perception data. Case studies with citizens are performed in order to gain more information about the methodology and to test the application. We also take into consideration how the flood risk perception varies between local residents who are interviewed directly in front of their house and general pedestrians who live in the neighborhood or further away and thus, do not have their house right at the questioning place.
In the following section, we portray related work about flood risk perception and the capturing of flood risk perception via sketch maps and identify remaining challenges that need to be addressed to tap the full potential of this participatory approach (Section 2). Thereafter, our research objectives are investigated in case studies in Santiago de Chile, and thus, focus is on the South American context and an urban environment. Additionally, the research is restricted to pluvial flooding in two municipalities of Santiago de Chile. We use two different extents as base maps to identify the influence of different spatial acquisition scales on the captured flood risk perception. An overview sketch map shows the whole municipality, while a detailed sketch map focuses on the study area within the neighborhood (Section 3). The sketch maps are applied in two case studies in Santiago de Chile, which is prone to regular urban pluvial flooding (Section 4). Flood risk perception is captured via sketch maps and the participants are asked for personal information, such as their place of living. The captured data is represented digitally and analyzed according to the differences of the spatial acquisition scale and the participants’ characteristics with an emphasis on whether the participants are residents or pedestrians (Section 5). Thereafter, we discuss the results, challenges, and opportunities (Section 6), and we conclude with an outlook regarding sketch maps within flood risk management (Section 7).
2. Related Work
Integrative disaster risk reduction can be considered as a promising approach for facing the increasing number of people and infrastructure which are affected by disasters [15]. Gaillard and Mercer [15] state that a combination of different types of knowledge, such as scientific and local knowledge, overcomes particularly inherent limitations. These limitations exist because, on the one hand, government officials and scientists follow the global scientific standards and base their decisions on non-contextual and quantitative models that are developed by people outside of the local communities. On the other hand, local tools like participatory mapping are valuable for the identification of local knowledge but they often fail to integrate stake-holders from non-local levels [15].
2.1. Flood Risk Perception
We will focus on pluvial flooding, which occurs frequently in urban areas because the infiltration capacity of the ground is very often below the precipitation intensity during rainfalls, which can be caused by artificial surface sealing, for example, by infrastructure [16]. Santiago de Chile is suitable for a case study because winter precipitation leads to regular floods and the urban expansion increases the negative consequences [17]. Retention areas are reduced, and the newly built environment seals the surfaces and hinders infiltration. Thus, these new residential areas are not only more hazard-prone due to their lower elevation in comparison to the rest of the city but the insufficient infiltration even intensifies the impact of the flooding [17]. Moreover, a location near to foothills can also lead to higher runoff rates and thus to pluvial flooding if the infiltration capacity is not sufficient. Urban flooding is very specific and sometimes only occurs in a few streets. This makes it necessary to collect local information, for example, about risk perception in order to install the required mitigation measures and to raise the risk awareness of residents.
The idea of including the perception of citizens in management or planning processes is not new. Geographers, environmental psychologists, and urban designers have used cognitive mapping in order to gain information about the perception of individuals of their environment and how factors such as gender, age or familiarity, among others, influence the outcome [18]. An experiment of Blades [19] includes respondents who have to sketch the same route twice with a week in between. Results show the consistency of these sketch maps and thus prove the reliability of these data [19]. Blades [19] uses the term sketch maps, although other researcher would term them mental maps as participants are drawing on blank sheets. In the following, we will use a narrower definition and refer to sketch maps only when spatially referenced maps are used as base maps [14].
Citizens can be integrated into disaster management approaches on different levels and their engagement within the whole process varies accordingly. As stated in Haklay [20], citizens can act as sensors (crowdsourcing), take part in basic data interpretations (distributed intelligence), be involved in the problem definition (participatory science) or even participate collaboratively in the whole process with problem definition, data collection as well as analysis and interpretation (extreme citizen science).
Participatory approaches include local geographic knowledge and can be used to visualize environmental perception [7,21,22,23,24]. Moreover, Silvestro, et al. [24] emphasize public participation and the involvement of the citizens already in the developing phase of the procedures to be carried out in a case of emergency. “The citizens are a fundamental element: they should be better aware of the risks related to the area where they live and be better prepared to face those risks” [24] (p. 2751).
However, many people are excluded from participatory mapping approaches because they have no access to the Internet or are not familiar with the current technological devices, for example, like in the study conducted by Cheung, et al. [25]. The use of paper-based participatory mapping overcomes this exclusion [14,26].
2.2. Capturing of Risk Perception
In recent years, sketch maps have been used digitally in Geographic Information Systems (GIS) [12,14,26], which allows visualization, analysis and combination with other data layers. Advances in tools for digitizing and new ways of spatial analysis within a GIS allow for a faster and easier integration of information captured via sketch maps, and therefore, there is an increased attractiveness of sketch maps for capturing perception in various research fields [26]. There are not only possibilities to do paper-based sketch maps [12,26], but it is also possible to have a sketch map on a digital device, which makes the digitization step obsolete [25]. Curtis, Shiau, Lowery, Sloane, Hennigan, and Curtis [26] give an overview of recent approaches. However, they use the broader concept of sketch maps for their review because they include approaches with mental maps (also referred to as sketch maps in these reviewed studies). Ceccato and Snickars [27], for example, not only conduct a questionnaire but also ask participants to draw areas that they perceive as their neighborhood on a paper map. The results are digitized in a GIS. Similarly, Campbell, et al. [28] investigate the perception of neighborhood boundaries via cognitive mapping and interviews. They suggest to use such subjective measures as a complementation to administrative definition. Curtis, Shiau, Lowery, Sloane, Hennigan and Curtis [26] mention the lack of clear guidelines for these approaches, which include participatory mapping.
Moreover, interactive and dynamic mapping is made possible for the participants who can directly draw sketches via web-based tools [25]. Participants are asked to digitally mark areas prone to flooding on a base map via a tablet; a questionnaire is applied to collect contextual, personal, risk and informational factors of the participants [25]. However, during data collection they face technical challenges like overheating of tablet units, dead batteries, or program crashes, as well as data entry errors, for example, entry of invalid respondent ID. Further, very often, data collection based on newly developed technical devices is restricted to citizens with the technical know-how and the possibility to access the Internet [29]. Otherwise, they cannot take part in such projects, which leads to the exclusion of specific subgroups of society, such as elderly residents or people with little income. Hence, it is necessary to decide for each specific case and local context whether an interactive mapping approach [25] with its inherent limitations is appropriate or whether a paper-based mapping [12,26] is more adequate for collecting the required data.
In our study, we aim at analyzing influencing factors on the flood risk perception based on the spatial acquisition scale of the base map and the characteristics of the respondents. Therefore, we conduct case studies and apply paper-based mapping and questionnaires. The results can lead to a better understanding of the tool itself and support the development of general guidelines.
3. Methods
In our study we apply the sketch map approach to capture and visualize the flood risk perception of citizens, to make these data available for further analyses in a GIS, and to investigate influences on the information gathered via sketch maps. Respondents get the base map and are asked to mark streets and areas that they perceive as areas at flood risk. Though, there are several aspects to consider when selecting and designing this base map of the sketch maps [12,26]. Among others, the type of disaster strongly influences the choice of the sketch map due to the extent, for example, whether there is a large or only a small affected area [30]. Additionally, object types such as houses, streets, landmarks, or places of interest need to be chosen carefully, when selecting the map content. Too detailed information might overwhelm or confuse the participants while sparse or misleading objects might hinder a disclosure of local knowledge on a detailed level. We use two different extents as base maps and in this way we are able to identify the influence of the spatial acquisition scale on the flood risk perception. Additionally, participants’ characteristics, such as whether they are local residents or pedestrians are collected via a questionnaire and then combined with the participatory mapping results. Local residents are participants that are questioned at their place of living and the researchers go there and ask directly for an interview. In contrast, the pedestrians are people passing by in the street, who do not have their property at the location, where the researchers meet them. Different methods are applied for data evaluation to compare the risk perception from the sketch maps with various reference data, such as critical points of flooding issued by the local government. Figure 1 shows the different steps of the research with the main tasks and results.
3.1. Sketch Maps
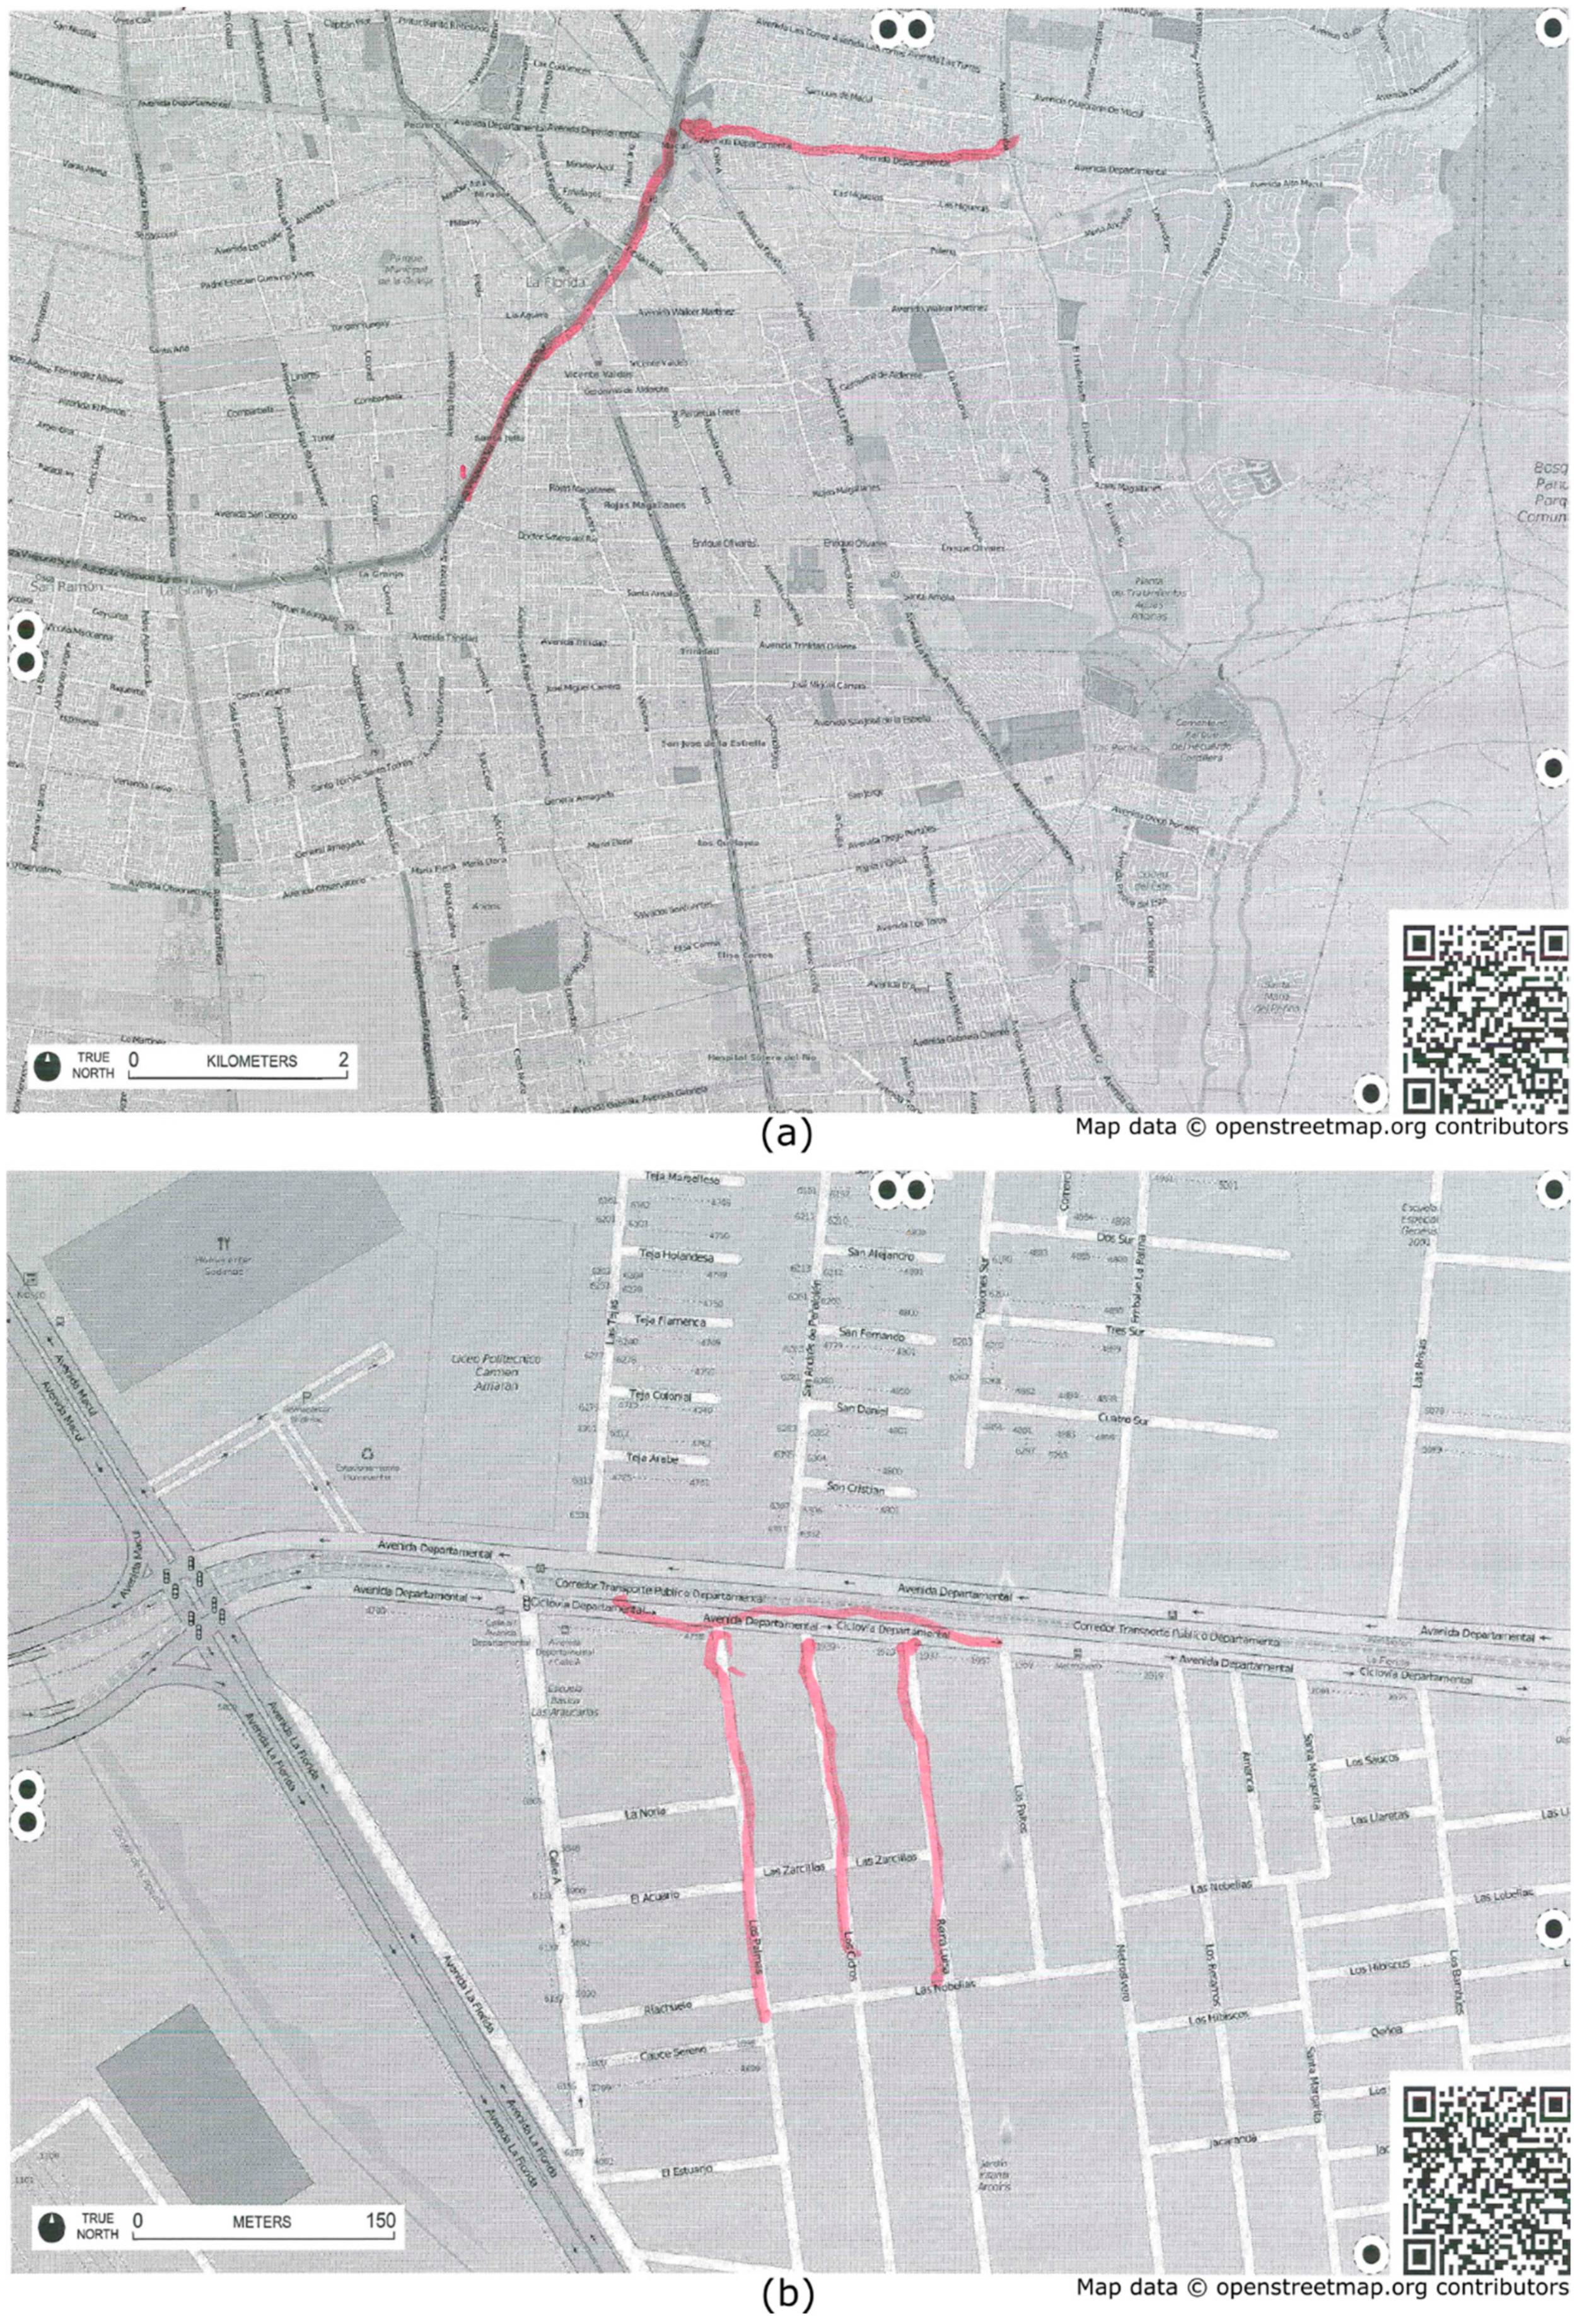
In our approach we combine the technical advances of GIS with sketch maps based on OpenStreetMap (OSM) Field Papers [31]. OSM Field Papers are intended for mapping infrastructure or collecting attributes like street names in the field which can be added to the OSM platform afterwards. It is possible to do an automatic georeferencing and the acquisition scale of the base map can be easily changed. Participants can directly mark the areas which they perceive as areas at flood risk in these base maps, resulting in a sketch map (Figure 2).
The study area can be selected on the website of OSM Field Papers and printed for the use in the field. In our study, the DIN A4 (21.0 cm × 29.7 cm) format is chosen due to practical reasons. This print out page is used as base map for the participatory mapping of flood risk perception of the participants. The citizens are asked to indicate with a marker the streets and areas they perceive as being affected by urban floods (Figure 2). They are allowed to draw in a way they prefer to avoid missing some of the information by restricting them to a specific design. In the aftermath, images of the sketch maps are uploaded to the Field Paper website, where they are automatically georeferenced, and made available as a GeoTIFF file for the download and use in a GIS. Within the GIS, the researchers digitize the flood risk perception as polygons to account for the various forms of marking by the participants. The data are saved in a separate GIS polygon file, which can be used for further calculations and analyses, such as for the comparison with reference data; for example, the identification whether a critical point issued by the government lies within a certain distance of the polygons of the sketch maps. Analyses also include, for instance, a comparison of flood risk perception of residents and pedestrians, which is possible due to the combination with the geolocated answers of the questionnaires (Section 3.3). Additionally, though for visual analyses only, these polygons can be represented with blurred boundaries to account for the hand drawn marking of the participants (Section 5, Figures 5–7).
3.2. Questionnaires
The questionnaire is designed to inquire information about the participants themselves as well as their experience with and knowledge of former flood events as well as their perception of flood intensity. In our analysis we use information about gender, age, duration of residence at or awareness of that specific place as well as whether the participants live at this very location or are pedestrians passing by. The perception of flood intensity is evaluated for both the whole area and the exact location of the survey and ranges from 1 to 5 with 1 for “not affected” and 5 for “affected very strongly”. We use a Likert-type scale to account for different severities of flooding. The questionnaire is based on KoBo Toolbox [32], which is chosen because questions can be designed on the webpage and afterwards the final forms of the questionnaire can be downloaded to the mobile application on a smartphone or tablet. Moreover, the collected data can be stored locally and can be uploaded later, which is very convenient for a field study. Another advantage is that each survey is geolocated and therefore the use for spatial analyses is facilitated. The results of the questionnaire are uploaded to the KoBo Toolbox webpage and the downloaded georeferenced data are used in a GIS. In case the mobile version cannot be used, there is the possibility to print the forms and use them directly for a paper-based questionnaire. Additionally, the design and language of the survey allows for a fast modification of the method for a use within various contexts, such as in another country, area of research or target group, among others.
3.3. Combination of Sketch Maps and Questionnaires
A combination of the sketch maps and the questionnaires enables subject risk perception mapping within a broader context. All sketch maps are marked with an individual ID number, which is also used for the corresponding questionnaire form. In this way, the answers of the participants can be added as attributes to the specific flood risk perception layer. The flood risk perception can be portrayed and analyzed according to these characteristics, for example, whether the participant is a pedestrian or resident and maps can show differences in flood risk perception of these groups. Moreover, as the survey information is geo-located, the locations of the participants can also be portrayed separately in a map or used for further analyses, such as a comparison to reference data. This combination of two different methods with spatial reference allows to visualize subjective risk perception on scaled and georeferenced maps and to interpret this information within the local context. At the same time, combining two methods for assessing the same aspect of the environment can serve as a quality measure and thus ensures that the resulting data is of high quality [33].
3.4. Case Study Design
There are different studies based on sketch maps for capturing risk perception and various methods are applied, such as surveys with a high number of participants [12] or with small groups, for example, during workshops [21]. In our qualitative study, an instrumental case study [34] is conducted in order to get more insight into the specific tool of data capturing (sketch maps) within its natural setting and possible influencing factors, which is done via asking people on the street (pedestrians) or directly at their place of living (residents). The sample is not representative for the area, though the results can still deliver valuable information [21], in our case, about the applied methods themselves as well as the subjective flood risk perception of the individual residents and pedestrians. We aim at information power rather than representativeness [35]. The sampling of our case study can be termed as “purposive sampling” [36] (p. 193) because we use a kind of deliberate sampling. While quantitative research is based on the sample size, the evaluation of the methods at hand with a participatory mapping approach has more facets of qualitative research, which focuses on the information from experiences [37]. Additionally, the small sample size can give good insights into the opportunities of the presented methods, however, a bias might exist, which has to be considered when evaluating the results [21].
3.5. Reference Data
For the evaluation of the flood risk perception and the local knowledge of the citizens, it is necessary to have a similar reference dataset. Therefore, for the first case study, on the one hand, a visual inspection of the main affected areas is conducted and photos are taken to identify possible reasons for flooding due to the local infrastructure. On the other hand, a comparison can be made to local flood perception based on the assumption that people are more aware of the risk, which is directly affecting their property than the community in general because flood perception is closely linked to personal experience of hazards [38]. Therefore, a point-based validation is made via directly investigating the intensity of risk which the residents perceive at that location. These points of intensity are compared to the flood risk perception gathered from the sketch maps in order to evaluate in how far the marking corresponds with this local risk perception [13].
In the second case study, a dataset of the municipality is available, which includes points that are considered as critical in a case of flooding. According to the members of the municipality, these points are chosen based on their personal experience and on information from citizens via informal discussions over the previous years and without a formal methodology [39]. Hence, this official data can also be regarded as subjective in nature. We use this information as a means of comparison to the flood risk perception of the citizens captured via the sketch maps.
4. Case Studies in Santiago de Chile
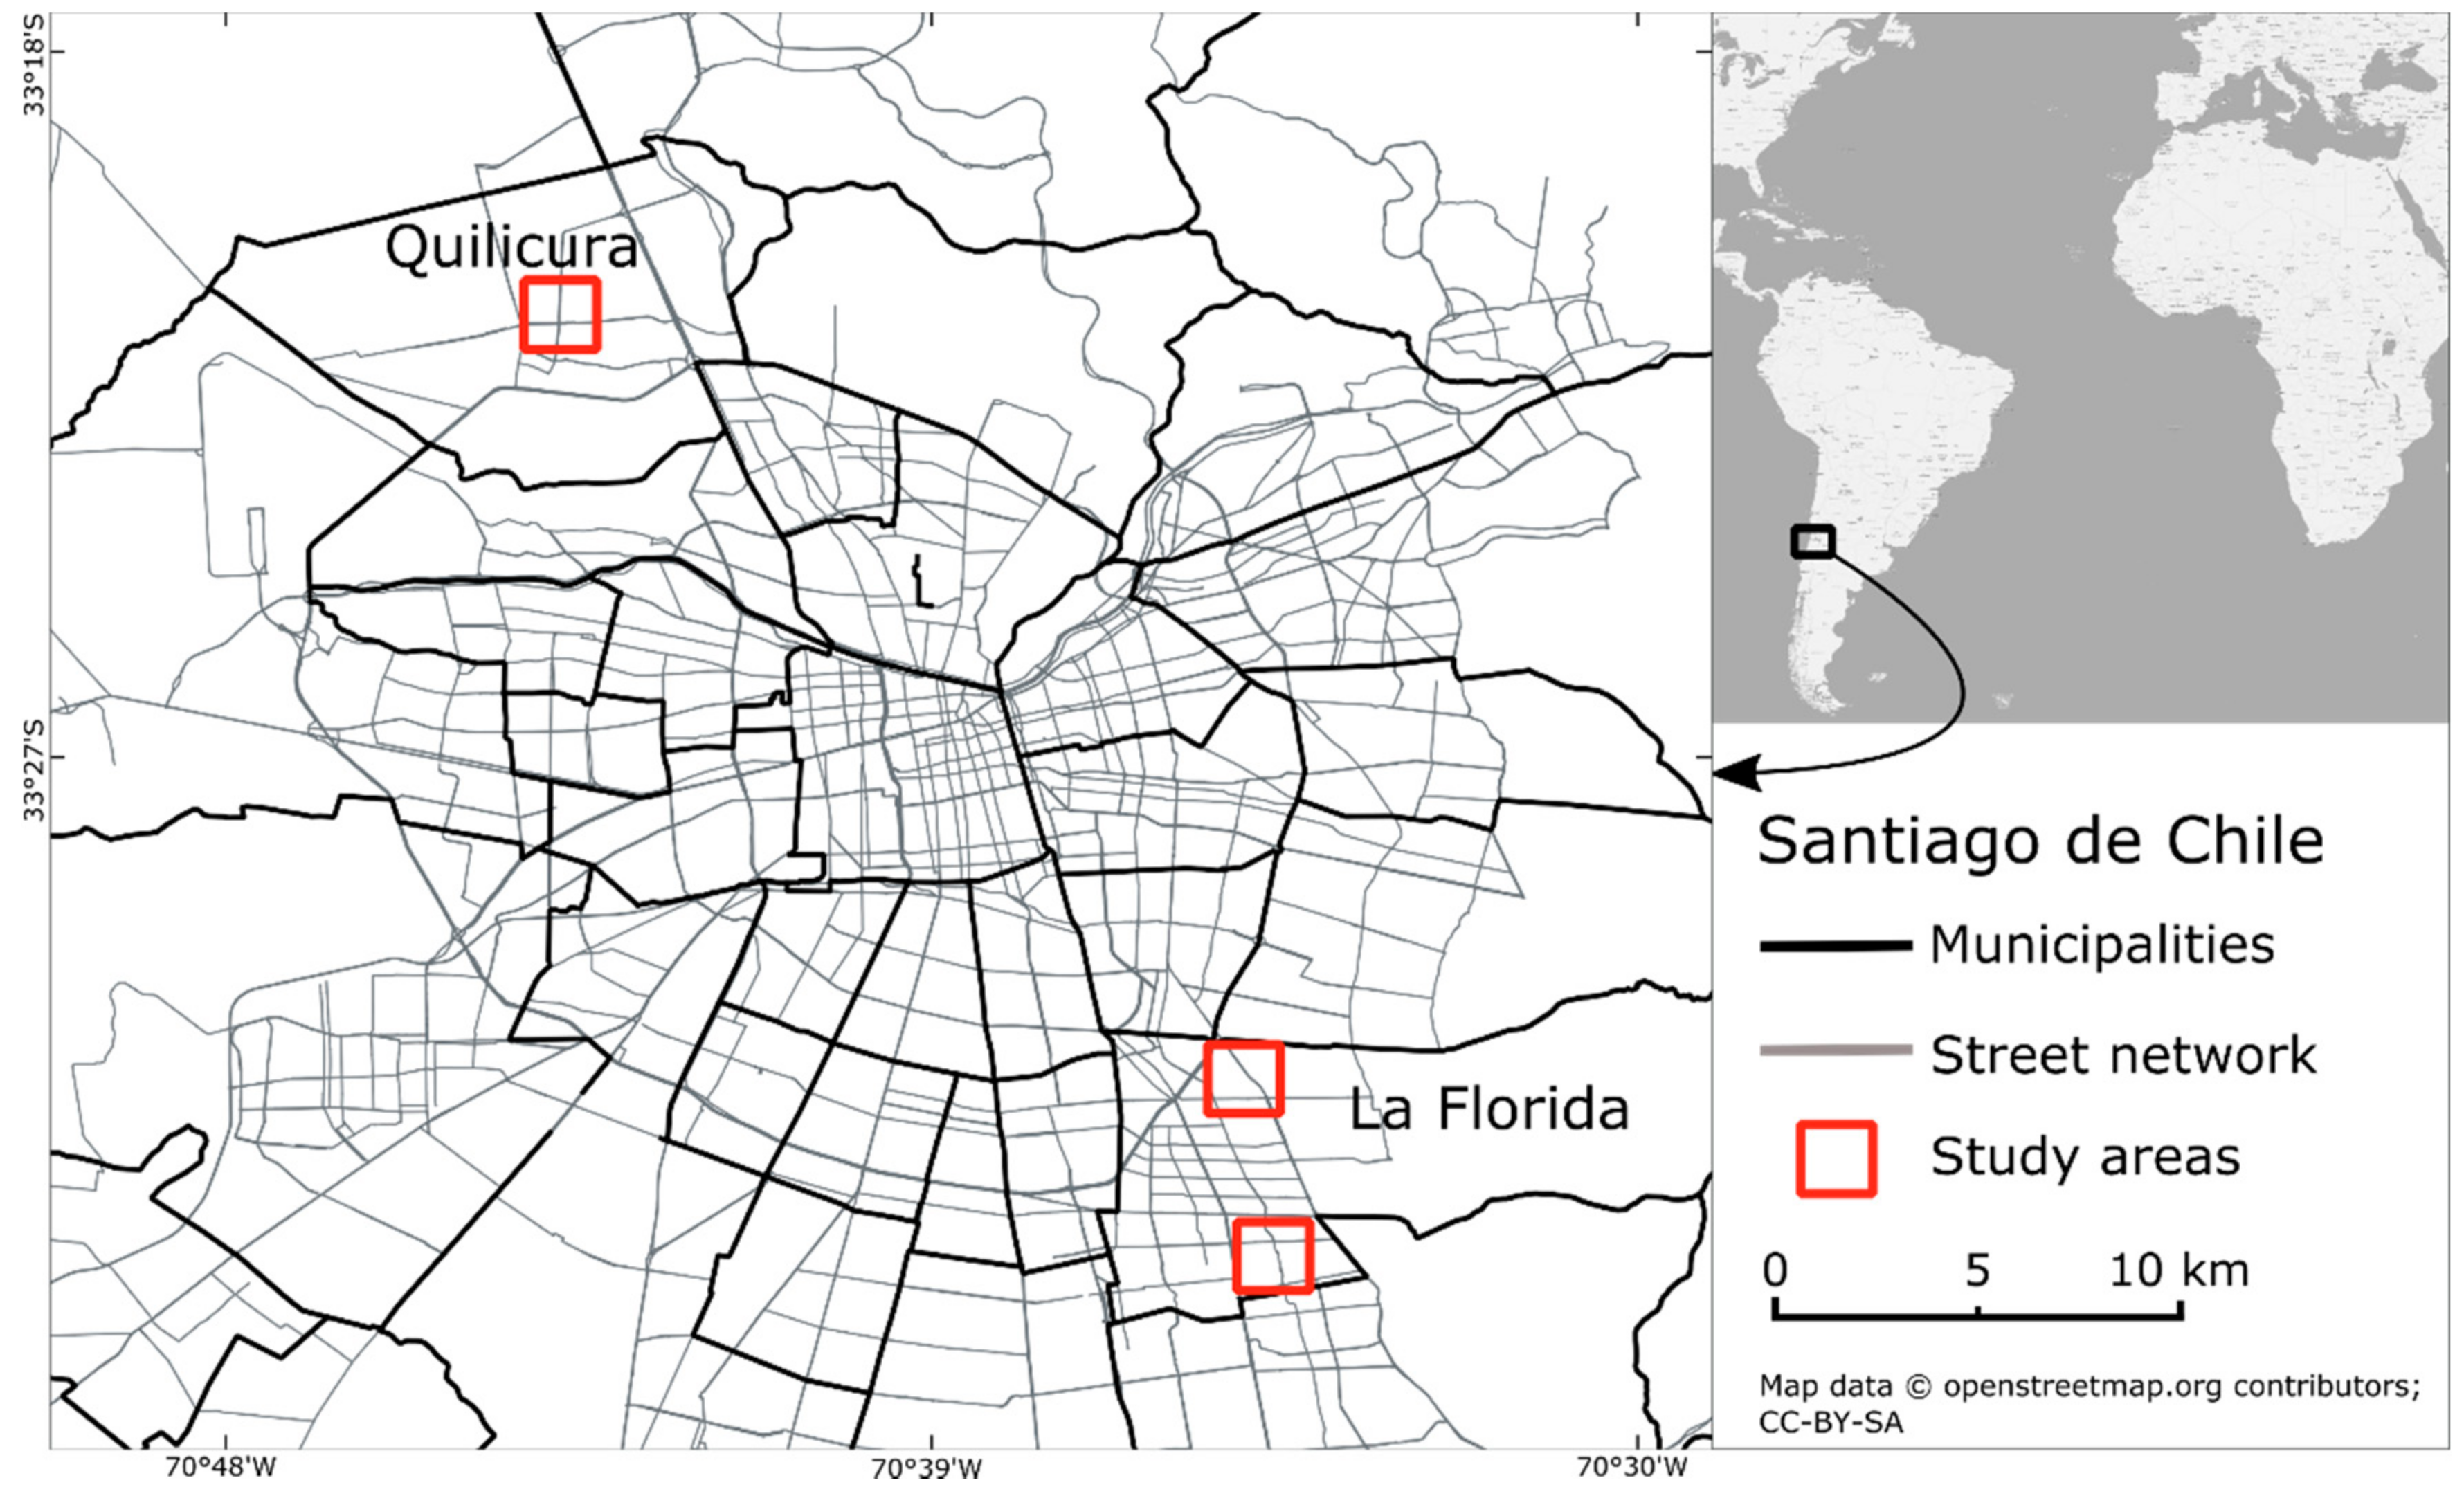
The previously discussed tools for capturing local knowledge within its context are tested and evaluated during two case studies in Santiago de Chile in two different municipalities of the city (Figure 3). It is a qualitative evaluation and focus is set on insights about the influence of different spatial acquisition scales and the place of living on the flood risk perception.
A first case study is conducted in the municipality of Quilicura, Santiago de Chile (Figure 3, see also [13]). The area is regularly flooded during raining events. Based on the findings of this pilot study, a second study is undertaken in another municipality of Santiago de Chile, namely La Florida, which is also prone to urban flooding (Figure 3). In Quilicura, some participants have difficulties to recognize streets or landmarks in the base map and therefore, in La Florida, the Metro Station “Macul” is used to orientate the map and the interviewers help to find the current location of the respondents. Moreover, participants are asked to mark areas which they perceive at risk of flooding in an overview base map and then in a detailed map of the neighborhood (Figure 2) to identify the influence of different spatial data acquisition scales on the flood risk perception.
5. Results
The following section presents the results of both case studies regarding a comparison to reference datasets as well as selected features of the questionnaires, such as the duration of living in the area, the place of residence and the perception of affectedness of the community and direct location. Moreover, the results of the second case study also show a difference in the level of detail of the flood risk perception due to the change of the acquisition scale of the base maps. This effect is considered during the detailed analysis of the flood risk perception with respect to attributes based on the questionnaire results and a comparison to reference data.
5.1. Case Study in Quilicura, Santiago de Chile
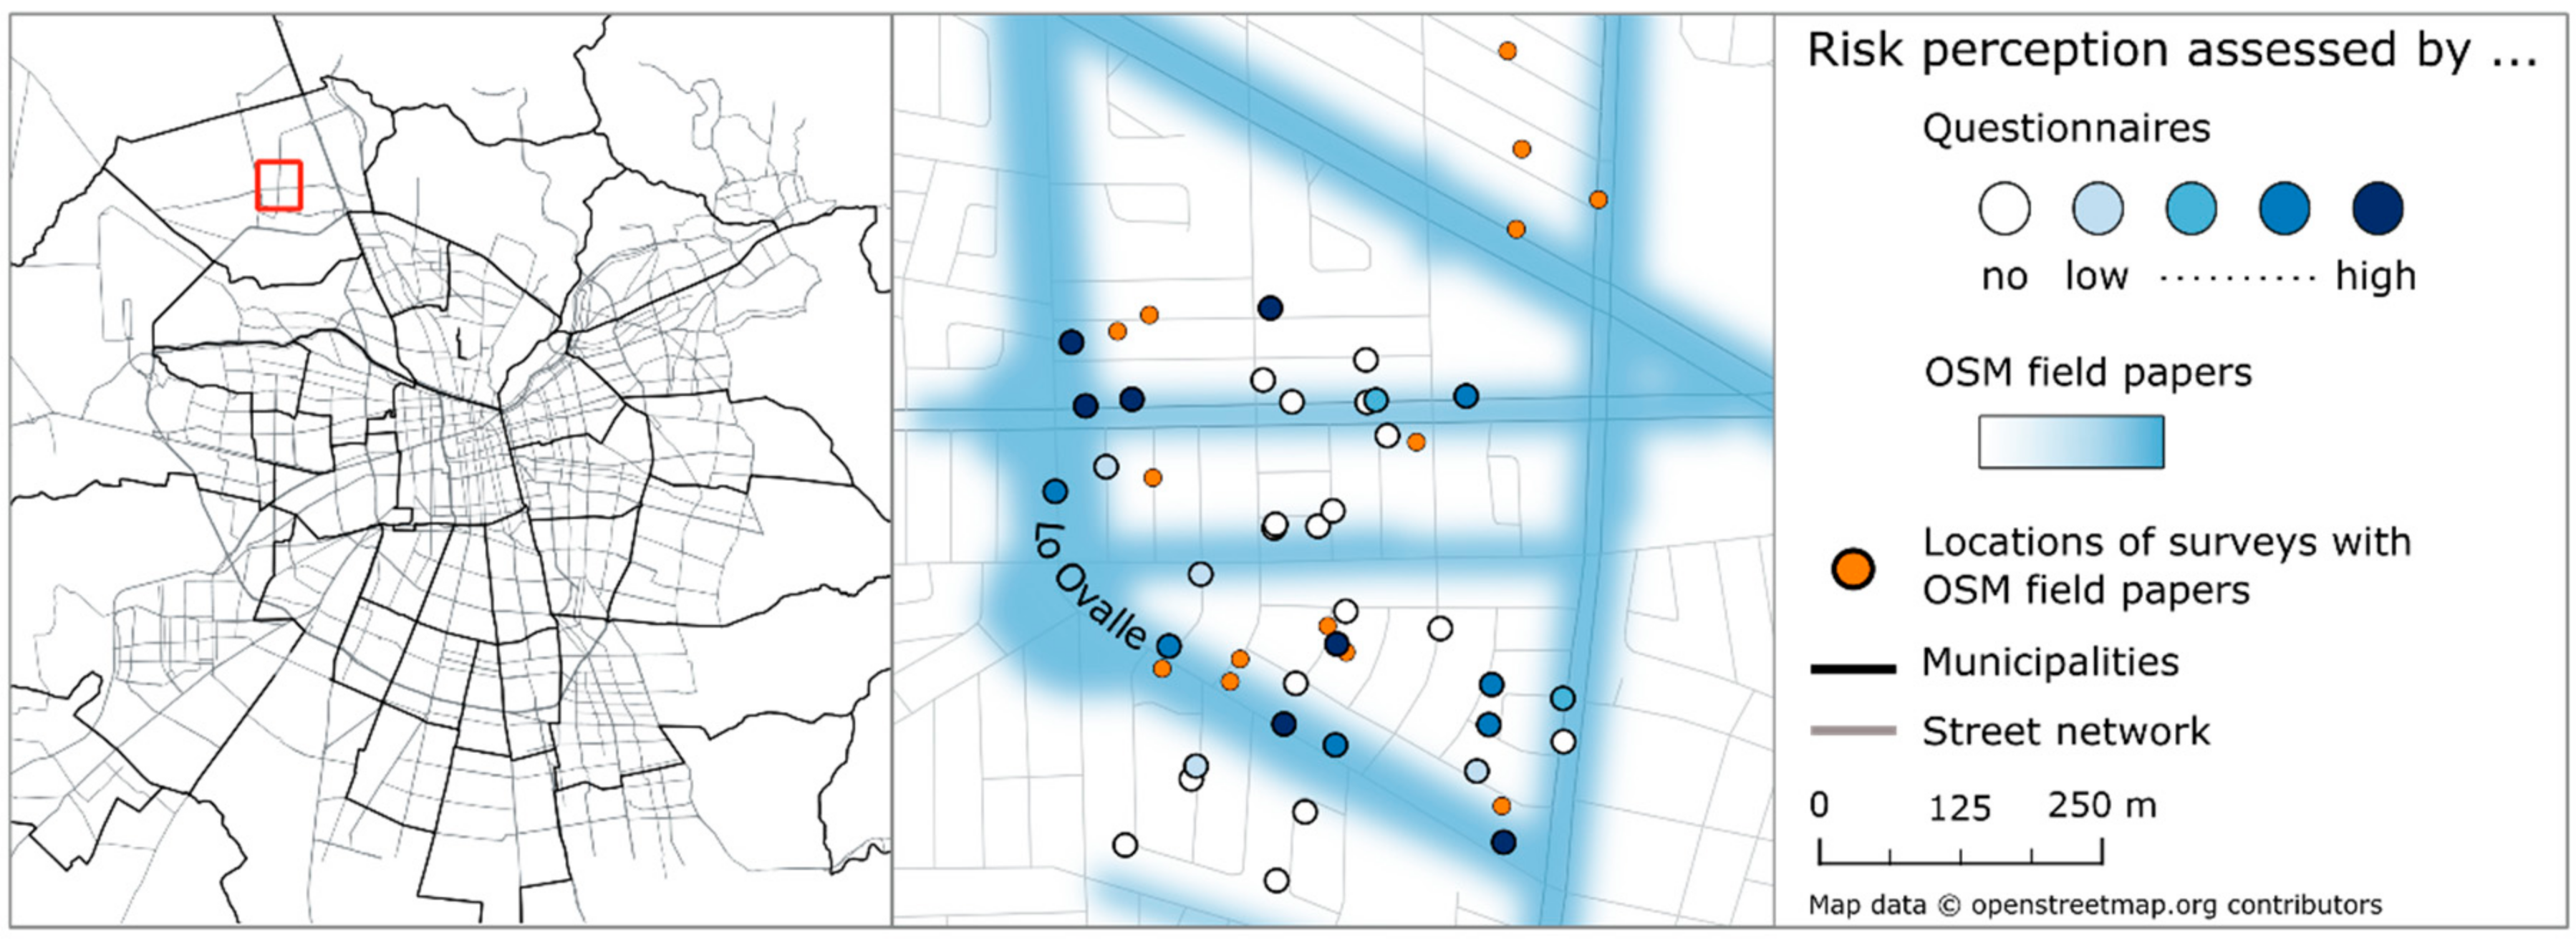
In total, 14 surveys are conducted during the first study with an equal distribution of male and female while 79% of the participants are residents and 21% pedestrians. The average age is 49 years, ranging from 19 to 77 years. The duration of residence (on average 14.6 years) can play an important role because a long residence might include more flood experience and knowledge about floods in this area. In general, the whole community is considered as being strongly affected by urban floods while nine rate it as strongly (level 4 and 5), and five as existing but not that strong (level 2 and 3). In contrast, the direct location is either perceived as strongly affected (level 4 and 5) by four participants or not affected (level 1), which is indicated by ten participants. The resulting risk perception map based on the sketch maps of all contributors shows high perceived urban flood risk in the street “Lo Ovalle” with two crossings (Figure 5, see [13]).
5.1.1. Comparison to Visual Inspections
The indicated areas at risk by the 14 participants are visually inspected and photos are taken. It is depicted that the street “Lo Ovalle” is built like a canal because the side streets are on a higher level; moreover, there are only a few gullies to cope with the water masses during rainfalls and many of them are not maintained (Figure 4). Residents already installed mitigation measures. Hence, this setting can explain the high risk perception of this street. In addition, it can also be assumed that the risk perception of people is higher on the main roads which they regularly use. In comparison, smaller streets might be underrepresented. This bias has to be kept in mind when analyzing risk perception maps of people (see [13]).
5.1.2. Comparison to Local Flood Risk Perception
For the second comparison we assume that the participants who are directly affected at their place of living tend to have more accurate flood risk perception in comparison to being asked about their risk perception for the whole study area. Results show a high correspondence between the two datasets (Figure 5). The sample consists of 36 people with 19 perceiving risk ranging from a low (2) to a high level (5), and 17 not perceiving any risk (1). When comparing the results to the flood risk perception captured via the sketch maps, at 12 locations (63%) risk is perceived in both datasets, however, seven locations with risk perception are not indicated in the sketch maps. Coming to the results where no flood risk is perceived, 14 locations (83%) can be found in areas, which are also not indicated in the sketch maps. Based on this comparison, the sketch maps can be evaluated as an adequate tool to get an idea of strongly affected areas, though no detailed conclusions can be drawn as the residents might not be aware of all the areas in the neighborhood (see [13]). Additionally, the resulting flood risk perception maps can be used as an indication of main streets that are frequently used, which plays an important role for disaster management.
5.2. Case Study in La Florida, Santiago de Chile
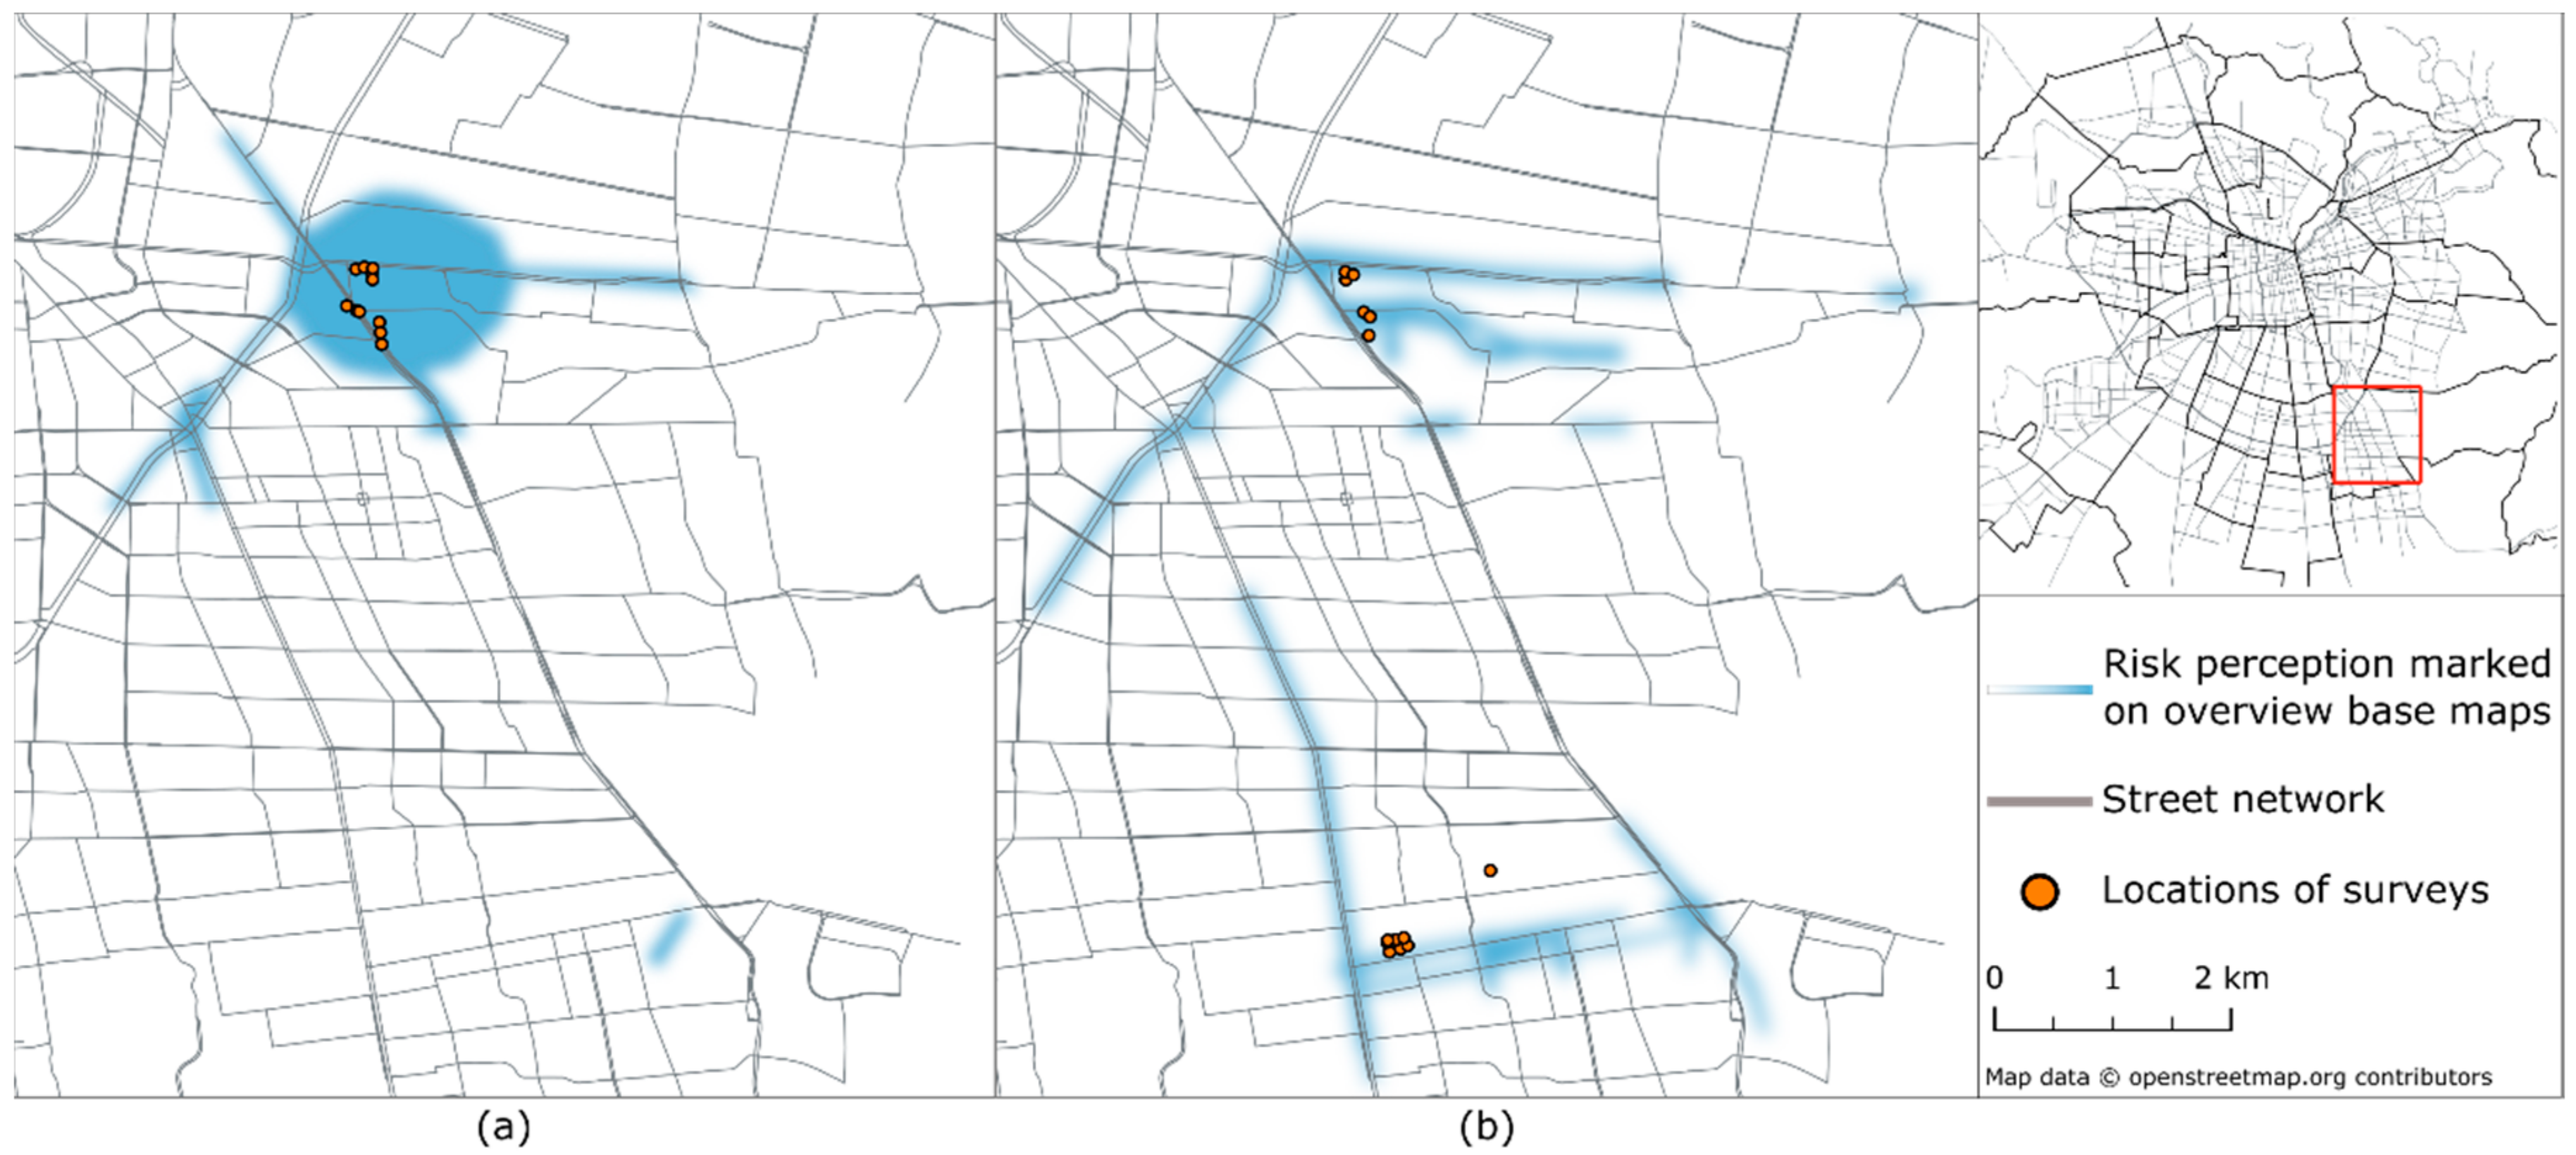
The second study comprises 30 participants including both local residents (60%) and pedestrians (40%). Similarly to the case study in Quilicura, participants are more aware of flooding at points of interest which are frequently visited, for example, the Metro Station Macul (in the northern part of the map) or of flooding in main streets (Figure 6). The following analyses take the differences in risk perception according to the overview maps and the detail maps into consideration.
Figure 6 shows that only sparse detailed information is provided when the overview base map is used. In contrast, the results of the maps with focus on the neighborhood show the detailed flood risk perception of the participants within the direct neighborhood (Figure 7).
5.2.1. Comparison to Critical Points Assessed by the Local Government
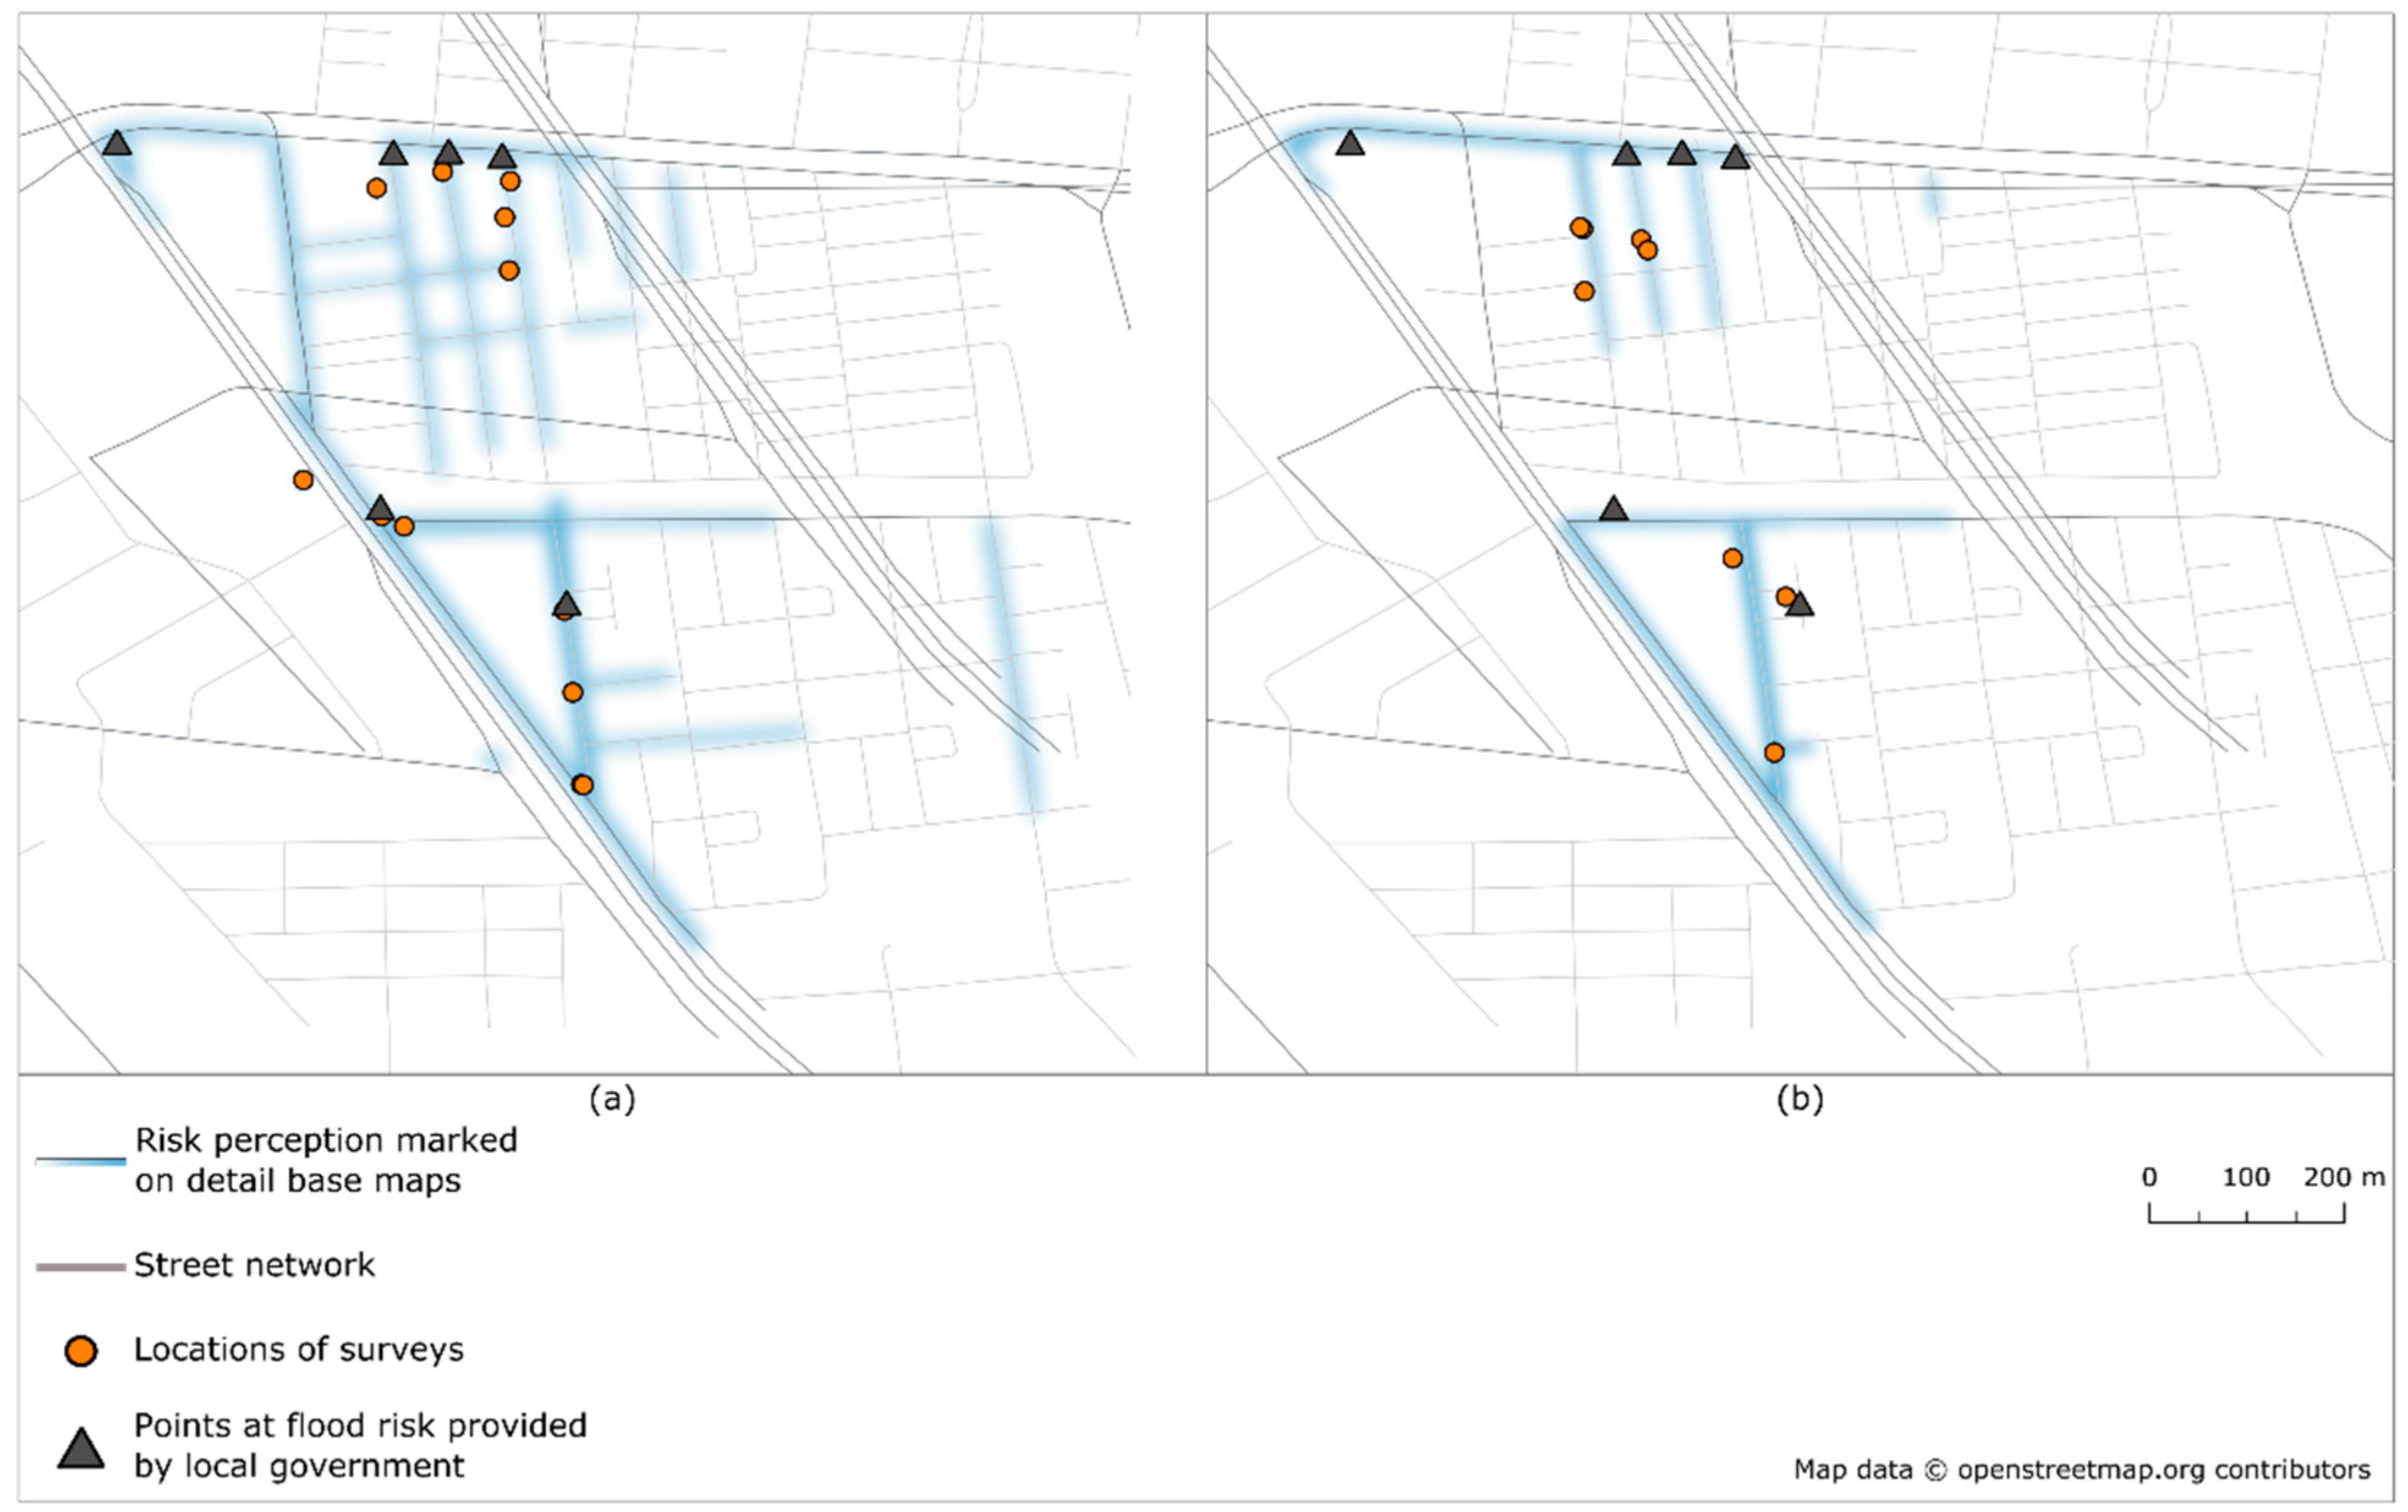
The local government has a set of official critical points of flooding in the community of La Florida, which is used as reference data. Results for the detail maps show that pedestrians have a broader flood risk perception and they also identify areas at risk, which are not stated as risk areas by the local government. Residents identify more specific areas and these areas are similar to the dataset of the local government (Figure 7).
There are several critical points which are not identified by the participants. This can be due to the locations of the survey, which are in the north and south area (see locations of participants in Figure 6). Therefore, the participants might not be familiar with the middle and northeast of La Florida. This example shows that the risk perception of the citizens is mainly based on important parts of the infrastructure and common areas in their neighborhood or their nearby neighborhood. They are not aware of the risk in unfrequented parts of their community. It is also visible that the overview map gathers risk perception of the people mainly based on the main streets. Small streets are only identified by the sketch maps based on the detailed scale of the neighborhood. Additionally, there are some areas, which have no problems with flooding (anymore) according to the local population, such as in the northeast. This can be due to mitigation measures and maybe the official critical points have not been updated yet.
There are differences in representation of the risk areas because there are points by the government and polygons by the participants. Therefore, our calculations for the results of the detail maps also include an option, where the government’s points do not need to be directly within the flood risk perception polygons but they are counted if they are within a certain distance. For the case study, distances of 50 m are allowed, which are around 1.4 cm on the base map. This reflects that the use of such additional calculations are appropriate because the people sometimes only approximately mark the areas. The results of the detail maps reveal that in the north all, and in the south 75% of the critical points of the government are at least within a distance of 50 m of the flood risk areas indicated by the participants.
5.2.2. Characteristics of Participants
The results are analyzed according to whether the participants are residents or pedestrians. The sketch maps based on the overview base map demonstrate that residents seem to have more information in addition to areas close to the main street and the metro station. The pedestrians seem to have the commonly known areas as risk areas in mind (Figure 6). In contrast, the detailed sketch maps reflect an overestimation of the pedestrians while the residents only mark a few streets that all correspond to critical points issued by the government (Figure 7).
The experience and knowledge of people is a valuable source of information about former flood events [3,38,40]. Therefore, the risk perception is evaluated according to the time they have lived in the area so far. The results show that people who have been living there 20 or less years mainly mark the main streets. This indicates that the longer they have lived there, the more smaller streets they identify. However, the differences are not very strong and thus, we do not go further into detail. Moreover, it is also possible to identify the awareness of the people according to the severity of the flooding. Therefore, participants are asked about the strongest flooding that they experienced at that exact location. The results show two main events: about half of the people mention the year 1993 and around a quarter name 2014.
On average, it can be concluded according to the participants’ risk perception that the municipality (3.73) and the direct location (3.57) are affected in a similar way with respect to the intensity rating from not affected (1) to extremely affected (5) (Table 1 and Table 2). However, in case of the intensity level, the differences between the pedestrians and residents are very small (difference of the average values: 0.25 for the municipality and 0.02 for the direct location) and thus, the place of living has no effect on the analyzed intensity of flood risk perception.
6. Discussion
One of the first questions of experts or members of the government when discussing about data provided by citizens concerns the quality issue [41,42,43]. To address these concerns, the nature of local knowledge needs to be considered. It is information based on a personal view and therefore, we deal with a subjective truth. That is why the context is so important, which may give hints about the motifs for giving a specific information, for example, a participant’s own property has been heavily affected, while another neighbor in the next street might have only been affected mildly, although the flood level might have been similar. Missing mitigation measures can be considered as one of the reasons for this difference [13]. The presented approach uses maps on different acquisition scales on which personal flood risk perception is marked as well as a questionnaire to gain information about the context of the participants to interpret the results more appropriately. The findings of this approach are discussed in the following with respect to opportunities and challenges; key aspects are summarized in Table 3.
6.1. Opportunities
The evaluation of the sketch maps of Quilicura shows that the resulting areas perceived at flood risk correspond to the given environment or rather the nature of the streets, which seems to favor especially the main streets like “Lo Ovalle” to function as a canal during raining events. Additionally, the comparison to local flood risk perception, which is based on the assumption that people who are directly affected can give more accurate information about risk perception, results in a high correspondence of the identified areas at risk. However, it must be kept in mind that the results might be biased because the maps present the whole study area to the participant, who might not be very familiar with all areas, leading to the indication of roads mainly used, especially the main roads. In our case study, exactly those streets are the ones, which have the most agreement on perceived flood risk. This corresponds to the fact that many participants stated that they are only aware of the flooding risk in their direct neighborhood. As this was not so easy to mark due to the scale of the overview map of Quilicura, the second field study includes base maps with different spatial acquisition scales, one with an overview of the whole study area in La Florida, and one with only the direct neighborhood. The objective of this approach of varying scales is to identify differences in the focus of the participants due to the base maps and the influence on the flood risk perception. The scale of the base map is chosen in order to have it be larger than the area of investigation to get an idea of the location and its surroundings; yet not too large in order to be able to read the street names due to practical reasons.
The detailed evaluation of the results of the second case study in La Florida is based on various aspects. A comparison of the two different risk perception maps (overview and detailed view) and points identified at flood risk by the local government (critical points) shows that with respect to the neighborhood areas, there is no remarkable difference of the areas perceived at risk by the participants and the critical points of the government. Therefore, it can be assumed that if the areas at flood risk shall be identified, the approach of the sketch maps can be used. However, on the detail maps, it is also revealed that pedestrians overestimate the area at flood risk while residents mention only the streets that are also identified as critical by the government. Hence, in cases, where all areas at risk need to be identified, pedestrians and residents can be inquired. As soon as specific streets on a close level are in focus, residents should be asked.
Some of the areas that are identified as being at flood risk by the participants are not critical points in the view of the local government. This might be due to the fact that the participants overestimated the area or that the local government missed these points because their data is also only based on former experiences and on interviews with residents. An additional value of the information captured via the sketch maps in comparison to the official data refers to the detailed view since there are only points by the government while the participants can also indicate areas, for example, a whole street. Moreover, there are several official critical points that do not correspond to the risk perception of the citizens. This surplus of identified official critical points might be caused by additional mitigation measures, which have been installed in the meantime; as a consequence these areas might not be seen as at flood risk anymore by the citizens.
The current flood information of the municipality comprises of indications of regularly flooded points. Though, important information is missing, for example, about the frequency or the intensity as the points are only defined by “regularly flooded”. The results of the field study depict that the method of sketch maps and questionnaires can improve such official data considerably by providing additional information like the flood intensity or the last major event. Moreover, Usón, et al. [39] show that in Santiago de Chile the acceptance of citizen-based information is rather low within the centralized government, which is also the case in many top-down focused governments [15]. Thus, the comparison to information provided by the local government can reveal valuable forms of improvements via a combination with citizen-based information. This might lead to more acceptance by governmental institutions.
The participants’ place of living plays an important role for the flood risk perception which they mark on the maps. The residents indicate more areas at risk on the overview level than the pedestrians who depict only a few areas, mainly with a focus on commonly known areas. Hence it can be concluded that the pedestrians are not aware of incidents in smaller streets as they might only use the main streets and points of interests, such as the metro station, while the residents also frequent the less known parts of the neighborhood. In contrast, on the detailed scale for Florida (see Figure 7), the pedestrians seem to have a larger area in mind than the local residents. This could be due to the fact that the homeowners might be focused on their specific street and only the directly neighboring streets. So, it is not possible to say that on a detailed scale one will get more information if residents are asked. Pedestrians from neighboring areas can also give profound information. However, a comparison to the critical points of the government demonstrate that the pedestrians overestimate the risk area and therefore, the detailed information of the residents gives more accurate information.
Another part of analysis considers the duration of living in the area. The results show no significant differences between the risk perceived by people who have only been living there for a short time or by people who have been residing in the area for a long time. This can be related to the frequency of the hazard: the flooding in Santiago de Chile takes place nearly every year. Hence, the duration of living does not play an important role in this case as even a short time of living there leads to sufficient flood experience. In contrast, the duration of living is a crucial factor in cases where the frequency is very low, such as in earthquake-prone areas, where the event happens only a few times in a century. In these cases, young people or people only living for a short time in these areas, might not be aware of the hazard and not familiar with influencing factors and possible mitigation options [3]. Therefore, the value of background information of the participants is strongly linked to the hazard type.
The participants’ experience of a major flood event has strong influences on their general flood perception because often they relate their current perception back to this event. Moreover, in regions, where no historic flood data are available, the identified years can be used to investigate circumstances and possible reasons for the flooding. The majority of participants experienced the floods of the year 1993 and 2014 as severe events. In addition, the experience of such a devastating event can lead to more risk awareness in general and to the acceptance of mitigation measures installed by the local government and readiness to take own preventive measures [9]. Moreover, the environmental conditions in these selected years can be analyzed in more detail to get information about influencing factors. This can help to increase the preparedness for future events.
The affectedness of the direct location and the study area in general can give a detailed view about the intensity of risk, which can be used as a good hint for prioritizing mitigation measures. Therefore, this adds important information to the officially used points of flood risk. On average, the residents and pedestrians have a similar perception of the affectedness. However, the residents name “extremely affected” more often. These results might be provoked by more experience and knowledge of the residents. A comparison to the affectedness of the municipality and the direct location of both study areas shows that in Quilicura most participants see the municipality as strongly affected while there are differences within the risk perception for the direct location because it is either strongly affected (majority) or not affected. In La Florida, the municipality is also identified as affected strongly, however, the direct location is rated with different intensity levels, not only the two extremes. This might indicate that in Quilicura, the flooding is even more location specific than in La Florida, where the flood probably spreads over more streets and with minor effects. Though, also with this affectedness evaluation, it is important to consider that it is a very subjective measure as it is influenced by previous experiences and knowledge of flooding events. The stronger the major event they experienced, the lower they might rate the intensity of a “regular” flood.
The characteristics of the base map, such as the acquisition scale, are an important factor within participatory approaches [21]. The change from one overview base map in the first case study to two base maps representing both the overview and the detailed view of the study area in the second study leads to more detailed results. The advantage of the two base maps can be seen in an increased value for fitness for use. The overview map can give a general idea of the area and which parts should be focused on in more detail. These maps can be marked by citizens from this area, but they do not necessarily need to live close by. The detail map is more appropriate for the use of case scenarios, when direct mitigation methods in a specific street, for example, should be evaluated on a regular basis by the residents or if there is the intention to plan mitigation measures. Then, a monitoring via sketch maps can identify the most affected streets in order to develop a list of priorities, especially in municipalities where not enough funding is available to do all the required mitigation measures.
The sketch maps approach offers a way to increase the information flow between different stakeholders because the local knowledge can be made available for the local governments and the citizens feel more valuable as they are included as a partner in the cooperation. These factors can support the resilience-building process [44].
6.2. Challenges
Our case studies show that sketch maps are an easy-to-use tool to disclose flood risk perception of the population. However, it should be mentioned that by selecting the area and the layout of the base map, a frame is imposed to the people who are taking part. Thus, some relevant information about areas outside of the study area provided by the map might get lost. Though, more base maps covering the whole region can overcome this problem. Furthermore, our second study addressed residents in areas where already critical points were issued by the local government. This might lead to a bias in the data. Questionnaires and risk maps of areas where no critical points are issued can be included to overcome this. Additionally, the sample size in our case studies leads to indicative and not definitive results and therefore, a larger number of participants would be necessary if conclusions for the whole society or generalizations want to be made [21].
Additionally, limitations of the usage of questionnaires have to be considered. They can be a complement to other assessments or can be used as a substitute if there is no other assessment at all. However, for the first case, data from different data sources need to be combined and this leads to challenges because there might be difficulties due to the data format, among others. In the second case, it is necessary to keep in mind that if the questionnaire data are used as the only data source, they cannot be compared to other regions, for example, where data from technical measurements are applied. They might only be used for visual comparisons as they are based on different concepts of data acquisition.
Another challenge appears in the subjective nature of the participatory mapping and the influence on accuracy. There are different risk perceptions of local people and of members of the government, respectively. Therefore, it is necessary to see the different results in their context to avoid wrong deductions by solely aggregating all information in a single map. Thus, an option would be to provide use case specific maps. If information about specific houses is required, the knowledge of local citizens might give the most detailed information, while the maps of the government could give insight into an overall image.
Moreover, the flexible approach of the sketch maps offers the chance to the participants to freely mark their risk perception; however, more restrictions, for example, to only allow marking lines, would lead to more homogeneous results and possibilities to compare the maps of different participants.
7. Conclusions
Our results reveal the effect of different spatial acquisition scales of base maps and the importance of the context of the participants. Based on these findings, use case specific decisions can be made about the choice of method (overview or detailed view base maps) and participants (residents or pedestrians). If general information about a flooding area is required, for example, the risk perception of residents and pedestrians can be a valuable source. However, as pedestrians tend to overestimate the risk area, residents should be inquired if detailed information is of importance.
Data captured via the presented approach can be used as a complement to already existing hazard models. In cases where no models or any hazard data are available, for example, due to the lack of money for technical devices, the flood risk perception captured via sketch maps is a unique way to get an idea of areas at potential risk in order to inform people, to capture further data in a targeted manner or to establish mitigation measures. However, more research is still required to identify the influence of other factors on the resulting sketch maps, for example, with a focus on official information provided by the authorities via leaflets, events, or online risk maps. People might have flood risk perception based on such information or were informed by other people. They might not have experienced a flood themselves. Moreover, our approach allows free drawing and it is worth it to investigate the difference in the resulting sketch maps when participants need to stick to a given way of marking, such as lines. Results can give additional hints for the study design of approaches based on sketch maps.
Author Contributions
Conceptualization, C.K., T.J.U., S.M. and B.H.; Methodology, C.K., T.J.U., S.M. and B.H.; Validation, C.K.; Formal Analysis, C.K.; Investigation, C.K. and T.J.U.; Data Curation, C.K.; Writing-Original Draft Preparation, C.K.; Writing-Review & Editing, C.K., T.J.U., S.M., F.-B.M. and B.H.; Visualization, C.K.; Supervision, C.K., F.-B.M., B.H.; Project Administration, C.K., B.H.; Funding Acquisition, B.H.
Funding
This research was supported by the WIN-Kolleg of the Heidelberg Academy of Sciences and Humanities (HAW). We acknowledge financial support by Deutsche Forschungsgemeinschaft within the funding programme Open Access Publishing, by the Baden-Württemberg Ministry of Science, Research and the Arts and by Ruprecht-Karls-Universität Heidelberg.
Acknowledgments
We thank Christoph Oberacker for sharing his experience regarding the methods of this research. We would like to express gratitude to all the study participants for their contributions and to the local governments of Quilicura and La Florida for their support.
Conflicts of Interest
The authors declare no conflict of interest. The funders had no role in the design of the study; in the collection, analyses, or interpretation of data; in the writing of the manuscript, and in the decision to publish the results.
References
- Douglas, I.; Garvin, S.; Lawson, N.; Richards, J.; Tippett, J.; White, I. Urban pluvial flooding: A qualitative case study of cause, effect and nonstructural mitigation. J. Flood Risk Manag. 2010, 3, 112–125. [Google Scholar] [CrossRef]
- Ebert, A.; Banzhaf, E.; McPhee, J. The influence of urban expansion on the flood hazard in Santiago de Chile. In Proceedings of the 2009 Joint Urban Remote Sensing Event, Shanghai, China, 20–22 May 2009; pp. 1–7. [Google Scholar]
- Wagner, K. Mental models of flash floods and landslides. Risk Anal. 2007, 27, 671–682. [Google Scholar] [CrossRef] [PubMed]
- European Commission. The EU Floods Directive. Available online: http://ec.europa.eu/environment/water/flood_risk/ (accessed on 8 June 2018).
- Gharesifard, M.; Wehn, U. To share or not to share: Drivers and barriers for sharing data via online amateur weather networks. J. Hydrol. 2016, 535, 181–190. [Google Scholar] [CrossRef]
- Wehn, U.; Rusca, M.; Evers, J.; Lanfranchi, V. Participation in flood risk management and the potential of citizen observatories: A governance analysis. Environ. Sci. Policy 2015, 48, 225–236. [Google Scholar] [CrossRef]
- Klonner, C.; Marx, S.; Usón, T.; Porto de Albuquerque, J.; Höfle, B. Volunteered geographic information in natural hazard analysis: A systematic literature review of current approaches with a focus on preparedness and mitigation. ISPRS Int. J. Geo-Inf. 2016, 5, 103. [Google Scholar] [CrossRef]
- Assumpção, T.H.; Popescu, I.; Jonoski, A.; Solomatine, D.P. Citizen observations contributing to flood modelling: Opportunities and challenges. Hydrol. Earth Syst. Sci. 2018, 22, 1473–1489. [Google Scholar] [CrossRef]
- Aerts, J.C.J.H.; Botzen, W.J.; Clarke, K.C.; Cutter, S.L.; Hall, J.W.; Merz, B.; Michel-Kerjan, E.; Mysiak, J.; Surminski, S.; Kunreuther, H. Integrating human behaviour dynamics into flood disaster risk assessment. Nat. Clim. Chang. 2018, 8, 193–199. [Google Scholar] [CrossRef] [Green Version]
- Schnebele, E.; Cervone, G. Improving remote sensing flood assessment using volunteered geographical data. Nat. Hazard Earth Syst. Sci. 2013, 13, 669–677. [Google Scholar] [CrossRef] [Green Version]
- Degrossi, L.C.; Porto De Albuquerque, J.; Fava, M.C.; Mendiondo, E.M. Flood citizen observatory: A crowdsourcing-based approach for flood risk management in Brazil. In Proceedings of the International Conference on Software Engineering and Knowledge Engineering, Hyatt Regency, Vancouver, BC, Canada, 1–3 July 2014; pp. 570–575. [Google Scholar]
- O’Neill, E.; Brennan, M.; Brereton, F.; Shahumyan, H. Exploring a spatial statistical approach to quantify flood risk perception using cognitive maps. Nat. Hazards 2015, 76, 1573–1601. [Google Scholar] [CrossRef]
- Klonner, C.; Marx, S.; Usón, T.; Höfle, B. Risk awareness maps of urban flooding via OSM Field Papers-case study Santiago de Chile. In Proceedings of the 13th International Conference on Information Systems for Crisis Response and Management, Rio de Janeiro, Brazil, 22–25 May 2016; Tapia, A., Antunes, P., Bañuls, V.A., Moore, K., Porto, J., Eds.; Federal University of Rio de Janeiro: Rio de Janeiro, Brazil, 2016. [Google Scholar]
- Boschmann, E.E.; Cubbon, E. Sketch maps and qualitative GIS: Using cartographies of individual spatial narratives in geographic research. Prof. Geogr. 2014, 66, 236–248. [Google Scholar] [CrossRef]
- Gaillard, J.C.; Mercer, J. From knowledge to action: Bridging gaps in disaster risk reduction. Prog. Hum. Geog. 2013, 37, 93–114. [Google Scholar] [CrossRef]
- Herget, J. Hochwasser, Sturzfluten und Ausbruchsflutwellen. In Naturrisiken und Sozialkatastrophen; Felgentreff, C., Glade, T., Eds.; Spektrum Akademischer Verlag: Berlin/Heidelberg, Germany, 2008; pp. 165–172. [Google Scholar]
- Banzhaf, E.; Kindler, A.; Müller, A.; Metz, K.; Reyes-Paecke, S.; Weiland, U. Land-use change, risk and land-use management. In Risk Habitat Megacity; Springer: Berlin/Heidelberg, Germany, 2012; pp. 127–154. [Google Scholar]
- Lynch, K. The Image of the City; MIT Press: Cambridge, MA, USA, 1960. [Google Scholar]
- Blades, M. The reliability of data collected from sketch maps. J. Environ. Psychol. 1990, 10, 327–339. [Google Scholar] [CrossRef]
- Haklay, M. Citizen science and volunteered geographic information: Overview and typology of participation. In Crowdsourcing Geographic Knowledge; Sui, D., Elwood, S., Goodchild, M., Eds.; Springer: Dordrecht, The Netherlands, 2013; pp. 105–122. [Google Scholar]
- Haworth, B.; Whittaker, J.; Bruce, E. Assessing the application and value of participatory mapping for community bushfire preparation. Appl. Geogr. 2016, 76, 115–127. [Google Scholar] [CrossRef]
- Haworth, B.T. Implications of volunteered geographic information for disaster management and GIScience: A more complex world of volunteered geography. Ann. Am. Assoc. Geogr. 2018, 108, 226–240. [Google Scholar] [CrossRef]
- Samodra, G.; Chen, G.; Sartohadi, J.; Kasama, K. Generating landslide inventory by participatory mapping: An example in Purwosari Area, Yogyakarta, Java. Geomorphology 2015. [Google Scholar] [CrossRef]
- Silvestro, F.; Gabellani, S.; Giannoni, F.; Parodi, A.; Rebora, N.; Rudari, R.; Siccardi, F. A hydrological analysis of the 4 November 2011 event in Genoa. Nat. Hazard Earth Syst. Sci. 2012, 12, 2743–2752. [Google Scholar] [CrossRef] [Green Version]
- Cheung, W.; Houston, D.; Schubert, J.E.; Basolo, V.; Feldman, D.; Matthew, R.; Sanders, B.F.; Karlin, B.; Goodrich, K.A.; Contreras, S.L.; et al. Integrating resident digital sketch maps with expert knowledge to assess spatial knowledge of flood risk: A case study of participatory mapping in Newport Beach, California. Appl. Geogr. 2016, 74, 56–64. [Google Scholar] [CrossRef] [Green Version]
- Curtis, J.W.; Shiau, E.; Lowery, B.; Sloane, D.; Hennigan, K.; Curtis, A. The prospects and problems of integrating sketch maps with geographic information systems to understand environmental perception: A case study of mapping youth fear in Los Angeles gang neighborhoods. Environ. Plan. B Plan. Des. 2014, 41, 251–271. [Google Scholar] [CrossRef]
- Ceccato, V.A.; Snickars, F. Adapting GIS technology to the needs of local planning. Environ. Plan. B Plan. Des. 2000, 27, 923–937. [Google Scholar] [CrossRef]
- Campbell, E.; Henly, J.R.; Elliott, D.S.; Irwin, K. Subjective constructions of neighborhood boundaries: Lessons from a qualitative study of four neighborhoods. J. Urban Aff. 2009, 31, 461–490. [Google Scholar] [CrossRef]
- Elwood, S.; Goodchild, M.F.; Sui, D.Z. Researching volunteered geographic information: Spatial data, geographic research, and new social practice. Ann. Assoc. Am. Geogr. 2012, 102, 571–590. [Google Scholar] [CrossRef]
- Felgentreff, C.; Glade, T. Naturrisiken und Sozialkatastrophen; Spektrum Akademischer Verlag: Berlin/Heidelberg, Germany, 2008; pp. XVIII, 454. [Google Scholar]
- Field Papers. Field Papers. Available online: http://fieldpapers.org/ (accessed on 8 June 2018).
- KoBo Toolbox. Kobo Toolbox. Available online: http://www.kobotoolbox.org/ (accessed on 8 June 2018).
- Mocnik, F.-B.; Mobasheri, A.; Griesbaum, L.; Eckle, M.; Jacobs, C.; Klonner, C. A grounding-based ontology of data quality measures. JOSIS 2018, 16. [Google Scholar] [CrossRef]
- Stake, R.E. Case studies. In Handbook of Qualitative Research; Denzin, N.K., Lincoln, Y.S., Eds.; Sage: London, UK, 1994. [Google Scholar]
- Malterud, K.; Siersma, V.D.; Guassora, A.D. Sample size in qualitative interview studies: Guided by information power. Qual. Health Res. 2016, 26, 1753–1760. [Google Scholar] [CrossRef] [PubMed]
- Punch, K.F. Introduction to Social Research: Quantitative and Qualitative Approaches, 1st ed.; Sage: London, UK, 1998. [Google Scholar]
- Sandelowski, M. Sample size in qualitative research. Res. Nurs. Health 1995, 18, 179–183. [Google Scholar] [CrossRef] [PubMed] [Green Version]
- Wachinger, G.; Renn, O.; Begg, C.; Kuhlicke, C. The risk perception paradox—Implications for governance and communication of natural hazards. Risk Anal. 2013, 33, 1049–1065. [Google Scholar] [CrossRef] [PubMed]
- Usón, T.J.; Klonner, C.; Höfle, B. Using participatory geographic approaches for urban flood risk in Santiago de Chile: Insights from a governance analysis. Environ. Sci. Policy 2016, 66, 62–72. [Google Scholar] [CrossRef]
- Gallart, F.; Llorens, P.; Latron, J.; Cid, N.; Rieradevall, M.; Prat, N. Validating alternative methodologies to estimate the regime of temporary rivers when flow data are unavailable. Sci. Total Environ. 2016, 565, 1001–1010. [Google Scholar] [CrossRef] [PubMed]
- Fonte, C.C.; Antoniou, V.; Bastin, L.; Estima, J.; Arsanjani, J.J.; Bayas, J.-C.L.; See, L.; Vatseva, R. Assessing VGI data quality. In Mapping and the Citizen Sensor; Foody, G., See, L., Fritz, S., Mooney, P., Olteanu-Raimond, A.-M., Fonte, C.C., Antoniou, V., Eds.; Ubiquity Press: London, UK, 2017. [Google Scholar]
- Goodchild, M.F.; Li, L. Assuring the quality of volunteered geographic information. Spat. Stat. 2012, 1, 110–120. [Google Scholar] [CrossRef]
- Haklay, M. How good is volunteered geographical information? A comparative study of OpenStreetMap and Ordnance Survey datasets. Environ. Plan. B Plan. Des. 2010, 37, 682–703. [Google Scholar] [CrossRef]
- Marana, P.; Labaka, L.; Sarriegi, J.M. A framework for public-private-people partnerships in the city resilience-building process. Saf. Sci. 2017. [Google Scholar] [CrossRef]
Figure 1.
Workflow showing the different tasks and results of each of the steps of the research. After the design of the case study and the conduction of the field work, the preprocessing of the collected data takes place. These data are analyzed in detail and conclusions are drawn.
Figure 1.
Workflow showing the different tasks and results of each of the steps of the research. After the design of the case study and the conduction of the field work, the preprocessing of the collected data takes place. These data are analyzed in detail and conclusions are drawn.
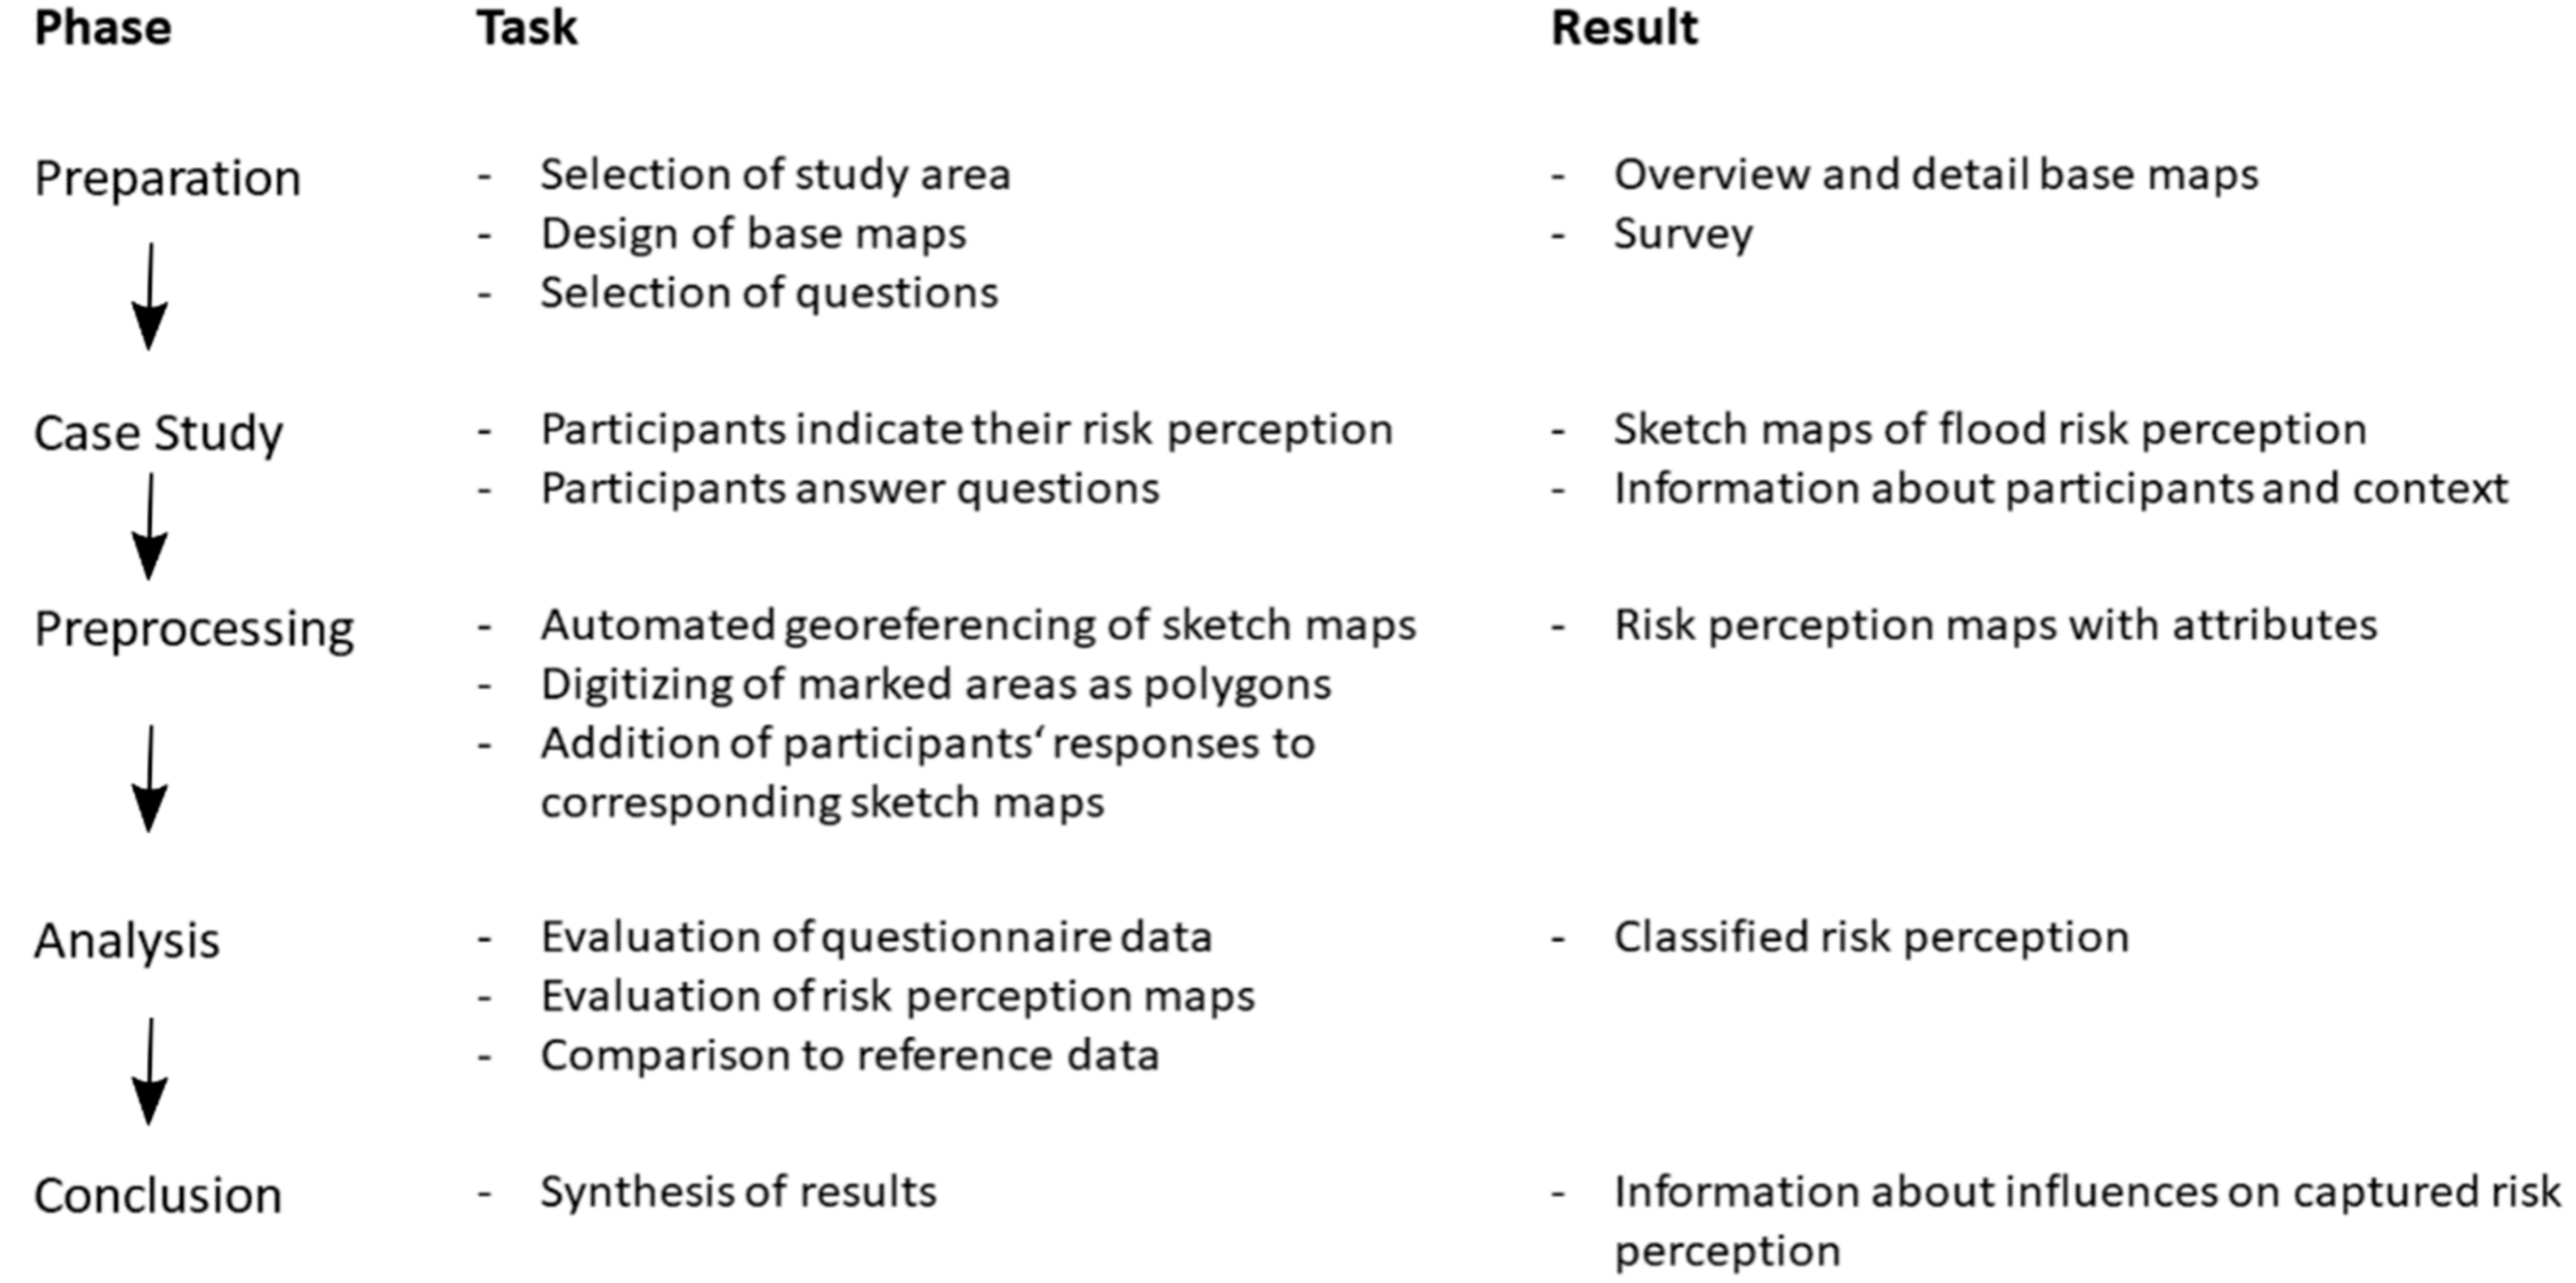
Figure 2.
Sketch maps with a single participant‘s risk perception marked in red. (a) Overview base layer of La Florida, Santiago de Chile; (b) detailed view of the study area. QR-Code and black dots allow fast automatic georeferencing of the sketch map. Based on OSM Field Papers [31].
Figure 2.
Sketch maps with a single participant‘s risk perception marked in red. (a) Overview base layer of La Florida, Santiago de Chile; (b) detailed view of the study area. QR-Code and black dots allow fast automatic georeferencing of the sketch map. Based on OSM Field Papers [31].

Figure 3.
Santiago de Chile with its municipalities of Quilicura (first case study in 2015), and La Florida (second case study in 2016 with a study area in the north and the south, respectively).
Figure 3.
Santiago de Chile with its municipalities of Quilicura (first case study in 2015), and La Florida (second case study in 2016 with a study area in the north and the south, respectively).

Figure 4.
Quilicura: The street “Lo Ovalle” turns into a riverbed during rainfalls due to its lower level compared to the side streets. Blocked gullies increase the runoff (photos taken by author, Quilicura, 6 May 2015).
Figure 4.
Quilicura: The street “Lo Ovalle” turns into a riverbed during rainfalls due to its lower level compared to the side streets. Blocked gullies increase the runoff (photos taken by author, Quilicura, 6 May 2015).
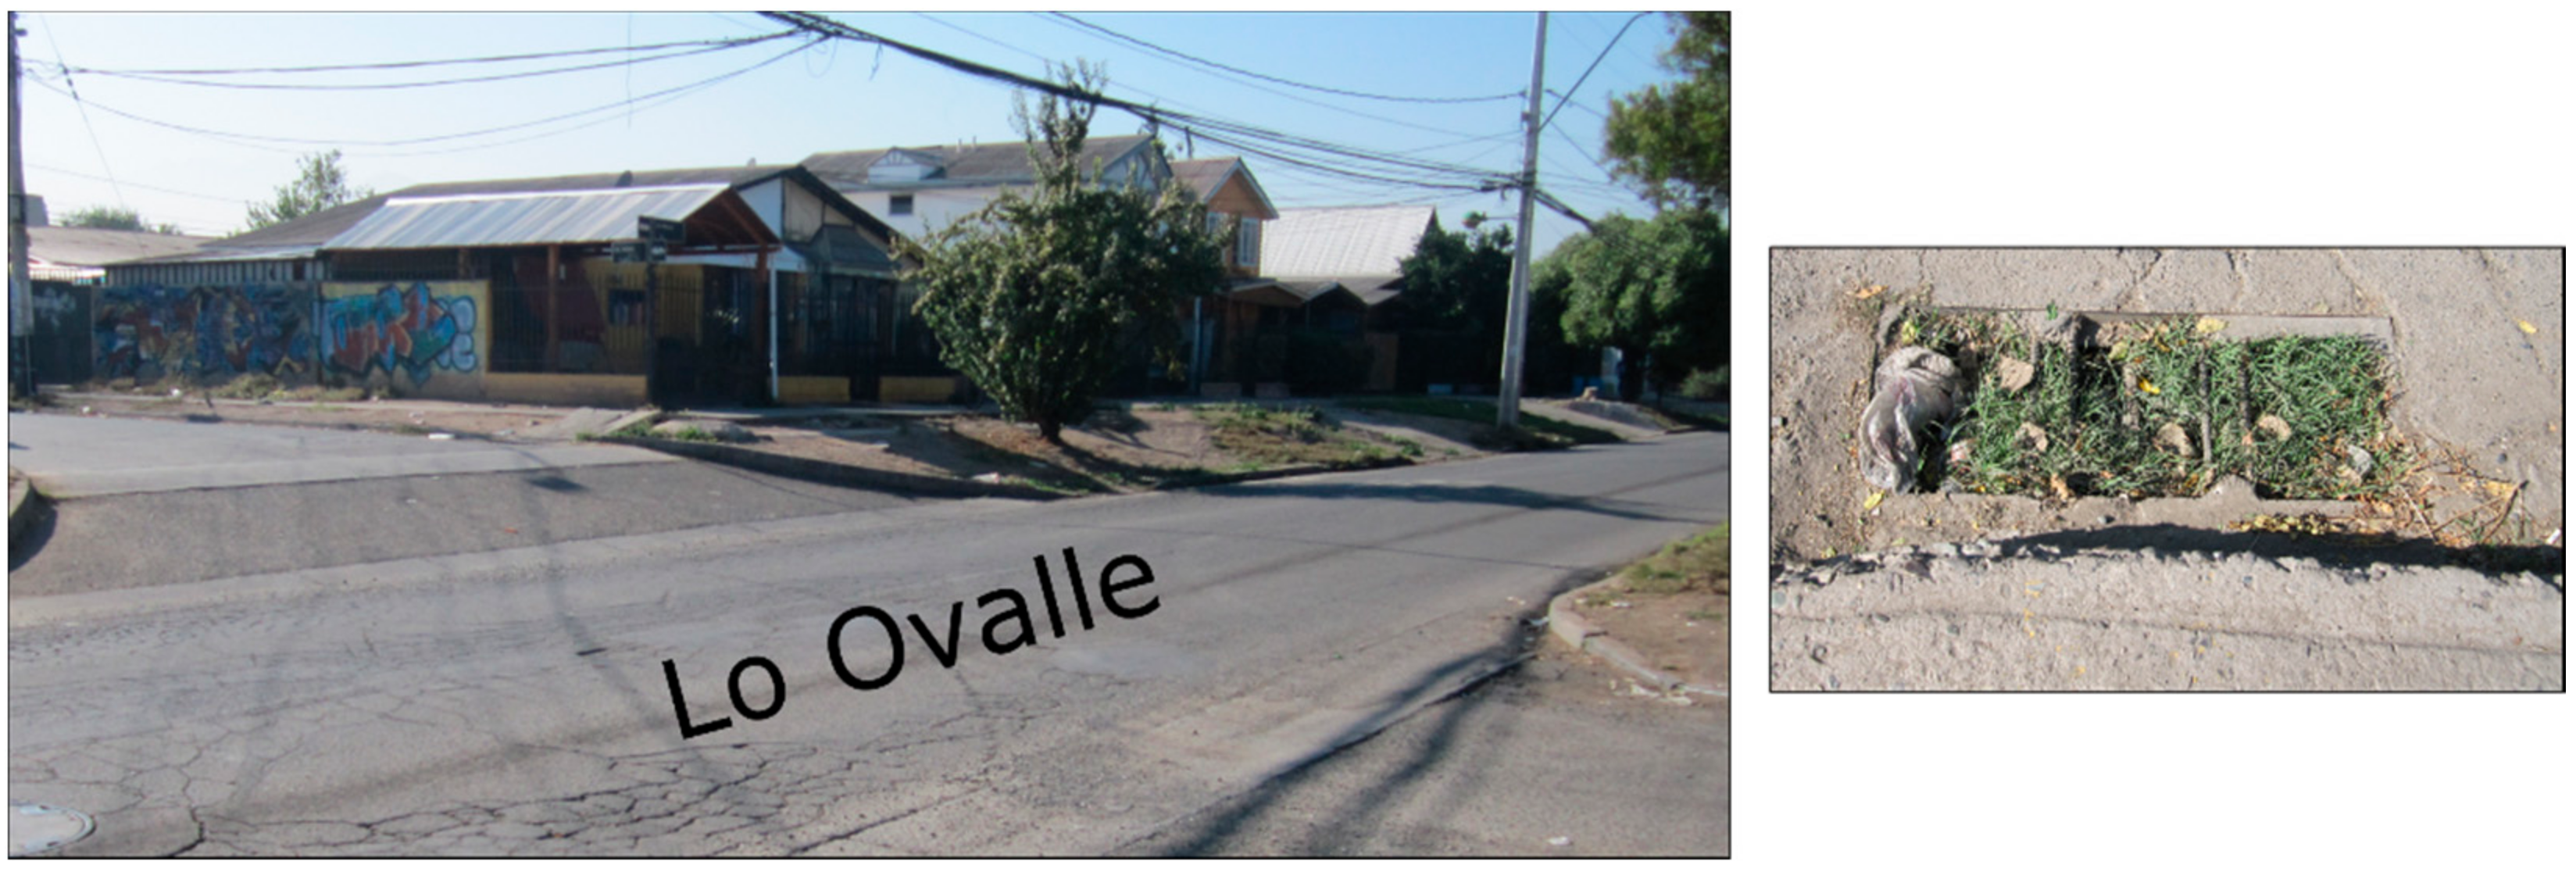
Figure 5.
Quilicura: Risk perception based on the overview base maps. The blue areas summarize the results of the risk perception maps of the 14 participants while the points indicate the reference data based on the local risk perception from 36 participants; i.e., the intensity of their flood risk perception at that direct location. The darker the blue, the higher the intensity. The orange points indicate the location of the 14 participants during the survey with the OSM field papers.

Figure 6.
Comparison of the risk perception of 12 pedestrians (a) and 18 residents (b) based on the overview maps. The orange points indicate the position of the people during the survey.
Figure 6.
Comparison of the risk perception of 12 pedestrians (a) and 18 residents (b) based on the overview maps. The orange points indicate the position of the people during the survey.

Figure 7.
Risk perception based on the detail maps in the north of La Florida (blue). Pedestrians (a) tend to overestimate the area at risk in comparison to residents (b). All perceive the same areas at risk as the local government (triangles). The orange points indicate the position of the people during the survey.


Table 1.
Affectedness of municipality (average of all answers 3.73).
| Affectedness | Residents (18) (Average: 3.83) | Pedestrians (12) (Average: 3.58) |
|---|---|---|
| 1 (not affected) | 0 | 0 |
| 2 | 4 | 2 |
| 3 | 2 | 5 |
| 4 | 5 | 1 |
| 5 (extremely affected) | 7 | 4 |
Table 2.
Affectedness of direct location (Average of all answers 3.57).
| Affectedness | Residents (18) (Average: 3.56) | Pedestrians (12) (Average: 3.58) |
|---|---|---|
| 1 (not affected) | 2 | 2 |
| 2 | 3 | 2 |
| 3 | 1 | 0 |
| 4 | 7 | 3 |
| 5 (extremely affected) | 5 | 5 |
Table 3.
Risk perception via sketch maps and questionnaires: key opportunities and challenges.
| Opportunities | Challenges |
|---|---|
|
|
|
|
|
|
|
|
|
|
| |
|
© 2018 by the authors. Licensee MDPI, Basel, Switzerland. This article is an open access article distributed under the terms and conditions of the Creative Commons Attribution (CC BY) license (http://creativecommons.org/licenses/by/4.0/).
Share and Cite
MDPI and ACS Style
Klonner, C.; Usón, T.J.; Marx, S.; Mocnik, F.-B.; Höfle, B. Capturing Flood Risk Perception via Sketch Maps. ISPRS Int. J. Geo-Inf. 2018, 7, 359. https://doi.org/10.3390/ijgi7090359
AMA Style
Klonner C, Usón TJ, Marx S, Mocnik F-B, Höfle B. Capturing Flood Risk Perception via Sketch Maps. ISPRS International Journal of Geo-Information. 2018; 7(9):359. https://doi.org/10.3390/ijgi7090359
Chicago/Turabian StyleKlonner, Carolin, Tomás J. Usón, Sabrina Marx, Franz-Benjamin Mocnik, and Bernhard Höfle. 2018. "Capturing Flood Risk Perception via Sketch Maps" ISPRS International Journal of Geo-Information 7, no. 9: 359. https://doi.org/10.3390/ijgi7090359
Note that from the first issue of 2016, this journal uses article numbers instead of page numbers. See further details here.