Using the Spatial Knowledge of Map Users to Personalize City Maps: A Case Study with Tourists in Madrid, Spain

 , , and
Abstract
:1. Introduction
Cognitive Maps, Sketches, and Spatial Knowledge
2. Materials and Methods
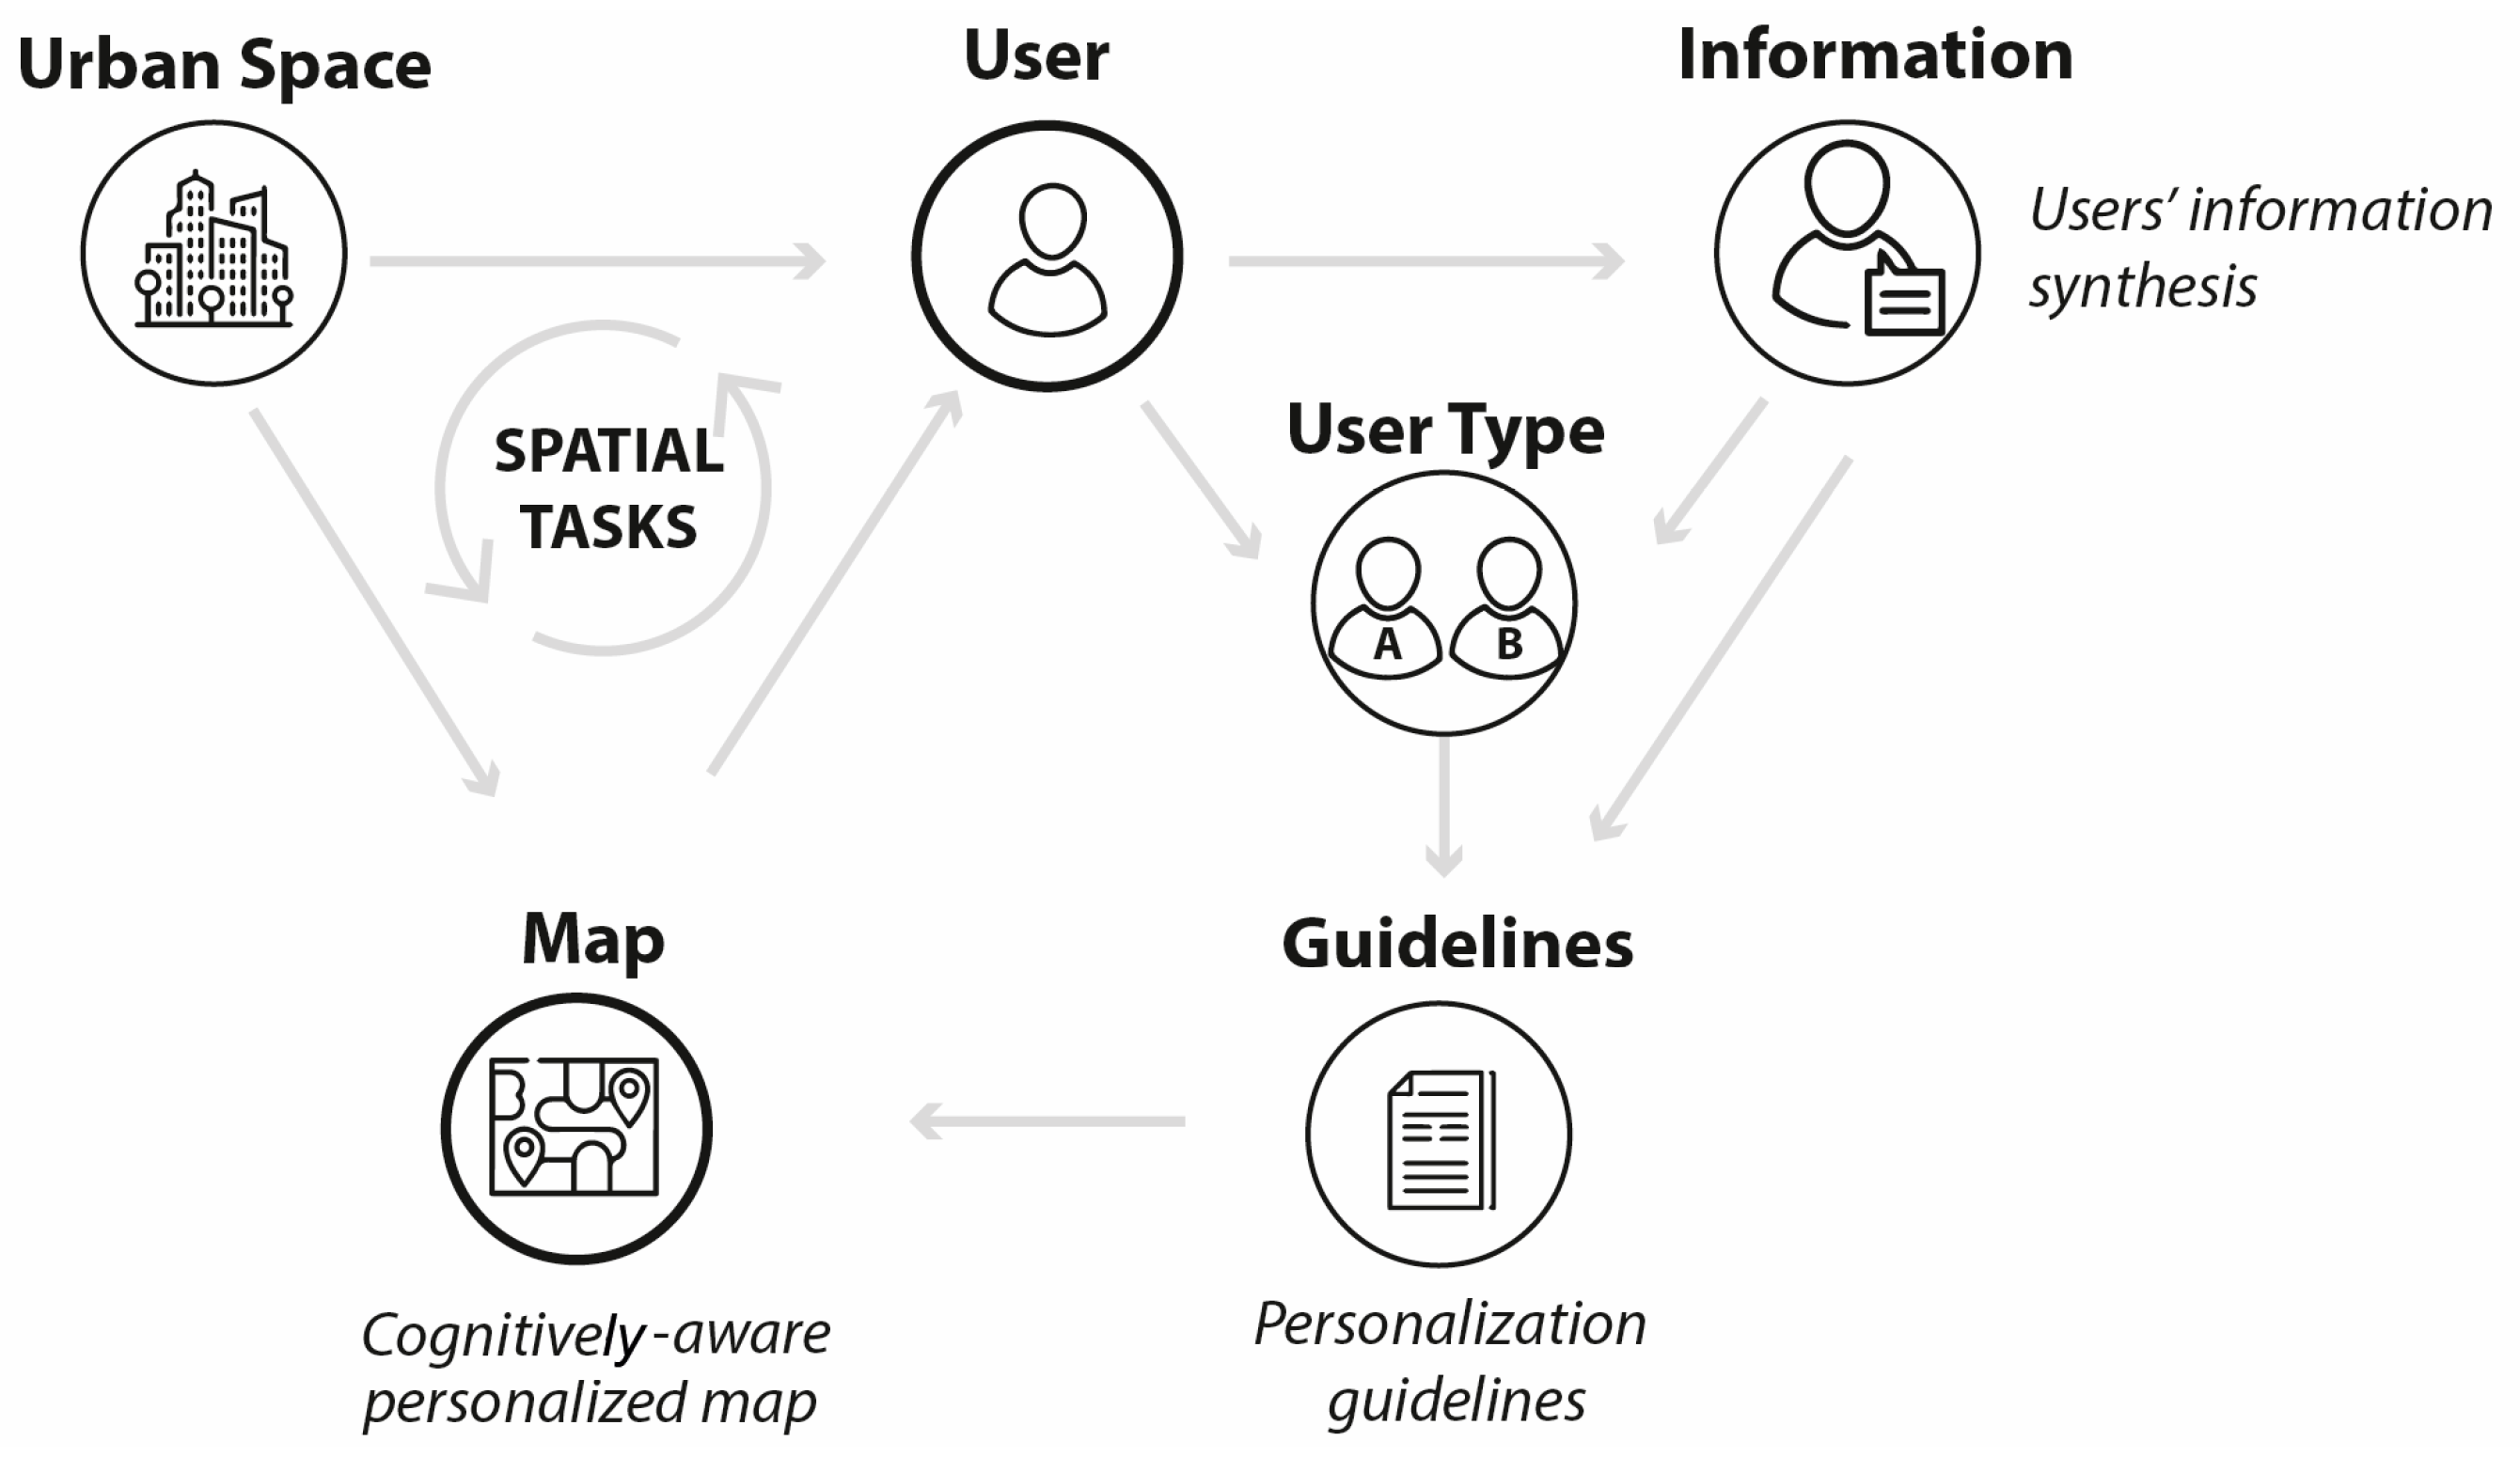
2.1. The Design of Cognitively Aware Personalized Maps
- Identification of factors affecting spatial knowledge: Identifying individual and contextual factors that could influence the spatial knowledge of map users.
- Data collection: Gathering data about the factors affecting users’ spatial knowledge, including their hand-drawn sketches.
- General analysis of sketches: Analyzing the sketches drawn by users and identifying the elements most used to represent the urban space, as well as particularities in the content of their drawings.
- Identification of user types: Analyzing data about factors affecting the spatial knowledge of participants to make choices about the parameters for user modeling. This analysis enables an understanding of how map users perform their spatial tasks and how they reflect on their cognitive maps. The result is the identification of different types of users and the factors necessary to categorize them.
- Identification of patterns: Describing the sketches of users by user type, the average number of features, types of features, and reference systems applied. The evolution of these characteristics over time is also considered.
- Definition of design guidelines: Top-down extraction of guidelines to design personalized maps, covering three levels: (1) for all maps; (2) for user types; and (3) for individual maps.
2.2. Case Study: Personalizing City Maps for Tourists in Madrid, Spain
2.2.1. Participants
2.2.2. Materials
- Questionnaire: We prepared a questionnaire to be completed just before the tourists left Madrid, asking for information about (1) individual factors: age, gender, education, place of origin, previous experience of visiting big cities, experience using maps, and their interest in the city; and (2) contextual factors: travel motivation, travel group, means of transport used, location of accommodation, and length of stay. We also requested information using open-ended questions, such as which places they had visited in the city, and asked them to draw a map of Madrid.
- “Thinking-aloud” notes and observations: we encouraged tourists to verbalize their thoughts while completing the questionnaire, and observed them, taking notes such as: “The man travels with a woman. The woman starts to complete the questionnaire, but when the questions about city attractions and locations started, she says it is better that he answers that, because he used the maps, so he knows the names and locations better.” This kind of information complemented the questionnaire data and gave us new clues for interpreting them.
- Travel diaries: We asked 6 participants to register daily any information that could influence their spatial knowledge of the city, such as the maps consulted, transport used, Points Of Interests (POIs) visited, and the situations in which they felt disoriented. Tourists registered their information using a mobile phone and/or paper notes. These diaries allowed us to monitor tourists so as to understand their motivations, needs, preferences, interests, aptitude, and constraints while performing spatial tasks in the city.
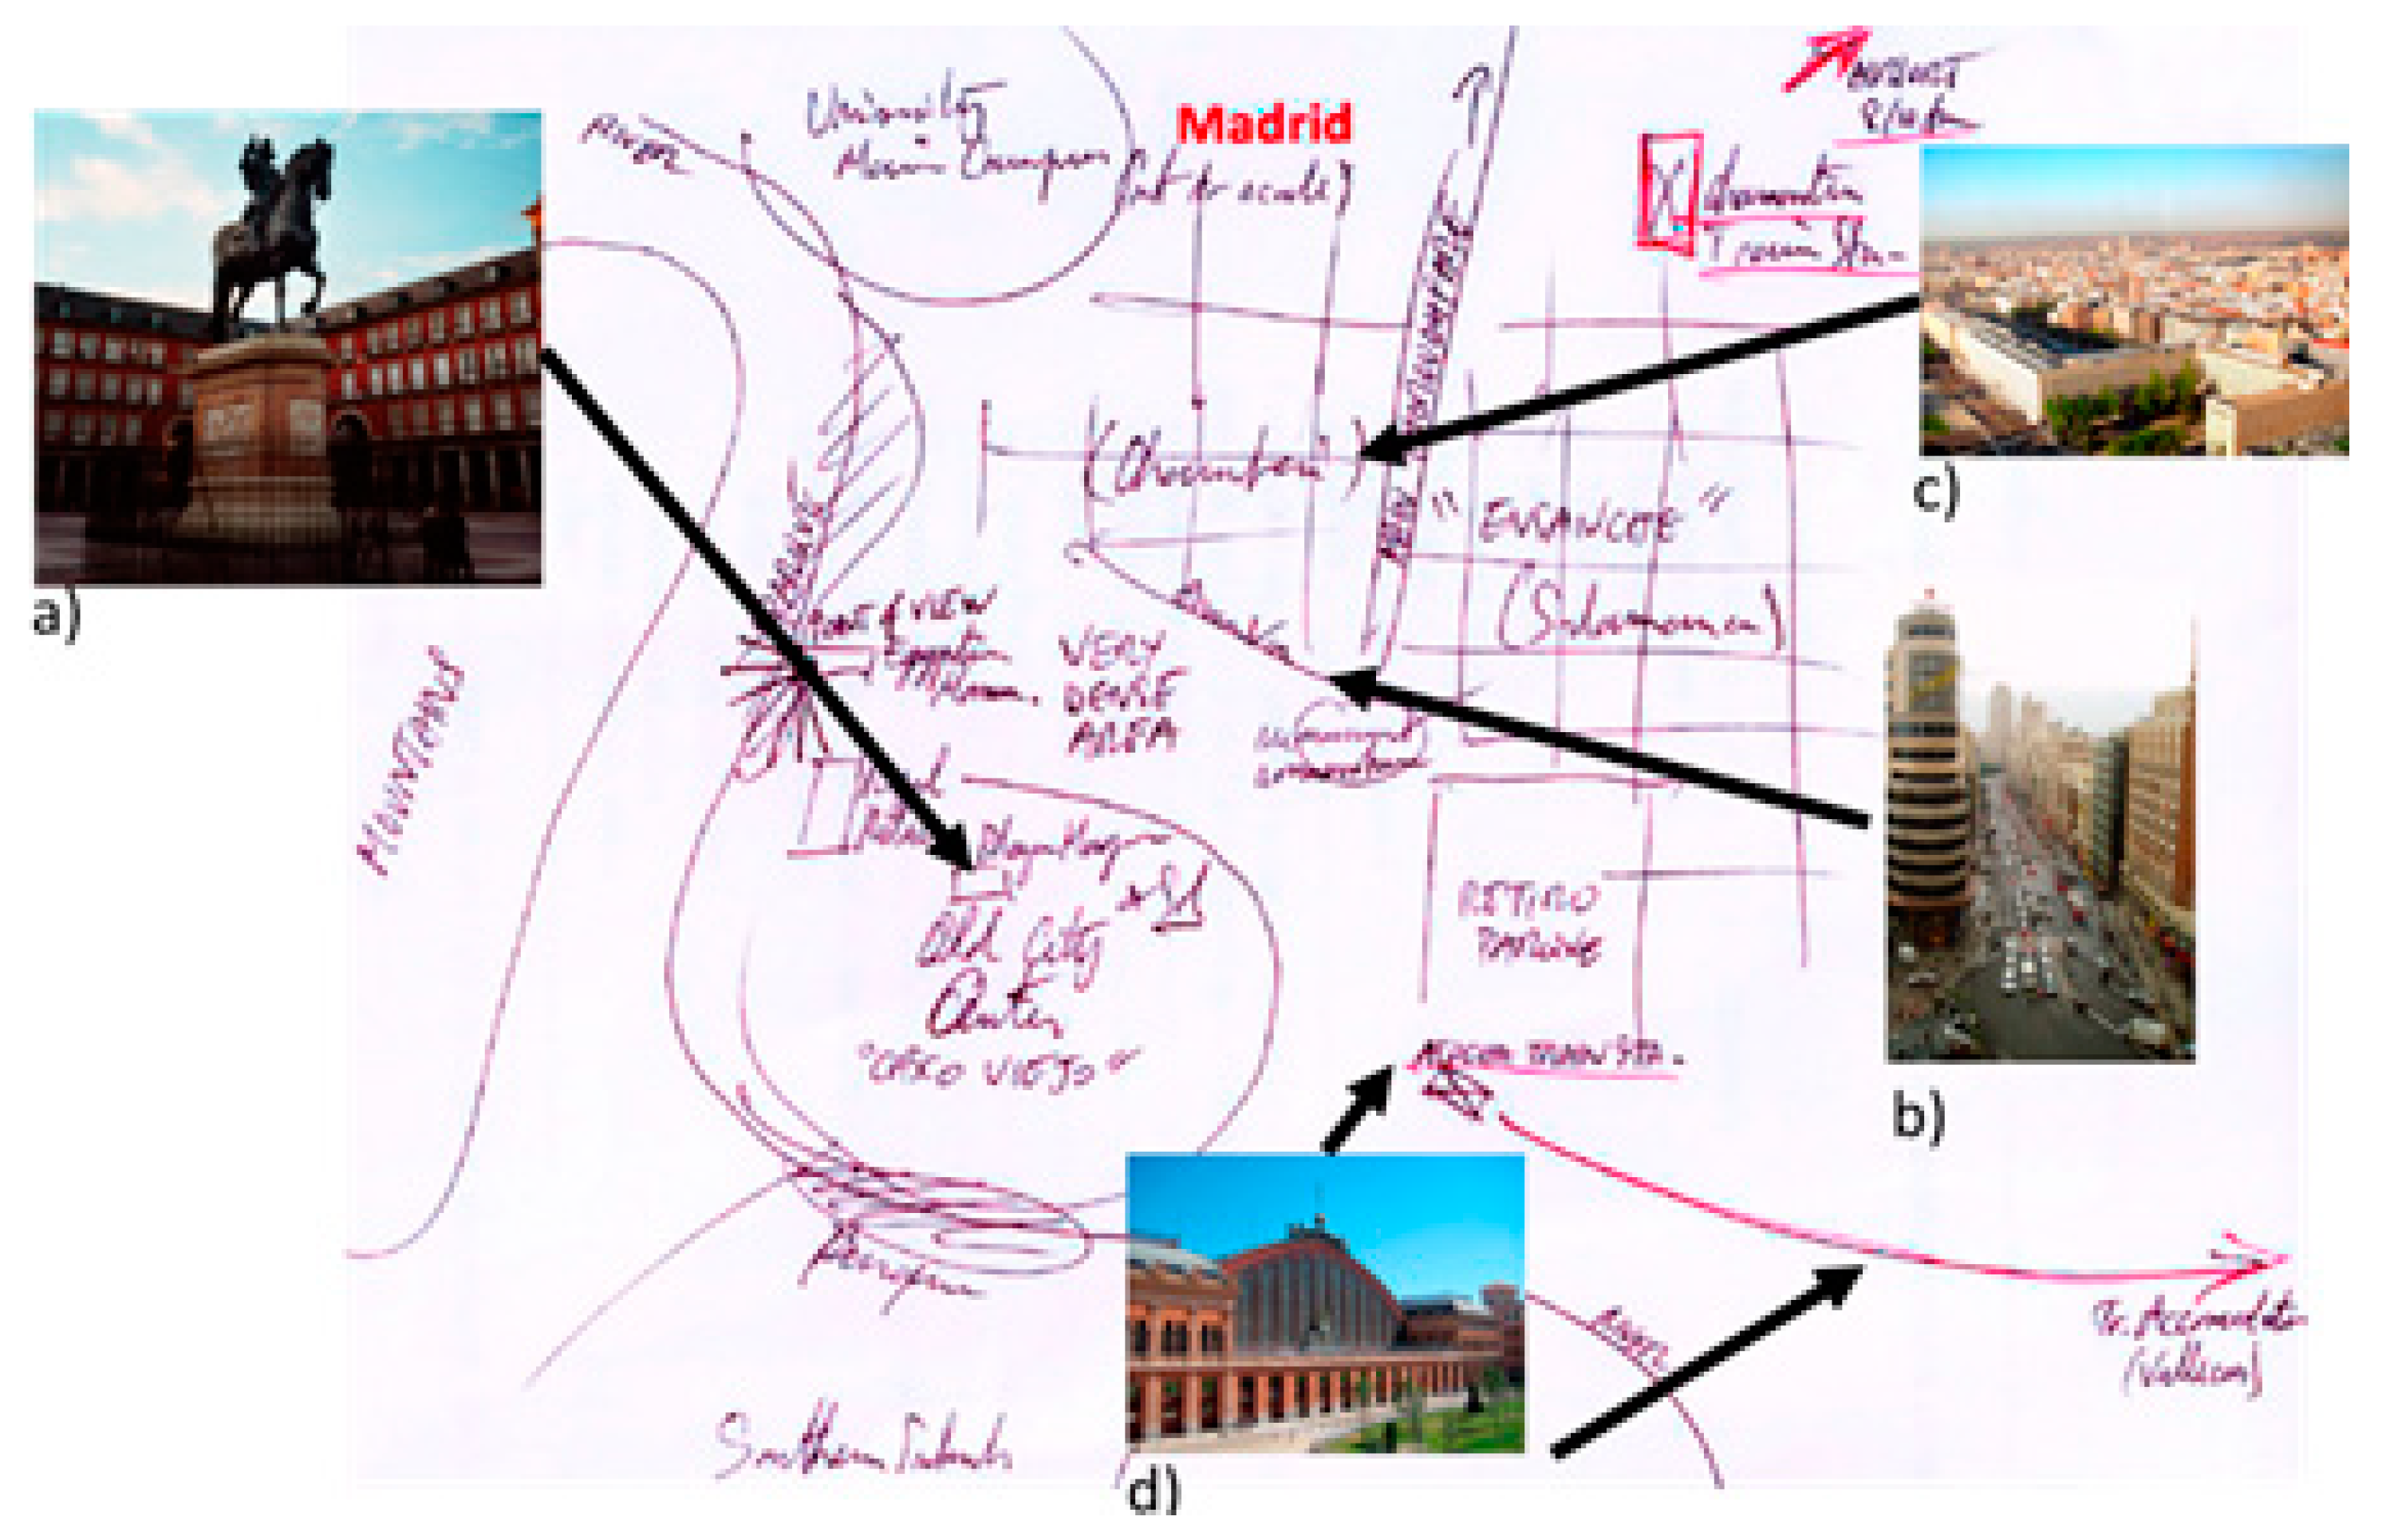
- Maps: We offered various maps of the city upon arrival to the participants that wrote diaries. Furthermore, all participants were asked to sketch maps of Madrid.
2.2.3. Procedure
3. Results
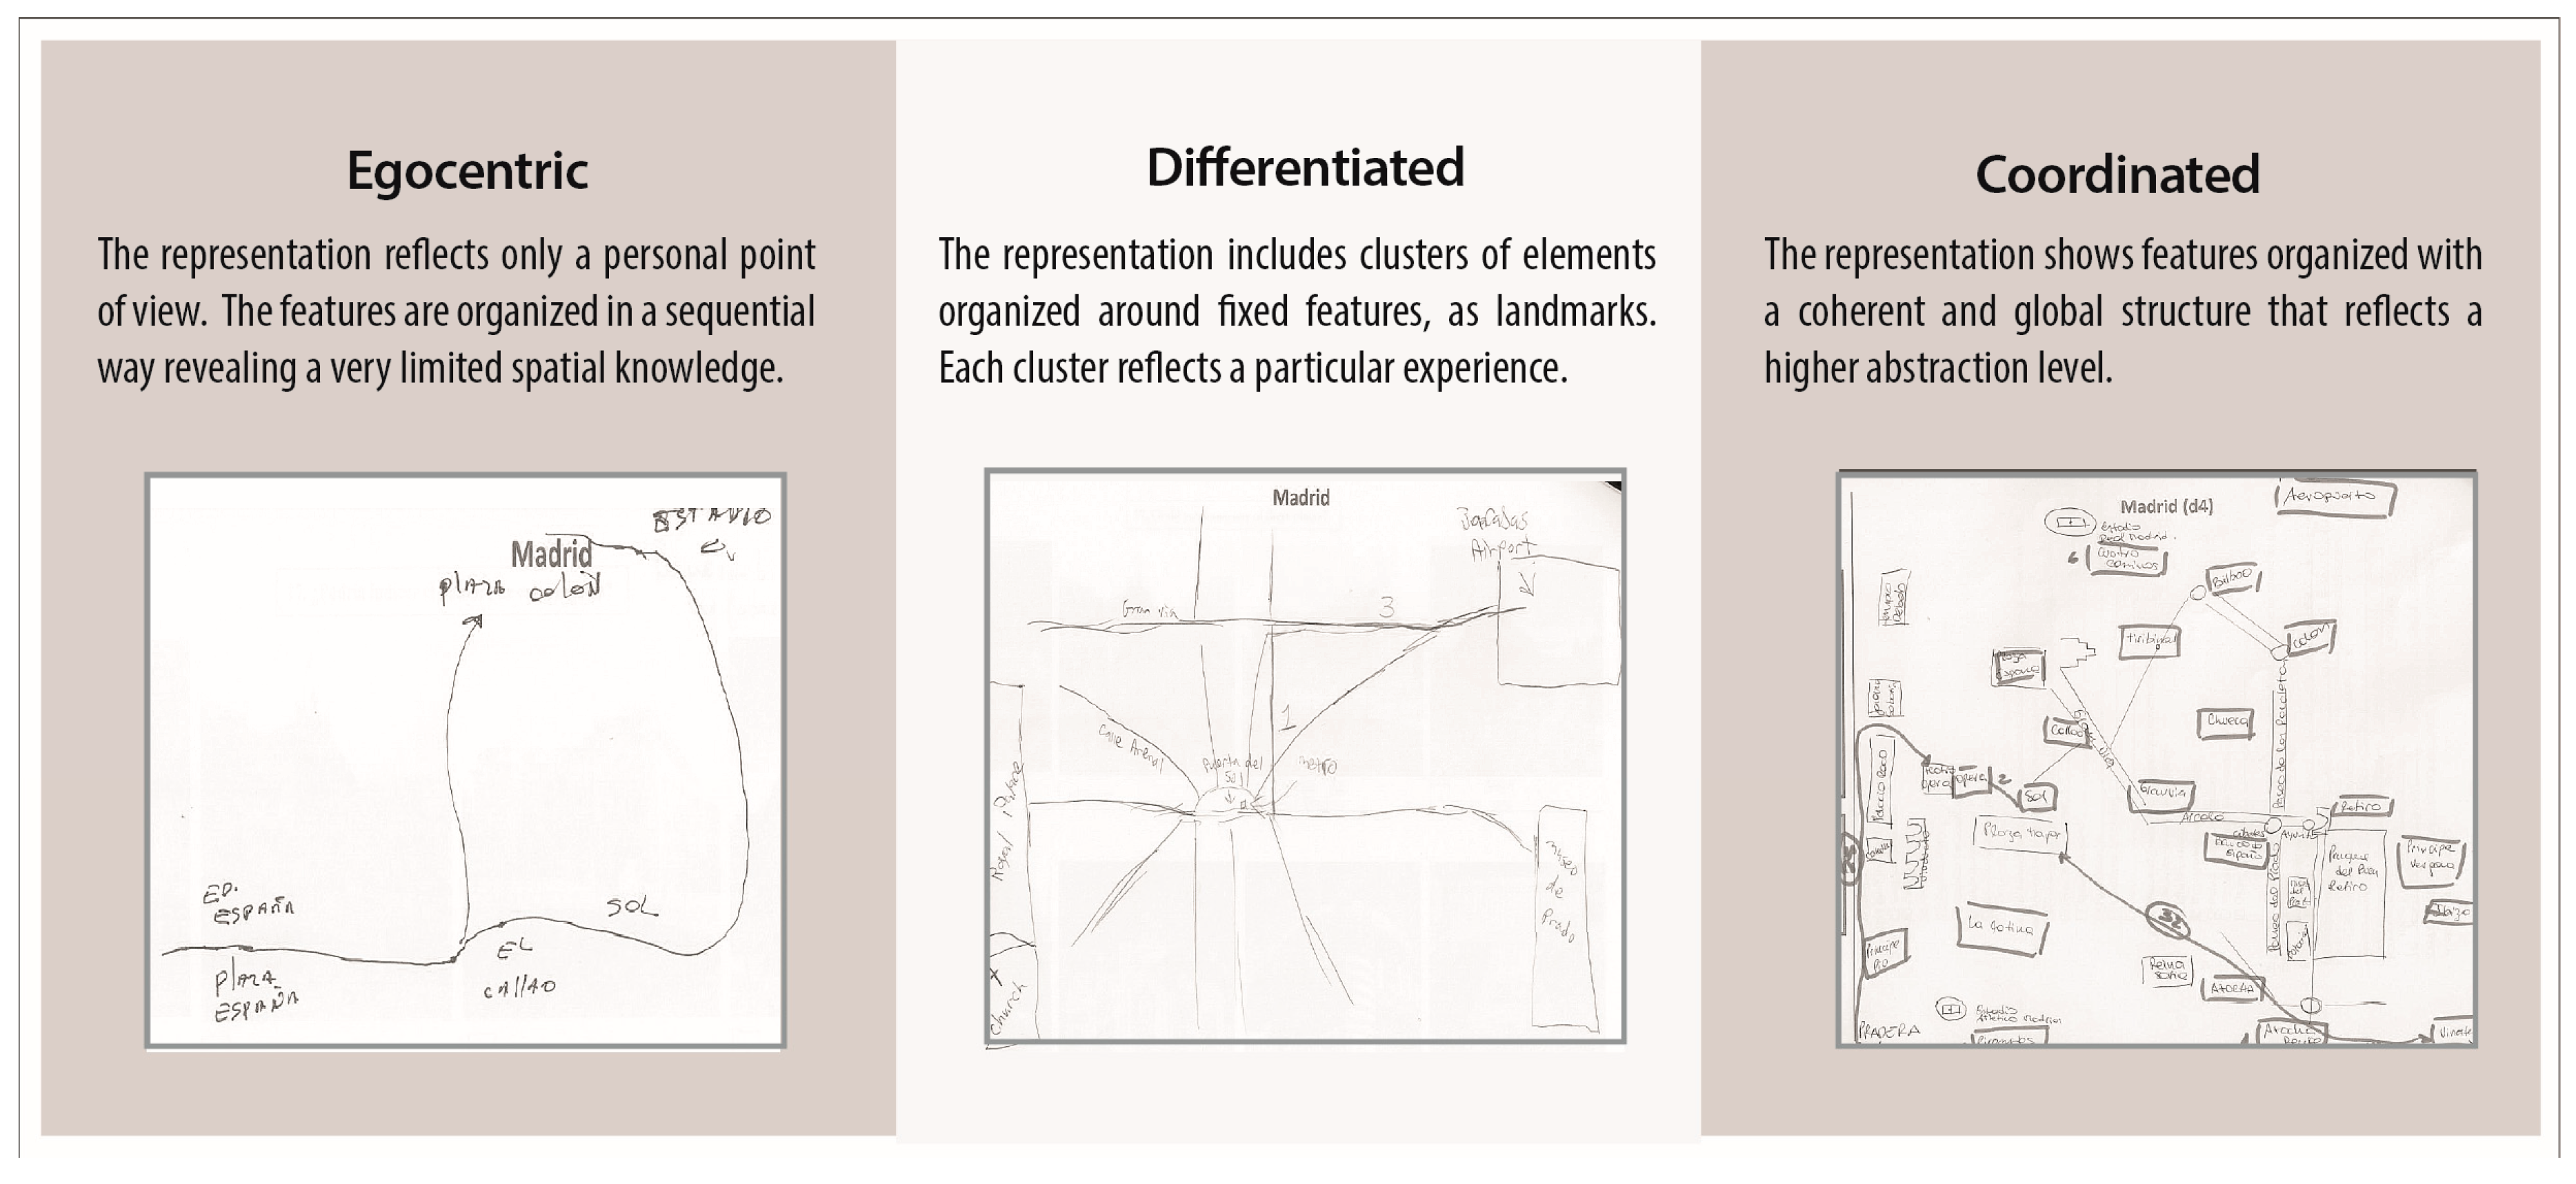
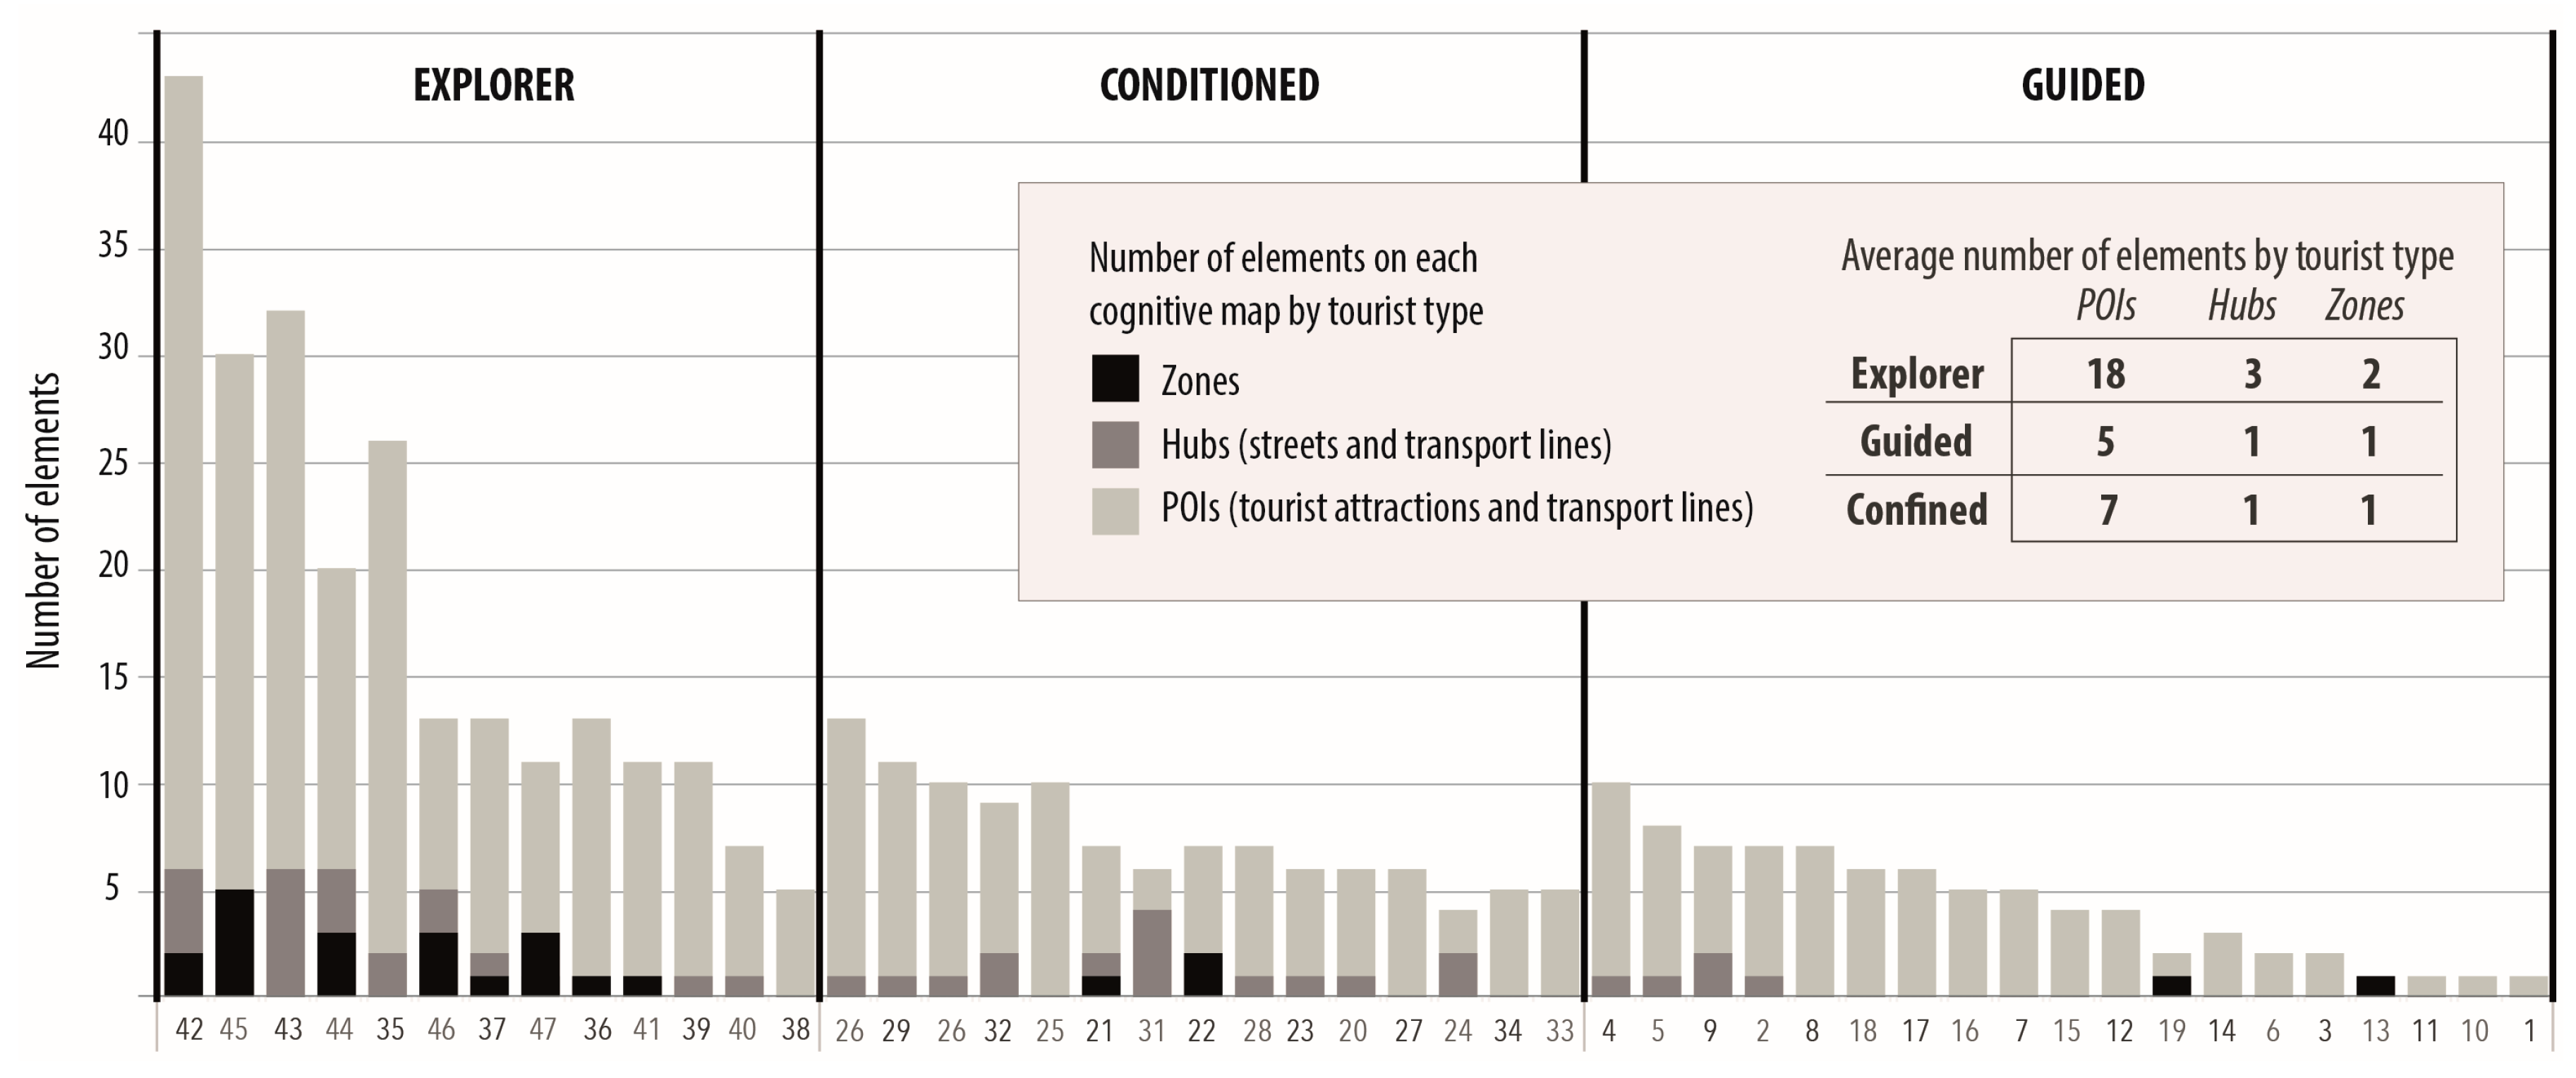
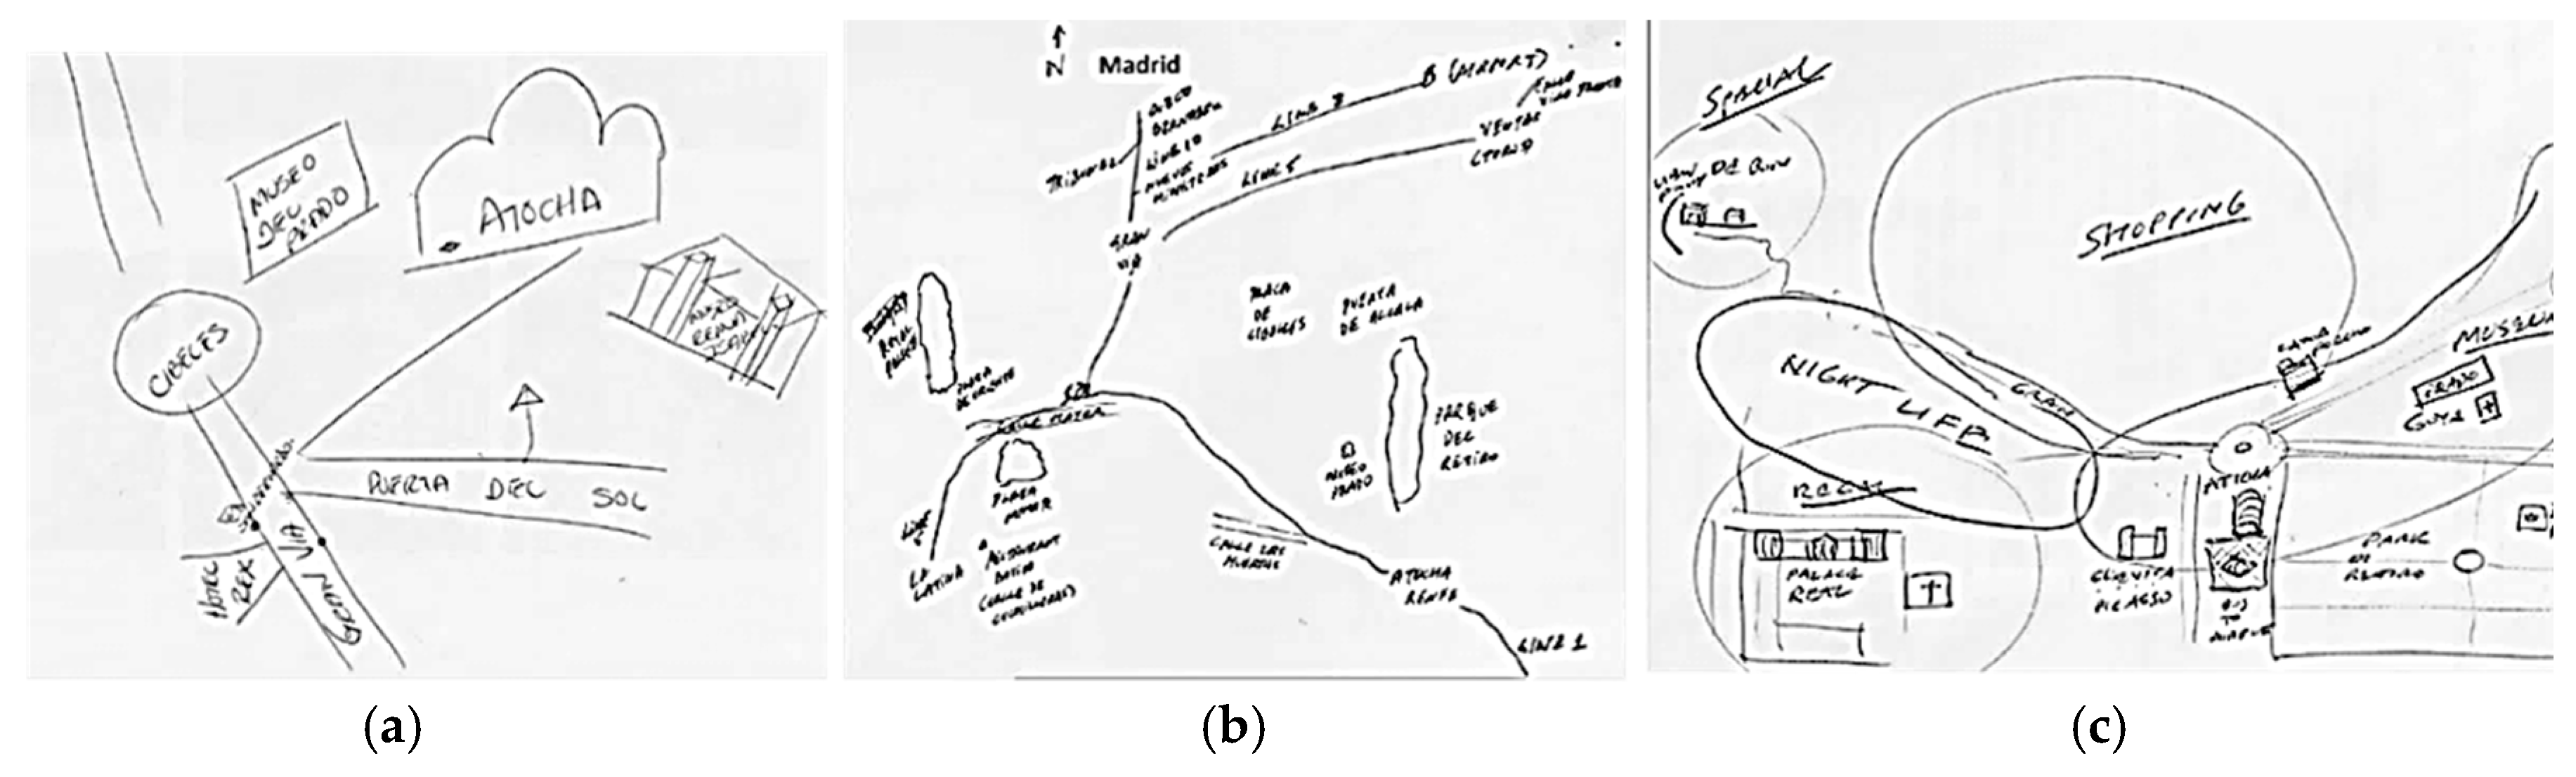
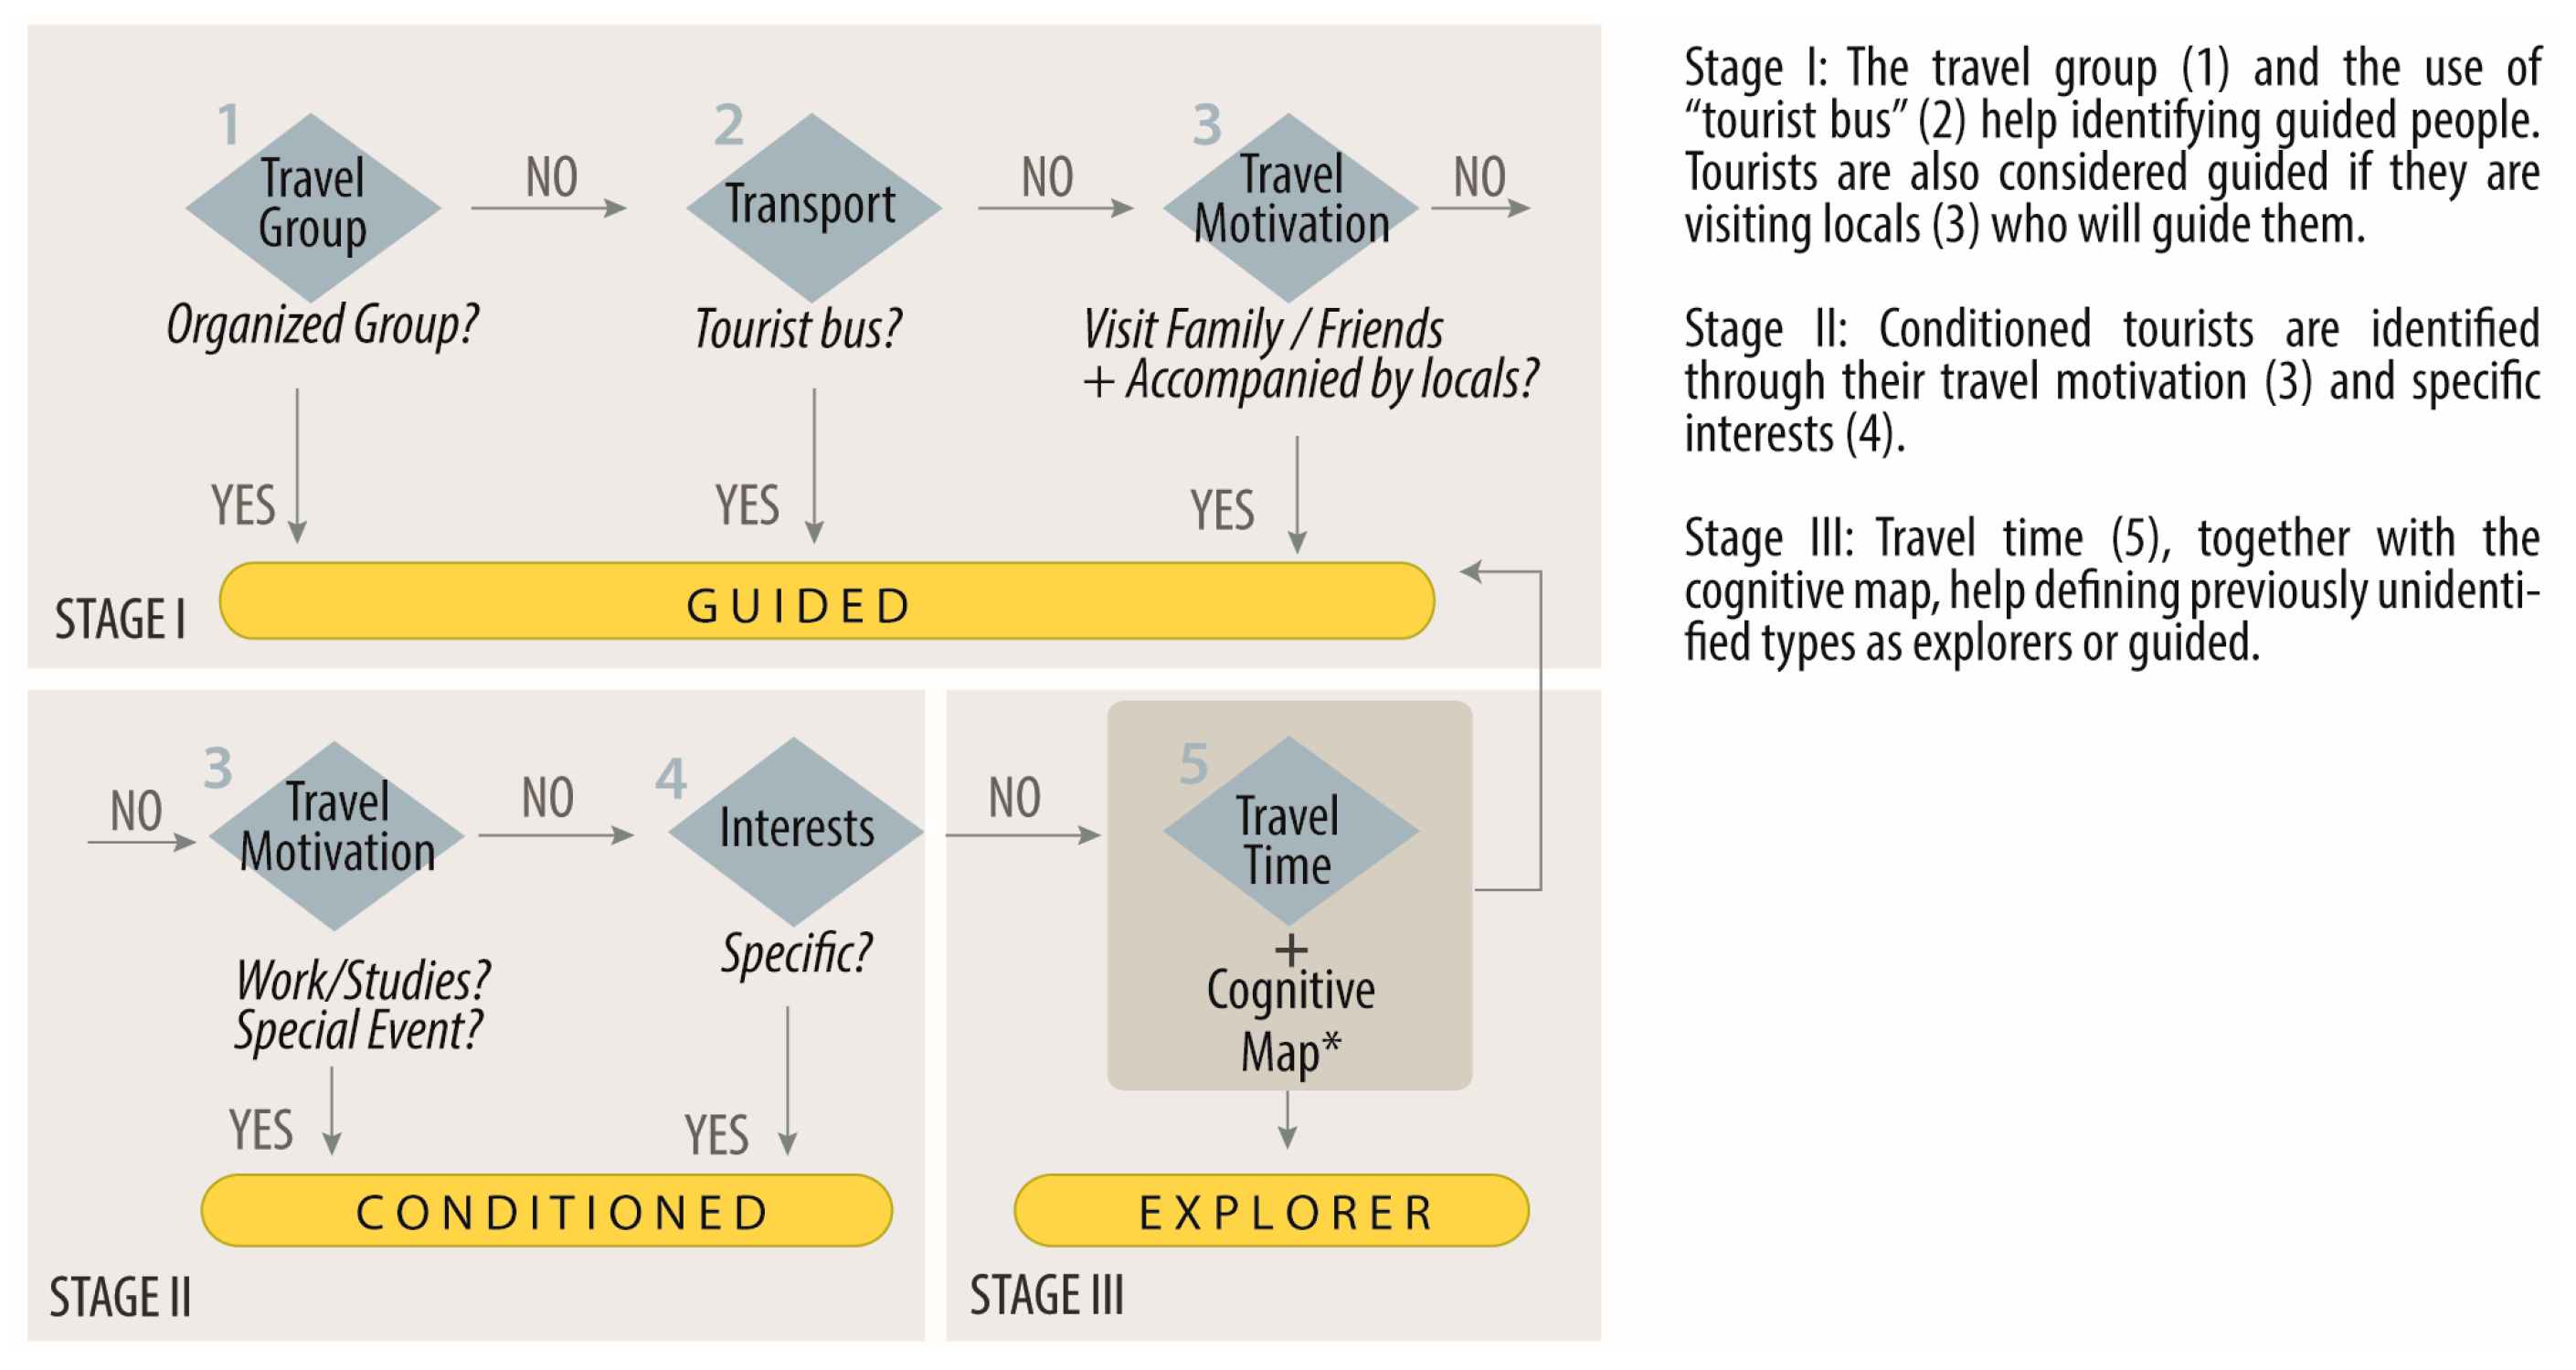
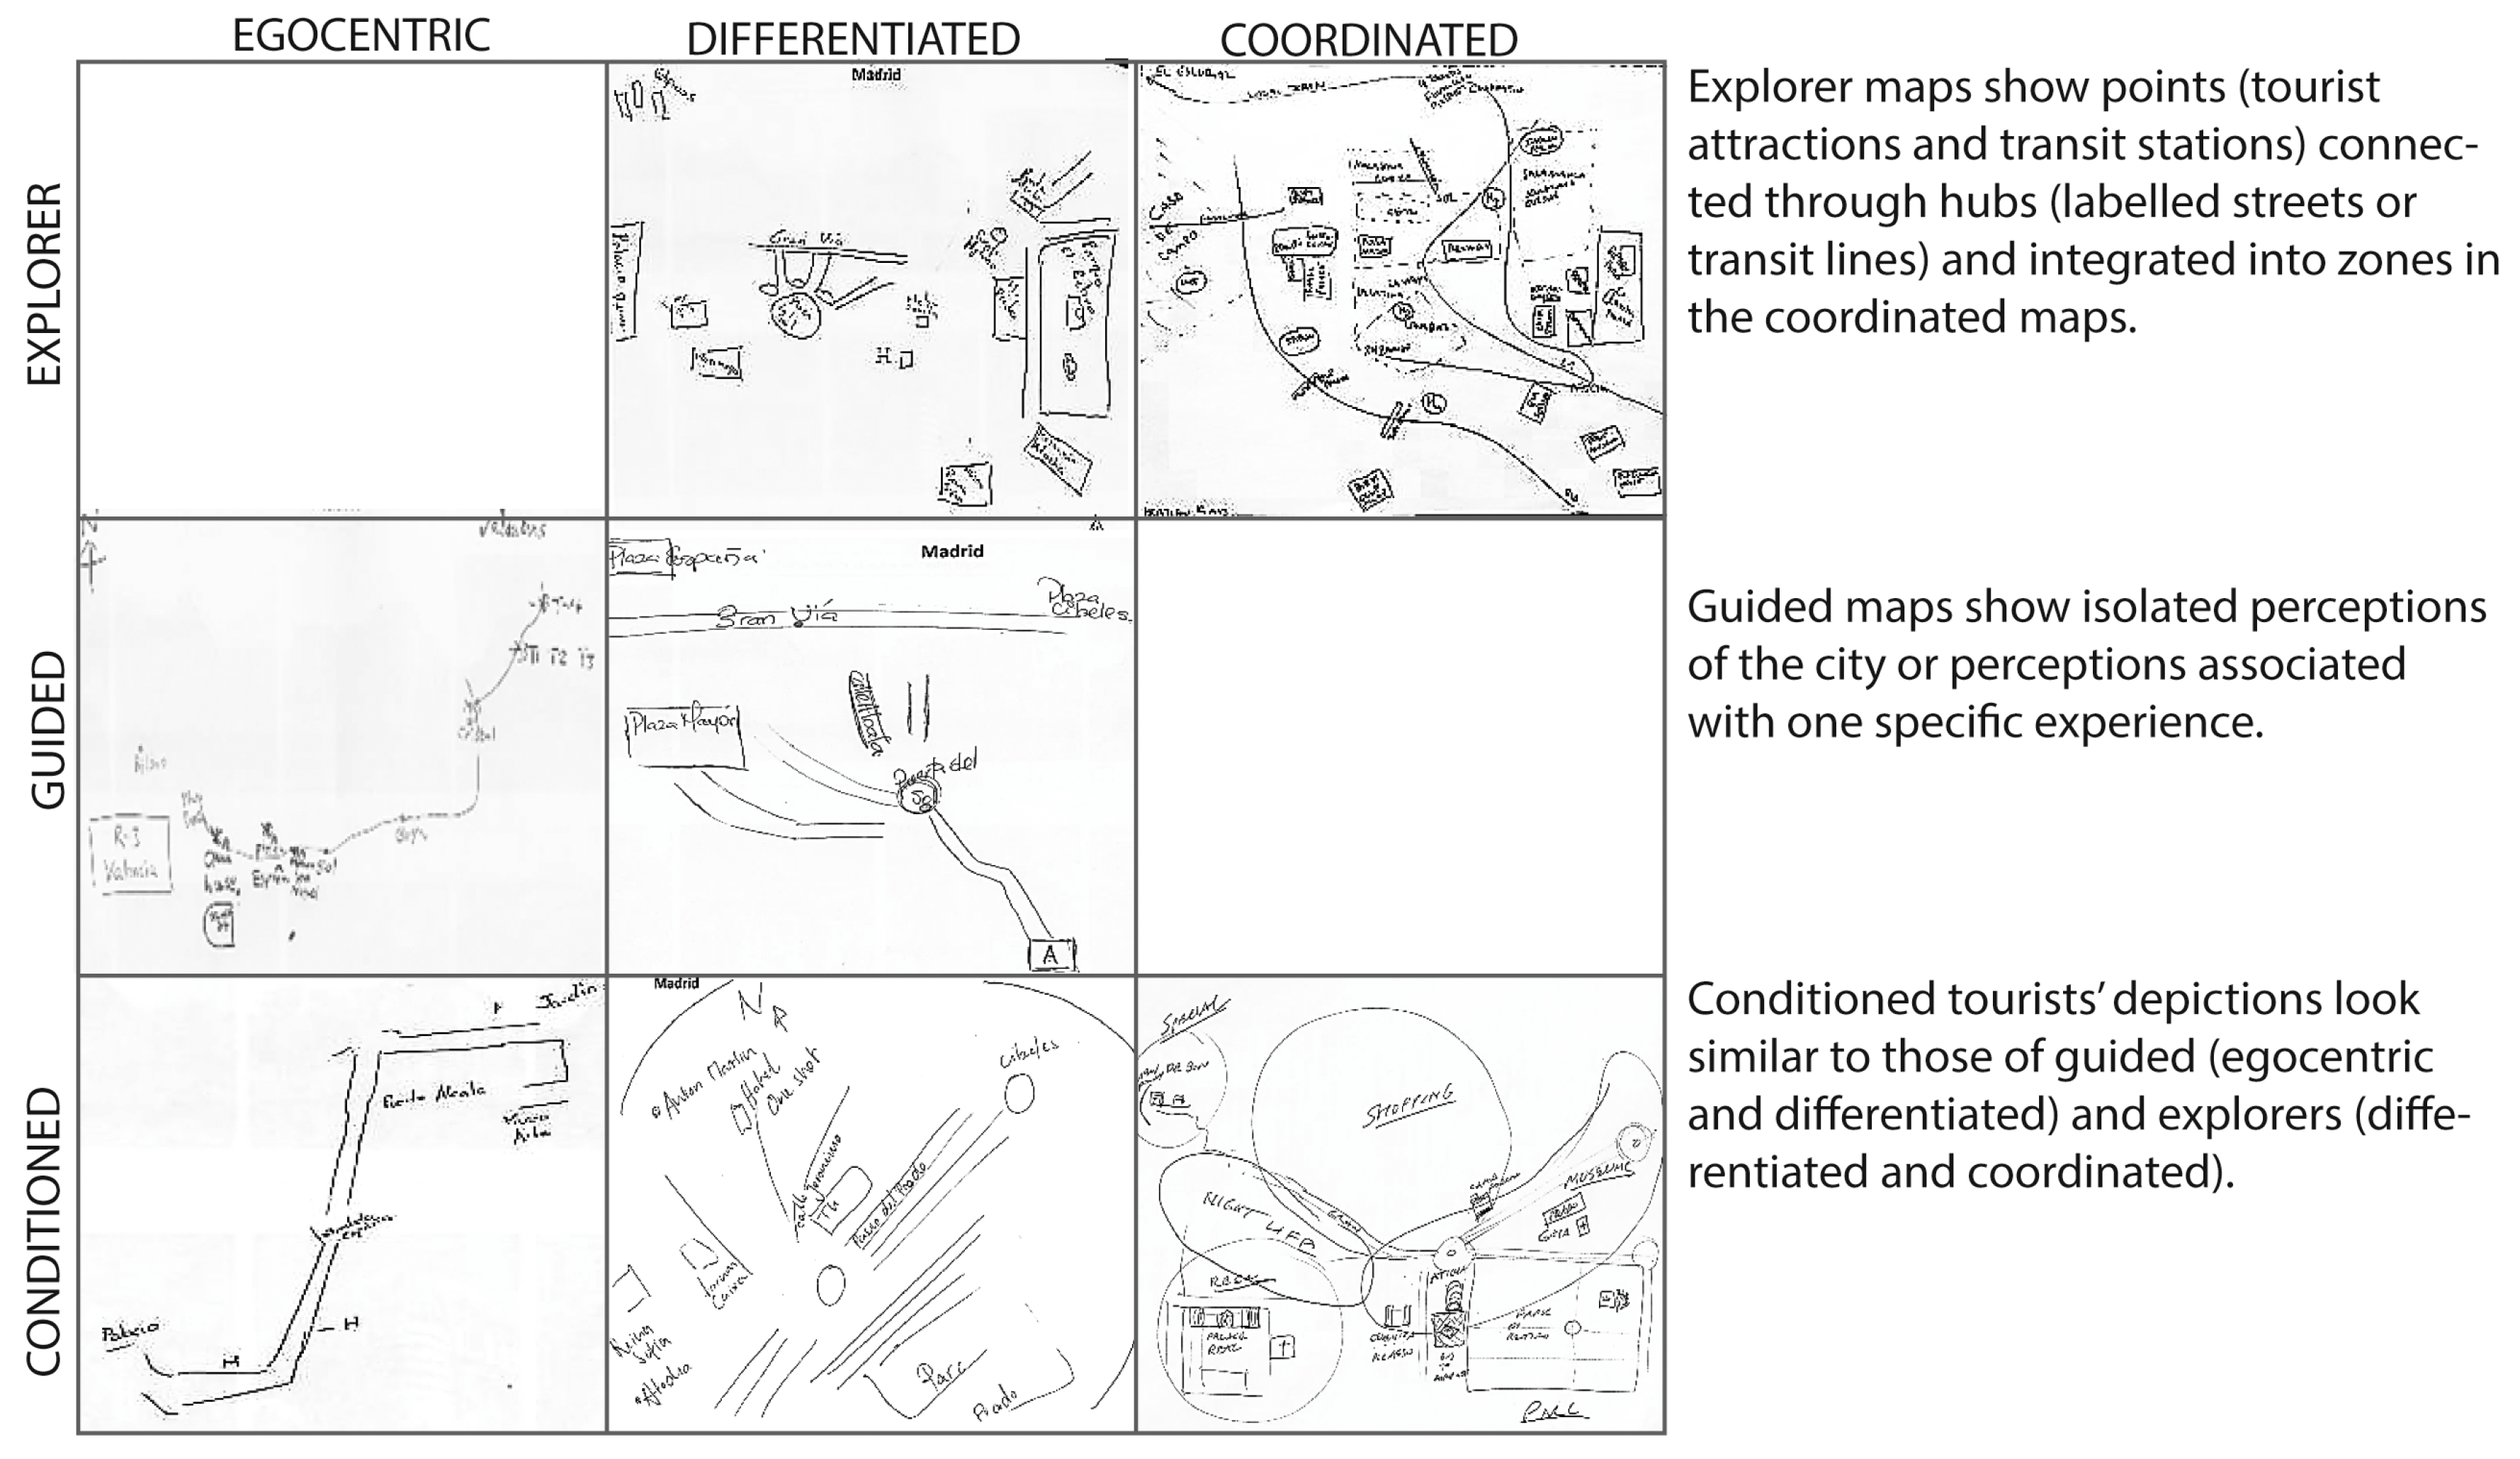
- Guided: These tourists value simplicity and convenience above all. They do not travel alone and let others guide them, delegating decision-making to another member of their traveling group. Their sketches include few POIs, and hubs (named streets or transport lines) and zones are almost non-existent (Figure 8). The maps reflect isolated perceptions of the city, usually associated with one or two specific travel experiences, e.g., as in a tourist bus tour. The positioning of graphical elements bears little to no resemblance to their real locations (Figure 9).
- Explorer: These tourists are interested in learning about the real essence of the city, finding locations that do not belong to typical tourist attractions, and in fully immersing in the local culture. They travel alone or with others, but never in organized groups, and they walk a lot during their visit and take public transport. Their sketches show an organized structure of the city with a large and varying number of features (Figure 8), with a relatively good resemblance to their real locations, especially compared to the sketches of the other types of tourists (Figure 9).
- Conditioned: The experience of these tourists is characterized by time and/or location constraints, due to work commitments or specific interests, e.g., watching a concert or sporting event. Their behavior can be similar to the Explorers (walking around the city, seeking contact with locals) or to the Guided (visiting the city on a tourist bus). The average number of features in their sketches fall in between the two other types (Figure 8 and Figure 9).
4. Discussion
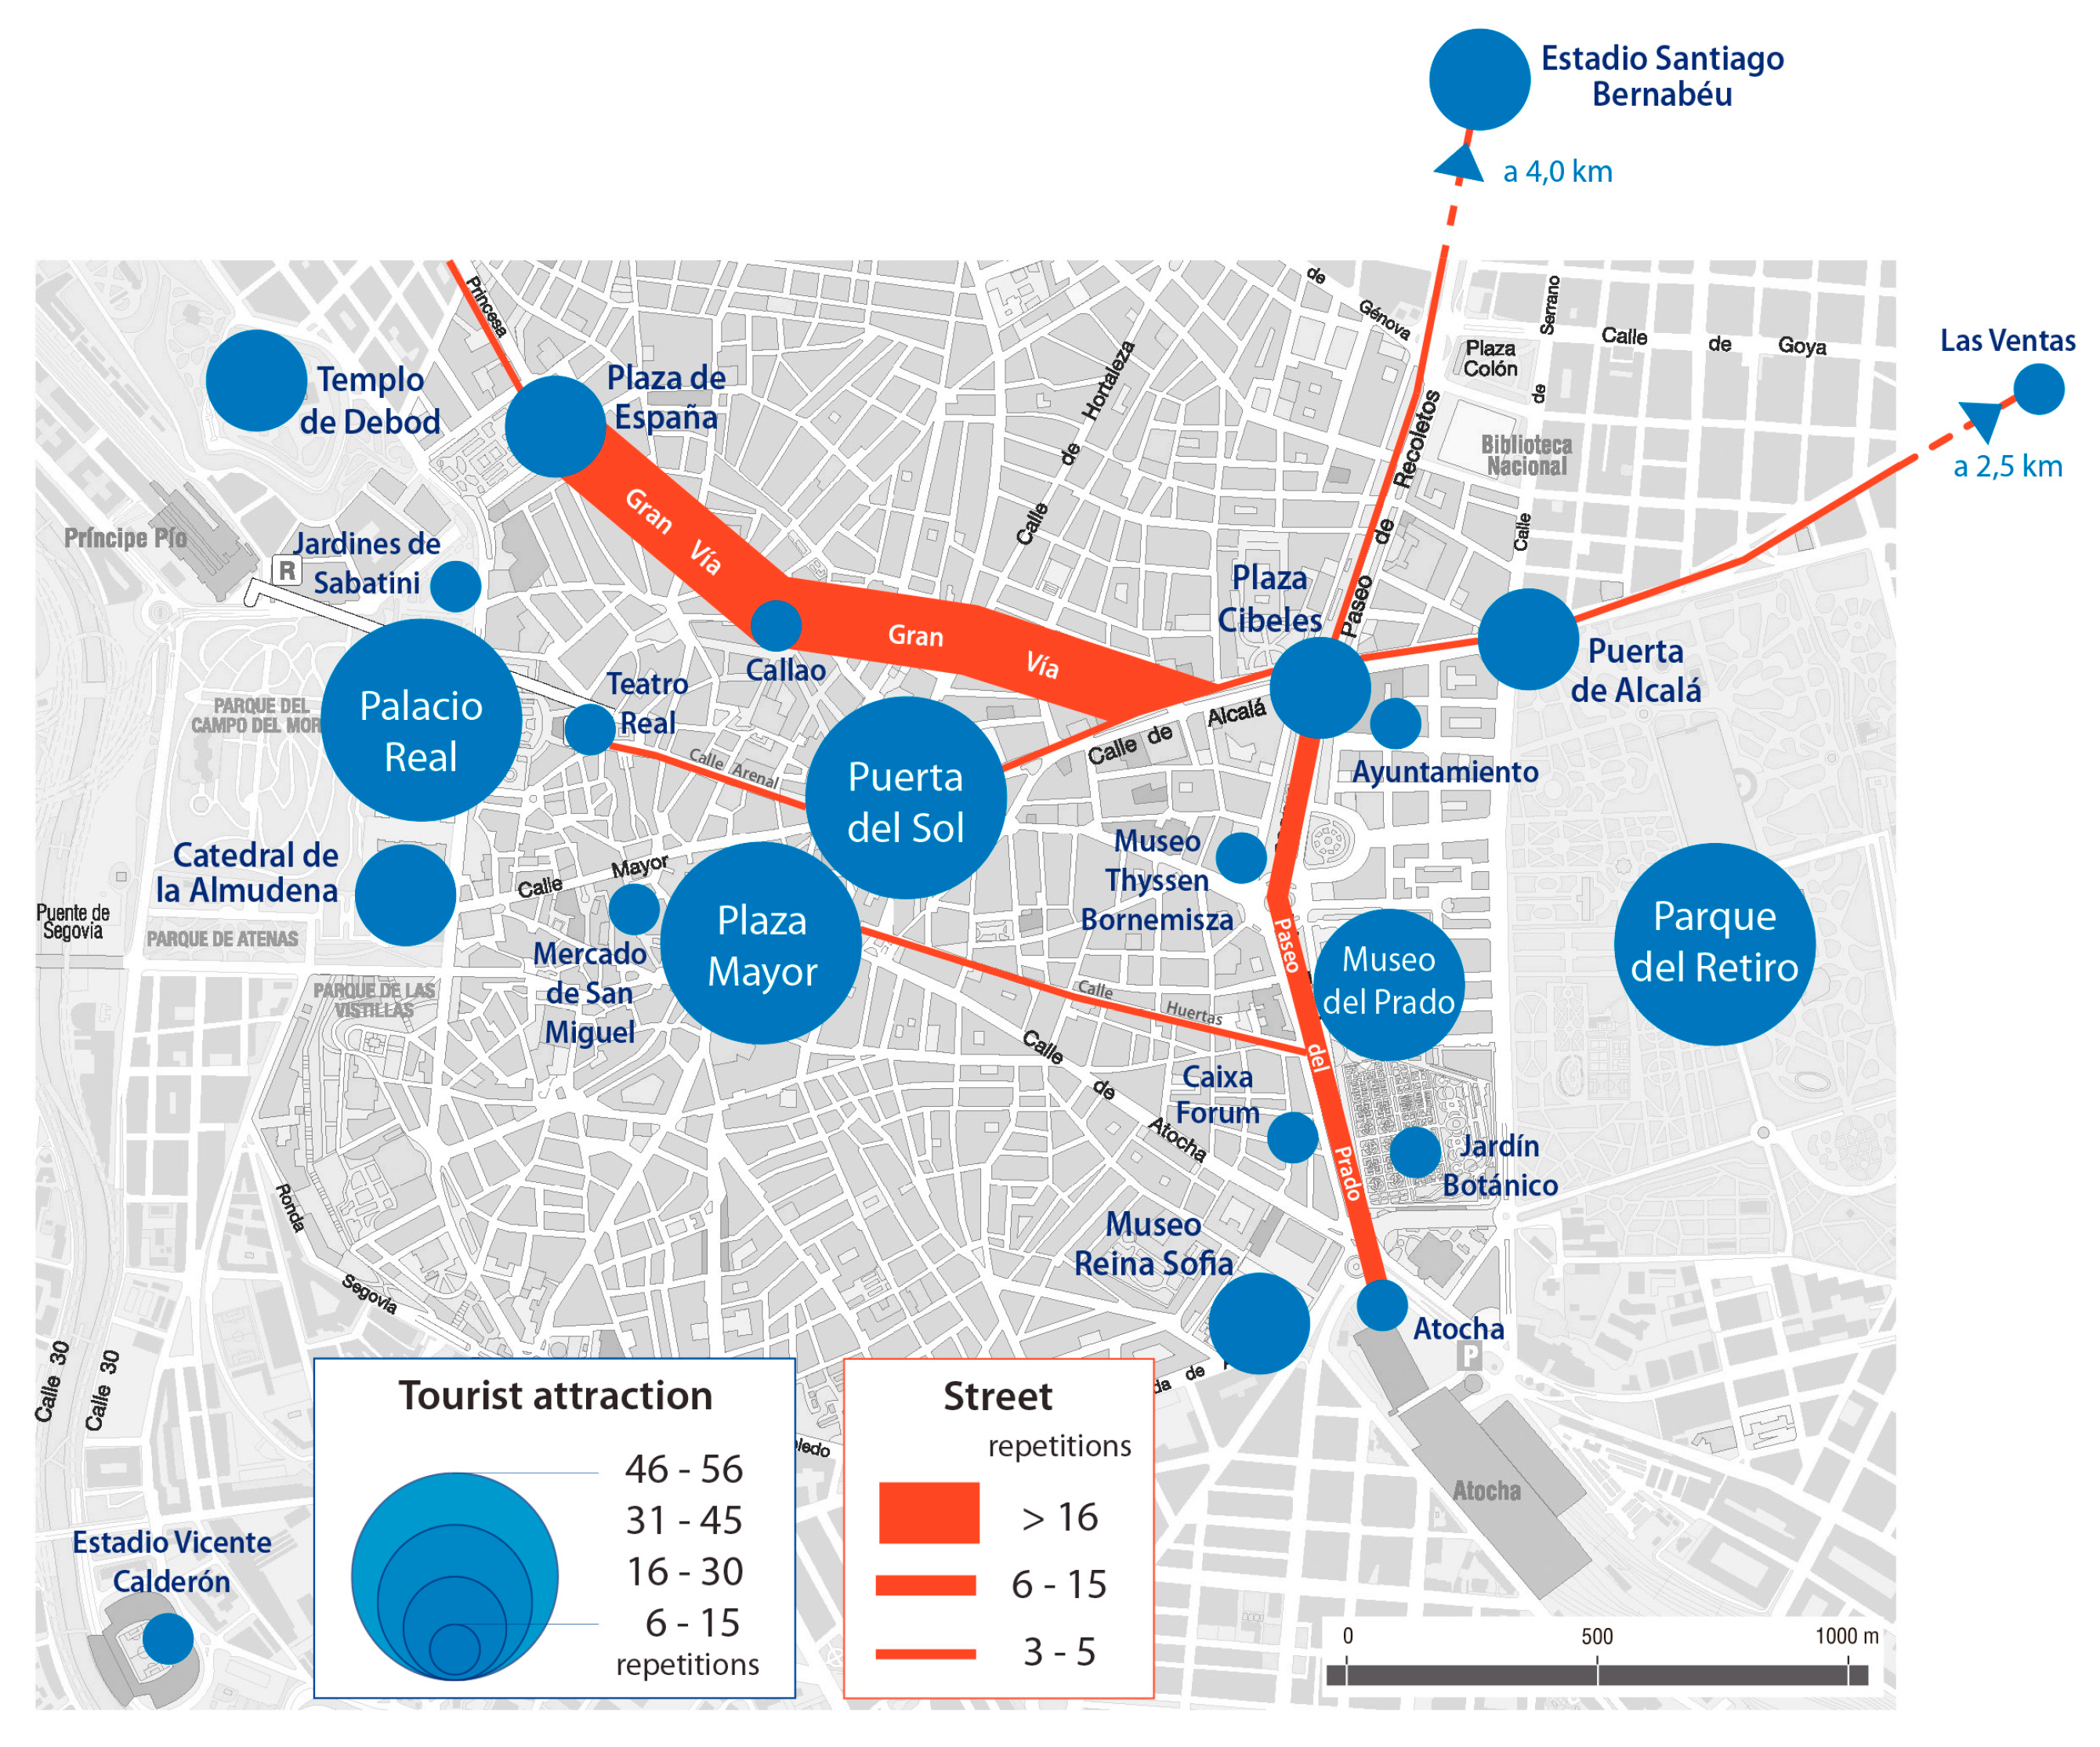
- For all maps: The map content should integrate the main features included in the collective conception that tourists have of Madrid (Figure 4) to help tourists make sense of the city. These features will have customized icons similar to the 2D and 2.5D depictions drawn in the tourists’ sketches (Figure 5a).
- For tourist-type maps: The map content for each tourist type will take into account the average number of features and the most evolved reference system used in the sketches of the respective tourist type, i.e., differentiated for Guided tourists, coordinated for Explorers, and either coordinated or differentiated for Conditioned tourists (Figure 8 and Figure 9).
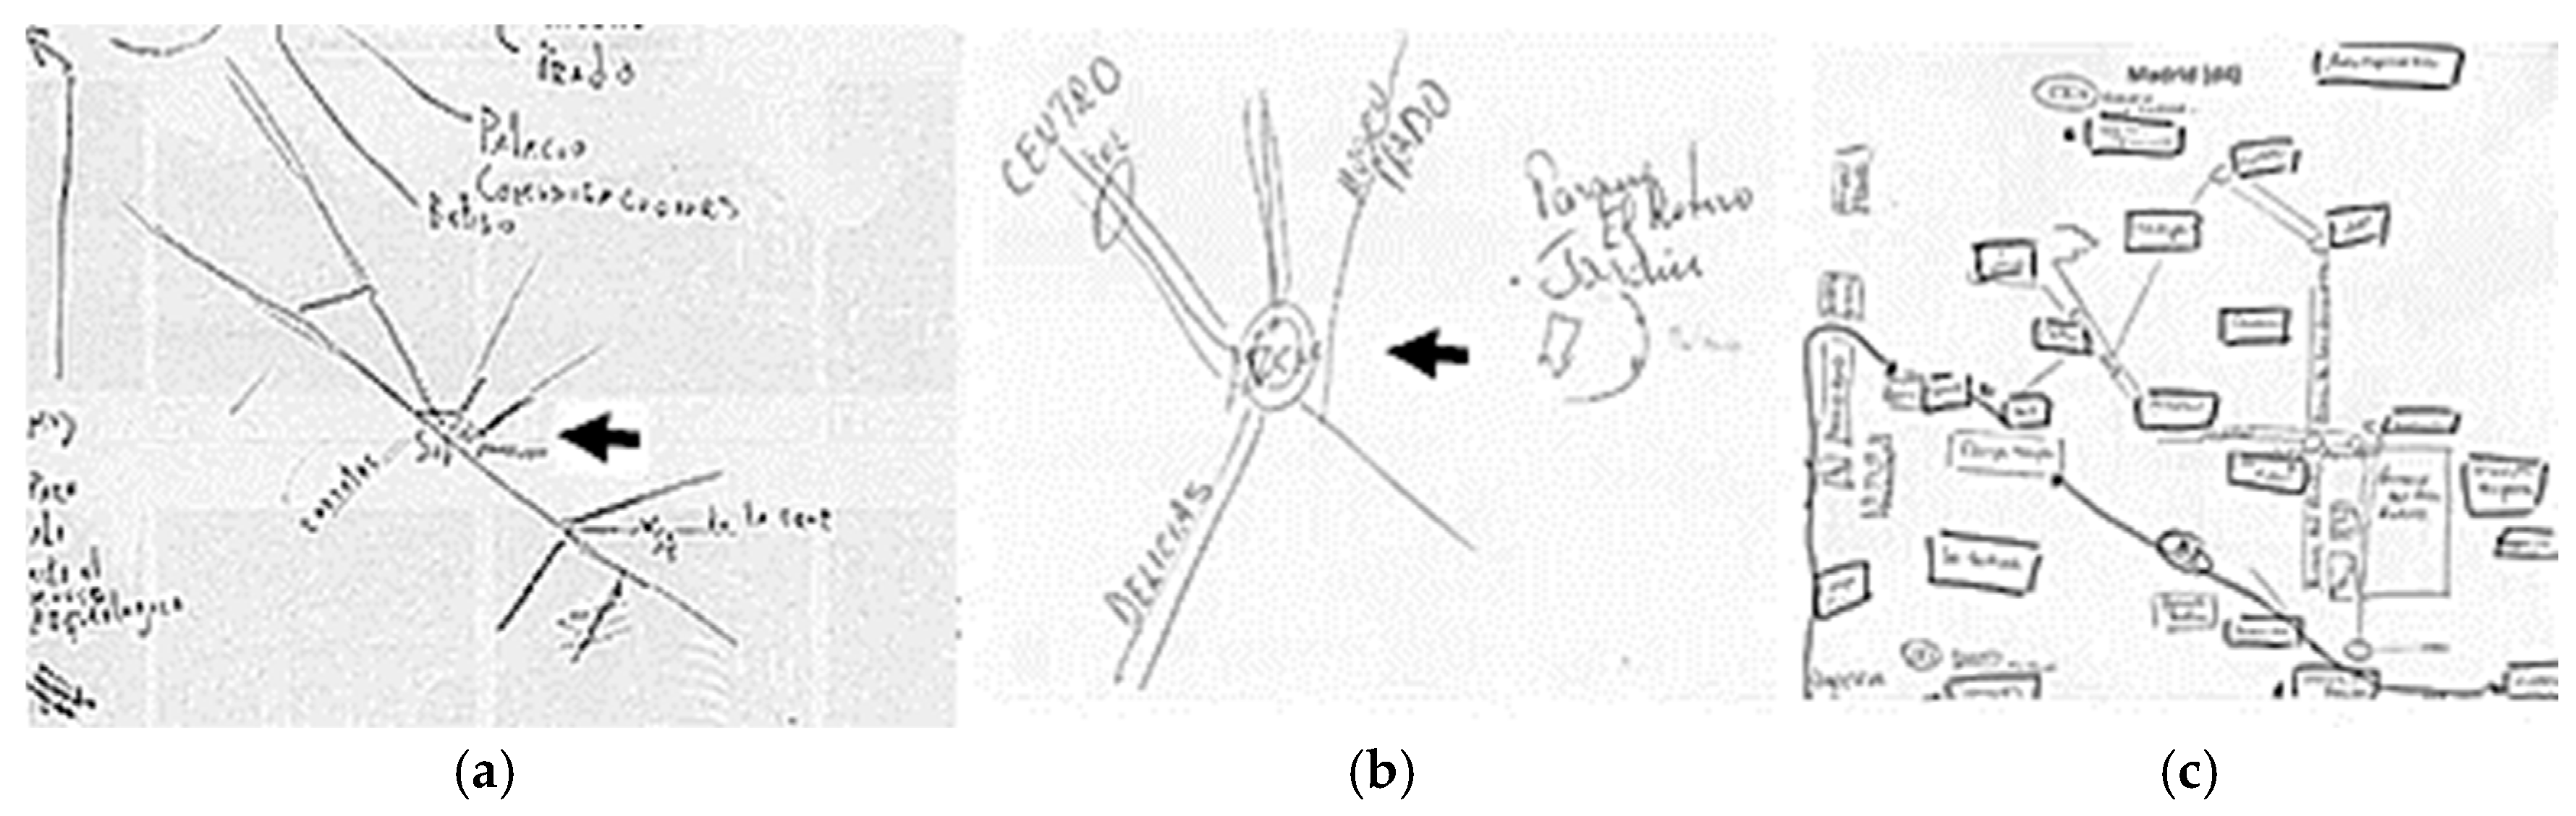
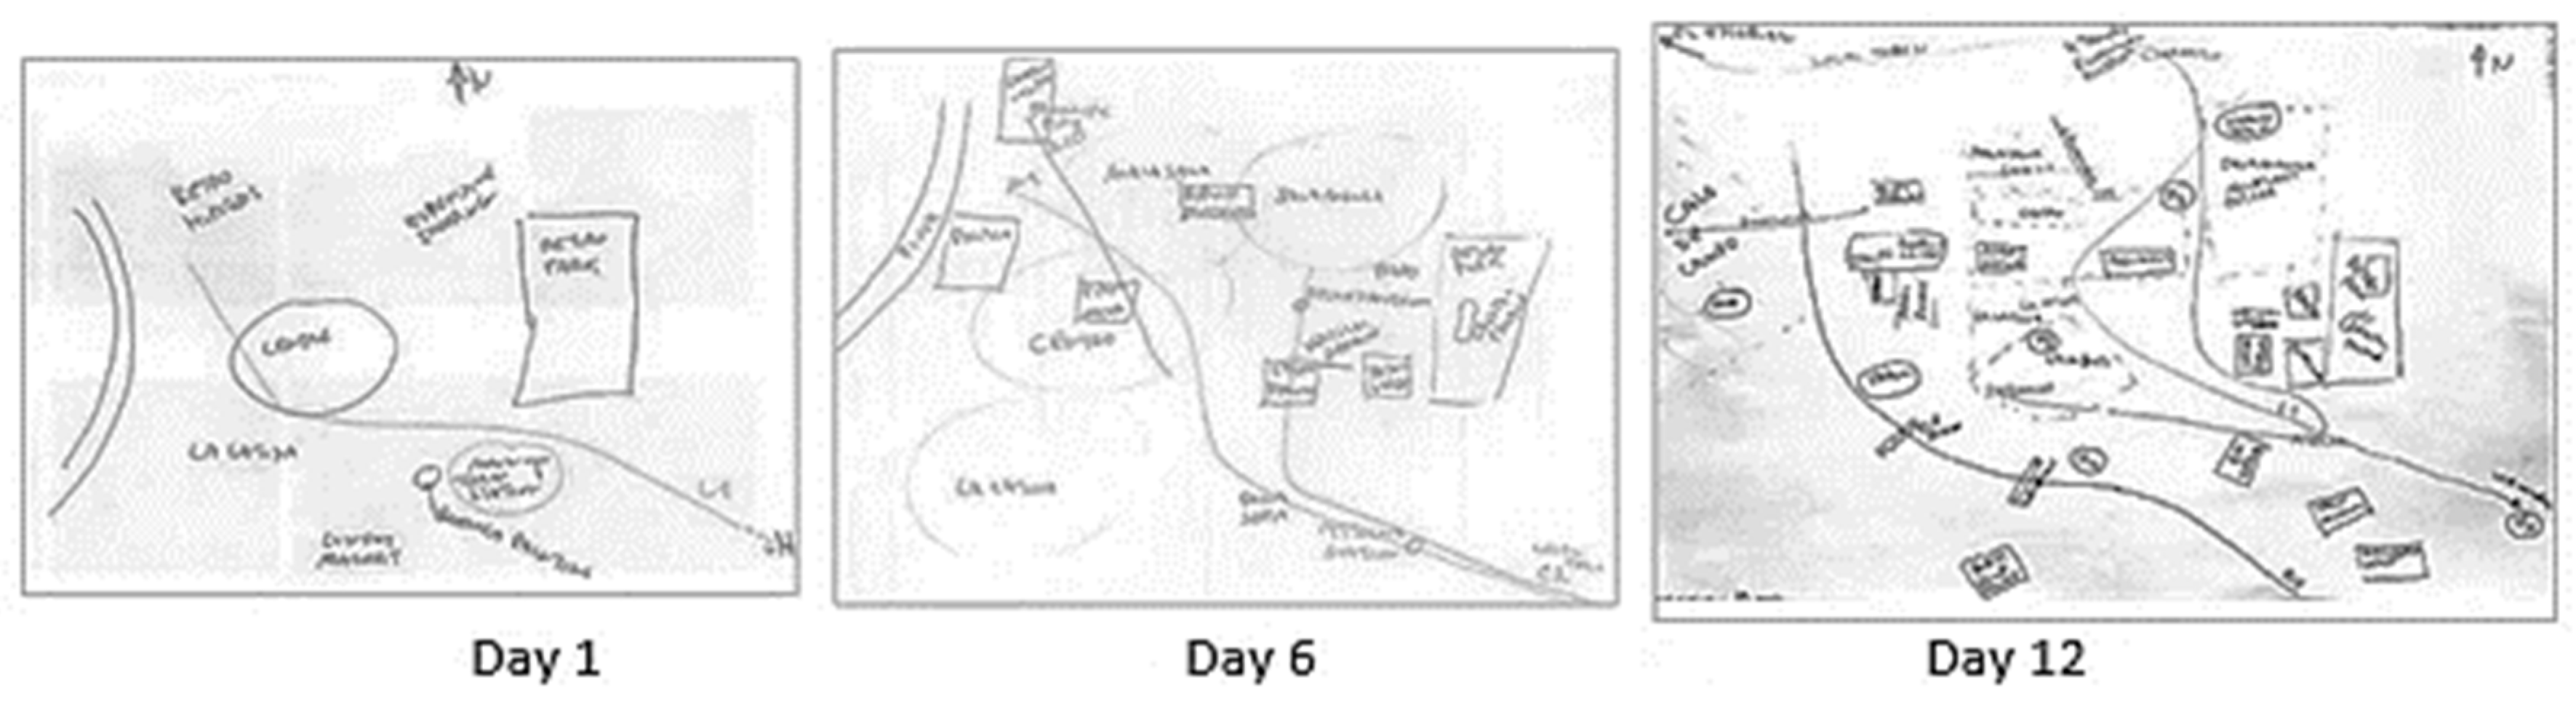
- For individual maps: The map content will gradually integrate new features as the tourist accomplishes spatial tasks. This guideline is to ensure the function of the map as an interface between the tourist and the city, in coherence with the evolution of tourists’ sketches through time (Figure 10). Key POIs for the experience of the tourist will be added to the map. They include those where the tourist stayed longer or visited more than once, as well as POIs evaluated especially positively or photographed profusely. Similarly, the transport lines and city zones most relevant to the tourist’s experience will also be included in the map (Figure 5b,c). Each tourist map will be a unique “here and now” map.
5. Conclusions
Author Contributions
Funding
Acknowledgments
Conflicts of Interest
References
- Ballatore, A.; Bertolotto, M. Personalizing maps. Commun. ACM 2015, 58, 68–74. [Google Scholar] [CrossRef]
- Kubíček, P.; Kozel, J. Cartographic techniques for adaptive emergency mapping. In Risk Models and Applications; Kremers, H., Susini, A., Eds.; Lecture Notes in Information, Science; Codata: Berlin, Germany, 2010; pp. 49–62. [Google Scholar]
- Friedmannová, L.; Konečný, M.; Staněk, K. An Adaptive Cartographic Visualisation for Support of the crisis management. In Proceedings of AutoCarto; Cartography and Geographic Information Society: Vancouver, BC, Canada, 2006; pp. 100–105. [Google Scholar]
- Reichenbacher, T. Adaptive egocentric maps for mobile users. In Map-Based Mobile Services; Meng, L., Zipf, A., Reichenbacher, T., Eds.; Springer: Heidelberg, Germany, 2005; pp. 141–158. [Google Scholar]
- Karimi, H.A.; Zhang, L.; Benner, J.G. Personalized accessibility map (PAM): A novel assisted wayfinding approach for people with disabilities. Ann. GIS 2014, 20, 99–108. [Google Scholar] [CrossRef]
- Zipf, A. User-Adaptive Maps for Location-Based Services (LBS) for Tourism. In Information and Communication Technologies in Tourism; Wöber, K., Frew, A.J., Hitz, M., Eds.; Springer: Vienna, Austria, 2002. [Google Scholar]
- Aissi, S.; Gouider, M. Personalization in Geographic information systems: A survey. Int. J. Comput. Sci. Issues 2012, 9, 291–298. [Google Scholar]
- Gervais, E.; Liu, H.; Nussbaum, D.; Roh, Y.S.; Sack, J.R.; Yi, J. Intelligent map agents—An ubiquitous personalized GIS. ISPRS J. Photogramm. Remote Sens. 2007, 62, 347–365. [Google Scholar] [CrossRef]
- Niaraki, A.; Kim, K. Ontology based personalized route planning system using a multi-criteria decision making approach. Expert Syst. Appl. 2009, 36, 2250–2259. [Google Scholar] [CrossRef]
- Kabassi, K. Personalizing recommendations for tourists. Telemat. Inf. 2010, 27, 51–66. [Google Scholar] [CrossRef]
- Berendt, B.; Barkowsky, T.; Freksa, C.; Kelter, S. Spatial representation with aspect maps. In Spatial Cognition—An Interdisciplinary Approach to Representing and Processing Spatial Knowledge; Freksa, C., Habel, C., Wender, K.F., Eds.; Springer: Berlin, Germany, 1998; pp. 313–336. [Google Scholar]
- Freksa, C. Spatial aspects of task-specific wayfinding maps. In Visual and Spatial Reasoning in Design, Key Centre of Design Computing and Cognition; Tversky, B., Gero, J.S., Eds.; University of Sydney: Sydney, Australia, 1999; pp. 15–32. [Google Scholar]
- Sarjakoski, L.T.; Sarjakoski, T. User Interfaces and Adaptive Maps. In Encyclopedia of GIS; Shekhar, S., Xiong, H., Eds.; Springer: New York, NY, USA, 2008; pp. 1205–1212. [Google Scholar]
- Griffin, A.L.; White, T.; Fish, C.; Tomio, B.; Huang, H.; Sluter, C.R.; Bravo, J.V.M.; Fabrikant, S.I.; Bleisch, S.; Yamada, M.; et al. Designing across map use contexts: A research agenda. Int. J. Cartogr. 2017, 3, 90–114. [Google Scholar] [CrossRef]
- Reichenbacher, T. Mobile Cartography—Adaptive Visualisation of Geographic Infor-Mation on Mobile Devices; Verlag Dr. Hut: München, Germany, 2004; ISBN 3-89963-048-3. [Google Scholar]
- Reichenbacher, T. Adaptation in mobile and ubiquitous cartography. In Multimedia Cartography; Cartwright, W., Peterson, M.P., Gartner, G., Eds.; Springer: Heidelberg, Germany, 2007; pp. 383–397. [Google Scholar]
- Nivala, A.M.; Sarjakoski, L.T. Adapting map symbols for mobile users. In Proceedings of the 22th International Cartographic Conference Mapping Approaches into a Changing World, A Coruña, Spain, 9–16 July 2005. [Google Scholar]
- Fischer, G. User Modeling in Human-Computer Interaction. User Model. User-Adapt. Interact. 2001, 11, 65–86. [Google Scholar] [CrossRef]
- Fink, J.; Kobsa, A. User Modeling for Personalized City Tours. Artif. Intell. Rev. 2002, 18, 33–74. [Google Scholar] [CrossRef]
- Wilson, D.; Bertolotto, M.; Weakliam, J. Personalizing map content to improve task completion efficiency. Int. J. Geogr. Inf. Sci. 2010, 24, 741–760. [Google Scholar] [CrossRef]
- Thoresen, J.; Francelet, R.; Coltekin, A.; Richter, K.; Fabrikant, S. Not all anxious individuals get lost: Trait anxiety and mental rotation ability interact to explain performance in map-based route learning in men. Neurobiol. Learn. Mem. 2016, 132, 1–8. [Google Scholar] [CrossRef] [PubMed]
- Downs, R.M.; Stea, D. Cognitive maps and spatial behavior: Process and products. In Image and Environment; Stea, D., Downs, R.M., Stea, D., Eds.; Aldine Publishing Co.: Chicago, IL, USA, 1973; pp. 8–26. [Google Scholar]
- Lynch, K. The Image of the City; MIT Press: Cambridge, UK, 1960; 196p. [Google Scholar]
- Appleyard, D. Styles and methods of structuring a city. Environ. Behav. 1970, 2, 100–118. [Google Scholar] [CrossRef]
- Milgram, S. The Individual in a Social World: Essays and Experiments; Addison-Wesley: New York, NY, USA, 1977. [Google Scholar]
- Evans, G. Environmental cognition. Psychol. Bull. 1980, 88, 259. [Google Scholar] [CrossRef]
- Garling, E.; Golledge, R. Cognitive mapping and spatial decision-making. In Cognitive Mapping: Past, Present, and Future; Kitchin, R., Freundschuh, S., Eds.; Routledge: London, UK; New York, NY, USA, 2000; pp. 44–65. [Google Scholar]
- Vertesi, J. Mind the Gap: The London Underground Map and Users’ Representations of Urban Space. Soc. Stud. Sci. 2008, 38, 7–33. [Google Scholar] [CrossRef]
- Thommen, E.; Avelar, S.; Zbinden Sapin, V.; Perrenoud, S.; Malatesta, D. Mapping the journey from home to school: A study on children’s representation of space. Int. Res. Geogr. Environ. Educ. 2010, 19, 191–205. [Google Scholar] [CrossRef]
- Mooney, P.; Winstanley, A. Cognitive Issues for Human Readers: Internet-based Transport maps. GIM Int. 2001, 15, 13–15. [Google Scholar]
- Avelar, S.; Hurni, L. On the Design of Schematic Transport Maps. Cartogr. Int. J. Geogr. Inf. Geovis. 2006, 41, 217–228. [Google Scholar] [CrossRef]
- Downs, R.; Stea, D. Maps in Minds: Reflections on Cognitive Mapping; Harper & Row: New York, NY, USA, 1977. [Google Scholar]
- Roth, R.E.; Çöltekin, A.; Delazari, L.; Filho, H.F.; Griffin, A.; Hall, A.; van Elzakker, C.P. User studies in cartography: Opportunities for empirical research on interactive maps and visualizations. Int. J. Cartogr. 2017, 3, 61–89. [Google Scholar] [CrossRef]
- Caquard, S. Cartography III: A post-representational perspective on cognitive cartography. Prog. Hum. Geogr. 2015, 39, 225–235. [Google Scholar] [CrossRef]
- Hirtle, S.C.; Raubal, M. Many to Many Mobile Maps. In Cognitive and Linguistic Aspects of Geographic Space. Lecture Notes in Geoinformation and Cartography; Raubal, M., Mark, D., Frank, A., Eds.; Springer: Berlin/Heidelberg, Germany, 2013; pp. 141–157. [Google Scholar] [Green Version]
- Klippel, A.; Lee, P.U.; Fabrikant, S.I.; Montello, D.R.; Bateman, J. The cognitive conceptual approach as a leitmotif for map design. In Reasoning with Mental and External Diagrams: Computational Modeling and Spatial Assistance; Menlo, P., Ed.; AAAI Press: Stanford, CA, USA, 2005; pp. 90–95. [Google Scholar]
- Wood, D.; Beck, R. Tour personality: The interdependence of environmental orientation and interpersonal behavior. J. Environ. Psychol. 1990, 10, 177–207. [Google Scholar] [CrossRef]
- Look, G.; Shrobe, H. Towards intelligent mapping applications: A study of elements found in cognitive maps. In Proceedings of the 12th International Conference on Intelligent User Interfaces, Honolulu, HI, USA, 28–31 January 2007; ACM Press: New York, NY, USA, 2007; pp. 309–312. [Google Scholar]
- Moore, G.T. Developmental differences in environmental cognition. Environ. Des. Res. 1973, 2, 232–239. [Google Scholar]
- Moore, G.T. The development of environmental knowing: An overview of an interactional-consructivist theory and some data on within-individual development variations. In Psycology and the Built Environment; Canter, D., Lee, T., Eds.; Architectural Press: London, UK, 1974; pp. 184–194. [Google Scholar]
- Moore, G. Theory and research on the development of environmental knowing. In Environ Knowing; Moore, G.T., Golledge, R.G., Eds.; Dowden, Hutchinson & Ross: Strondsberg, PA, USA, 1976; pp. 138–164. [Google Scholar]
- Moore, G. Knowing about environmental knowing the current state of theory and research on environmental cognition. Environ. Behav. 1979, 11, 33–70. [Google Scholar] [CrossRef]
- Shelton, A.; McNamara, T. Systems of spatial reference in human memory. Cogn. Psychol. 2001, 43, 274–310. [Google Scholar] [CrossRef] [PubMed]
- McNamara, T.; Rump, B.; Werner, S. Egocentric and geocentric frames of reference in memory of large-scale space. Psychon. Bull. Rev. 2003, 10, 589–595. [Google Scholar] [CrossRef] [PubMed] [Green Version]
- Zhong, J.; Kozhevnikov, M. Relating allocentric and egocentric survey-based representations to the self-reported use of a navigation strategy of egocentric spatial updating. J. Environ. Psychol. 2016, 46, 154–175. [Google Scholar] [CrossRef]
- Beck, R.J.; Wood, D. Cognitive transformation of information from urban geographic fields to mental maps. Environ. Behav. 1976, 8, 199–238. [Google Scholar] [CrossRef]
- Dziekan, K. Ease-of-Use in Public Transportation: A User Perspective on Information and Orientation Aspects. Ph.D. Thesis, KTH, Royal Institute of Technology Stockholm, Stockholm, Sweden, 2008. [Google Scholar]
- Slocum, T.A.; Blok, C.; Jiang, B.; Koussoulakou, A.; Montello, D.R.; Fuhrmann, S.; Hedley, N.R. Cognitive and usability issues in geovisualization. Cartogr. Geogr. Inf. Sci. 2001, 28, 61–75. [Google Scholar] [CrossRef]
- Guo, Z. Mind the map! The impact of transit maps on path choice in public transit. Transport. Res. Part A Policy Pract. 2011, 45, 625–639. [Google Scholar] [CrossRef] [Green Version]
- Pearce, P.L. The Ulysses Factor; Springer: New York, NY, USA, 1988. [Google Scholar]
- Walmsley, D.J.J.; Jenkins, J.M.M. Tourism cognitive mapping of unfamiliar environments. Ann. Tour. Res. 1992, 19, 268–286. [Google Scholar] [CrossRef]
- Lew, A.; McKercher, B. Modeling tourist movements: A local destination analysis. Ann. Tour. Res. 2006, 33, 403–423. [Google Scholar] [CrossRef]
- White, T. User assessment methods in cartographic experiment design. In Proceedings of the Association of American Geographers Annual Meeting, Chicago, IL, USA, 21–25 April 2015. [Google Scholar]
- Holden, A. Tourism Studies and the Social Sciences; Routledge: London, UK, 2004. [Google Scholar]
- Lundy, L. Future Traveller Tribes 2030. Building a More Rewarding Journey; Frost & Sullivan Amadeus: San Antonio, TX, USA, 2015; Available online: http://www.amadeus.com/documents/future-traveller-tribes-2030/amadeus-traveller-tribes-2030-airline-it.pdf (accessed on 1 July 2018).
- Woodside, A.G.; Martin, D. (Eds.) Tourism Management: Analysis, Behaviour and Strategy; CABI: Wallingford, UK, 2008. [Google Scholar]
- García-Mas, A.; García-Mas, A. La Mente del Viajero; Thomson: Madrid, Spain, 2005. [Google Scholar]


| Tourist | Origin, Age, Gender | Stay (days) | Travel Motiv. | Travel Group | Transport Used | Profile |
|---|---|---|---|---|---|---|
| T1 | Mexico, 39, female | 8 | work | alone | on foot, taxi, tourist bus | Professional travelling alone for work (congress). She visited the city in her spare time guided by local friends. She also joined a tourist tour by bus provided by the congress organization. |
| T2 | Argentina, 30, male | 4 | holiday | couple | on foot, metro | Young couple with much experience travelling in South America together and on their own. They planned together the places to visit before they arrived, but also included spontaneous activities during their stay. They shared spatial tasks. |
| T3 | Argentina, 25, female | |||||
| T4 | UK, 34, male | 6 | work | alone | on foot, metro | Executive with large experience travelling alone. He came for a work course but also visited the city, looking for direct contact with the local culture. When his classes finished, he visited Madrid with colleagues, guiding them. |
| T5 | Denmark, 49, male | 12 | holiday | couple | mainly on foot | Professional with extensive travel experience, accompanied by his wife. He guided his wife, performing all spatial tasks. He looked for direct contact with local people, avoiding touristic places. |
| T6 | Denmark, 52, female | Housewife, always travels with her partner. She was guided by him throughout the trip and depended on him to get information and make spatial decisions. | ||||
| Final sketch | ||||||
 | ||||||
| Context of Use | ||||
|---|---|---|---|---|
| Tourist | Users Type | Interest of Users | Map Use Environment | Spatial Tasks |
| T1 | Guided | Museums and monuments | At home, not yet in Madrid, with no time pressure to complete spatial tasks, using a computer. | Check the travel plan sent by a tourist agent to visit Madrid for four days with a friend. |
| T2 | Explorer | Local gastronomy, music, and arts | At the hotel, after three days in Madrid, with no time pressure to complete spatial tasks, using a tablet. | Get an overview of the places already visited and check new suggestions of restaurants, and music- and art-related places to visit. |
| Map Design Decisions | |||
|---|---|---|---|
| Tourist | Guideline 1 | Guideline 2 | Guideline 3 |
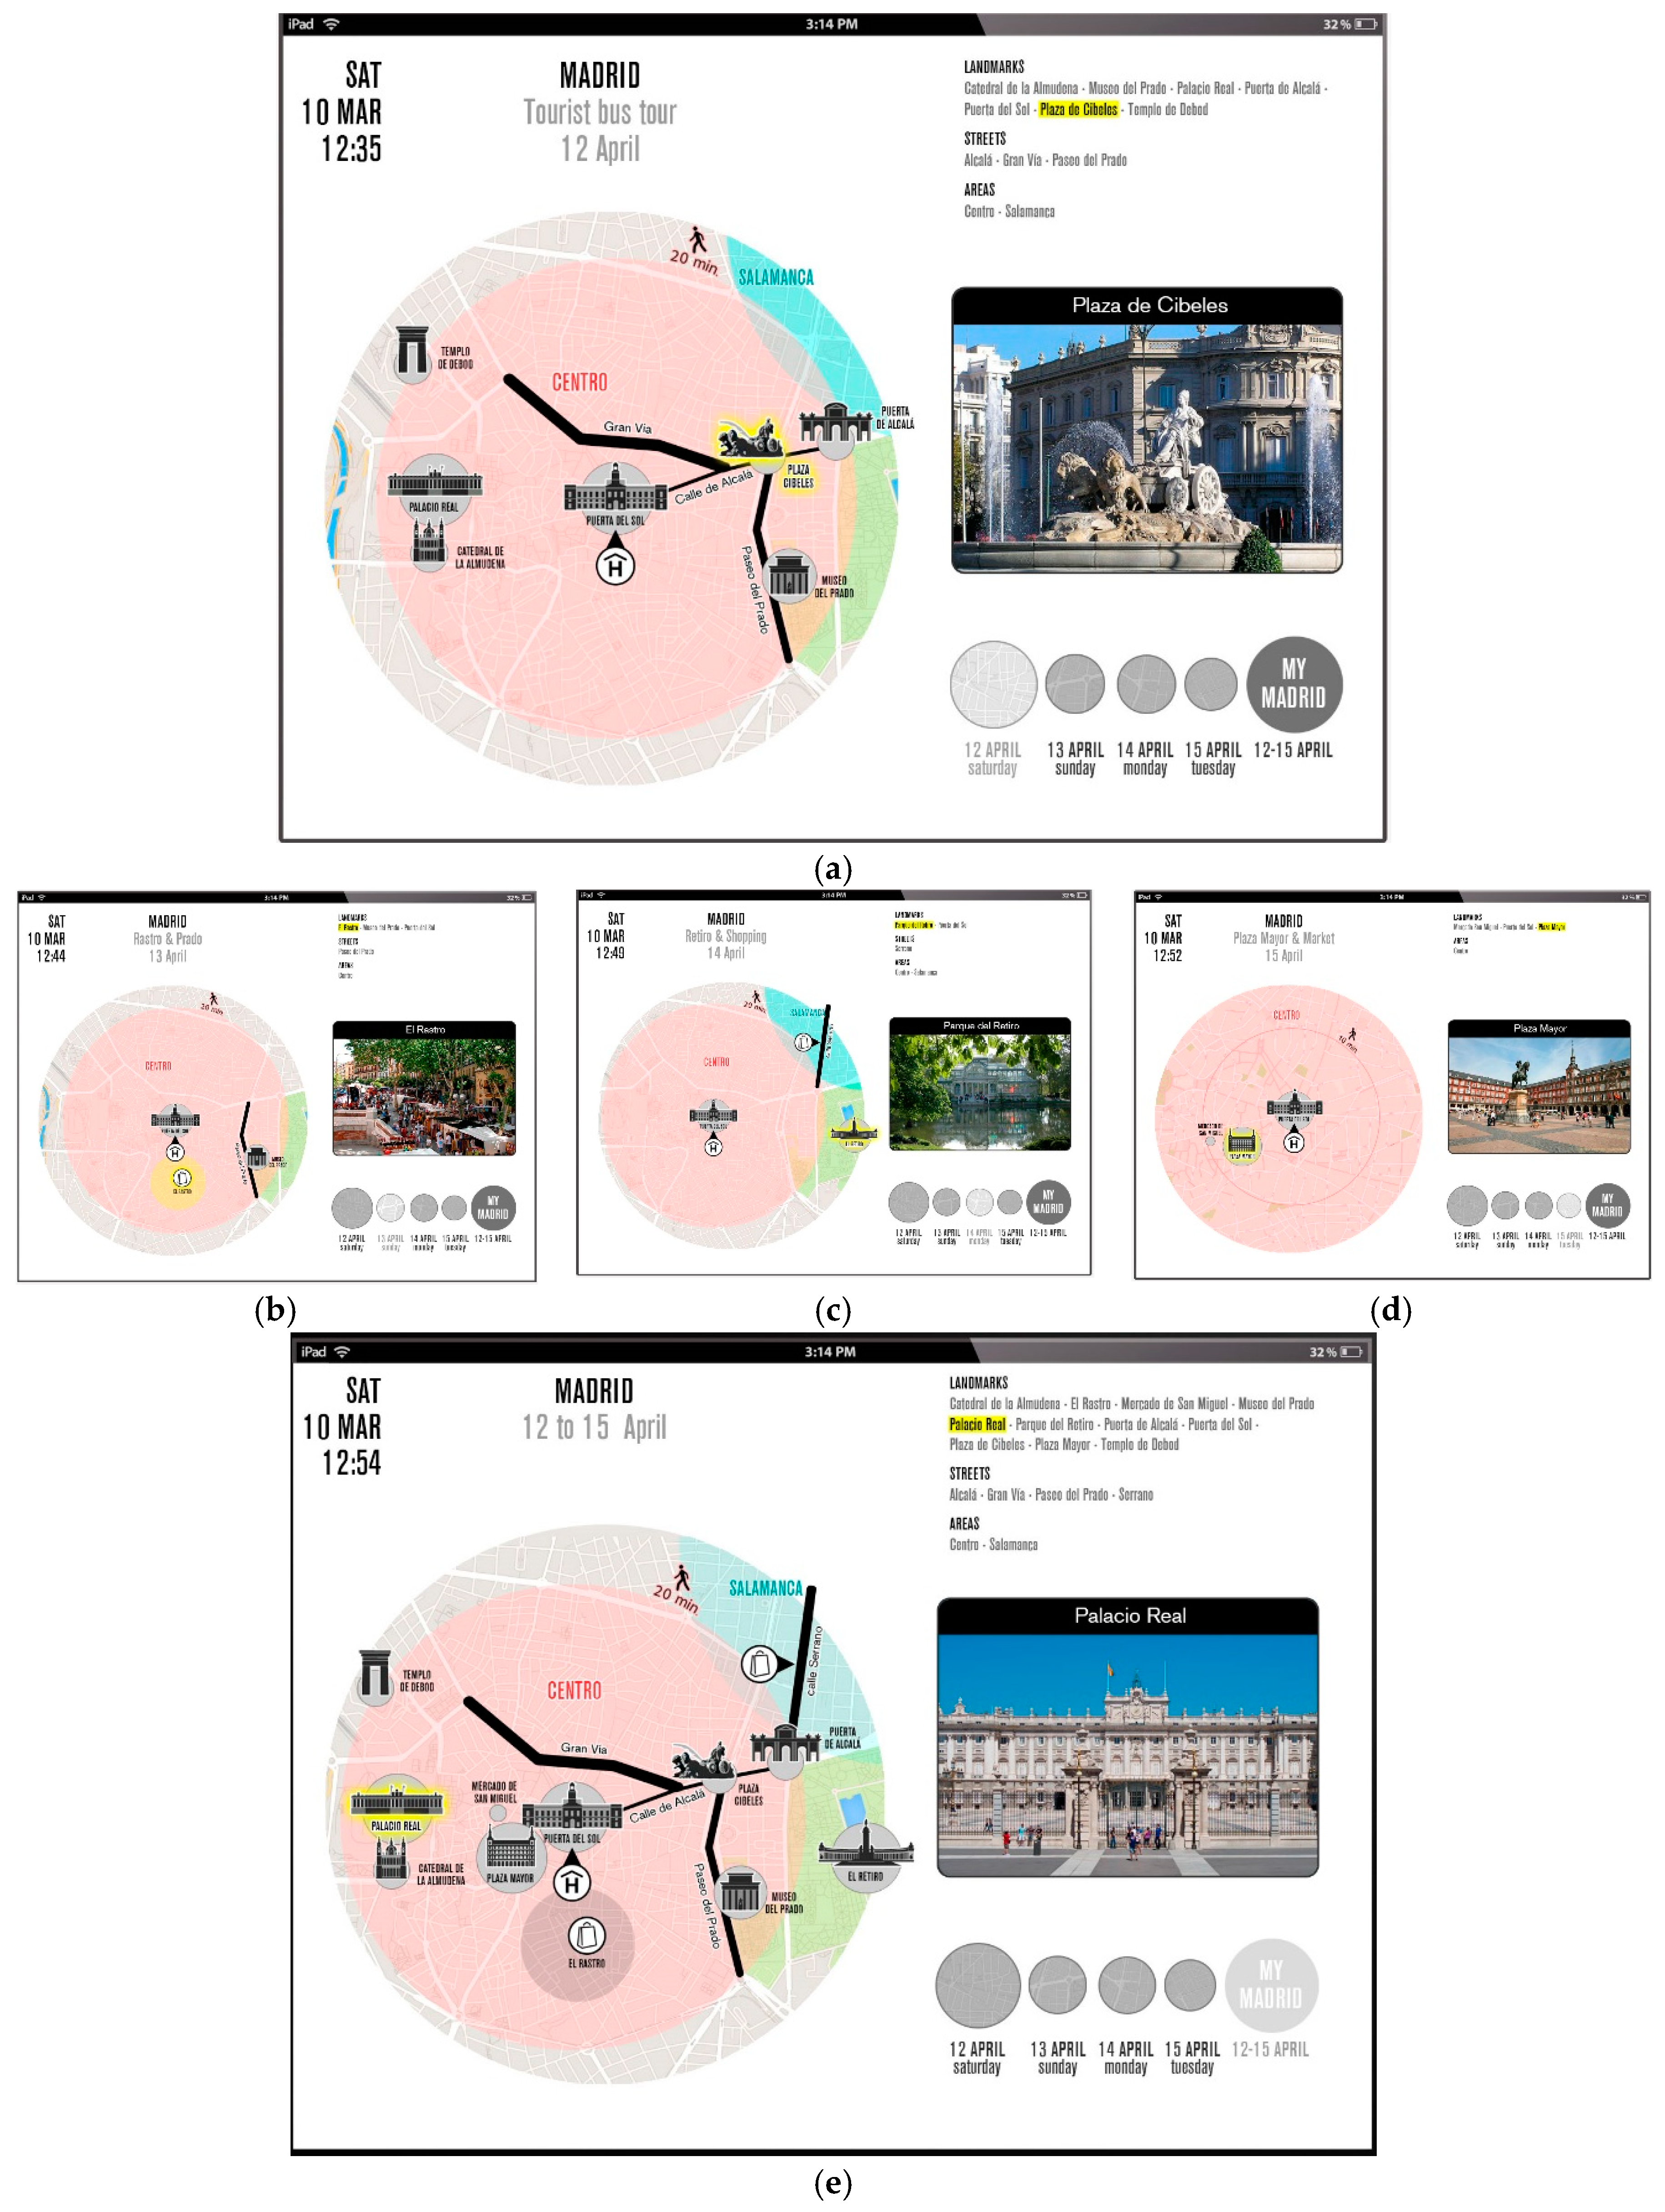
| T1 (Guided) | Include POIs and streets that are common to all tourists and are needed to support the spatial tasks of tourists. POIs will be represented by 2.5D icons customized over circles or through lines with sizes representing the amount of that specific feature in the collective conception of Madrid. | Visualize the travel plan, using one map per day. The day map will include POIs (around 5) and relevant streets (1 or 2), with a differentiated reference system, and an anchor point at the hotel (Figure 11a–d). An extra map will be designed, integrating all information in a coordinated reference system (Figure 11e). | During the tourist stay in Madrid, the maps will evolve to distinguish the POIs and streets already seen from the ones to be visited. If the tourist takes photos, they can replace the generic images. Places visited out of the initial plan will also be included. |
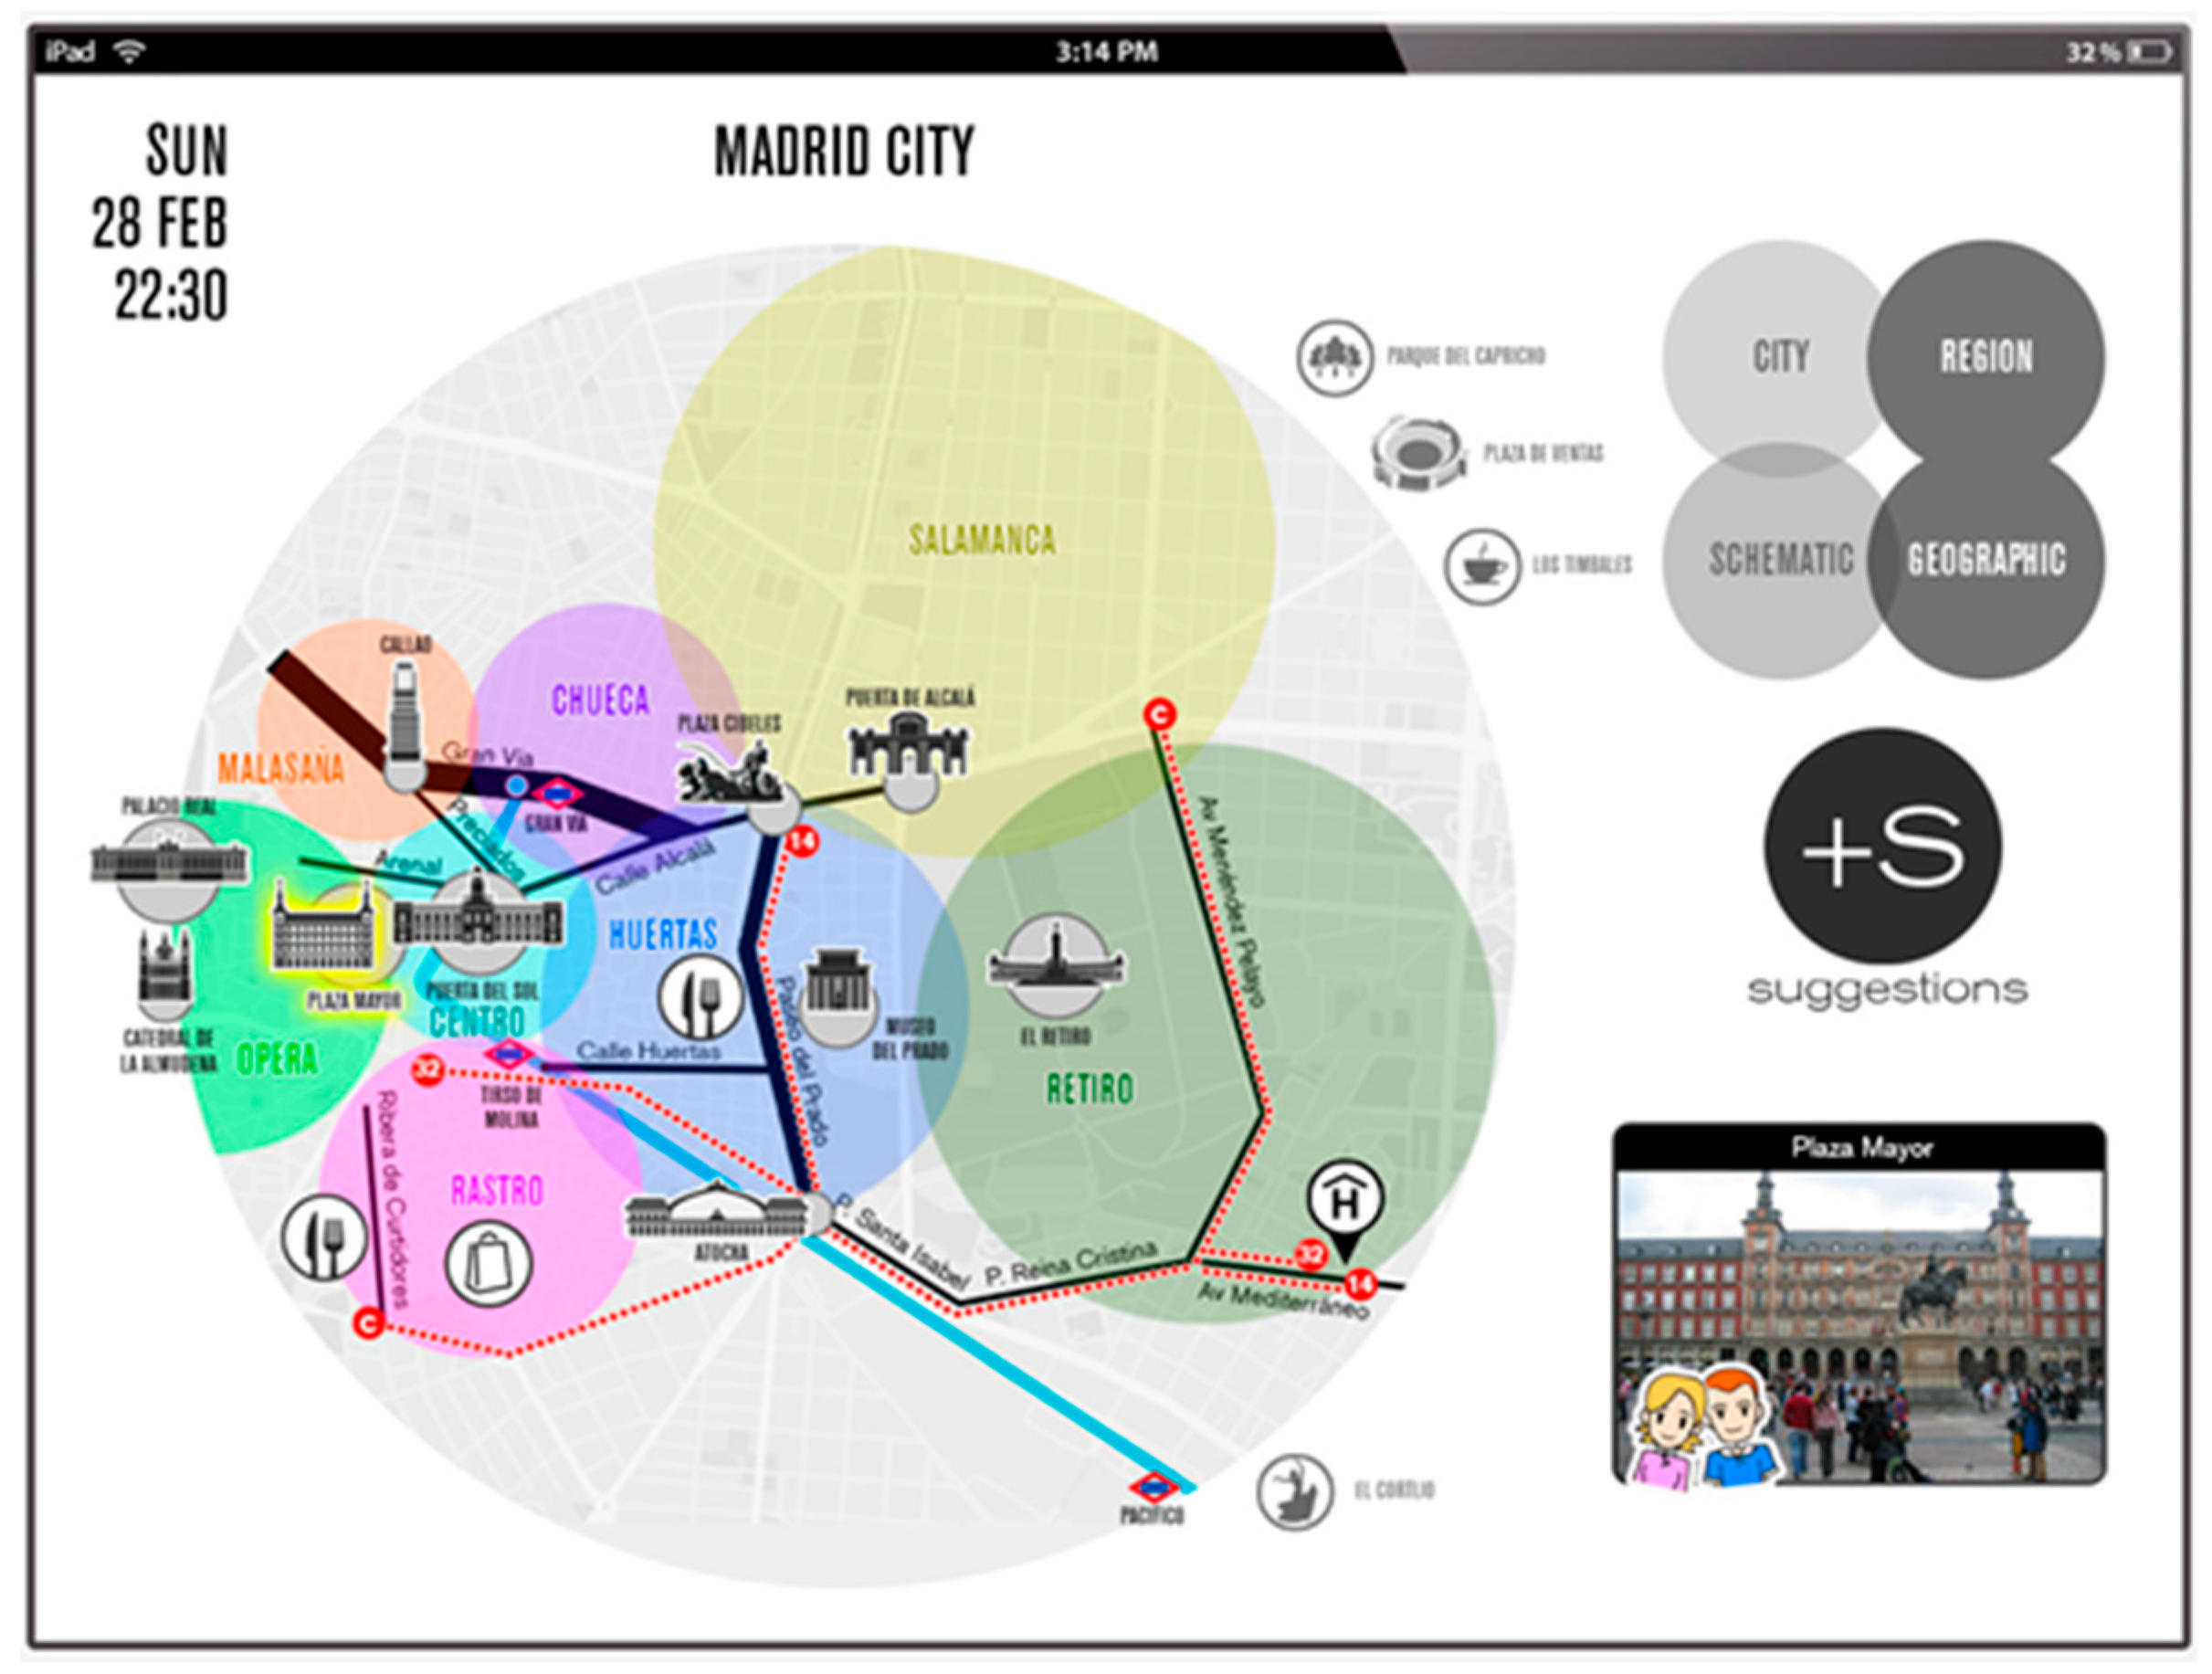
| T2 (Explorer) | A unique map integrates the zones and streets visited, public transport lines taken, and POIs seen, with a coordinated reference system (Figure 9). The number of features to give an overview of the visited places can extend to more than 2 zones, 3 hubs, and 18 POIs (see Figure 8). | Cafés and restaurants where the tourist stayed longer or visited more than once will be included. Suggestions will be included in the map considering the interests of the tourist, the timetable of public transport. and the weather forecast. The suggestions will be presented in colors, while previously visited places will be shown in grey. | |
© 2018 by the authors. Licensee MDPI, Basel, Switzerland. This article is an open access article distributed under the terms and conditions of the Creative Commons Attribution (CC BY) license (http://creativecommons.org/licenses/by/4.0/).
Share and Cite
Manrique-Sancho, M.-T.; Avelar, S.; Iturrioz-Aguirre, T.; Manso-Callejo, M.-Á. Using the Spatial Knowledge of Map Users to Personalize City Maps: A Case Study with Tourists in Madrid, Spain. ISPRS Int. J. Geo-Inf. 2018, 7, 332. https://doi.org/10.3390/ijgi7080332
Manrique-Sancho M-T, Avelar S, Iturrioz-Aguirre T, Manso-Callejo M-Á. Using the Spatial Knowledge of Map Users to Personalize City Maps: A Case Study with Tourists in Madrid, Spain. ISPRS International Journal of Geo-Information. 2018; 7(8):332. https://doi.org/10.3390/ijgi7080332
Chicago/Turabian StyleManrique-Sancho, María-Teresa, Silvania Avelar, Teresa Iturrioz-Aguirre, and Miguel-Ángel Manso-Callejo. 2018. "Using the Spatial Knowledge of Map Users to Personalize City Maps: A Case Study with Tourists in Madrid, Spain" ISPRS International Journal of Geo-Information 7, no. 8: 332. https://doi.org/10.3390/ijgi7080332